the Creative Commons Attribution 4.0 License.
the Creative Commons Attribution 4.0 License.
 | 03 May 2022
Stability-dependent increases in liquid water with droplet number in the Arctic
Rebecca J. Murray-Watson
Edward Gryspeerdt
The effects of aerosols on cloud microphysical properties are a large source of uncertainty when assessing anthropogenic climate change. The aerosol–cloud relationship is particularly unclear in high-latitude polar regions due to a limited number of observations. Cloud liquid water path (LWP) is an important control on cloud radiative properties, particularly in the Arctic, where clouds play a central role in the surface energy budget. Therefore, understanding how aerosols may alter cloud LWP is important, especially as aerosol sources such as industry and shipping move further north in a warming Arctic.
Using satellite data, this work investigates the effects of aerosols on liquid Arctic clouds over open ocean by considering the relationship between cloud droplet number concentration (Nd) and LWP, an important component of the aerosol–LWP relationship. The LWP response to Nd varies significantly across the region, with increases in LWP with Nd observed at very high latitudes in multiple satellite datasets, with this positive signal observed most strongly during the summer months. This result is in contrast to the negative response typically seen in global satellite studies and previous work on Arctic clouds showing little LWP response to aerosols.
The lower tropospheric stability (LTS) was found to be an important control on the spatial variations in LWP response, strongly influencing the sign and magnitude of the Nd–LWP relationship, with increases in LWP in high-stability environments. The influence of humidity varied depending on the stability, with little impact at low LTS but a strong influence at high LTS. The mean Nd state does not dominate the LWP response, despite the non-linearities in the relationship. As the Nd–LWP sensitivity changed from positive to negative when moving from high- to low-LTS environments, this work shows evidence of a temperature-dependent aerosol indirect effect. Additionally, the LWP–LTS relationship changes with Nd, generating an aerosol-dependent cloud feedback. As the LTS is projected to decrease and the boundary layer to become more polluted in a future Arctic, these results show that aerosol increases may produce lower cloud water paths. This shift to more unstable environments implies that LWP adjustments shift from enhancing the Twomey effect by 8 % to offsetting it by around 40 %, with this warming effect having potential consequences for sea ice extent.
- Article
(5326 KB) - Full-text XML
-
Supplement
(6950 KB) - BibTeX
- EndNote


Aerosols can strongly influence the radiative properties of clouds through the modification of cloud microphysical properties. Some aerosols act as cloud condensation nuclei (CCN), and an increase in these aerosols leads to an increase in cloud droplet number concentration (Nd). For a constant cloud liquid water path (LWP), this leads to a decrease in the cloud droplet radius, which increases cloud albedo (Twomey, 1977). This would lead to a short-wave cooling effect at the top of the atmosphere and at the surface. Smaller droplets may also have smaller coalescence rates and therefore delay the formation of precipitation (Albrecht, 1989). This leads to larger cloud LWP, which also increases cloud albedo. However, an increase in aerosol may also deplete LWP: smaller droplets cool and evaporate more quickly, generating turbulence and accelerating the entrainment of dry air into the cloud (Ackerman et al., 2004; Xue and Feingold, 2006; Williams and Igel, 2021). This promotes further cloud evaporation, which reduces the cooling effect of the cloud. Buffering mechanisms in the system make the influence of aerosols on cloud properties difficult to deduce (Stevens and Feingold, 2009); for example, aerosol-induced instability may also deepen the cloud layer, creating higher-LWP clouds which in turn precipitate more, offsetting the LWP gains from the precipitation suppression mechanism.
The size and magnitude of the effects of aerosols on cloud LWP, and therefore the net radiative effect, are uncertain. Modelling studies often find increases in LWP with aerosols (Quaas et al., 2008), whereas satellite-based studies typically observe weak or negative responses Michibata et al. (e.g. 2016); Malavelle et al. (e.g. 2017); Gryspeerdt et al. (e.g. 2019). Meteorological conditions strongly influence the sign and magnitude of the relationship, with increases in LWP with aerosol loading typically observed in humid conditions (Coopman et al., 2016; Toll et al., 2019).
The relationship between aerosols and Arctic clouds is particularly unclear, in part due to difficulties in obtaining observations (Grosvenor and Wood, 2014). However, as industrialisation moves to higher latitudes, understanding how aerosols change cloud properties will become increasingly important (Schmale et al., 2018). This is particularly essential as low-level liquid-containing clouds play a central role in the Arctic energy budget, in which they often contribute to surface heating through their long-wave warming effect (Curry and Ebert, 1992; Shupe and Intrieri, 2004). This contrasts with the rest of the globe, where the short-wave cooling effect dominates (L'Ecuyer et al., 2019). The difference in the Arctic is attributed to two key phenomena: the polar night, during which the short-wave cooling effect is non-existent, and the presence of bright surfaces such as snow and ice. Overlying clouds cannot reflect significantly more radiation than these high-albedo surfaces, which again negates their cooling effects. However, Arctic clouds may have a cooling effect in the summer months, when sea ice retreats and there is ample solar radiation (Intrieri et al., 2002). The warming effect of clouds has been linked with sea ice loss (Kay and Gettelman, 2009; Huang et al., 2019) and melting of the Greenland ice sheet (Bennartz et al., 2013).
Previous in situ and satellite studies have shown that Arctic clouds are more sensitive to anthropogenic aerosols than their low-latitude counterparts (Garrett et al., 2004; Coopman et al., 2018). The resulting changes in their microphysical properties can substantially change the net radiative effect of the clouds (Lubin and Vogelmann, 2006; Zhao and Garrett, 2015), with the magnitude and sign of the effect also dependent on other factors including the season and the albedo of the underlying surface. These modifications in cloud properties may have significant implications for the Arctic, which is undergoing rapid environmental change. The region is warming at an accelerated rate, at least twice the global average (Serreze and Barry, 2011), a phenomenon known as Arctic amplification. Although primarily driven by an increase in greenhouse gas emissions, clouds play an uncertain role, with models predicting a wide range in the magnitude of their effect (Pithan and Mauritsen, 2014). Aerosol-induced changes to the cloud radiative effects may cause clouds to amplify or counteract this phenomenon (Schmale et al., 2021).
Identifying the role of aerosols in cloud properties is further complicated by the influence of confounding variables. For example, increases in satellite-retrieved aerosol optical depth (AOD) due to aerosol swelling in high-humidity conditions may generate spurious correlations between aerosol and cloud properties (e.g. Quaas et al., 2010). Coopman et al. (2016) found that if meteorology is not accounted for, the magnitude of the cloud response to aerosol is larger by a factor of 3 than when the confounding influence of meteorology is reduced by using reanalysis data. To circumvent these issues, recent studies (Gryspeerdt et al., 2016) have used a mediating variable, such as Nd. By considering Nd, the relationship between LWP and aerosols can be broken down into two parts; this can be represented using the sensitivity parameter (Feingold et al., 2001), which quantifies the relative change in LWP for a change in AOD (or Nd):
Focusing on the Nd–LWP relationship assists in the understanding of the aerosol–LWP relationship as aerosol-induced changes to LWP act via changes to Nd through mechanisms such as precipitation suppression. Previous studies, both globally and in the Arctic, have shown that Nd typically increases with aerosol (e.g. Garrett et al., 2004; Quaas et al., 2006), so the Nd–LWP relationship governs the sign of the LWP response to aerosols. The use of Nd is particularly helpful in the Arctic; the persistently high cloud fraction (Shupe, 2011; Cesana et al., 2012) and high-albedo surfaces mean passive sensors (such as the Moderate Resolution Imaging Spectroradiometer, MODIS) can only obtain limited valid aerosol retrievals. Additionally, Nd is a good choice as its retrieval is not strongly affected by relative humidity.
Although satellites' high temporal resolution and large spatial coverage overcome the issues faced by in situ measurements and field campaigns, few previous studies have used satellites to study Arctic aerosol–cloud interactions (Coopman et al., 2018; Zamora et al., 2018; Maahn et al., 2021). This work uses several years of satellite data from multiple instruments to investigate the relationship between LWP and Nd, using reanalysis data to investigate the influence of meteorology. The findings suggest that the lower tropospheric stability (LTS) is a dominant control in the Nd–LWP relationship, which may have significant implications in a warmer, ice-free Arctic.
Observational data used in this study are obtained from MODIS on board NASA's Aqua satellite for the years 2010 to 2015, inclusive, using the cloud properties from the Level 2 (L2) Collection 6.1 dataset (MYD06_L2; Platnick et al., 2017). Only pixels above the latitude of 60∘ N were included in this work. The data were regridded from their native 1 km by 1 km resolution to 25 km by 25 km and into the polar stereographic projection. The analysis is performed at an orbital level to avoid temporal averaging of the data. The data were filtered to include only single-layer liquid clouds using “Cloud_Phase_Infrared”, “Cloud_Phase_Optical_Properties” and the “Cloud_Multi_Layer_Flag”. Liquid-topped mixed-phase clouds are common in the Arctic, and the MODIS cloud-phase algorithm may incorrectly classify these clouds as purely liquid clouds. Therefore, only pixels with cloud-top temperatures above 268 K were included in this study as in situ measurements show these clouds have a liquid water fraction of upwards of 95 % (de Boer et al., 2009). MODIS has been shown to underestimate cloud-top temperatures in the Arctic (Tietze et al., 2011), meaning that this filtering step is likely removing too many clouds. However, as the inclusion of mixed-phase clouds would introduce significant uncertainties (Khanal and Wang, 2018), this conservative estimate of the cloud-top temperature is used.
The cloud liquid water path was estimated according to Eq. (2):
in which ρ is the density of water and τc and re are the cloud optical thickness and the cloud droplet effective radius, both acquired from MODIS. Equation (2) assumes adiabatic conditions, such as the cloud interacting with the environment through precipitation or entrainment (Brenguier et al., 2000; Wood and Hartmann, 2006).
For comparison with the MODIS data, LWP data were also obtained from version 2 of the Advanced Microwave Scanning Radiometer for EOS (AMSR-E) ocean product, which is also aboard Aqua (Wentz and Meissner, 2004). Data from 2010 and 2011 were included in the analysis. The data were regridded from their native 12 km by 12 km grid to the same 25 km by 25 km polar stereographic grid as the MODIS data. The in-cloud LWP is calculated by dividing the AMSR-E LWP by the MODIS liquid cloud fraction.
The cloud droplet number concentration (Nd) is estimated from MODIS data using Eq. (3):
in which k is associated with the droplet spectrum width and is assumed to have a constant value of 0.8 (Painemal and Zuidema, 2011; Grosvenor and Wood, 2014). Q is the scattering coefficient and is approximately equal to 2 (Bennartz, 2007). The condensation rate depends on temperature and on pressure, although the pressure dependence is weak. Therefore, the condensation rate is calculated using the linear relationship derived in Gryspeerdt et al. (2016), using the MODIS cloud-top temperature following Grosvenor and Wood (2014). The subadiabatic factor (fad) represents the degree to which the cloud departs from the adiabatic profile. While previous work has found that marine stratiform clouds are generally found to be close to adiabatic (Zuidema et al., 2005), other studies have shown fad can vary widely (e.g. Merk et al., 2016). This study assumes an fad of 0.7, following Painemal and Zuidema (2011).
Several unique aspects of the Arctic environment, including high solar zenith angles, high-albedo surfaces such as sea ice and snow, and persistent darkness during the polar night, can create challenges for passive satellite sensors to obtain accurate retrievals of clouds. To detect clouds, MODIS relies on contrast between the clouds and the underlying surface in thermal and visible channels. During the polar night, MODIS is unable to use visible bands to detect clouds and therefore must solely rely on infrared channels. Chan and Comiso (2013) found that due to insufficient thermal contrast between clouds and the surface, MODIS frequently failed to discriminate between them during nighttime retrievals. Additionally, sea ice or snow-covered surfaces were frequently flagged as cloud due to similar temperatures or reflectivity, with 30.9 % disagreement between MODIS and CALIOP, an active sensor, in detection of cloudy scenes over these surfaces. Due to greater thermal and visible contrast between clouds and the surface, MODIS performed better over ocean, with only 3.7 % disagreement in cloud detection between MODIS and CALIOP.
High-albedo surfaces also pose difficulties for retrievals of cloud microphysical properties. Dong et al. (2016) showed the difference between satellite-retrieved τc and that measured by in situ instruments in Utqiaġvik (formerly Barrow) was higher in snow-covered than snow-free regions (which included ocean) and increased at higher surface albedo due to lack of contrast between cloud and the surface.
Large solar zenith angles (SZAs), which occur frequently at high latitudes, introduce additional biases into cloud property retrievals. Grosvenor and Wood (2014) found that τc increases substantially with SZAs above 65–70∘. Retrieved re decreases at higher SZAs, leading to an overestimate of Nd by 50 %–70 %, depending on the MODIS band used and the sensor viewing angle. Over snow-free surfaces, Dong et al. (2016) also saw increases in retrieved τc and re relative to in situ measurements at very high SZAs, generating overestimates in LWP relative to the ground measurements of about 20 g m−2 at SZAs greater than 72∘.
Careful filtering of the L2 pixels to remove cases in which the data are known to be highly uncertain can prevent the introduction of biases into the results in spite of these difficult conditions. Therefore, the pixels were filtered only to include those with a 5 km cloud fraction of above 0.9 to limit uncertainties associated with retrievals at the cloud edge. Pixels with a heterogeneity index (“Cloud_Mask_SPI”) above 30 were removed as inhomogeneous clouds are known to introduce retrieval biases (Zhang and Platnick, 2011). The solar zenith angle and the sensor viewing angle were limited to 65 and 50∘, following Grosvenor and Wood (2014). Requiring low solar zenith angles means that only sunlit pixels are included in this analysis.
Due to uncertainties associated with retrievals of cloud properties over snow- and ice-covered surfaces by passive sensors, only ocean pixels were considered. The sea ice pixels were removed using daily sea ice cover data from Nimbus-7 SMMR and DMSP SSM/I-SSMIS Passive Microwave Data, Version 1 dataset (Cavalieri et al., 1996), also gridded at a 25 km by 25 km resolution. Open-ocean pixels adjacent to sea-ice-containing pixels were also removed from this analysis to minimise the impacts of undetected sea ice.
The Nd retrievals were further limited to include only pixels with an re greater than 4 µm and a τc greater than 4. This is due to uncertainties associated with retrievals of smaller values (Quaas et al., 2006; Sourdeval et al., 2016). This stringent filtering is not applied to the LWP retrievals as Nd is more sensitive to inaccuracies in these values and would introduce a high bias into the MODIS LWP against the AMSR-E LWP (Gryspeerdt et al., 2019). A summary of the filtering methods has been provided in Fig. S1 in the Supplement.
Meteorological reanalysis data were obtained from the ERA5 dataset (Hersbach et al., 2020), produced by the European Centre for Medium-Range Weather Forecasts. The data at the time step which is closest to that of the time of the satellite overpass are considered to be temporally coincident for this study. The data were gridded from their original 0.25∘ by 0.25∘ grid onto the same 25 km by 25 km grid as the MODIS data. The effects of free tropospheric moisture and lower tropospheric stability (LTS) were studied as previous works have shown these variables have a strong influence on the Nd–LWP relationship (Chen et al., 2014; Michibata et al., 2016; Coopman et al., 2016). The specific humidity at 750 hPa (q750) was chosen as a measure of the humidity of the free troposphere. The LTS, which is a measure of the static stability of the atmosphere, was calculated as the potential temperature difference between 700 and 1000 hPa (Klein and Hartmann, 1993).
Additionally, the marine cold air outbreak (MCAO) index (Kolstad and Bracegirdle, 2008) is important to cloud formation and behaviour at high latitudes (McCoy et al., 2017). Much like LTS, it is a metric of the stability of the boundary layer, although it is calculated as the difference between the potential temperature at 800 hPa and the sea surface temperature (Fletcher et al., 2016), with positive values indicating higher instability. This metric is particularly suitable for the Arctic as it highlights the difference in temperature of the relatively warm ocean with the cool overlying air masses. The ocean–air temperature gradient is an important driver of boundary layer instability in the Arctic (Kay and Gettelman, 2009).
3.1 The regional and seasonal Nd–LWP relationship
Figure 1a shows the annual mean linear sensitivity of the MODIS LWP to the Nd. There is a clear negative-to-positive gradient in the sensitivity, with increases in LWP with Nd typically occurring at higher latitudes. The seasonal cycle of the MODIS sensitivity is shown in Fig. 1c, d and e. Although spring and autumn have regions of positive sensitivity, the summer months most strongly contribute to the signal observed when considering the all-season response, as they have the most data. Figure 1b shows the linear sensitivity between MODIS Nd and AMSR-E LWP for all seasons. The positive relationship and spatial pattern are similar to the MODIS data, with the AMSR-E LWP showing a stronger positive response to aerosols. This may be due to a potential negative bias in the MODIS data due to re retrieval errors (Gryspeerdt et al., 2019). Due to the absence of incoming solar radiation during polar nights, there is a lack of data for the winter season. The number of successful retrievals used for the sensitivity calculation for each pixel for the remaining seasons is shown in Fig. S2.
The decrease in LWP with Nd at lower latitudes has previously been observed in liquid-phase clouds over subtropical oceans (e.g. Michibata et al., 2016; Gryspeerdt et al., 2019) and is consistent with the mechanism of aerosol-enhanced entrainment mixing (Ackerman et al., 2004). Positive sensitivities have previously been observed in high-relative-humidity conditions (Chen et al., 2014; Toll et al., 2017). Increases in LWP also occur in very clean conditions due to precipitation suppression in this low-Nd regime (Gryspeerdt et al., 2019).
There are several possible explanations for the spatial heterogeneity in the LWP response. One potential cause could be due to air masses moving off the ice edge; cold air moving over the relatively warm open-ocean regions has previously been associated with Arctic cloud formation (Pithan et al., 2018). However, the lack of a strong positive response around the ice edge during the spring months (Fig. 1c) suggests that the exposure of these air masses to new aerosol and moisture sources as they transition from the ice pack is not significant to the Nd–LWP relationship. The remaining potential drivers include the cloud mean state and meteorological conditions, which are investigated further in this work.
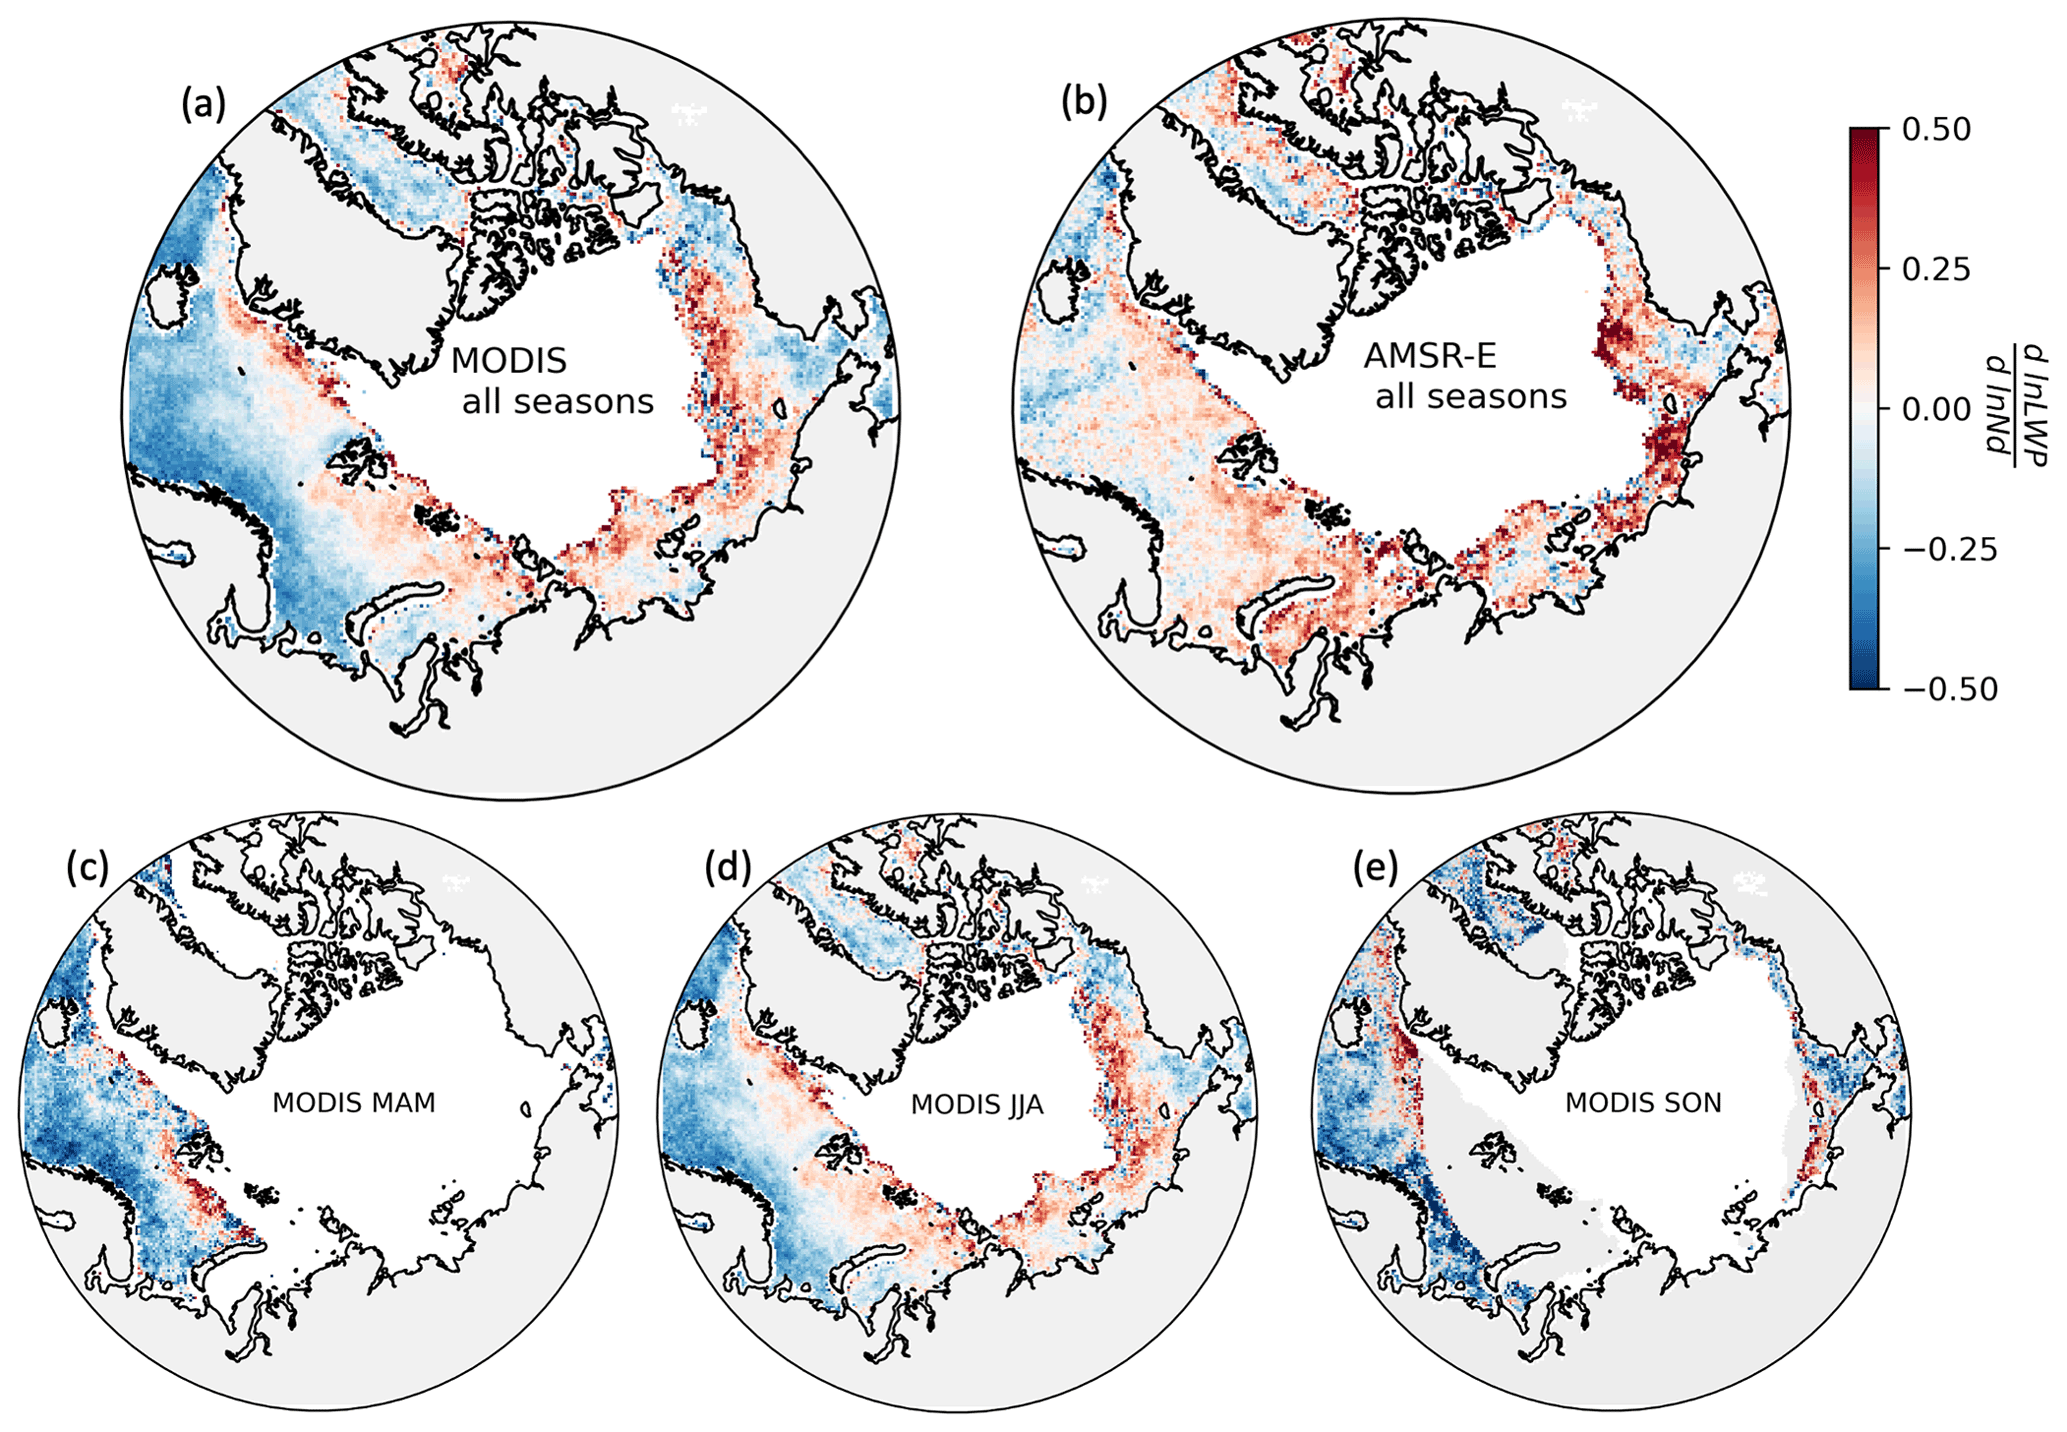
Figure 1The sensitivity of the cloud liquid water path to Nd for (a) MODIS all seasons; (b) AMSR-E all seasons; (c) MODIS March, April and May (MAM); (d) MODIS June, July and August (JJA); and (e) MODIS September, October and November (SON). White indicates data omitted due to the presence of sea ice, and grey shows either missing data due to the polar night or the presence of land masses.
3.2 The role of meteorology and cloud mean state
To investigate the drivers of the different LWP responses, Fig. 2 shows the distributions of cloud microphysical properties and meteorological variables for grid boxes with positive and negative sensitivity. There is no evidence for a statistically significant difference between the distributions of the LWP, specific humidity, Nd vertical velocity or surface wind speed for two regions (Mann–Whitney U test, p>0.05; Mann and Whitney, 1947). However, the distributions for the LTS, the surface temperature and the MCAO index are significantly different. In particular, in the region of positive sensitivity, the LTS tends towards higher values, whereas the surface temperature and the MCAO index are both lower. This influence of stability on the LWP sensitivity is consistent with previous studies (Chen et al., 2014); higher-stability conditions inhibit mixing between the cloud layer with the dry above-cloud layer and prevent the depletion of LWP due to the evaporation–entrainment mechanism.
The r2 values of the correlation between the sensitivity and mean of meteorological variables for each pixel over the 6 years of data were calculated. The r2 is higher for the LTS (0.39) than for the MCAO index (0.26) and surface temperature (0.32); the associated scatter plots are shown in Fig. S3. This indicates that the LTS explains a greater fraction of the variance in the sensitivity than the other meteorological variables. Due to its better performance as an explanatory variable, LTS is used in the remainder of this study as a proxy for the importance of stability and surface forcing on cloud formation.
This association between positive sensitivities and higher LTS values explains why the strongest positive signal was observed during JJA in Fig. 1. During the summer, the ocean temperature is constrained by melting sea ice while the atmosphere is warmed by an increase in solar radiation, creating a weak ocean–air temperature gradient (Kay and Gettelman, 2009; Persson, 2012; Morrison et al., 2018). This results in warm air residing above a relatively cold ocean, producing high-LTS conditions. Conversely, in spring and autumn, lower-stability conditions are more common. Due to its large thermal heat capacity, the ocean remains warm relative to the atmosphere in seasons with low insolation, generating a larger ocean–air temperature gradient and unstable conditions (Kay and Gettelman, 2009; Morrison et al., 2018; Huang et al., 2019).
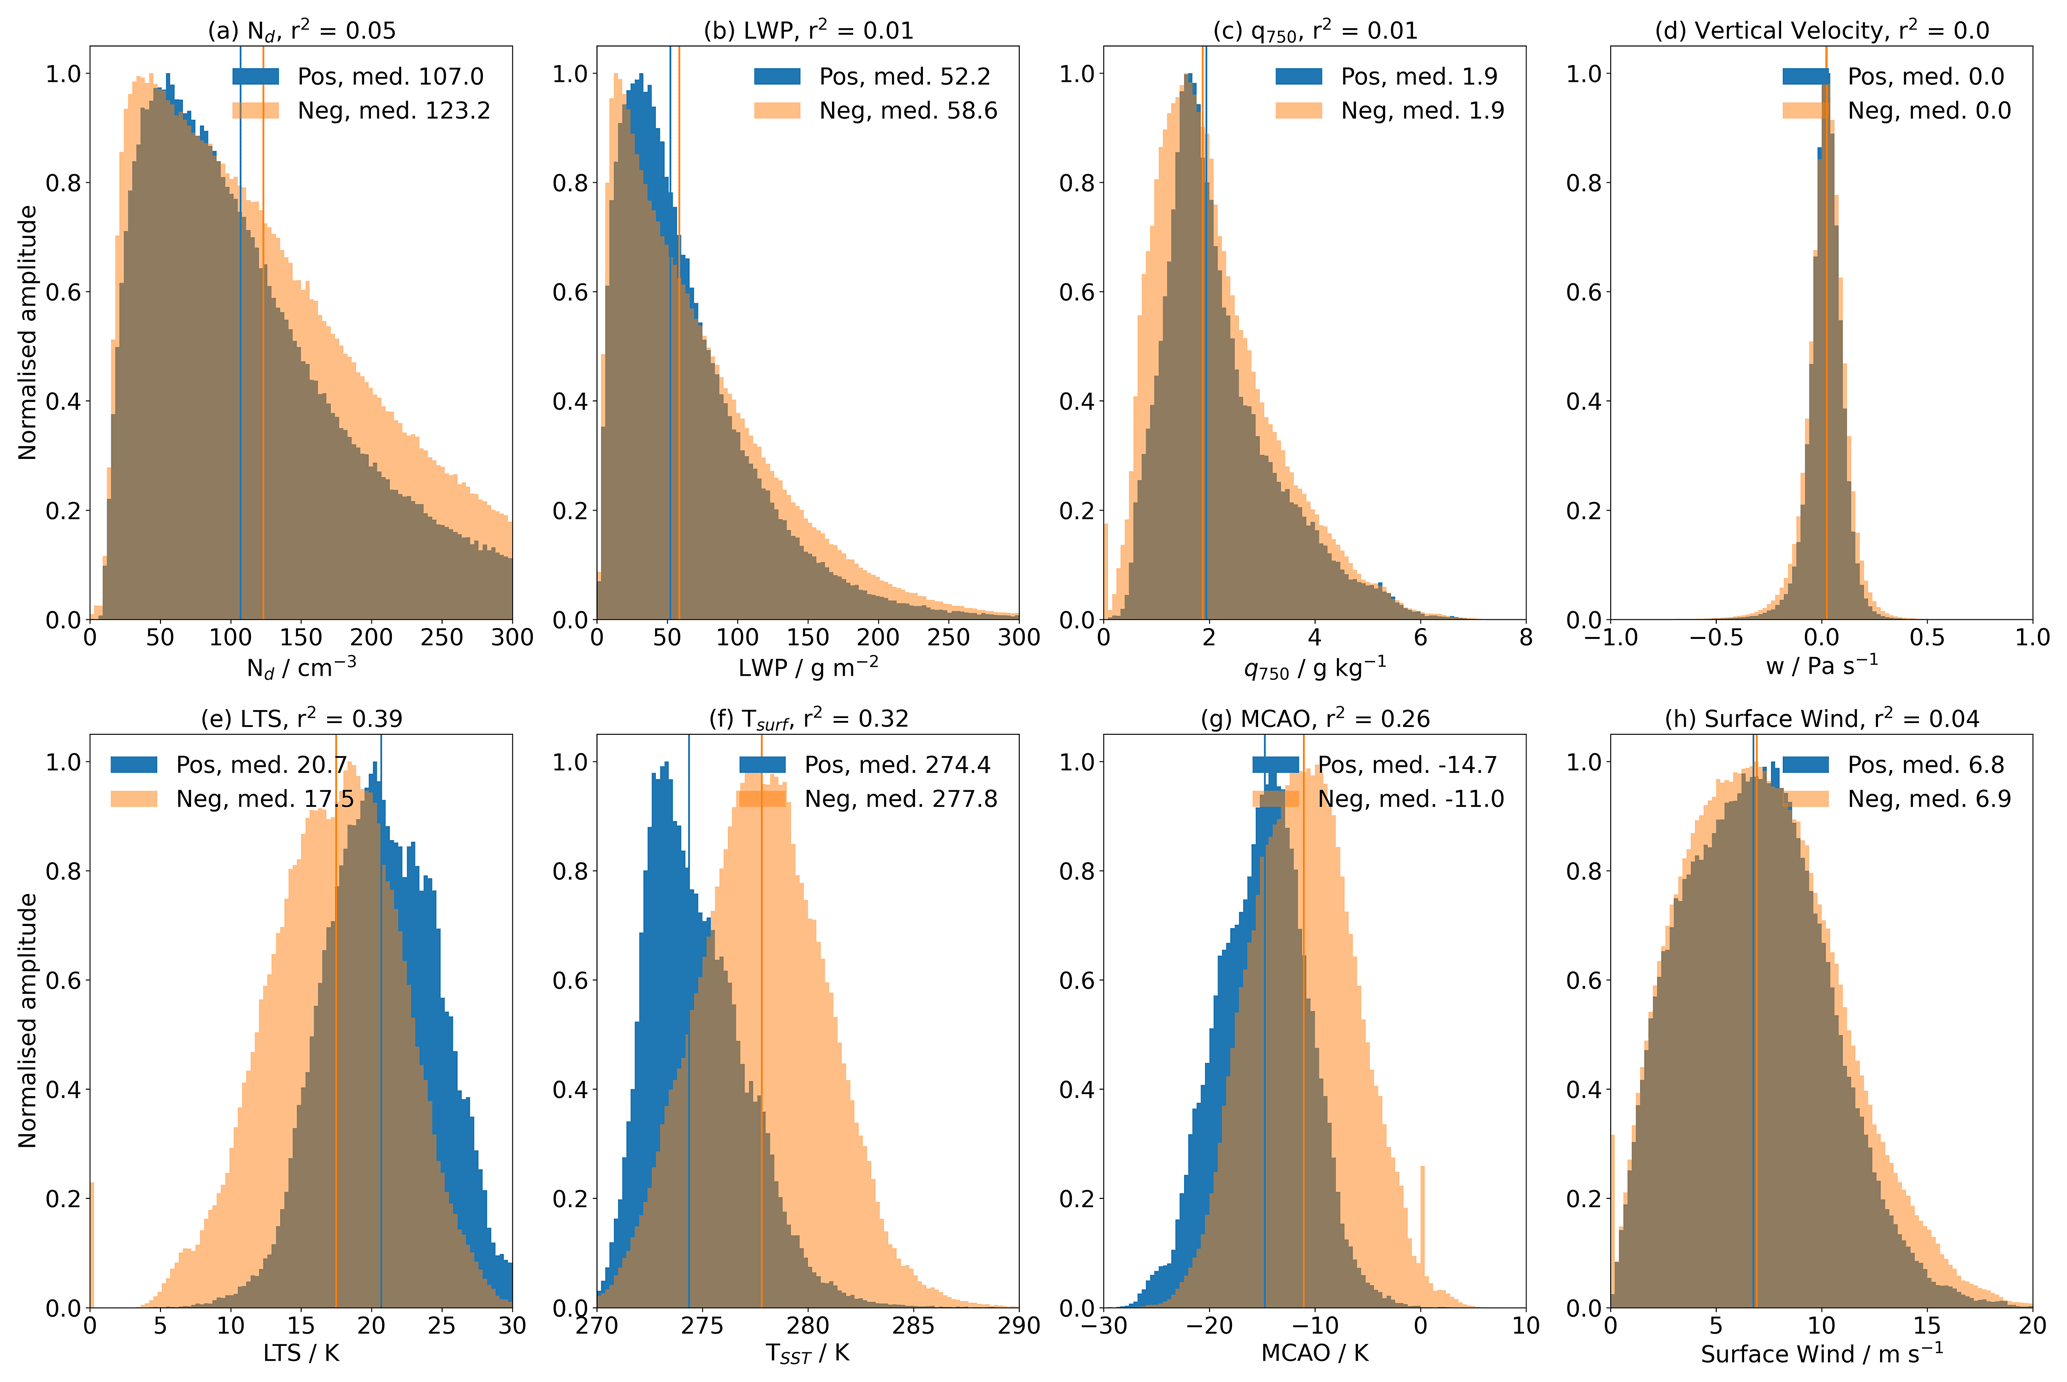
Figure 2Normalised histograms showing the distributions of (a) Nd, (b) LWP, (c) q750, (d) vertical velocity, (e) LTS, (f) Tsurf, (g) MCAO and (h) surface wind for the regions of positive and negative sensitivity shown in Fig. 1a. The blue and orange vertical lines show the medians for the positive and negative regions, respectively. The r2 values of the correlation between the sensitivity and mean of meteorological variables for each pixel over the 6 years of data are above each subplot.
From Fig. 2, it appears that the specific humidity does not strongly drive the LWP response. However, previous work has shown that specific humidity often strongly influences the Nd–LWP relationship, with more weakly negative responses under higher-humidity conditions (Chen et al., 2014; Toll et al., 2019) due to a suppressed evaporation–entrainment mechanism. To investigate this further, the data were partitioned into bins of specific humidity and LTS (Fig. 3). The number of retrievals used to calculate the sensitivity in each bin is shown in Fig. S4. The response to changes in specific humidity is weak, with strongly negative sensitivities evident under both humid and dry conditions. The response to variations in LTS is greater, with a strong negative response at low LTS turning into a positive sensitivity in higher-stability conditions. The strong dependence on stability supports the hypothesis that the LTS is the predominant control behind the differences between the regions of positive and negative sensitivity (Fig. 2).
Although the overall response to humidity is weak, Fig. 3 shows that its role is dependent upon the LTS conditions. The influence of humidity on the Nd–LWP relationship is small at low LTS; the sensitivity is consistently strongly negative across the humidity range. However, it becomes important at high LTS, where the response changes from negative to positive as humidity increases. This relationship holds when using specific humidity from different vertical levels (Fig. S5). These results are similar to previous work on Arctic clouds: in high-stability environments, Coopman et al. (2016) found an increasingly positive response with q750. Additionally, the sensitivity to aerosol increased with LTS when q750 was constrained between 2.0 and 4.0 g kg−1.
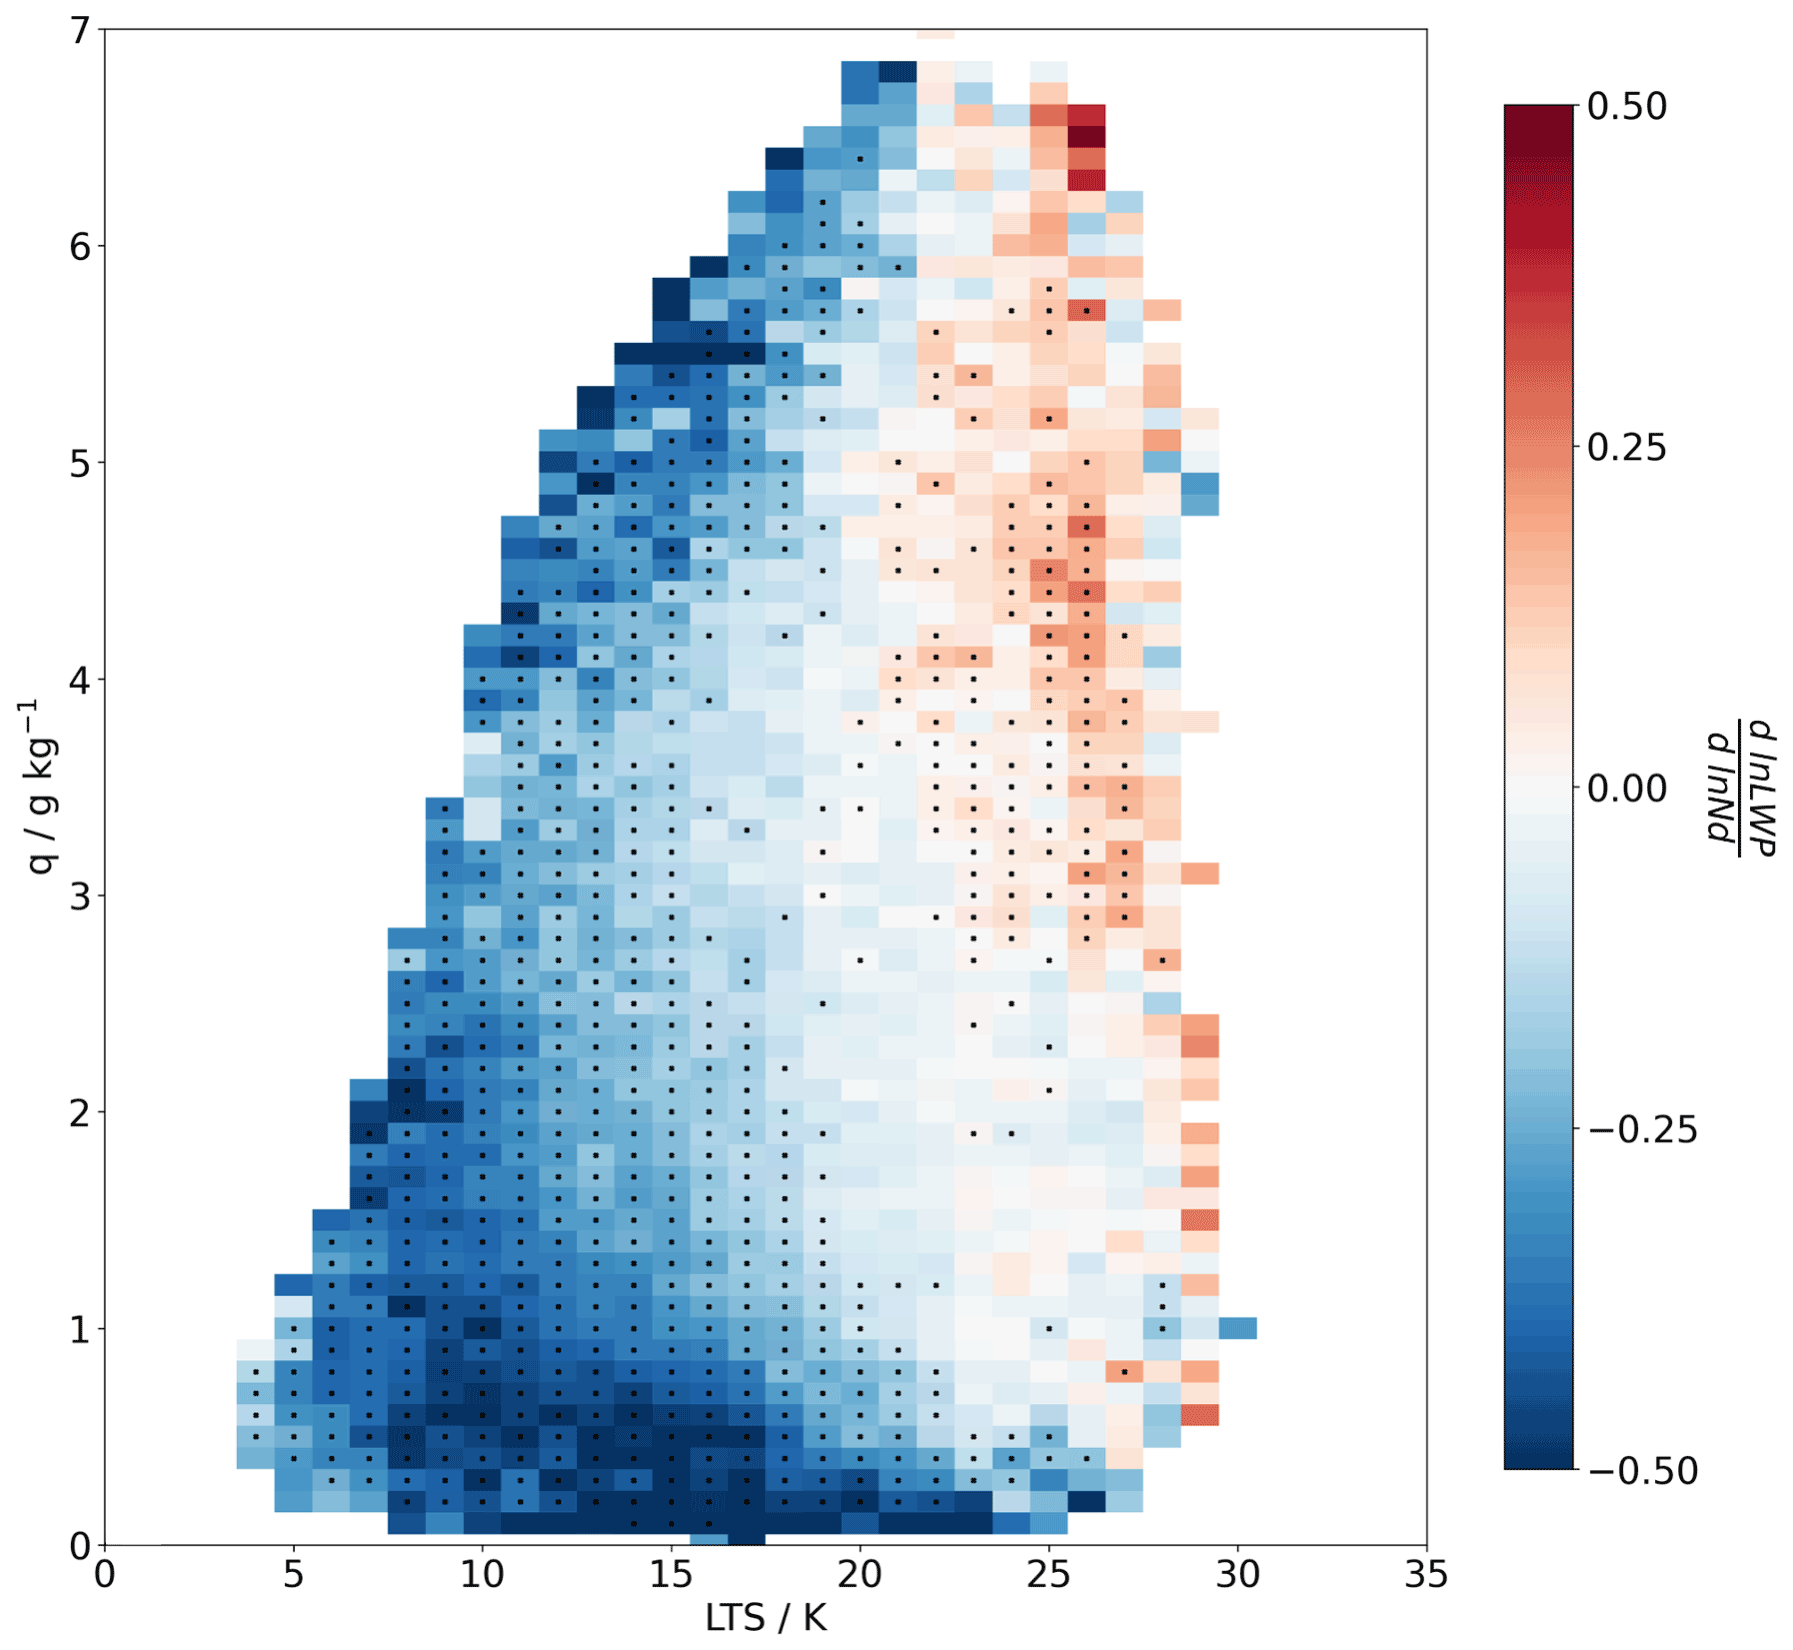
Figure 3The linear Nd–LWP sensitivity plotted as a function of LTS and cloud-top humidity (q750). Only bins which included over 100 valid retrievals were included in the analysis. The black dots indicate points for which the correlation is significant at a 95 % confidence level.
The results presented so far have assumed a linear sensitivity of LWP to Nd; however, assuming linearity means important characteristics of the relationship are not considered. For example, the response of LWP can be non-linear, with a dependence on the initial cloud state (Gryspeerdt et al., 2019). Additionally, use of the linear sensitivity parameter does not consider the absolute values of the LWP and how these change in different meteorological regimes. To investigate these characteristics, joint probability histograms were generated by creating a 2D histogram of LWP and Nd and then normalising each column by the total Nd, such that each pixel in that column represented P(LWP|Nd), or the probability of observing a particular LWP given a particular Nd. These diagrams also allow for exploration of where along the Nd spectrum the meteorological conditions considered in Fig. 3 become important to the Nd–LWP relationship.
Figure 4 shows the Nd–LWP joint probability histogram for four different environmental regimes, partitioned into high and low LTS and specific humidity bins. The differences between the normalised histograms are shown at the end of each row and column, and the Nd distributions for the regimes are shown beneath each histogram. The blue lines in the difference plots show clouds with a droplet effective radius of 15 µm; clouds to the left of this line are assumed to be precipitating. The black lines in the joint probability histograms are the mean LWP for each Nd bin, with the shading showing the 95 % confidence interval. These mean LWP lines are expanded in Fig. 5 for clarity. Figure 5 also displays the seasonal breakdown of this relationship, showing dependence of Nd–LWP on LTS and q750 is robust across seasons, as would be expected from an effect driven by meteorology.
In high-LTS conditions, Figs. 4 and 5a and b show evidence of three different responses of LWP to Nd, which are related to the precipitation behaviour as a function of re and the pixel aggregation scale. First, in clean states (low Nd; up to 20 cm−3), there are strong increases in LWP with Nd, as has been observed in previous work (Gryspeerdt et al., 2019); this is consistent with precipitation suppression. There is little difference in the high- and low-q750 environments in these low-Nd conditions (Fig. 4c), suggesting that the precipitation suppression mechanism is not strongly reliant on specific humidity. The Nd distributions below the histograms show that these very low Nd conditions are relatively rare in the Arctic and therefore have little bearing on the linear sensitivity.
In the second regime, between 50 and 150–200 cm−3, LWP still increases with increasing Nd, but the strength of the increase is not as large as for the clean cases (Fig. 5a, b). This is likely due to the precipitation suppression and evaporation–entrainment mechanisms competing to modulate LWP. Figure 6 shows that at these droplet number concentrations, there is still a significant proportion of the droplets which are sufficiently large (re>15 µm) for the precipitation suppression to augment LWP. However, most droplets are smaller than 15 µm, so the precipitation suppression mechanism is weaker than at lower Nd. In high-LTS conditions, the evaporation–entrainment mechanism is suppressed enough that Nd increases up to 150–200 cm−3 can still lead to increases in LWP. The similarity between the high- and low-humidity cases for this Nd range in Fig. 4c also suggests that this Nd–LWP relationship in this regime is not dominated by the evaporation–entrainment mechanism. From the Nd distributions, the majority of the data are in this regime, and therefore they strongly influence the Nd–LWP sensitivity.
Finally, the LWP decreases with further increases in Nd in heavily polluted (above 200 cm−3) environments. At these Nd values, droplets are rarely larger than 15 µm (Fig. 6), so the precipitation suppression mechanism cannot generate further increases in cloud water. Therefore, the evaporation–entrainment mechanism becomes the dominant control and begins to reduce LWP. Figures 4c and 5b show that the LWP decreases are stronger in low-humidity environments due to the enhanced evaporation of cloud droplets under these conditions. At high q750, free tropospheric moisture can buffer against cloud water loss.
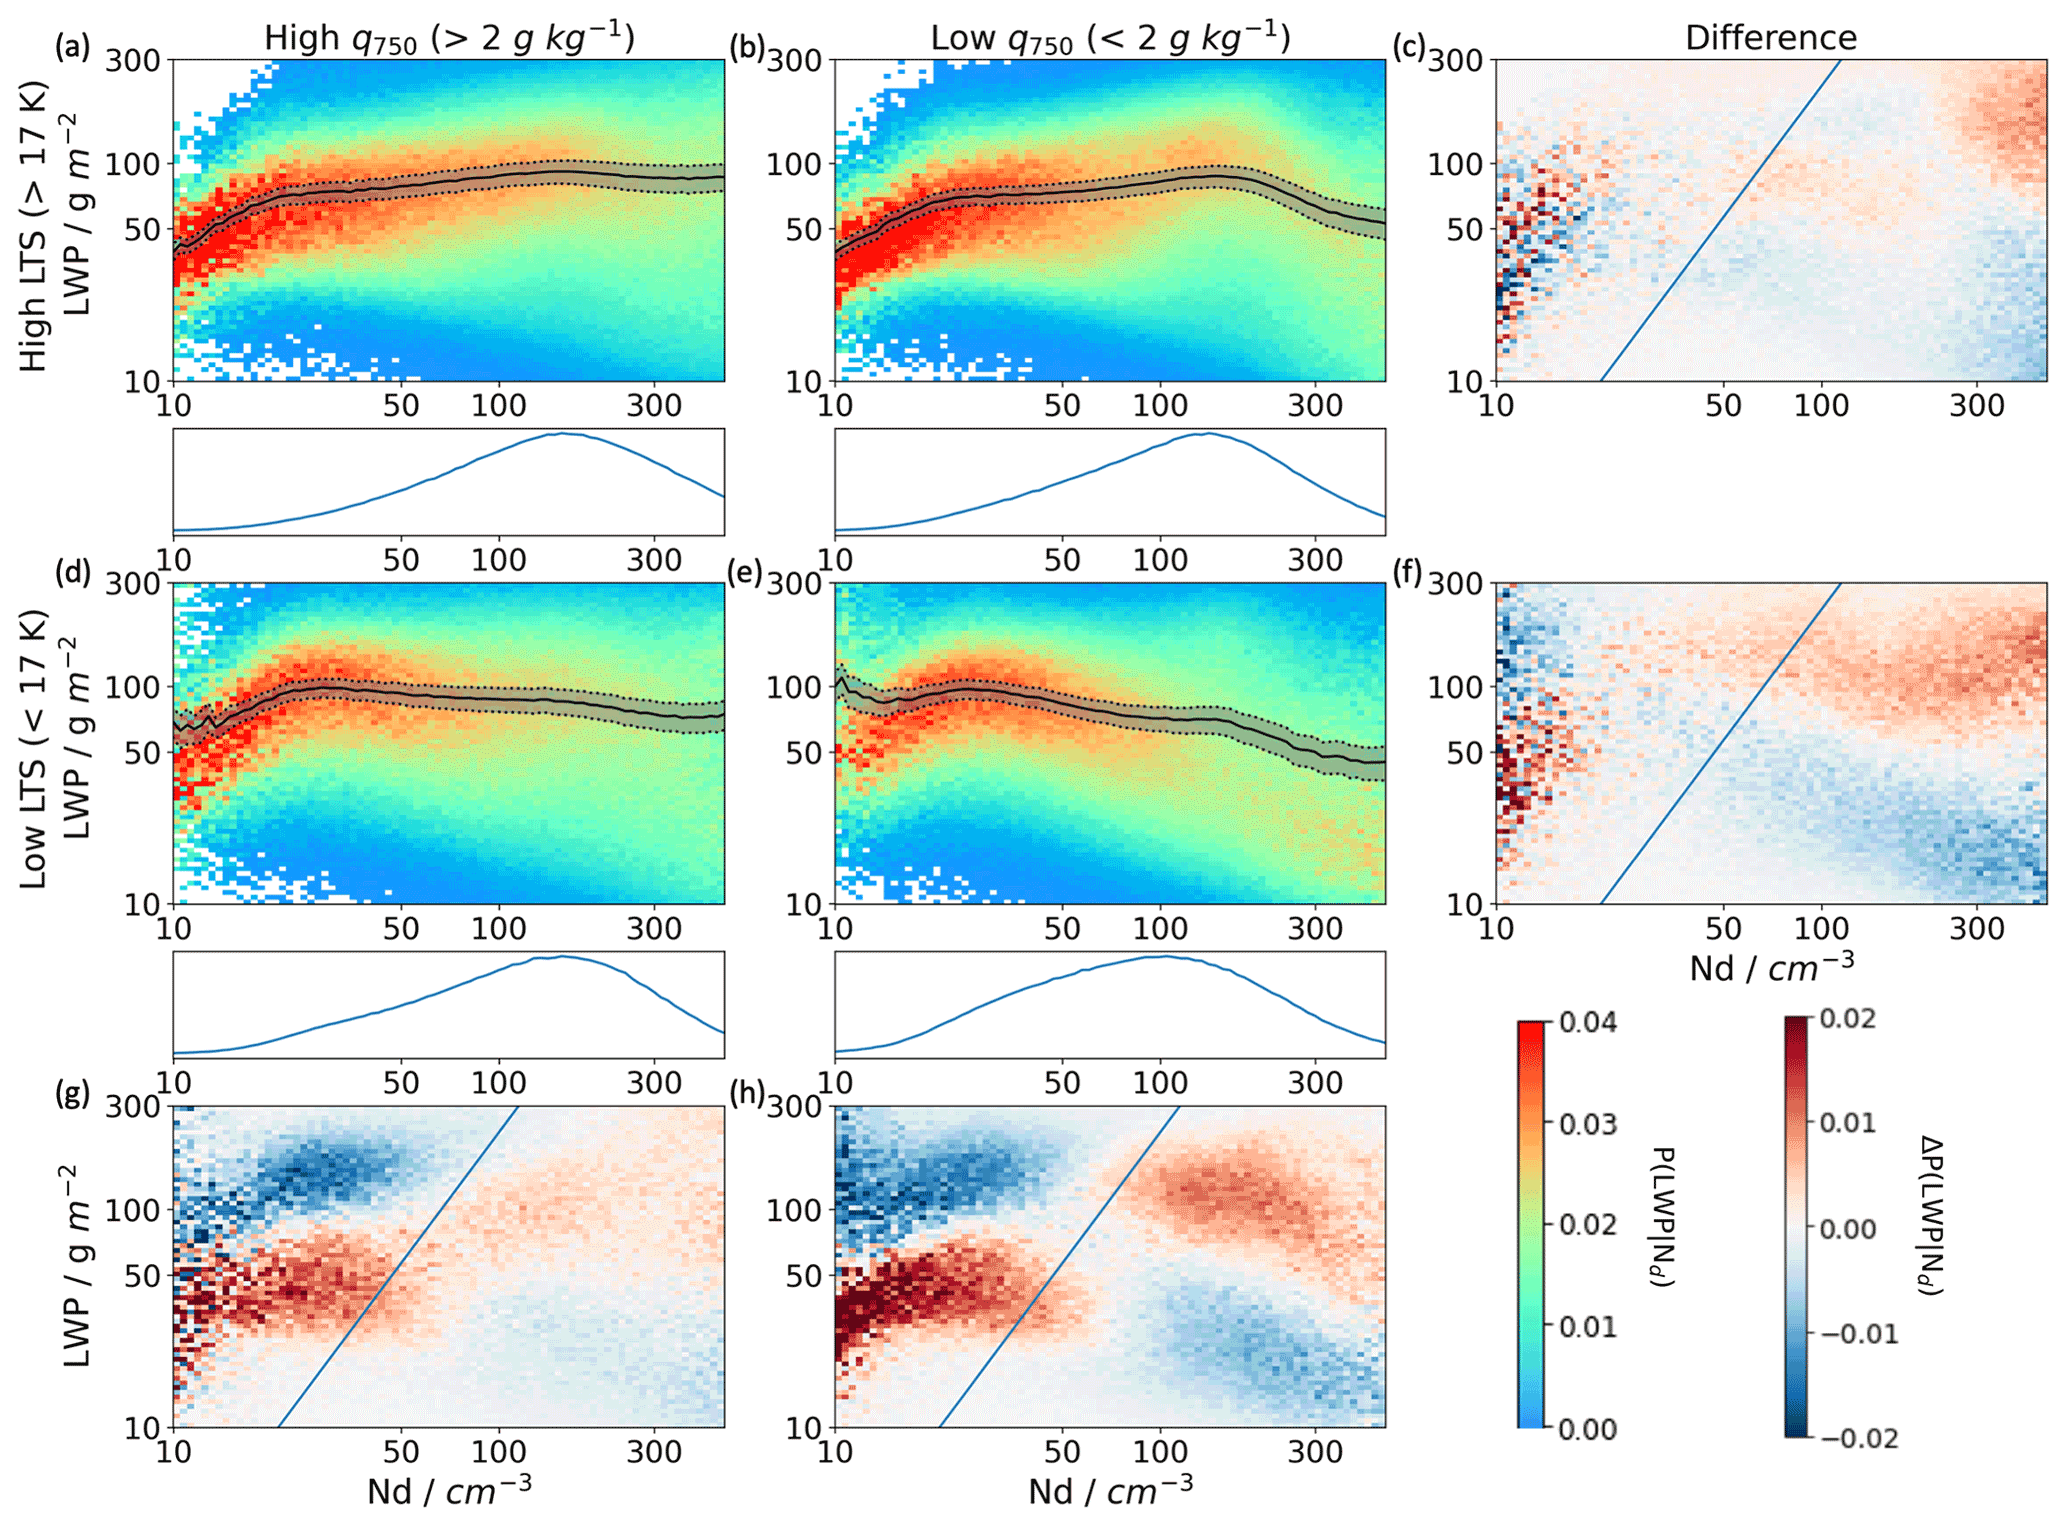
Figure 4Joint probability histograms for Nd–LWP divided into four meteorological regimes based on LTS and q. The difference plots are shown at the end of each row and column, with red over blue indicating higher LWP at higher humidity/LTS. The black lines and grey shading in the joint probability histograms represent the mean LWP value for each Nd bin and the 95 % confidence interval, respectively. The blue lines in the difference plots indicate clouds with an effective radius of 15 µm, so clouds to the right of the line are expected to be non-precipitating.
Similarly to the stable regimes, the precipitation suppression mechanism is again evident for Nd up to 20–30 cm−3 in low-LTS environments. After this, the LWP decreases with increasing Nd, with stronger decreases seen in low-q750 conditions (Fig. 5c and d). This is consistent with the evaporation–entrainment mechanism. Figure 4f shows that the difference between the high- and low-humidity regimes manifests at a lower droplet number than in the high-LTS regimes; in Fig. 4c, clouds in high-q750 environments do not have significantly greater LWP than clouds in low-q750 environments until Nd reaches above 250 cm−3 (indicated by the region of darker red over blue in Fig. 4c). However, in Fig. 4f, these larger LWP values in moister conditions occur earlier at around 40–50 cm−3, with the disparity growing stronger with higher Nd. This importance of humidity at lower Nd at low LTS may be due to increased turbulent mixing with the above-cloud layer. This would enhance the rate of droplet evaporation, thereby increasing the dependence of LWP on q750.
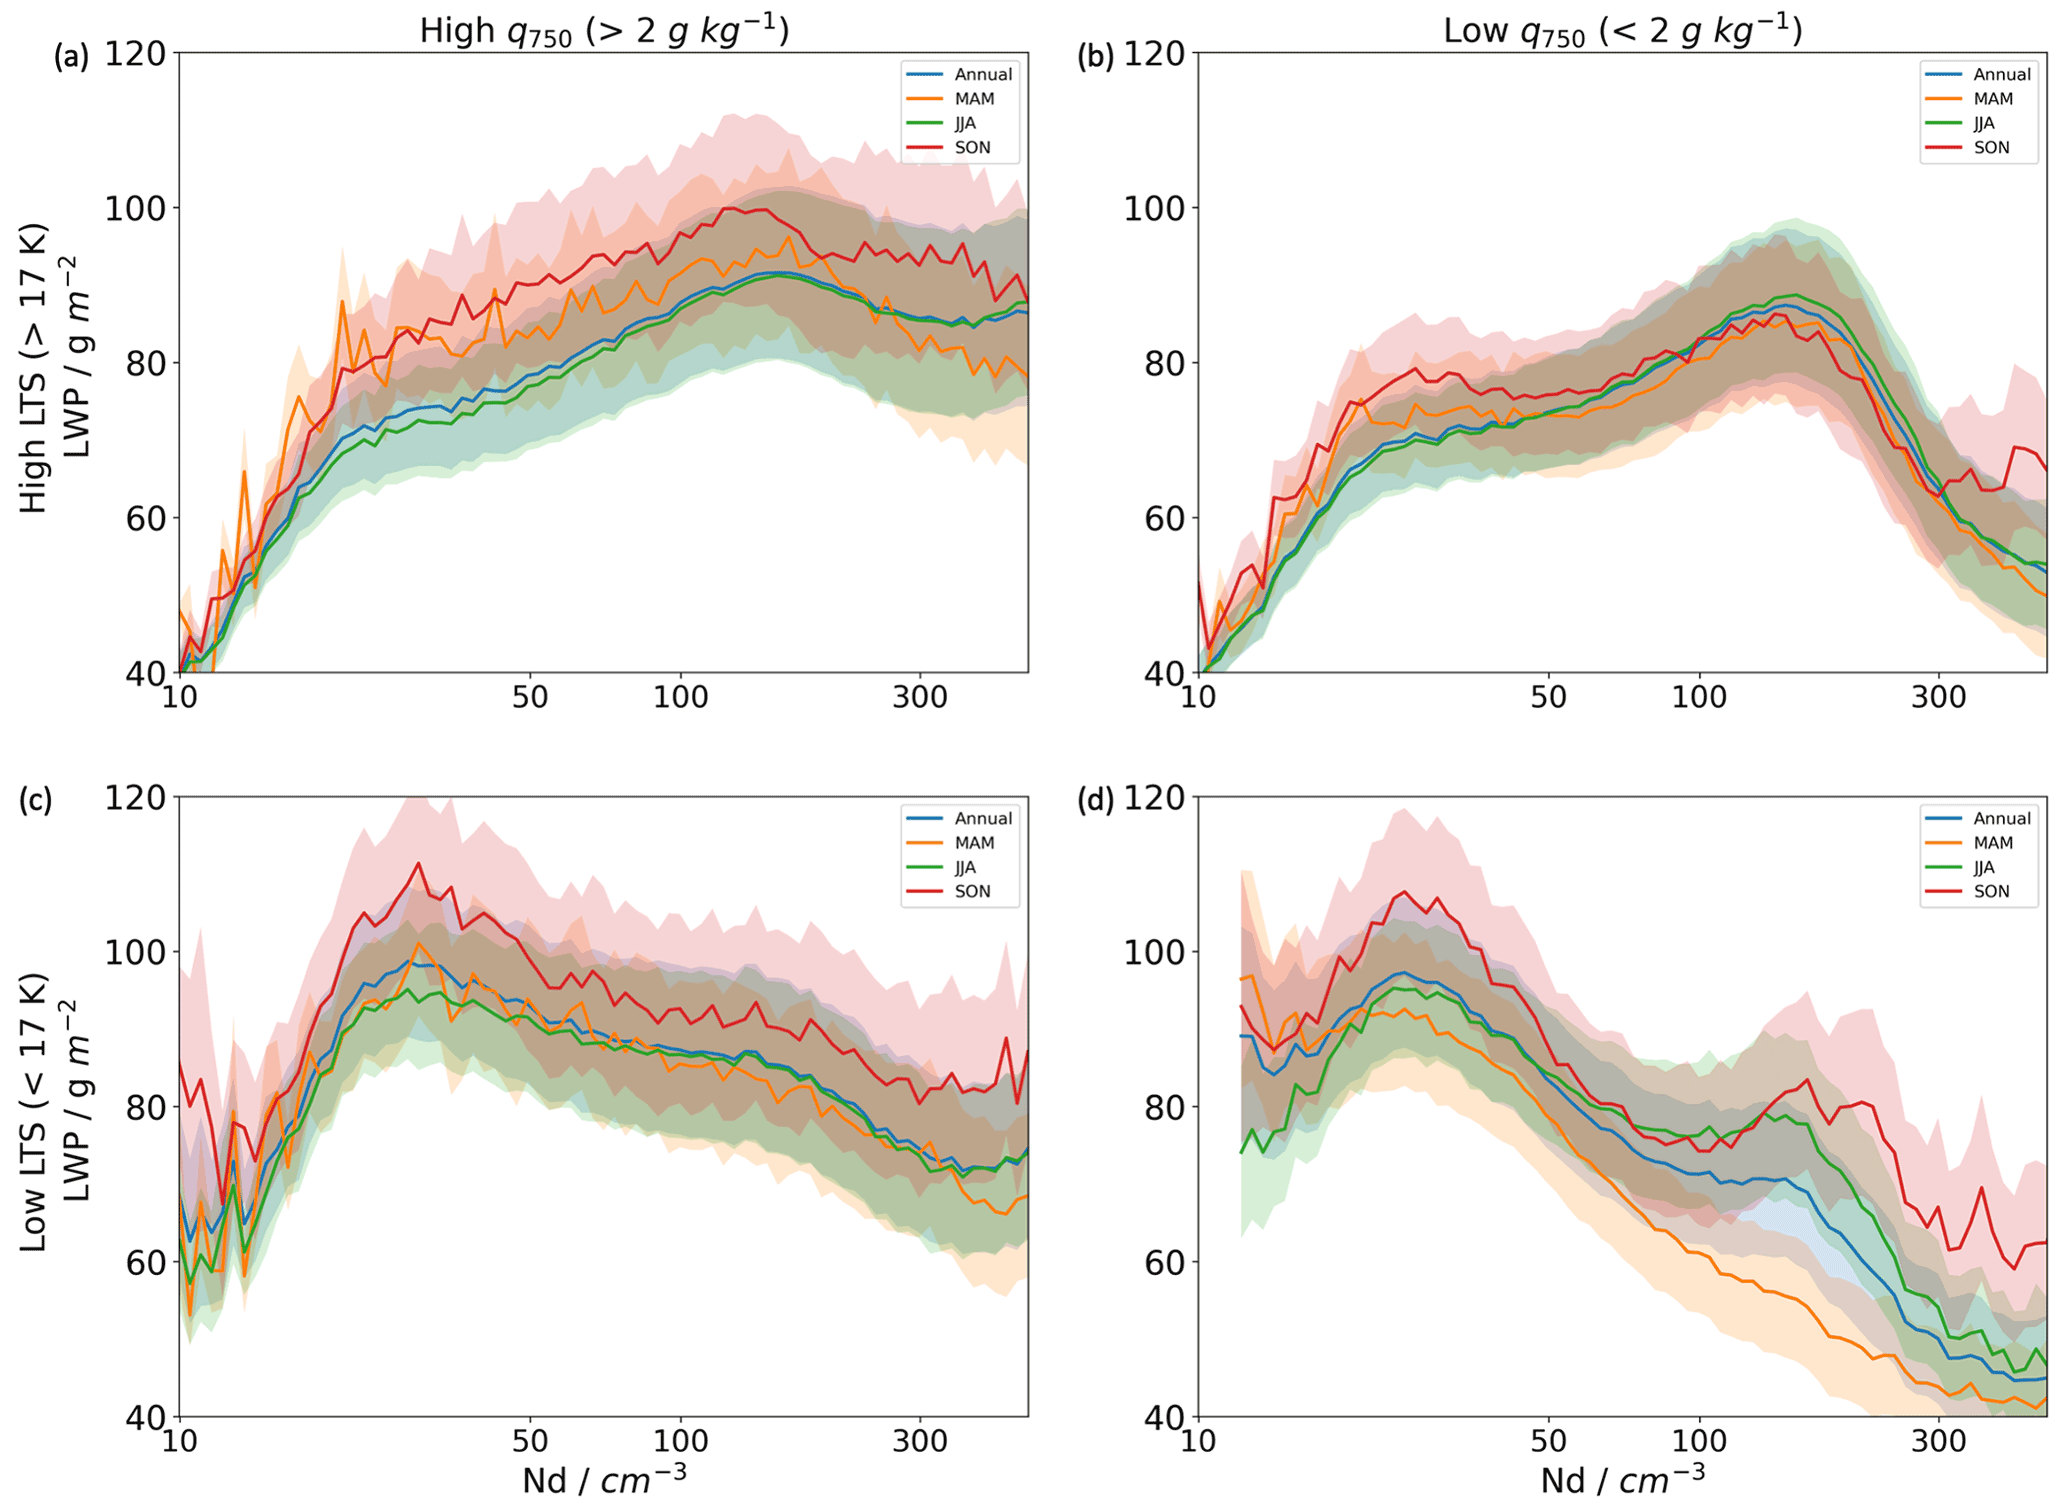
Figure 5The mean LWP for each Nd bin and the 95 % confidence interval for different meteorological regimes. The blue line is for all seasons and equivalent to the black lines in Fig. 4, and the orange, green and red lines are for MAM, JJA and SON, respectively.
When comparing across stability regimes, Fig. 4g and h show that when the Nd is below 50 cm−3, low-LTS conditions support clouds with a higher LWP. This may be due to a deepening of the boundary layer under unstable conditions, allowing clouds to grow deep enough to precipitate such that an increase in aerosol allows for more LWP to be retained in the cloud through the precipitation suppression mechanism. Additionally, low LTS facilitates the vertical transport of moisture, thereby promoting cloud formation (Kay et al., 2016). This behaviour is similar in both high- and low-q750 environments, suggesting that humidity plays a smaller role at low Nd.
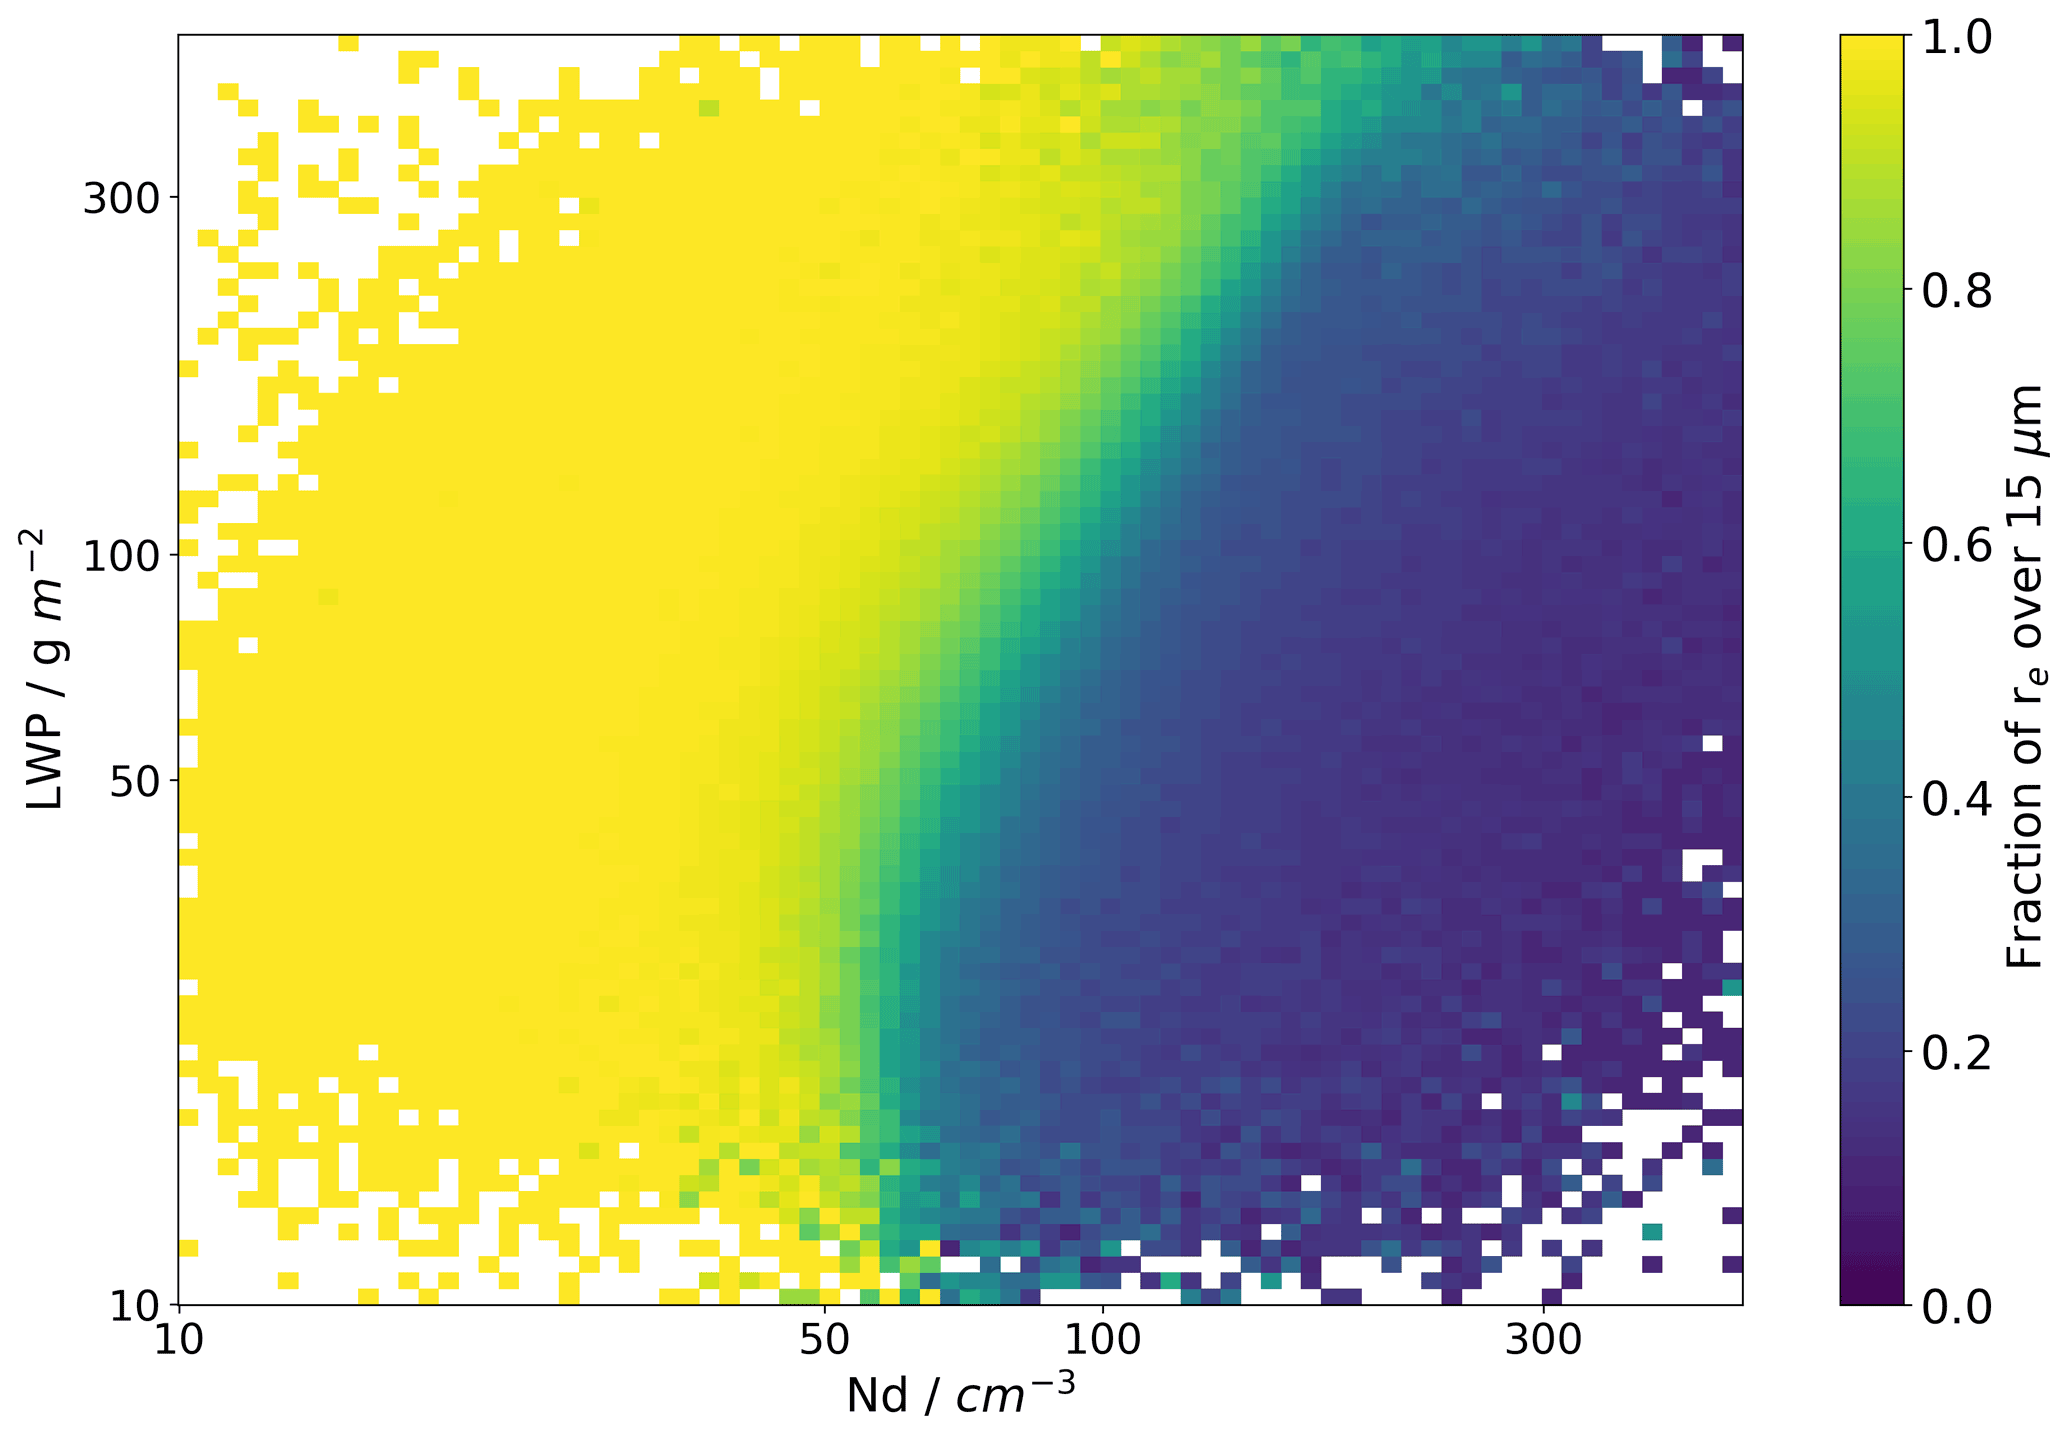
Figure 6Fraction of 1 km pixels with re>15 µm for a given 25 km by 25 km grid, as a function of LWP and Nd. Droplets with re>15 µm are assumed to be precipitating. The threshold of 15 µm for collision–coalescence is taken following Rosenfeld and Gutman (1994).
However, as Nd increases above 50–100 cm−3, Fig. 4g and h show that higher-LTS conditions support higher-LWP clouds than low-LTS conditions. Stronger mixing with subsaturated air in low-LTS environments may enhance droplet evaporation relative to stable environments. Dryer cloud tops would strengthen this effect, resulting in the disparity in cloud LWP for high and low LTS being stronger in low-q750 environments (Fig. 4h).
3.3 Radiative impacts
The potential radiative impact of the LWP adjustments relative to the albedo enhancements from more numerous, smaller droplets (the Twomey effect) can be estimated from
in which α is the cloud albedo following Platnick and Twomey (1994). An estimate of the Nd–LWP sensitivity can be generated by using the present-day Nd distribution and the joint probability histogram to generate a LWP distribution. The present-day Nd distribution is then adjusted such that the mean increases by 10 % to represent a hypothetical increase in aerosol concentration in a future Arctic. A new LWP distribution is calculated using this adjusted Nd distribution and the joint probability histograms. The change in the mean LWP and mean Nd between the two set distributions is calculated to estimate the sensitivity. Using this method, in high-LTS conditions (ignoring the effects of humidity), LWP adjustments imply an 8 % enhancement of the Twomey effect (slope of +0.03), and under low-LTS conditions, an offset of 43 % is implied (slope of −0.17). The sign of the sensitivity is insensitive to the size of the perturbation for moderately sized adjustments to the Nd distribution.
In this work, we have investigated the factors which influence the Nd–LWP relationship in Arctic clouds. We have found that LTS is a dominant control on the LWP response, with increases in LWP possible in high-stability conditions. Specific humidity only appears to influence the relationship in polluted or high-LTS conditions, and the Nd state exerts little control on the LWP response. However, despite careful filtering to remove instances in which the data are prone to errors, some uncertainties in the results remain.
For example, although the pixels have been filtered by cloud-top temperature, the misclassification of mixed-phase clouds as liquid may influence the results. However, Khanal and Wang (2018) showed that the error associated with this misclassification is small when compared to those generated by high solar zenith angles experienced in the Arctic, which in turn have been addressed in this work by the omission of high-angle pixels.
As LWP and Nd are both calculated using the τc and re retrievals, errors in these properties may result in significant correlated errors in the LWP and Nd MODIS retrievals. Gryspeerdt et al. (2019) show that errors in τc would generate a positive bias, whereas errors in re would create negative bias. However, when this analysis was repeated using the AMSR-E LWP (Figs. 1b, S6 and S7), the LWP response to Nd across the different meteorological regimes was consistent with the results using the MODIS LWP. AMSR-E is an independent dataset and therefore not affected by the correlated errors in τc and re. Therefore, while correlated errors may affect the LWP–Nd relationship, they do not dominate the results and the observed relationships are not just retrieval artefacts. The joint probability histograms generated using the AMSR-E LWP and MODIS Nd (Fig. S6) were also used to repeat the calculations in Sect. 4 to understand the effects of correlated errors on the estimate of the radiative impacts. In high-LTS conditions, the AMSR-E LWP adjustments imply a 13 % enhancement of the Twomey effect (slope of +0.05), and under low-LTS conditions, an offset of 10 % is implied (slope −0.04). The shift in the sign of the relationship with LTS is still evident, with changes in unstable conditions unlikely to be positive and enhancements in stable conditions unlikely to be very large. However, due to uncertainties in AMSR-E retrievals, the exact value of the enhancement or offset is unclear. A full understanding of the correlated errors is beyond the scope of this work.
Despite ERA5 performing better than other reanalysis datasets when compared to in situ observations of temperature and humidity (Graham et al., 2019), the meteorological conditions in the Arctic are still poorly constrained. Therefore, use of the reanalysis data may introduce additional uncertainties into the results. However, Renfrew et al. (2021) found that ERA5 compared well to in situ observations of ice-free regions in the Arctic, so these uncertainties are unlikely to strongly impact the findings of this work.
As the Arctic warms, the LTS is projected to decrease (Boeke et al., 2021). Figure 4 shows that in lower-LTS environments, LWP typically decreases with Nd, which weakens the short-wave cooling effect of the clouds on the surface. Assuming moderate increases in Nd, the LWP adjustments shift from amplifying the Twomey effect by 8 % in a stable environment to a 43 % reduction in an unstable one. This change in the sign of the Nd–LWP relationship with warming amounts to a temperature-dependent indirect effect: in a warmer Arctic with a more unstable boundary layer, LWP adjustments may shift from enhancing the cooling effect to offsetting it.
Equally, these results also demonstrate an aerosol-dependent cloud feedback, as the LWP response to changes in LTS is different in clean and polluted environments. In more polluted environments, LWP decreases more strongly at low LTS. This weakens the negative cloud feedback, shifting to a positive effect. This influence of aerosols on the cloud feedback is key as industrialisation and the creation of new trans-Arctic shipping lanes are projected to be developed as the Arctic heats and sea ice retreats, introducing a large new source of anthropogenic aerosols (Peters et al., 2011; Schmale et al., 2018).
In stable conditions, the Nd–LWP relationship is positive, with decreases in LWP only seen in heavily polluted environments (Fig. 4a, b). Additionally, in relatively clean conditions, clouds in low-LTS environments have higher LWP than clouds in stable environments (Fig. 4g, h). Therefore, individually, the increases in aerosol or decreases in LTS projected for the Arctic may act to strengthen the cloud short-wave effect. However, working together in a warmer Arctic, they may produce clouds with lower water paths, leading to a weaker negative cloud feedback in a more polluted environment.
The results presented here are only for liquid clouds over ocean; more work is required using different datasets to see if the findings hold in ice-covered regions or for mixed-phase clouds. Nevertheless, these findings that the aerosol–cloud interactions change with warming and that the LWP–LTS relationship depends on the aerosol loading may have significant implications for the surface energy budget in a rapidly changing Arctic. For example, potential decreases in cloud LWP suggested by this study could have significant consequences for Arctic sea ice extent. Thinner clouds have a lower albedo and therefore a lower short-wave cooling effect at the surface. In non-summer months, when surface albedo is low due to the presence of open ocean, this leads to an increase in solar radiation being absorbed by the surface. Previous work has found a negative correlation between the amount of radiation absorbed by the surface in summer, which is in part controlled by cloud LWP, and sea ice extent later in the year (Choi et al., 2014; Huang et al., 2017). The effects of these LWP changes to the long-wave effect, which dominates in non-summer months, are expected to be weaker, as Arctic clouds in non-summer months typically have LWP greater than 30 g m−2 and therefore act as black-body radiators (Shupe and Intrieri, 2004; Huang et al., 2017, 2019). As a result, changes in cloud fraction control the long-wave downwelling in the Arctic.
Previous studies have found a strong sensitivity of Arctic cloud properties and aerosols (Garrett et al., 2004; Coopman et al., 2018). However, these works either were of a limited spatial extent or considered the average response of cloud properties across the Arctic and therefore did not observe the spatial heterogeneity in the cloud response. This work considered the regional variation in the LWP response to Nd in liquid clouds, documenting a positive sensitivity at higher latitudes. Positive relationships have previously been observed under some conditions but not at the strength found in this work (Han et al., 2002; Chen et al., 2014; Toll et al., 2019; Gryspeerdt et al., 2019). However, the response is typically negative across the globe. The signal was most strongly observed during the summer months (Fig. 1). Comparison of cloud and meteorological properties of the regions displaying positive and negative sensitivity indicates that stability, in particular LTS, is a significant driving force for the difference in behaviour (Fig. 2).
There is only a weak response to cloud-top specific humidity, but the variation with LTS was much greater (Fig. 3). Under moist, stable conditions, the LWP increases with Nd, as seen with subtropical clouds (e.g. Chen et al., 2014). Even when considering cases with lower humidity, increases in LWP with Nd are supported up until high Nd, at which point the humidity is insufficient to offset the moisture lost to droplet evaporation (Fig. 4). The frequency of these high-LTS conditions at high latitudes during the summer months explains the seasonal pattern in the sensitivity in Fig. 1.
This work found evidence for a temperature-dependent aerosol indirect effect through the change in sign of the Nd–LWP relationship with LTS and an aerosol-dependent cloud feedback as the LWP response to LTS, and therefore surface temperature, changes with Nd. Unstable conditions generate higher LWP values than stable conditions for low Nd, potentially due to precipitation suppression (Fig. 4). Therefore, in a future lower-LTS environment, clouds have a stronger short-wave cooling effect. However, the response to aerosol in a warmer Arctic is different: interactions with aerosols would produce lower-LWP clouds, thereby reducing the aerosol cooling effect. Using the Twomey relation (Eq. 4) and simple assumptions about the future environment, an increase in Nd and move to low-LTS conditions imply that the Nd–LWP relationship shifts from slightly enhancing the Twomey effect to offsetting it by 43 %.
These findings on the dependence of the Nd–LWP relationship on the LTS and mean Nd state have important consequences for cloud feedbacks in a warmer, more polluted Arctic. The combined effect of increasing aerosol concentrations in conjunction with increases in surface temperature and decreases in the LTS may ultimately lead to thinner, lower-LWP clouds, with reduced cooling potential.
The data products are referenced in Sect. 2. The MODIS data were obtained from NASA Goddard Space Flight Center (https://doi.org/10.1109/TGRS.2016.2610522, Platnick et al., 2017). The ERA5 data were obtained from the Climate Data Store (https://doi.org/10.1002/qj.3803, Hersbach et al., 2020). The sea ice and AMSR-E data were obtained from the National Snow and Ice Data Center (https://doi.org/10.5067/8GQ8LZQVL0VL, Cavalieri et al. (1996) and https://doi.org/10.5067/AMSR-E/AE_OCEAN.002, Wentz and Meissner, 2004).
The supplement related to this article is available online at: https://doi.org/10.5194/acp-22-5743-2022-supplement.
Both authors contributed to study design and interpretation of results. RJMW performed the analysis and prepared the manuscript, with comments from EG.
The contact author has declared that neither they nor their co-author has any competing interests.
Publisher’s note: Copernicus Publications remains neutral with regard to jurisdictional claims in published maps and institutional affiliations.
This work was supported by funding from the Royal Society (University Research Fellowship URF/R1/191602) and an Imperial College London Department of Physics PhD studentship.
This research has been supported by the Royal Society (grant no. URF/R1/191602).
This paper was edited by Hailong Wang and reviewed by Yiyi Huang and two anonymous referees.
Ackerman, A., Kirkpatrick, M., Stevens, D., and Toon, O.: The impact of humidity above stratiform clouds on indirect aerosol climate forcing, Nature, 432, 1014–1017, https://doi.org/10.1038/nature03174, 2004. a, b
Albrecht, B. A.: Aerosols, Cloud Microphys. Fract. Cloud. Sci., 245, 1227–1230, https://doi.org/10.1126/science.245.4923.1227, 1989. a
Bennartz, R.: Global assessment of marine boundary layer cloud droplet number concentration from satellite, J. Geophys. Res.-Atmos., 112, https://doi.org/10.1029/2006JD007547, 2007. a
Bennartz, R., Shupe, M., Turner, D., Walden, V., Steffan, K., Cox, C., Kulie, M., Miller, N., and Pettersen, C.: July 2012 Greenland melt extent enhanced by low-level liquid clouds, Nature, 496, 83–86, https://doi.org/10.1038/nature12002, 2013. a
Boeke, R. C., Taylor, P. C., and Sejas, S. A.: On the Nature of the Arctic's Positive Lapse-Rate Feedback, Geophys. Res. Lett., 48, e2020GL091109, https://doi.org/10.1029/2020GL091109, 2021. a
Brenguier, J.-L., Pawlowska, H., Schüller, L., Preusker, R., Fischer, J., and Fouquart, Y.: Radiative Properties of Boundary Layer Clouds: Droplet Effective Radius versus Number Concentration, J. Atmos. Sci., 57, 803–821, https://doi.org/10.1175/1520-0469(2000)057<0803:RPOBLC>2.0.CO;2, 2000. a
Cavalieri, D. J., Parkinson, C. L., Gloersen, P., and Zwally, H. J.: Sea Ice Concentrations from Nimbus-7 SMMR and DMSP SSM/I-SSMIS Passive Microwave Data, Version 1, Boulder, Colorado USA, NASA National Snow and Ice Data Center Distributed Active Archive Center, Updated yearly, [data set], https://doi.org/10.5067/8GQ8LZQVL0VL, 1996. a, b
Cesana, G., Kay, J. E., Chepfer, H., English, J. M., and de Boer, G.: Ubiquitous low-level liquid-containing Arctic clouds: New observations and climate model constraints from CALIPSO-GOCCP, Geophys. Res. Lett., 39, L20804, https://doi.org/10.1029/2012GL053385, 2012. a
Chan, M. A. and Comiso, J. C.: Arctic Cloud Characteristics as Derived from MODIS, CALIPSO, and CloudSat, J. Climate, 26, 3285–3306, https://doi.org/10.1175/JCLI-D-12-00204.1, 2013. a
Chen, Y.-C., Christensen, M., Stephens, G., and Seinfeld, J.: Satellite-based estimate of global aerosol–cloud radiative forcing by marine warm clouds, Nat. Geosci., 7, 643–646, https://doi.org/10.1038/ngeo2214, 2014. a, b, c, d, e, f
Choi, Y.-S., Kim, B.-M., Hur, S.-K., Kim, S.-J., Kim, J.-H., and Ho, C.-H.: Connecting early summer cloud-controlled sunlight and late summer sea ice in the Arctic, J. Geophys. Res.-Atmos., 119, 11087–11099, https://doi.org/10.1002/2014JD022013, 2014. a
Coopman, Q., Garrett, T. J., Riedi, J., Eckhardt, S., and Stohl, A.: Effects of long-range aerosol transport on the microphysical properties of low-level liquid clouds in the Arctic, Atmos. Chem. Phys., 16, 4661–4674, https://doi.org/10.5194/acp-16-4661-2016, 2016. a, b, c, d
Coopman, Q., Garrett, T. J., Finch, D. P., and Riedi, J.: High Sensitivity of Arctic Liquid Clouds to Long-Range Anthropogenic Aerosol Transport, Geophys. Res. Lett., 45, 372–381, https://doi.org/10.1002/2017GL075795, 2018. a, b, c
Curry, J. A. and Ebert, E. E.: Annual Cycle of Radiation Fluxes over the Arctic Ocean: Sensitivity to Cloud Optical Properties, J. Climate, 5, 1267–1280, https://doi.org/10.1175/1520-0442(1992)005<1267:ACORFO>2.0.CO;2, 1992. a
de Boer, G., Eloranta, E. W., and Shupe, M. D.: Arctic Mixed-Phase Stratiform Cloud Properties from Multiple Years of Surface-Based Measurements at Two High-Latitude Locations, J. Atmos. Sci., 66, 2874–2887, https://doi.org/10.1175/2009JAS3029.1, 2009. a
Dong, X., Xi, B., Qiu, S., Minnis, P., Sun-Mack, S., and Rose, F.: A radiation closure study of Arctic stratus cloud microphysical properties using the collocated satellite-surface data and Fu-Liou radiative transfer model, J. Geophys. Res.-Atmos., 121, 10175–10198, https://doi.org/10.1002/2016JD025255, 2016. a, b
Feingold, G., Remer, L. A., Ramaprasad, J., and Kaufman, Y. J.: Analysis of smoke impact on clouds in Brazilian biomass burning regions: An extension of Twomey's approach, J. Geophys. Res.-Atmos., 106, 22907–22922, https://doi.org/10.1029/2001JD000732, 2001. a
Fletcher, J. K., Mason, S., and Jakob, C.: A Climatology of Clouds in Marine Cold Air Outbreaks in Both Hemispheres, J. Climate, 29, 6677–6692, https://doi.org/10.1175/JCLI-D-15-0783.1, 2016. a
Garrett, T. J., Zhao, C., Dong, X., Mace, G. G., and Hobbs, P. V.: Effects of varying aerosol regimes on low-level Arctic stratus, Geophys. Res. Lett., 31, L17105, https://doi.org/10.1029/2004GL019928, 2004. a, b, c
Graham, R. M., Hudson, S. R., and Maturilli, M.: Improved Performance of ERA5 in Arctic Gateway Relative to Four Global Atmospheric Reanalyses, Geophys. Res. Lett., 46, 6138–6147, https://doi.org/10.1029/2019GL082781, 2019. a
Grosvenor, D. P. and Wood, R.: The effect of solar zenith angle on MODIS cloud optical and microphysical retrievals within marine liquid water clouds, Atmos. Chem. Phys., 14, 7291–7321, https://doi.org/10.5194/acp-14-7291-2014, 2014. a, b, c, d, e
Gryspeerdt, E., Quaas, J., and Bellouin, N.: Constraining the aerosol influence on cloud fraction, J. Geophys. Res.-Atmos., 121, 3566–3583, https://doi.org/10.1002/2015JD023744, 2016. a, b
Gryspeerdt, E., Goren, T., Sourdeval, O., Quaas, J., Mülmenstädt, J., Dipu, S., Unglaub, C., Gettelman, A., and Christensen, M.: Constraining the aerosol influence on cloud liquid water path, Atmos. Chem. Phys., 19, 5331–5347, https://doi.org/10.5194/acp-19-5331-2019, 2019. a, b, c, d, e, f, g, h, i
Han, Q., Rossow, W. B., Zeng, J., and Welch, R.: Three Different Behaviors of Liquid Water Path of Water Clouds in Aerosol–Cloud Interactions, J. Atmos. Sci., 59, 726–735, https://doi.org/10.1175/1520-0469(2002)059<0726:TDBOLW>2.0.CO;2, 2002. a
Hersbach, H., Bell, B., Berrisford, P., Hirahara, S., Horányi, A., Muñoz-Sabater, J., Nicolas, J., Peubey, C., Radu, R., Schepers, D., Simmons, A., Soci, C., Abdalla, S., Abellan, X., Balsamo, G., Bechtold, P., Biavati, G., Bidlot, J., Bonavita, M., De Chiara, G., Dahlgren, P., Dee, D., Diamantakis, M., Dragani, R., Flemming, J., Forbes, R., Fuentes, M., Geer, A., Haimberger, L., Healy, S., Hogan, R. J., Hólm, E., Janisková, M., Keeley, S., Laloyaux, P., Lopez, P., Lupu, C., Radnoti, G., de Rosnay, P., Rozum, I., Vamborg, F., Villaume, S., and Thépaut, J.-N.: The ERA5 global reanalysis, [data set], Q. J. Roy. Meteor. Soc., 146, 1999–2049, https://doi.org/10.1002/qj.3803, 2020. a, b
Huang, Y., Dong, X., Xi, B., Dolinar, E. K., and Stanfield, R. E.: The footprints of 16 year trends of Arctic springtime cloud and radiation properties on September sea ice retreat, J. Geophys. Res.-Atmos., 122, 2179–2193, https://doi.org/10.1002/2016JD026020, 2017. a, b
Huang, Y., Dong, X., Bailey, D. A., Holland, M. M., Xi, B., DuVivier, A. K., Kay, J. E., Landrum, L. L., and Deng, Y.: Thicker Clouds and Accelerated Arctic Sea Ice Decline: The Atmosphere-Sea Ice Interactions in Spring, Geophys. Res. Lett., 46, 6980–6989, https://doi.org/10.1029/2019GL082791, 2019. a, b, c
Intrieri, J. M., Fairall, C. W., Shupe, M. D., Persson, P. O. G., Andreas, E. L., Guest, P. S., and Moritz, R. E.: An annual cycle of Arctic surface cloud forcing at SHEBA, J. Geophys. Res.-Oceans, 107, 13–14, https://doi.org/10.1029/2000JC000439, 2002. a
Kay, J., L'Ecuyer, T., Chepfer, H., Loeb, N., Morrison, A., and Cesana, G.: Recent Advances in Arctic Cloud and Climate Research, Curr. Clim. Change Rep., 2, 159–169, https://doi.org/10.1007/s40641-016-0051-9, 2016. a
Kay, J. E. and Gettelman, A.: Cloud influence on and response to seasonal Arctic sea ice loss, J. Geophys. Res.-Atmos., 114, D18204, https://doi.org/10.1029/2009JD011773, 2009. a, b, c, d
Khanal, S. and Wang, Z.: Uncertainties in MODIS-Based Cloud Liquid Water Path Retrievals at High Latitudes Due to Mixed-Phase Clouds and Cloud Top Height Inhomogeneity, J. Geophys. Res.-Atmos., 123, 11154–11172, https://doi.org/10.1029/2018JD028558, 2018. a, b
Klein, S. A. and Hartmann, D. L.: The Seasonal Cycle of Low Stratiform Clouds, J. Climate, 6, 1587–1606, https://doi.org/10.1175/1520-0442(1993)006<1587:TSCOLS>2.0.CO;2, 1993. a
Kolstad, E. W. and Bracegirdle, T. J.: Marine cold-air outbreaks in the future: an assessment of IPCC AR4 model results for the Northern Hemisphere, Clim. Dynam., 30, 871–885, https://doi.org/10.1007/s00382-007-0331-0, 2008. a
L'Ecuyer, T. S., Hang, Y., Matus, A. V., and Wang, Z.: Reassessing the Effect of Cloud Type on Earth's Energy Balance in the Age of Active Spaceborne Observations, Part I: Top of Atmosphere and Surface, J. Climate, 32, 6197–6217, https://doi.org/10.1175/JCLI-D-18-0753.1, 2019. a
Lubin, D. and Vogelmann, A.: A climatologically significant aerosol longwave indirect effect in the Arctic, Nature, 449, 453–456, https://doi.org/10.1038/nature04449, 2006. a
Maahn, M., Goren, T., Shupe, M. D., and de Boer, G.: Liquid Containing Clouds at the North Slope of Alaska Demonstrate Sensitivity to Local Industrial Aerosol Emissions, Geophys. Res. Lett., 48, e2021GL094307, https://doi.org/10.1029/2021GL094307, 2021. a
Malavelle, F. F., Haywood, J. M., Jones, A., Gettelman, A., Clarisse, L., Bauduin, S., Allan, R. P., Karset, I. H. H., Kristjánsson, J. E., Oreopoulos, L., Cho, N., Lee, D., Bellouin, N., Boucher, O., Grosvenor, D. P., Carslaw, K. S., Dhomse, S., Mann, G. W., Schmidt, A., Coe, H., Hartley, M. E., Dalvi, M., Hill, A. A., Johnson, B. T., Johnson, C. E., Knight, J. R., O'Connor, F. M., Partridge, D. G., Stier, P., Myhre, G., Platnick, S., Stephens, G. L., Takahashi, H., and Thordarson, T.: Strong constraints on aerosol–cloud interactions from volcanic eruptions, Nature, 546, 485–491, https://doi.org/10.1038/nature22974, 2017. a
Mann, H. B. and Whitney, D. R.: On a Test of Whether one of Two Random Variables is Stochastically Larger than the Other, Ann. Math. Stat., 18, 50–60, https://doi.org/10.1214/aoms/1177730491, 1947. a
McCoy, I. L., Wood, R., and Fletcher, J. K.: Identifying Meteorological Controls on Open and Closed Mesoscale Cellular Convection Associated with Marine Cold Air Outbreaks, J. Geophys. Res.-Atmos., 122, 11678–11702, https://doi.org/0.1002/2017JD027031, 2017. a
Merk, D., Deneke, H., Pospichal, B., and Seifert, P.: Investigation of the adiabatic assumption for estimating cloud micro- and macrophysical properties from satellite and ground observations, Atmos. Chem. Phys., 16, 933–952, https://doi.org/10.5194/acp-16-933-2016, 2016. a
Michibata, T., Suzuki, K., Sato, Y., and Takemura, T.: The source of discrepancies in aerosol–cloud–precipitation interactions between GCM and A-Train retrievals, Atmos. Chem. Phys., 16, 15413–15424, https://doi.org/10.5194/acp-16-15413-2016, 2016. a, b, c
Morrison, A. L., Kay, J. E., Chepfer, H., Guzman, R., and Yettella, V.: Isolating the Liquid Cloud Response to Recent Arctic Sea Ice Variability Using Spaceborne Lidar Observations, J. Geophys. Res.-Atmos., 123, 473–490, https://doi.org/10.1002/2017JD027248, 2018. a, b
Painemal, D. and Zuidema, P.: Assessment of MODIS cloud effective radius and optical thickness retrievals over the Southeast Pacific with VOCALS-REx in situ measurements, J. Geophys. Res.-Atmos., 116, D24206, https://doi.org/10.1029/2011JD016155, 2011. a, b
Persson, P.: Onset and end of the summer melt season over sea ice: thermal structure and surface energy perspective from SHEBA, Clim. Dynam., 39, 1349–1371, https://doi.org/10.1007/s00382-011-1196-9, 2012. a
Peters, G. P., Nilssen, T. B., Lindholt, L., Eide, M. S., Glomsrød, S., Eide, L. I., and Fuglestvedt, J. S.: Future emissions from shipping and petroleum activities in the Arctic, Atmos. Chem. Phys., 11, 5305–5320, https://doi.org/10.5194/acp-11-5305-2011, 2011. a
Pithan, F. and Mauritsen, T.: Arctic amplification dominated by temperature feedbacks in contemporary climate models, Nat. Geosci., 7, 181–184, https://doi.org/10.1038/ngeo2071, 2014. a
Pithan, F., Svensson, G., Caballero, R., Chechin, D., Cronin, T., Ekman, A., Neggers, R., Shupe, M., Solomon, A., Tjernström, M., and Wendisch, M.: Role of air-mass transformations in exchange between the Arctic and mid-latitudes, Nat. Geosci., 11, 805–812, https://doi.org/10.1038/s41561-018-0234-1, 2018. a
Platnick, S. and Twomey, S.: Remote sensing the susceptibility of cloud albedo to changes in drop concentration, Atmos. Res., 34, 85–98, https://doi.org/10.1016/0169-8095(94)90082-5, 1994. a
Platnick, S., Meyer, K. G., King, M. D., Wind, G., Amarasinghe, N., Marchant, B., Arnold, G. T., Zhang, Z., Hubanks, P. A., Holz, R. E., Yang, P., Ridgway, W. L., and Riedi, J.: The MODIS Cloud Optical and Microphysical Products: Collection 6 Updates and Examples From Terra and Aqua, IEEE T. Geosci. Remote, [data set], 55, 502–525, https://doi.org/10.1109/TGRS.2016.2610522, 2017. a, b
Quaas, J., Boucher, O., and Lohmann, U.: Constraining the total aerosol indirect effect in the LMDZ and ECHAM4 GCMs using MODIS satellite data, Atmos. Chem. Phys., 6, 947–955, https://doi.org/10.5194/acp-6-947-2006, 2006. a, b
Quaas, J., Boucher, O., Bellouin, N., and Kinne, S.: Satellite-based estimate of the direct and indirect aerosol climate forcing, J. Geophys. Res.-Atmos., 113, D05204, https://doi.org/10.1029/2007JD008962, 2008. a
Quaas, J., Stevens, B., Stier, P., and Lohmann, U.: Interpreting the cloud cover – aerosol optical depth relationship found in satellite data using a general circulation model, Atmos. Chem. Phys., 10, 6129–6135, https://doi.org/10.5194/acp-10-6129-2010, 2010. a
Renfrew, I. A., Barrell, C., Elvidge, A. D., Brooke, J. K., Duscha, C., King, J. C., Kristiansen, J., Cope, T. L., Moore, G. W. K., Pickart, R. S., Reuder, J., Sandu, I., Sergeev, D., Terpstra, A., Våge, K., and Weiss, A.: An evaluation of surface meteorology and fluxes over the Iceland and Greenland Seas in ERA5 reanalysis: The impact of sea ice distribution, Q. J. Roy. Meteor. Soc., 147, 691–712, https://doi.org/0.1002/qj.3941, 2021. a
Rosenfeld, D. and Gutman, G.: Retrieving microphysical properties near the tops of potential rain clouds by multispectral analysis of AVHRR data, Atmos. Res., 34, 259–283, https://doi.org/10.1016/0169-8095(94)90096-5, 1994. a
Schmale, J., Arnold, S. R., Law, K. S., Thorp, T., Anenberg, S., Simpson, W. R., Mao, J., and Pratt, K. A.: Local Arctic Air Pollution: A Neglected but Serious Problem, Earth's Future, 6, 1385–1412, https://doi.org/10.1029/2018EF000952, 2018. a, b
Schmale, J., Zieger, P., and Ekman, A.: Aerosols in current and future Arctic climate, Nat. Clim. Change, 11, 95–105, https://doi.org/10.1038/s41558-020-00969-5, 2021. a
Serreze, M. C. and Barry, R. G.: Processes and impacts of Arctic amplification: A research synthesis, Glob. Planet. Change, 77, 85–96, https://doi.org/10.1016/j.gloplacha.2011.03.004, 2011. a
Shupe, M. D.: Clouds at Arctic Atmospheric Observatories, Part II: Thermodynamic Phase Characteristics, J. Appl. Meteorol. Clim., 50, 64–661, https://doi.org/10.1175/2010JAMC2468.1, 2011. a
Shupe, M. D. and Intrieri, J. M.: Cloud Radiative Forcing of the Arctic Surface: The Influence of Cloud Properties, Surface Albedo, and Solar Zenith Angle, J. Climate, 17, 616–628, https://doi.org/10.1175/1520-0442(2004)017<0616:CRFOTA>2.0.CO;2, 2004. a, b
Sourdeval, O., C.-Labonnote, L., Baran, A. J., Mülmenstädt, J., and Brogniez, G.: A methodology for simultaneous retrieval of ice and liquid water cloud properties, Part 2: Near-global retrievals and evaluation against A-Train products, Q. J. Roy. Meteor. Soc., 142, 3063–3081, https://doi.org/10.1002/qj.2889, 2016. a
Stevens, B. and Feingold, G.: Untangling aerosol effects on clouds and precipitation in a buffered system, Nature, 461, 607–613, https://doi.org/10.1038/nature08281, 2009. a
Tietze, K., Riedi, J., Stohl, A., and Garrett, T. J.: Space-based evaluation of interactions between aerosols and low-level Arctic clouds during the Spring and Summer of 2008, Atmos. Chem. Phys., 11, 3359–3373, https://doi.org/10.5194/acp-11-3359-2011, 2011. a
Toll, V., Christensen, M., Gassó, S., and Bellouin, N.: Volcano and Ship Tracks Indicate Excessive Aerosol-Induced Cloud Water Increases in a Climate Model, Geophys. Res. Lett., 44, 12492–12500, https://doi.org/10.1002/2017GL075280, 2017. a
Toll, V., Christensen, M., Quaas, J., and Bellouin, N.: Weak average liquid-cloud-water response to anthropogenic aerosols, Nature, 572, 51–55, https://doi.org/10.1038/s41586-019-1423-9, 2019. a, b, c
Twomey, S.: The Influence of Pollution on the Shortwave Albedo of Clouds, J. Atmos. Sci., 34, 1149–1152, https://doi.org/10.1175/1520-0469(1977)034<1149:TIOPOT>2.0.CO;2, 1977. a
Wentz, F. J. and Meissner, T.: AMSR-E/Aqua L2B Global Swath Ocean Products derived from Wentz Algorithm, Version 2.7, Boulder, Colorado USA, NASA National Snow and Ice Data Center Distributed Active Archive Center, [data set], https://doi.org/10.5067/AMSR-E/AE_OCEAN.002, 2004. a, b
Williams, A. S. and Igel, A. L.: Cloud Top Radiative Cooling Rate Drives Non-Precipitating Stratiform Cloud Responses to Aerosol Concentration, Geophys. Res. Lett., 48, e2021GL094740, https://doi.org/10.1029/2021GL094740, 2021. a
Wood, R. and Hartmann, D. L.: Spatial Variability of Liquid Water Path in Marine Low Cloud: The Importance of Mesoscale Cellular Convection, J. Climate, 19, 1748–1764, https://doi.org/10.1175/JCLI3702.1, 2006. a
Xue, H. and Feingold, G.: Large-Eddy Simulations of Trade Wind Cumuli: Investigation of Aerosol Indirect Effects, J. Atmos. Sci., 63, 1605–1622, https://doi.org/10.1175/JAS3706.1, 2006. a
Zamora, L. M., Kahn, R. A., Huebert, K. B., Stohl, A., and Eckhardt, S.: A satellite-based estimate of combustion aerosol cloud microphysical effects over the Arctic Ocean, Atmos. Chem. Phys., 18, 14949–14964, https://doi.org/10.5194/acp-18-14949-2018, 2018. a
Zhang, Z. and Platnick, S.: An assessment of differences between cloud effective particle radius retrievals for marine water clouds from three MODIS spectral bands, J. Geophys. Res.-Atmos., 116, D20215, https://doi.org/10.1029/2011JD016216, 2011. a
Zhao, C. and Garrett, T. J.: Effects of Arctic haze on surface cloud radiative forcing, Geophys. Res. Lett., 42, 557–564, https://doi.org/10.1002/2014GL062015, 2015. a
Zuidema, P., Westwater, E. R., Fairall, C., and Hazen, D.: Ship-based liquid water path estimates in marine stratocumulus, J. Geophys. Res.-Atmos., 110, D20206, https://doi.org/10.1029/2005JD005833, 2005. a