the Creative Commons Attribution 4.0 License.
the Creative Commons Attribution 4.0 License.
 | 14 Jan 2022
Measurement report: Long-term changes in black carbon and aerosol optical properties from 2012 to 2020 in Beijing, China
Jiaxing Sun
Wei Zhou
Conghui Xie
Chun Chen
Tingting Han
Qingqing Wang
Zhijie Li
Jie Li
Pingqing Fu
Zifa Wang
Atmospheric aerosols play an important role in the radiation balance of the earth–atmosphere system. However, our knowledge of the long-term changes in equivalent black carbon (eBC) and aerosol optical properties in China is very limited. Here we analyze the 9-year measurements of eBC and aerosol optical properties from 2012 to 2020 in Beijing, China. Our results showed large reductions in eBC by 71 % from 6.25 ± 5.73 µg m−3 in 2012 to 1.80 ± 1.54 µg m−3 in 2020 and 47 % decreases in the light extinction coefficient (bext, λ = 630 nm) of fine particles due to the Clean Air Action Plan that was implemented in 2013. The seasonal and diurnal variations of eBC illustrated the most significant reductions in the fall and at nighttime, respectively. ΔeBC ΔCO also showed an annual decrease from ∼ 7 to 4 ng m−3 ppbv−1 and presented strong seasonal variations with high values in spring and fall, indicating that primary emissions in Beijing have changed significantly. As a response to the Clean Air Action Plan, single-scattering albedo (SSA) showed a considerable increase from 0.79 ± 0.11 to 0.88 ± 0.06, and mass extinction efficiency (MEE) increased from 3.2 to 3.8 m2 g−1. These results highlight the increasing importance of scattering aerosols in radiative forcing and a future challenge in visibility improvement due to enhanced MEE. Brown carbon (BrC) showed similar changes and seasonal variations to eBC during 2018–2020. However, we found a large increase of secondary BrC in the total BrC in most seasons, particularly in summer with the contribution up to 50 %, demonstrating an enhanced role of secondary formation in BrC in recent years. The long-term changes in eBC and BrC have also affected the radiative forcing effect. The direct radiative forcing (ΔFR) of BC decreased by 67 % from +3.36 W m−2 in 2012 to +1.09 W m−2 in 2020, and that of BrC decreased from +0.30 to +0.17 W m−2 during 2018–2020. Such changes might have important implications for affecting aerosol–boundary layer interactions and the improvement of future air quality.
- Article
(4937 KB) - Full-text XML
-
Supplement
(931 KB) - BibTeX
- EndNote


Atmospheric aerosols play an important role in the radiative balance of the earth–atmosphere system by directly scattering and absorbing solar radiation or indirectly changing cloud reflectivity and precipitation processes (Rosenfeld, 2000; Bond and Bergstrom, 2006). Accurate assessment of radiative forcing caused by aerosol is still a challenge (IPCC, 2013) due to uncertainties in the estimating scattering coefficient (bsca), absorption coefficient (babs), and single-scattering albedo (SSA). In particular, SSA is a key factor determining whether aerosols exert warming or cooling effects. Previous studies found that an increase of SSA from 0.8 to 0.9 can shift the radiative forcing from positive to negative (Hansen et al., 1997; Lee et al., 2007). These key parameters of aerosol optical properties are closely related to the size distribution, mass concentration, and composition of aerosols, which have been extensively studied in previous research (Han et al., 2015; Massoli et al., 2015; Zhai et al., 2017; Xie et al., 2019). Generally, sulfate, nitrate, and most organics predominantly scatter light and exert a negative forcing effect (Haywood and Boucher, 2000; Han et al., 2015). In contrast, black carbon (BC) and brown carbon (BrC) are major absorption aerosols which the warm atmosphere and present a positive forcing effect (Bond et al., 2013). BC is mainly generated from the incomplete combustion of fossil fuels and bio-fuels. It absorbs at all wavelengths and produces a strong radiative forcing effect (Jacobson, 2001; Bond et al., 2013; IPCC, 2013). Depending on the measurement method, BC is also called elemental carbon (EC), refractory black carbon (rBC), and equivalent black carbon (eBC), which is derived from converting the light absorption coefficient into mass concentration with a suitable mass absorption efficient (MAE) (Petzold et al., 2013). As a part of organic carbon, the absorbing ability of BrC depends strongly on wavelength (Andreae and Gelencsér, 2006; Cappa et al., 2019) and generally accounts for 20 %–40 % of the total absorption of carbonaceous aerosol over a global scale (Park et al., 2010; Saleh et al., 2013; Jo et al., 2016; Wang et al., 2019a). Besides primary sources similar to BC (i.e., biomass burning, coal combustion and vehicle exhaust), BrC can also be produced from multiphase reactions like photochemical or aqueous-phase oxidation of volatile organic compounds (Laskin et al., 2015).
High concentrations of absorbing and scattering aerosols also cause air pollution and effect humans' health (Oberdörster and Yu, 1990). BC is a particular pollutant which could affect the development of the boundary layer by changing the atmospheric heating rate and aggravating air pollution (Ding et al., 2016). Severe air pollution has been a wide environmental concern in China during the last decade (An et al., 2019; Zhou et al., 2020). Previous studies showed that China and India contributed most to the BC emissions in Asia, accounting for 25 %–35 % in 2010 (Ramanathan and Carmichael, 2008; Bond et al., 2013; Li et al., 2017; Wei et al., 2020). In China, the BC emissions were estimated to be approximately 2534 Gg in 2014, twice as much as that in 1960 (Hoesly et al., 2018). Until 2017, the residential and industry contributed more than 83 % of Chinese BC emissions (Wang et al., 2012). Therefore, it is important to characterize the long-term changes in BC and its response to the changes in source emissions.
Beijing as one of the largest megacities in the world has had great success in decreasing PM2.5 during the last decade by implementing the Clean Air Action Plan (Zhang et al., 2019). Many previous studies focused on the changes in aerosol chemical components and the influences of emissions and meteorological conditions (Sun et al., 2018; Lei et al., 2020; Y. Sun et al., 2020). The mass concentration, mixing state, optical property, and coating chemical composition of BC in Beijing were also widely investigated in field campaigns in specific seasons (Han et al., 2017; D. Liu et al., 2017; Din et al., 2019; Xie et al., 2020; Sun et al., 2021). However, our understanding of the long-term changes of black carbon, aerosol optical properties, and radiative effects as a response to the “Atmospheric Pollution Prevention and Control Action Plan” (http://www.gov.cn/zwgk/2013-09/12/content_2486773.htm, last access: 21 July 2021) is very limited.
In this study, we conducted 9-year measurements of eBC and light extinction coefficient (λ = 630 nm) using aethalometers along with a cavity attenuated phase shift (CAPS) extinction monitor in Beijing. The long-term changes in eBC, bext, SSA, and mass extinction efficient (MEE) are investigated, and their annual, seasonal, and diurnal variations are elucidated. Moreover, we illustrate the changes in BrC absorption and absorption Ångström exponent (AAE) using 3-year measurements from 2018 to 2020. Particularly, the contributions of primary emissions and secondary formation to BrC absorptions are quantified, and their changes during the past 3 years are demonstrated. Finally, the impact of the changes in BC and BrC on direct radiative forcing is estimated and discussed.
2.1 Sampling sites and measurements
All optical measurements were conducted at the Institute of Atmospheric Physics (IAP), Chinese Academy of Sciences (39∘58′28′′ N, 116∘22′16′′ E), in Beijing. More detailed descriptions of the sampling site were given in a previous study (J. Y. Sun et al., 2020). Equivalent BC (eBC) was measured by a two-wavelength (375 and 880 nm) aethalometer (AE22, Magee Scientific) from August 2012 to December 2014 and a seven-wavelength (370, 470, 520, 590, 660, 880, and 950 nm) aethalometer (AE33, Magee Scientific) from January 2015 to November 2020, along with the measurement of light extinction (bext, λ = 630 nm) of dry, fine particles using a CAPS extinction monitor from 2012 to 2020. Note that the measurements of aethalometers and CAPS from June 2013 to September 2014 and from August 2015 to August 2017 were not available. The available data are from August 2012 to May 2013, October 2014 to September 2015, and September 2017 to December 2020. A more detailed instrument deployment is shown in Fig. S1 in the Supplement. The AE22 and AE33 were operated at time resolutions of 10 and 1 min, respectively, and the CAPS was operated at a time resolution of 1 s. Because the new version of AE33 using the “dual-spot” technique can provide more reliable measurements by better correcting the filter-based loading effects (Drinovec et al., 2015), we further corrected the eBC measurement of AE22 according to a parallel measurement between AE33 and AE22 (R2 = 0.99, slope = 1.38) (Han et al., 2017). The mass concentrations of PM2.5 and CO were obtained from the air quality monitoring station at the Olympic Center (39∘59′11′′ N, 116∘23′58′′ E), which is approximately 4 km from our sampling site. The meteorological parameters of wind direction (WD) and wind speed (WS) were measured at the height of 102 m on the 325 m meteorological tower in Beijing. In this study, four seasons are defined as spring (March, April, and May), summer (June, July and August), fall (September, October, and November), and winter (December, January, and February the following year), and all data are reported in Beijing standard time (UTC+8).
2.2 Calculations of aerosol optical properties
Single-scattering albedo (SSA, λ = 630 nm) of PM2.5 can be calculated as follows:
where bext is the light extinction coefficient at 630 nm. The mass concentration of eBC was converted to babs at 630 nm using an MAE of 7.9 in spring and summer and 7.4 in fall and winter, respectively (Han et al., 2017).
The mass extinction efficiency (MEE) of PM2.5 was derived as the ratio of bext to the mass concentration of PM2.5,
The absorption Ångström exponent (AAE) can be determined using Eq. (4) (Moosmüller et al., 2011), and the babs, BC at each wavelength was estimated assuming an AAE = 1 for pure BC (Bond and Bergstrom, 2006). After subtracting babs, BC from the total absorption coefficient babs, total at 370 nm, the BrC absorption coefficient (babs, BrC) can be estimated with Eq. (5). Note that we may slightly overestimate the absorption of BrC due to the influence of dust, though the MAE of dust was much lower than BC and BrC (Yang et al., 2009).
2.3 Quantification of primary and secondary BrC absorption
The absorption of BrC at 370 nm can be classified as primary (babs, primary BrC) and secondary (babs, secondary BrC) using Eq. (6), assuming a negligible contribution of dust.
where babs, BC was the absorption at 880 nm, and is the ratio of primary BrC absorption to BC absorption. Considering , we simplify the Eq. (6) to Eq. (7).
Here was determined by the newly developed minimum R squared (MRS) method (Wu and Yu, 2016) using the mass concentration of BC as a tracer (Wang et al., 2019a). In MRS calculation, the correlation coefficient (R2) between measured eBC and estimated babs, secondary BrC was examined as a function of a series of hypothetical . The with the minimum correlation coefficient (R2) between BC and babs, secondary BrC was assumed to be the most statistically probable , considering the independent variations between BC and babs, secondary BrC. Based on this method, we first determined the monthly with an example of analysis of 3 months in the fall of 2020 (Fig. S2). The babs, secondary BrC was then determined as the difference between the total babs, BrC and babs, primary BrC.
2.4 Estimation of radiative forcing of BC and BrC
We estimated the direct radiative forcing (ΔFR) caused by BC and BrC at the top of atmosphere (TOA) based on forcing equations suggested by a previous study (Chylek and Wong, 1995). The modified wavelength-dependent version of the equation is given below (Chen and Bond, 2010):
where S is the solar irradiance (W m−2), τatm is the atmospheric transmission (unitless), Fc is the fractional cloud amount (unitless), as is the surface reflectance (unitless), β is the backscatter fraction (unitless), and τscat and τabs are the aerosol scattering and absorption optical depths (unitless), respectively. Wavelength-dependent S(λ) and τatm(λ) are derived from the ASTM G173-03 reference spectra (Chen and Bond, 2010). Fc and as are 0.6 and 0.19, respectively, based on previous studies (Bond and Bergstrom, 2006; Wang et al., 2019b). Based on the small differences in mass size distribution of BC in recent years (Wu et al., 2021) and the little effect of BC particle shape on backscatter fraction (C. Liu et al., 2017), we used a constant value of β (0.29) (Charlson et al., 1992; Chylek and Wong, 1995), which could be adapted to the usual size distribution of BC in Beijing (D. Liu et al., 2019, 2020; H. Liu et al., 2020; Wu et al., 2021). Based on the method in a previous study (Wang et al., 2019b), τscat and τabs can be estimated as and , respectively, where bsca(λ) and babs(λ) are scattering and absorption coefficients, respectively, and Heff is the effective height. The effective heights can be derived from the relationship between aerosol optical depth τ (, available from the Aerosol Robotic Network data archive) and light extinction coefficient by CAPS. The detail results of Heff in four seasons are shown in Table S2. In addition, the uncertainties of BC and BrC ΔFR were also estimated (see Supplement for details).
3.1 Temporal variations of eBC
Figure 1a shows the annual variations of eBC, ΔeBC ΔCO, and eBC PM2.5 during 2012–2020. The annual mean (±1σ) concentration of eBC was 6.25 ± 5.73 µg m−3 in 2012 (from August in 2012 to May in 2013), and it decreased by 71 % (1.80 ± 1.54) in 2020. The Mann–Kendall trend test supported that the decrease in eBC from 2012 to 2020 was significant (Table S1). The annual mean concentration in 2020 was similar to that in Milan (Mousavi et al., 2019), lower than that in Xiamen (Deng et al., 2020), Shanghai (Wei et al., 2020), and Hefei (Zhang et al., 2015), yet higher than that in Nanjing (Jing et al., 2019) and New York City (Rattigan et al., 2013). A significant reduction in CO by 56 % from 2012 to 2020 (Fig. S3) also indicated that primary emissions from incomplete combustion reduced significantly during the past decade. Considering that different primary sources showed different emissions of BC and CO (Derwent et al., 2001; Spackman et al., 2008), we calculated ΔeBC ΔCO as the ratio of (eBC–eBC0) and (CO–CO0), which was widely used to identify the variations of BC sources (Kondo et al., 2006; Subramanian et al., 2010; D. Liu et al., 2020). The background concentration of CO (CO0) was determined as the average of 1.25 percentile in each year, and that of eBC (eBC0) was assumed to be zero, considering the negligible natural sources of BC in the clean background except biomass burning and wild fires (Han et al., 2009; Pan et al., 2011) and the short lifetime in the atmosphere (Bond et al., 2013). As shown in Fig. 1a, the annual mean values of ΔeBC ΔCO and eBC PM2.5 presented similarly decreasing trends, indicating a significant change in the structure of primary emission sources. Figure 2 presents the monthly variations of eBC, ΔeBC ΔCO, and eBC PM2.5. The eBC showed consistently seasonal patterns across different years, with wintertime eBC almost twice that in summer, mainly due to largely enhanced coal combustion emissions in the heating season (Sun et al., 2018), consistent with the higher eBC PM2.5 in wintertime. ΔeBC ΔCO presented pronounced seasonal variations. The highest values up to 12.0 ng m−3 ppbv−1 occurred in spring and fall, likely due to the influences of biomass burning emissions (Streets et al., 2003; Spackman et al., 2008; Han et al., 2009; Westerdahl et al., 2009; Pan et al., 2011). However, the monthly average ΔeBC ΔCO became relatively constant after 2018, suggesting that the primary emission sources of eBC and CO were relatively stable after the 5-year Clean Air Action Plan (2013–2017) in Beijing (Spackman et al., 2008).
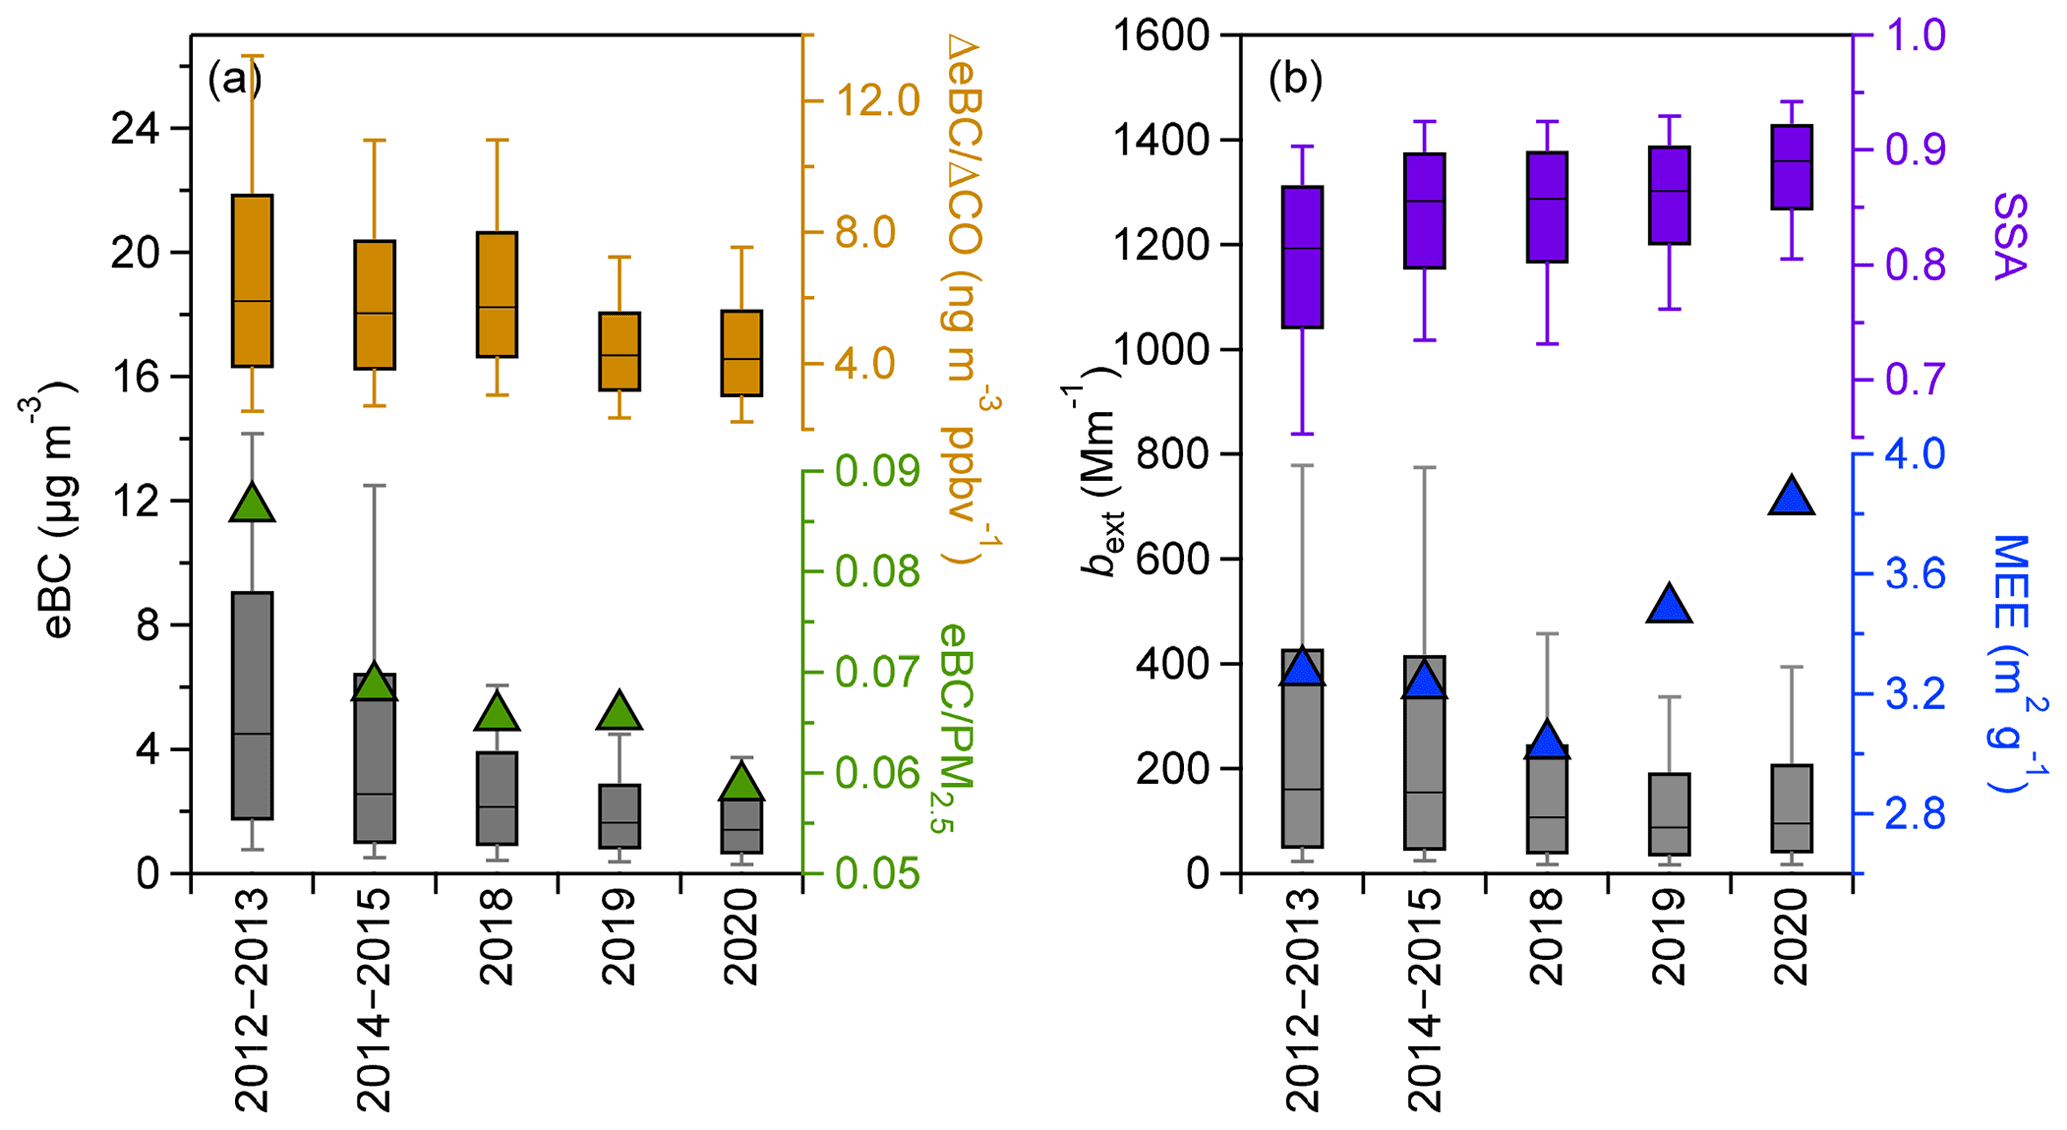
Figure 1Annual variations of (a) eBC, ΔeBC ΔCO, and eBC PM2.5 and (b) bext, SSA, and MEE. The median (horizontal line), mean (markers), 25th and 75th percentiles (lower and upper box), and 10th and 90th percentiles (lower and upper whiskers) are also shown.
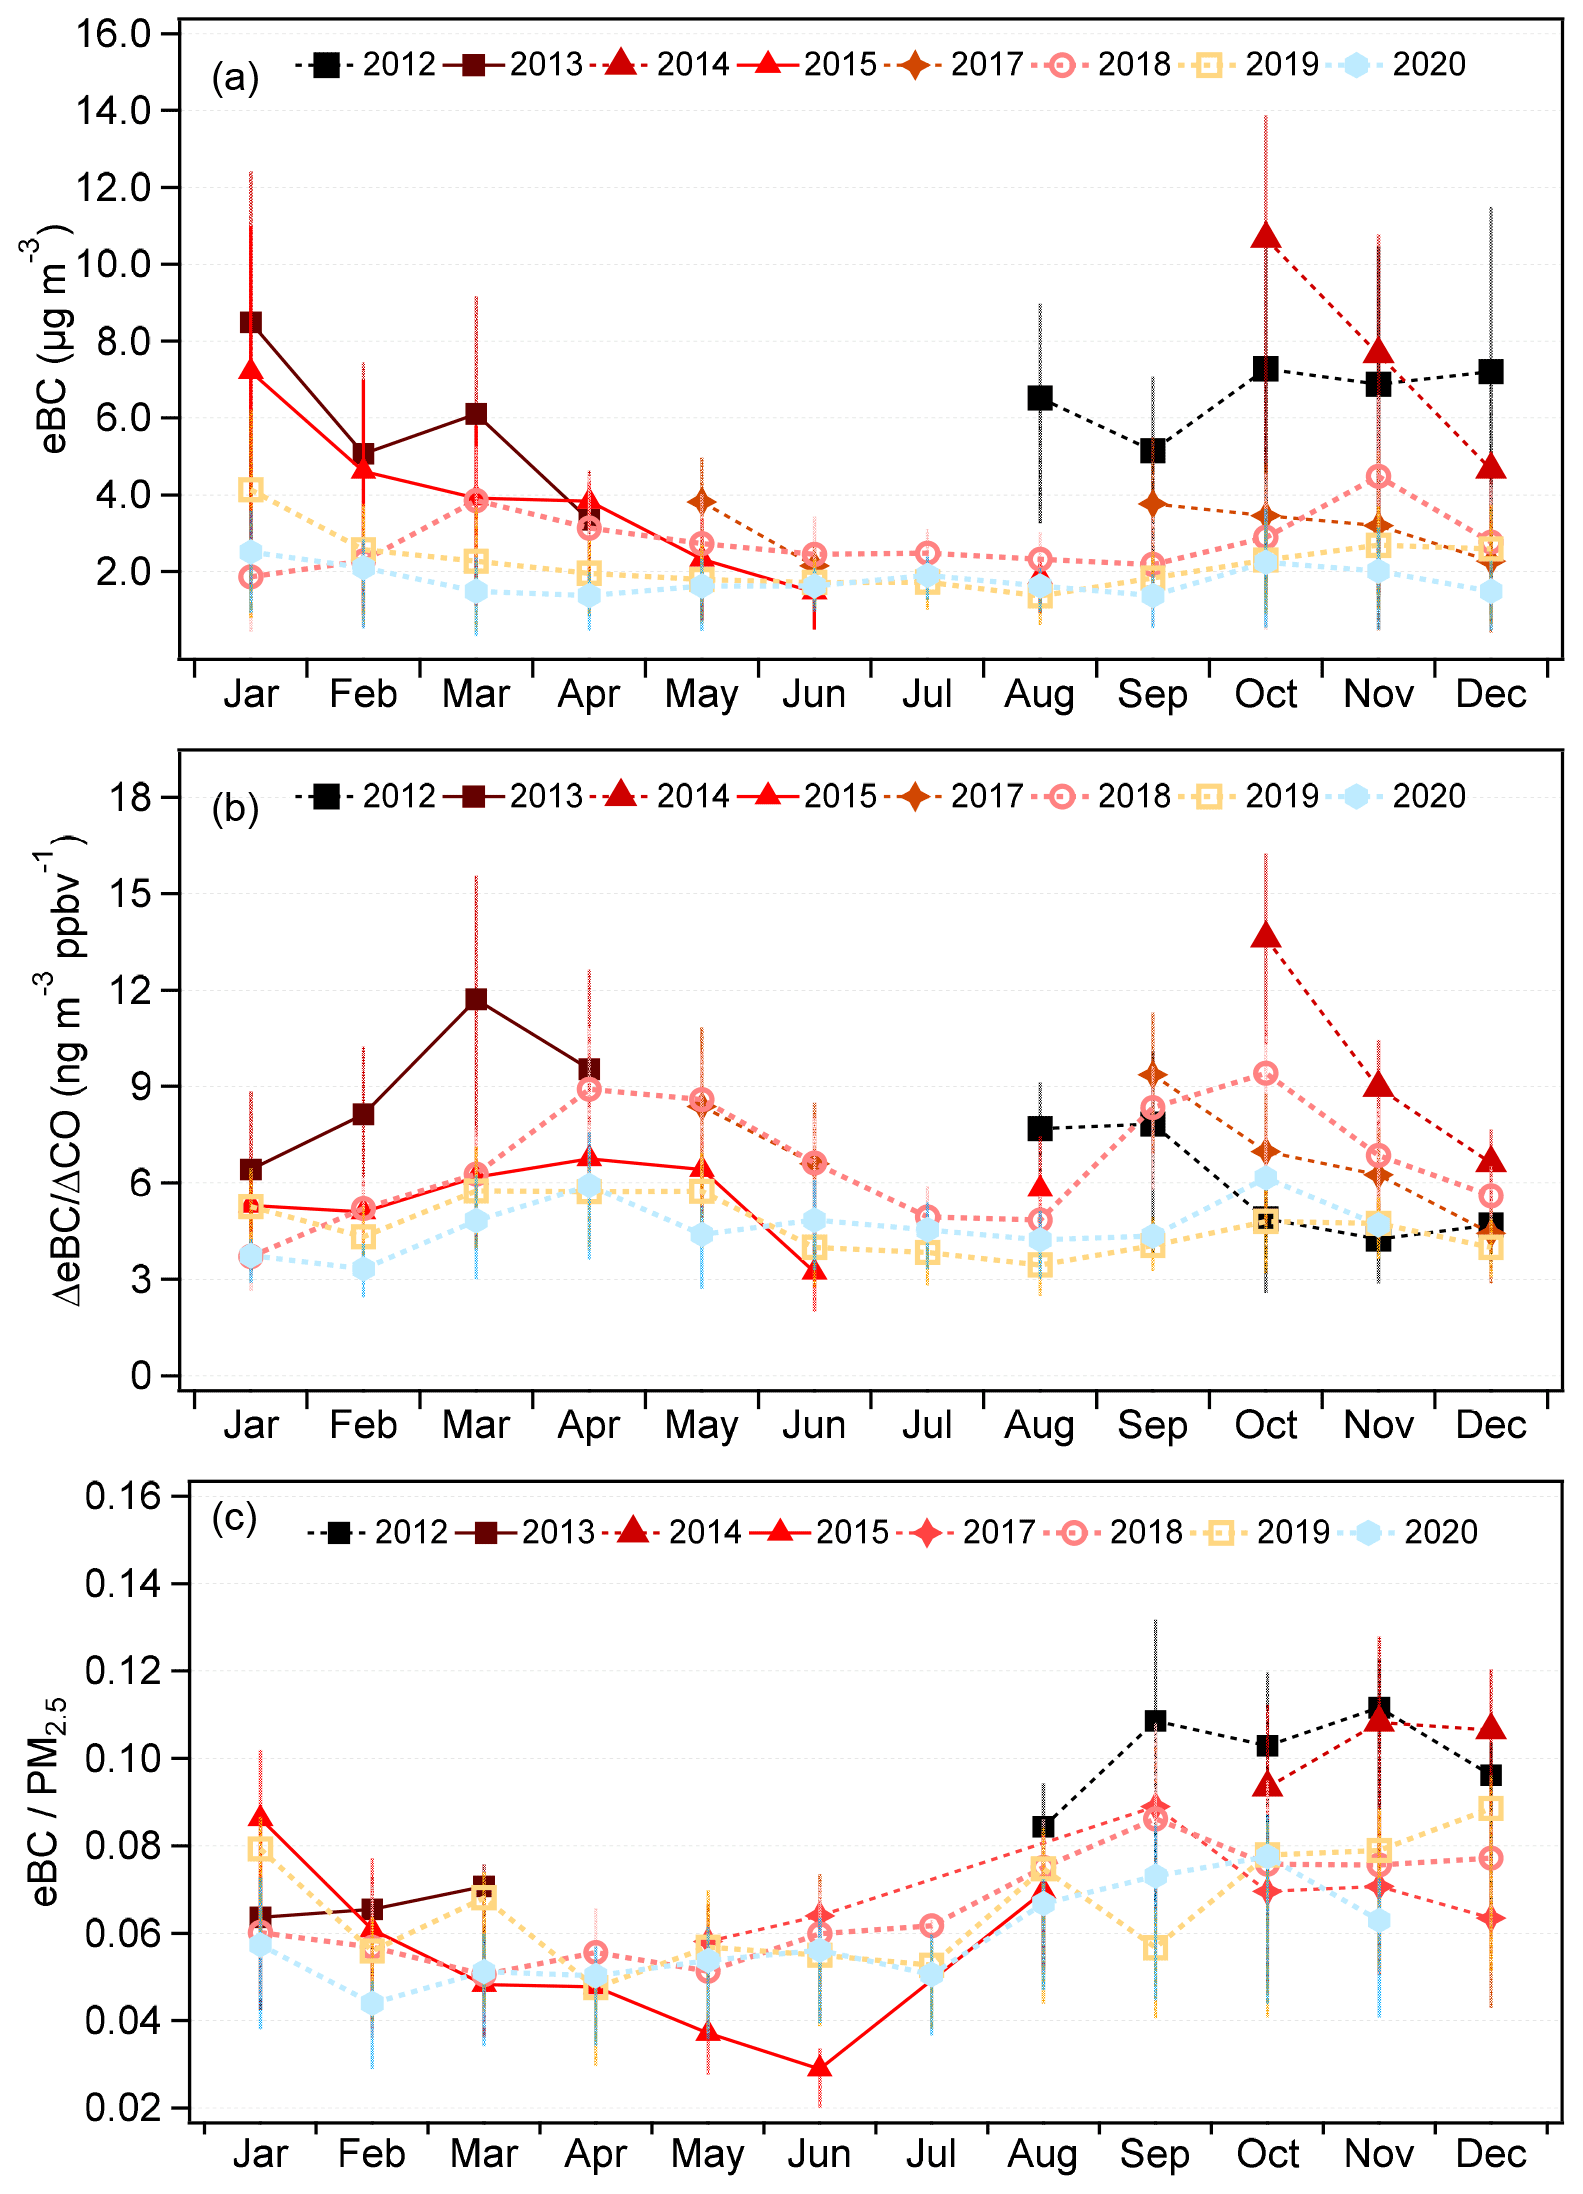
Figure 2Monthly variations in (a) eBC, (b) ΔeBC ΔCO, and (c) eBC PM2.5. The mean (markers) and 25th and 75th percentiles (sticks) are also shown.
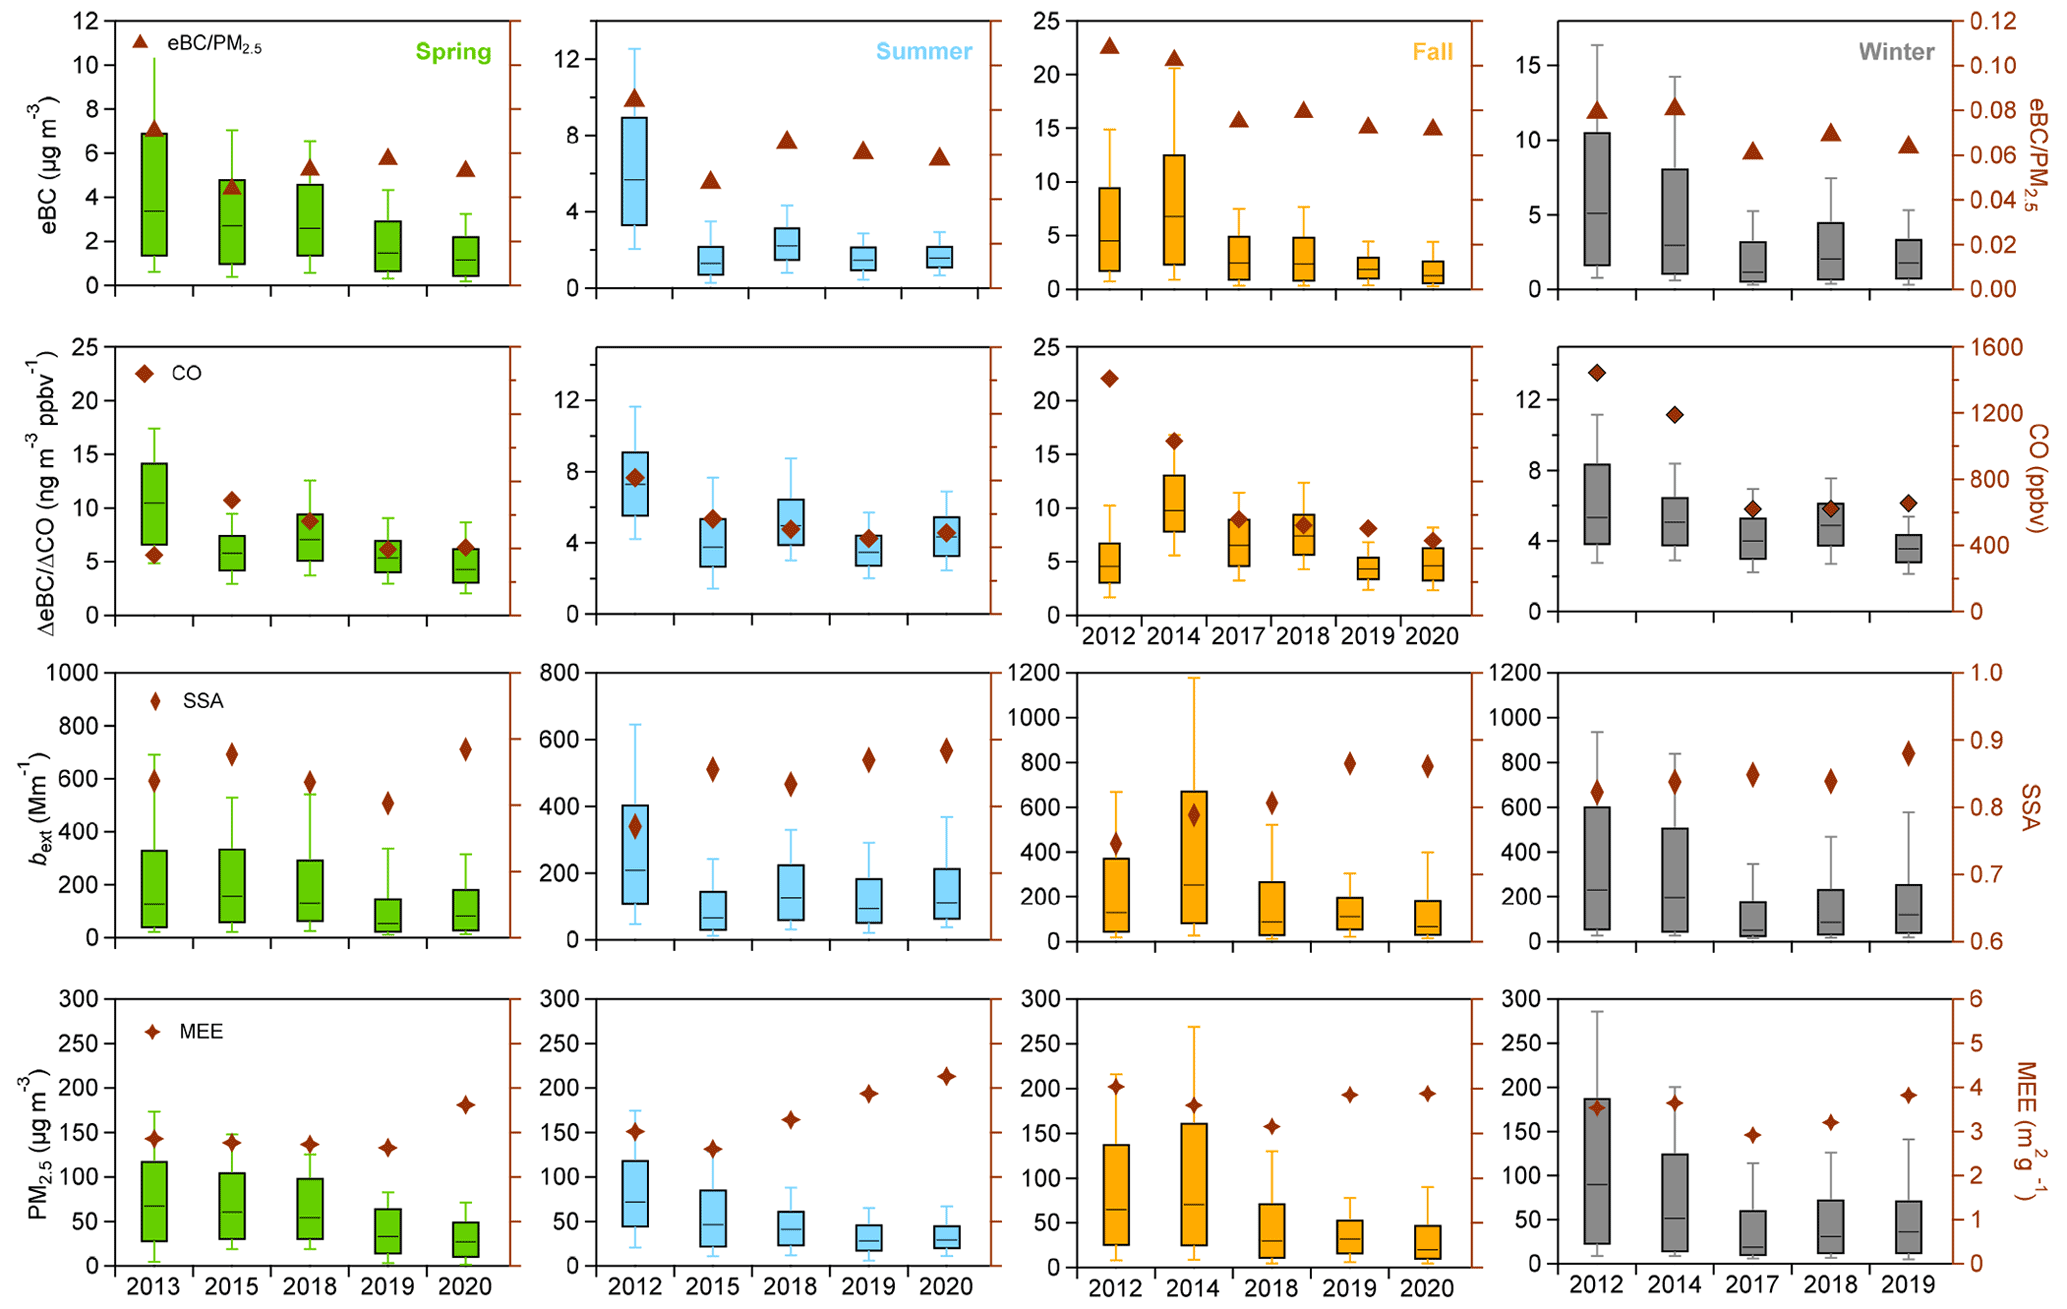
As illustrated in Fig. 3, the mass concentrations of eBC were ubiquitously decreased during all seasons in 2020 compared to 2012. In particular, the mass concentration of eBC decreased by more than 63 % and 44 % from 2014 to 2017 in fall and winter, respectively, and even up to 75 % in summer from 2012 to 2015, and the ΔeBC ΔCO changed differently in different seasons. These results indicate a significant response of black carbon aerosol to the “Atmospheric Pollution Prevention and Control Action Plan”. Although a temporary increase in eBC and ΔeBC ΔCO (Figs. 3 and S4) in 2018 suggested a change of primary emissions or meteorological influences, the implementation of the “Three-Year Action Plan for Blue Sky Defense” from 2018 to 2021 (http://www.gov.cn/zhengce/content/2018-07/03/content_5303158.htm, last access: 28 July 2021) still resulted in a further decrease in eBC and then remained relatively stable at lower levels during 2019–2020. Considering the entire 9-year period, the largest decrease in eBC was observed in fall (78 %) from 2014 to 2020, with ΔeBC ΔCO and eBC PM2.5 decreasing 53 % and 3 %, respectively. The eBC in spring decreased by 68 % from 2013 to 2020, with a similarly significant decrement in ΔeBC ΔCO. The average ΔeBC ΔCO decreased from over 10 to below 5 in spring and fall, which suggested that the decrease of BC was mainly due to the reduced biomass burning emissions in the past 8 years (Streets et al., 2003; Spackman et al., 2008; Han et al., 2009; Westerdahl et al., 2009; Pan et al., 2011). Different from the fall, when BC emissions reduced more than other scattering pollutants, the value of eBC PM2.5 was relatively stable in spring. In comparison, the eBC and ΔeBC ΔCO in summer were lower than those in other seasons except 2012, and they did not change substantially in recent years. This is likely due to relatively stable sources in summer, i.e., vehicle exhausts. Although eBC decreased by more than 60 % in winter from 2012 to 2019, the different source contributions to BC were relatively constant in winter over 8 years, as indicated by flat ΔeBC ΔCO (4–6 ng m−3 ppbv−1, representing typical coal combustion emission in winter; Wang et al., 2015). One explanation is that coal combustion and biomass burning emissions in winter were reduced similarly in Beijing due to the promotion of clean fuels. Overall, the decreases in eBC during the last 8 years in Beijing were mainly due to the changes in spring, fall, and winter, and the reasons for the changes were different between winter and the other two seasons. In addition, more attention should be paid to the BC reduction in winter in the future based on the analysis of the four seasons.
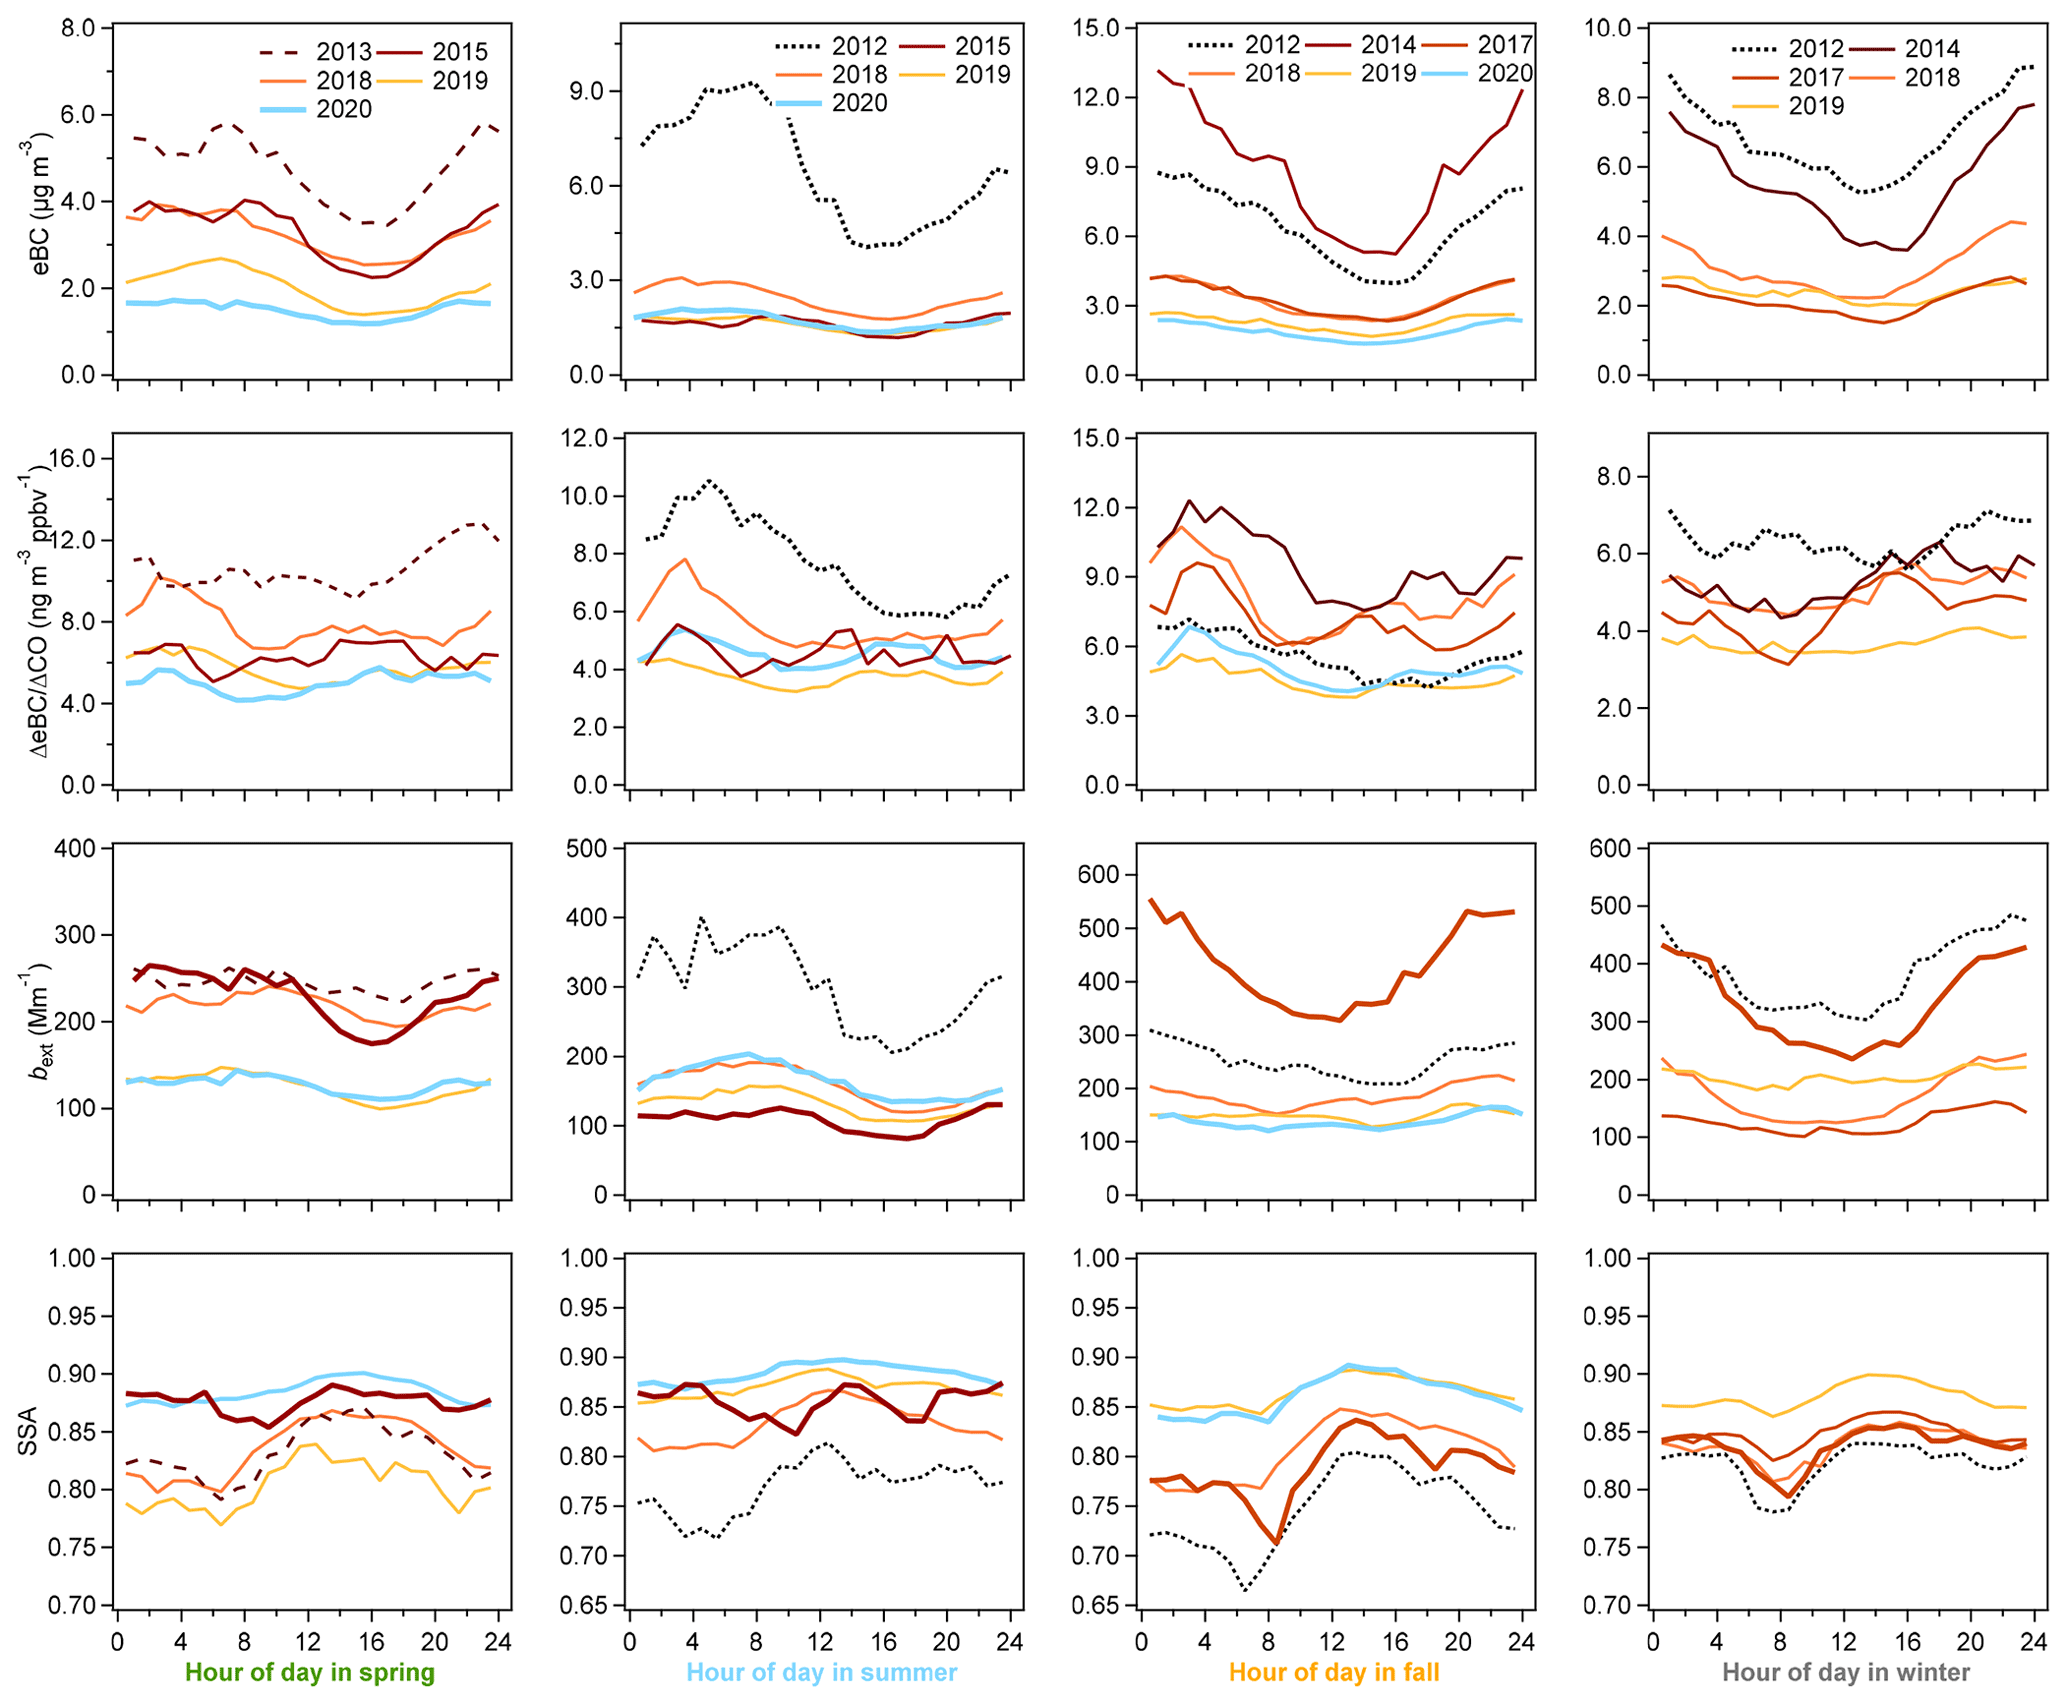
Figure 4Diurnal variations of eBC, ΔeBC ΔCO, bext, and SSA for spring, summer, fall, and winter in different years.
Before 2015, the diurnal variation of eBC (Fig. 4) showed clear peaks at morning rush hours during four seasons. After implementing the “China 5” standard nationally and eliminating 5 million old vehicles in China (Zhang et al., 2019), the morning peaks of eBC disappeared. Still, the eBC presented pronounced diurnal variations during all seasons, with the lowest mass concentrations in the afternoon due to high mixing layer height (MLH) and low emissions (Xie et al., 2019). Because of the deeper development of boundary layer in spring and summer, the lowest eBC values occurred during 15:00–17:00 which was later than those in fall and winter. Comparatively, a ubiquitously higher concentration of eBC in the early morning resulted from a synergetic effect of shallow boundary layer and high emissions from heavy-duty vehicles and diesel trucks that are only allowed to enter the city between 23:00 and 06:00. Consistently, the diurnal cycle of ΔeBC ΔCO presented the highest value at 02:00–06:00 before 2019 due to the difference in vehicle emissions throughout the day. For example, previous studies found that CO is emitted primarily from gasoline vehicles which showed a low ΔeBC ΔCO of about 3 ng m−3 ppbv−1, while BC is dominantly emitted from diesel trucks and heavy-duty vehicles (Kondo et al., 2006; Han et al., 2009). We also found that the decreases in ΔeBC ΔCO and eBC from 2013 to 2019 were more significant at night, highlighting that the reductions in diesel truck and heavy-duty vehicle emissions at night contributed significantly to the decreases of BC in Beijing. Differently, the diurnal cycle of ΔeBC ΔCO in winter was less pronounced than other seasons (Fig. 4), indicating that the source of BC was relatively stable during the heating period although the mass concentration decreased. Particularly, we found that the diurnal variations of both ΔeBC ΔCO and eBC in 2019 and 2020 were less pronounced during the four seasons. One explanation was the significantly reduced primary emissions, e.g., vehicle emissions, due to the influences of COVID-19.
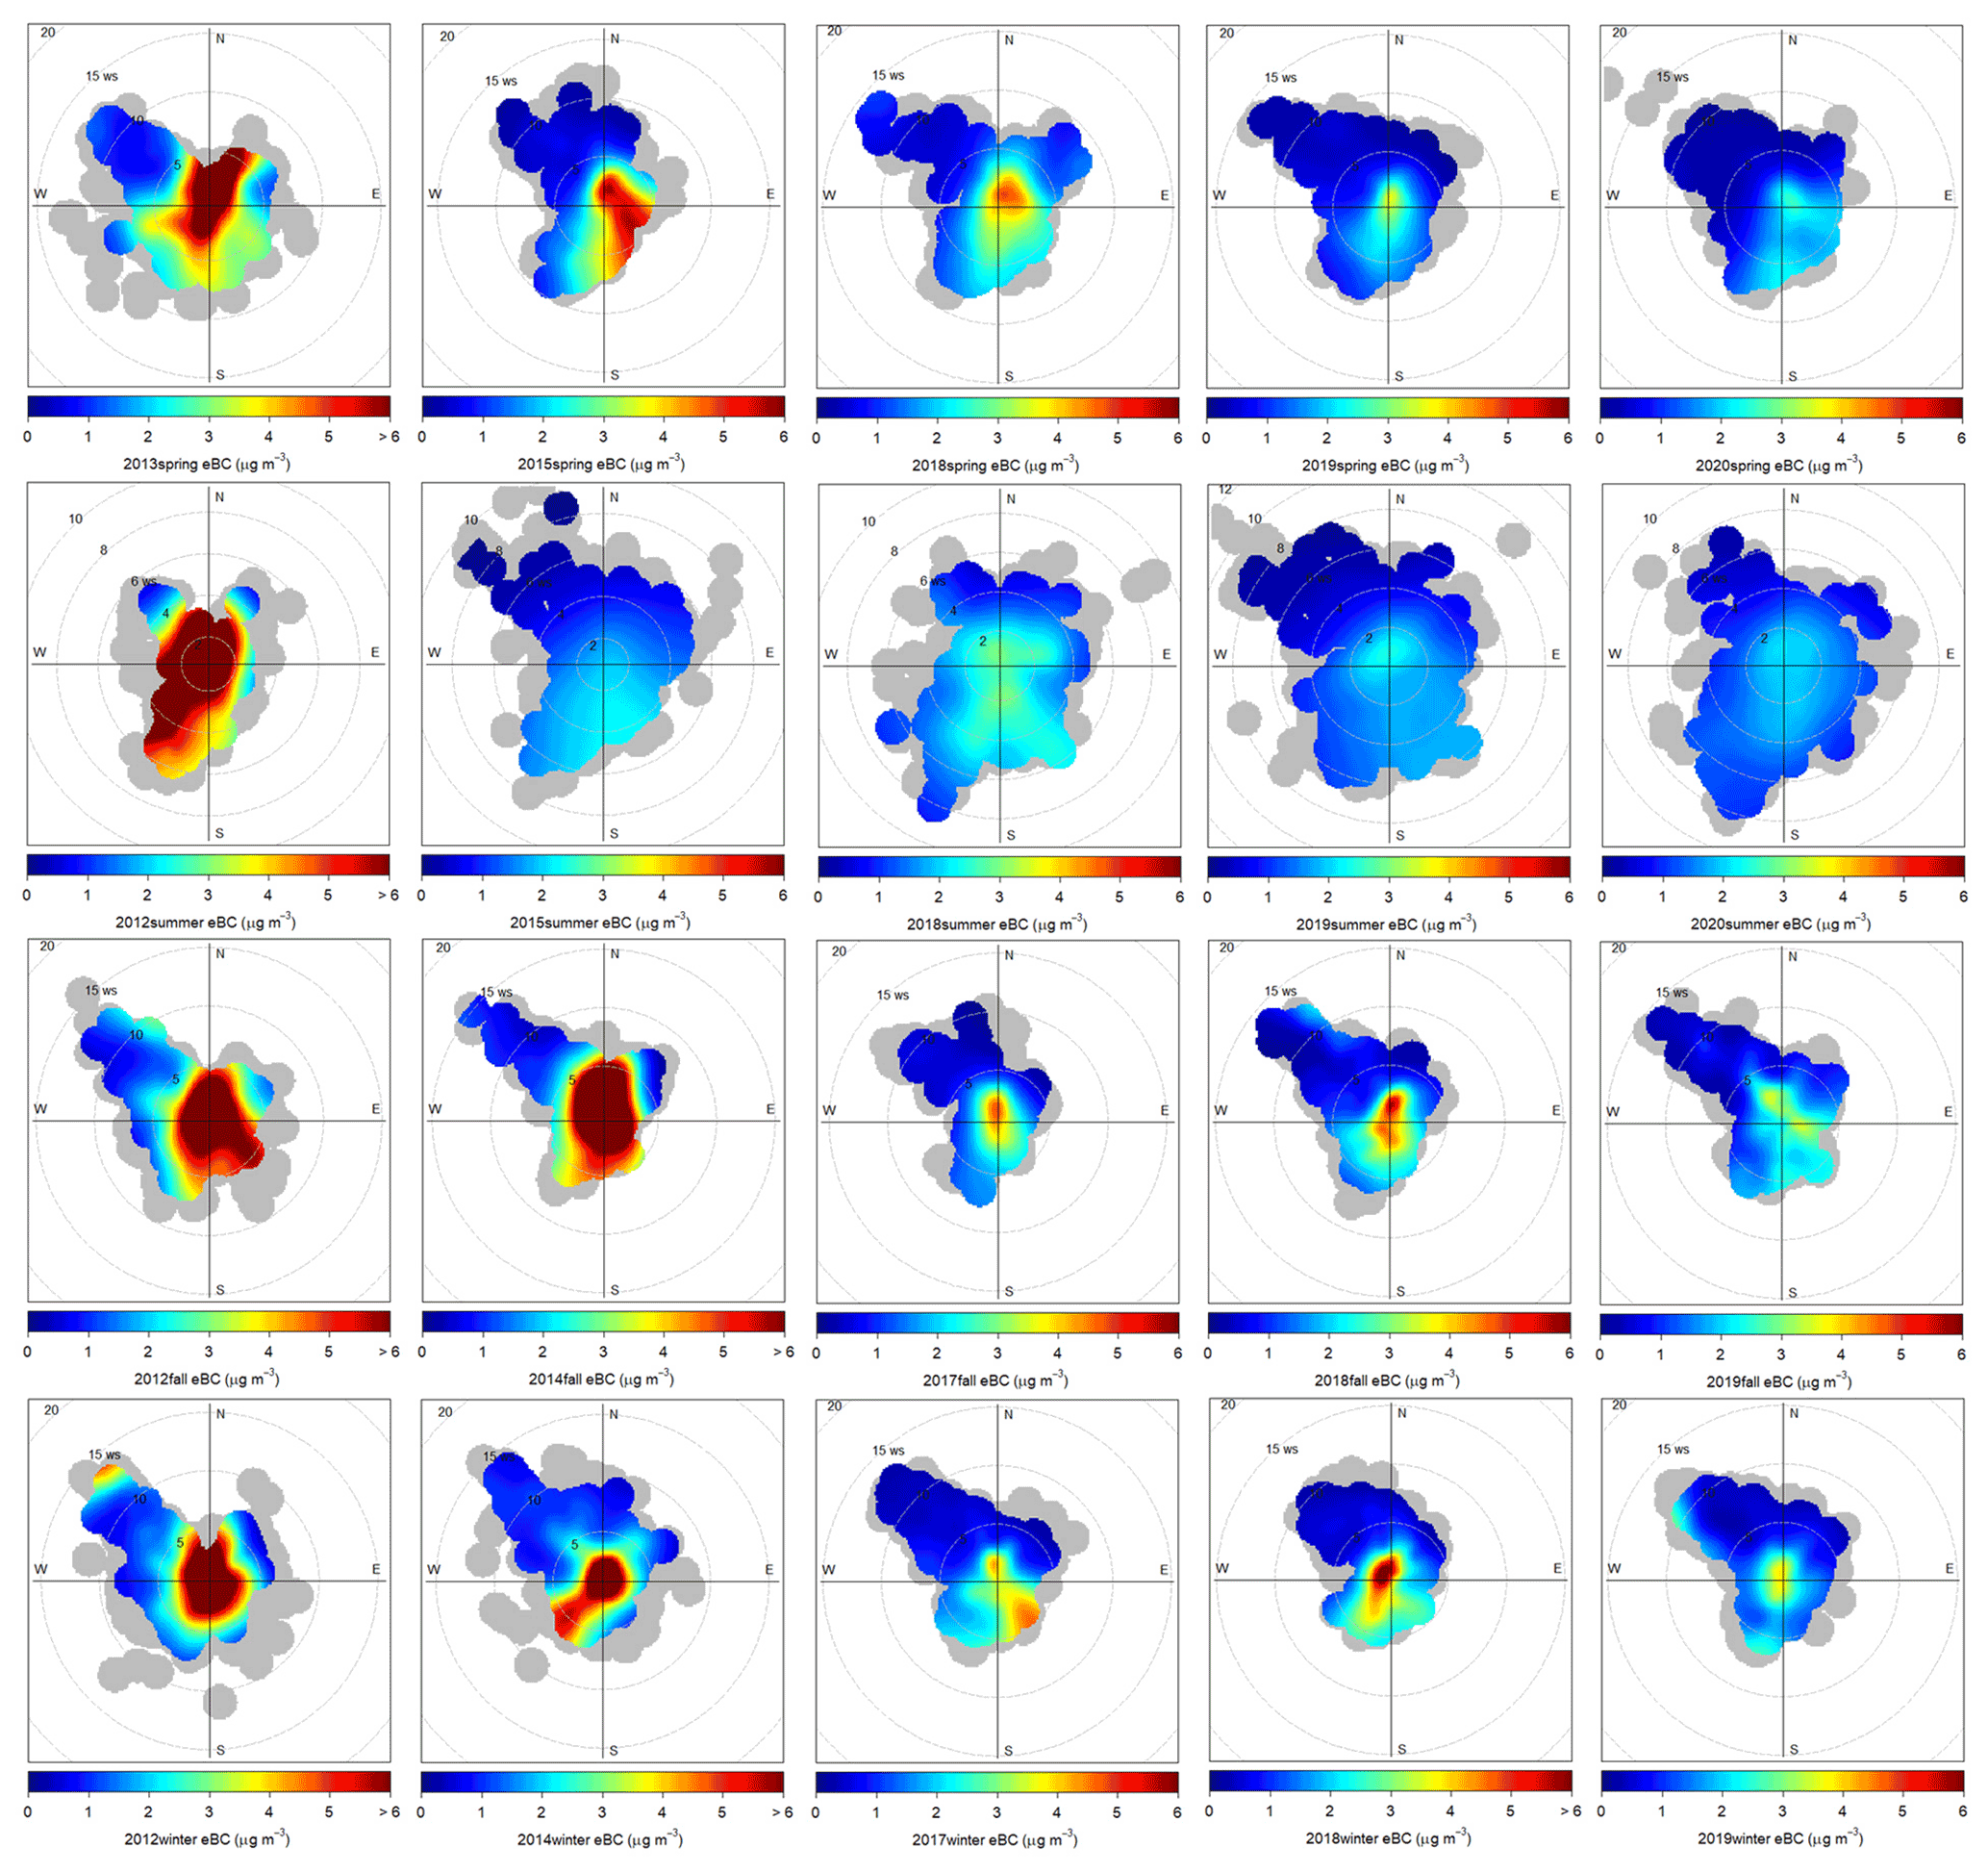
Figure 5Bivariate polar plots for hourly eBC mass concentration in the four seasons over 9 years.
Figure 5 shows the bivariate polar plots of eBC during four seasons, and Fig. S5 illustrates the distribution of cities and towns around Beijing. In general, higher concentrations of eBC occurred in regions with low WS (< 2 m s−1), while lower concentrations often occurred in regions with high WS from the northwest during all seasons. In summer, the eBC presented a similar distribution, with high concentrations in the middle and the regions to the south and southeast, except in 2012, suggesting important contributions from both local emissions and regional transport. Different from summer, high concentrations of eBC occurred dominantly in a small region close to the sampling site during the other three seasons, suggesting the dominant source contributions from local emissions. However, the regional transport from the south and southeast was also found to play an important role, e.g., in spring 2015 and 2020 and winter 2017. It is interesting to note that the eBC from the southwest with low WS decreased significantly over 8 years in fall, while it still exceeded 3 µg m−3 from the southeast in the fall of 2019. These results indicate that the source regions of eBC can be substantially different in different years depending on meteorology. By comparison with the seasonal variation of ΔeBC ΔCO, we inferred that biomass burning emissions from the southwest and regional transport from the southeast are two important non-local sources of eBC in Beijing. Therefore, the synergistic control of source emissions in Beijing and surrounding regions would greatly benefit the reductions in eBC in Beijing.
3.2 Temporal variations of aerosol optical properties
Figure 1b presents the annual variations of bext, SSA, and MEE. The annual mean (±1σ) of bext decreased by 47 % from 2012 to 2020, while that of SSA increased from 0.79 ± 0.11 to 0.88 ± 0.06. Such an increase in SSA could shift the radiative forcing from positive to negative (Hansen et al., 1997; Lee et al., 2007). MEE is also a key factor reflecting the responses of atmospheric light properties to aerosol composition changes. In particular, the annual mean MEE and SSA increased despite the decreases in eBC and bext and the relatively minor variations in particle size distributions (Fig. S6) in the past decade, which indicated that scattering aerosol species played more important roles than absorbing aerosol species in radiative forcing. The increased MEE is consistent with the findings of previous studies showing increased contributions of high scattering ammonium nitrate in fine particles (Huang et al., 2013; Lei et al., 2020). The seasonal variations of SSA and MEE showed generally higher values in winter and lower values in summer (Fig. S7).
Figure 3 shows an increasing trend in the seasonal average SSA during all seasons, indicating a more effective control of absorbing aerosol (i.e., eBC) than scattering components during the last decade. This is consistent with recent studies showing larger reductions in primary aerosol species than secondary species in response to emission controls (Y. Sun et al., 2020). The most significant increase of SSA was observed in fall from 0.75 ± 0.12 to 0.87 ± 0.07 during 2012–2020, followed by summer from 0.77 ± 0.12 in 2012 to 0.88 ± 0.06 in 2020. While the increase of SSA in fall was mainly due to the changes in aerosol chemical composition such as the decrease in BC, the increase of SSA in summer was also likely affected by the increase in aerosol particle sizes. These results were supported by the similar particle size distributions (mode ∼ 200 nm) in fall, while a clear increase in the mode was observed during summer from 2013 to 2018 (Fig. S8). Note that the particle size in summer 2019 was smaller than that in 2018, yet the seasonal mean SSA was higher in 2019, suggesting that the changes in aerosol chemical components contributed significantly to the increased SSA. The highest seasonal average SSA (0.88 ± 0.06) was observed in summer 2020, which was close to that during the COVID-19 outbreak in spring 2020, yet was much higher than 0.82 ± 0.05, observed in the North China Plain in 2009 (Ma et al., 2011). We also noticed that the increase in SSA was becoming smaller over the past 8 years, indicating that the light absorbing and scattering components were becoming relatively stable with the progress of the Clean Air Action Plan. Figure 3 also shows the seasonal average of bext and MEE over the past 9 years. The MEE increased mostly by more than 43 % in summer from 2012 to 2020, although bext decreased ubiquitously during all seasons and most notably in the fall from 432 Mm−1 in 2014 to less than 140 Mm−1 in 2020 (∼ 68 %). Comparatively, bext was relatively stable at 230 Mm−1 in spring before 2019 and decreased substantially by 40 % in 2019 due to significant reductions in fine particles. Although bext was comparable in springs of 2019 and 2020, SSA was increased by 8 %. These results suggest that scattering aerosol played an important role in changing aerosol optical properties. For example, higher SSA in spring 2020 resulted from larger reductions in primary emissions e.g., absorbing eBC, than scattering secondary aerosol due to the decreases in anthropogenic emissions during the COVID-19 lockdown (Li et al., 2022). The increase of MEE from 2.6 m2 g−1 in 2019 to 3.6 m2 g−1 in 2020 also suggested a significant change in scattering aerosols, such as an increase in nitrate contribution (Lei et al., 2020). Compared with spring, bext decreased by 60 % in summer from 2012 to 2015 and then gradually increased afterwards. Similarly, bext also showed a sharp decrease of 60 % in winter from 2014 to 2017, and after that it continuously increased to > 200 Mm−1 in 2019. Considering the increased SSA and particle size (Fig. S8) yet relatively constant mass concentrations of eBC during 2017–2019, we inferred that the increased light extinction in winter was mainly caused by scattering aerosols that can vary substantially in different years due to the changes in meteorological conditions (Zhou et al., 2019). Overall, the results in this study clearly demonstrate the responses of aerosol optical properties to the changes in aerosol composition and particle size distribution since the Clean Air Action Plan was implemented in 2013.
The diurnal cycles of bext and SSA in four seasons are shown in Fig. 4. Because the diurnal variations of particle size distributions are not available in this study, our discussions are mainly focused on the influences of chemical components. The pronounced diurnal variations of SSA were characterized by afternoon peaks in all seasons, consistent with the measurements at 260 m in Beijing (Xie et al., 2019). Before 2015, SSA presented an obvious valley during 07:00–09:00, mainly due to the increased BC concentrations and contributions, and the valley was much smaller after 2015 due to the improvement of vehicle emission standards and the reduction in vehicle emission. After the early morning, SSA presented the highest values during 12:00–13:00. The major reason is the reduced eBC emission during daytime and enhanced photochemical production of secondary scattering aerosols (Han et al., 2017).
Over the 9 years, the diurnal variation of bext was characterized by higher values at night and lower values in daytime during all seasons. One of the major factors driving the diurnal variations is the evolution of boundary layer height (Han et al., 2015, 2017; Xie et al., 2019). As a response, bext reached the minimum at 12:00–14:00 in fall and winter, whereas the minimum occurred during 16:00–18:00 in spring and summer due to a deeper vertical convection in late afternoon. In fall, the bext decreased, while SSA increased at nighttime from 2012 to 2019, indicating that the reduction of BC at night had a significant impact on the decrease of bext. Note that bext increased by more than 62 % in winter from 2017 to 2019 as discussed above; yet the reason causing the increased bext was different according to the diurnal variations. For example, the diurnal variations of bext in winters of 2017 and 2018 suggested that the increased bext was mainly due to simultaneously enhanced absorbing and scattering aerosols at night, consistent with relatively similar diurnal patterns of SSA in the two winters. However, the relative consistency of bext values from 20:00 to 04:00 in 2018 and 2019 indicated that the increase in seasonal average of bext from 2018 to 2019 was mainly due to the increase in scattering aerosols during daytime when the eBC mass concentration was relatively stable. Overall, the reduced eBC and increased scattering aerosols together resulted in the increase in seasonal average of SSA by more than 4 % from 2018 to 2019.
3.3 Temporal variations of light absorption of BrC
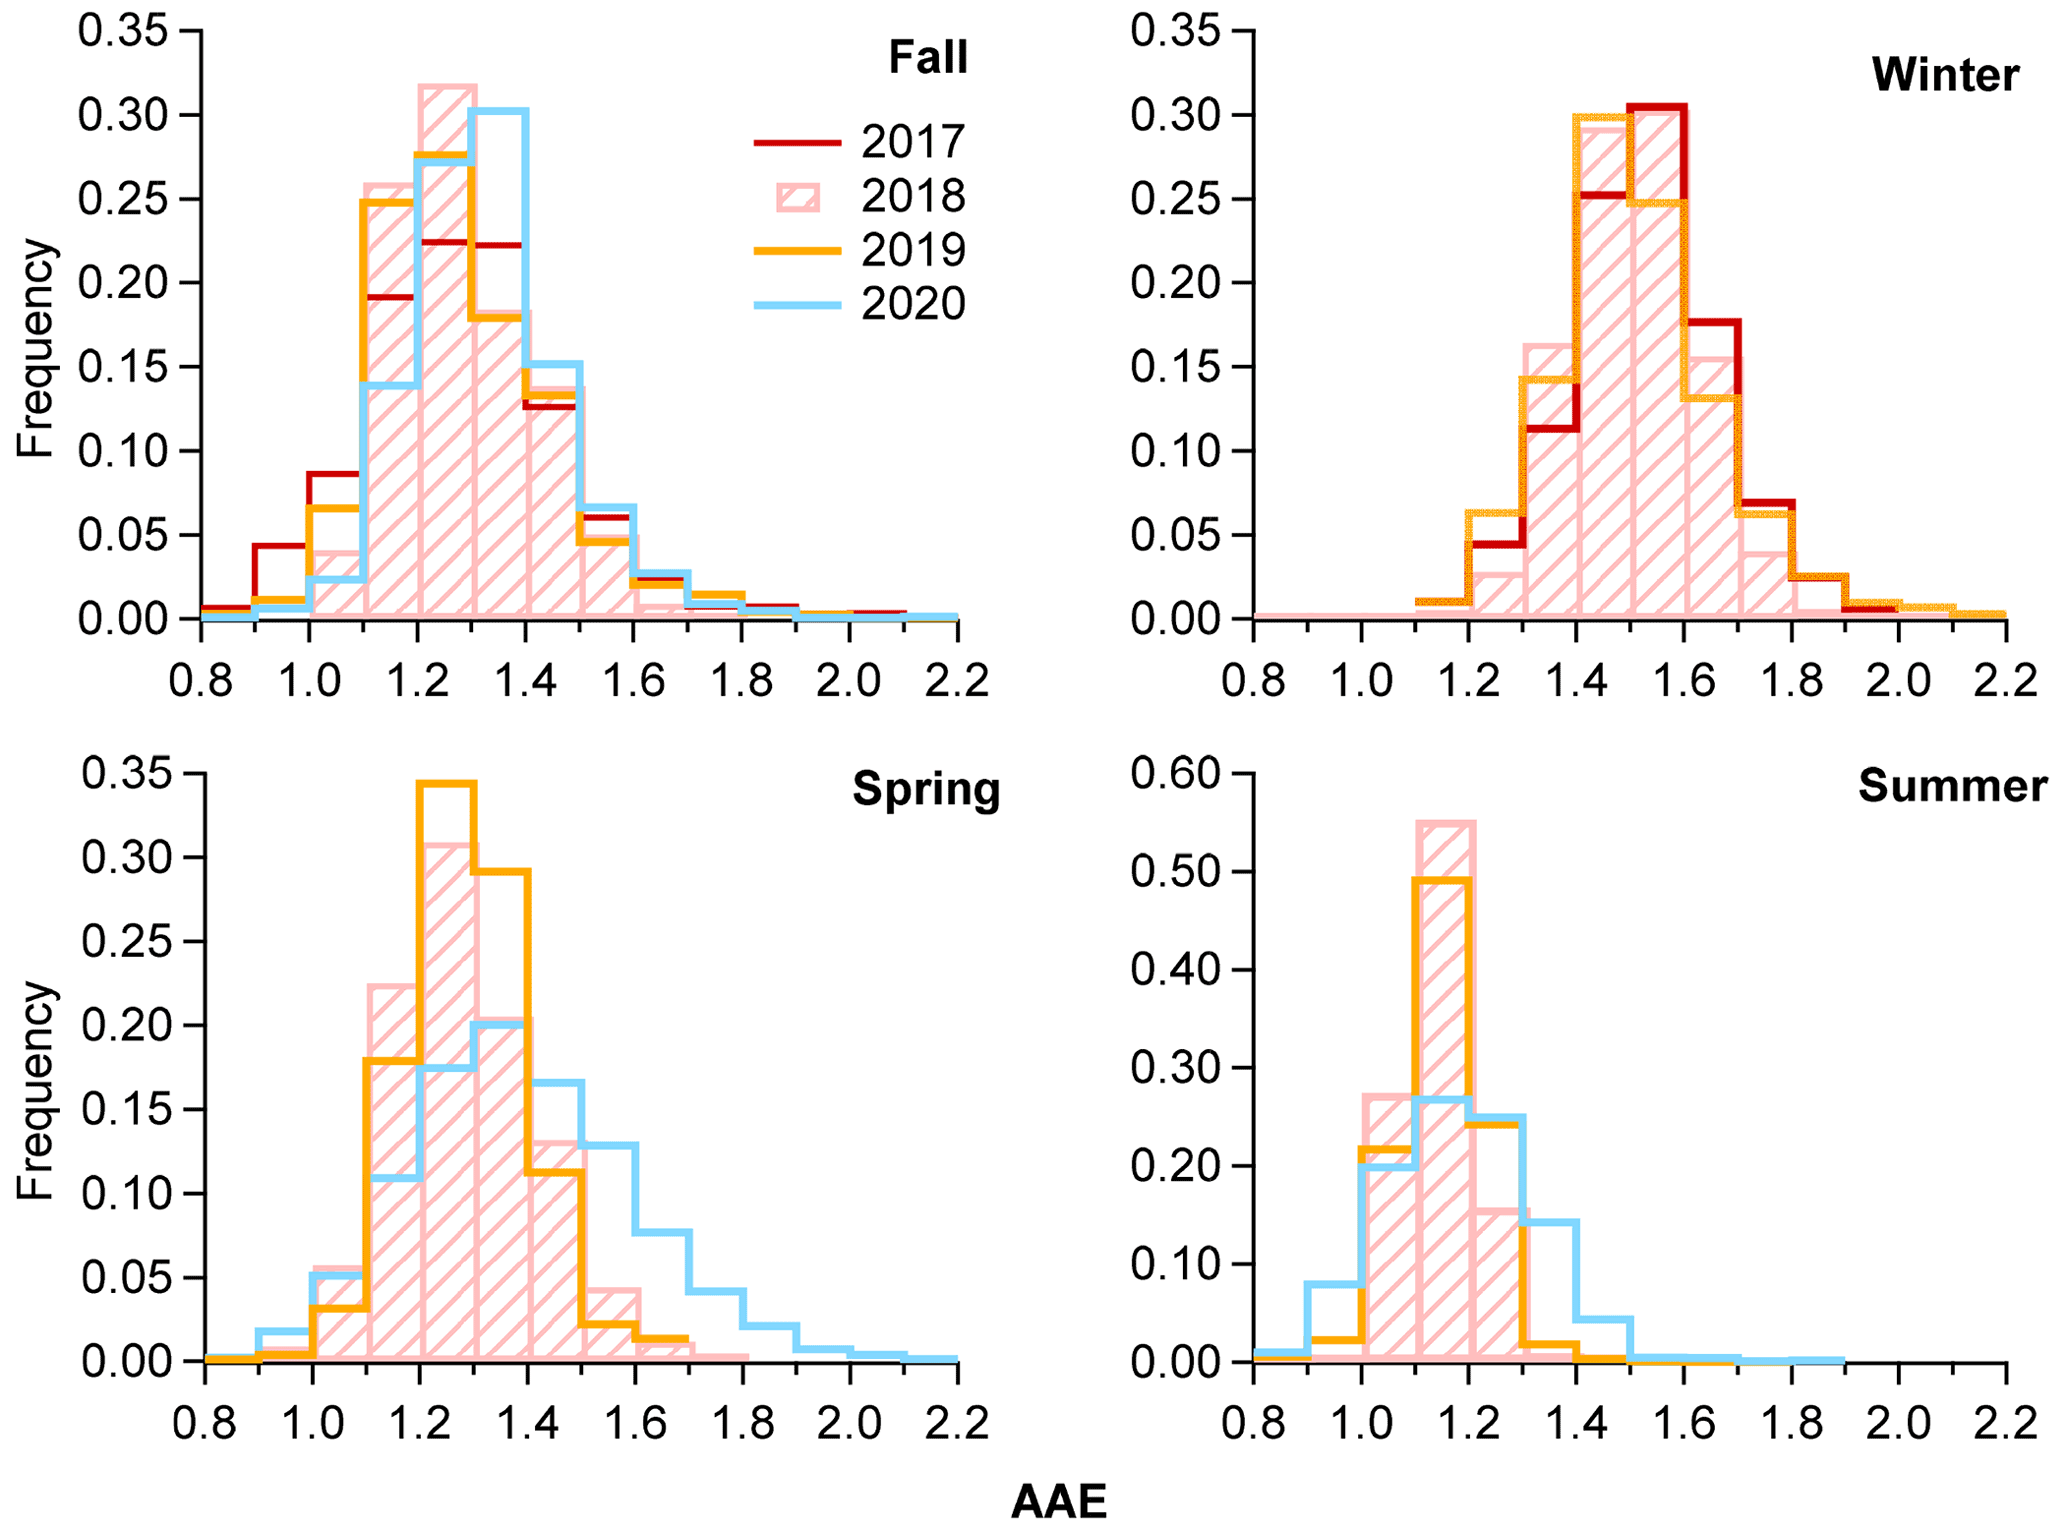
Figure 6a shows the seasonal variations of BrC absorption and AAE during 2017–2020. The seasonal average of BrC absorption was the highest during winter, which was approximately twice that in spring and fall and 5 times higher than that in summer. Consistent with the seasonal variations of eBC, the absorption of BrC in 2018 was generally higher than other years, mainly due to the increased biomass burning emissions. The lowest AAE ubiquitously occurred in summer, while the highest value up to 1.5 occurred in winter. Despite the stronger absorption in fall than spring in 2018 and 2019, the AAE was similar, indicating similar emission sources of BrC in the two seasons (Ran et al., 2016). Note that AAE was up to 1.39 in 2020 and showed a higher frequency at AAE > 1.3 in spring (Fig. 7), suggesting that the emissions with high combustion efficiency (e.g., traffic) decreased much more than the low-efficiency sources (e.g., biomass burning) during the COVID-19 lockdown in Beijing. As illustrated in Fig. 7, the distribution of AAE in summer was mainly concentrated in the range of 1.0–1.3 due to the lower source emissions BrC than other seasons, particularly primary coal combustion and biomass burning emissions. However, we found a change in AAE distribution in summer 2020, which was characterized by a higher frequency at AAE > 1.3, suggesting a stronger BrC absorption. Further analysis showed that such a change was mainly due to the enhanced contribution from secondary BrC. Compared with summer, the AAE distribution was relatively stable in fall and winter, and the distribution range of ∼ 1.2–1.9 in winter was overall higher than that in other seasons
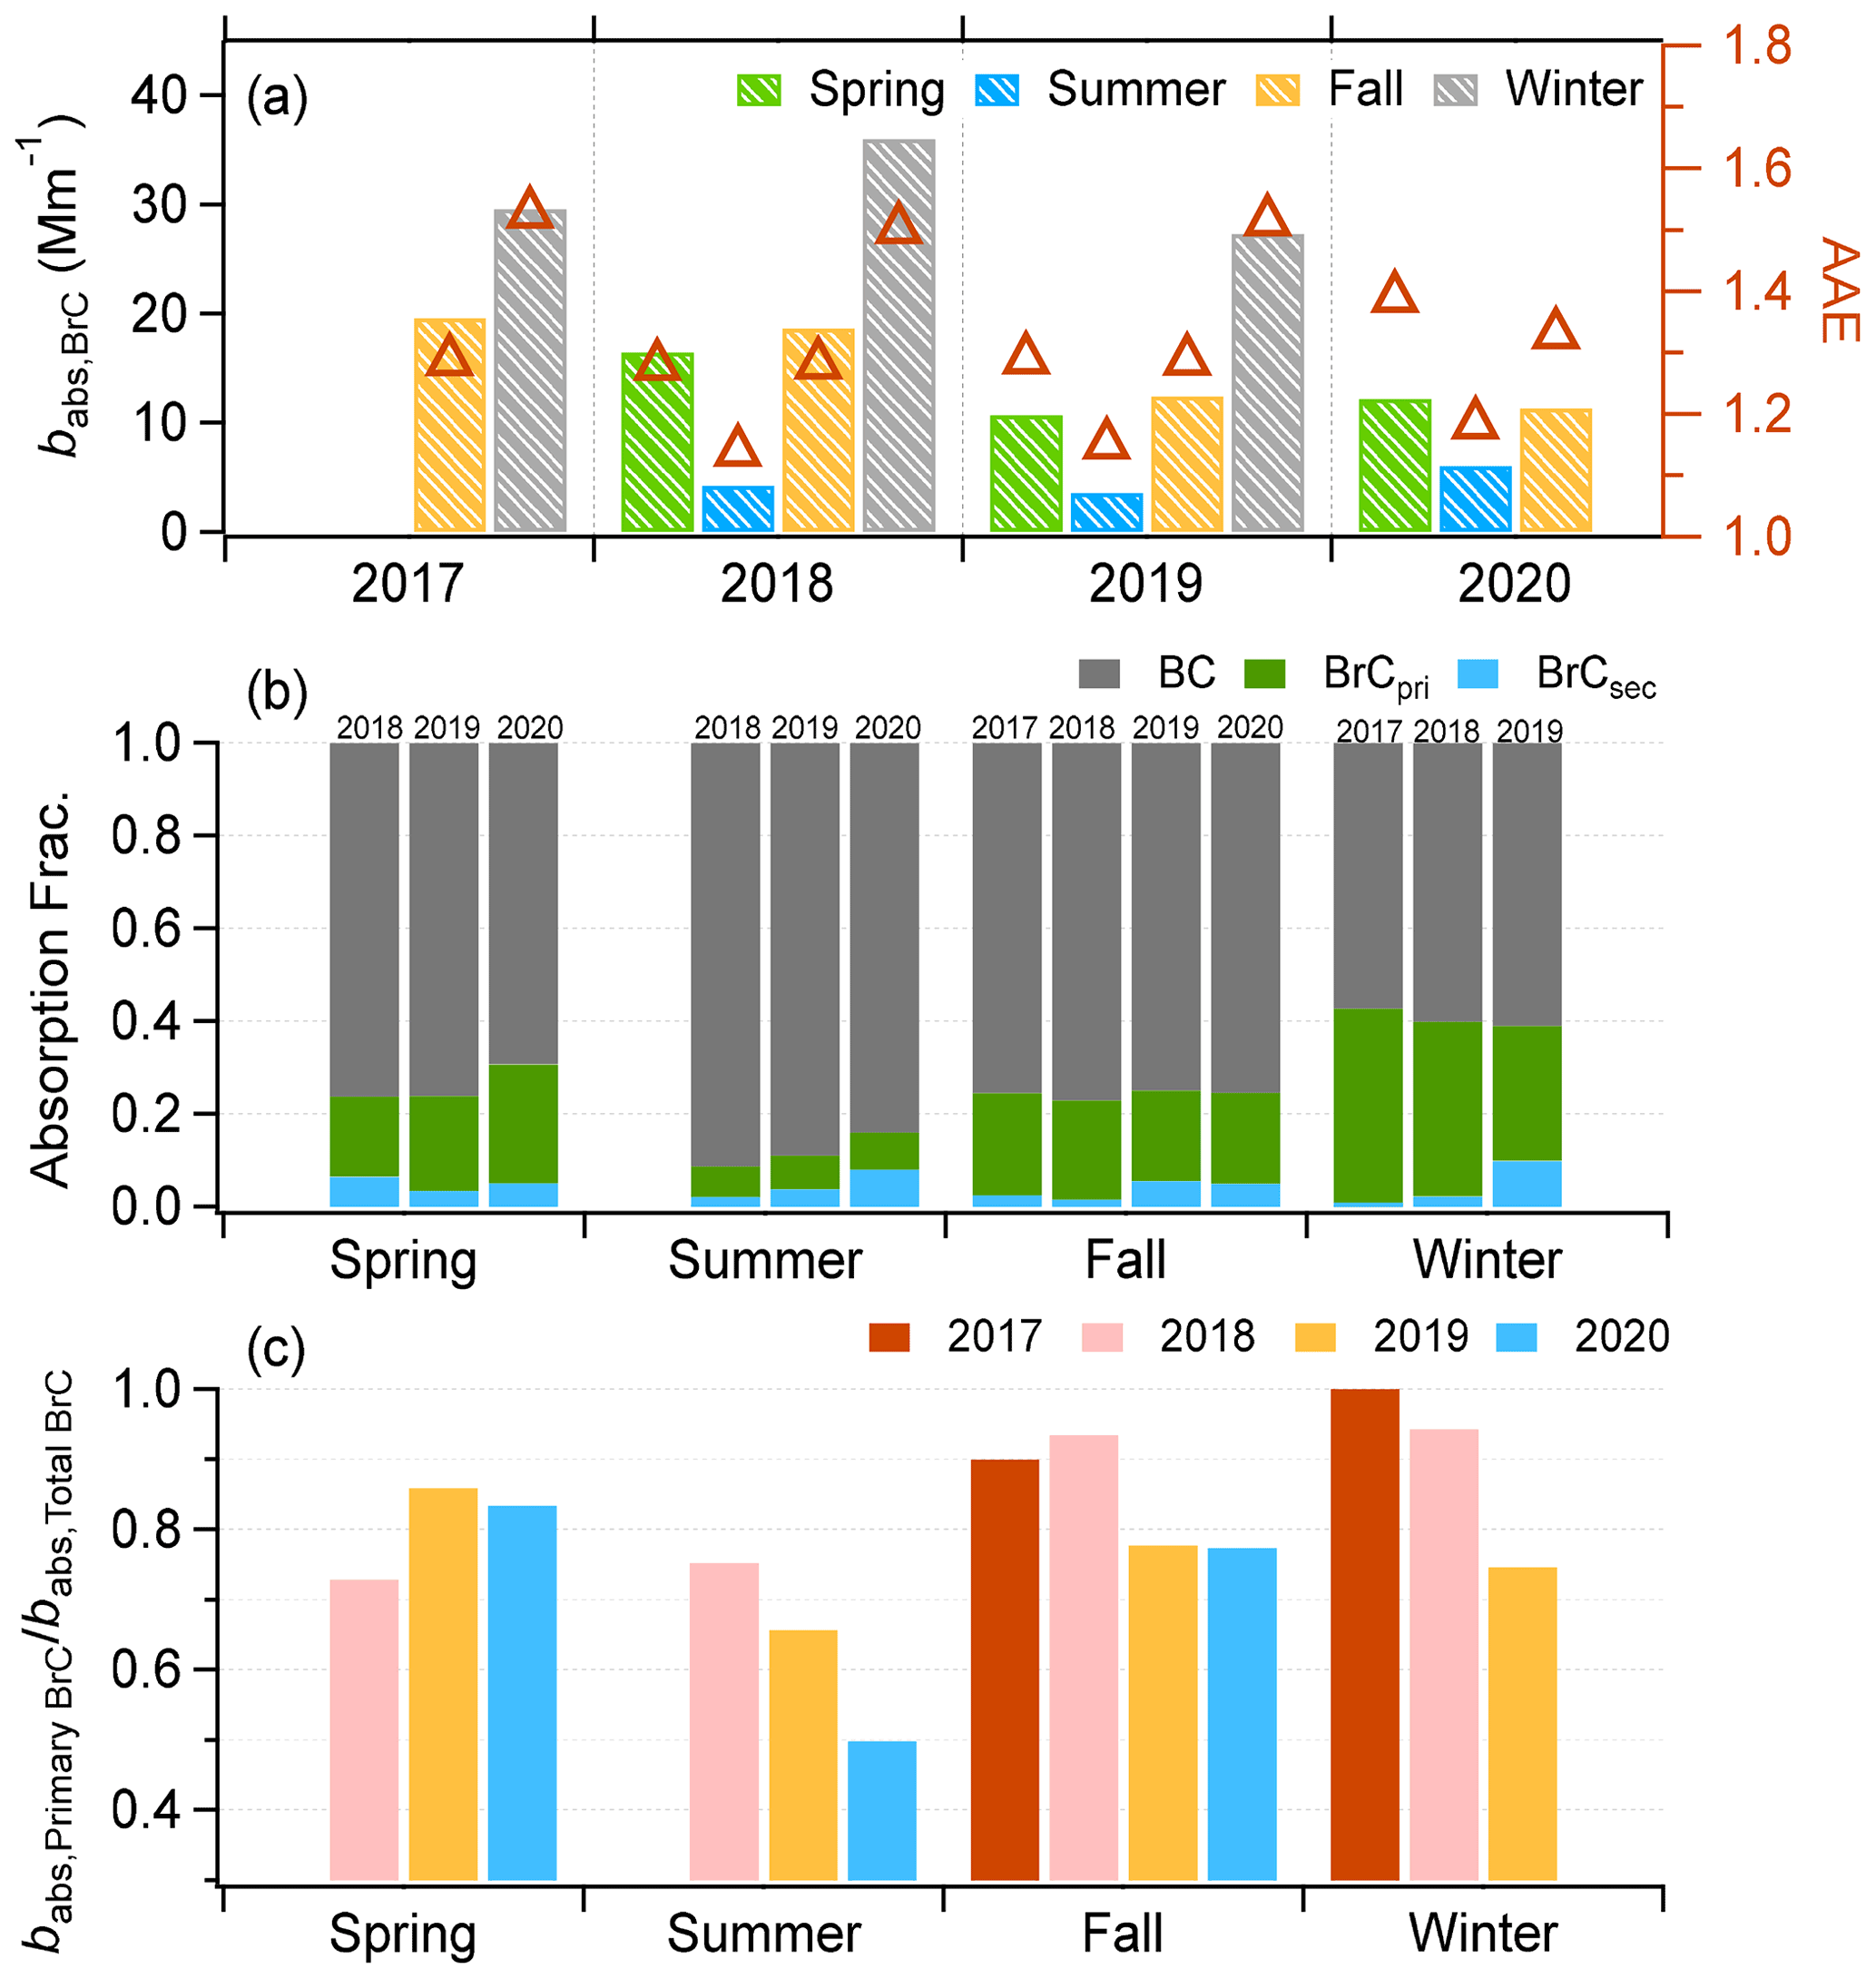
Figure 6Seasonal variations of (a) babs, BrC, AAE, percentage contribution of (b) absorbing components to the absorption coefficient, and (c) the proportion of babs, secondary BrC of the BrC absorption coefficient at 370 nm from 2018 to 2020.
As shown in Fig. S6, the diurnal variations of BrC absorption were similar to that of eBC, with generally higher values at nighttime, except in summer during 2018–2020. This result indicated that the BC-related primary emissions were also the main sources of BrC in spring, fall, and winter. In comparison, the diurnal variations of BrC absorption were largely different from eBC in summer because BrC was significantly influenced by secondary organic aerosols (SOAs). The diurnal variation of BrC absorption in summer 2020 was different from previous years, while the variations of eBC did not change significantly, supporting the increased contribution of secondary aerosol to BrC. Generally, the AAE showed a minimum at night, followed by a daytime increase from 08:00 to 12:00 during four seasons (Fig. S6), suggesting that photochemical production contributed dominantly to the BrC formation during daytime.
Using the MRS method (Wu and Yu, 2016), we estimated the primary and secondary BrC absorptions in each month during 2017–2020. As shown in Fig. S8, the monthly variation of primary BrC absorption was pronounced and similar to that of eBC, with high values in January and low values in July. These results are mainly due to enhanced primary emission except in summer, consistent with a previous study showing enhanced BrC contribution to absorption within higher aerosol emission (Tian et al., 2020). Despite this, the primary BrC absorption decreased gradually from 2017 to 2020, mainly due to the decreased emissions of biomass burning and coal combustion. We further explored the seasonal variations of primary and secondary BrC. As shown in Fig. 6b, BC dominated ultraviolet light absorption at 370 nm during four seasons, with the highest contribution being in summer (∼ 85 %) and the lowest in winter (∼ 60 %). One reason is because BrC from biomass burning and coal combustion in summer was small, which is also supported by the lower AAE in summer than other seasons (Fig. 7). Note that the average contribution of BrC to the total absorption in summer increased to 16 % from 2018 to 2020, likely due to enhanced SOA in organic aerosol (OA; Lei et al., 2020), and, correspondingly, the contributions of primary BrC to the total BrC absorption decreased from 75 % to 50 %. The contributions of BrC absorption were comparable in spring and fall, accounting for 25 %–30 %. Due to the decreased primary emission and enhanced secondary production during the COVID-19 lockdown, we found that the contribution of BrC absorption had increased by more than 7 % in spring from 2018 to 2020. In comparison, the contributions of BrC were larger than 40 % in winter, with slightly downward trends in the past 3 years. The declines of primary emissions might be an explanation; coal has been replaced by natural gas for residential heating in recent years.
Although the contributions of BrC absorption to the total absorption were relatively stable during four seasons from 2018 to 2020, the relative contributions of primary and secondary BrC changed significantly (Fig. 6c). Overall, the primary BrC was much higher than secondary BrC, yet showing decreasing trends from 2017 to 2020 except in spring. The primary BrC contributed more than 75 % to the total BrC in fall and winter, while they reached the minimum in summer (50 %–75 %). The contribution of summertime primary BrC decreased by more than 25 % from 2018 to 2020, and that of secondary BrC increased to up to 50 % of the total BrC in summer 2020, with an increase in AAE to 1.2. Given that eBC decreased continuously in summer in the past 3 years, the increases in AAE were mainly due to larger secondary BrC production from photochemical reaction. We also observed a large increase in secondary BrC in winter from 2018 to 2020. While the secondary BrC was negligible in 2018, the contribution increased to ∼ 25 % in 2020, suggesting that secondary production of BrC became more important in winter, which is consistent with the continuous increase in SOA in winter in recent years (Lei et al., 2020). Similar increases in secondary BrC were also observed in fall.
3.4 Direct radiative forcing of BC and BrC
As shown in Fig. 8, the annual mean ΔFR caused by BC was about +3.36 W m−2 in 2012, close to that previously reported in north China (Yang et al., 2017). Combined with the low SSA (annual mean value was about 0.79) in 2012, the negative radiative effect caused by scatting aerosols at TOA might be offset by BC, forming an inversion layer that exacerbated air pollution. Ding et al. (2016) found that the aerosol–boundary layer feedback to a unit quantity of BC will be lower in a higher aerosol loading case as solar radiation weakens. However, ΔFR decreased substantially by 67 % (+1.09) in 2020, suggesting that the BC radiative forcing was largely reduced during the last decade, which would help improve the air quality by reducing aerosol–boundary layer interaction. The relatively lower ΔFR caused by BC in recent years could lead to the negative radiative forcing of aerosols at TOA, thereby facilitating the dispersion of air pollutants in the boundary layer, which will in turn maintain air pollution at a low level. However, the ΔFR in 2020 was also much higher than the global annual mean TOA radiative forcing 0.40 W m−2 (IPCC, 2013), indicating that the positive radiative effect of BC in Beijing should be of continual concern in the future. The seasonal variation of BC ΔFR (Fig. S9) suggested the largest decrease in summer and fall. However, we noticed that the BC ΔFR was relatively stable in each season from 2019 and 2020, consistent with the small changes in eBC concentrations.

Figure 8Temporal variations of the annual mean ΔFR caused by BC, primary BrC, and secondary BrC.
We also estimated the radiative effects of BrC. As shown in Fig. 8, BrC ΔFR decreased by 43 % from +0.30 W m−2 in 2018 to +0.17 W m−2 in 2020; yet it was much higher than the global mean (+0.04–0.11 W m−2) (Feng et al., 2013). The scattering radiative forcing of BrC was estimated at −1.00–1.65 W m−2. The absorbing radiative forcing of BrC led to ∼ 18 % reduction in the amount of negative radiative forcing caused by BrC scattering compared to the results from the non-absorbing assumption. The seasonal variation of BrC ΔFR (in Fig. S9) showed a large decrease during all seasons from 2018 to 2019. However, compared with 2019, the BrC ΔFR became stable in summer 2020, which was different from the decreases in spring and fall. We further estimated the primary and secondary BrC ΔFR. Primary BrC ΔFR was approximately +0.16 W m−2 in 2020, decreasing by 41 % compared with 2018 (+0.27 W m−2). Such a value was higher than the global average of radiative forcing (+0.11 W m−2) from primary organic aerosols (Lu et al., 2015). Compared with primary BrC, the secondary BrC ΔFR was generally small; yet it showed an increase from +0.005 W m−2 in 2019 to +0.016 W m−2 in 2020.
In this study, 9-year measurements of eBC and light extinction coefficient in Beijing were analyzed. Our results showed that the annual mean eBC concentration decreased by 71 % from 6.25 µg m−3 in 2012 to 1.80 µg m−3 in 2020, and the decreases dominantly occurred at nighttime, suggesting an effective control of primary emissions due to the Clean Air Action Plan that was implemented in 2013. bext showed similar reductions by 47 % from 2012 to 2020. We also observed a pronounced seasonal variation in ΔeBC ΔCO, with high values in spring and fall and a gradual decrease in recent years, indicating a significant change in primary sources. As a response of the changes in primary and secondary aerosols, SSA increased substantially from 0.79 ± 0.11 in 2012 to 0.88 ± 0.06 in 2020, and it presented similar increasing trends during all seasons. These results highlight the increasingly important role of scattering aerosol in radiative forcing. Similarly, the seasonal average MEE increased gradually from 2012 to 2020, and the increase was most significant in summer by more than 43 %. The increased MEE explained the fact that PM2.5 decreased substantially after the Clean Air Action Plan, while the visibility did not show similar improvements as PM2.5.
We further analyzed the changes in BrC during 2018–2020. The BrC absorption presented the pronounced seasonal variation with the highest value in winter. We found that the primary emissions co-emitted with BC were the main sources of BrC during most seasons, while the secondary BrC was also important in summer. In particular, the contribution of secondary BrC to the total BrC showed a large increase in summer, and it was up to 50 % in summer 2020. These results indicated the BrC from secondary formation played an increasing role in the absorption at 370 nm during 2018–2020 in Beijing. By estimating the direct radiative forcing caused by absorbing aerosols, we found that the annual mean BC ΔFR decreased by 67 % from +3.36 W m−2 in 2012 to +1.09 W m−2 in 2020, and that of BrC decreased from +0.30 to +0.17 W m−2 during 2018–2020. Considering that the BC-induced aerosol–boundary layer feedback plays an important role in severe haze formation, the decreases in BC and radiative forcing would weaken aerosol–boundary layer interaction and help mitigate air pollution.
The data in this study are available at https://doi.org/10.5281/zenodo.5784837 (Sun, 2021).
The supplement related to this article is available online at: https://doi.org/10.5194/acp-22-561-2022-supplement.
YS and JS designed the research. JS, WZ, CX, CC, and TH conducted the measurements. JS, ZhW, WZ, and CC analyzed the data. CW, QW, ZL, JL, PF, and ZiW reviewed and commented on the paper. JS and YS wrote the paper.
The contact author has declared that neither they nor their co-authors have any competing interests.
Publisher's note: Copernicus Publications remains neutral with regard to jurisdictional claims in published maps and institutional affiliations.
This research has been supported by the National Natural Science Foundation of China (grant nos. 42061134008 and 9204430003).
This paper was edited by Roya Bahreini and reviewed by two anonymous referees.
An, Z., Huang, R. J., Zhang, R., Tie, X., Li, G., Cao, J., Zhou, W., Shi, Z., Han, Y., Gu, Z., and Ji, Y.: Severe haze in northern China: A synergy of anthropogenic emissions and atmospheric processes, Proc. Natl. Acad. Sci. USA, 116, 8657–8666, https://doi.org/10.1073/pnas.1900125116, 2019.
Andreae, M. O. and Gelencsér, A.: Black carbon or brown carbon? The nature of light-absorbing carbonaceous aerosols, Atmos. Chem. Phys., 6, 3131–3148, https://doi.org/10.5194/acp-6-3131-2006, 2006.
Bond, T. C. and Bergstrom, R. W.: Light absorption by carbonaceous particles: an investigative review, Aerosol Sci. Technol., 40, 27–67, https://doi.org/10.1080/02786820500421521, 2006.
Bond, T. C., Doherty, S. J., Fahey, D. W., Forster, P. M., Berntsen, T., DeAngelo, B. J., Flanner, M. G., Ghan, S., Kärcher, B., Koch, D., Kinne, S., Kondo, Y., Quinn, P. K., Sarofim, M. C., Schultz, M. G., Schulz, M., Venkataraman, C., Zhang, H., Zhang, S., Bellouin, N., Guttikunda, S. K., Hopke, P. K., Jacobson, M. Z., Kaiser, J. W., Klimont, Z., Lohmann, U., P., S. J., Shindell, D., Storelvmo, T., Warren, S. G., and Zender, C. S.: Bounding the role of black carbon in the climate system: a scientific assessment, J. Geophys. Res.-Atmos., 118, 5380–5552, https://doi.org/10.1002/jgrd.50171, 2013.
Cappa, C. D., Zhang, X., Russell, L. M., Collier, S., Lee, A. K. Y., Chen, C.-L., Betha, R., Chen, S., Liu, J., Price, D. J., Sanchez, K. J., McMeeking, G. R., Williams, L. R., Onasch, T. B., Worsnop, D. R., Abbatt, J., and Zhang, Q.: Light absorption by ambient black and brown carbon and its dependence on black carbon coating state for two California, USA, cities in winter and summer, J. Geophys. Res.-Atmos., 124, 1550–1577, https://doi.org/10.1029/2018jd029501, 2019.
Charlson, R. J., Schwartz, S. E., Hales, J. M., Cess, R. D., Coakley, J. A., Hansen, J. E., and Hofmann, D. J.: Climate forcing by anthropogenic aerosols, Science, 255, 423–430, 1992.
Chen, Y. and Bond, T. C.: Light absorption by organic carbon from wood combustion, Atmos. Chem. Phys., 10, 1773–1787, https://doi.org/10.5194/acp-10-1773-2010, 2010.
Chylek, P. and Wong, J.: Effect of aerosols on global budget, Geophys. Res. Lett., 22, 929–931, 1995.
Deng, J., Zhao, W., Wu, L., Hu, W., Ren, L., Wang, X., and Fu, P.: Black carbon in Xiamen, China: Temporal variations, transport pathways and impacts of synoptic circulation, Chemosphere, 241, 125133, https://doi.org/10.1016/j.chemosphere.2019.125133, 2020.
Derwent, R. G., Ryall, D. B., Jennings, S. G., Spain, T. G., and Simmonds, P. G.: Black carbon aerosol and carbon monoxide in European regionally polluted air masses at Mace Head, Ireland during 1995–1998, Atmos. Environ., 35, 6371–6378, 2001.
Din, S., Liu, D., Zhao, D., Hu, K., Tian, P., Zhou, W., Huang, M., Yang, Y., Wang, F., Sheng, J., Liu, Q., Kong, S., Cui, P., Huang, Y., He, H., Coe, H., and Ding, D.: Size-related physical properties of black carbon in the lower atmosphere over Beijing and Europe, Environ. Sci. Technol., 53, 11112–11121, https://doi.org/10.1021/acs.est.9b03722, 2019.
Ding, A. J., Huang, X., Nie, W., Sun, J. N., Kerminen, V. M., Petäjä, T., Su, H., Cheng, Y. F., Yang, X. Q., Wang, M. H., Chi, X. G., Wang, J. P., Virkkula, A., Guo, W. D., Yuan, J., Wang, S. Y., Zhang, R. J., Wu, Y. F., Song, Y., Zhu, T., Zilitinkevich, S., Kulmala, M., and Fu, C. B.: Enhanced haze pollution by black carbon in megacities in China, Geophys. Res. Lett., 43, 2873–2879, https://doi.org/10.1002/2016gl067745, 2016.
Drinovec, L., Močnik, G., Zotter, P., Prévôt, A. S. H., Ruckstuhl, C., Coz, E., Rupakheti, M., Sciare, J., Müller, T., Wiedensohler, A., and Hansen, A. D. A.: The ”dual-spot” Aethalometer: an improved measurement of aerosol black carbon with real-time loading compensation, Atmos. Meas. Tech., 8, 1965–1979, https://doi.org/10.5194/amt-8-1965-2015, 2015.
Feng, Y., Ramanathan, V., and Kotamarthi, V. R.: Brown carbon: a significant atmospheric absorber of solar radiation?, Atmos. Chem. Phys., 13, 8607–8621, https://doi.org/10.5194/acp-13-8607-2013, 2013.
Han, S., Kondo, Y., Oshima, N., Takegawa, N., Miyazaki, Y., Hu, M., Lin, P., Deng, Z., Zhao, Y., Sugimoto, N., and Wu, Y.: Temporal variations of elemental carbon in Beijing, J. Geophys. Res.-Atmos., 114, D23202, https://doi.org/10.1029/2009jd012027, 2009.
Han, T. T., Xu, W. Q., Chen, C., Liu, X. G., Wang, Q. Q., Li, J., Zhao, X. J., Du, W., Wang, Z. F., and Sun, Y. L.: Chemical apportionment of aerosol optical properties during the Asia–Pacific Economic Cooperation summit in Beijing, China, J. Geophys. Res.-Atmos., 120, 12281–12295, https://doi.org/10.1002/2015jd023918, 2015.
Han, T. T., Xu, W. Q., Li, J., Freedman, A., Zhao, J., Wang, Q. Q., Chen, C., Zhang, Y. J., Wang, Z. F., Fu, P. Q., Liu, X. G., and Sun, Y. L.: Aerosol optical properties measurements by a CAPS single scattering albedo monitor: Comparisons between summer and winter in Beijing, China, J. Geophys. Res.-Atmos., 122, 2513–2526, https://doi.org/10.1002/2016jd025762, 2017.
Hansen, J., Sato, M., and Ruedy, R.: Radiative forcing and climate response, J. Geophys. Res.-Atmos., 102, 6831–6864, https://doi.org/10.1029/96jd03436, 1997.
Haywood, J. and Boucher, O.: Estimates of the direct and indirect radiative forcing due to tropospheric aerosols: A review, Rev. Geophy., 38, 513–543, https://doi.org/10.1029/1999rg000078, 2000.
Hoesly, R. M., Smith, S. J., Feng, L., Klimont, Z., Janssens-Maenhout, G., Pitkanen, T., Seibert, J. J., Vu, L., Andres, R. J., Bolt, R. M., Bond, T. C., Dawidowski, L., Kholod, N., Kurokawa, J.-I., Li, M., Liu, L., Lu, Z., Moura, M. C. P., O'Rourke, P. R., and Zhang, Q.: Historical (1750–2014) anthropogenic emissions of reactive gases and aerosols from the Community Emissions Data System (CEDS), Geosci. Model Dev., 11, 369–408, https://doi.org/10.5194/gmd-11-369-2018, 2018.
Huang, Y., Li, L., Li, J., Wang, X., Chen, H., Chen, J., Yang, X., Gross, D. S., Wang, H., Qiao, L., and Chen, C.: A case study of the highly time-resolved evolution of aerosol chemical and optical properties in urban Shanghai, China, Atmos. Chem. Phys., 13, 3931–3944, https://doi.org/10.5194/acp-13-3931-2013, 2013.
IPCC: Climate Change 2013: The Physical Science Basis. Contribution of Working Group I to the Fifth Assessment Report of the Intergovernmental Panel on Climate Change, edited by: Stocker, T. F., Qin, D., Plattner, G.-K., Tignor, M., Allen, S. K., Boschung, J., Nauels, A., Xia, Y., Bex, V., and Midgley, P. M., Cambridge University Press, Cambridge, United Kingdom and New York, NY, USA, 1535 pp., https://doi.org/10.1017/CBO9781107415324, 2013.
Jacobson, M. Z.: Strong radiative heating due to the mixing state of black carbon in atmospheric aerosols, Nature, 409, 695–697, 2001.
Jing, A., Zhu, B., Wang, H., Yu, X., An, J., and Kang, H.: Source apportionment of black carbon in different seasons in the northern suburb of Nanjing, China, Atmos. Environ., 201, 190–200, https://doi.org/10.1016/j.atmosenv.2018.12.060, 2019.
Jo, D. S., Park, R. J., Lee, S., Kim, S.-W., and Zhang, X.: A global simulation of brown carbon: implications for photochemistry and direct radiative effect, Atmos. Chem. Phys., 16, 3413–3432, https://doi.org/10.5194/acp-16-3413-2016, 2016.
Kondo, Y., Komazaki, Y., Miyazaki, Y., Moteki, N., Takegawa, N., Kodama, D., Deguchi, S., Nogami, M., Fukuda, M., Miyakawa, T., Morino, Y., Koike, M., Sakurai, H., and Ehara, K.: Temporal variations of elemental carbon in Tokyo, J. Geophys. Res.-Atmos., 111, D12205, https://doi.org/10.1029/2005jd006257, 2006.
Laskin, A., Laskin, J., and Nizkorodov, S. A.: Chemistry of atmospheric brown carbon, Chem. Rev., 115, 4335–4382, https://doi.org/10.1021/cr5006167, 2015.
Lee, K. H., Li, Z. Q., Wong, M. S., Xin, J. Y., Wang, Y. S., Hao, W. M., and Zhao, F. S.: Aerosol single scattering albedo estimated across China from a combination of ground and satellite measurements, J. Geophys. Res.-Atmos., 112, D22S15, https://doi.org/10.1029/2007jd009077, 2007.
Lei, L., Zhou, W., Chen, C., He, Y., Li, Z., Sun, J., Tang, X., Fu, P., Wang, Z., and Sun, Y.: Long-term characterization of aerosol chemistry in cold season from 2013 to 2020 in Beijing, China, Environ. Pollut., 268, 115952, https://doi.org/10.1016/j.envpol.2020.115952, 2020.
Li, L., Tan, Q., Zhang, Y., Feng, M., Qu, Y., An, J., and Liu, X.: Characteristics and source apportionment of PM2.5 during persistent extreme haze events in Chengdu, southwest China, Environ. Pollut., 230, 718–729, https://doi.org/10.1016/j.envpol.2017.07.029, 2017.
Li, Z., Sun, Y., Wang, Q., Xin, J., Sun, J., Lei, L., Li, J., Fu, P., and Wang, Z.: Nitrate and secondary organic aerosol dominated particle light extinction in Beijing due to clean air action, Atmos. Environ., 269, 118833, https://doi.org/10.1016/j.atmosenv.2021.118833, 2022.
Liu, C., Li, J., Yin, Y., Zhu, B., and Feng, Q.: Optical properties of black carbon aggregates with non-absorptive coating, J. Quant. Spectrosc. Ra., 187, 443–452, https://doi.org/10.1016/j.jqsrt.2016.10.023, 2017.
Liu, D., Whitehead, J., Alfarra, M. R., Reyes-Villegas, E., Spracklen, D. V., Reddington, C. L., Kong, S., Williams, P. I., Ting, Y.-C., Haslett, S., Taylor, J. W., Flynn, M. J., Morgan, W. T., McFiggans, G., Coe, H., and Allan, J. D.: Black-carbon absorption enhancement in the atmosphere determined by particle mixing state, Nat. Geosci., 10, 184–188, https://doi.org/10.1038/ngeo2901, 2017.
Liu, D., Joshi, R., Wang, J., Yu, C., Allan, J. D., Coe, H., Flynn, M. J., Xie, C., Lee, J., Squires, F., Kotthaus, S., Grimmond, S., Ge, X., Sun, Y., and Fu, P.: Contrasting physical properties of black carbon in urban Beijing between winter and summer, Atmos. Chem. Phys., 19, 6749–6769, https://doi.org/10.5194/acp-19-6749-2019, 2019.
Liu, D., Ding, S., Zhao, D., Hu, K., Yu, C., Hu, D., Wu, Y., Zhou, C., Tian, P., Liu, Q., Wu, Y., Zhang, J., Kong, S., Huang, M., and Ding, D.: Black carbon emission and wet scavenging from surface to the top of boundary layer over Beijing region, J. Geophys. Res.-Atmos., 125, e2020JD033096, https://doi.org/10.1029/2020jd033096, 2020.
Liu, H., Pan, X., Wu, Y., Ji, D., Tian, Y., Chen, X., and Wang, Z.: Size-resolved mixing state and optical properties of black carbon at an urban site in Beijing, Sci. Total Environ., 749, 141523, https://doi.org/10.1016/j.scitotenv.2020.141523, 2020.
Lu, Z., Streets, D. G., Winijkul, E., Yan, F., Chen, Y., Bond, T. C., Feng, Y., Dubey, M. K., Liu, S., Pinto, J. P., and Carmichael, G. R.: Light absorption properties and radiative effects of primary organic aerosol emissions, Environ. Sci. Technol., 49, 4868–4877, https://doi.org/10.1021/acs.est.5b00211, 2015.
Ma, N., Zhao, C. S., Nowak, A., Müller, T., Pfeifer, S., Cheng, Y. F., Deng, Z. Z., Liu, P. F., Xu, W. Y., Ran, L., Yan, P., Göbel, T., Hallbauer, E., Mildenberger, K., Henning, S., Yu, J., Chen, L. L., Zhou, X. J., Stratmann, F., and Wiedensohler, A.: Aerosol optical properties in the North China Plain during HaChi campaign: an in-situ optical closure study, Atmos. Chem. Phys., 11, 5959–5973, https://doi.org/10.5194/acp-11-5959-2011, 2011.
Massoli, P., Kebabian, P. L., Onasch, T. B., Hills, F. B., and Freedman, A. A.: Aerosol light extinction measurements by cavity attenuated phase shift (CAPS) spectroscopy: laboratory validation and field deployment of a compact aerosol particle extinction monitor, Aerosol Sci. Technol., 44, 428–435, https://doi.org/10.1080/02786821003716599, 2015.
Moosmüller, H., Chakrabarty, R. K., Ehlers, K. M., and Arnott, W. P.: Absorption Ångström coefficient, brown carbon, and aerosols: basic concepts, bulk matter, and spherical particles, Atmos. Chem. Phys., 11, 1217–1225, https://doi.org/10.5194/acp-11-1217-2011, 2011.
Mousavi, A., Sowlat, M. H., Lovett, C., Rauber, M., Szidat, S., Boffi, R., Borgini, A., De Marco, C., Ruprecht, A. A., and Sioutas, C.: Source apportionment of black carbon (BC) from fossil fuel and biomass burning in metropolitan Milan, Italy, Atmos. Environ., 203, 252–261, https://doi.org/10.1016/j.atmosenv.2019.02.009, 2019.
Oberdörster, G. and Yu, C. P.: The carcinogenic potential of inhaled diesel exhaust: a particle effect?, J. Aerosol. Sci., 21, S397–S401, 1990.
Pan, X. L., Kanaya, Y., Wang, Z. F., Liu, Y., Pochanart, P., Akimoto, H., Sun, Y. L., Dong, H. B., Li, J., Irie, H., and Takigawa, M.: Correlation of black carbon aerosol and carbon monoxide in the high-altitude environment of Mt. Huang in Eastern China, Atmos. Chem. Phys., 11, 9735–9747, https://doi.org/10.5194/acp-11-9735-2011, 2011.
Park, R. J., Kim, M. J., Jeong, J. I., Youn, D., and Kim, S.: A contribution of brown carbon aerosol to the aerosol light absorption and its radiative forcing in East Asia, Atmos. Environ., 44, 1414–1421, https://doi.org/10.1016/j.atmosenv.2010.01.042, 2010.
Petzold, A., Ogren, J. A., Fiebig, M., Laj, P., Li, S.-M., Baltensperger, U., Holzer-Popp, T., Kinne, S., Pappalardo, G., Sugimoto, N., Wehrli, C., Wiedensohler, A., and Zhang, X.-Y.: Recommendations for reporting “black carbon” measurements, Atmos. Chem. Phys., 13, 8365–8379, https://doi.org/10.5194/acp-13-8365-2013, 2013.
Ramanathan, V. and Carmichael, G. J. N. G.: Global and regional climate changes due to black carbon, Nat. Geosci., 36, 335–358, 2008.
Ran, L., Deng, Z. Z., Wang, P. C., and Xia, X. A.: Black carbon and wavelength-dependent aerosol absorption in the North China Plain based on two-year aethalometer measurements, Atmos. Environ., 142, 132–144, https://doi.org/10.1016/j.atmosenv.2016.07.014, 2016.
Rattigan, O. V., Civerolo, K., Doraiswamy, P., Felton, H. D., and Hopke, P. K.: Long Term Black Carbon Measurements at Two Urban Locations in New York, Aerosol Air Qual. Res., 13, 1181–1196, https://doi.org/10.4209/aaqr.2013.02.0060, 2013.
Rosenfeld, D.: Suppression of rain and snow by urban and industrial air pollution, Science, 287, 1793–1796, 2000.
Saleh, R., Hennigan, C. J., McMeeking, G. R., Chuang, W. K., Robinson, E. S., Coe, H., Donahue, N. M., and Robinson, A. L.: Absorptivity of brown carbon in fresh and photo-chemically aged biomass-burning emissions, Atmos. Chem. Phys., 13, 7683–7693, https://doi.org/10.5194/acp-13-7683-2013, 2013.
Spackman, J. R., Schwarz, J. P., Gao, R. S., Watts, L. A., Thomson, D. S., Fahey, D. W., Holloway, J. S., de Gouw, J. A., Trainer, M., and Ryerson, T. B.: Empirical correlations between black carbon aerosol and carbon monoxide in the lower and middle troposphere, Geophys. Res. Lett., 35, L19819, https://doi.org/10.1029/2008gl035237, 2008.
Streets, D. G., Bond, T. C., Carmichael, G. R., Fernandes, S. D., Fu, Q., He, D., Klimont, Z., Nelson, S. M., Tsai, N. Y., Wang, M. Q., Woo, J. H., and Yarber, K. F.: An inventory of gaseous and primary aerosol emissions in Asia in the year 2000, J. Geophys. Res.-Atmos., 108, 8809, https://doi.org/10.1029/2002jd003093, 2003.
Subramanian, R., Kok, G. L., Baumgardner, D., Clarke, A., Shinozuka, Y., Campos, T. L., Heizer, C. G., Stephens, B. B., de Foy, B., Voss, P. B., and Zaveri, R. A.: Black carbon over Mexico: the effect of atmospheric transport on mixing state, mass absorption cross-section, and BC/CO ratios, Atmos. Chem. Phys., 10, 219–237, https://doi.org/10.5194/acp-10-219-2010, 2010.
Sun, J., Xie, C., Xu, W., Chen, C., Ma, N., Xu, W., Lei, L., Li, Z., He, Y., Qiu, Y., Wang, Q., Pan, X., Su, H., Cheng, Y., Wu, C., Fu, P., Wang, Z., and Sun, Y.: Light absorption of black carbon and brown carbon in winter in North China Plain: comparisons between urban and rural sites, Sci. Total Environ., 770, 144821, https://doi.org/10.1016/j.scitotenv.2020.144821, 2021.
Sun, J. Y., Wu, C., Wu, D., Cheng, C., Li, M., Li, L., Deng, T., Yu, J. Z., Li, Y. J., Zhou, Q., Liang, Y., Sun, T., Song, L., Cheng, P., Yang, W., Pei, C., Chen, Y., Cen, Y., Nian, H., and Zhou, Z.: Amplification of black carbon light absorption induced by atmospheric aging: temporal variation at seasonal and diel scales in urban Guangzhou, Atmos. Chem. Phys., 20, 2445–2470, https://doi.org/10.5194/acp-20-2445-2020, 2020.
Sun, Y.: Beijing_BC_Data, Zenodo [data set], https://doi.org/10.5281/zenodo.5784837, 2021.
Sun, Y., Xu, W., Zhang, Q., Jiang, Q., Canonaco, F., Prévôt, A. S. H., Fu, P., Li, J., Jayne, J., Worsnop, D. R., and Wang, Z.: Source apportionment of organic aerosol from 2-year highly time-resolved measurements by an aerosol chemical speciation monitor in Beijing, China, Atmos. Chem. Phys., 18, 8469–8489, https://doi.org/10.5194/acp-18-8469-2018, 2018.
Sun, Y., Lei, L., Zhou, W., Chen, C., He, Y., Sun, J., Li, Z., Xu, W., Wang, Q., Ji, D., Fu, P., Wang, Z., and Worsnop, D. R.: A chemical cocktail during the COVID-19 outbreak in Beijing, China: Insights from six-year aerosol particle composition measurements during the Chinese New Year holiday, Sci. Total Environ., 742, 140739, https://doi.org/10.1016/j.scitotenv.2020.140739, 2020.
Tian, P., Liu, D., Zhao, D., Yu, C., Liu, Q., Huang, M., Deng, Z., Ran, L., Wu, Y., Ding, S., Hu, K., Zhao, G., Zhao, C., and Ding, D.: In situ vertical characteristics of optical properties and heating rates of aerosol over Beijing, Atmos. Chem. Phys., 20, 2603–2622, https://doi.org/10.5194/acp-20-2603-2020, 2020.
Wang, Q., Liu, S., Zhou, Y., Cao, J., Han, Y., Ni, H., Zhang, N., and Huang, R.: Characteristics of Black Carbon Aerosol during the Chinese Lunar Year and Weekdays in Xi'an, China, Atmosphere, 6, 195–208, https://doi.org/10.3390/atmos6020195, 2015.
Wang, Q., Han, Y., Ye, J., Liu, S., Pongpiachan, S., Zhang, N., Han, Y., Tian, J., Wu, C., Long, X., Zhang, Q., Zhang, W., Zhao, Z., and Cao, J.: High Contribution of Secondary Brown Carbon to Aerosol Light Absorption in the Southeastern Margin of Tibetan Plateau, Geophys. Res. Lett., 46, 4962–4970, https://doi.org/10.1029/2019gl082731, 2019a.
Wang, Q., Ye, J., Wang, Y., Zhang, T., Ran, W., Wu, Y., Tian, J., Li, L., Zhou, Y., Hang Ho, S. S., Dang, B., Zhang, Q., Zhang, R., Chen, Y., Zhu, C., and Cao, J.: Wintertime optical properties of primary and secondary brown carbon at a regional site in the North China Plain, Environ. Sci. Technol., 53, 12389–12397, https://doi.org/10.1021/acs.est.9b03406, 2019b.
Wang, R., Tao, S., Wang, W., Liu, J., Shen, H., Shen, G., Wang, B., Liu, X., Li, W., Huang, Y., Zhang, Y., Lu, Y., Chen, H., Chen, Y., Wang, C., Zhu, D., Wang, X., Li, B., Liu, W., and Ma, J.: Black carbon emissions in China from 1949 to 2050, Environ. Sci. Technol., 46, 7595–7603, https://doi.org/10.1021/es3003684, 2012.
Wei, C., Wang, M. H., Fu, Q. Y., Dai, C., Huang, R., and Bao, Q.: Temporal characteristics and potential sources of black carbon in megacity Shanghai, China, J. Geophys. Res.-Atmos., 125, e2019JD031827, https://doi.org/10.1029/2019jd031827, 2020.
Westerdahl, D., Wang, X., Pan, X., and Zhang, K. M.: Characterization of on-road vehicle emission factors and microenvironmental air quality in Beijing, China, Atmos. Environ., 43, 697–705, https://doi.org/10.1016/j.atmosenv.2008.09.042, 2009.
Wu, C. and Yu, J. Z.: Determination of primary combustion source organic carbon-to-elemental carbon (OC EC) ratio using ambient OC and EC measurements: secondary OC-EC correlation minimization method, Atmos. Chem. Phys., 16, 5453–5465, https://doi.org/10.5194/acp-16-5453-2016, 2016.
Wu, Y., Xia, Y., Zhou, C., Tian, P., Tao, J., Huang, R. J., Liu, D., Wang, X., Xia, X., Han, Z., and Zhang, R.: Effect of source variation on the size and mixing state of black carbon aerosol in urban Beijing from 2013 to 2019: Implication on light absorption, Environ. Pollut., 270, 116089, https://doi.org/10.1016/j.envpol.2020.116089, 2021.
Xie, C., Xu, W., Wang, J., Wang, Q., Liu, D., Tang, G., Chen, P., Du, W., Zhao, J., Zhang, Y., Zhou, W., Han, T., Bian, Q., Li, J., Fu, P., Wang, Z., Ge, X., Allan, J., Coe, H., and Sun, Y.: Vertical characterization of aerosol optical properties and brown carbon in winter in urban Beijing, China, Atmos. Chem. Phys., 19, 165–179, https://doi.org/10.5194/acp-19-165-2019, 2019.
Xie, C., He, Y., Lei, L., Zhou, W., Liu, J., Wang, Q., Xu, W., Qiu, Y., Zhao, J., Sun, J., Li, L., Li, M., Zhou, Z., Fu, P., Wang, Z., and Sun, Y.: Contrasting mixing state of black carbon-containing particles in summer and winter in Beijing, Environ. Pollut., 263, 114455, https://doi.org/10.1016/j.envpol.2020.114455, 2020.
Yang, M., Howell, S. G., Zhuang, J., and Huebert, B. J.: Attribution of aerosol light absorption to black carbon, brown carbon, and dust in China – interpretations of atmospheric measurements during EAST-AIRE, Atmos. Chem. Phys., 9, 2035–2050, https://doi.org/10.5194/acp-9-2035-2009, 2009.
Yang, Y., Wang, H., Smith, S. J., Ma, P.-L., and Rasch, P. J.: Source attribution of black carbon and its direct radiative forcing in China, Atmos. Chem. Phys., 17, 4319–4336, https://doi.org/10.5194/acp-17-4319-2017, 2017.
Zhai, J., Lu, X., Li, L., Zhang, Q., Zhang, C., Chen, H., Yang, X., and Chen, J.: Size-resolved chemical composition, effective density, and optical properties of biomass burning particles, Atmos. Chem. Phys., 17, 7481–7493, https://doi.org/10.5194/acp-17-7481-2017, 2017.
Zhang, Q., Zheng, Y., Tong, D., Shao, M., Wang, S., Zhang, Y., Xu, X., Wang, J., He, H., Liu, W., Ding, Y., Lei, Y., Li, J., Wang, Z., Zhang, X., Wang, Y., Cheng, J., Liu, Y., Shi, Q., Yan, L., Geng, G., Hong, C., Li, M., Liu, F., Zheng, B., Cao, J., Ding, A., Gao, J., Fu, Q., Huo, J., Liu, B., Liu, Z., Yang, F., He, K., and Hao, J.: Drivers of improved PM2.5 air quality in China from 2013 to 2017, Proc. Natl. Acad. Sci. USA, 116, 24463–24469, https://doi.org/10.1073/pnas.1907956116, 2019.
Zhang, X., Rao, R., Huang, Y., Mao, M., Berg, M. J., and Sun, W.: Black carbon aerosols in urban central China, J. Quant. Spectrosc. Ra., 150, 3–11, https://doi.org/10.1016/j.jqsrt.2014.03.006, 2015.
Zhou, W., Gao, M., He, Y., Wang, Q., Xie, C., Xu, W., Zhao, J., Du, W., Qiu, Y., Lei, L., Fu, P., Wang, Z., Worsnop, D. R., Zhang, Q., and Sun, Y.: Response of aerosol chemistry to clean air action in Beijing, China: insights from two-year ACSM measurements and model simulations, Environ. Pollut., 255, 113345, https://doi.org/10.1016/j.envpol.2019.113345, 2019.
Zhou, W., Xu, W., Kim, H., Zhang, Q., Fu, P., Worsnop, D., and Sun, Y.: A review of aerosol chemistry in Asia: insights from aerosol mass spectrometer measurements, Environ. Sci.-Proc. Imp., 22, 1616–1653, https://doi.org/10.1039/D0EM00212G, 2020.