the Creative Commons Attribution 4.0 License.
the Creative Commons Attribution 4.0 License.
 | 02 May 2022
Offline analysis of the chemical composition and hygroscopicity of submicrometer aerosol at an Asian outflow receptor site and comparison with online measurements
Yange Deng
Hiroaki Fujinari
Hikari Yai
Kojiro Shimada
Yuzo Miyazaki
Eri Tachibana
Dhananjay K. Deshmukh
Kimitaka Kawamura
Tomoki Nakayama
Shiori Tatsuta
Mingfu Cai
Hanbing Xu
Haobo Tan
Sho Ohata
Yutaka Kondo
Akinori Takami
Shiro Hatakeyama
Michihiro Mochida
Filter-based offline analysis of atmospheric aerosol hygroscopicity coupled to composition analysis provides information complementary to that obtained from online analysis. However, its application itself and comparison to online analysis have remained limited to date. In this study, daily submicrometer aerosol particles (PM0.95, 50 % cutoff diameter 0.95 µm) were collected onto quartz fiber filters on Okinawa Island, a receptor of East Asian outflow, in the autumn of 2015. The chemical composition of water-soluble matter (WSM) in PM0.95, PM0.95 itself, and their respective hygroscopicities were characterized through the offline use of an aerosol mass spectrometer and a hygroscopicity tandem differential mobility analyzer. Thereafter, results were compared with those obtained from online analyses. Sulfate dominated the WSM mass (59 %), followed by water-soluble organic matter (WSOM, 20 %) and ammonium (13 %). WSOM accounted for most (91 %) of the mass of extracted organic matter (EOM) and the atomic O-to-C ratios (O:C) of WSOM and EOM were high (mean ± standard deviation were 0.84 ± 0.08 and 0.78 ± 0.08, respectively), both of which indicate highly aged characteristics of the observed aerosol. The hygroscopic growth curves showed clear hysteresis for most samples. At 85 % relative humidity (RH), the calculated hygroscopicity parameter κ values of the WSM (κWSM), WSOM, EOM, and PM0.95 () were 0.50 ± 0.03, 0.22 ± 0.12, 0.20 ± 0.11, and 0.47 ± 0.03, respectively. An analysis using the thermodynamic Extended Aerosol Inorganics Model (E-AIM) shows, on average, that inorganic salts and WSOM contributed 88 % and 12 %, respectively, of the κWSM (or ). High similarities were found between offline and online analysis for chemical compositions that are related to particle hygroscopicity (the mass fractions and O:C of organics and the degree of neutralization) and also for aerosol hygroscopicity. As possible factors governing the variation in κWSM, the influences of WSOM abundance and the neutralization of inorganic salts were assessed. At high RH (70 %–90 %), the hygroscopicity of WSM and PM0.95 was affected considerably by the presence of organic components; at low RH (20 %–50 %), the degree of neutralization could be important. This study not only characterized aerosol hygroscopicity at the receptor site of East Asian outflow but also shows that offline hygroscopicity analysis is an appropriate method, at least for aerosols of the studied type. The results encourage further applications to other environments and to more in-depth hygroscopicity analysis, in particular for organic fractions.
- Article
(4457 KB) - Full-text XML
-
Supplement
(6471 KB) - BibTeX
- EndNote


Hygroscopicity of atmospheric aerosols is a key property related to its effects on climate and air quality. It influences the aerosol's light scattering and absorption ability (Titos et al., 2016; Zhou et al., 2020) and therefore affects visibility and the radiative balance of the Earth. Moreover, it influences the capability of aerosol particles to act as cloud condensation nuclei (CCN) under supersaturated water-vapor conditions, which further influences the radiative balance by affecting the optical property and lifetime of clouds (Mcfiggans et al., 2006). In addition, the absorption of water by aerosol particles might serve as important media for aqueous-phase reactions (McNeill, 2015; Cheng et al., 2016). The hygroscopicity of aerosol particles might also influence their adverse effects on human health: aerosol particle deposition in a human body is expected to depend on hygroscopic growth under high relative humidity (RH) in the respiratory system (Braakhuis et al., 2014).
The hygroscopicity of atmospheric aerosol is governed by the chemical composition. It is often represented by hygroscopicity parameter κ. Several hygroscopicity studies have been performed for atmospheric particles or particles generated by extracts from atmospheric aerosol samples. Whereas the ability of the particles to grow to cloud droplet size under supersaturated water-vapor conditions has been investigated using a CCN counter, alternatively, the growth in particle size as a result of humidification under sub-saturated conditions has also been investigated, for example using a hygroscopicity tandem differential mobility analyzer (HTDMA). At water activity (aw) of around 0.9 or higher, inorganic salts such as NaCl and (NH4)2SO4 present high κ values of 0.5–1.4; atmospheric organic aerosol (OA) components present intermediate κ values of 0.01–0.5 (Petters and Kreidenweis, 2007). By contrast, black carbon retains almost no water (Guo et al., 2016) and its κ value can be inferred as zero. The κ values of ambient aerosol particles are explained by the combination of water uptake by respective components in the mixture. In the low to middle RH range, the deliquescence and efflorescence of inorganic salts can strongly affect the hygroscopic growth of atmospheric particles and could result in hysteresis according to the history of RH (Tang et al., 1977). For the hygroscopicity of ambient particles, the composition of inorganics, including the degree of neutralization, affects their contribution to particle hygroscopicity (Tang and Munkelwitz, 1977; Freedman et al., 2019). In addition, the contrasting hygroscopicity of organics and inorganics is responsible for variations in their hygroscopicity (e.g., Gunthe et al., 2009; Cerully et al., 2011; Pierce et al., 2012; Levin et al., 2014; Deng et al., 2018). The dominant components of atmospheric aerosols govern the dependence of aerosol hygroscopicity on locations: hygroscopicity in the forest atmosphere (Gunthe et al., 2009; Hong et al., 2014), where OA dominates the aerosol composition, is generally less than that in the marine atmosphere (Mochida et al., 2011; Pringle et al., 2010), where inorganic salts dominate. Moreover, while the oxygenation of OA relates to its hygroscopicity (Kuwata et al., 2013), correlation from analysis of atmospheric aerosols can be poor (Kuang et al., 2020). Whereas multiple compositional factors are expected to control the aerosol hygroscopic growth as explained above, studies elucidating variations in hygroscopic growth under different atmospheric environments are few, which can be attributed to the lack of hygroscopicity analyses coupled with chemical composition analyses.
For characterizing the hygroscopicity of atmospheric aerosols, offline analysis, i.e., the collection of aerosol samples on substrates followed by analysis of the hygroscopicity of chemical components therein, provides information that complements information obtained from online analysis. Such offline analyses have been conducted for urban aerosols (e.g., Aggarwal et al., 2007; Mihara and Mochida, 2011) and aerosols in remote environments (e.g., Silvergren et al., 2014; Boreddy and Kawamura, 2016). For offline methods, the hygroscopicity of aerosol particles with size up to ∼ 1 µm or larger was analyzed, providing data for hygroscopicity in a wide range of particle sizes, which are often difficult to obtain by online analyses. Furthermore, whereas information related to the mixing state is lost, offline methods enable investigation of the hygroscopicity of specific compound groups in aerosols, for example, water-soluble matter and humic-like substances (Gysel et al., 2004). Moreover, whereas field deployments of online instruments such as HTDMAs might be heavy-duty and hinder observations particularly at remote sites, offline analysis can be a good alternative for aerosol hygroscopicity studies. Recent studies have indicated that offline use of an aerosol mass spectrometer (AMS) can be a useful means to elucidate the contribution of the OA component to aerosol hygroscopicity because of its capability of quantifying organic mass in addition to organic carbon and to characterize the chemical structure of OA (Mihara and Mochida, 2011; Lee et al., 2019). More offline studies, in particular those of the role of OA, should be undertaken to characterize aerosol hygroscopicity further.
Positive and negative artifacts have been evaluated for offline analyses of the concentrations of aerosol chemical components (Turpin et al., 2000; Chow et al., 2005). Sampling artifacts are inherent to offline analyses and might also affect offline hygroscopic growth measurements. However, the propriety of the offline method for quantifying aerosol hygroscopicity is not evaluated tentatively. Bias might arise from sampling artifacts by adsorption or evaporative loss of compounds and degradation of collected aerosol components, as in the case of the quantification of chemical components. Although full resolution of the degree of such artifacts is difficult, comparison between offline and online results from measurements of chemical composition and aerosol hygroscopicity is expected to constrain the possible magnitudes of artifacts and warrant the further utilization of offline methods.
In this study, we analyzed the hygroscopicity of submicrometer (PM0.95, 50 % cutoff diameter 0.95 µm) aerosol samples collected on Okinawa, a remote island in Japan. We interpreted results based on the chemical composition analysis, including the offline use of an aerosol mass spectrometer. Okinawa is considered a receptor site of aerosols from the Asian continent, thereby suited to characterizing the nature of the hygroscopicity of aged atmospheric aerosols after long-range transport. Although a few reports have described the relation between the chemical composition and the hygroscopicity on Okinawa (Mochida et al., 2010; Cai et al., 2017), no report of the relevant literature has described a study of their mutual quantitative relation. Here, based on measurements of the chemical composition of PM0.95 and the hygroscopic growth of the extracted water-soluble matter (WSM) in PM0.95, the hygroscopicity parameter κ of WSM, water-soluble organic matter (WSOM), and PM0.95 at 20 %–90 % RH are characterized. Factors responsible for the hygroscopicity parameters are assessed. This study, an extension of our online aerosol hygroscopicity study (Cai et al., 2017), aims at characterizing the RH and composition dependence of the hygroscopicity of aged aerosols after their atmospheric transport. In addition, from a methodological viewpoint, the offline analysis of the composition and hygroscopic growth using filter samples is assessed by comparison with online analysis.
2.1 Aerosol sampling and extraction
Aerosol samples were collected at Cape Hedo Atmosphere and Aerosol Monitoring Station (26.52∘ N, 128.15∘ E) of the National Institute for Environmental Studies, Japan, on Okinawa Island between 26 October and 9 November 2015. It is a receptor site of Asian outflow after long-range transport (Takami et al., 2007; Lun et al., 2014). The aerosols were collected daily on quartz fiber filters using a high-volume aerosol sampler (model 120B; Kimoto Electric Co., Ltd.) equipped with a cascade impactor (TE-234; Tisch Environmental, Inc.). Details of sampling periods for the respective samples are presented in Table S1. The respective means of the RH, air temperature, and wind speed during the sampling days were 75.4 %, 23.8 ∘C, and 3.8 m s−1. Precipitation was only observed on 30 October (Fig. S1). The PM0.95 samples collected on backup filters (area 391 cm2) were used for analysis. The quartz fiber filters were pre-combusted at 450 ∘C for 6 h before use. The high-volume sampler was placed on the rooftop of a station building. Its inlet was located about 4 m above the ground. The flow rate of the sampler was about 1100 L min−1. For each sample, about 1600 m3 of air was aspirated. Blank samples were collected by operating the sampler for only 10 s. After sample collection, the filter samples were stored in freezers for around 9 months or longer before the analyses. Possible degradation of some highly reactive compounds such as persistent radicals (Alpert et al., 2021) is not assessed in this study.
For offline analyses using the HTDMA and the AMS, WSM and water-insoluble organic matter (WISOM) in each aerosol sample were extracted as follows. First, three punches (34 mm diameter) from each filter sample were ultrasonicated with ∼ 3 g of water for 15 min. The solution was then filtered with a Teflon filter (0.20 µm, Millex-FG; Millipore Corp.). For each aerosol sample, the extraction was repeated three times and the WSM solutions were combined. Then, the WISOM in the same sample punches were extracted by ultrasonication with first 3 g of methanol once and then 3 g of dichloromethane methanol (, ) mixture three times. The extract solutions were filtered through the Teflon filter used for the filtration of WSM, and the solutions after filtration were combined. The combined WISOM solution was dried with a rotatory evaporator and was re-dissolved in dichloromethane methanol (, ) solution. For total organic carbon (TOC) analyses for WSM, three punches (diameter 34 mm) of each filter sample were extracted ultrasonically once with 20 mL of ultrapure water for 15 min before being filtered through a syringe filter; similarly, for ion chromatograph (IC) analyses for WSM, one punch with a diameter of 34 mm was extracted with 10 mL of ultrapure water (20 min ultrasonication) and then filtered (Müller et al., 2017b). The fair agreement between the mass concentrations of extracted OC from the offline AMS analysis, the performance of which has been well validated in the work of Chen et al. (2016), and those of OC from the thermal analysis supports the high extraction efficiency of organics by the solvent extraction.
2.2 Hygroscopic growth measurement for WSM
The hygroscopic growth factors (gf) of WSM at 20 %, 30 %, 40 %, 50 %, 60 %, 65 %, 70 %, 75 %, 80 %, 85 %, and 90 % RH in humidification and dehumidification branches were obtained using an HTDMA (Fig. S2a). For measurements, a WSM solution was nebulized using a homemade nebulizer equipped with a syringe pump to generate WSM aerosol particles. After the generated WSM aerosol was passed through a Nafion humidifier (NH1, 94 %–98 % RH; MH-110-12F-4; Perma Pure LLC), it was dried with two diffusion dryers in series containing silica gel (white, middle granule; Kanto Kagaku) and a molecular sieve (13X 4A mixture; Supelco and Sigma-Aldrich). The dried aerosol flow was transferred through an impactor (model 1035900; TSI Inc.) with a 0.071 cm diameter orifice in the front. It was then neutralized using an Am241 neutralizer. The neutralized aerosol was passed through the first differential mobility analyzer (DMA1, model 3081; TSI Inc.) in the HTDMA. The aerosol particles with a 100 nm dry diameter were selected. In humidification mode, 100 nm dry aerosol particles were then humidified using a second Nafion humidifier (NH2, MD-110-24S-4; Perma Pure LLC). In dehumidification mode, 100 nm dry particles were first humidified to >97 % RH using a third Nafion humidifier (NH3, MD-110-24S-4; Perma Pure LLC) before the particles were transferred to NH2.
The aerosol particles downstream of NH2 were scanned using a second DMA (DMA2, model 3081; TSI Inc.) coupled with a condensation particle counter (CPC, model 3775; TSI Inc.). The aerosol flow rates of both DMA1 and DMA2 were 0.3 L min−1. The RH values at the outlet of sheath flow of the DMA1, the inlet of NH2, the inlets of sample and sheath flows of the DMA2, and the outlet of sheath flow of the DMA2 were monitored using RH sensors (HMT337; Vaisala). During the experiment, the RH inside the DMA1 was lower than 10 %. The residence time from the outlet of the NH2 to the inlet of DMA2 was calculated as 13 s, which is close to the lower end of the recommended range of 10 to ∼ 40 s by Duplissy et al. (2009). The gf at 90 % RH in humidification and dehumidification branches was measured separately 1 month later than the gf at other RH levels. The gf is defined as the ratio of the mobility diameter of particles classified using DMA2 to the dry mobility diameter (100 nm), which was retrieved using the Twomey algorithm with consideration of transfer functions of the two DMAs as in the work of Mochida et al. (2010) (“T” in Eq. S2 in the reference should be omitted) but with modified data bins. The mode gf values of fitted lognormal distributions under different RH conditions were used to represent the hygroscopic growth of WSM and for the derivation of the hygroscopicity parameter (κWSM) following the κ-Köhler theory (Petters and Kreidenweis, 2007) as
where σ represents the surface tension at the solution–air interface; Mw and ρw denote the molecular mass and density of pure water, respectively; dwet stands for the product of gf and ddry (here 100 nm); R is the universal gas constant; and T is the absolute temperature. In Eq. (1), T of 298.15 K was used considering the temperature at the outlet of sheath flow of DMA2 (24.22–26.59 ∘C). The surface tension of pure water was σ. The equations used to calculate the density and surface tension of pure water and the densities of dry inorganic salts are the same as those used in the online thermodynamic Extended Aerosol Inorganics Model (E-AIM) (Sect. 2.5). Measurement data were used to derive gf and κWSM only if the RH values at the outlet of DMA2 met certain criteria (Text S1). Note that the assumption of 30 % lower σ than that of water (Facchini et al., 1999) results in a slight decrease in the calculated κWSM (0.8 %–3.4 %), which provides a guide to the uncertainty associated with surface tension.
Before hygroscopic growth measurements for aerosol extracts, the size selection performance of DMA1 and DMA2 was assessed using polystyrene latex (PSL) particles of standard size (Text S2). Furthermore, the hygroscopic growth of pure ammonium sulfate (AS, 99.999 % trace metals basis; Sigma-Aldrich) particles was measured following the same procedure as that for the WSM samples to confirm the HTDMA performance (Text S3). The gf of dry AS particles (RH = 7.22 ± 0.04 %) was measured to quantify the slight difference in sizing (1.9 %) between the two DMAs. This difference has been corrected for derivation of gf of WSM samples and AS particles. More details about the quality control of the offline analyses are presented in Text S4.
2.3 Chemical composition analyses
Ammonium, nitrate, sulfate, sodium, potassium, calcium, magnesium, chloride, and methane sulfonic acid (MSA) in WSM samples were quantified using an ion chromatograph (model 761 Compact IC; Metrohm AG). Concentrations of water-soluble organic carbon (WSOC) in WSM samples were determined using a total organic carbon analyzer (model TOC-LCPH; Shimadzu Corp.). The results are presented in Table S3.
To characterize the chemical structures of WSOM and WISOM and to quantify their concentrations, WSM and WISOM samples were analyzed using a high-resolution time-of-flight aerosol mass spectrometer (AMS; Aerodyne Research Inc.; DeCarlo et al., 2006) by nebulizing the solutions using Ar and by transferring the generated particles to the AMS. Before analysis by the AMS, the WSM aerosol flow was dried using two diffusion dryers filled with silica gel. The WISOM aerosol flow was dried by two diffusion dryers filled in series with activated carbon (to remove dichloromethane and methanol vapor) and silica gel. The AMS was operated in both V mode and W mode. The W-mode data were analyzed to obtain the atomic ratios of O to C (O:C), H to C (H:C), and organic mass to organic carbon (OM:OC) based on the Improved-Ambient method (Canagaratna et al., 2015) for WSOM and WISOM. The O:C and H:C of WSOM and WISOM were used further to derive their densities (Kuwata et al., 2012). The mass concentration of WSOM was calculated as the product of WSOC from the TOC analyzer and the OM:OC of WSOM. To validate the quantification of WSOM and derive the mass ratios of WISOM to WSOM, the mass spectra of WSOM and WISOM and those of the mixtures of phthalic acid and WSOM (or WISOM) from V-mode AMS analysis were used for their quantification (Text S5). The mass concentration of WISOM was calculated as the product of the mass concentration of WSOM and the mass ratio of WISOM to WSOM from the mass spectral analysis. The mass concentration of extracted organic matter (EOM) was defined as the sum of WSOM and WISOM. The mass concentration of water-insoluble organic carbon (WISOC) was derived by dividing the mass concentration of WISOM by the OM:OC of WISOM. The extracted organic carbon (EOC) was defined as the sum of WSOC and WISOC.
The concentrations of OC and elemental carbon (EC) in PM0.95 aerosol samples were obtained using a Sunset Laboratory carbon analyzer with the Interagency Monitoring of Protected Visual Environments (IMPROVE_A) temperature protocol and the thermal–optical transmission method. A filter punch of 16 mm diameter was used for the analysis, and the presence of carbonate carbon was not considered. Good agreement (Fig. S6) was found between EOC and OC, indicating high recovery of EOM. Table S4 summaries all offline measurements.
2.4 Concurrent online measurements of ambient aerosol
During the period of the filter sampling of PM0.95, the mass concentrations of non-refractory chemical components (sulfate, nitrate, ammonium, chloride, and organics) and black carbon (BC) in PM1 (50 % cutoff diameter 1 µm) were measured using the same AMS as that for the offline analysis, and a filter-based absorption photometer continuous soot monitoring system (COSMOS; Kanomax, Osaka, Japan) (Mori et al., 2014; Ohata et al., 2019). Furthermore, the number–size distributions of submicrometer aerosols were measured using a scanning mobility particle sizer (SMPS) composed of a DMA (model 3081; TSI Inc.) and a water-based CPC (model 3785; TSI Inc.). A schematic of the experimental setup for AMS and SMPS measurements is presented in Fig. S2b. The AMS was operated in both V + PToF mode and W mode with a time resolution of 30 min. The bulk mass concentrations of non-refractory aerosol components were derived from V-mode data. Composition-dependent collection efficiency (Middlebrook et al., 2012) was applied for quantification. The W-mode data were analyzed to obtain the O:C and H:C and densities of organics in the manner of the offline analysis. The SMPS measured the aerosol number–size distributions at diameters of 13.8–749.9 nm every 5 min. The DMA in the SMPS was operated with an aerosol flow rate of 0.3 L min−1 and a sheath-to-aerosol flow ratio of 10:1. Compressed dry pure air was supplied to the CPC through an equalizer to complement its total inlet flow rate of 1.0 L min−1. Temperature and RH of ambient air, wind speed and direction, and precipitation were measured using a weather sensor (model WXT520; Vaisala). The AMS was calibrated before both online and offline (Sect. 2.3) measurements using the same procedures as those reported by Deng et al. (2018). The SMPS was calibrated using standard-size PSL particles (Text S2) before ambient measurements. Furthermore, a hygroscopicity and volatility tandem differential mobility analyzer (H/V-TDMA) was deployed during 1–9 November 2015 to measure the size-resolved aerosol hygroscopicity and volatility. Related details have been presented by Cai et al. (2017). For comparison between offline and online data, the time windows for offline data were truncated to 10:00 to 10:00 Japan standard time (JST; 24 h). Online data were averaged for the 1 d periods (Table S1).
2.5 Prediction of WSM hygroscopicity based on E-AIM
Hygroscopic growth of the WSM sample for the water activity (aw) range of 0.10–0.99 was predicted without considering the water uptake by WSOM using the online aerosol thermodynamics model E-AIM III (http://www.aim.env.uea.ac.uk/aim/model3/model3a.php, last access: 1 August 2019; Clegg et al., 1998; Wexler and Clegg, 2002). The inorganic chemical components of WSM (sulfate, sodium, and ammonium) obtained from IC analysis and the WSOM obtained from TOC and offline AMS analyses were used for derivation. Potassium, calcium, magnesium, nitrate, and chloride were not considered in E-AIM because of their very low concentrations (Table S3). The RH-dependent hygroscopicity parameters of WSM, κWSM, were predicted from hygroscopic growth data following the κ-Köhler theory. The RH-dependent hygroscopicity parameters of water-soluble inorganic matter (WSIM) in each WSM sample, κinorg, were derived similarly to those for κWSM. Details of these derivations are presented in Text S6.
2.6 Estimating the hygroscopicity of WSOM, EOM, and PM0.95
The hygroscopicity parameters of WSOM (κWSOM), EOM (κEOM), and PM0.95 () were calculated on the assumption that the volumes of water retained by respective components are additive (Petters and Kreidenweis, 2007):
Therein, κWSM is the hygroscopicity parameter of WSM particles and κWSOM and κinorg denote hygroscopicity parameters of WSOM and WSIM, respectively. The and stand for the volume fractions of WSOM and WSIM, respectively, in WSM as derived from offline IC, TOC, and AMS analyses (Text S7).
The hygroscopicity parameter of EOM was estimated on the assumption that the hygroscopicity parameter of WISOM, κWISOM, is zero as
where and represent the volume fractions of WSOM and WISOM, respectively, in EOM (Text S7). With consideration of EC and WISOM but neglecting other water-insoluble inorganics in PM0.95, the hygroscopicity parameter of PM0.95 was also estimated.
Therein, , , and represent the volume fractions of WSM, WISOM, and EC, respectively, among the sum of these three components (Text S7). Here, the hygroscopicity of EC, κEC, was assumed to be zero.
3.1 Mass concentrations and composition of aerosol components
The atmospheric mass concentrations of chemical components in PM0.95 samples and their mass fractions are presented in Fig. 1 along with the mass concentrations of chemical components and number–size distributions of aerosols from online analyses. Offline analysis of PM0.95 samples indicated that sulfate was the most abundant (mean ± standard deviation 2.62 ± 1.70 µg m−3) throughout the observation period, followed by WSOM (0.86 ± 0.51 µg m−3), ammonium (0.59 ± 0.32 µg m−3), WISOM (0.11 ± 0.14 µg m−3), EC (0.10 ± 0.03 µg m−3), and sodium (0.07 ± 0.03 µg m−3). Accordingly, sulfate accounted for the largest mass fraction (59.4 %) among the quantified PM0.95 components, followed by WSOM (19.6 %), ammonium (13.3 %), WISOM (2.56 %), EC (2.36 %), and sodium (1.49 %). The contributions of potassium, magnesium, calcium, nitrate, and chloride to the PM0.95 samples were small: 1.23 % in total. WSOM accounted for a major fraction of EOM (mean of 91 % on a mass basis). This large proportion suggests that the studied aerosol was aged substantially, considering the much lower proportions against total OM in East Asian suburban (approx. 60 %; Müller et al., 2017a) and urban (27 %–45 %; Miyazaki et al., 2006) environments, which are based on our mass conversions, assuming factors of 1.8 and 1.2 to convert WSOC to WSOM and WISOC to WISOM (Müller et al., 2017a, and references therein), respectively. The mass ratio of EC to EOM was on average 11 %, which is similar to the proportion of total OM (12 %) based on earlier reported OC:EC over the Sea of Japan and offshore of Japan (Lim et al., 2003; a factor of 2.1 – Turpin and Lim, 2001 – was assumed to convert OC to OM). As shown in Fig. 1d, the aerosol number–size distribution shows bimodal or broad unimodal characteristics.
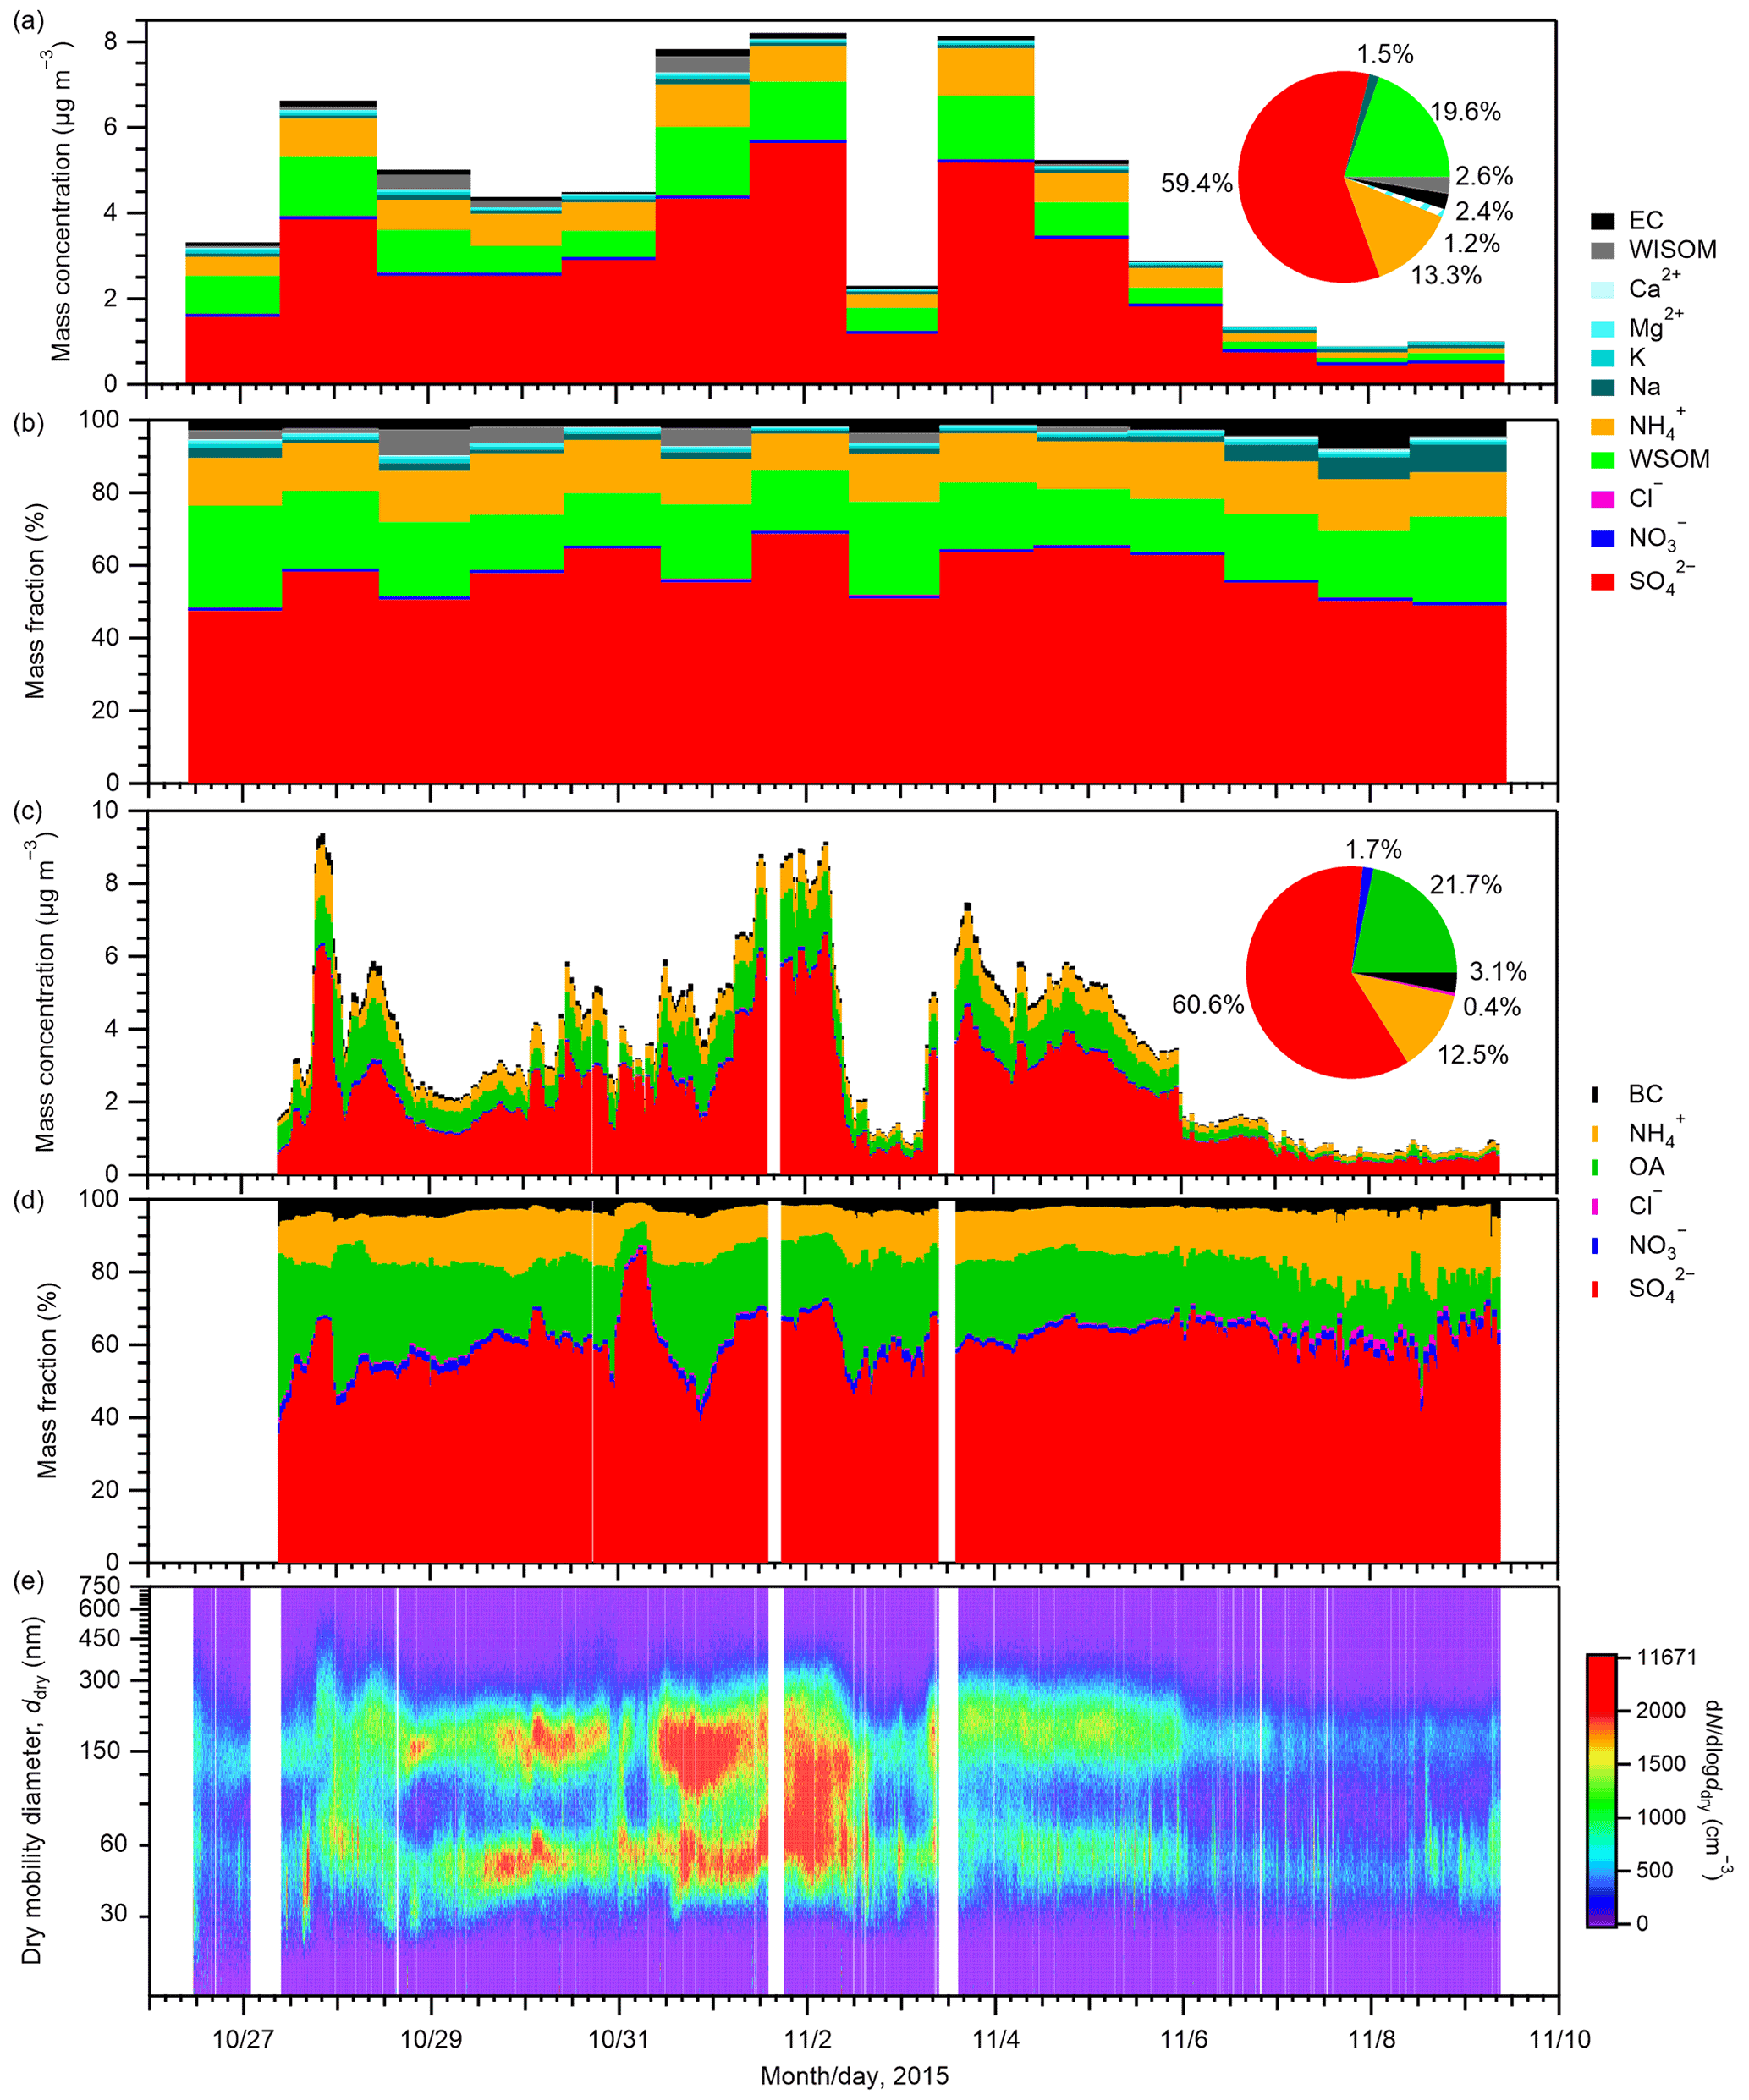
Figure 1(a) Mass concentrations of chemical components in PM0.95 and (b) their mass fractions from offline analyses. (c) Mass concentrations of PM1 components and (d) their mass fractions and (e) number–size distributions of aerosol particles from online analyses. Related online BC data have been published by Koike and Oshima (2018). The pie charts in panels (a) and (c) show the mean fractions of each compound calculated from their mean mass concentrations based on offline and online analyses, respectively. The patterned wedge in the pie chart in panel (a) represents the total mass fraction of K+, Mg2+, Ca2+, Cl−, and NO. The composition and size distribution of the aerosols at the study site are also discussed in Cai et al. (2017).
For sulfate, organics, ammonium, and EC (BC), the relative abundances among them from the offline analysis showed moderate agreement with those from the online analysis (61.7 %, 22.2 %, 13.7 %, and 2.4 % for sulfate, EOM, ammonium, and EC, respectively, from offline measurements during the period with effective data). The coefficients of determination (r2) of the mass fractions of sulfate, organics, ammonium, and EC (BC) in those four aerosol components from offline and online analyses were 0.62, 0.32, 0.23, and 0.08, respectively (Fig. S7). Whereas the absolute concentrations of the aerosol are not crucially important for the offline analysis of aerosol hygroscopicity, high positive correlations between online and offline measurements for sulfate, organics, ammonium, and EC (BC) (the r2 values of which are 0.90, 0.82, 0.92, and 0.76, respectively; Fig. S7) support agreement between offline and online analyses. Note that the r2 values of the mass fractions between offline and online analyses were lower than those of the mass concentrations. This may be in part because the mass fractions of respective components are influenced by the uncertainties in the mass concentrations of respective components and also by those of the summed concentrations. In addition, smaller variations in the mass fractions as compared to the mass concentrations may result in larger contributions of the uncertainties to r2. The average mass concentrations of sulfate, organics, and ammonium from online measurements were 77 %, 76 %, and 71 %, respectively, of offline results. Lower concentrations might result from uncertainty in the collection efficiency of the online AMS analysis (Takegawa et al., 2009) and from different size windows for offline PM0.95 sampling and online AMS analysis. Sampling bias of organics or ammonium by absorption/evaporation does not explain the difference because sulfate measurements should not be influenced largely from positive/negative artifacts, considering sulfate's low volatility (Johnson et al., 2004) and the reported absence of SO2 artifacts for filters of other types (Eldred and Cahill, 1997). The mean mass concentration of BC from online analysis was almost equal to those of EC from the offline analysis: the ratio of the former to the latter was 1.02.
Figure 2 presents backward air mass trajectories for PM0.95 sampling. For most days, the 3 d trajectories passed over the Asian continent and/or the Japan archipelago, but maritime air masses also arrived at the observation site during 6–8 November 2015. A comparison between air mass trajectories and aerosol concentration data shows that maritime air masses during 6–8 November are characterized by lower aerosol mass concentrations but higher mass fractions of sodium (≥ 5 %) than the other days influenced by continental air masses (Figs. 1a and b and 2). The mean mass concentrations of sulfate, WSOM, ammonium, and EC from offline analyses during 6–8 November were, on average, one-sixth, one-fifth, one-fifth, and one-half, respectively, of those during other days, whereas the mean mass concentration of sodium during the period (0.07 µg m−3) was similar to that of other days (0.06 µg m−3) (Table S3).
Two types of composition related to aerosol hygroscopicity were investigated: the O:C of organics and the molar ratio of ammonium to sulfate (after omitting sulfate that was preferentially neutralized by sodium) (; Text S7), which represents the degree of neutralization of sulfate by ammonium and sodium. For the derivation of , the neutralization of sulfate by other cations was not considered because their contributions were small. The O:C of EOM from PM0.95 samples is presented in Fig. 3a. The mean ± standard deviation of the ratio was 0.78 ± 0.08. Although the value was 18 % lower than that of the mean O:C of OA from the online analysis of PM1 (0.95 ± 0.09), they were in good agreement (r2=0.58; Fig. S8). The O:C values of EOM were in the range of 0.64–0.94, suggesting a highly aged nature of the observed OA (Canagaratna et al., 2015). The values from PM0.95 samples are presented in Fig. 3b: the mean ± standard deviation was 1.45 ± 0.34. The results suggest that except for the aerosols on 7 and 8 November, the studied aerosols were fairly acidic. To compare the offline and online analyses, was also derived by ignoring the neutralization of sulfate by sodium, which is presented as (Fig. 3b). The mean ± standard deviation of from the offline analysis (1.29 ± 0.21) was similar to that from the online analysis (1.29 ± 0.40). The two also showed good agreement (r2=0.52; Fig. S8). If a portion of sulfate was in the form of sodium sulfate at the time of online AMS analysis, then this fraction might not have been detected considering the high melting temperature of the salt. However, the offline analysis suggests that the fraction of sulfate neutralized by sodium was, on average, only 5 %. Hence, it is not expected to affect the comparison strongly. Further comparisons between offline and online analyses based on mass spectra of organics are presented in Text S8.
On 7 and 8 November, the days under the influence of maritime air masses, the O:C and from the offline analysis values were lower and higher, respectively, than those during other periods when the air masses were from the Asian continent and/or the Japan archipelago (Figs. 2 and 3). In addition, comparison between and from the offline analysis shows that sodium neutralized a larger fraction of sulfate on the two dates. The results suggest that air masses from the Asian continent transported more aged and acidic aerosol and that air masses from the North Pacific included less oxygenated and more neutralized aerosol. However, it is noteworthy that the possible influence of the external mixing state on the neutralization of aerosols is not considered. The more acidic nature of the continental aerosol is expected to be contributed by the formation of sulfate during the transport. In addition, the oxidation of MSA from marine biological activity is expected to contribute to sulfate. The low relative abundance of sodium in the continental aerosol also accounted for the more acidic nature.
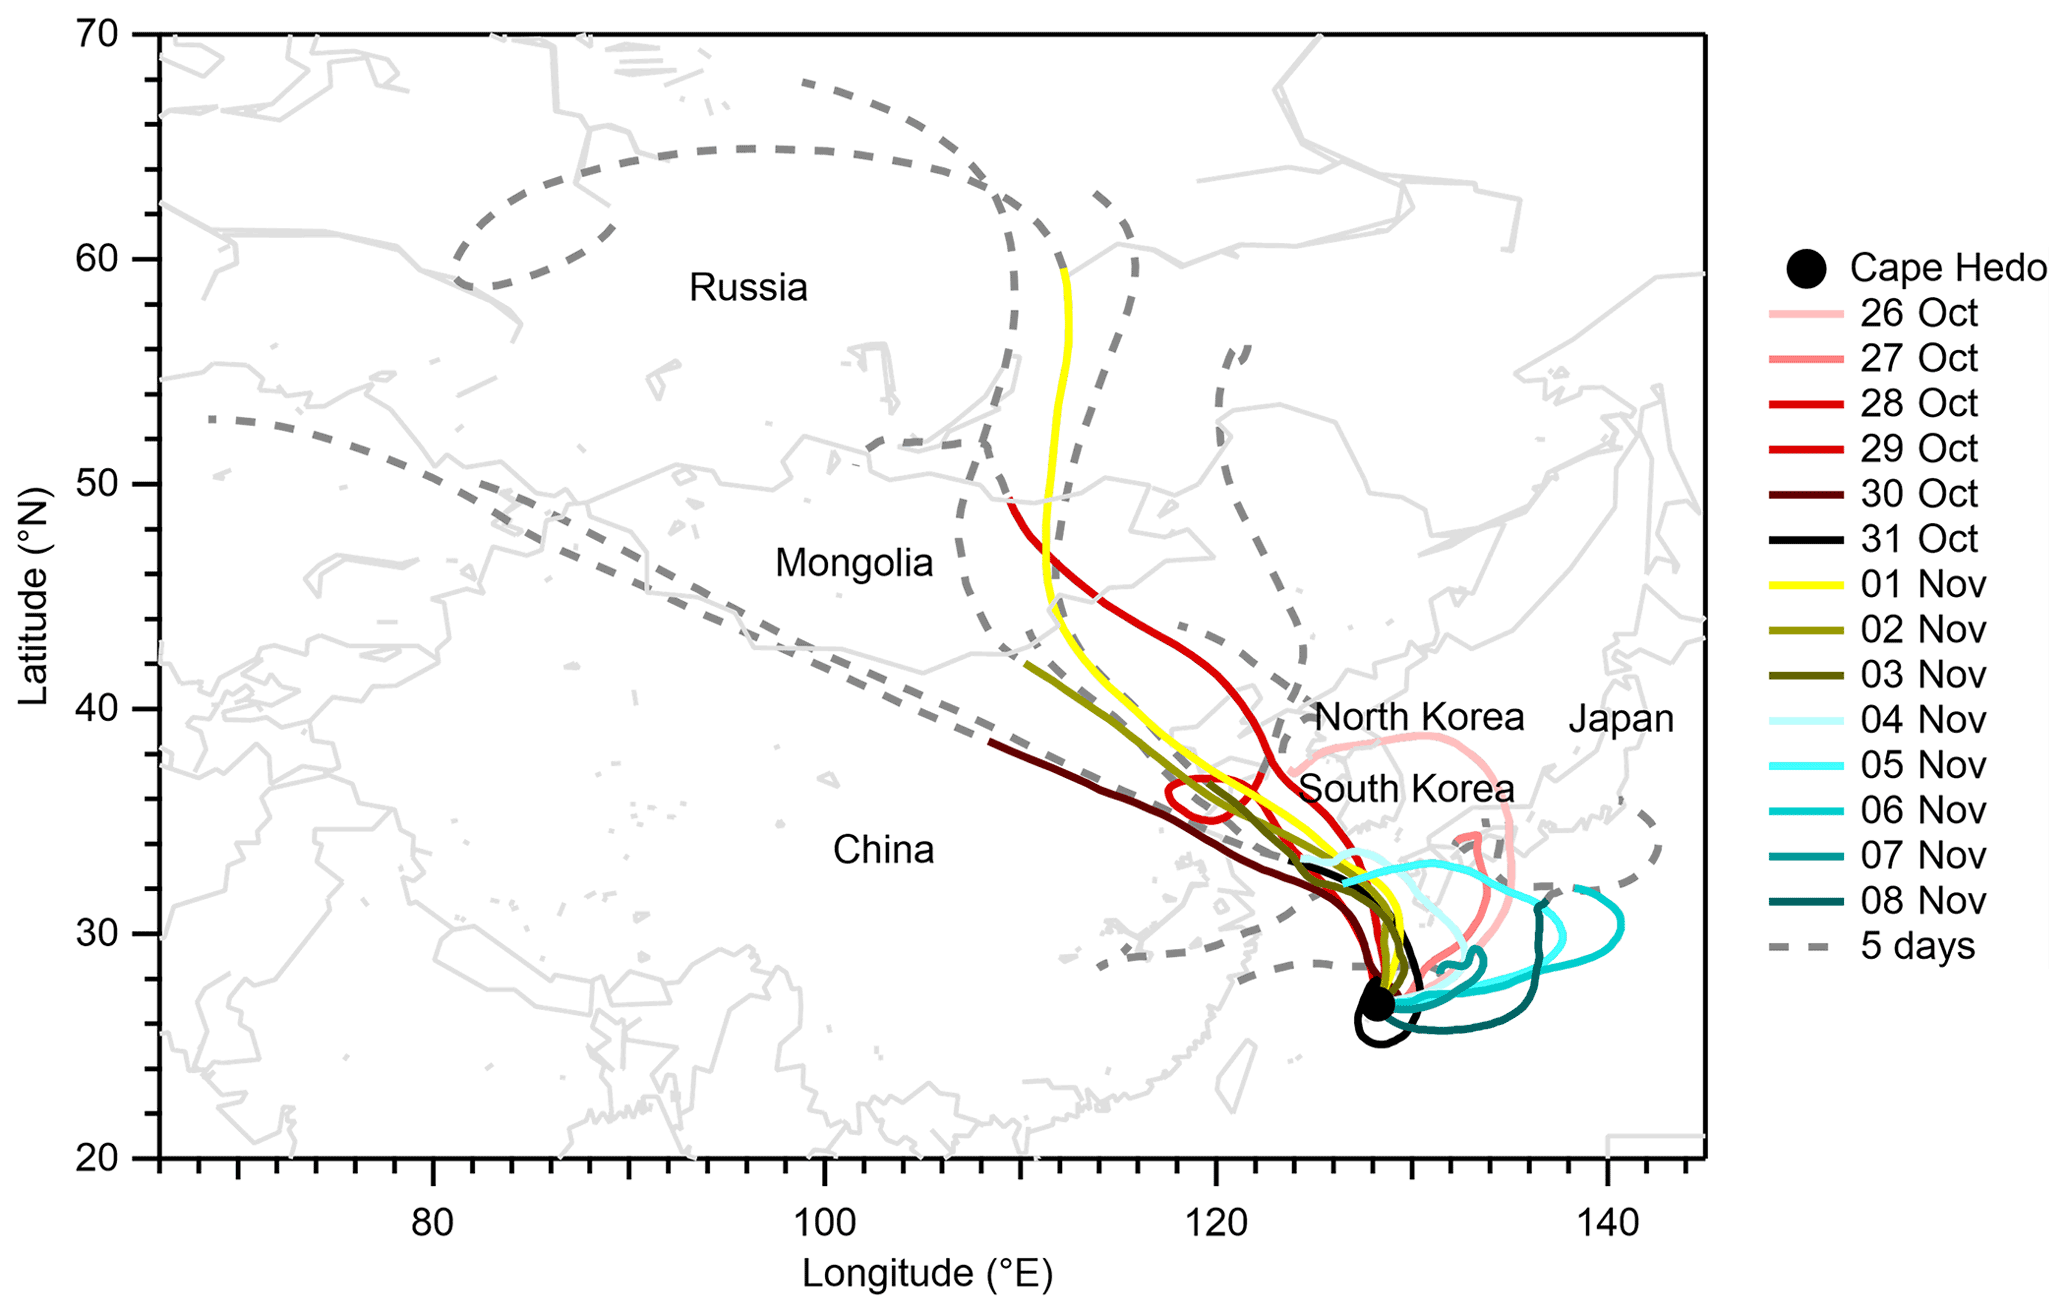
Figure 2Daily air mass trajectories arrived at 500 m above the observation site at 14:00 JST. The solid colored lines represent the 3 d trajectories. The solid colored lines together with their respective extended dashed gray sections indicate the 5 d trajectories. The solid circle represents the observation site location. The map is based on GSHHG 2.3.4; the shoreline polygon data in a crude resolution are used. Trajectories were produced using the NOAA HYSPLIT atmospheric transport and dispersion modeling system (Draxler and Hess, 1998).

Figure 3(a) The O:C of EOM from the offline analysis of PM0.95 samples (bars) and that of OA from the online AMS analysis (open circles). (b) The degree of neutralization of the remaining sulfate (after preferentially being neutralized by sodium; Text S7) by ammonium from the offline analysis of PM0.95 samples (; unfilled bars), the degree of neutralization of sulfate by ammonium (without considering sodium) () from the offline analysis (filled bars), and the online AMS analysis (solid line). The values of NH4HSO4, (NH4)3H(SO4)2, and (NH4)2SO4 are shown as dashed lines in panel (b). In panel (a), the missing O:C during 28–31 October is due to the malfunction of the chopper in the W-mode online measurement.
3.2 Hygroscopicity of WSM and PM0.95
The means ± standard deviations of the measured gf values for WSM particles are presented in Fig. 4 and Table S5. The mean gf values predicted from E-AIM without consideration of the water retained by WSOM are also shown in the figure. The gf values of the respective WSM samples are presented in Fig. S11. While gf smaller than unity was reported and interpreted as a result of restructuring of non-spherical particles (Gysel et al., 2004; Jung et al., 2011), the gf of nearly unity or greater for WSM particles in our study (>0.997) means that such a phenomenon was not evident. This may be owing to the humidification using NH1 followed by drying in diffusion dryers prior to the HTDMA analysis, which may avoid fast water evaporation and formation of cracks or cavities (Gysel et al., 2004). The means ± standard deviations of gf at 40 %, 60 %, and 85 % RH in the humidification (dehumidification) branch were 1.04 ± 0.02 (1.09 ± 0.03), 1.13 ± 0.05 (1.22 ± 0.01), and 1.53 ± 0.03 (1.53 ± 0.02), respectively (Table S5). The obtained gf of WSM at 90 % RH (gf(90 %)) was slightly lower than that of the WSM from Chichijima (1.76–1.79), which was also influenced by transport from East Asia but was much farther to the east of the Asian continent compared with Okinawa (Boreddy et al., 2014; Boreddy and Kawamura, 2016). It was also lower than the mean values for WSM during a cruise over the East China Sea (1.99; Yan et al., 2017) which was nearer the Asian continent. On the other hand, the obtained gf (90 %) of WSM was higher than that of the WSM obtained during a cruise in the Bay of Bengal (1.25–1.43; Boreddy et al., 2016), which was influenced by anthropogenic or biomass burning air masses. For three studies (Boreddy et al., 2014; Boreddy and Kawamura, 2016; Yan et al., 2017), the WSM were extracted from total suspended particles that contain higher mass fractions of inorganics and sea salts than those examined for this study. By contrast, the WSM in the last referenced study (Boreddy et al., 2016) was extracted from PM2.5 (50 % cutoff diameter 2.5 µm) with higher mass fractions of organics. These compositional differences should explain the observed differences in gf (90 %).

Figure 4The mean of (a) measured and E-AIM-predicted gf for WSM particles as a function of RH and (b) measured and E-AIM-predicted κWSM as a function of RH. (c) The κ values for WSM from respective PM0.95 samples in dehumidification (dehum) branches. In panels (a) and (b), results from both humidification (hum) and dehumidification branches are presented. In the predictions in panels (a) and (b), water retained by WSOM is not considered. Results obtained for the dehumidification branch were obtained by assuming that no solid is formed under any RH condition.
Hysteresis of the hygroscopic growth of the WSM particles was observed for most samples except for those collected on 26 October and 2 and 6 November (Fig. S11). The hysteresis was expected to have been caused by the influence of inorganic salts, as indicated by the differences in the predicted hygroscopic growth in humidification and dehumidification branches from E-AIM, where only the water retained by inorganics is considered. Being different from the observation, the hysteresis was predicted for almost all samples, which might result from the uncertainty in the quantification of inorganic salts and/or the influence of organic components on the hygroscopicity of WSM (Choi and Chan, 2002). The deliquescence of WSM in the humidification branch was observed in the RH of 50 %–70 %. In this branch, the WSM shows prominent water uptake at RH as low as 20 % (Fig. 4a), being in contrast to the absence of hygroscopic growth of pure AS (Fig. S3). Water uptake of WSM at low RH in the humidification branch can be enhanced under highly acidic conditions (Sect. 3.1) and/or in the presence of WSOM (Gysel et al., 2004). In the dehumidification branch, efflorescence was not evident down to 30 % RH for most samples, indicating the existence of metastable conditions to retain water after experiencing high RH. The samples collected on 7 and 8 November, all characterized by a large sodium fraction, showed clearer efflorescence behavior at 40 % RH (Fig. S11). The high efflorescence RH (ERH) of sodium sulfate (57 %–59 %) (Tang, 1996) might have been associated with the observed efflorescence. In addition, the high (2.01 and 1.97, respectively) on these two dates could have contributed to the high ERH, which is supported by the distinctive ERH among different forms of ammoniated sulfate (Tang and Munkelwitz, 1994). Whereas the external mixing state of atmospheric aerosol is lost by filter sampling, the former possibility implies that the sea-salt component enhances the ability to effloresce once mixed with other inorganic components. This characteristic, however, is expected to be important only if such aerosols are transported to drier environments.
The obtained gf values as a function of RH were converted to corresponding κ values. The means ± standard deviations of the measured κ values for WSM as a function of RH are presented in Fig. 4b and Table S5. The κ values from E-AIM by ignoring the water uptake by organics are also shown in the same figure. The κWSM values of respective WSM samples are presented in Fig. S12. In the humidification branch, the measured κWSM values averaged for each RH were 0.17–0.24 (at 20 %–50 % RH) and 0.50–0.56 (at 70 %–90 % RH) below and above, respectively, the marked increase in κWSM with the increase in RH, presumably indicating the deliquescence of major inorganic salts. Comparison between measured κWSM and predicted κWSM shows that, on average, the measured κWSM values were greater than predictions for all RH, suggesting the ubiquitous contributions of WSOM to the measured κWSM. The results at RH <70 % deviated more from the 1:1 line than those at RH ≥ 70 % RH (Fig. S13), which might indicate dominant contributions of WSOM to κWSM at low RH for some aerosol samples (Gysel et al., 2004; Aggawarl et al., 2007).
In the dehumidification branch, except for the case at 20 % RH, where the corresponding κ value was 0.17, the κ values of WSM were modestly high, with values of 0.42–0.57. The lack of a large dependence on RH suggests that efflorescence did not occur. Even if it did, it was for minor fractions of inorganics. The contribution of WSOM to the hygroscopicity of WSM was evident from the fact that, except the sample collected on 1 November, the E-AIM-predicted κ values, by ignoring the water retained by WSOM at RH ≥ 65 %, were lower than the measured values (Fig. S12). The κ values of WSM from respective PM0.95 samples in dehumidification branches are presented in Fig. 4c. At high RH (≥ 65 %), the difference in κWSM among different samples was small compared with that at low RH, indicating that the difference in the composition among aerosol samples did not result in large variation in the hygroscopicity of WSM in these RH conditions. Clear variations in hygroscopicity among samples at low RH can be explained by the influence of the degree of neutralization of inorganic salts and the abundance of organics. For example, the κWSM on 1 November at ≤ 60 % RH was higher than on other days, which was likely to be related to a low ratio (approx. 0.80), as evidenced by the large E-AIM-predicted κWSM on this day (Fig. S12); the κWSM on 26 October was lower than that on other days, which might be explained by the high mass fraction of WSOM (Fig. 1b) in addition to the high (1.66). The contribution of chemical composition will be discussed further in later sections.
By considering the atmospheric concentrations of WISOM and EC, the κ values of PM0.95 were estimated (Table S5). In the humidification branch, the values were 0.16–0.22 and 0.47–0.53 without (20 %–50 % RH) and with (70 %–90 % RH), respectively, the deliquescence of WSM particles (Table S5). In the dehumidification branch, except for the case at 20 % RH, where the corresponding was 0.16, they were in the range of 0.40–0.54 (Table S5). At 90 % RH, was in the range of 0.47–0.52, which is higher than that measured at a supersite in Hong Kong (0.18–0.48 with ddry of 100 and 200 nm; Cheung et al., 2015) that was influenced by clean maritime air masses and/or polluted Asian continental and coastal inflows.
Figure 5 presents a comparison of calculated at 85 % RH with that for 40–200 nm particles from the online analysis (κonline) at 85 % RH during the same observation period. The time series of the mean gf of particles with different dry diameters are presented in Fig. S14. The estimated range of at 85 % RH (0.49–0.51) was within the range of κonline (0.44–0.51) for ambient aerosol particles. Furthermore, the and κonline at 85 % RH for 200 nm particles are compared for the days when both data are available (Fig. 6). Moderate positive correlations were found (r2 of 0.37 and 0.42 for dehumidification and humidification branches, respectively), although the particle hygroscopicity stayed high and the variation was small during the campaign. In addition, all data are within ∼ 15 % of the 1:1 line (Fig. 6). The absence of strong correlations may be because the offline/online data were for different size ranges, and because online data only represent fewer than 2 % of the aerosols in a day whereas offline data represent more than 95 % of aerosols in a day. Results obtained from comparison of and κonline indicate that offline aerosol hygroscopicity analysis can be used as an alternative method, at least for the studied type of aerosols, for which the sampling bias for semi-volatile ammonium nitrate is not significant because of its low abundance.
The mean number and volume concentrations as a function of the dry particle diameter are also depicted in Fig. 5. The clear bimodal shape of the mean aerosol number–size distribution with Aitken and accumulation modes suggests that the aerosols experienced in-cloud processing (Mochida et al., 2011; Hoppel et al., 1986). Similar high hygroscopicity of particles in the Aitken mode (40 nm diameter) and the accumulation mode (150 and 200 nm diameters) suggests the dominance of sulfate in both modes (Mochida et al., 2011). The mean aerosol volume–number concentration presented unimodal distribution with a mode diameter of 260 nm, indicating that aerosol mass in the accumulation mode dominates the total aerosol mass in the submicrometer size range. With regard to the influence of aerosol hygroscopicity on aqueous-phase chemical reactions on a mass basis, the hygroscopicity of large aerosol particles in the accumulation mode might be more important. Offline analysis extended the online hygroscopic analysis of <200 nm particles to the whole submicrometer size range, where most of the aerosol liquid water mass should exist. Most HTDMAs are not applicable to the measurements of the hygroscopicity of dry particles larger than 500 nm (Tang et al., 2019), although techniques to measure >500 nm particles have also been developed, for example based on the usage of optical particle counters (Sorooshian et al., 2008; Tang et al., 2019). Comparison with the κ of ambient particles with ddry of 300 nm or larger in previous studies shows that the mean of κ at 85 % RH for PM0.95 from our study (0.47) is larger than the mean κvalues of 300–360 nm particles in an urban site (0.32–0.33; Kawana et al., 2016) and a forest site (0.34–0.40; Kawana et al., 2017; Deng et al., 2019) in East Asia.

Figure 5Comparison of κ at 85 % RH for PM0.95 () in humidification and dehumidification branches and that from online analyses (κonline) during the same observation period. Markers and whiskers represent mean values and standard deviations, respectively. The mean number–size and volume–size distributions of atmospheric aerosols are also shown. The size distribution and κonline of the aerosols at the study site are also discussed in Cai et al. (2017).
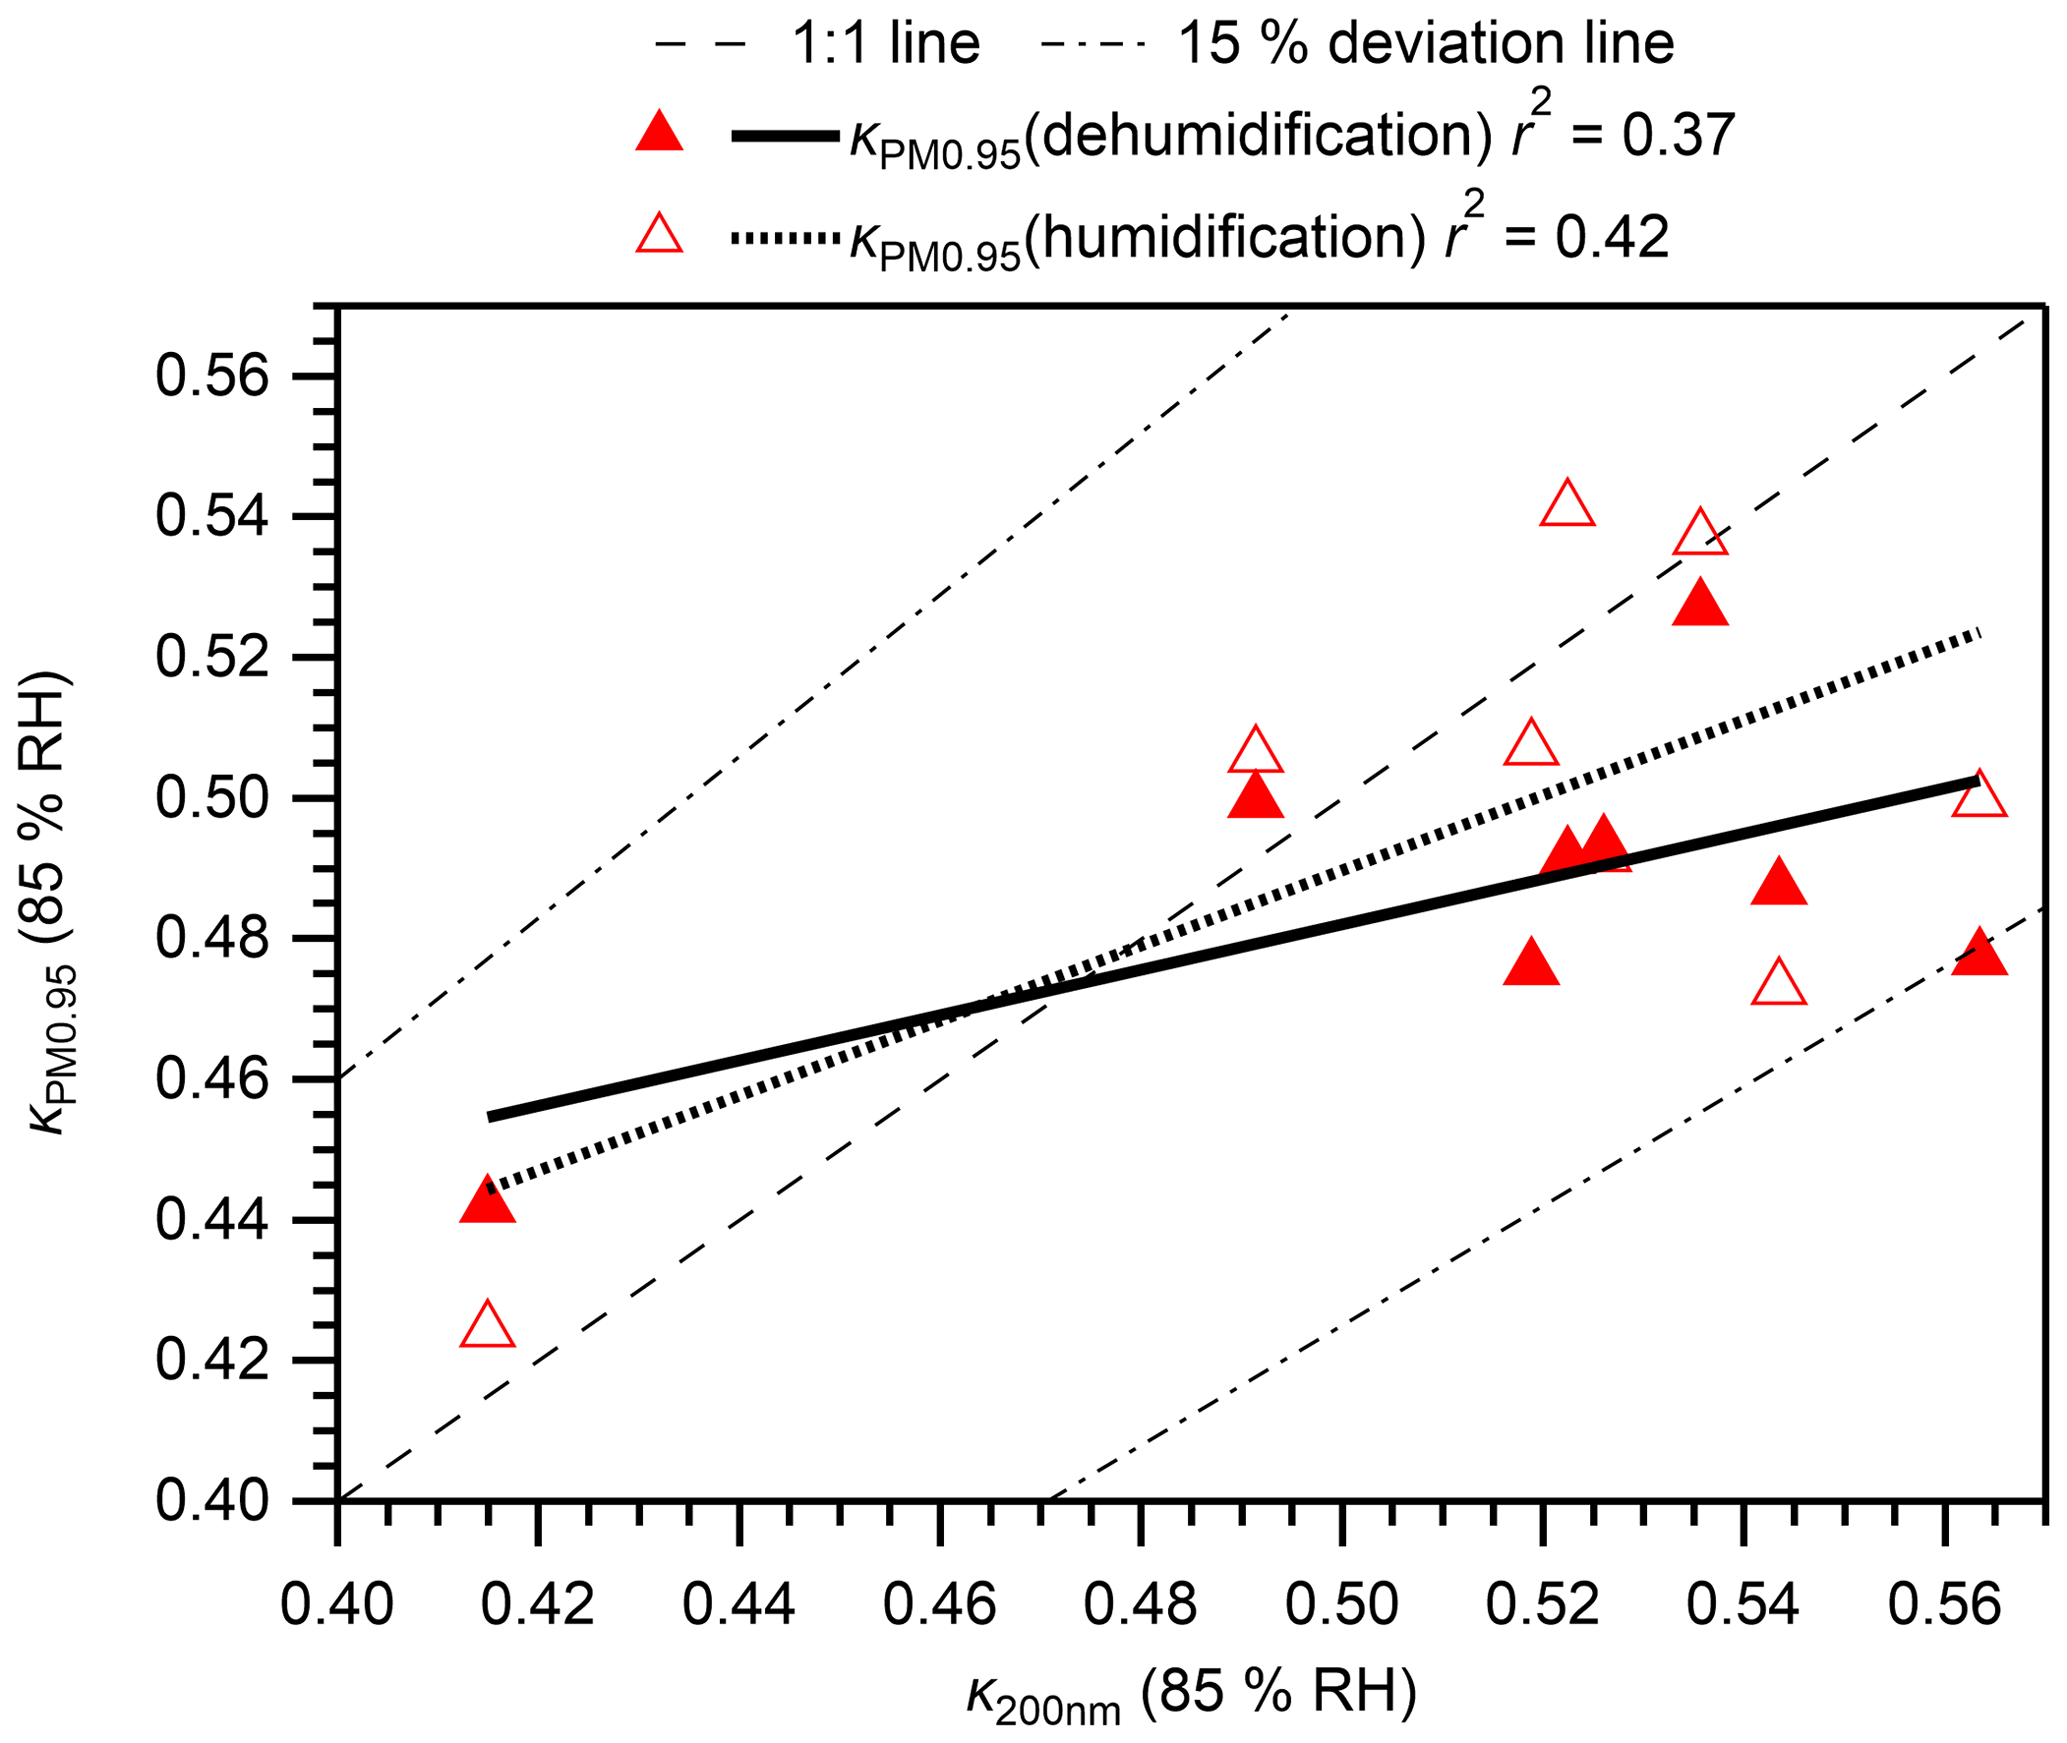
Figure 6Comparison of calculated κ for PM0.95 () in humidification and dehumidification branches and κ for 200 nm atmospheric particles from online HTDMA analysis. Regression lines, the 1:1 line, and 15 % deviation lines are also presented. It is noteworthy that online data only represent fewer than 2 % of the aerosols in a day, whereas offline data represent more than 95 % of aerosols in a day (10:00–10:00 JST).
3.3 Hygroscopicity of WSOM and EOM
The hygroscopicity parameters of WSOM and EOM were calculated based on κWSM from measurements in the dehumidification branch and the predicted water uptake by inorganic salts (Eqs. 2 and 3). The results are presented in Fig. 7 and Table S5. At 75 %–85 % RH, where the deviation of the measured κ of AS from that predicted from E-AIM was slight (≤ 5 %; Fig. S3), κWSOM values were 0.19–0.22. Those values were higher than the κ of WSOM from US national parks and Storm Peak Laboratory (0.05–0.15 at 90 % RH; Taylor et al., 2017) and from fresh Indonesian peat burning particles (0.18 at 85 % RH; Chen et al., 2017). In the same RH range, κEOM was in the range of 0.17–0.20 and was, on average, 11 % lower than that of κWSOM. The κEOM from this study was higher than the κ of OA in the western and central Los Angeles Basin that was influenced by marine air masses (0.14 at 74 %–92 % RH; Hersey et al., 2011). It was also higher than the κ values of OA that were influenced by marine air masses over the continental United States, Canada, the Pacific Ocean, and the Gulf of Mexico and were aged (O:C = 0.93 ± 0.30) (0.13 at 70 %–95 % RH; Shingler et al., 2016). However, it might be lower than the κ of OA at a supersite in Hong Kong, for which only an upper limit value of 0.29 (at 90 % RH) was reported (Yeung et al., 2014). It is noteworthy that the estimated mean κWSOM and κEOM of approx. 0.2 is higher than the default κ value of organics (κorg) of 0.14 used in an atmospheric aerosol model (Kawecki and Steiner, 2018). The different κorg values of different types or different atmospheric regions reported in this study and earlier studies described above suggest the importance of considering different κorg values depending on the types and origins of OA in model calculations. The κWSOM and κEOM values derived from the measurement in the humidification branch at 85 % RH where WSM particles would be mostly or fully dissolved in water are also presented in Table S5. The mean values in the humidification branch were slightly higher than those in the dehumidification branch, but the characteristics explained above also apply to this condition. The fractional contributions of WSOM to the water uptake by WSM and PM0.95, represented as ( × κWSOM) κWSM and ( × κWSOM) , respectively, are presented in Table S6. The contribution of WSOM to the water uptake by WSM and PM0.95 was 10 %–12 % at 75 %–85 % RH.
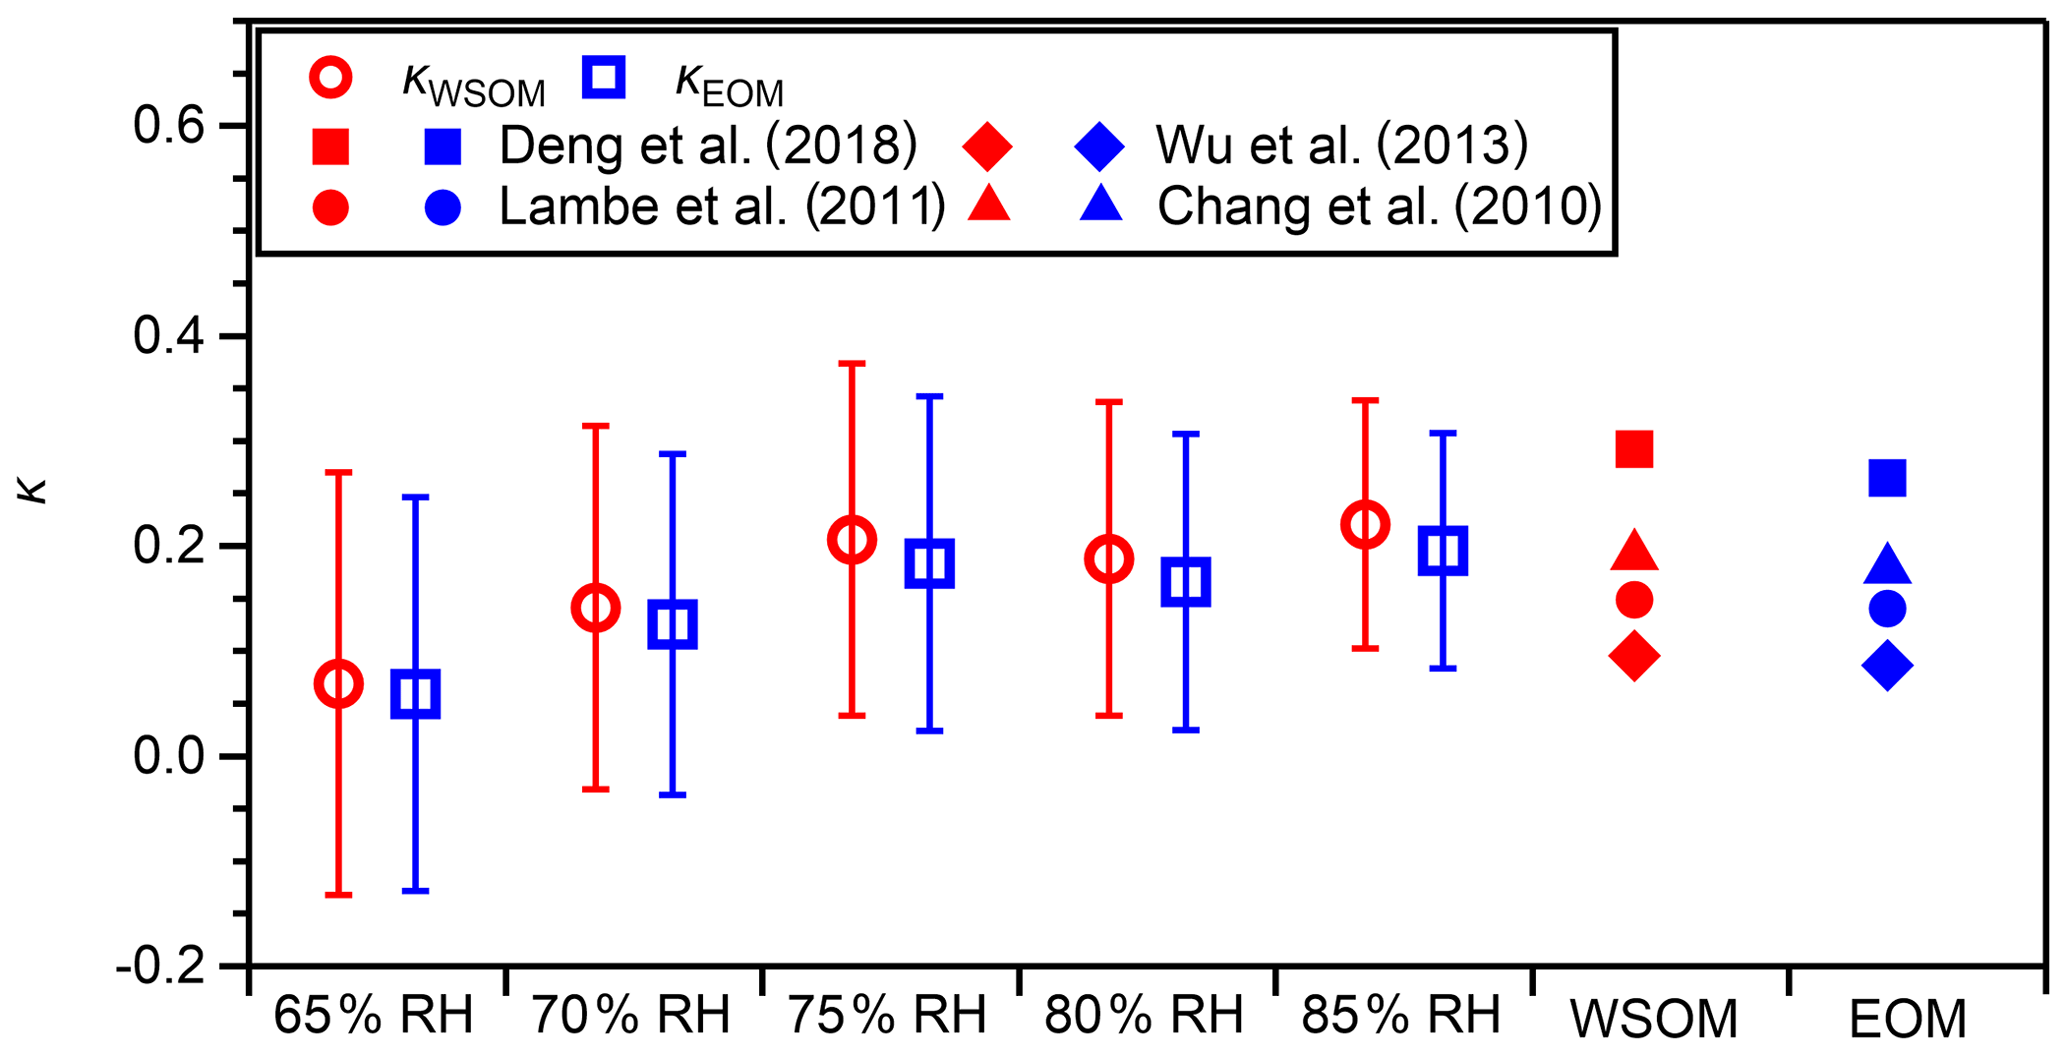
Figure 7Estimated hygroscopicity parameter values of WSOM (κWSOM) and EOM (κEOM) under different RH conditions in dehumidification branches. Open markers represent mean values. Whiskers represent standard deviations of the related mean value. The hygroscopicity parameter values of WSOM and EOM predicted based on regression lines reported for the hygroscopicity parameter values of organics and their O:C (Chang et al., 2010 (0.42 ± 0.04 % supersaturation); Lambe et al., 2011 (0.1 %–1.5 % supersaturation); Wu et al., 2013 (90 % RH); Deng et al., 2018 (0.11 %–0.80 % supersaturation)), where mean values of the O:C of WSOM (0.84, red markers) and of EOM (0.79, blue markers) were used.
The high κWSOM and κEOM values are reasonably explained by the high O:C ratios of WSOM and EOM on a mean basis. The mean O:C values of WSOM and EOM were 0.84 and 0.78, from which κWSOM and κEOM were estimated to be 0.19 and 0.18, respectively, based on the reported regression lines between κorg and O:C under sub-saturated and supersaturated conditions (0.42 ± 0.04 % supersaturation – Chang et al., 2010; 0.1 %–1.5 % supersaturation – Lambe et al., 2011; 90 % RH – Wu et al., 2013; 0.11 %–0.80 % supersaturation – Deng et al., 2018) (Fig. 7). Although there may be some difference in the κorg values between sub-saturated and supersaturated conditions, we regard our comparison as meaningful because the difference could be small (Liu et al., 2018; Kuang et al., 2020). Correlations of κWSOM and κEOM with the O:C were weak (Fig. S15, dehumidification branch). That weakness, however, should not contradict earlier reported positive correlation between κorg and O:C, given the narrow range of O:C observed in this study (0.64–0.94). The absence of correlation might also be related to the fact that the O:C values of WSOM and EOM fall in the plateau in the high O:C range reported by Cappa et al. (2011), who reported sigmoidal dependence of the hygroscopicity of OA on the O:C.
3.4 Factors affecting the hygroscopicity of WSM and PM0.95
The discussion presented in earlier sections indicates that the water uptake of WSOM and the degree of neutralization of the inorganic components influence the hygroscopicity of WSM. Here, the influences of the mass fraction of WSOM (fWSOM) and on κWSM and at 20 %–90 % RH are assessed in light of the variations in the hygroscopicity. Although the variations in κWSM and may also be contributed by other factors (e.g., presence of minor inorganic ions, possible variation in κWSOM, and non-additivity of the contributions of WSOM and WSIM to the water uptake), they are not assessed here.
The relation between fWSOM and κWSM at 20 %–90 % RH in the dehumidification branch is presented in Fig. 8a and b. Despite the narrow range of fWSOM, moderate negative correlation between fWSOM and κWSM was observed for all RH conditions, except for 90 % RH, indicating the importance of the relative contributions of WSOM and WSIM (mainly sulfate + ammonium) to the hygroscopicity of WSM. The poor correlation between fWSOM and κWSM at 90 % RH in the dehumidification branch was probably attributable to measurement uncertainty, which is supported by the high correlation between fWSOM and κWSM in the humidification branch (Fig. 8b). This dependence is explained by the low hygroscopicity of WSOM compared to that of WSIM. The shaded areas in Fig. 8b represent κWSM predicted by application of a mean (i.e., fixed) value of κinorg and mean ± standard deviation of κWSOM for 85 % RH using Eq. (2). The prediction captures the measured dependence of κWSM on fWSOM at 85 % RH, supporting the importance of fWSOM. As in the case of κWSM, dependence of on the mass fraction of EOM in PM0.95 (fEOM) in the dehumidification branch was also observed for ≥ 60 % RH except for 90 % RH (Fig. S16a and b). The result suggests that the mass fractions of organic components played an important role in the variation in the hygroscopicity of aerosol particles.
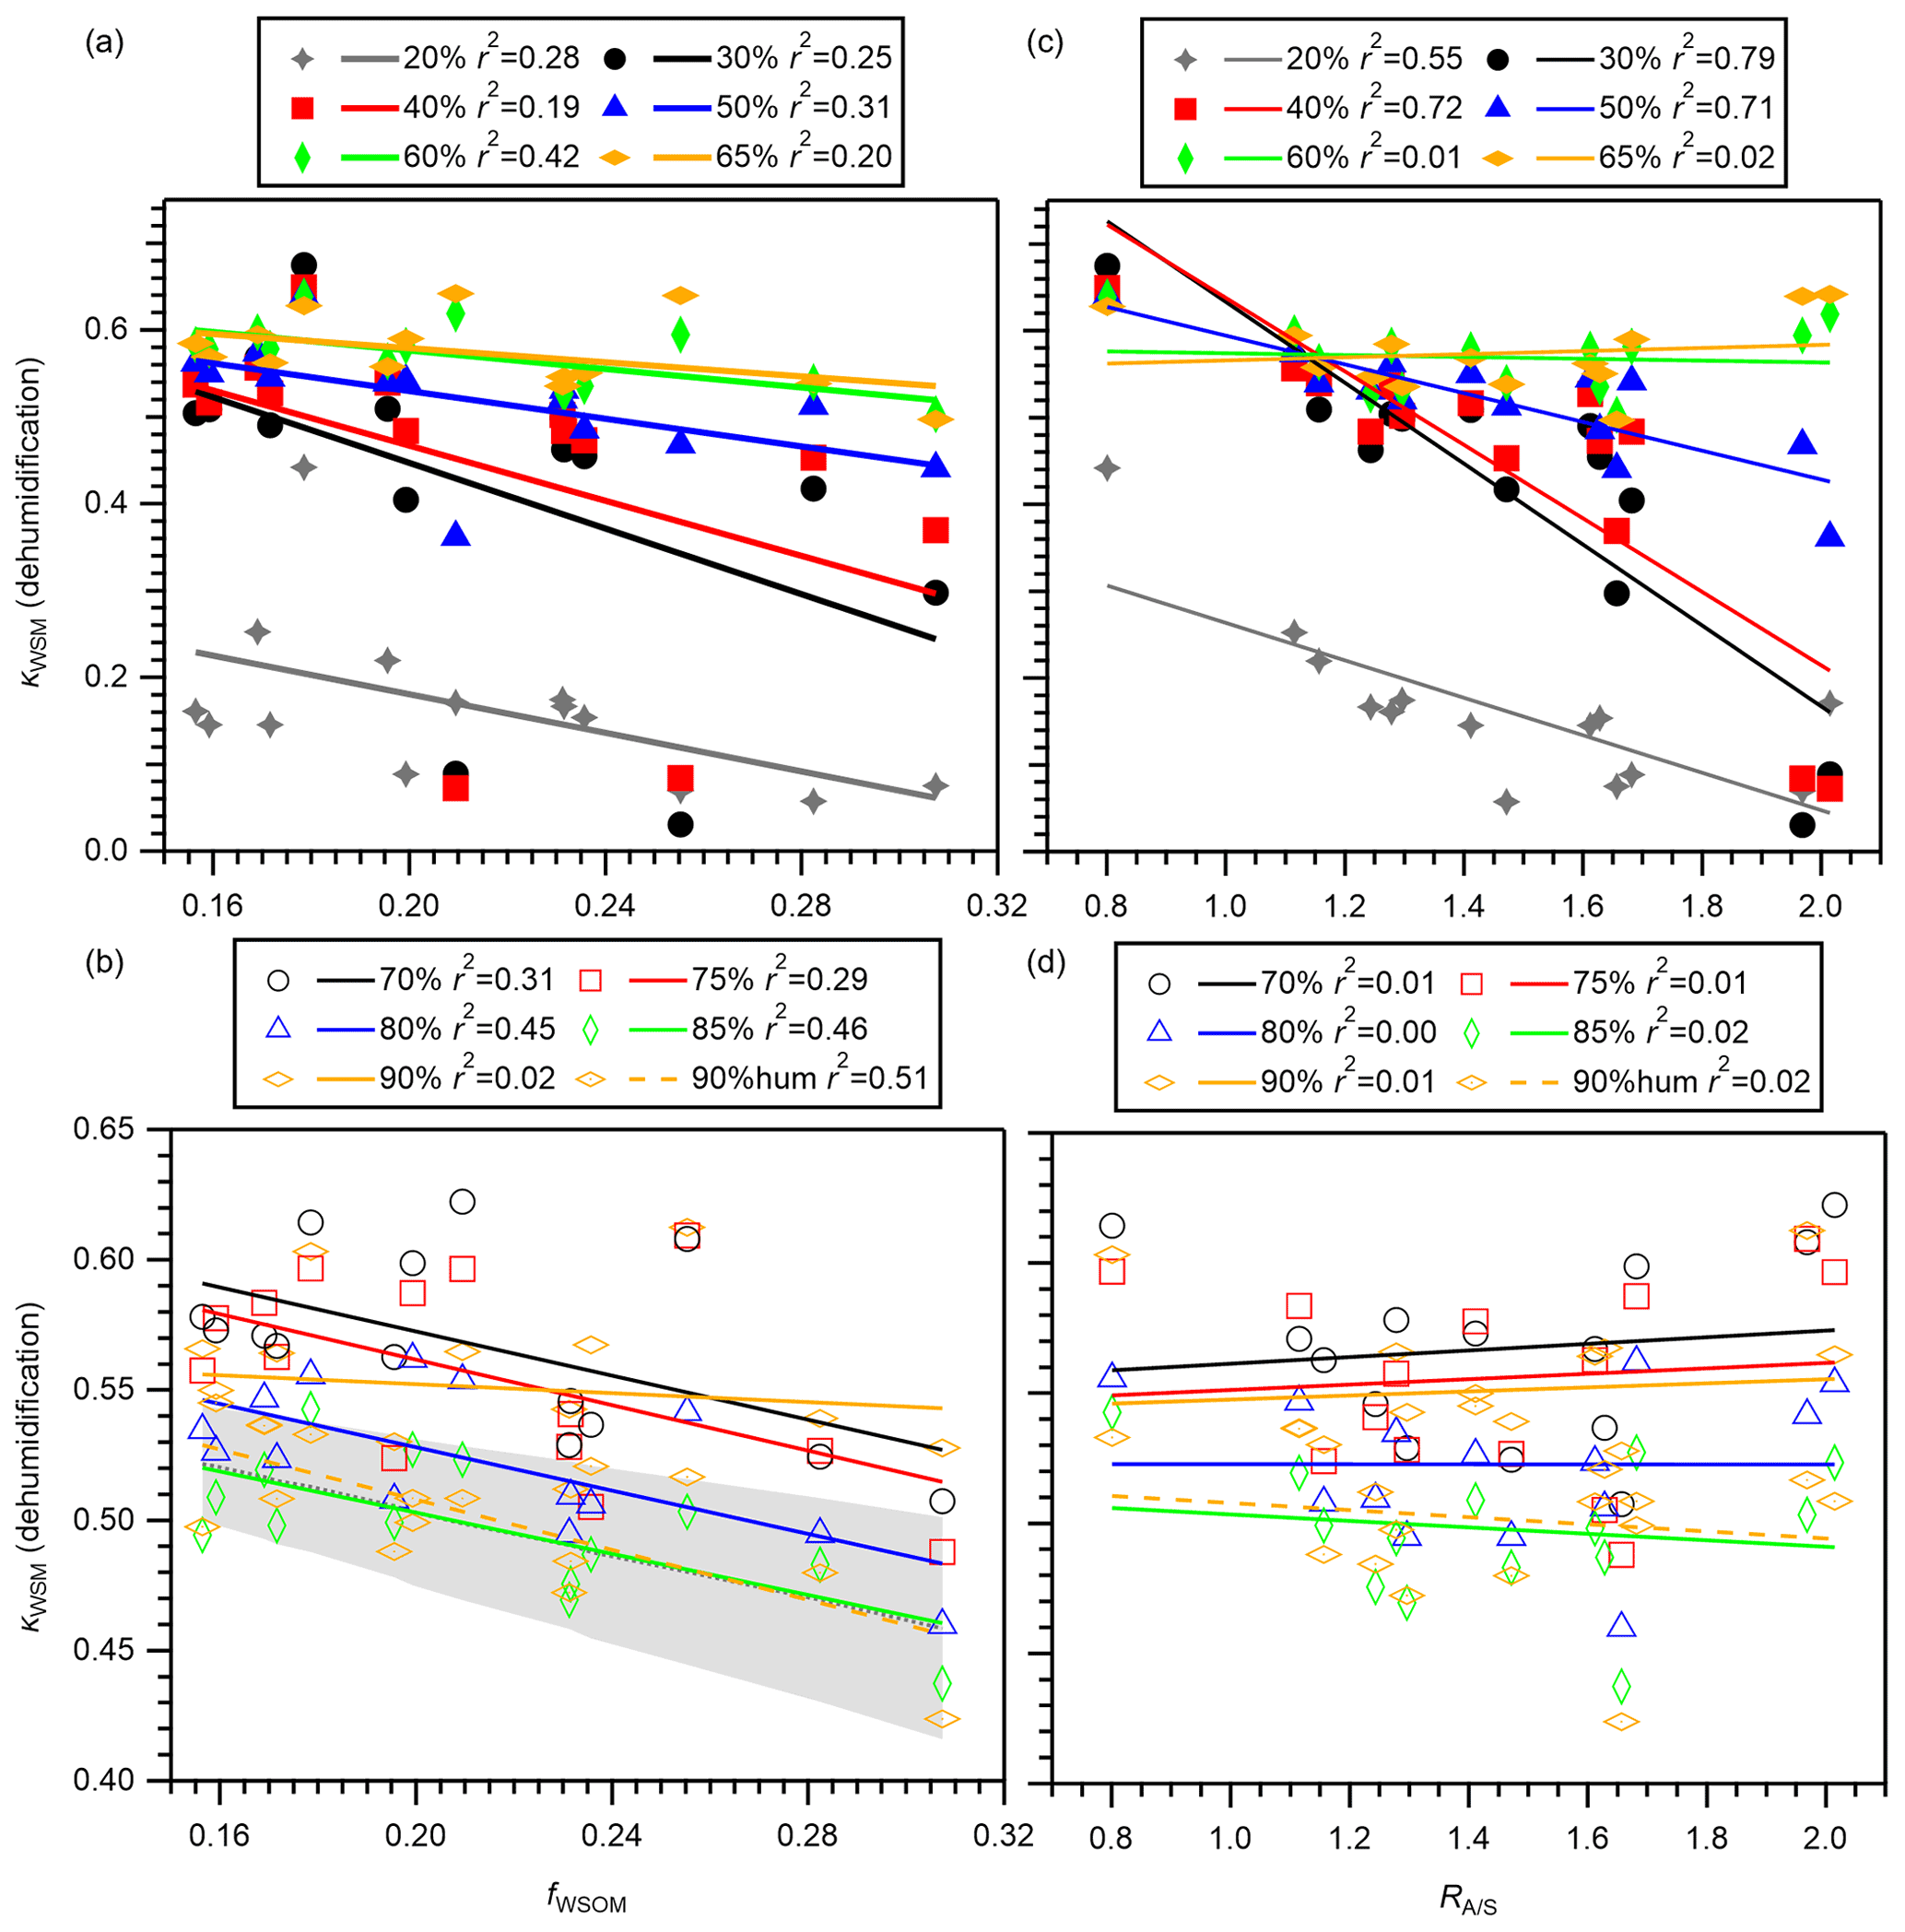
Figure 8The κWSM values in the dehumidification branch versus (a, b) the mass fractions of WSOM in WSM (fWSOM) and (c, d) the ammonium-to-remaining-sulfate molar ratio () from the offline analysis. Panels (a) and (c) present results obtained at 20 %, 30 %, 40 %, 50 %, 60 %, and 65 % RH. Panels (c) and (d) present results obtained at 70 %, 75 %, 80 %, 85 %, and 90 % RH. The κWSM at 90 % RH in the humidification branch (90 % hum) was also compared to (b) fWSOM and (d) . The shaded area in panel (b) shows κWSM predicted by application of a mean value of κinorg (0.59) and mean ± standard deviation of κWSOM for 85 % RH (0.22 ± 0.12) using Eq. (2). Coefficients of determination r2 are also presented.
The relation between the degree of neutralization represented by and κWSM at 20 %–90 % RH is also analyzed for the dehumidification branch (Fig. 8c and d). Although the correlations between and κWSM were weak for ≥ 60 % RH, clearer negative correlations were observed for <60 % RH. This result implies that the degree of neutralization is important to the variation in κWSM under low-RH conditions. The correlation was absent for κWSM predicted from E-AIM versus measured for RH ≤ 80 %). Therefore, the relation might be associated with the efflorescence behavior of inorganic components. Negative correlation at <60 % RH was observed (r2 0.58–0.77) even after excluding two samples with high relative abundances of sodium which showed high ERH (Fig. 4c). Therefore, the efflorescence of ammoniated sulfate itself might be related to . An alternative explanation is that is related to water uptake by organics and/or their influence on the efflorescence of inorganic salts. Although the small amount of aerosol water at <60 % RH might not strongly affect the particle optical property, it might have an important role in chemical reactions in the particles. Therefore, the relation between inorganic composition and water uptake should be assessed further, in addition to the role of acidity itself in the reactions. As in the case of κWSM, the relation between and in the dehumidification branch was analyzed (Fig. S16c and d). The result suggests that the degree of neutralization of inorganic aerosol components is also important in low-RH conditions.
In the humidification branch, moderately to highly negative correlations were found between κWSM and fWSOM (and and fEOM) at ≥ 70 % RH (Figs. S17 and S18), indicating the contribution of WSOM to the water uptake of WSM (or PM0.95) and being similar to the case of the dehumidification branch. Moderate positive (or negative) correlations of κWSM or with were observed at 60 % and 65 % RH (or 30 % RH), but for other RH conditions, correlation was not evident (Figs. S17 and S18). This result contrasts with the prediction of κWSM from E-AIM (for inorganic components), which instead shows moderate to high negative correlations with the ratio, in particular at 50 %–70 % RH (r2≥0.80; Fig. S19). The strong positive correlations between E-AIM-predicted deliquescence RH (DRH) and ratio were also found (Fig. S20). They are expected to be responsible for negative correlation between model-based κWSM and . The reason for the contrasting results between the measurements and the model prediction remains unclear. Further investigations on the influence of the degree of neutralization of inorganic salts on κWSM (or ) in the humidification mode are required. While the measurement uncertainty for DRH as seen for AS might be responsible for the discrepancy, the possible role of WSOM in DRH of inorganic salts should also be explored in future studies.
The composition of aerosols and the RH-dependent hygroscopic growth of aerosol components under the influence of the outflow from the Asian continent, as well as the air masses over the Pacific, were characterized based on analyses of submicrometer aerosol samples collected on filters in autumn 2015 on Okinawa, Japan. This offline analysis compensated for online analysis in terms of the quantification and characterization of water-soluble components and PM0.95 (50 % cutoff diameter 0.95 µm) and of the measurement of the hygroscopic growth as a function of relative humidity. This study characterized the RH-dependent hygroscopicity of submicrometer aerosols and their chemical components, in particular organics, in the outflow region of East Asia. Moreover, results from offline analyses were compared to those collected using online methods to assess the consistency of the results from the two different approaches.
The analysis of PM0.95 samples collected on filters showed the dominance of sulfate, which is quantitatively consistent with the chemical composition analysis based on online analysis using AMS and COSMOS. Offline analysis showed high proportions of WSOM (91 %) in EOM and high O:C of WSOM and EOM (0.84 ± 0.08 and 0.78 ± 0.08, respectively), all of which indicate the aged nature of the studied aerosol and characterize long-range-transported aerosols off the coast of East Asia. The temporal variation in the ammonium-to-sulfate molar ratio, assuming that sulfate was neutralized preferentially by sodium ions (), was obtained from the offline analysis. The result demonstrates that air masses from the Asian continent transported more acidic and aged aerosols and that sodium played a role in neutralizing the sulfate from maritime air masses.
The RH dependence of hygroscopic growth in humidification and dehumidification branches was inferred for water-soluble components from filter samples. At 40 %, 60 %, and 85 % RH, the κ values for WSM (κWSM) in the humidification (dehumidification) branch were 0.21 ± 0.10 (0.45 ± 0.17), 0.30 ± 0.13 (0.57 ± 0.04), and 0.51 ± 0.04 (0.50 ± 0.03), respectively. The κ values for PM0.95 () were also calculated. At 75 %–85 % RH, the κ values of WSOM and EOM in the dehumidification branch were estimated as 0.19–0.22 and 0.17–0.20, respectively. The WSOM was estimated to have contributed to 10 %–12 % of the water uptake of WSM and PM0.95. The dependences of the κWSM (or ) on the mass fractions of WSOM in WSM (or PM0.95) and the (at ≤ 50 % RH) in the dehumidification mode were inferred from their negative correlations. In the humidification mode, whereas the mass fractions of WSOM were suggested to be important for both κWSM and at RH ≥ 70 %, the relation between κWSM (or ) and in the low RH range was not evident despite the apparent relation in the case of κWSM predicted from E-AIM. The dependence of κWSM and on the fractions of WSOM and suggests the importance of understanding the temporal variability in the aerosol hygroscopicity at the receptor region of East Asian outflow, which includes a long-term trend under the condition of the large decrease in Chinese SO2 emissions in recent years (Zheng et al., 2018).
The hygroscopicity parameter values of PM0.95 at 85 % RH from offline methods were close to earlier reported values from online hygroscopicity measurements performed during the field campaign. Results obtained from this study extended the characterization of the studied aerosols by online analysis (≤ 200 nm), toward the mass-/volume-based mean diameter of the submicrometer aerosols. On the other hand, the similarity of the hygroscopicity parameter values from offline and online methods suggests the propriety of the offline method on aerosol hygroscopicity analysis, at least for remote sites at which the aerosols are aged and semi-volatile ammonium nitrate is not abundant. This finding encourages further studies of the hygroscopicity of aerosol components, particularly OA, the hygroscopicity of which is not yet characterized well. Given that precise analysis of the hygroscopicity of OA is not easy based on online analyses, the offline approach is useful for better understanding of the relation between chemical structure, sources, and hygroscopicity of WSOM and other organic components because of the richness of information from the AMS spectra. For example, the hygroscopicity of humic-like substances and other organic fractions and their contributions to total particulate matter are worth elucidating by the extension of the approach of this study.
| aw | water activity |
| volume fraction of EC in PM0.95 | |
| volume fraction of EOM in PM0.95 | |
| volume fraction of WISOM in EOM | |
| volume fraction of WSIM in PM0.95 | |
| volume fraction of WSIM in WSM | |
| volume fraction of WSOM in EOM | |
| volume fraction of WSOM in WSM |
| ρw | density of pure water |
| σ | surface tension at the solution–air interface of a liquid particle |
| κ | hygroscopicity parameter |
| κEC | κ of EC, which is equal to zero |
| κEOM | κ of EOM |
| κinorg | κ of WSIM |
| κonline | κ of ambient aerosol particles at 85 % RH obtained through on-site measurement |
| κ of PM0.95 | |
| κWSM | κ of WSM |
| κWSOM | κ of WSOM |
| AMS | (high-resolution time-of-flight) aerosol mass spectrometer |
| AS | ammonium sulfate |
| BC | black carbon |
| COSMOS | continuous soot monitoring system |
| CPC | condensation particle counter |
| ddry | dry particle diameter, which is 100 nm for this study |
| DMA | differential mobility analyzer |
| DRH | deliquescence RH |
| dwet | wet particle diameter – the product of gf and ddry |
| E-AIM | online Extended AIM Aerosol Thermodynamics model |
| EC | elemental carbon |
| EOC | extracted organic carbon |
| EOM | extracted organic matter |
| ERH | efflorescence RH |
| gf | hygroscopic growth factor |
| H : C | atomic ratio of H to C |
| H/V-TDMA | hygroscopicity and volatility tandem differential mobility analyzer |
| HTDMA | hygroscopicity tandem differential mobility analyzer |
| IC | ion chromatograph |
| Mw | molar mass of pure water |
| O : C | atomic ratio of O to C |
| OA | organic aerosol |
| OC | organic carbon |
| OM : OC | mass ratio of organic matter to organic carbon in the organic aerosol component |
| PM0.95 | subset of aerosol particles with diameters <0.95 µm |
| PM1 | subset of aerosol particles with diameters <1 µm |
| R | universal gas constant |
| r2 | coefficient of determination between two variables |
| molar ratio of ammonium to the remaining sulfate after preferentially being neutralized by sodium | |
| molar ratio of ammonium to sulfate | |
| RH | relative humidity |
| SMPS | scanning mobility particle sizer |
| T | absolute temperature |
| TOC | total organic carbon |
| WISOC | water-insoluble organic carbon |
| WISOM | water-insoluble organic matter |
| WSM | water-soluble matter |
| WSIM | water-soluble inorganic matter |
| WSOC | water-soluble organic carbon |
| WSOM | water-soluble organic matter |
All of the finally derived data supporting the findings of this study are available in the article or in the Supplement.
The supplement related to this article is available online at: https://doi.org/10.5194/acp-22-5515-2022-supplement.
MM, HF, and YD designed the experiments with contributions from KS and SH. HF, YD, YH, and MM performed them with contributions from KS, YM, ET, DKD, TN, ST, HX, FL, and SO. YD, MM, and HF analyzed the data with contributions from KS, YM, ET, DKD, KK, TN, ST, MC, HT, SO, YK, AT, and SH. YD and MM prepared the manuscript with contributions from HF, YM, DKD, SO, and AT.
At least one of the (co-)authors is a member of the editorial board of Atmospheric Chemistry and Physics. The peer-review process was guided by an independent editor, and the authors also have no other competing interests to declare.
Publisher’s note: Copernicus Publications remains neutral with regard to jurisdictional claims in published maps and institutional affiliations.
We thank the staff of the Cape Hedo Atmosphere and Aerosol Monitoring Station, National Institute for Environmental Studies, Japan, for the use of the study site. We also thank Atsushi Matsuki for the use of the water-based CPC, Petr Vodička for expert discussions on the OC–EC data analysis and comments on the paper, Martin Irwin for the field BC observation, and Naga Oshima for the quality control of online BC data. We also thank Yuua Nakamura for her work related to the experiments and Ruichen Zhou and Shuhei Ogawa for the calculation of the resident time of sample aerosols after humidification in the HTDMA. We acknowledge the NOAA Air Resources Laboratory (ARL) for providing the HYSPLIT transport and dispersion model. This study was in part performed under the joint research program of the Institute for Space-Earth Environmental Research, Nagoya University. Yange Deng thanks her current affiliation for supporting her to process data and write this paper.
This research has been supported by the Japan Society for the Promotion of Science (grant nos. JP19H04253 and JP18K19852) and the Environmental Restoration and Conservation Agency (grant no. JPMEERF20202003).
This paper was edited by Markus Petters and reviewed by three anonymous referees.
Aggarwal, S. G., Mochida, M., Kitamori, Y., and Kawamura, K.: Chemical closure study on hygroscopic properties of urban aerosol particles in Sapporo, Japan, Environ. Sci. Technol., 41, 6920–6925, https://doi.org/10.1021/es063092m, 2007.
Alpert, P. A., Dou, J., Arroyo, P. C., Schneider, F., Xto, J., Luo, B. P., Peter, T., Huthwelker, T., Borca, C. N., Henzler, K. D., Schaefer, T., Herrmann, H., Raabe, J., Watts, B., Krieger, U. K., and Ammann, M.: Photolytic radical persistence due to anoxia in viscous aerosol particles, Nat. Commun., 12, 1769, https://doi.org/10.1038/s41467-021-21913-x, 2021.
Boreddy, S. K. R. and Kawamura, K.: Hygroscopic growth of water-soluble matter extracted from remote marine aerosols over the western North Pacific: Influence of pollutants transported from East Asia, Sci. Total Environ., 557, 285–295, https://doi.org/10.1016/j.scitotenv.2016.03.096, 2016.
Boreddy, S. K. R., Kawamura, K., and Jung, J. S.: Hygroscopic properties of particles nebulized from water extracts of aerosols collected at Chichijima Island in the western North Pacific: An outflow region of Asian dust, J. Geophys. Res.-Atmos., 119, 167–178, https://doi.org/10.1002/2013jd020626, 2014.
Boreddy, S. K. R., Kawamura, K., Bikkina, S., and Sarin, M. M.: Hygroscopic growth of particles nebulized from water-soluble extracts of PM2.5 aerosols over the Bay of Bengal: Influence of heterogeneity in air masses and formation pathways, Sci. Total Environ., 544, 661–669, https://doi.org/10.1016/j.scitotenv.2015.11.164, 2016.
Braakhuis, H. M., Park, M., Gosens, I., De Jong, W. H., and Cassee, F. R.: Physicochemical characteristics of nanomaterials that affect pulmonary inflammation, Part. Fibre Toxicol., 11, 18, https://doi.org/10.1186/1743-8977-11-18, 2014.
Cai, M. F., Tan, H. B., Chan, C. K., Mochida, M., Hatakeyama, S., Kondo, Y., Schurman, M. I., Xu, H. B., Li, F., Shimada, K., Li, L., Deng, Y. G., Yai, H., Matsuki, A., Qin, Y. M., and Zhao, J.: Comparison of Aerosol Hygroscopcity, Volatility, and Chemical Composition between a Suburban Site in the Pearl River Delta Region and a Marine Site in Okinawa, Aerosol Air Qual. Res., 17, 3194–3208, https://doi.org/10.4209/aaqr.2017.01.0020, 2017.
Canagaratna, M. R., Jimenez, J. L., Kroll, J. H., Chen, Q., Kessler, S. H., Massoli, P., Hildebrandt Ruiz, L., Fortner, E., Williams, L. R., Wilson, K. R., Surratt, J. D., Donahue, N. M., Jayne, J. T., and Worsnop, D. R.: Elemental ratio measurements of organic compounds using aerosol mass spectrometry: characterization, improved calibration, and implications, Atmos. Chem. Phys., 15, 253–272, https://doi.org/10.5194/acp-15-253-2015, 2015.
Cappa, C. D., Che, D. L., Kessler, S. H., Kroll, J. H., and Wilson, K. R.: Variations in organic aerosol optical and hygroscopic properties upon heterogeneous OH oxidation, J. Geophys. Res.-Atmos., 116, D15204, https://doi.org/10.1029/2011jd015918, 2011.
Cerully, K. M., Raatikainen, T., Lance, S., Tkacik, D., Tiitta, P., Petäjä, T., Ehn, M., Kulmala, M., Worsnop, D. R., Laaksonen, A., Smith, J. N., and Nenes, A.: Aerosol hygroscopicity and CCN activation kinetics in a boreal forest environment during the 2007 EUCAARI campaign, Atmos. Chem. Phys., 11, 12369–12386, https://doi.org/10.5194/acp-11-12369-2011, 2011.
Chang, R. Y.-W., Slowik, J. G., Shantz, N. C., Vlasenko, A., Liggio, J., Sjostedt, S. J., Leaitch, W. R., and Abbatt, J. P. D.: The hygroscopicity parameter (κ) of ambient organic aerosol at a field site subject to biogenic and anthropogenic influences: relationship to degree of aerosol oxidation, Atmos. Chem. Phys., 10, 5047–5064, https://doi.org/10.5194/acp-10-5047-2010, 2010.
Chen, J., Budisulistiorini, S. H., Itoh, M., Lee, W.-C., Miyakawa, T., Komazaki, Y., Yang, L. D. Q., and Kuwata, M.: Water uptake by fresh Indonesian peat burning particles is limited by water-soluble organic matter, Atmos. Chem. Phys., 17, 11591–11604, https://doi.org/10.5194/acp-17-11591-2017, 2017.
Chen, Q. C., Ikemori, F., Higo, H., Asakawa, D., and Mochida, M.: Chemical Structural Characteristics of HULIS and Other Fractionated Organic Matter in Urban Aerosols: Results from Mass Spectral and FT-IR Analysis, Environ. Sci. Technol., 50, 1721–1730, https://doi.org/10.1021/acs.est.5b05277, 2016.
Cheng, Y. F., Zheng, G. J., Wei, C., Mu, Q., Zheng, B., Wang, Z. B., Gao, M., Zhang, Q., He, K. B., Carmichael, G., Poschl, U., and Su, H.: Reactive nitrogen chemistry in aerosol water as a source of sulfate during haze events in China, Sci. Adv., 2, 12, https://doi.org/10.1126/sciadv.1601530, 2016.
Cheung, H. H. Y., Yeung, M. C., Li, Y. J., Lee, B. P., and Chan, C. K.: Relative Humidity- Dependent HTDMA Measurements of Ambient Aerosols at the HKUST Supersite in Hong Kong, China, Aerosol Sci. Technol., 49, 643–654, https://doi.org/10.1080/02786826.2015.1058482, 2015.
Choi, M. Y. and Chan, C. K.: The effects of organic species on the hygroscopic behaviors of inorganic aerosols, Environ. Sci. Technol., 36, 2422–2428, https://doi.org/10.1021/es0113293, 2002.
Chow, J. C., Watson, J. G., Lowenthal, D. H., and Magliano, K. L.: Loss of PM2.5 nitrate from filter samples in central California, J. Air Waste Manag. Assoc., 55, 1158–1168, https://doi.org/10.1080/10473289.2005.10464704, 2005.
Clegg, S. L., Brimblecombe, P., and Wexler, A. S.: Thermodynamic model of the system H+-NH-SO–NO–H2O at tropospheric temperatures, J. Phys. Chem. A, 102, 2137–2154, https://doi.org/10.1021/jp973042r, 1998.
DeCarlo, P. F., Kimmel, J. R., Trimborn, A., Northway, M. J., Jayne, J. T., Aiken, A. C., Gonin, M., Fuhrer, K., Horvath, T., Docherty, K. S., Worsnop, D. R., and Jimenez, J. L.: Field-deployable, high-resolution, time-of-flight aerosol mass spectrometer, Anal. Chem., 78, 8281–8289, https://doi.org/10.1021/ac061249n, 2006.
Deng, Y., Yai, H., Fujinari, H., Kawana, K., Nakayama, T., and Mochida, M.: Diurnal variation and size dependence of the hygroscopicity of organic aerosol at a forest site in Wakayama, Japan: their relationship to CCN concentrations, Atmos. Chem. Phys., 19, 5889–5903, https://doi.org/10.5194/acp-19-5889-2019, 2019.
Deng, Y. G., Kagami, S., Ogawa, S., Kawana, K., Nakayama, T., Kubodera, R., Adachi, K., Hussein, T., Miyazaki, Y., and Mochida, M.: Hygroscopicity of Organic Aerosols and Their Contributions to CCN Concentrations Over a Midlatitude Forest in Japan, J. Geophys. Res.-Atmos., 123, 9703–9723, https://doi.org/10.1029/2017jd027292, 2018.
Draxler, R. R. and Hess, G. D.: An overview of the HYSPLIT_4 modelling system for trajectories, dispersion and deposition, Aust. Meteorol. Mag., 47, 295–308, 1998.
Duplissy, J., Gysel, M., Sjogren, S., Meyer, N., Good, N., Kammermann, L., Michaud, V., Weigel, R., Martins dos Santos, S., Gruening, C., Villani, P., Laj, P., Sellegri, K., Metzger, A., McFiggans, G. B., Wehrle, G., Richter, R., Dommen, J., Ristovski, Z., Baltensperger, U., and Weingartner, E.: Intercomparison study of six HTDMAs: results and recommendations, Atmos. Meas. Tech., 2, 363–378, https://doi.org/10.5194/amt-2-363-2009, 2009.
Eldred, R. A. and Cahill, T. A.: Sulfate sampling artifact from SO2 and alkaline soil, Environ. Sci. Technol., 31, 1320–1324, https://doi.org/10.1021/es9605533, 1997.
Facchini, M. C., Mircea, M., Fuzzi, S., and Charlson, R. J.: Cloud albedo enhancement by surface-active organic solutes in growing droplets, Nature, 401, 257–259, https://doi.org/10.1038/45758, 1999.
Freedman, M. A., Ott, E. J. E., and Marak, K. E.: Role of pH in Aerosol Processes and Measurement Challenges, J. Phys. Chem. A, 123, 1275–1284, https://doi.org/10.1021/acs.jpca.8b10676, 2019.
Gunthe, S. S., King, S. M., Rose, D., Chen, Q., Roldin, P., Farmer, D. K., Jimenez, J. L., Artaxo, P., Andreae, M. O., Martin, S. T., and Pöschl, U.: Cloud condensation nuclei in pristine tropical rainforest air of Amazonia: size-resolved measurements and modeling of atmospheric aerosol composition and CCN activity, Atmos. Chem. Phys., 9, 7551–7575, https://doi.org/10.5194/acp-9-7551-2009, 2009.
Guo, S., Hu, M., Lin, Y., Gomez-Hernandez, M., Zamora, M. L., Peng, J. F., Collins, D. R., and Zhang, R. Y.: OH-Initiated Oxidation of m-Xylene on Black Carbon Aging, Environ. Sci. Technol., 50, 8605–8612, https://doi.org/10.1021/acs.est.6b01272, 2016.
Gysel, M., Weingartner, E., Nyeki, S., Paulsen, D., Baltensperger, U., Galambos, I., and Kiss, G.: Hygroscopic properties of water-soluble matter and humic-like organics in atmospheric fine aerosol, Atmos. Chem. Phys., 4, 35–50, https://doi.org/10.5194/acp-4-35-2004, 2004.
Hersey, S. P., Craven, J. S., Schilling, K. A., Metcalf, A. R., Sorooshian, A., Chan, M. N., Flagan, R. C., and Seinfeld, J. H.: The Pasadena Aerosol Characterization Observatory (PACO): chemical and physical analysis of the Western Los Angeles basin aerosol, Atmos. Chem. Phys., 11, 7417–7443, https://doi.org/10.5194/acp-11-7417-2011, 2011.
Hong, J., Häkkinen, S. A. K., Paramonov, M., Äijälä, M., Hakala, J., Nieminen, T., Mikkilä, J., Prisle, N. L., Kulmala, M., Riipinen, I., Bilde, M., Kerminen, V.-M., and Petäjä, T.: Hygroscopicity, CCN and volatility properties of submicron atmospheric aerosol in a boreal forest environment during the summer of 2010, Atmos. Chem. Phys., 14, 4733–4748, https://doi.org/10.5194/acp-14-4733-2014, 2014.
Hoppel, W. A., Frick, G. M., and Larson, R. E.: Effect of Nonprecipitating Clouds on the Aerosol Size Distribution in the Marine Boundary-Layer, Geophys. Res. Lett., 13, 125–128, https://doi.org/10.1029/GL013i002p00125, 1986.
Johnson, G. R., Ristovski, Z., and Morawska, L.: Method for measuring the hygroscopic behaviour of lower volatility fractions in an internally mixed aerosol, J. Aerosol Sci., 35, 443–455, https://doi.org/10.1016/j.jaerosci.2003.10.008, 2004.
Jung, J. S., Kim, Y. J., Aggarwal, S. G., and Kawamura, K.: Hygroscopic property of water-soluble organic-enriched aerosols in Ulaanbaatar, Mongolia during the cold winter of 2007, Atmos. Environ., 45, 2722–2729, https://doi.org/10.1016/j.atmosenv.2011.02.055, 2011.
Kawana, K., Nakayama, T., and Mochida, M.: Hygroscopicity and CCN activity of atmospheric aerosol particles and their relation to organics: Characteristics of urban aerosols in Nagoya, Japan, J. Geophys. Res.-Atmos., 121, 4100–4121, https://doi.org/10.1002/2015jd023213, 2016.
Kawana, K., Nakayama, T., Kuba, N., and Mochida, M.: Hygroscopicity and cloud condensation nucleus activity of forest aerosol particles during summer in Wakayama, Japan, J. Geophys. Res.-Atmos., 122, 3042–3064, https://doi.org/10.1002/2016jd025660, 2017.
Kawecki, S. and Steiner, A. L.: The Influence of Aerosol Hygroscopicity on Precipitation Intensity During a Mesoscale Convective Event, J. Geophys. Res.-Atmos., 123, 424–442, https://doi.org/10.1002/2017jd026535, 2018.
Koike, M. and Oshima, N.: Mass concentration of BC (black carbon) measurement by COSMOS at the Cape Hedo in Japan, 1.00, Arctic Data archive System (ADS), Japan, https://ads.nipr.ac.jp/dataset/A20180402-006 (last access: 17 April 2022), 2018.
Kuang, Y., Xu, W. Y., Tao, J. C., Ma, N., Zhao, C. S., and Shao, M.: A Review on Laboratory Studies and Field Measurements of Atmospheric Organic Aerosol Hygroscopicity and Its Parameterization Based on Oxidation Levels, Curr. Pollut. Rep., 6, 410–424, https://doi.org/10.1007/s40726-020-00164-2, 2020.
Kuwata, M., Zorn, S. R., and Martin, S. T.: Using Elemental Ratios to Predict the Density of Organic Material Composed of Carbon, Hydrogen, and Oxygen, Environ. Sci. Technol., 46, 787–794, https://doi.org/10.1021/es202525q, 2012.
Kuwata, M., Shao, W., Lebouteiller, R., and Martin, S. T.: Classifying organic materials by oxygen-to-carbon elemental ratio to predict the activation regime of Cloud Condensation Nuclei (CCN), Atmos. Chem. Phys., 13, 5309–5324, https://doi.org/10.5194/acp-13-5309-2013, 2013.
Lambe, A. T., Onasch, T. B., Massoli, P., Croasdale, D. R., Wright, J. P., Ahern, A. T., Williams, L. R., Worsnop, D. R., Brune, W. H., and Davidovits, P.: Laboratory studies of the chemical composition and cloud condensation nuclei (CCN) activity of secondary organic aerosol (SOA) and oxidized primary organic aerosol (OPOA), Atmos. Chem. Phys., 11, 8913–8928, https://doi.org/10.5194/acp-11-8913-2011, 2011.
Lee, W. C., Chen, J. Budisulistiorini, S. H. Itoh, M. Shiodera S., and Kuwata M.: Polarity-dependent chemical characteristics of water-soluble organic matter from laboratory-generated biomass-burning revealed by 1-octanol-water partitioning, Environ. Sci. Technol., 53, 8047–8056, https://doi.org/10.1021/acs.est.9b01691, 2019.
Levin, E. J. T., Prenni, A. J., Palm, B. B., Day, D. A., Campuzano-Jost, P., Winkler, P. M., Kreidenweis, S. M., DeMott, P. J., Jimenez, J. L., and Smith, J. N.: Size-resolved aerosol composition and its link to hygroscopicity at a forested site in Colorado, Atmos. Chem. Phys., 14, 2657–2667, https://doi.org/10.5194/acp-14-2657-2014, 2014.
Lim, H. J., Turpin, B. J., Russell, L. M., and Bates, T. S.: Organic and elemental carbon measurements during ACE-Asia suggest a longer atmospheric lifetime for elemental carbon, Environ. Sci. Technol., 37, 3055–3061, https://doi.org/10.1021/es020988s, 2003.
Liu, P. F., Song, M. J., Zhao, T. N., Gunthe, S. S., Ham, S. H., He, Y. P., Qin, Y. M., Gong, Z. H., Amorim, J. C., Bertram, A. K., and Martin, S. T.: Resolving the mechanisms of hygroscopic growth and cloud condensation nuclei activity for organic particulate matter, Nat. Commun., 9, 4076, https://doi.org/10.1038/s41467-018-06622-2, 2018.
Lun, X. X., Takami, A., Ma, W. F., Shimono, A., and Hatakeyama, S.: Long-range transport of organic aerosol to Cape Hedo, Japan, Particuology, 13, 35–41, https://doi.org/10.1016/j.partic.2013.04.010, 2014.
McFiggans, G., Artaxo, P., Baltensperger, U., Coe, H., Facchini, M. C., Feingold, G., Fuzzi, S., Gysel, M., Laaksonen, A., Lohmann, U., Mentel, T. F., Murphy, D. M., O'Dowd, C. D., Snider, J. R., and Weingartner, E.: The effect of physical and chemical aerosol properties on warm cloud droplet activation, Atmos. Chem. Phys., 6, 2593–2649, https://doi.org/10.5194/acp-6-2593-2006, 2006.
McNeill, V. F.: Aqueous Organic Chemistry in the Atmosphere: Sources and Chemical Processing of Organic Aerosols, Environ. Sci. Technol., 49, 1237–1244, https://doi.org/10.1021/es5043707, 2015.
Middlebrook, A. M., Bahreini, R., Jimenez, J. L., and Canagaratna, M. R.: Evaluation of Composition-Dependent Collection Efficiencies for the Aerodyne Aerosol Mass Spectrometer using Field Data, Aerosol Sci. Technol., 46, 258–271, https://doi.org/10.1080/02786826.2011.620041, 2012.
Mihara, T. and Mochida, M.: Characterization of Solvent-Extractable Organics in Urban Aerosols Based on Mass Spectrum Analysis and Hygroscopic Growth Measurement, Environ. Sci. Technol., 45, 9168–9174, https://doi.org/10.1021/es201271w, 2011.
Miyazaki, Y., Kondo, Y., Takegawa, N., Komazaki, Y., Fukuda, M., Kawamura, K., Mochida, M., Okuzawa, K., and Weber, R. J.: Time-resolved measurements of water-soluble organic carbon in Tokyo, J. Geophys. Res.-Atmos., 111, D23206, https://doi.org/10.1029/2006jd007125, 2006.
Mochida, M., Nishita-Hara, C., Kitamori, Y., Aggarwal, S. G., Kawamura, K., Miura, K., and Takami, A.: Size-segregated measurements of cloud condensation nucleus activity and hygroscopic growth for aerosols at Cape Hedo, Japan, in spring 2008, J. Geophys. Res.-Atmos., 115, D21207, https://doi.org/10.1029/2009jd013216, 2010.
Mochida, M., Nishita-Hara, C., Furutani, H., Miyazaki, Y., Jung, J. Y., Kawamura, K., and Uematsu, M.: Hygroscopicity and cloud condensation nucleus activity of marine aerosol particles over the western North Pacific, J. Geophys. Res.-Atmos., 116, D06204, https://doi.org/10.1029/2010jd014759, 2011.
Mori, T., Kondo, Y., Ohata, S., Moteki, N., Matsui, H., Oshima, N., and Iwasaki, A.: Wet deposition of black carbon at a remote site in the East China Sea, J. Geophys. Res.-Atmos., 119, 10485–10498, https://doi.org/10.1002/2014jd022103, 2014.
Müller, A., Miyazaki, Y., Aggarwal, S. G., Kitamori, Y., Boreddy, S. K. R., and Kawamura, K.: Effects of chemical composition and mixing state on size-resolved hygroscopicity and cloud condensation nuclei activity of submicron aerosols at a suburban site in northern Japan in summer, J. Geophys. Res.-Atmos., 122, 9301–9318, https://doi.org/10.1002/2017jd027286, 2017a.
Müller, A., Miyazaki, Y., Tachibana, E., Kawamura, K., and Hiura, T.: Evidence of a reduction in cloud condensation nuclei activity of water-soluble aerosols caused by biogenic emissions in a cool-temperate forest, Sci. Rep., 7, 8452, https://doi.org/10.1038/s41598-017-08112-9, 2017b.
Ohata, S., Kondo, Y., Moteki, N., Mori, T., Yoshida, A., Sinha, P. R., and Koike, M.: Accuracy of black carbon measurements by a filter-based absorption photometer with a heated inlet, Aerosol Sci. Technol., 53, 1079–1091, https://doi.org/10.1080/02786826.2019.1627283, 2019.
Petters, M. D. and Kreidenweis, S. M.: A single parameter representation of hygroscopic growth and cloud condensation nucleus activity, Atmos. Chem. Phys., 7, 1961–1971, https://doi.org/10.5194/acp-7-1961-2007, 2007.
Pierce, J. R., Leaitch, W. R., Liggio, J., Westervelt, D. M., Wainwright, C. D., Abbatt, J. P. D., Ahlm, L., Al-Basheer, W., Cziczo, D. J., Hayden, K. L., Lee, A. K. Y., Li, S.-M., Russell, L. M., Sjostedt, S. J., Strawbridge, K. B., Travis, M., Vlasenko, A., Wentzell, J. J. B., Wiebe, H. A., Wong, J. P. S., and Macdonald, A. M.: Nucleation and condensational growth to CCN sizes during a sustained pristine biogenic SOA event in a forested mountain valley, Atmos. Chem. Phys., 12, 3147–3163, https://doi.org/10.5194/acp-12-3147-2012, 2012.
Pringle, K. J., Tost, H., Pozzer, A., Pöschl, U., and Lelieveld, J.: Global distribution of the effective aerosol hygroscopicity parameter for CCN activation, Atmos. Chem. Phys., 10, 5241–5255, https://doi.org/10.5194/acp-10-5241-2010, 2010.
Shingler, T., Crosbie, E., Ortega, A., Shiraiwa, M., Zuend, A., Beyersdorf, A., Ziemba, L., Anderson, B., Thornhill, L., Perring, A. E., Schwarz, J. P., Campazano-Jost, P., Day, D. A., Jimenez, J. L., Hair, J. W., Mikoviny, T., Wisthaler, A., and Sorooshian, A.: Airborne characterization of subsaturated aerosol hygroscopicity and dry refractive index from the surface to 6.5 km during the SEAC4RS campaign, J. Geophys. Res.-Atmos., 121, 4188–4210, https://doi.org/10.1002/2015jd024498, 2016.
Silvergren, S., Wideqvist, U., Strom, J., Sjogren, S., and Svenningsson, B.: Hygroscopic growth and cloud forming potential of Arctic aerosol based on observed chemical and physical characteristics (a 1 year study 2007–2008), J. Geophys. Res.-Atmos., 119, 14080–14097, https://doi.org/10.1002/2014jd021657, 2014.
Sorooshian, A., Hersey, S., Brechtel, F. J., Corless, A., Flagan, R. C., and Seinfeld, J. H.: Rapid, size-resolved aerosol hygroscopic growth measurements: Differential aerosol sizing and hygroscopicity spectrometer probe (DASH-SP), Aerosol Sci. Technol., 42, 445–464, https://doi.org/10.1080/02786820802178506, 2008.
Takami, A., Miyoshi, T., Shimono, A., Kaneyasu, N., Kato, S., Kajii, Y., and Hatakeyama, S.: Transport of anthropogenic aerosols from Asia and subsequent chemical transformation, J. Geophys. Res.-Atmos., 112, D22S31, https://doi.org/10.1029/2006jd008120, 2007.
Takegawa, N., Miyakawa, T., Watanabe, M., Kondo, Y., Miyazaki, Y., Han, S., Zhao, Y., van Pinxteren, D., Bruggemann, E., Gnauk, T., Herrmann, H., Xiao, R., Deng, Z., Hu, M., Zhu, T., and Zhang, Y.: Performance of an Aerodyne Aerosol Mass Spectrometer (AMS) during Intensive Campaigns in China in the Summer of 2006, Aerosol Sci. Technol., 43, 189–204, https://doi.org/10.1080/02786820802582251, 2009.
Tang, I. N.: Chemical and size effects of hygroscopic aerosols on light scattering coefficients, J. Geophys. Res.-Atmos., 101, 19245–19250, https://doi.org/10.1029/96JD03003, 1996.
Tang, I. N. and Munkelwitz, H. R.: Aerosol growth studies – III ammonium bisulfate aerosols in a moist atmosphere, J. Aerosol Sci., 8, 321–330, https://doi.org/10.1016/0021-8502(77)90019-2, 1977.
Tang, I. N. and Munkelwitz, H. R.: Water Activities, Densities, and Refractive-Indexes of Aqueous Sulfates and Sodium-Nitrate Droplets of Atmospheric Importance, J. Geophys. Res.-Atmos., 99, 18801–18808, https://doi.org/10.1029/94jd01345, 1994.
Tang, I. N., Munkelwitz, H. R., and Davis, J. G.: Aerosol growth studies – II. Preparation and growth measurements of monodisperse salt aerosols, J. Aerosol Sci., 8, 149–159, https://doi.org/10.1016/0021-8502(77)90002-7, 1977.
Tang, M., Chan, C. K., Li, Y. J., Su, H., Ma, Q., Wu, Z., Zhang, G., Wang, Z., Ge, M., Hu, M., He, H., and Wang, X.: A review of experimental techniques for aerosol hygroscopicity studies, Atmos. Chem. Phys., 19, 12631–12686, https://doi.org/10.5194/acp-19-12631-2019, 2019.
Taylor, N. F., Collins, D. R., Lowenthal, D. H., McCubbin, I. B., Hallar, A. G., Samburova, V., Zielinska, B., Kumar, N., and Mazzoleni, L. R.: Hygroscopic growth of water soluble organic carbon isolated from atmospheric aerosol collected at US national parks and Storm Peak Laboratory, Atmos. Chem. Phys., 17, 2555–2571, https://doi.org/10.5194/acp-17-2555-2017, 2017.
Titos, G., Cazorla, A., Zieger, P., Andrews, E., Lyamani, H., Granados-Munoz, M. J., Olmo, F. J., and Alados-Arboledas, L.: Effect of hygroscopic growth on the aerosol light-scattering coefficient: A review of measurements, techniques and error sources, Atmos. Environ., 141, 494–507, https://doi.org/10.1016/j.atmosenv.2016.07.021, 2016.
Turpin, B. J. and Lim, H. J.: Species Contributions to PM2.5 Mass Concentrations: Revisiting Common Assumptions for Estimating Organic Mass, Aerosol Sci. Technol., 35, 602–610, https://doi.org/10.1080/02786820119445, 2001.
Turpin, B. J., Saxena, P., and Andrews, E.: Measuring and simulating particulate organics in the atmosphere: problems and prospects, Atmos. Environ., 34, 2983–3013, https://doi.org/10.1016/s1352-2310(99)00501-4, 2000.
Wexler, A. S. and Clegg, S. L.: Atmospheric aerosol models for systems including the ions H+, NH, Na+, SO, NO, Cl−, Br−, and H2O, J. Geophys. Res.-Atmos., 107, ACH 14-1–ACH 14-14, https://doi.org/10.1029/2001jd000451, 2002.
Wu, Z. J., Poulain, L., Henning, S., Dieckmann, K., Birmili, W., Merkel, M., van Pinxteren, D., Spindler, G., Müller, K., Stratmann, F., Herrmann, H., and Wiedensohler, A.: Relating particle hygroscopicity and CCN activity to chemical composition during the HCCT-2010 field campaign, Atmos. Chem. Phys., 13, 7983–7996, https://doi.org/10.5194/acp-13-7983-2013, 2013.
Yan, Y., Fu, P. Q., Jing, B., Peng, C., Boreddy, S. K. R., Yang, F., Wei, L. F., Sun, Y. L., Wang, Z. F., and Ge, M. F.: Hygroscopic behavior of water-soluble matter in marine aerosols over the East China Sea, Sci. Total Environ., 578, 307–316, https://doi.org/10.1016/j.scitotenv.2016.10.149, 2017.
Yeung, M. C., Lee, B. P., Li, Y. J., and Chan, C. K.: Simultaneous HTDMA and HR-ToF-AMS measurements at the HKUST Supersite in Hong Kong in 2011, J. Geophys. Res.-Atmos., 119, 9864–9883, https://doi.org/10.1002/2013jd021146, 2014.
Zheng, B., Tong, D., Li, M., Liu, F., Hong, C., Geng, G., Li, H., Li, X., Peng, L., Qi, J., Yan, L., Zhang, Y., Zhao, H., Zheng, Y., He, K., and Zhang, Q.: Trends in China's anthropogenic emissions since 2010 as the consequence of clean air actions, Atmos. Chem. Phys., 18, 14095–14111, https://doi.org/10.5194/acp-18-14095-2018, 2018.
Zhou, J., Xu, X., Zhao, W., Fang, B., Liu, Q., Cai, Y., Zhang, W., Venables, D. S., and Chen, W.: Simultaneous measurements of the relative-humidity-dependent aerosol light extinction, scattering, absorption, and single-scattering albedo with a humidified cavity-enhanced albedometer, Atmos. Meas. Tech., 13, 2623–2634, https://doi.org/10.5194/amt-13-2623-2020, 2020.