the Creative Commons Attribution 4.0 License.
the Creative Commons Attribution 4.0 License.
 | 25 Apr 2022
Measurement report: Interpretation of wide-range particulate matter size distributions in Delhi
Ülkü Alver Şahin
Mohammed S. Alam
David C. S. Beddows
Dimitrios Bousiotis
Zongbo Shi
Leigh R. Crilley
William Bloss
James Brean
Isha Khanna
Rulan Verma
Delhi is one of the world's most polluted cities, with very high concentrations of airborne particulate matter. However, little is known about the factors controlling the characteristics of wide-range particle number size distributions. Here, new measurements are reported from three field campaigns conducted in winter and pre-monsoon and post-monsoon seasons at the Indian Institute of Technology campus in the south of the city. Particle number size distributions were measured simultaneously, using a scanning mobility particle sizer and a GRIMM optical particle monitor, covering 15 nm to >10 µm diameter. The merged, wide-range size distributions were categorized into the following five size ranges: nucleation (15–20 nm), Aitken (20–100 nm), accumulation (100 nm–1 µm), large fine (1–2.5 µm), and coarse (2.5–10 µm) particles. The ultrafine fraction (15–100 nm) accounts for about 52 % of all particles by number (PN10 is the total particle number from 15 nm to 10 µm) but just 1 % by PM10 volume (PV10 is the total particle volume from 15 nm to 10 µm). The measured size distributions are markedly coarser than most from other parts of the world but are consistent with earlier cascade impactor data from Delhi. Our results suggest substantial aerosol processing by coagulation, condensation, and water uptake in the heavily polluted atmosphere, which takes place mostly at nighttime and in the morning hours. Total number concentrations are highest in winter, but the mode of the distribution is largest in the post-monsoon (autumn) season. The accumulation mode particles dominate the particle volume in autumn and winter, while the coarse mode dominates in summer. Polar plots show a huge variation between both size fractions in the same season and between seasons for the same size fraction. The diurnal pattern of particle numbers is strongly reflective of a road traffic influence upon concentrations, especially in autumn and winter, although other sources, such as cooking and domestic heating, may influence the evening peak. There is a clear influence of diesel traffic at nighttime, when it is permitted to enter the city, and also indications in the size distribution data of a mode < 15 nm, which is probably attributable to CNG/LPG vehicles. New particle formation appears to be infrequent and is, in this dataset, limited to 1 d in the summer campaign. Our results reveal that the very high emissions of airborne particles in Delhi, particularly from traffic, determine the variation in particle number size distributions.
- Article
(7772 KB) - Full-text XML
-
Supplement
(1618 KB) - BibTeX
- EndNote


Air pollution in Delhi has been studied for many years, and the authorities have implemented several interventions designed to limit the concentrations. The sulfur content of diesel and petrol fuels was reduced to 50 ppm (parts per million) during 1996–2010, more than 1300 industries were shut down due to hazardous emissions, commercial vehicles older than 15 years were gradually taken out of the traffic fleet, and public transport vehicles and auto-rickshaws were converted to compressed natural gas (CNG) fuel (Narain and Krupnick, 2007). An odd/even vehicle number plate restriction has been applied during working days (Chowdhury et al., 2017). Although these measures have reduced gaseous pollutants (SO2 and CO) and primary particulate matter, in recent years, several studies have reported that the PM2.5 concentrations have been constant or slowly increasing in India, especially in the winter and autumn seasons (Babu et al., 2013; Balakrishnan et al., 2019; Dandona et al., 2017; Kumar et al., 2017), except in 2020. In 2020, the PM2.5 level decreased by approximately 40 %, due to COVID-19 lockdown measures (Rodríguez-Urrego and Rodríguez-Urrego, 2020; Mahato et al., 2020). Although the overall emission sources in India are dominated by traffic, industry, construction, and local biomass burning, haze pollution events in Delhi are frequently related to the large-scale open burning of post-harvest crop residues/wood during the crop burning season in nearby rural regions (Cusworth et al., 2018; Bikkina et al., 2019; Kanawade et al., 2020). Furthermore, the sources of particles are mostly local (Hama et al., 2020), so meteorological factors play an important role in influencing concentrations of air pollution (Tiwari et al., 2014; Yadav et al., 2016; Guo et al., 2017; Dumka et al., 2019; Kumar et al., 2020).
Annual average PM2.5 levels range between 81 and 190 µg m−3 in Delhi and are clearly higher than the WHO guideline value (5 µg m−3) and Indian national limit value (40 µg m−3; Hama et al., 2020). To the best of our knowledge, most studies in India have focussed on the source apportionment from chemical profiles of particles (Pant and Harrison, 2012; Jain et al., 2020; Bhandari et al., 2020; Rai et al., 2020). Mostly, they have reported that biomass burning contributes greatly to PM2.5 mass, while traffic contributes heavily to PM10 mass in Delhi. Residential energy use contributes 50 % of the PM2.5 mass concentration, and the construction sectors are also considered an important source of particle mass (Guttikunda et al., 2014; Butt et al., 2016; Conibear et al., 2018). Furthermore, it is particularly important to understand the absolute contribution and sources of different sizes of particles within PM2.5. A recently published paper by Das et al. (2021) highlighted that <250 nm particles contribute a significant proportion of the total PM2.5 mass and have a potentially important link with human health.
The particle number size distribution (PNSD) can provide air pollution source apportionment with high time resolution, compared to use of chemical species, and influences the aerosol transport and transformation profiles in the urban atmosphere and toxicological effects on humans (Wu and Boor, 2021). Many PNSD studies have been conducted in urban, traffic, and background sites over the past few decades, and three review studies have been published (Vu et al., 2015; Azimi et al., 2014; Wu and Boor, 2021). There are some studies evaluating the number or mass particle size distribution (PSD) in Delhi (Mönkkönen et al., 2005; Chelani et al., 2010; Gupta et al., 2011; Pant et al., 2016; Gani et al., 2020). Harrison (2020) compared PNSDs from Delhi, Beijing, and London and reported that the particles from Delhi are far greater in number, with a much larger modal diameter that is close to 100 nm. In a recent paper, Gani et al. (2020) investigated the PNSD up to 0.5 µm in size from 2017 to 2018 and reported that rapid coagulation is an important process in Delhi.
The wide-range PNSD is important for the description of all sources of inhalable particles (<10 µm). It is not easy to separately identify particles arising from resuspension, sea salt, and construction or from brake wear and combustion or vehicle exhaust by using only the <0.5 µm particle size range. Harrison et al. (2011) reported that using wide-range particle sizes in source apportionment was extremely successful for the identification of the separate contributions of on-road emission, including brake wear and resuspension. Although there are a few studies of wide-range particle characterization in Beijing (Jing et al., 2014) and source apportionment in Venice, Italy (Masiol et al., 2016), there has been no previous wide-range PNSD study in Delhi. In this study, we aimed to interpret particulate matter size distributions over a wide range (15 nm to 10 µm) in the winter and post-monsoon and pre-monsoon seasons in Delhi. Future studies will look at the two-step receptor modelling of wide-range particulate matter size distributions and chemical composition in Delhi.
2.1 Study area
The measurements were part of the NERC/MoES (Natural Environment Research Council/Ministry of Earth Sciences) Air Pollution and Human Health in an Indian megacity (APHH Delhi, https://www.urbanair-india.org, last access: 8 April 2022) study, a joint UK–India project addressing air pollution in Delhi. The sampling location was ∼ 15 m above ground level on the fifth floor of the Civil Engineering Department at the Indian Institute of Technology – Delhi (IIT Delhi) campus, located in New Delhi, which is representative of an urban background environment (28.545∘ N, 77.193∘ E; Fig. S1 in the Supplement). The measurement station is at a 120 m distance from a major arterial road. As part of APHH Delhi, there were the following three field campaigns: (i) January–February 2018 (winter), (ii) May–June 2018 (summer; pre-monsoon), and (iii) October–November 2018 (autumn; post-monsoon). In all field campaigns, a suite of gas and particulate phase instrumentation was deployed within a temperature-controlled laboratory.
These sampling periods were representative of conditions for PM and gases during these seasons in Delhi. We found the average PM2.5 concentration to be approximately 180, 220, and 120 µg m−3 for winter, autumn (excluding Diwali), and summer, respectively, measured by a TEOM FDMS (TEOM filter dynamic measurement system). Hama et al. (2020) studied the long-term (from 2014 to 2017) trends in air pollution in Delhi at six stations (residential, commercial, and industrial sites) and reported that the mean PM2.5 concentrations ranged 147–248, 147–248, and 76–135 µg m−3 for winter, autumn, and summer, respectively, and a good correlation between sites within Delhi was found. This gives reassurance that the PM2.5 concentrations measured at our site are within the typical range of those observed in Delhi.

Figure 1Comparison of average particle number counts (number per cm3) for nucleation, Aitken, accumulation, large fine and coarse modes of PM between 15 nm and 10 µm in all seasons, and the volume contributions for comparison.
2.2 Measurements
Aerosol particle sizes in the atmosphere span a very wide range, from a few nanometres at the lower end to some tens of micrometres at the upper end. Because of this very wide range of sizes, particle properties vary considerably across the size spectrum, with the behaviour of the smaller particles being determined by their high mobility and hence diffusivity, while at the coarse end of the size distribution, inertial properties are especially important. Due to this divergence in behaviour, no instrument is capable of measuring the whole range of particle sizes.
To measure the particle size range used in this study, two particle instruments were used to collect number size distributions (NSDs). For the range 15–640 nm, a TSI scanning mobility particle sizer (SMPS) 3936 was used, consisting of a TSI 3080 Electrostatic Classifier, TSI 3081 differential mobility analyser (DMA), and TSI 3775 condensation particle counter (CPC). To extend this range into the coarse mode, a portable laser aerosol spectrometer and dust monitor (GRIMM 1.108) were used alongside the SMPS.
2.3 Merging process
Merging procedures have usually been reported for merging SMPS and aerosol particle sizer (APS) data, but here the GRIMM optical spectrometer (OP) data are merged with SMPS data. For a complete particle size distribution, simultaneously collected, paired hourly averaged particle number size distributions collected from the SMPS and GRIMM were merged. The merging procedure is based on the principle of converting the diameters of the GRIMM-derived data to a diameter matching the SMPS-derived data in the region where the size distribution measurements overlap. The GRIMM model measures the optical diameter , whereas the SMPS measures the mobility diameter of the particles. Comprehensive descriptions of the procedure and mathematics are given by DeCarlo et al. (2004) and Schmid et al. (2007). The GRIMM NSDs are translated onto the extended electrical mobility diameter axis of the SMPS using Eq. (1) (Beddows et al., 2010; Liu et al., 2016; Ondráček et al., 2009).
The Cunningham slip correction factor is given by C, and the unknown variables, such as the shape factor of the particles, are accounted for by a free parameter X (given by Eq. 2), which is adjusted until the tails of the SMPS and GRIMM NSD overlap each other, giving a continuous NSD across the particle size bins measured by the two instruments.
The estimated transition regime effective density (normalized by the unit density, ρo), typically ranges from 0.77 to 2.56 g cm−3 when the aerodynamic diameter is used in merging. Detailed information on the effective particle density, based on the geographical regions, is seen in the Wu and Boor (2021) study.
The merging algorithm (originally programmed in CRAN R) was implemented using Excel spreadsheets and the solver tool minimized the separation between the tails of the overlapping SMPS and GRIMM. Due to the imperfect nature of the data, each of the merges was allocated a factor indicating the quality, based on whether (i) there is a successful fit, (ii) the scatter of the data is across the overlapping tails, (iii) the fraction of points on the tail fall onto the fitted curve, and (iv) how smooth the overlap is (Table S1). The size bins overlap (300–700 nm) between GRIMM and SMPS. This process was repeated for the winter, summer, and autumn data sets, and any results failing the test were either repeated or the data were removed from the analysis. In all, only eight samples from 1117 failed to give an acceptable fit in the merging procedure.
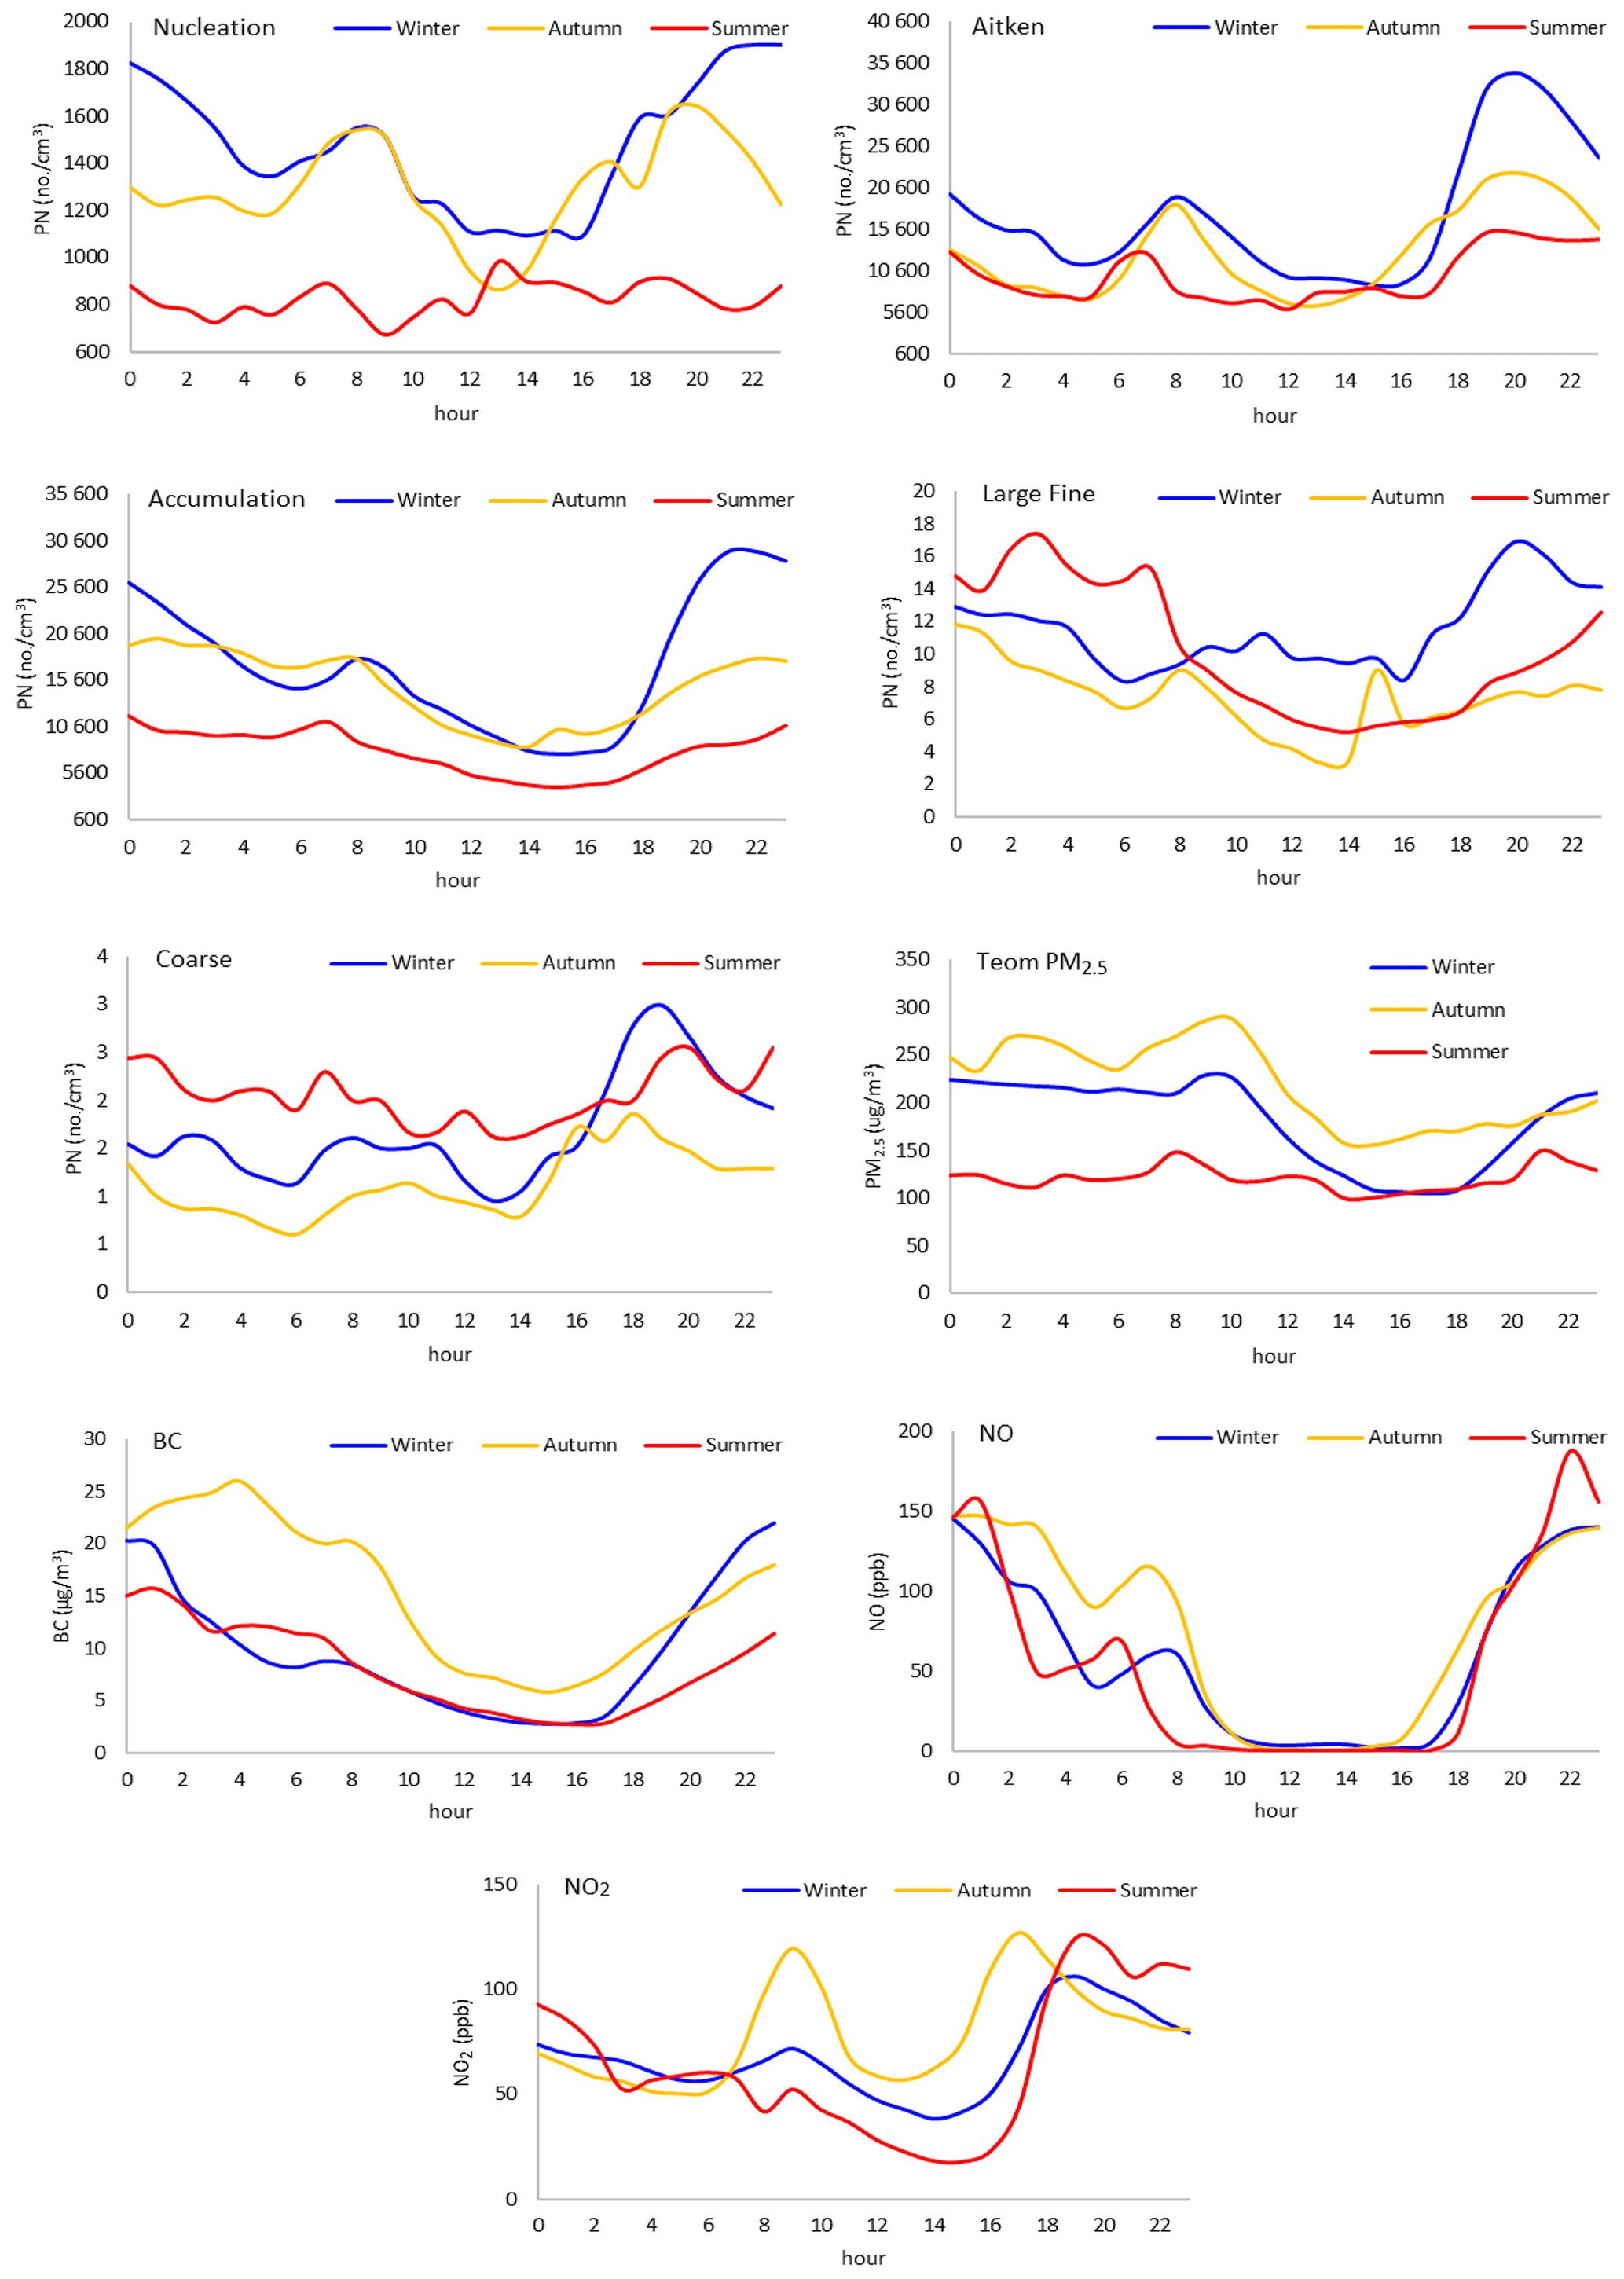
Figure 2Average diurnal variation in particle number counts for nucleation, Aitken, accumulation, large fine, and coarse modes and PM2.5, BC, NO, and NO2 in autumn, summer, and winter.
2.4 Data and quality management
Data from SMPS and GRIMM were measured with 1 min resolution and converted to hourly averages. The seasons were categorized as winter, autumn, and summer. The measurements were taken in winter, from 12 January 16:00 LT to 11 February 04:00 LT, in autumn, from 24 October 16:00 LT to 11 November 10:00 LT, and in summer, from 16 May 19:00 LT to 5 June 15:00 LT, in 2018. There were 709, 403, and 477 total pairs (h) in the data sets in winter, autumn, and summer, respectively. But 172, 43, and 257 pairs in winter, autumn, and summer, respectively, were excluded because of the non-availability of data at that time. Data coverage is 76 % for winter, 95 % for autumn, and 46 % for summer. Figure S2 in the Supplement shows the hourly mean values of total particle counts for three seasons. In order to evaluate day- and nighttime particle number concentration (PNC) differences, the day and night were defined as 07:00–19:00 LT and 19:00–07:00 LT, respectively. All times reported are local times recorded in Indian Standard Time (IST; GMT+05:30).
R version 3.1.2 was used to analyse the data (R Core Team, 2015). First, all data were checked for a clean up of the robustness of the data sets to detect anomalous records and take out the extreme values. Data greater than the 99.5th percentile were deleted. Diwali time in 2018 (7 November 2018, from 16:00 to 23:00 LT) was taken out the date set in order to exclude its extreme effect on PNSD values. Particle number concentrations during Diwali time are given in the Supplement (Fig. S3). There were some single gaps in the data matrixes. These missing data were replaced by linearly interpolated values from the nearest bins to those samples.
In the literature, PNCs measuring below 1 µm are frequently split into the following three ranges: nucleation, Aitken, and accumulation (Gani et al., 2020). Nucleation size ranges have variously been described as being either below 30 nm (Masiol et al., 2016), below 25 nm (Gani et al., 2020), or below 20 nm (Wu and Boor, 2021). Some studies have evaluated the wide-range PNSDs and split them into four ranges (nucleation, Aitken, accumulation, and coarse; Masiol et al., 2016; Harrison et al., 2011). In this study, the modes have been aggregated into five differently sized groups: nucleation (15–20 nm), Aitken (20–100 nm), accumulation (100 nm–1 µm), large fine (1–2.5 µm), and coarse (2.5–10 µm) based on merged data. Ultrafine particles (UFPs) are considered to be the total PN counts of the nucleation and Aitken modes (<100 nm).
The particle mass was calculated for the SMPS and OP (hereafter SMPS+OP) merged data, assuming a density of 1.6 g cm−3 (Gani et al., 2020). The estimation of particle density as a function of size is extremely difficult, and there are few examples of data available for the particle density from Delhi. Since Gani et al. (2020) used the density of PM at the same location as in our study, we used the same density value to convert the PN to PM mass. Figure S4 shows the comparison of PM2.5 measured by SMPS+OP and TEOM FDMS in Delhi for the three seasons. Figure S5 shows the comparison of PM2.5 with relative humidity measured by SMPS+OP and TEOM in Delhi for the three seasons. A good correlation of the estimated particle mass with independent measurements with a co-located TEOM FDMS was observed, except in summer.
The cumulative frequency of the observations as a function of particle size was calculated for each hour of the day. Standard central measures from the cumulative frequency plots were represented by the geometric mean diameter (GMD) for each size distribution. They were used to examine the particle growth processes. First, the growth of GMD was estimated visually from the diurnal GMD data plot (Fig. 8). The minimum growth time used for the estimation of the growth rate (GR) was selected as 3 h, and if the growth lasted for long enough, then the GR was estimated. The observed growth of the GMD of the particle was quantified by fitting the GMD of particles during the growth process event over a period of time, t (Reaction R3). Detailed information on the method can be found in Sarangi et al. (2015, 2018).
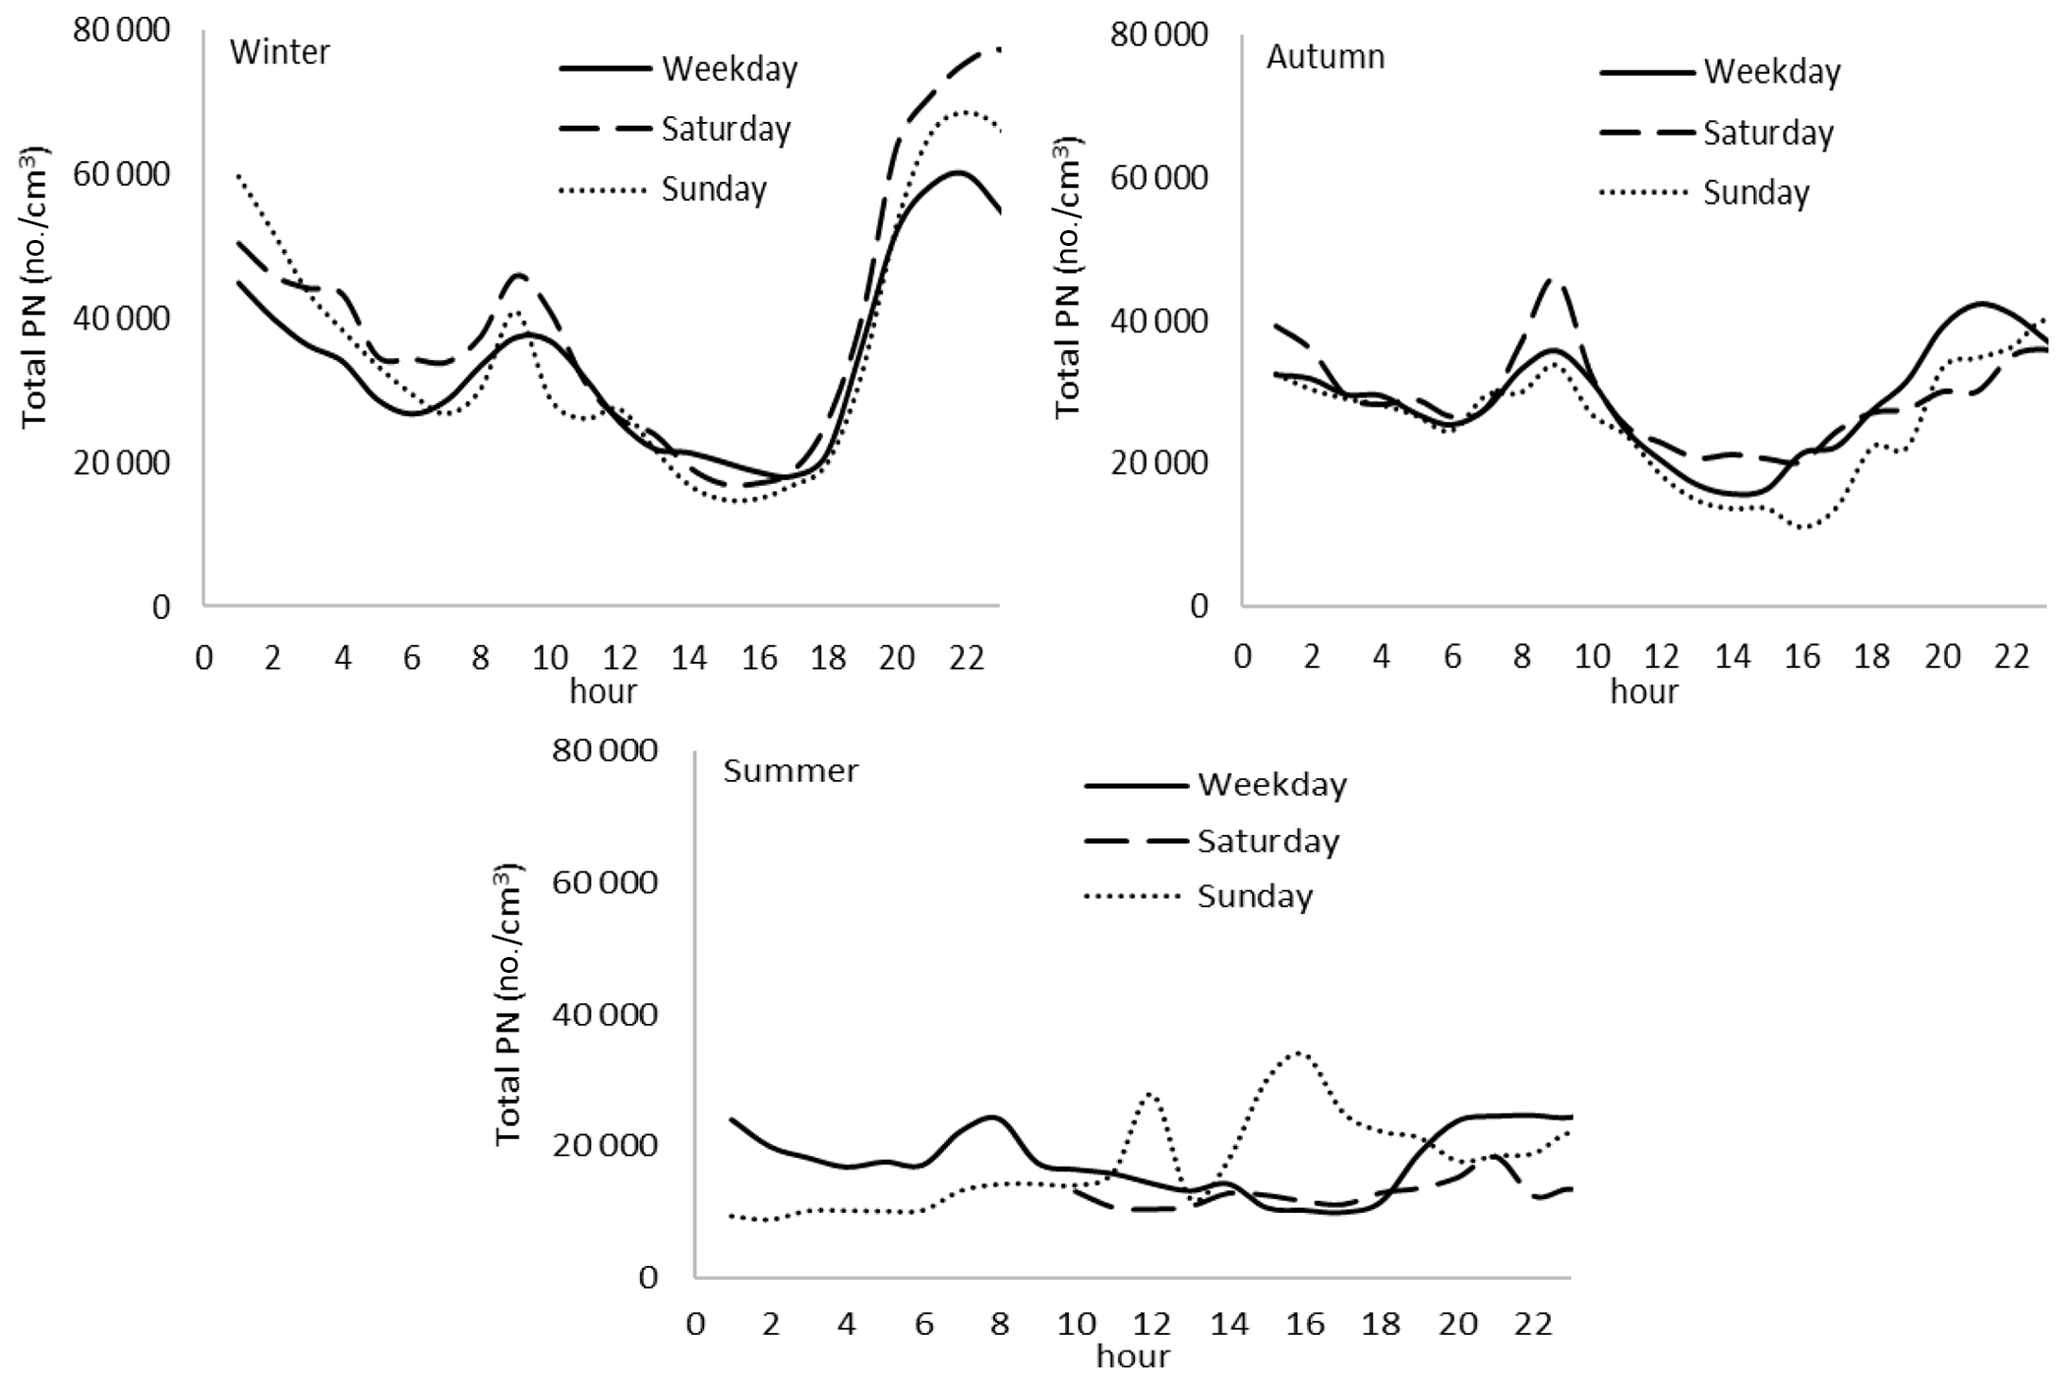
Figure 3Average diurnal variation in the total particle number counts (between 15 and 10 µm) for the weekday average (Monday to Friday), Saturday, and Sunday in Delhi. Summer data are very limited. There are no data for Friday afternoon and night nor for Saturday in the early morning (Fig. S6).
3.1 Particle number and size
Table S2 gives the descriptive statistics of particle number counts (number per cm3) calculated using every 1 h of measurements for the nucleation, Aitken, accumulation, large fine, and coarse modes between 15 nm and 10 µm in all seasons. The time series of the total particle number counts are presented in Fig. S2. The average total PN levels were 36.73×103 cm−3 in winter, 29.35×103 cm−3 in autumn, and 18.91×103 cm−3 in summer. Generally, the wintertime PN levels were higher than the other seasons. The wintertime PN levels of nucleation, Aitken, and accumulation modes were ∼ 1.5, 1.8, and 2.2 times higher than in summer, respectively. Similar ratios were obtained by Guttikunda and Gurjar (2012) in Delhi for particulate matter concentrations. This is attributed to the unfavourable dispersion conditions, including low wind speed and low mixing height during the winter season. The autumn PN levels of nucleation, Aitken, and accumulation modes were ∼ 1.5, 1.3, and 1.9 times higher than in summer, respectively. The wintertime and autumn average PN levels are similar, except for the Aitken mode for which winter is 1.4 times higher than in autumn. However, for the large fine and coarse modes, the PN level was not markedly different between winter, autumn, and summer. Gani et al. (2020) reported that the average PN levels were 52.50×103 cm−3 in winter, 43.40×103 cm−3 in summer, and 38.00×103 cm−3 in autumn in Delhi as per the measurements in 2017. The differences in the magnitude of number counts between the two studies are potentially explained by the difference in the sampling period and changes in emissions.
Figure 1 shows a comparison of the average particle number and volume and the contribution to total PN. The average PV (particle volume) levels indicate that PV of the Aitken mode is highest in winter, while the accumulation mode is highest in autumn, and the coarse mode is highest in summer. The contribution of UFPs to the numbers is highest in summer (57 %) but their contribution to volume is the lowest in autumn and summer (<1 %). The contribution to both the number and volume of the accumulation mode is highest in autumn with 51 % and 75 %, respectively. UFP contributions to total PV are below 1 % in Delhi. Furthermore, it can be clearly seen that the coarse fraction of particles dominates in summer, while the accumulation mode dominates in autumn and winter.
Wu and Boor (2021) analysed the PNSD observations made between 1998 and 2017 in 114 cities in 43 countries around the globe. They reported that there are significant variations in the magnitude of urban aerosol PNSD among different geographical regions. The main finding of their study is that the PNSD in Europe, North America, Australia, and New Zealand are dominated by nucleation- and Aitken-mode particles, while in central, southern, southeastern, and eastern Asia they are dominated by the substantial contribution from the accumulation mode, which is consistent with our finding. Pant et al. (2016) report mass size distributions for particulate matter sampled by a cascade impactor in Delhi in winter. The dominant modes appear at around 3–4 and 0.6 µm, with a lesser peak at 0.2 µm aerodynamic diameter. These are, respectively, in the coarse (former mode) and accumulation (latter two modes) ranges, as classified in the current study. The largest component of mass was in the accumulation mode, and the distribution fits well with the pattern of data seen in Fig. 1. Major components of the coarse fraction were Al, Si, Ca, and Fe (Pant et al., 2016), suggestive of soil and street dust as major contributors. The elements most notable in the accumulation fraction were Cu, Zn, Pb, and Sb, indicative of non-exhaust traffic emissions and metallurgical sources, and S, which showed a major peak due to sulfate, peaking at 0.9 µm (Pant et al., 2016).
3.2 Diurnal change
Figure 2 shows the diurnal variation in particle number concentrations and of PM2.5, BC, NO, and NO2 for each season (excluding the day of Diwali), and the normalized time variations in all particle fractions are given in Fig. S6. Figure S7 represents the diurnal variation in the meteorological parameters. In general, there are large differences in PN levels between cold seasons (winter and autumn) and the warm season (summer) for nucleation size particles. Coarse mode particle numbers in the summer are higher than in winter and autumn, except in the evening. For autumn and winter, particle counts are similar from 7:00 to 19:00 LT (daytime). However, from 19:00 to 7:00,LT particle counts in winter are higher than in autumn. The lowest levels for all modes were present during the afternoon in all seasons (14:00–16:00 LT), followed by highest levels during the night in winter (after 20:00 LT). The winter and autumn diurnal profiles had two peaks for below 1 µm particle size in the morning and evening, corresponding to the traffic rush hours. But in the summer the same peaks for nucleation, Aitken, and accumulation modes are seen, although of smaller magnitude, and 1 h earlier compared to the winter and autumn. Pant et al. (2016) reported the on diurnal variation in traffic at one of the major arterial roads in Delhi, and Dhyani et al. (2019) reported on traffic-related emissions. Figure S9 shows the diurnal variation in traffic at a major road intersection in Delhi. Cars, two/three wheelers, buses, and LCV (light commercial vehicle) fleet numbers increase in the morning, persist throughout daytime and start to decrease at 22:00 LT. Due to the prohibition of access for heavy-duty diesel vehicles to central Delhi from 6:00 until 23:00 LT, during the daytime, including the traffic rush hours, the HCV (heavy commercial vehicle) number is at its lowest level (Fig. S9 or Dhyani et al., 2019). While road traffic clearly influences the diurnal pattern in PN, other sources, including cooking and domestic combustion, are likely to contribute. Small midday PN peaks were observed during the summer in the nucleation, Aitken, and coarse modes. Another study conducted in Delhi reported the same midday peaks in the warm season and the highest levels in the cold season (Gani et al., 2020), which may be related to bus and LCV emissions at midday.
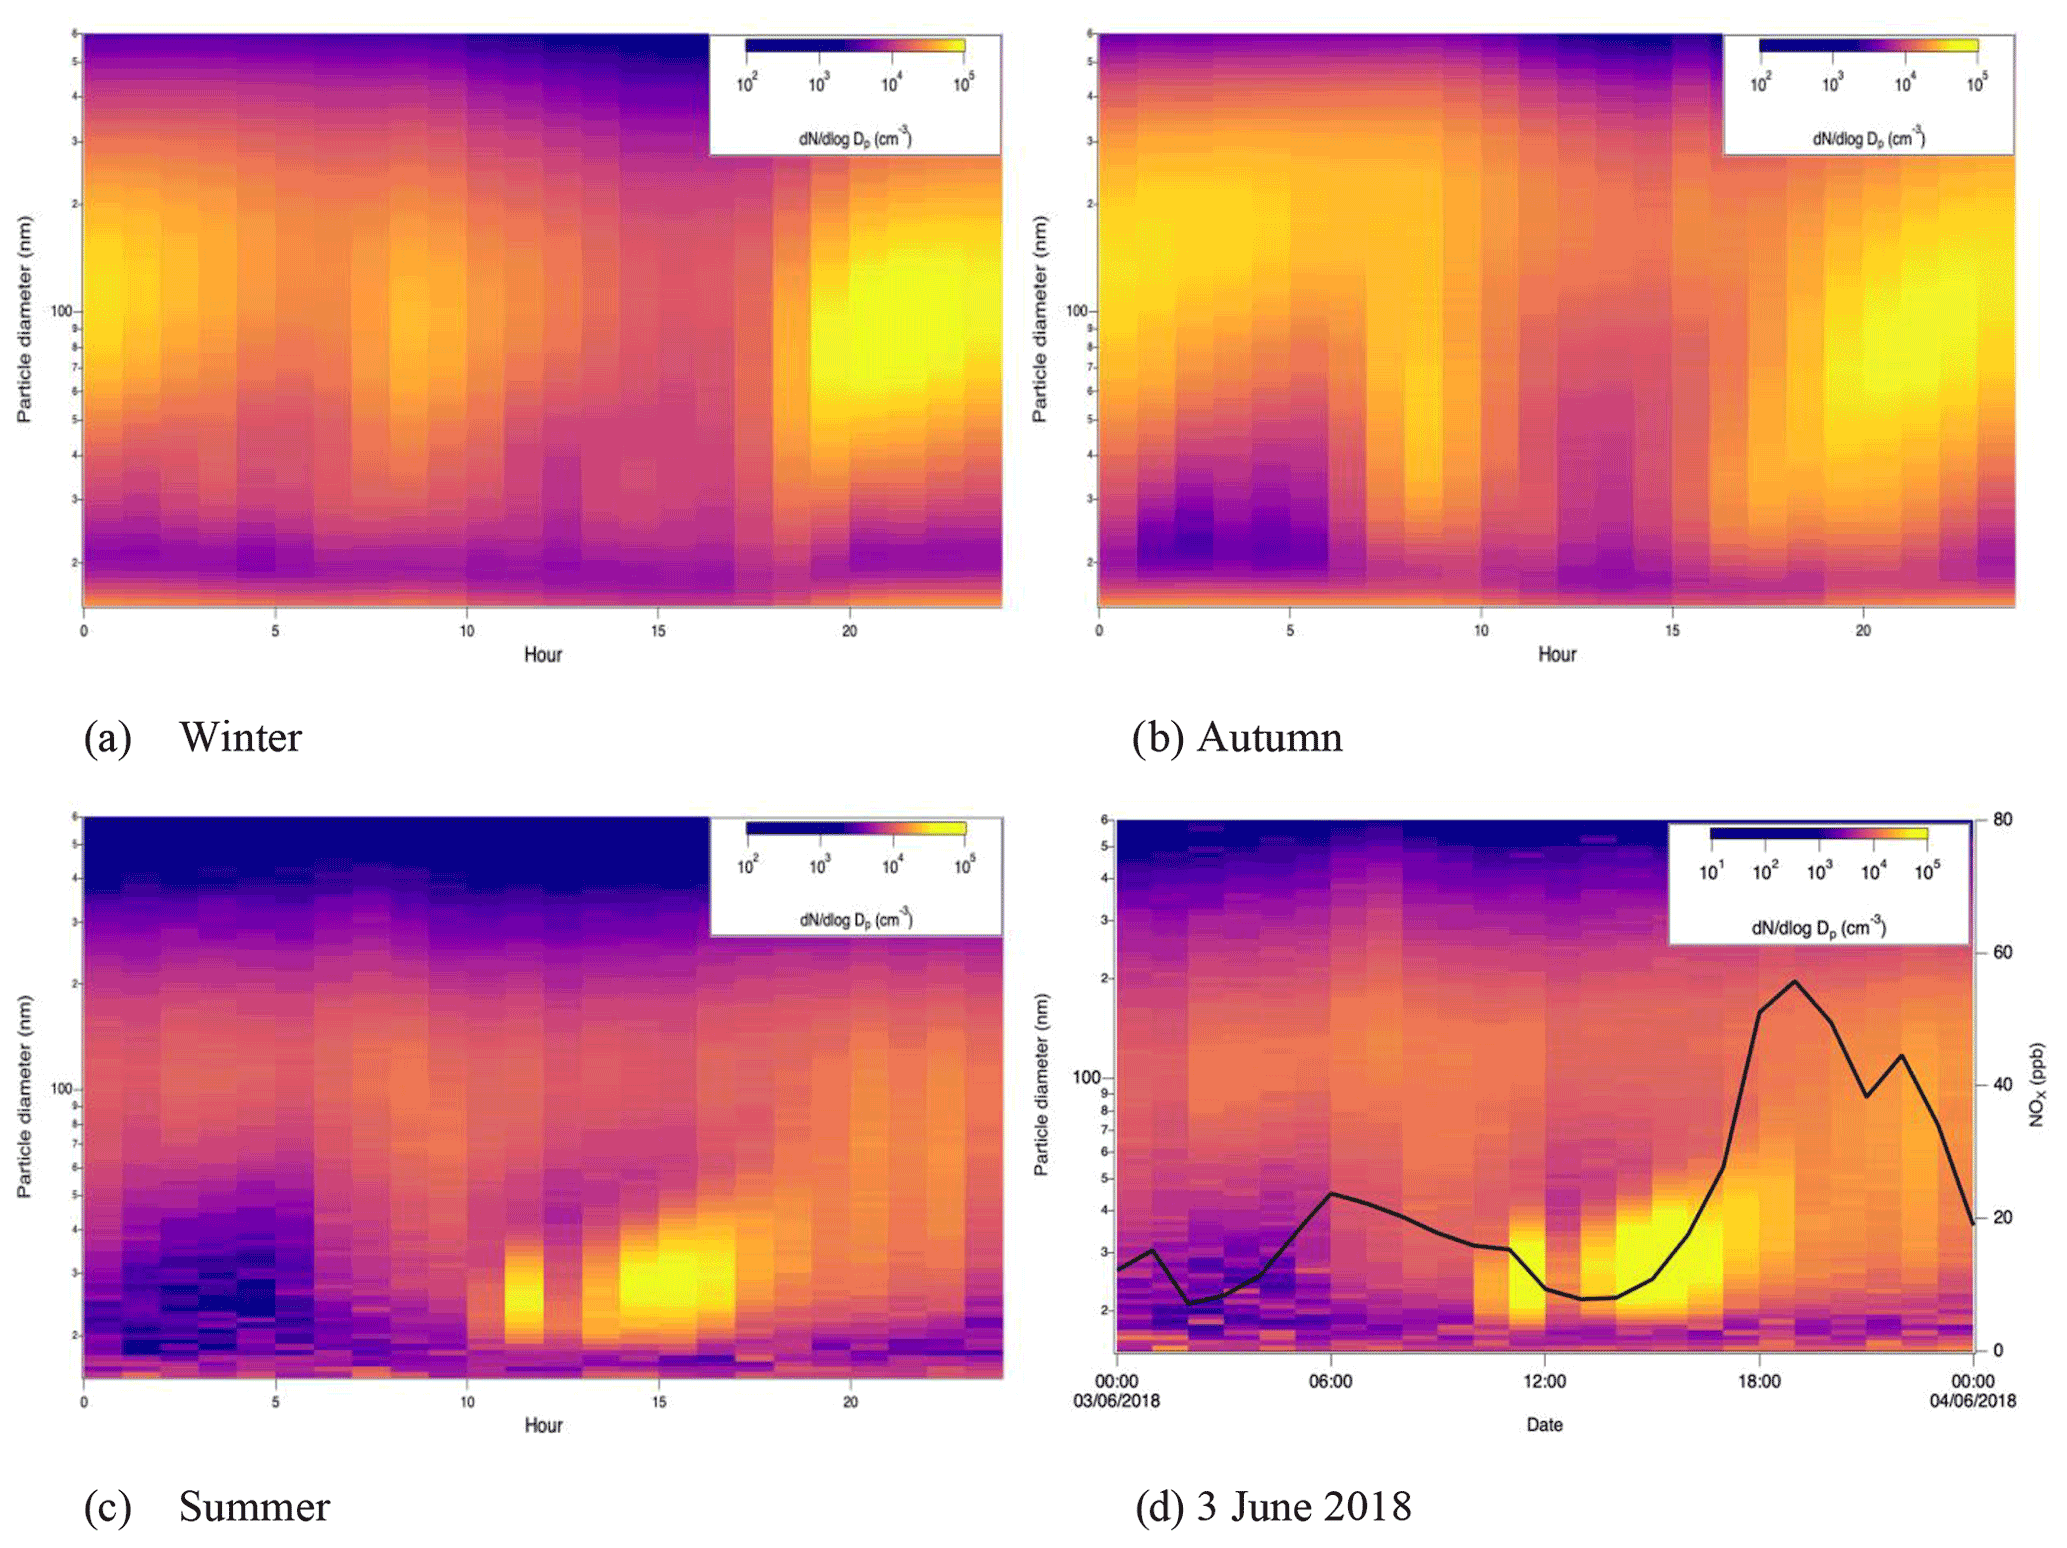
Figure 4Diurnal contour plots for particles derived by SMPS between 15 and 660 nm averaged for each season (a – winter; b – autumn; c – summer) and for 3 June 2018 data when a new particle formation (NPF) event probably occurred (d). The solid line shows the NOx mixing ratio.
Figure 3 shows the differences in the diurnal variations in total PN levels between the weekday and weekend. These are based upon a small dataset, and hence, the rather small differences within a season may not be meaningful. In winter, the PN levels on Saturday and Sunday are higher than on the weekdays during the night (from 20:00 to 10:00 LT the next day). However, after the morning rush hour peaks, during the daytime, the PN levels are the same for all days. The diurnal variation in PN in the autumn shows no significant differences among the days with the same main peaks in the morning for all days, although they are the highest on Saturday. There is a flattened peak (from 8:00 to 10:00 LT) in the morning rush hour for the weekday, while there are pointed peaks at approximately 9:00 on Saturday and Sunday in winter and autumn. Measurements made during the summer period are very limited. Due to there being only 4 full days and 9 half days of measurements, it is very hard to draw any conclusions. Even so, there are indications of a weekday traffic effect upon the PN levels in summer. There is only 1 d of measurements on a Sunday (3 June 2018), and it shows the midday peaks. Overall, despite seasonal differences, there appears to be a strong influence of light duty road vehicles upon the diurnal profiles, which reflect the traffic volumes, with a noticeable impact of heavy duty vehicles upon nighttime concentrations of all particle fractions.
New particle formation (NPF) events present variable seasonality for different areas, though in most cases they appear to be more frequent during spring or summer (Salvador et al., 2021). Gani et al. (2020) studied long-term PNSD in Delhi and have stated that they did not see any NPF during the winter or autumn seasons in Delhi. In this study, the identification of NPF events was conducted manually using the criteria set by Dal Maso et al. (2005) and by Bousiotis et al. (2019, 2021). The data were analysed visually on a day-to-day basis, for each 24 h period, from midnight to midnight. According to these criteria, a NPF event is considered when a distinctly new mode of particles appears in the nucleation mode size range, prevails for some hours, and shows signs of growth. These are the initial criteria used in identifying the events. Following that, as the dataset starts from a rather large size (15 nm), to be more confident about the events and not to confuse them with pollution events, high time resolution data for NOx and the fluctuations in the condensation sink were also used to identify pollution events affecting particle concentrations which were not considered. Hence, while we checked the particle size distributions for the NPF events, we also looked at the levels of pollutants to ensure that what was attributed to a NPF event was not particles from pollution/direct emissions. By considering the pollution levels and condensation sink, we can reduce the possibility of including particle formation events that are not associated with secondary formation. After analysing all the data, measurements from only one day during the measurement campaign were compliant with the criteria set as a class Ia NPF event. Figure 4 presents the contour plots of average diurnal variation for all seasons and for the NPF event on 3 June. The NPF may be suppressed due to very high pre-existing aerosol concentrations (Kanawade et al., 2020; Gani et al., 2020) during severe air pollution episodes in Delhi. This suppression effect has also been observed in European cities (Bousiotis et al., 2019, 2021).
A new study by Sebastian et al. (2022) analysed PNSD and the frequency of NPF at six different locations in India. The Delhi observation site is in an urban area and located at CSIR – National Physical Laboratory (NPL), approximately 8 km from the IIT location described as urban background in our study. They found that the NPF frequently occurs in the spring season but is least common in autumn and winter due to air pollution episodes suppressing the NPF. They also stated that the highest concentration and frequency of occurrence of NPF events in was Delhi as compared to other sites. As in other studies (such as Bousiotis et al., 2021), this study also emphasized that the increased concentrations of precursor gases are important for the occurrence of NPF in urban areas.
3.3 Day- and nighttime differences in PN and PV
Table S3 presents the summary statistics of the particle number and mass levels derived from the merged particle number data and BC, NOx, and PM2.5 at night and during the day for each season, excluding Diwali. Figure 5 shows the particle number comparison of all modes at night and during the day seasonally. At both night- and daytime, the nucleation counts are approximately the same in autumn and summer ( and 1.0) and a little higher at night in winter (). But in the night, Aitken and accumulation counts are higher than in the day by factors of 1.4 and 1.5 times in summer, 1.2 and 1.5 times in autumn, respectively, and approximately a factor of 2 higher in winter. While the coarse mode PN counts are approximately the same for all seasons and day-/nighttime, the large fine PN levels in the nighttime are significantly higher (1.7) than in the daytime in summer. It seems that, in the nighttime, high PM concentrations are due to the increasing Aitken and accumulation modes occurring from the coagulation of nucleation mode particles, condensation of low volatility species, or hygroscopic growth. In addition, biomass burning and older diesel vehicles can contribute significantly to particles in these fractions (Kumar et al., 2013; Chen et al., 2017; Gani et al., 2020). Meteorological factors can also profoundly affect the PN levels in daytime and nighttime. The differences in wind speed between day and night in summer are lower than in winter and autumn (Fig. S7). Higher wind speed, and lower humidity, may favour the resuspension of coarse dust as a dominant mechanism in the summer. Seasonal changes in mixing depths are surprisingly small (Fig. S7) and, hence, unlikely to have a major influence. However, the major increases and decreases in the diurnal plots of pollutants (Fig. 2) are consistent with the diurnal plots of mixed layer height (MLH) (Fig. S7). Autumn and winter also have longer periods with low mixing heights, as seen in Fig. S7. Total particle number (TPN) showed a negative exponential dependence upon MLH, which became more scattered at lower values of MLH, probably reflecting the larger relative errors in MLH estimates at smaller values.
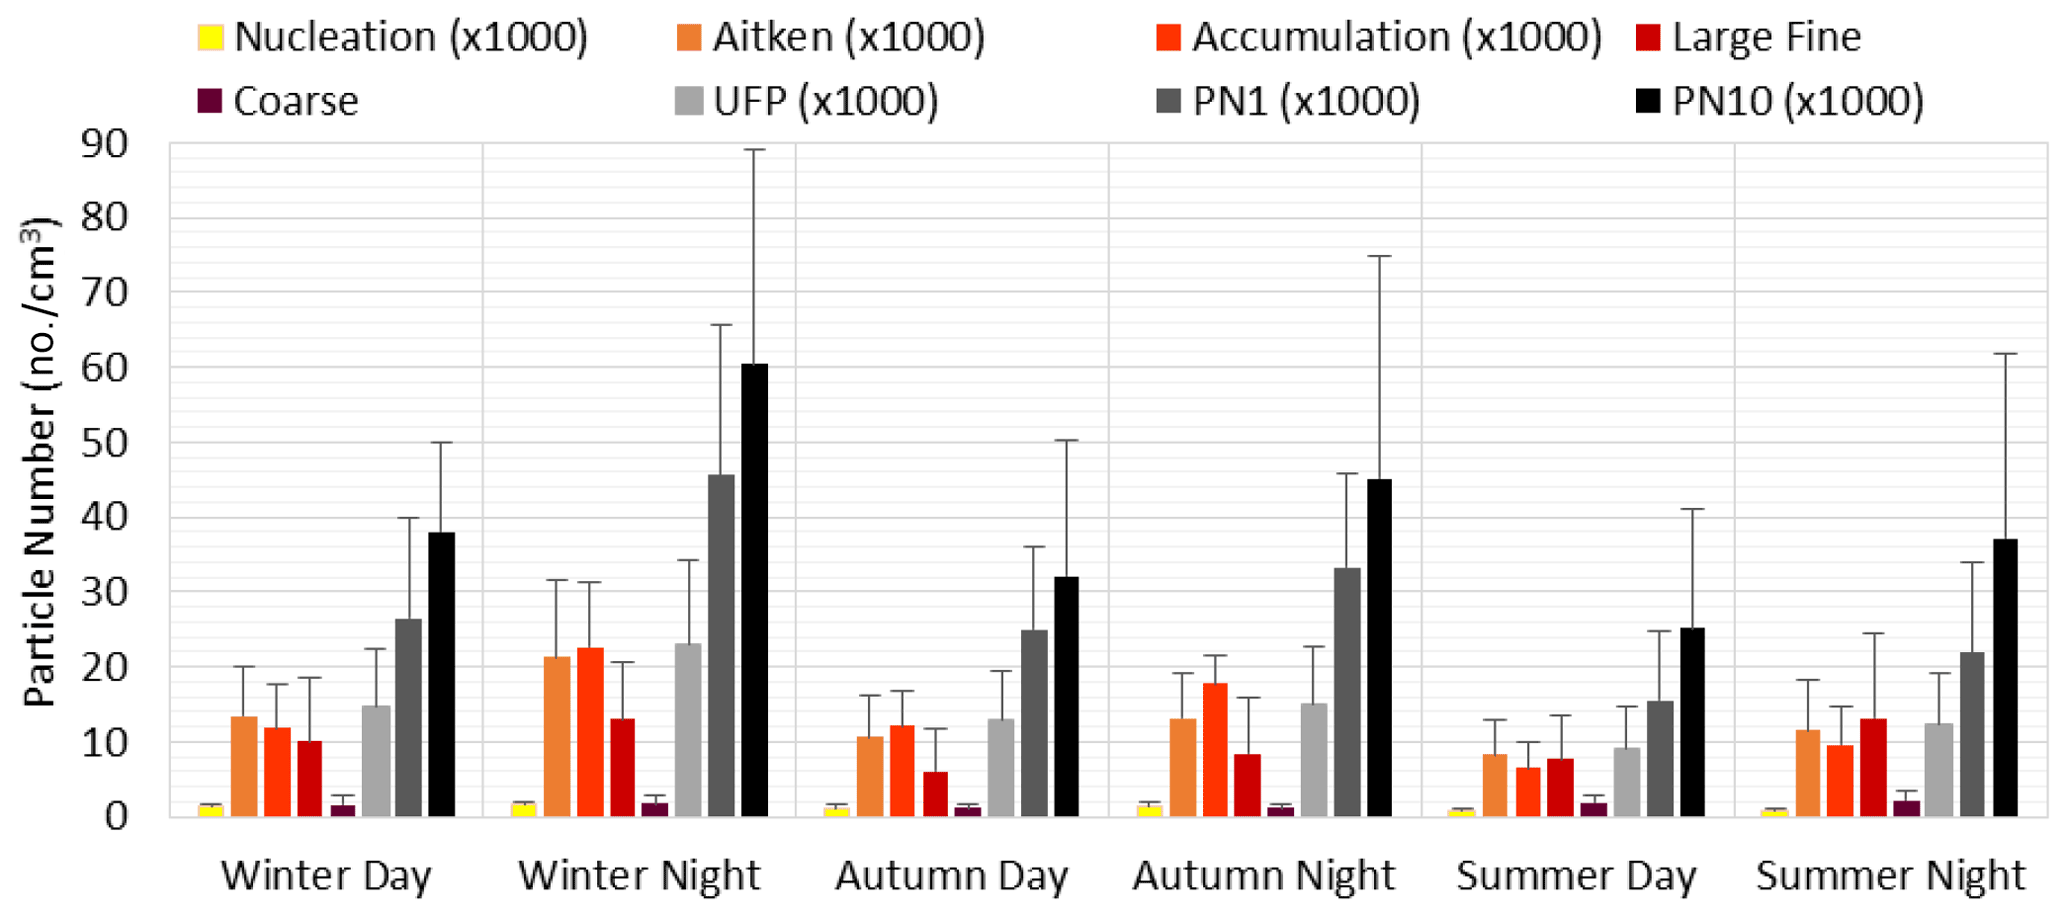
Figure 5The hourly average of day- and nighttime particle numbers for all modes from the wide-range particle sizes derived from the merged data. , , .

Figure 6Seasonal average (line) and standard deviation (shadow) of the particle number size distributions.

Figure 7Hourly average particle number distributions in autumn, summer, and winter in Delhi for the day- and nighttime (a, c, e) and during daytime hours (b, d, f).
Figure S8 represents the relation between the ventilation coefficients () and TPN as a function of the hour and month. Gani et al. (2020) reported that the VC is 4–6 times smaller for the wintertime compared to the summer in Delhi. In this study, the VC is 1.8 and 1.6 times higher in summer (mean of 2732 m2 s−1) compared to the winter (mean of 1491 m2 s−1) and autumn (mean of 1702 m2 s−1), respectively. The daytime hourly TPN levels are lower as related to the higher VC, and the lower VC in the colder months gives higher TPN. Although there are not enough daily data (especially for summer) to give more detail, we can see the same trend as compared to the weekly data from Gani et al. (2019) study.
Overall, for the daytime for all seasons, hourly averaged UFP concentrations are usually less than the nighttime; however, the UFP contribution to the PN1 (55 % during the day and 50 % at night for winter; 52 % during the day and 45 % at night for autumn; 58 % during the day and 56 % at night for summer) and PN10 (38 % during the day and 38 % at night for winter; 40 % during the day an 33 % in night for autumn; 36 % during the day and 33 % at night for summer) is mostly slightly higher in the daytime. Similarly, Gani et al. (2020) have reported the highest contribution (of UFP to PNC) in the daytime compared with the nighttime in Delhi. Due to the difference in PN size range (they measured down to 12 nm), they found the UFP contribution to PNC higher than in the present study.
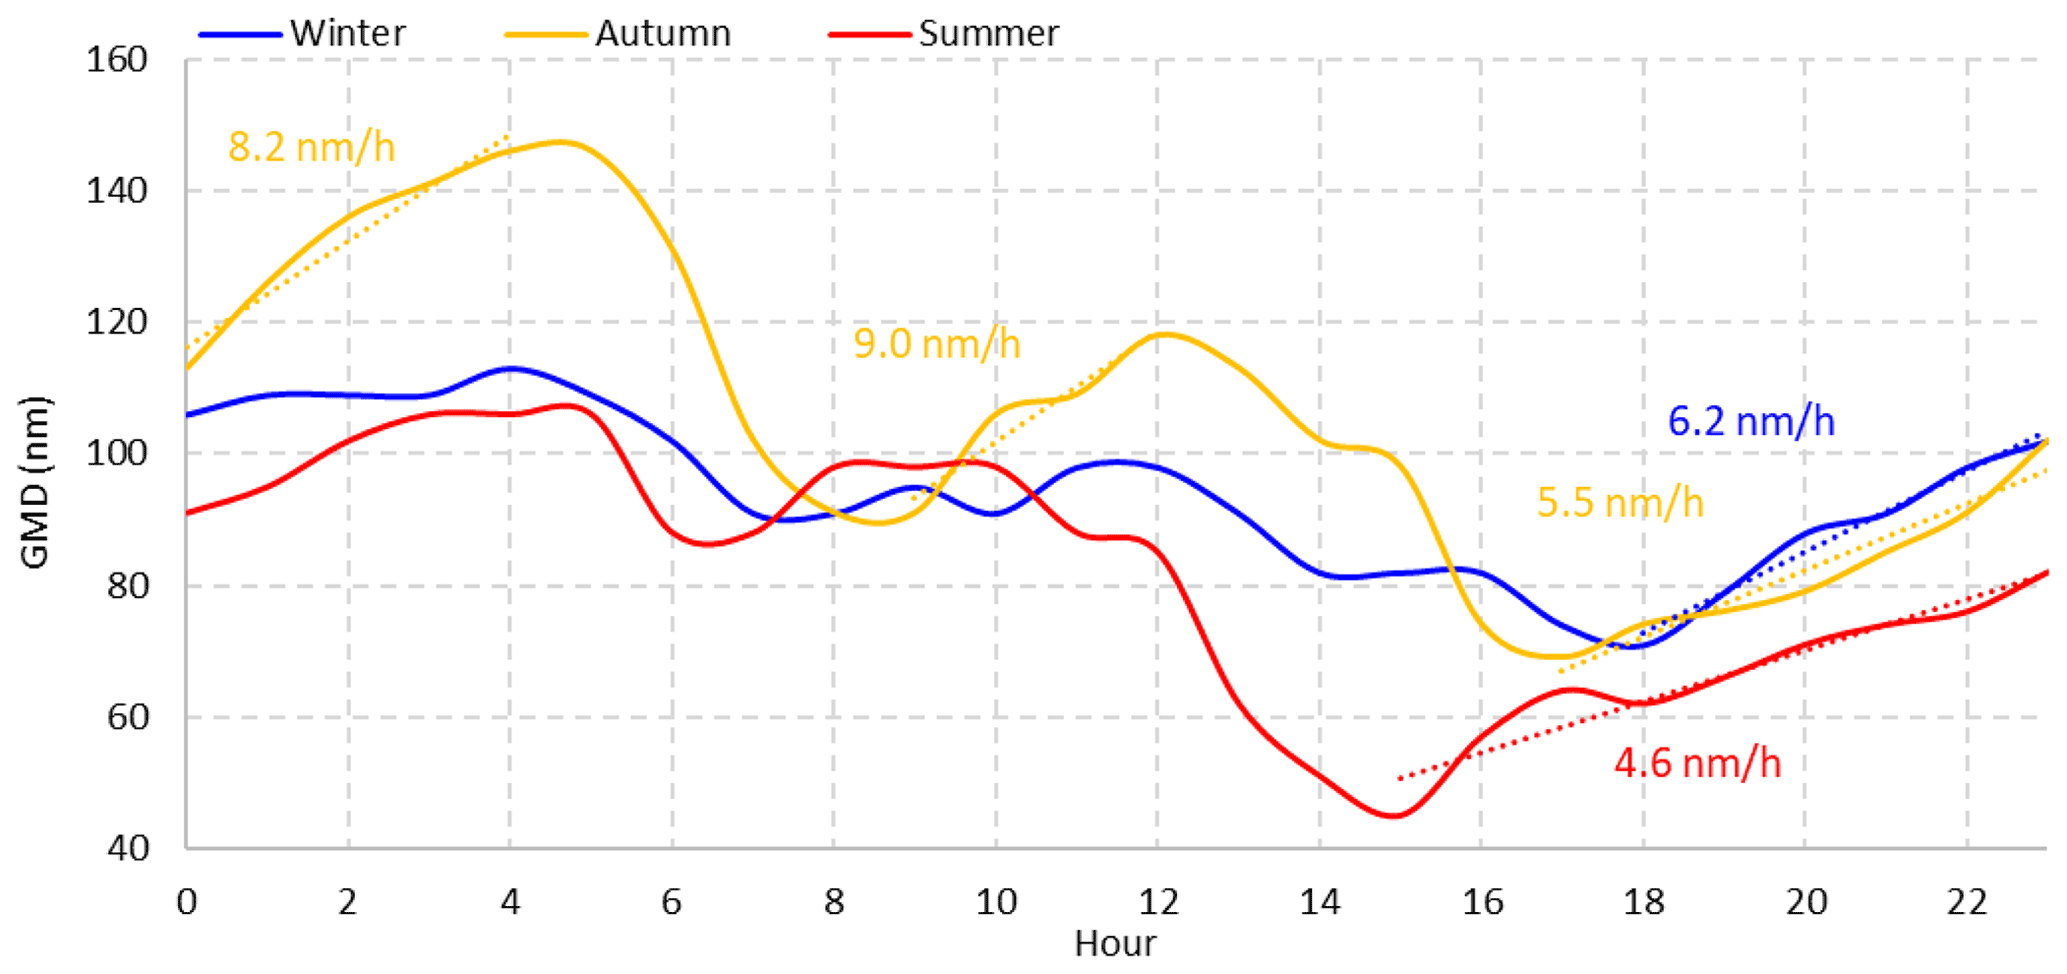
Figure 8Diurnal change in the geometric mean diameter (GMD) calculated for winter, autumn and summer seasons. Growth rates (nm/h) are calculated from dGMD/dt.
3.4 Size distributions
Figure 6 shows the average PNSD in three seasons in Delhi. Volume and area distributions are shown in the Supplement in Fig. S10. The highest number concentrations are seen in winter, followed by autumn, and then summer. Although the number concentrations of the particles below 200 nm are far greater in winter, those between 200 and 600 nm are greater in autumn within the accumulation mode. The winter and summer PNSD show modes at approximately 100 nm but the autumn PNSD shows the mode at approximately 200 nm. This could be due to changing sources of the particles in Delhi between seasons (Jain et al., 2020), in addition to (differing) aerosol dynamical processes. The Delhi atmosphere is more polluted compared with most other cities, based on particle number and mass (Harrison, 2020). This will cause a tendency for particles to grow more rapidly by coagulation and condensation (Harrison et al., 2018), but this might be expected to occur in all seasons.
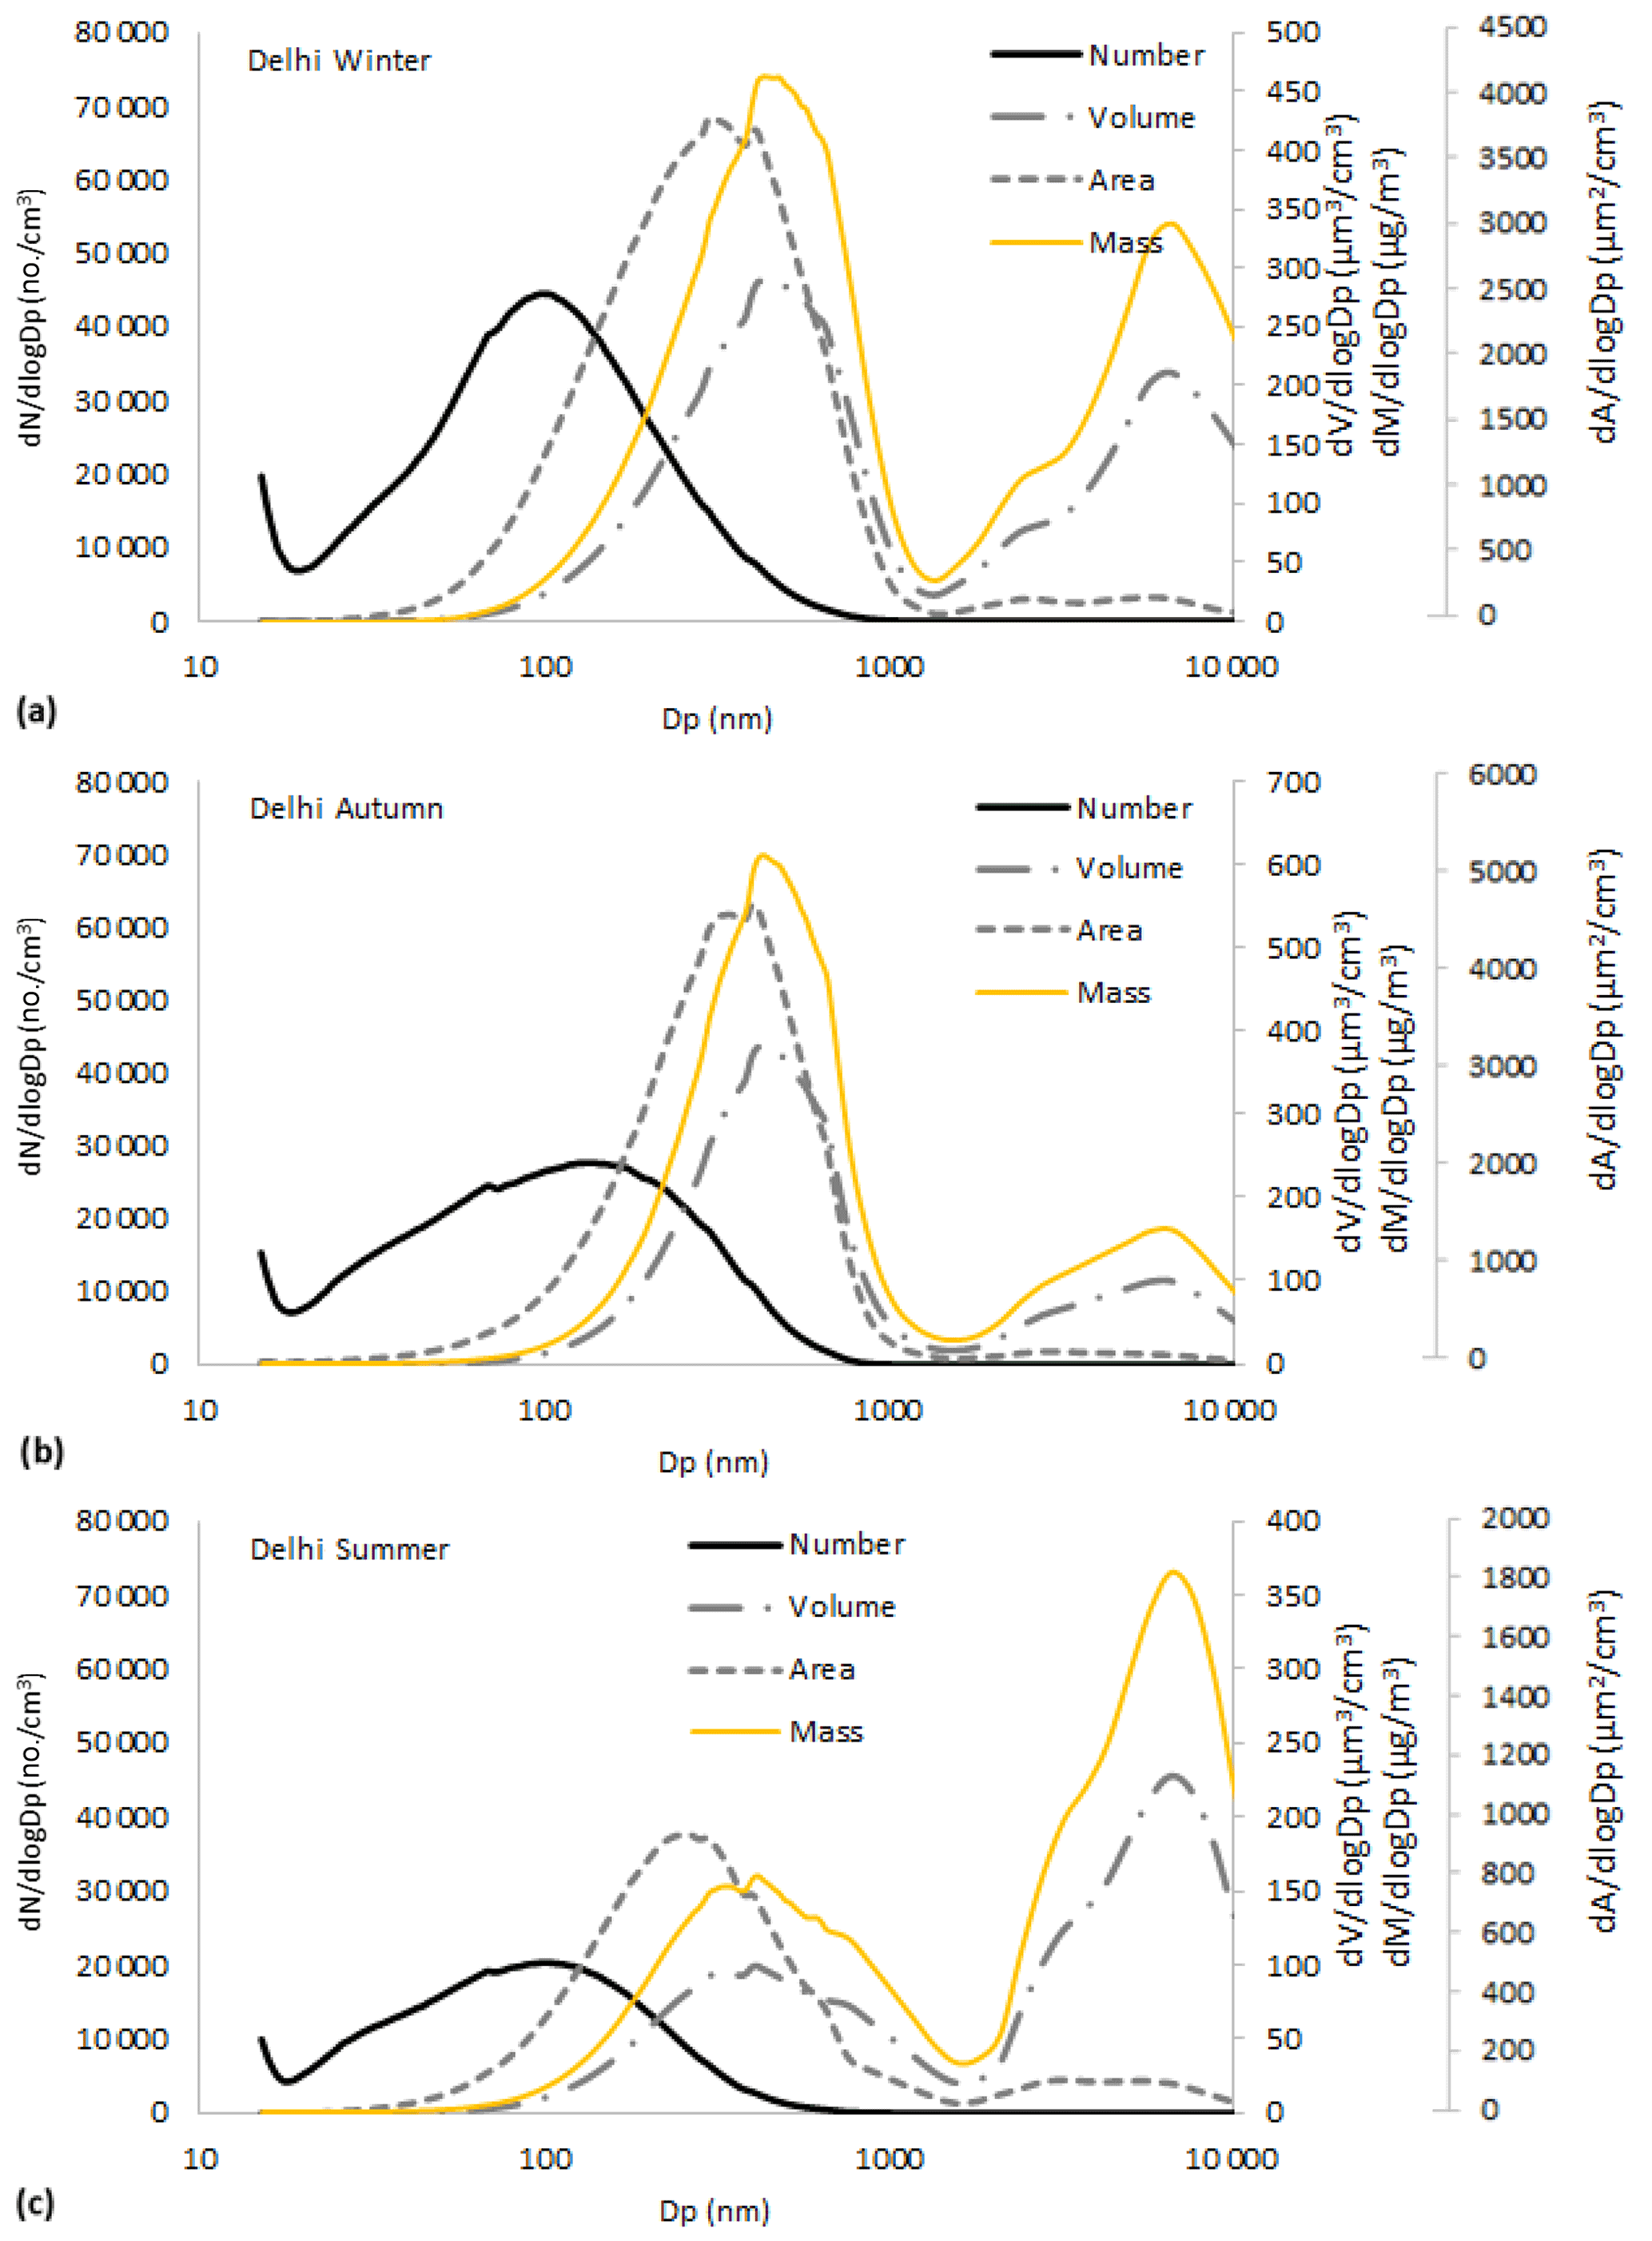
Figure 9Hourly average particle number, volume, and area distributions in the winter (a), autumn (b) and summer (c) in Delhi.
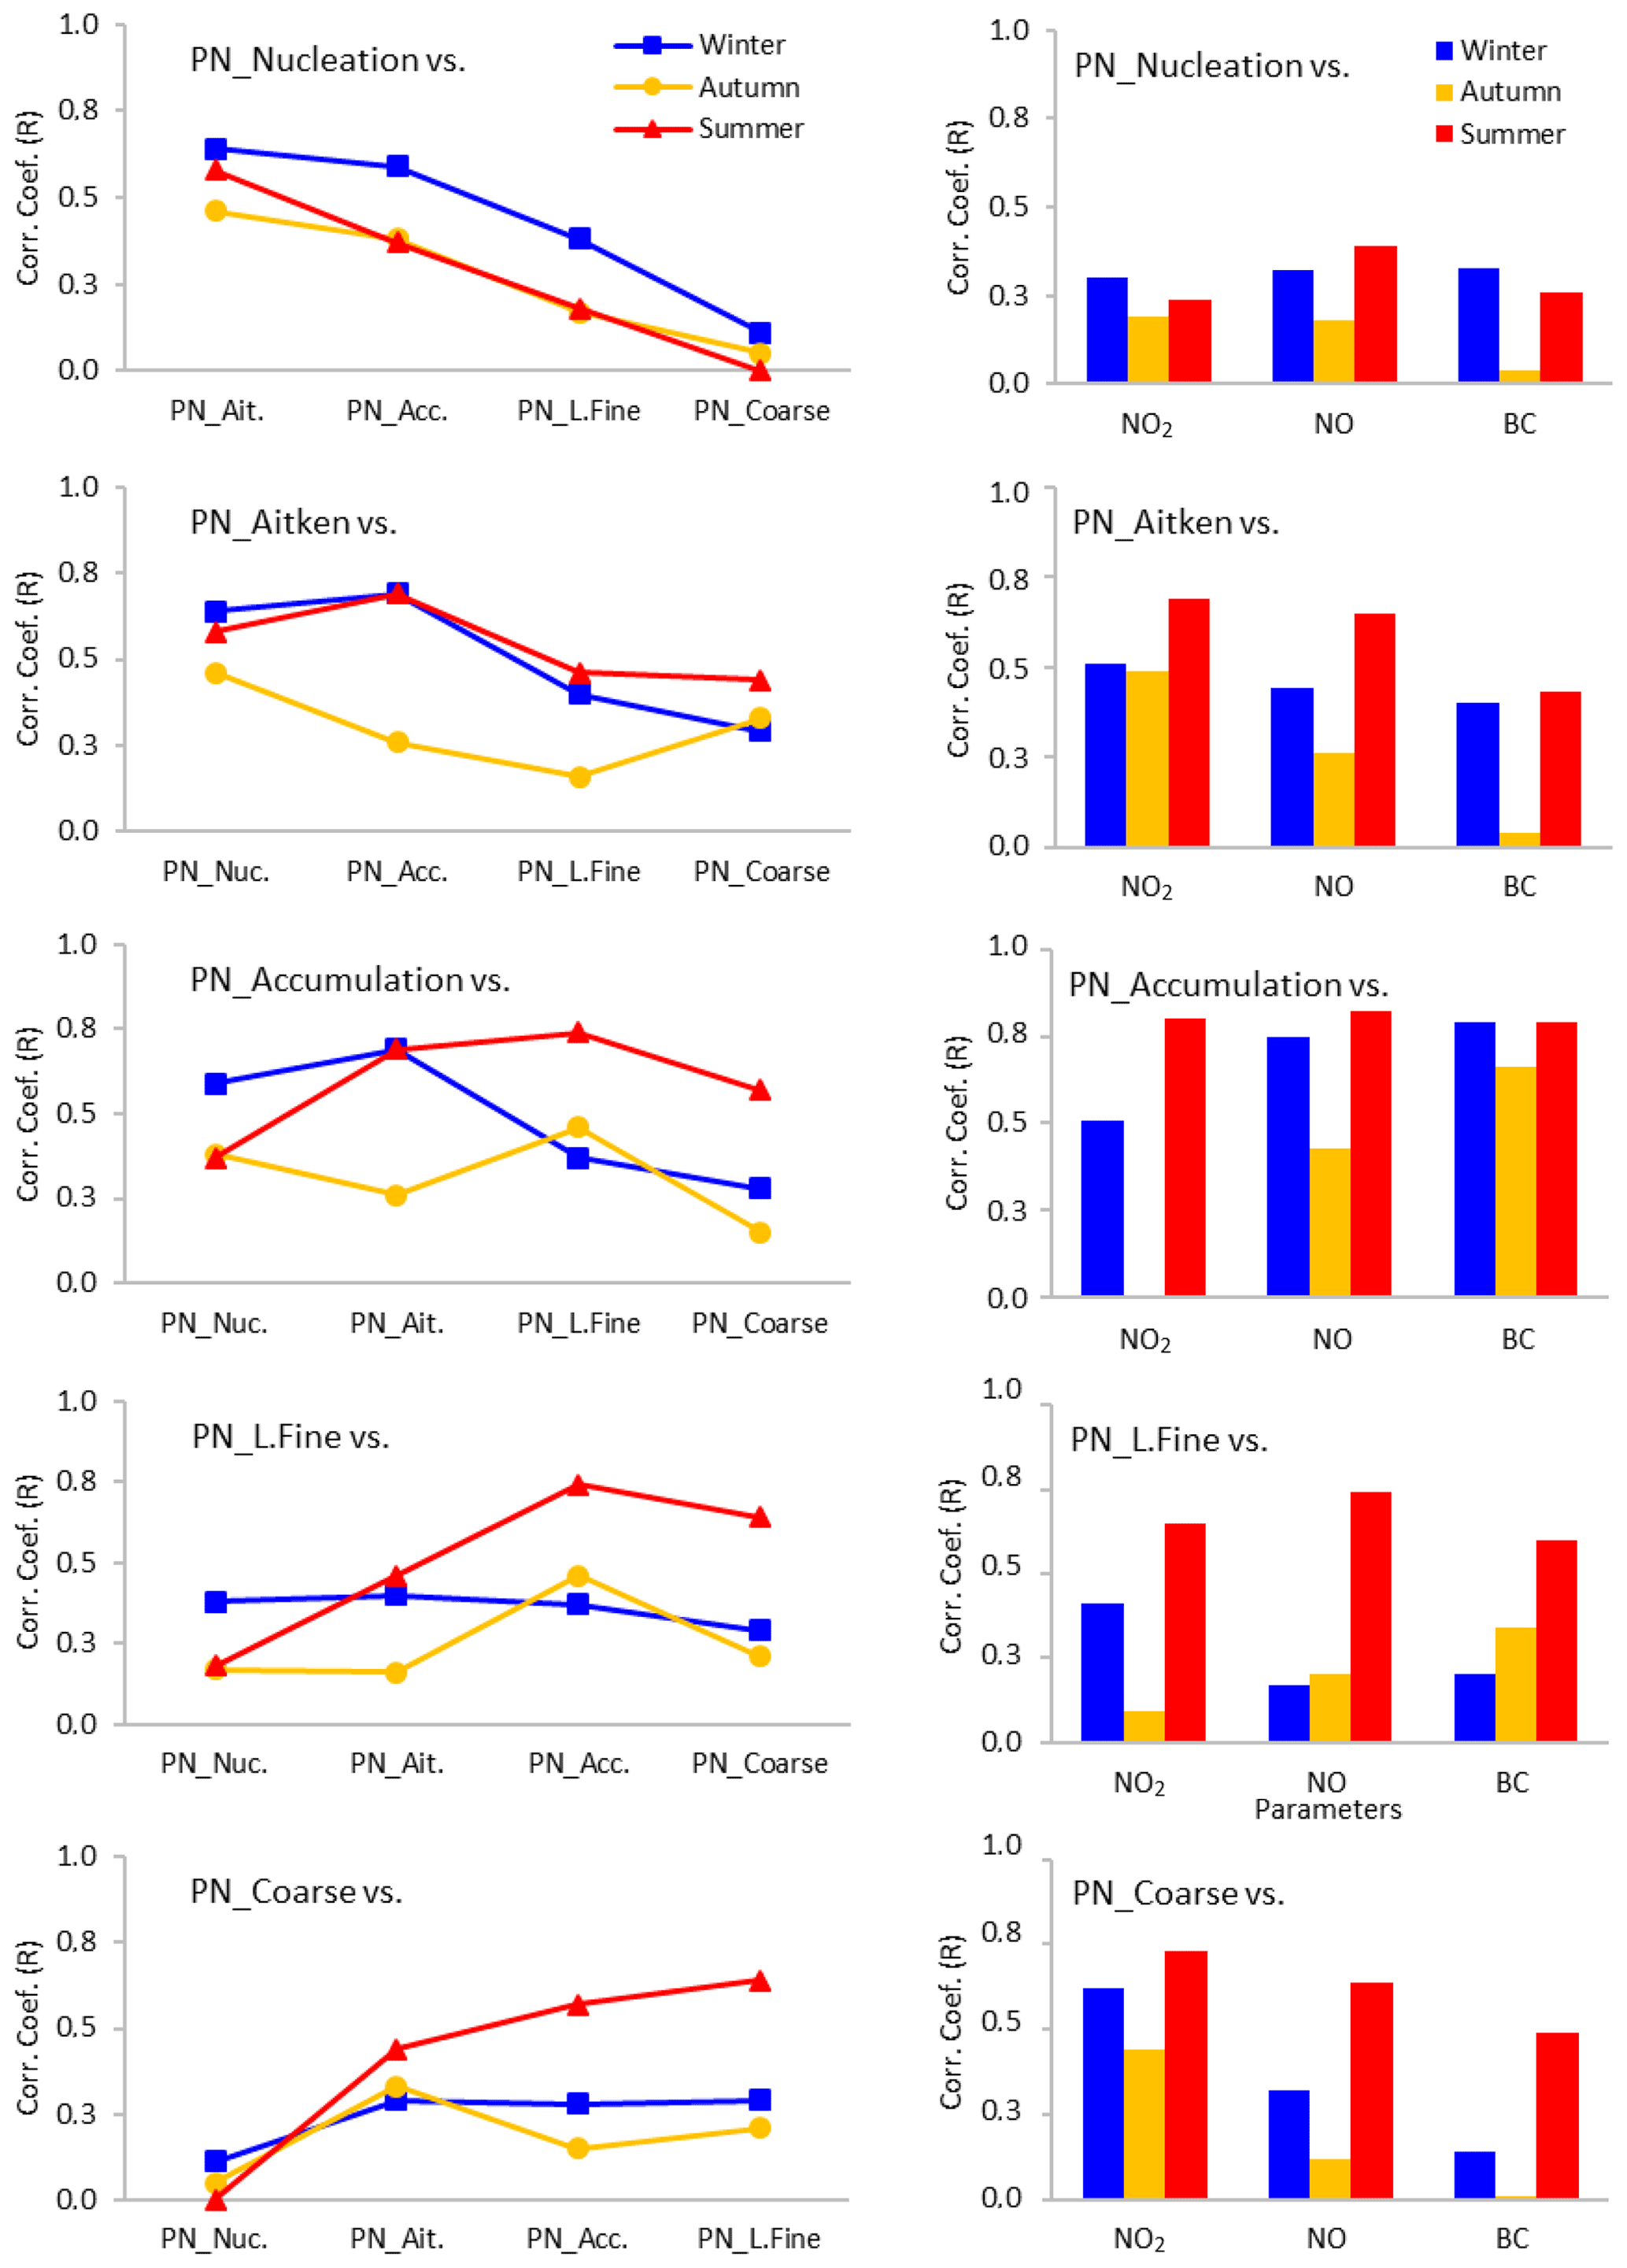
Figure 10Correlation coefficient (R) between the hourly average PNs of five particle size fractions (left side) and NO, NO2, and BC (right side).
As described above, in Delhi the nighttime particle concentrations are markedly higher than the daytime concentrations. The PNSD changes for each hour of the day across all three seasons were analysed (Fig. S11) and categorized. Figure 7 presents the PNSD differences between daytime and nighttime and shows the variation in PNSDs within the day in all seasons. The main difference between day and night in winter is only the number concentration, with little change in the mode size between day and night, while the PNSDs in summer and autumn show bimodal distributions with modes at approximately 30 and 140 nm in summer and 35 and 200 nm in autumn. When we focus on PNSD during the daytime, it can be clearly seen that the modes are manifest at different times. In winter, while the PNSD shows the same mode at approximately 100 nm from 8:00 to 14:00 LT, the mode in the afternoon (from 14:00 to 18:00 LT) drops slightly in size (70 nm). In the morning and afternoon, there are two small peaks at 60 and 40 nm for the Aitken fraction and 170 and 130 nm for the accumulation fraction in autumn. During the day in summer, there are two peaks at approximately 30 nm from 10:00 to 18:00. This may be associated with summer nucleation events and NPF on 3 June 2018 (Fig. 4). Furthermore it may be related to the growth in particles from 10:00 to 14:00 in autumn and summer. The full reasons for these changing PNSDs are not clear, and it would be unwise to attempt a detailed interpretation of a very small dataset.
Figure 8 shows the average geometric mean diameter (GMD) change with the hour of the day. In total, two overall periods of the GMD increase are observed. One of them is during the nighttime in all seasons, with GMD growing at between 4.6 nm h−1 in summer and 6.2 nm h−1 in winter. The particle growth in autumn is predominantly (when compared to the winter and summer) both late in the night (from 0:00 to 5:00 LT) and in the morning (from 8:00 to 12:00 LT). Considering the PNSD trend in autumn (Fig. 7), the GMD rises at 9 nm h−1 from morning to noon. Similar results were obtained in the USA (Kuang et al., 2012), Canada (Jeong et al., 2010; Iida et al., 2008), Italy (Hamed et al., 2007), and Japan (Han et al., 2013). However, the calculated GMD growth rate is smaller than that calculated by Sarangi et al. (2015, 2018) in Delhi, by Kalafut-Pettibone et al. (2011) in Mexico City, and by Zhang et al. (2011) in Beijing. The changing GMD with time in Delhi could be the result of changing sources and/or of dynamics. Nocturnal growth may be the result of reducing temperatures and increasing RH causing vapour condensation (Sarangi et al., 2018). Morning growth may be due to the oxidation processes leading to the production of less volatile vapours which then condense onto the particles (Sarangi et al., 2018).
Figure 9 gives the average particle number, volume, area, and mass size distribution for all seasons. While the number size distributions have one mode, two peaks are observed in volume distributions that are centred at 0.5 and 6 µm. These relate to two different main sources, which might be secondary aerosol (such as sulfate at high RH) in the fine mode and road dust resuspension, soil, or construction dust for the coarse mode (Pant et al., 2016). In winter and autumn, fine mode particle volumes are higher than the coarse mode. However, in summer the coarse mode particle volumes are higher than the fine particle level. In a recent paper, Thamban et al. (2021) show that modes in the mass size distributions of hydrocarbon organic aerosol (HOA), semi-volatile oxygenated organic aerosol (SVOOA), biomass burning organic aerosol (BBOA), and low volatile oxygenated organic aerosol (LVOOA) measured by aerosol mass spectrometry are typically in the range 300–600 nm vacuum aerodynamic diameter, very consistent with the peaks seen in the mass distributions in Fig. 9.
Hama et al. (2020) obtained the spatiotemporal characteristics of the daily averaged air pollutants and concluded that the particulate matter mass (PM10 and PM2.5) are dominated by local sources across Delhi. The main local air pollutant sources in Delhi include traffic, construction, resuspension of dust, diesel generators, power plants, industries, and biomass burning (Kumar et al., 2013; Nagpure et al., 2015; Hama et al., 2020).
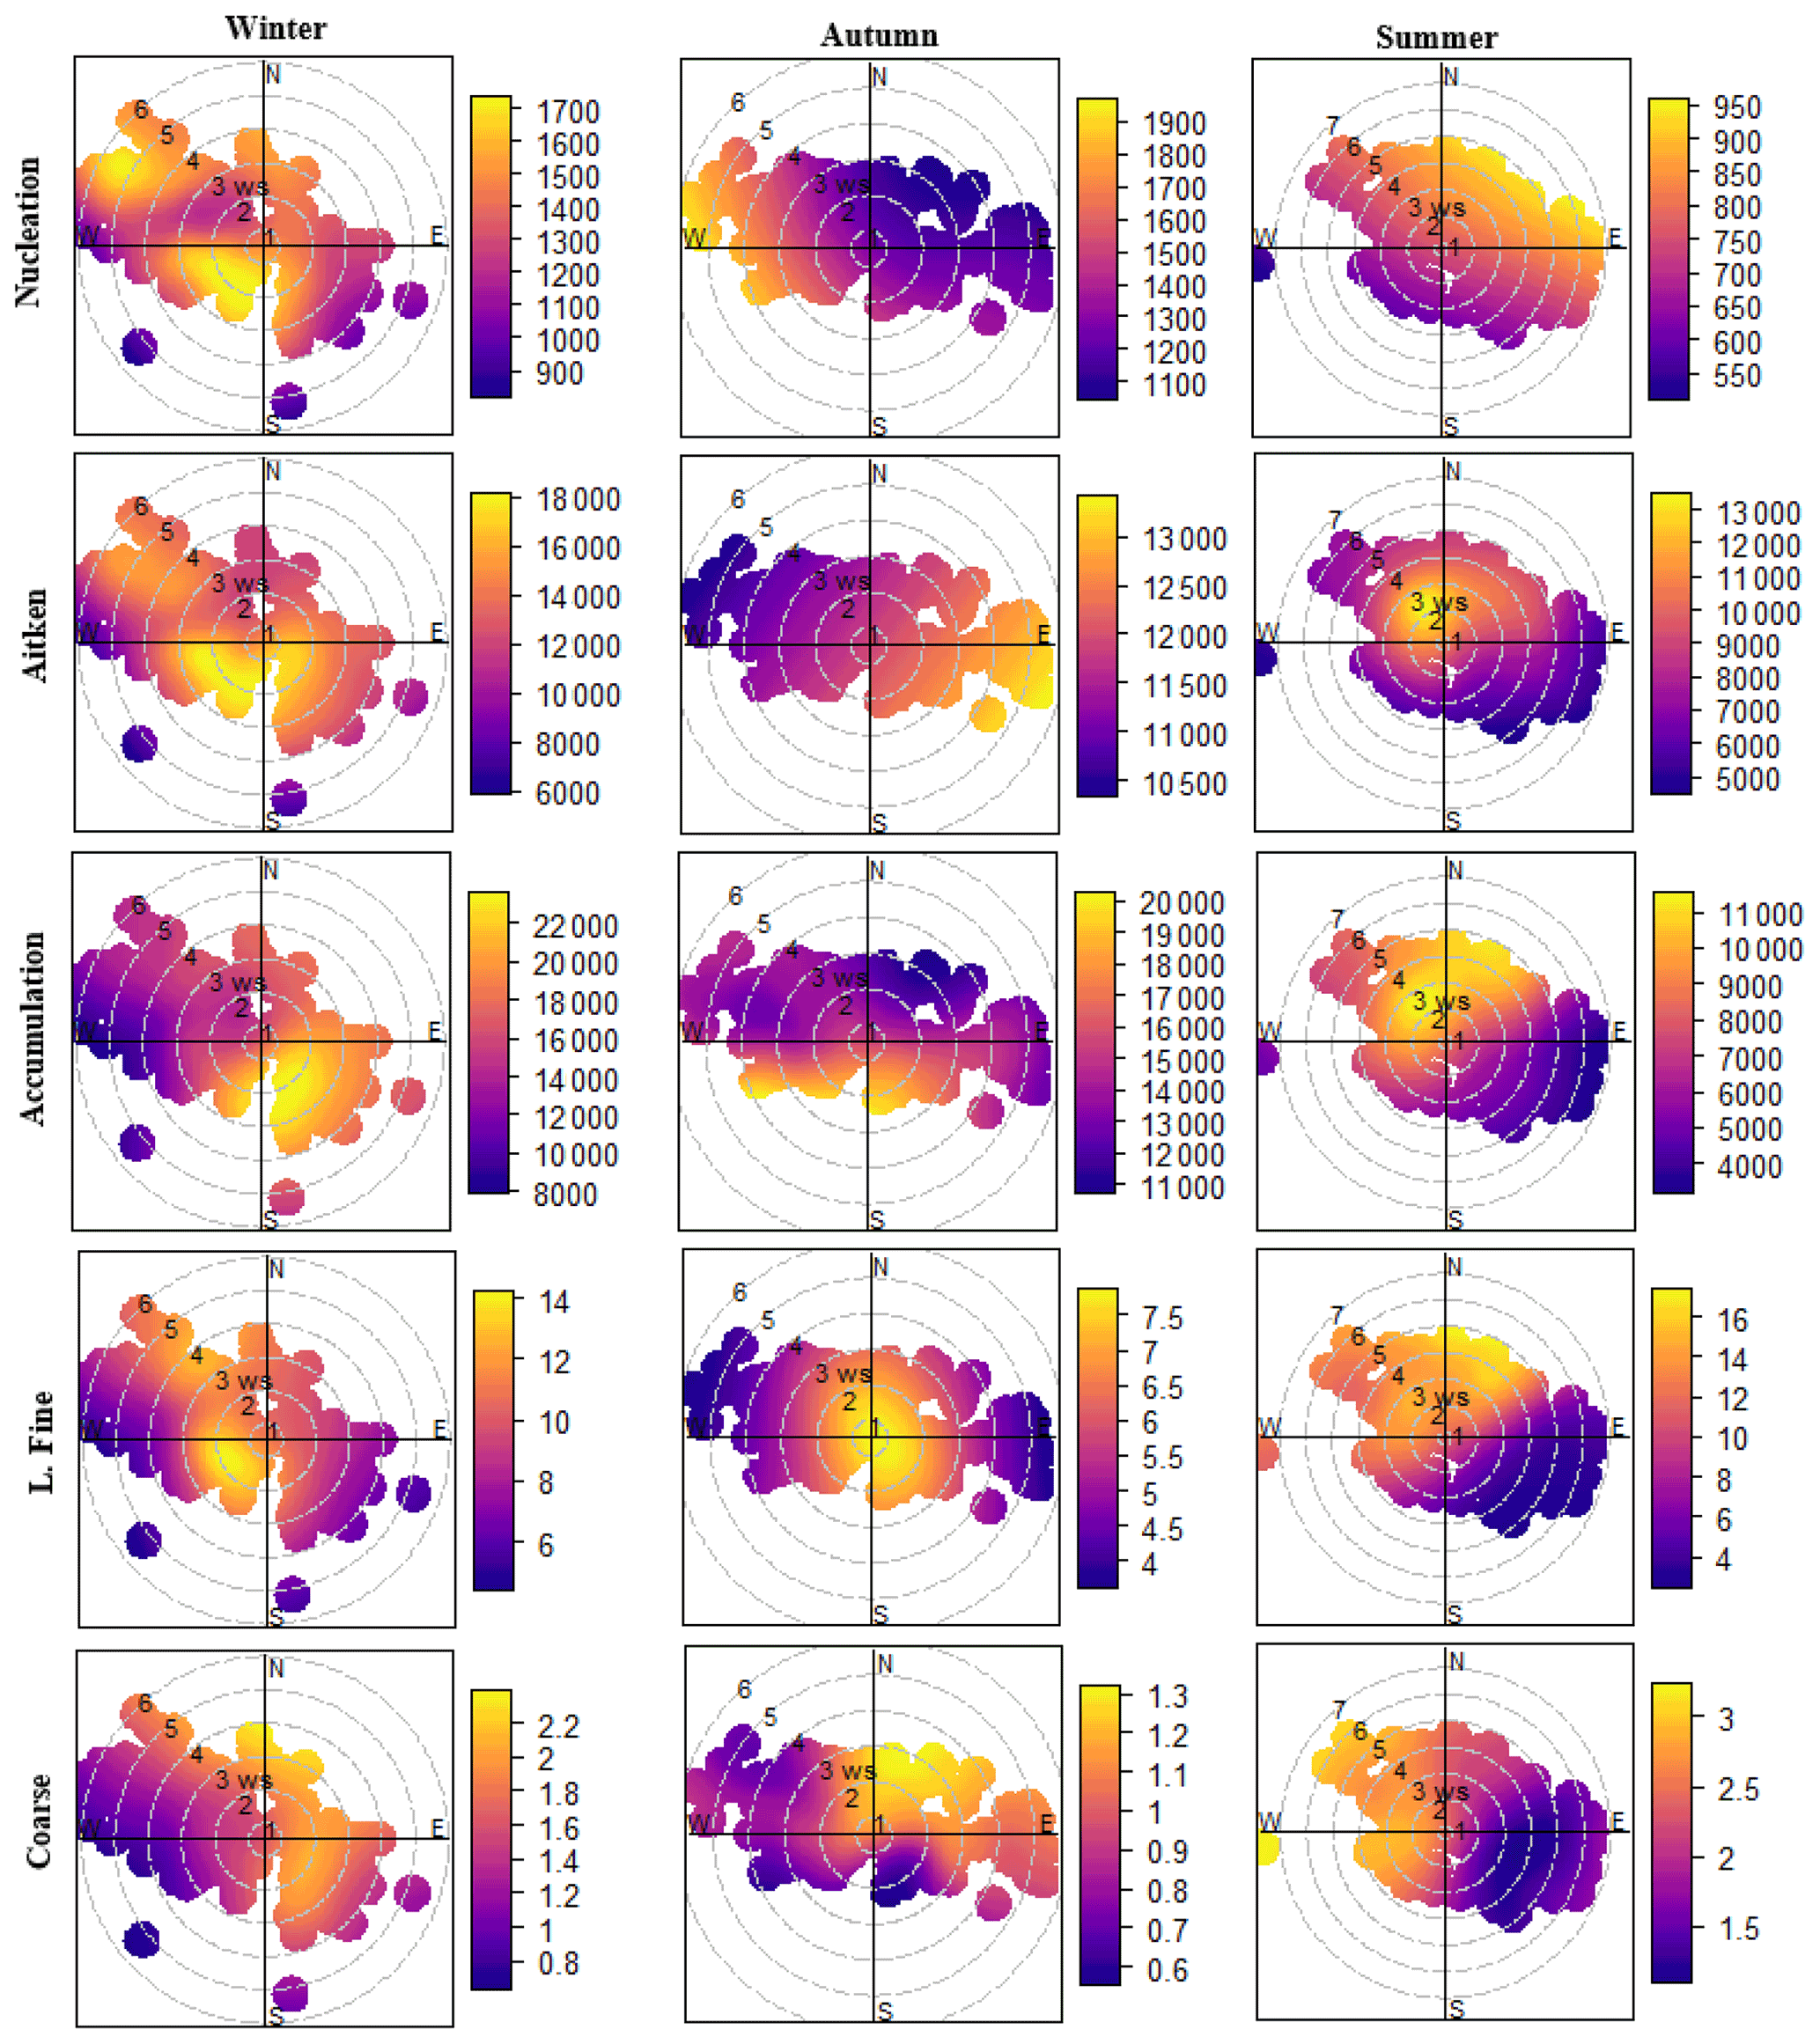
Figure 11Polar plots of PNs (number per cm3) for five particle size fractions in winter, autumn, and summer in Delhi.
All average PNSD graphs show an increasing trend in PNC at particle sizes below 19 nm particle diameter. SMPS measurements in this study were conducted only above 15 nm. So, the peak particle size within this size range cannot be seen. However, the clear increase in particle numbers below 19 nm indicates that another source may be important in Delhi. This small mode and bimodal PNSD during the day (Fig. 7) may be associated with the road transport vehicle types in Delhi. Despite the diesel restriction during rush hours and the conversion of the public transport vehicles to CNG, several studies have reported that PM2.5 concentrations have been remaining steady or are slowly increasing in India, especially in the winter and autumn seasons (Babu et al., 2013; Balakrishnan et al., 2019; Dandona et al., 2017; Kumar et al., 2017).
The fuels used in Delhi's traffic fleet are petrol, diesel, CNG, and LPG. Legislation limits the sulfur content of the fuel to 50 ppm in diesel as per Bharat Stage IV. The diesel vehicles are not required to be fitted with particle traps. The technology of the gasoline vehicle fleet varies as vehicle engine capacity changes. Cars, two/three wheelers, buses, and LCV fleet volumes are high during the day. Due to the time restrictions on trucks/heavy goods vehicles entering the city, during the daytime the HCV number is at its lowest level (Fig. S9).
Previous published studies indicate that emissions of particles from CNG vehicles (Euro 4, 5, and 6) with a diameter greater than 23 nm are as low as a diesel particle filter equipped vehicle and an order of magnitude lower than gasoline vehicles (Kontses et al., 2020; Giechaskiel, et al., 2019; Magara-Gomez et al., 2014; Schreiber et al., 2007), and CNG vehicles mainly emit nuclei mode particles (Zhu et al., 2014; Toumasatos et al., 2021). Zhu et al. (2014) calculated the size-resolved particle emission factors from on-road diesel buses and CNG buses and reported that the PNSD of diesel buses dominate the accumulation mode diameters of 74–87 nm, while the PNSD of CNG buses dominated the nucleation mode with modes at 21–24 nm. Total PN emissions of diesel buses per vehicle were 4 times higher than the level of CNG buses. However, the PN level in the nucleation mode (15–25 nm) of CNG buses was 1.7 times higher than from the diesel buses in the nucleation mode. Toumasatos et al. (2021) studied the particle emission performance of the Euro 6 CNG and gasoline vehicles and discussed the current EU cutoff solid PN size threshold of 23 nm. The results revealed that PN>23 nm represented 43 % of PN>10 nm and 8 % of PN>2.5 nm for gasoline vehicles and 7 % of PN>10 nm and 1 % of PN>2.5 nm for CNG vehicles, respectively. These studies of emission PNSDs show that a significant number of particles reside below the EU lower measurement limit of 23 nm, and many are even smaller than 10 nm. These probably contribute to the mode seen just appearing at the extremely small particle limit of Fig. 9.
When the PNSD results measured in Delhi are compared with the main emission categories in the literature (Kumar et al., 2013; Vu et al., 2015), it seems that the average size distributions measured in the atmosphere in Delhi are much coarser, which is presumably due to condensation and coagulation, or it could be that secondary particles dominate over the primary emissions. Pant et al. (2016) hypothesized that the main accumulation mode peak in their winter measurements arose from aqueous droplet evaporation, although this mechanism would be unlikely to explain the mode seen in the summer data. Thamban et al. (2021) have also reported particle growth in the Delhi atmosphere from the condensation of organic compounds formed from oxidation processes.
Previous studies have attempted to quantify the relative contribution of primary and secondary sources to the total and mode-segregated particle number concentrations (Rodríguez, and Cuevas, 2007; Kulmala et al., 2016, 2021; Hama et al., 2017; Casquero-Vera et al., 2021). Rodríguez and Cuevas (2007) first presented the methodology for the separation of traffic-related primary aerosol particles from the total using the BC as the main tracer of traffic. The method was tested in this study but did not prove appropriate as the BC sources in Delhi are more complex and do not only arise from traffic. The BC diurnal trend (Fig. 2) does not show the rush hour peaks and reflects mostly the combustion activity at night, presumably including the heavy duty diesel emissions. A recent study by Kulmala et al. (2021) used NOx as a tracer of primary sources. Figure 2 shows that only the NO2 diurnal trend in autumn is clearly related to traffic sources. Furthermore, the sources of BC and NOx are largely the same, as judged from the high similarity between BC and NOx diurnal trends (Fig. 2).
3.5 Correlations of PN with NO2, NO, and BC
Figure 10 shows the correlation coefficients between the hourly average PNs of five particle size fractions and NO, NO2, and BC measured in Delhi. Nucleation mode PN is better correlated with the Aitken mode PN in winter and summer despite the lower correlation in autumn. The correlations among >1 µm size fractions are higher in summer than winter and autumn. Tyagi et al. (2016) stated that the major source of NOx emissions is vehicle exhaust and power plants in Delhi. Furthermore, studies have reported that approximately 80 %–90 % of NOx and CO are produced from the transport sector in Delhi (Gurjar et al., 2004; Gulia et al., 2015; Tyagi et al., 2016; Hama et al., 2020). As seen in Fig. 2, the NO2 diurnal trend is very similar to nucleation and Aitken particle trends, especially in the autumn. NO2 peaks in autumn in the traffic rush hours are larger than in winter and summer. In addition, there are no significant correlations between NO2 and NO or BC in autumn (0.02 for NO; 0.03 for BC) compared to the summer (0.73 for NO; 0.61 for BC) and winter (0.37 for NO; 0.28 for BC; Fig. S12). NO and BC diurnal trends show the same higher level in the night (Fig. 2), and they also have higher correlation coefficients (0.78 in winter, 0.77 in summer, and 0.72 in autumn) for all seasons, similar to the accumulation mode particle counts (Figs. 2 and 10; Table S2). NO2 and <100 nm particles may be associated with traffic sources, while the NO and BC and <1 µm particles could be associated with biomass burning, industry (small generator), power generation, or possibly also with diesel vehicles.
3.6 Wind effects
Figure S13 represents polar plots of BC, NO, and NO2 that were measured in Delhi. This shows no consistent pattern. There are differences between the pollutants in terms of directional and wind speed associations and for each pollutant/season. There is no obvious indication of a strong local source influence, typically manifest as an intense area in the very centre of the plot circle. The plots for the particle size fractions (Fig. 11) also show little consistency between seasons for a given size fraction. Within a season, however, adjacent size fractions often show similar behaviour (consistent with their correlations; see above), but this similarity does not extend across all size ranges within a season.
This study serves to highlight the remarkable complexity of airborne particulate matter in Delhi. The size distributions show marked seasonal changes, with coarse particles dominant in summer, but not in the cooler seasons when the accumulation mode dominates. The measured size distributions show a fine mode aerosol with a considerably larger modal diameter than that typically seen in western countries and larger than the modal emission size from major source categories. It appears the that the high particle concentrations and chemically reactive atmosphere are promoting the rapid coagulation and condensational growth of particles, and therefore, the measured size distributions are driven more by aerosol dynamical processes than source characteristics. Growth via a liquid droplet phase in the cooler months may also occur. There is little evidence for a contribution of new particle formation (although the summer season dataset is small), consistent with earlier work by Gani et al. (2020). Another notable feature is the apparent complexity and seasonal variability in sources of NO, NO2, and BC, pollutants, which can often be used to identify or locate sources of emissions. This is reflected in the various particle fractions, which generally correlate poorly with the other pollutants and with fractions other than the proximate size.
The diurnal variation in all particle fractions is strongly suggestive of a road traffic influence, especially in the winter campaign. This appears to be strongly influenced by the emissions of heavy duty diesel traffic, which is only able to access central Delhi at night. A size mode of <15 nm may well be attributable to vehicles using LPG/CNG fuels. However, the seasonal variability in the geographic distribution and wind speed dependence of sources revealed by the polar plots is strongly indicative of many other sources also contributing to all size fractions of particles.
Data supporting this publication are openly available from the UBIRA eData repository at https://doi.org/10.25500/edata.bham.00000730 (Harrison and Şahin, 2021).
The supplement related to this article is available online at: https://doi.org/10.5194/acp-22-5415-2022-supplement.
This study was conceived by RMH. WB managed the research programme, and MSA, LRC, IK and RV collected the data. DCSB and ÜAS led the data analysis, with contributions from JB and DB. ÜAS and RMH co-authored the first draft. ZS and all co-authors provided comments and revisions.
The contact author has declared that neither they nor their co-authors have any competing interests.
Publisher’s note: Copernicus Publications remains neutral with regard to jurisdictional claims in published maps and institutional affiliations.
We would also like to acknowledgement the IIT Delhi team, under principal investigator Mukesh Khare, who provided all the facilities, including space and logistical help, during the experiment.
We are thankful to the Scientific and Technical Research Council of Turkey (TUBITAK; grant no. 1059B191801445), who supported the work of Ülkü Alver Şahin for this ASAP project. This research has been supported by the Natural Environment Research Council (grant no. NE/P016499/1).
This paper was edited by Armin Sorooshian and reviewed by two anonymous referees.
Azimi, P., Zhao, D., and Stephens, B.: Estimates of HVAC filtration efficiency for fine and ultrafine particles of outdoor origin, Atmos. Environ., 98, 337–346, https://doi.org/10.1016/j.atmosenv.2014.09.007, 2014.
Babu, S. S., Manoj, M. R., Moorthy, K. K., Mukunda, M. G., Vijayakumar, S. N., Sobhan, K. K., Satheesh, S. K., Niranjan, K., Ramagopal, K., Bhuyan, P. K., and Singh, D.: Trends in aerosol optical depth over Indian region: Potential causes and impact indicators, J. Geophys. Res., 118, 11794–11806, https://doi.org/10.1002/2013JD020507, 2013.
Balakrishnan, K., Pillarisetti, A., Yamanashita, K., and Yusoff, K.: Air quality and health in Asia and the Pacific, in: Air Pollution in Asia and the Pasific: Science Based Solution, United Nations Environment Programme (UNEP), Bangkok, Thailand, ISBN 978-92-807-3725-7, 2019.
Beddows, D. C. S., Dall'osto, M., and Harrison, R. M.: An Enhanced Procedure for the Merging of Atmospheric Particle Size Distribution Data Measured Using Electrical Mobility and Time-of-Flight Analysers, Aerosol Sci. Tech., 44, 930–938, https://doi.org/10.1080/02786826.2010.502159, 2010.
Bhandari, S., Gani, S., Patel, K., Wang, D. S., Soni, P., Arub, Z., Habib, G., Apte, J. S., and Hildebrandt Ruiz, L.: Sources and atmospheric dynamics of organic aerosol in New Delhi, India: insights from receptor modeling, Atmos. Chem. Phys., 20, 735–752, https://doi.org/10.5194/acp-20-735-2020, 2020.
Bikkina, S., Andersson, A., Kirillova, E. N., Holmstrand, H., Tiwari, S., Srivastava, A. K., Bisht, D. S., and Gustafsson, Ö.: Air quality in megacity Delhi affected by countryside biomass burning, Nature Sustainability, 2, 200–205, https://doi.org/10.1038/s41893-019-0219-0, 2019.
Bousiotis, D., Dall'Osto, M., Beddows, D. C. S., Pope, F. D., and Harrison, R. M.: Analysis of new particle formation (NPF) events at nearby rural, urban background and urban roadside sites, Atmos. Chem. Phys., 19, 5679–5694, https://doi.org/10.5194/acp-19-5679-2019, 2019.
Bousiotis, D., Brean, J., Pope, F. D., Dall'Osto, M., Querol, X., Alastuey, A., Perez, N., Petäjä, T., Massling, A., Nøjgaard, J. K., Nordstrøm, C., Kouvarakis, G., Vratolis, S., Eleftheriadis, K., Niemi, J. V., Portin, H., Wiedensohler, A., Weinhold, K., Merkel, M., Tuch, T., and Harrison, R. M.: The effect of meteorological conditions and atmospheric composition in the occurrence and development of new particle formation (NPF) events in Europe, Atmos. Chem. Phys., 21, 3345–3370, https://doi.org/10.5194/acp-21-3345-2021, 2021.
Butt, E. W., Rap, A., Schmidt, A., Scott, C. E., Pringle, K. J., Reddington, C. L., Richards, N. A. D., Woodhouse, M. T., Ramirez-Villegas, J., Yang, H., Vakkari, V., Stone, E. A., Rupakheti, M., S. Praveen, P., G. van Zyl, P., P. Beukes, J., Josipovic, M., Mitchell, E. J. S., Sallu, S. M., Forster, P. M., and Spracklen, D. V.: The impact of residential combustion emissions on atmospheric aerosol, human health, and climate, Atmos. Chem. Phys., 16, 873–905, https://doi.org/10.5194/acp-16-873-2016, 2016.
Casquero-Vera, J. A., Lyamani, H., Titos, G., Minguillón, M. C., Dada, L., Alastuey, A., Querol, X., Petäjä, T., Olmo, F. J., and Alados-Arboledas, L.: Quantifying traffic, biomass burning and secondary source contributions to atmospheric particle number concentrations at urban and suburban sites, Sci. Total Environ., 768, 145282, doi.org/10.1016/j.scitotenv.2021.145282, 2021.
Chelani, A. B., Gajghate, D. G., ChalapatiRao, C. V., and Devotta, S.: Particle Size Distribution in Ambient Air of Delhi and Its Statistical Analysis, B. Environ. Contam. Tox., 85, 22–27, https://doi.org/10.1007/s00128-010-0010-4, 2010.
Chen, F., Zhang, X., Zhu, X., Zhang, H., Gao, J., and Hopke, P. K.: Chemical Characteristics of PM2.5 during a 2016 Winter Haze Episode in Shijiazhuang, China, Aerosol Air Qual. Res., 17, 368–380, https://doi.org/10.4209/aaqr.2016.06.0274, 2017.
Chowdhury, S., Dey, S., Tripathi, S. N., Beig, G., Mishra, A. K., and Sharma, S.:”Traffic intervention” policy fails to mitigate air pollution in megacity Delhi, Environ. Sci. Policy, 74, 8–13, https://doi.org/10.1016/j.envsci.2017.04.018, 2017.
Conibear, L., Butt, E. W., Knote, C., Arnold, S. R., and Spracklen, D. V.: Residential energy use emissions dominate health impacts from exposure to ambient particulate matter in India, Nat. Commun., 9, 617, https://doi.org/10.1038/s41467-018-02986-7, 2018.
Cusworth, D. H., Mickley, L. J., Sulprizio, M. P., Liu, T., Marlier, M. E., DeFries, R. S., Guttikunda, S. K., and Gupta, P.: Quantifying the influence of agricultural fires in northwest India on urban air pollution in Delhi, India, Environ. Res. Lett., 13, 044018, https://doi.org/10.1088/1748-9326/aab303, 2018.
Dal Maso, M., Kulmala, M., Riipinen, I., Wagner, R., Hussein, T., Aalto, P. P., and Lehtinen, K. E. J.: Formation and growth of fresh atmospheric aerosols: eight years of aerosol size distribution data from SMEAR II, Hyytiala, Finland, Boreal Environ. Res. 10, 323–336, 2005.
Dandona, L., Dandona, R., Kumar, G. A., Shukla, D. K., Paul, V. K., Balakrishnan, K., Prabhakaran, D., Tandon, N., Salvi, S., Dash, A. P., Nandakumar, A., Patel, V., Agarwal, S. K., Gupta, P. C., Dhaliwal, R. S., Mathur, P., Laxmaiah, A., Dhillon, P. K., Dey, S., Mathur, M. R., Afshin, A., Fitzmaurice, C., Gakidou, E., Gething, P., Hay, S. I., Kassebaum, N. J., Kyu, H., Lim, S. S., Naghavi, M., Roth, G. A., Stanaway, J. D., Whiteford, H., Chadha, V. K., Khaparde, S. D., Rao, R., Rade, K., Dewan, P., Furtado, M., Dutta, E., Varghese, C. M., Mehrotra, R., Jambulingam, P., Kaur, T., Sharma, M., Singh, S., Arora, R., Rasaily, R., Anjana, R. M., Mohan, V., Agrawal, A., Chopra, A., Mathew, A. J., Bhardwaj, D., Muraleedharan, P., Mutreja, P., Bienhoff, K., Glenn, S., Abdulkader, R. S., Aggarwal, A. N., Aggarwal, R., Albert, S., Ambekar, A., Arora, M., Bachani, D., Bavdekar, A., Beig, G., Bhansali, A., Bhargava, A., Bhatia, E., Camara, B., Christopher, D. J., Das, S. K., Dave, P. V., Dey, S., Ghoshal, A. G., Gopalakrishnan, N., Guleria, R., Gupta, R., Gupta, S. S., Gupta, T., Gupte, M. D., Gururaj, G., Harikrishnan, S., Iyer, V., Jain, S. K., Jeemon, P., Joshua, V., Kant, R., Kar, A., Kataki, A. C., Katoch, K., Khera, A., Kinra, S., Koul, P. A., Krishnan, A., Kumar, A., Kumar, R. K., Kumar, R., Kurpad, A., Ladusingh, L., Lodha, R., Mahesh, P. A., Malhotra, R., Mathai, M., Mavalankar, D., Mohan Bv, M., Mukhopadhyay, S., Murhekar, M., Murthy, G. V. S., Nair, S., Nair, S. A., Nanda, L., Nongmaithem, R. S., Oommen, A. M., Pandian, J. D., Pandya, S., Parameswaran, S., Pati, S., Prasad, K., Prasad, N., Purwar, M., Rahim, A., Raju, S., Ramji, S., Rangaswamy, T., Rath, G. K., Roy, A., Sabde, Y., Sachdeva, K. S., Sadhu, H., Sagar, R., Sankar, M. J., Sharma, R., Shet, A., Shirude, S., Shukla, R., Shukla, S. R., Singh, G., Singh, N. P., Singh, V., Sinha, A., Sinha, D. N., Srivastava, R. K., Srividya, A., Suri, V., Swaminathan, R., Sylaja, P. N., Tandale, B., Thakur, J. S., Thankappan, K. R., Thomas, N., Tripathy, S., Varghese, M., Varughese, S., Venkatesh, S., Venugopal, K., Vijayakumar, L., Xavier, D., Yajnik, C. S., Zachariah, G., Zodpey, S., Rao, J. V. R. P., Vos, T., Reddy, K. S., Murray, C. J. L., and Swaminathan, S.: Nations within a nation: variations in epidemiological transition across the states of India, 1990–2016 in the global burden of disease study, The Lancet, 390, 10111, 2437–2460, https://doi.org/10.1016/S0140-6736(17)32804-0, 2017.
Das, A., Kumar, A., Habib, G., and Vivekanandan, P.: Insights on the biological role of ultrafine particles of size PM<0.25: A prospective study from New Delhi, Environ. Pollut. B, 268, 115638, https://doi.org/10.1016/j.envpol.2020.115638, 2021.
DeCarlo, P. F., Slowik, J. G., Worsnop, D. R., Davidovits, P., and Jimenez, J. L.: Particle Morphology and Density Characterization by Combined Mobility and Aerodynamic Diameter Measurements. Part 1: Theory, Aerosol Sci. Tech., 38, 1185–1205, https://doi.org/10.1080/027868290903907, 2004.
Dhyani, R., Sharma, N., and Advani, M.: Estimation of Fuel Loss and Spatial-Temporal Dispersion of Vehicular Pollutants at a Signalized Intersection in Delhi City, India, edited by: Marche, G. P., Borrego, C., Longhurst, J., Lopes, M., and Barnes, J., WIT Transection on Ecology and the Environment: Air Pollution 2019, WIT Press, 236, 233–247, ISBN 9781784663438, 2019.
Dumka, U. C., Tiwari, S., Kaskaoutis, D. G., Soni, V. K., Safai, P. D., and Attri, S. D.: Aerosol and pollutant characteristics in Delhi during a winter research campaign, Environ. Sci. Pollut. Res., 26, 3771–3794, https://doi.org/10.1007/s11356-018-3885-y, 2019.
Gani, S., Bhandari, S., Patel, K., Seraj, S., Soni, P., Arub, Z., Habib, G., Hildebrandt Ruiz, L., and Apte, J. S.: Particle number concentrations and size distribution in a polluted megacity: the Delhi Aerosol Supersite study, Atmos. Chem. Phys., 20, 8533–8549, https://doi.org/10.5194/acp-20-8533-2020, 2020.
Giechaskiel, B., Lähde, T., and Drossinos, Y.: Regulating particle number measurements from the tailpipe of light-duty vehicles: The next step?, Environ. Res., 172, 1–9, https://doi.org/10.1016/j.envres.2019.02.006, 2019.
Gulia, S., Shiva Nagendra, S. M., Khare, M., and Khanna, I.: Urban air quality management – A review, Atmos. Pollut. Res., 6, 286–304, https://doi.org/10.5094/APR.2015.033, 2015.
Guo, H., Kota, S. H., Sahu, S. K., Hu, J., Ying, Q., Gao, A., and Zhang, H.: Source apportionment of PM2.5 in North India using source-oriented air quality models, Environ. Pollut., 231, 426–436, https://doi.org/10.1016/j.envpol.2017.08.016, 2017.
Gupta, S., Kumar, K., Srivastava, A., Srivastava, A., and Jain, V. K.: Size distribution and source apportionment of polycyclic aromatic hydrocarbons (PAHs) in aerosol particle samples from the atmospheric environment of Delhi, India, Sci. Total Environ., 409, 4674–4680, https://doi.org/10.1016/j.scitotenv.2011.08.008, 2011.
Gurjar, B. R., van Aardenne, J. A., Lelieveld, J., and Mohan, M.: Emission estimates and trends (1990–2000) for megacity Delhi and implications, Atmos. Environ., 38, 5663–5681, https://doi.org/10.1016/j.atmosenv.2004.05.057, 2004.
Guttikunda, S. K., and Gurjar, B. R.: Role of meteorology in seasonality of air pollution in megacity Delhi, India, Environ. Monit. Assess., 184, 3199–3211, https://doi.org/10.1007/s10661-011-2182-8, 2012.
Guttikunda, S. K., Goel, R., and Pant, P.: Nature of air pollution, emission sources, and management in the Indian cities, Atmos. Environ., 95, 501–510, https://doi.org/10.1016/j.atmosenv.2014.07.006, 2014.
Hama, S. M. L., Cordell, R. L., and Monks, P. S.: Quantifying primary and secondary source contributions to ultrafine particles in the UK urban background, Atmos. Environ., 166, 62–78, https://doi.org/10.1016/j.atmosenv.2017.07.013, 2017.
Hama, S. M. L., Kumar, P., Harrison, R. M., Bloss, W. J., Khare, M., Mishra, S., Namdeo, A., Sokhi, R., Goodman, P., and Sharma, C.: Four-year assessment of ambient particulate matter and trace gases in the Delhi-NCR region of India, Sustain. Cities Soc., 54, 102003, https://doi.org/10.1016/j.scs.2019.102003, 2020.
Hamed, A., Joutsensaari, J., Mikkonen, S., Sogacheva, L., Dal Maso, M., Kulmala, M., Cavalli, F., Fuzzi, S., Facchini, M. C., Decesari, S., Mircea, M., Lehtinen, K. E. J., and Laaksonen, A.: Nucleation and growth of new particles in Po Valley, Italy, Atmos. Chem. Phys., 7, 355–376, https://doi.org/10.5194/acp-7-355-2007, 2007.
Han, Y., Iwamoto, Y., Nakayama, T., Kawamura, K., Hussein, T., and Mochida, M.: Observation of new particle formation over a mid-latitude forest facing the North Pacific, Atmos. Environ., 64, 77–84, https://doi.org/10.1016/j.atmosenv.2012.09.036, 2013.
Harrison, R. M.: Airborne particulate matter, Phil. Trans. R. Soc. A, 378, 20190319, https://doi.org/10.1098/rsta.2019.0319, 2020.
Harrison, R. M. and Şahin, Ü. A.: Research data supporting “Interpretation of Wide Range Particulate Matter Size Distributions in Delhi”, University of Birmingham, UBIRA eData [data set], https://doi.org/10.25500/edata.bham.00000730, 2021.
Harrison, R. M., Beddows, D. C. S., and Dall'Osto, M.: PMF Analysis of Wide-Range Particle Size Spectra Collected on a Major Highway, Environ. Sci. Technol., 45, 5522–5528, https://doi.org/10.1021/es2006622, 2011.
Harrison, R. M., Rob MacKenzie, A., Xu, H., Alam, M. S., Nikolova, I., Zhong, J., and Liang, Z.: Diesel exhaust nanoparticles and their behaviour in the atmosphere, P. R. Soci. A, 474, 20180492, https://doi.org/10.1098/rspa.2018.0492, 2018.
Iida, K., Stolzenburg, M. R., McMurry, P. H., and Smith, J. N.: Estimating nanoparticle growth rates from size-dependent charged fractions: Analysis of new particle formation events in Mexico City, J. Geophys. Res., 113, D05207, https://doi.org/10.1029/2007JD009260, 2008.
Jain, S., Sharma, S. K., Vijayan, N., and Mandal, T. K.: Seasonal characteristics of aerosols (PM2.5 and PM10) and their source apportionment using PMF: A four year study over Delhi, India, Environ. Pollut., 262, 114337, https://doi.org/10.1016/j.envpol.2020.114337, 2020.
Jeong, C.-H., Evans, G. J., McGuire, M. L., Chang, R. Y.-W., Abbatt, J. P. D., Zeromskiene, K., Mozurkewich, M., Li, S.-M., and Leaitch, W. R.: Particle formation and growth at five rural and urban sites, Atmos. Chem. Phys., 10, 7979–7995, https://doi.org/10.5194/acp-10-7979-2010, 2010.
Jing, H., Li, Y. F., Zhao, J., Li, B., Sun, J., Chen, R., Gao, Y., and Chen, C.: Wide-range particle characterization and elemental concentration in Beijing aerosol during the 2013 Spring Festival, Environ. Pollut., 192, 204–211, https://doi.org/10.1016/j.envpol.2014.06.003, 2014.
Kalafut-Pettibone, A. J., Wang, J., Eichinger, W. E., Clarke, A., Vay, S. A., Blake, D. R., and Stanier, C. O.: Size-resolved aerosol emission factors and new particle formation/growth activity occurring in Mexico City during the MILAGRO 2006 Campaign, Atmos. Chem. Phys., 11, 8861–8881, https://doi.org/10.5194/acp-11-8861-2011, 2011.
Kanawade, V. P., Srivastava, A. K., Ram, K., Asmi, E., Vakkari, V., Soni, V. K., Varaprasad, V., and Sarangi, C.: What caused severe air pollution episode of November 2016 in New Delhi?, Atmos. Environ., 222, 117125, https://doi.org/10.1016/j.atmosenv.2019.117125, 2020.
Kontses, A., Triantafyllopoulos, G., Ntziachristos, L., and Samaras, Z.: Particle number (PN) emissions from gasoline, diesel, LPG, CNG and hybrid-electric light-duty vehicles under real-world driving conditions, Atmos. Environ., 222, 117126, https://doi.org/10.1016/j.atmosenv.2019.117126, 2020.
Kuang, C., Chen, M., Zhao, J., Smith, J., McMurry, P. H., and Wang, J.: Size and time-resolved growth rate measurements of 1 to 5 nm freshly formed atmospheric nuclei, Atmos. Chem. Phys., 12, 3573–3589, https://doi.org/10.5194/acp-12-3573-2012, 2012.
Kulmala, M., Dada, L., Daellenbach, K. R., Yan, C., Stolzenburg, D., Kontkanen, J., Ezhova, E., Hakala, S., Tuovinen, S., Kokkonen, T. V., Kurpp, M., Cai, R., Zhou, Y., Yin, R., Baalbaki, R., Chan, T., Chu, B., Deng, C., Fu, Y., Ge, M., He, H., Heikkinen, L., Junninen, H., Liu, Y., Lu, Y., Nie, W., Rusanen, A., Vakkari, V., Wang, Y., Yang, G., Yao, L., Zheng, J., Kujansuu, J., Kangasluoma, J., Petäjä, T., Paasonen, P., Järvi, L., Worsnop, D., Ding, A., Liu, Y., Wang, L., Jiang, J., Bianchi, F., and Kerminen, V. M.: Is reducing new particle formation a plausible solution to mitigate particulate air pollution in Beijing and other Chinese megacities?, Faraday Discuss., 226, 221, https://doi.org/10.1039/D0FD00078G, 2021.
Kulmala, M., Luoma, K., Virkkula, A., Petäjä, T., Paasonen, P., Kerminen, V.-M., Nie, W., Qi, X., Shen, Y., Chi, X., and Ding, A.: On the mode-segregated aerosol particle number concentration load: contributions of primary and secondary particles in Hyytiälä and Nanjing. Boreal, Env. Res., 21, 319–331, 2016.
Kumar, A., Ambade, B., Sankar, T. K., Sethi, S. S., and Kurwadkar, S.: Source identification and health risk assessment of atmospheric PM2.5-bound polycyclic aromatic hydrocarbons in Jamshedpur, India, Sustain. Cities Soc., 52, 101801, https://doi.org/10.1016/j.scs.2019.101801, 2020.
Kumar, P., Gulia, S., Harrison, R. M., and Khare, M.: The influence of odd–even car trial on fine and coarse particles in Delhi, Environ. Pollut., 225, 20–30, https://doi.org/10.1016/j.envpol.2017.03.017, 2017.
Kumar, P., Pirjola, L., Ketzel, M., and Harrison, R. M.: Nanoparticle emissions from 11 non-vehicle exhaust sources – A review, Atmos. Environ., 67, 252–277, https://doi.org/10.1016/j.atmosenv.2012.11.011, 2013.
Liu, J., Jiang, J., Zhang, Q., Deng, J., and Hao, J.: A spectrometer for measuring particle size distributions in the range of 3 nm to 10 µm, Front. Environ. Sci. Eng., 10, 63–72, https://doi.org/10.1007/s11783-014-0754-x, 2016.
Magara-Gomez, K. T., Olson, M. R., McGinnis, J. E., Zhang, M., and Schauer, J. J.: Effect of Ambient Temperature and Fuel on Particle Number Emissions on Light-Duty Spark-Ignition Vehicles, Aerosol Air Qual. Res., 14, 1360–1371, https://doi.org/10.4209/aaqr.2013.06.0183, 2014.
Mahato, S., Pal, S., and Ghosh, K. G.: Effect of lockdown amid COVID-19 pandemic on air quality of the megacity Delhi, India, Sci. Total Environ., 730, 139086, https://doi.org/10.1016/j.scitotenv.2020.139086, 2020.
Masiol, M., Vu, T. V., Beddows, D. C. S., and Harrison, R. M.: Source apportionment of wide range particle size spectra and black carbon collected at the airport of Venice (Italy), Atmos. Environ., 139, 56–74, https://doi.org/10.1016/j.atmosenv.2016.05.018, 2016.
Mönkkönen, P., Koponen, I. K., Lehtinen, K. E. J., Hämeri, K., Uma, R., and Kulmala, M.: Measurements in a highly polluted Asian mega city: observations of aerosol number size distribution, modal parameters and nucleation events, Atmos. Chem. Phys., 5, 57–66, https://doi.org/10.5194/acp-5-57-2005, 2005.
Nagpure, A. S., Ramaswami, A., and Russell, A.: Characterizing the Spatial and Temporal Patterns of Open Burning of Municipal Solid Waste (MSW) in Indian Cities, Environ. Sci. Technol., 49, 12904–12912, https://doi.org/10.1021/acs.est.5b03243, 2015.
Narain, U. and Krupnick, A.: The Impact of Delhi's CNG Program on Air Quality, RFF Discussion Paper No. 07–06, 54 pp., https://doi.org/10.2139/ssrn.969727, 2007.
Ondráček, J., Ždímal, V., Smolík, J., and Lazaridis, M.: A Merging Algorithm for Aerosol Size Distribution from Multiple Instruments, Water Air Soil Pollut., 199, 219–233, https://doi.org/10.1007/s11270-008-9873-y, 2009.
Pant, P. and Harrison, R. M.: Critical Review of Receptor Modelling for Particulate Matter: A Case Study of India, Atmos. Environ., 49, 1–12, https://doi.org/10.1016/j.atmosenv.2011.11.060, 2012.
Pant, P., Baker, S. J., Goel, R., Guttikunda, S., Goel, A., Shukla, A., and Harrison, R. M.: Analysis of size-segregated winter season aerosol data from New Delhi, India, Atmos. Poll. Res., 7, 100–109, https://doi.org/10.1016/j.apr.2015.08.001, 2016.
R Core Team: a Language and Environment for Statistical Computing, R Foundation for Statistical Computing, Vienna, Austria, http://www.R-project.org/ (last access: 1 April 2022), 2015.
Rai, P., Furger, M., Haddad, I. E., Kumar, V., Wang, L., Singh, A., Dixit, K., Bhattu, D., Petit, J. E., Ganguly, D., Rastogi, N., Baltensperger, U., Tripathi, S. N., Slowik, J. G., and Prévôt, A. S. H.: Real-time measurement and source apportionment of elements in Delhi's atmosphere, Sci. Total Environ., 742, 140332, https://doi.org/10.1016/j.scitotenv.2020.140332, 2020.
Rodríguez, S. and Cuevas, E.: The contributions of “minimum primary emissions” and “new particle formation enhancements” to the particle number concentration in urban air, J. Aerosol Sci., 38, 1207–1219, https://doi.org/10.1016/j.jaerosci.2007.09.001, 2007.
Rodríguez-Urrego, D. and Rodríguez-Urrego, L.: Air quality during the COVID-19: PM2.5 analysis in the 50 most polluted capital cities in the world, Environ. Pollut., 266, 115042, https://doi.org/10.1016/j.envpol.2020.115042, 2020.
Salvador, P., Barreiro, M., Gómez-Moreno, F. J., Alonso-Blanco, E., and Artíñano, B.: Synoptic classification of meteorological patterns and their impact on air pollution episodes and new particle formation processes in a south European air basin, Atmos. Environ., 245, 118016, https://doi.org/10.1016/j.atmosenv.2020.118016, 2021.
Sarangi, B., Aggarwal, S. G., and Gupta, P. K.: A simplified approach to calculate particle growth rate due to self-coagulation, scavenging and condensation using SMPS measurements during a particle growth event in New Delhi, Aerosol and air quality research, 15, 166–179, https://doi.org/10.4209/aaqr.2013.12.0350, 2015.
Sarangi, B., Aggarwal, S. G., Kunwar, B., Kumar, S., Kaur, R., Sinha, D., Tiwari, S., and Kawamura, K.: Nighttime particle growth observed during spring in New Delhi: Evidences for the aqueous phase oxidation of SO2, Atmos. Environ., 188, 82–96, https://doi.org/10.1016/j.atmosenv.2018.06.018, 2018
Schmid, O., Karg, E., Hagen, D. E., Whitefield, P. D., and Ferron, G. A.: On the Effective Density of Non-Spherical Particles as Derived From Combined Measurements of Aerodynamic and Mobility Equivalent Size, Atmos. Environ., 38, 431–443, https://doi.org/10.1016/j.jaerosci.2007.01.002, 2007.
Schreiber, D., Forss, A. M., Mohr, M., and Dimopoulos, P.: Particle Characterisation of Modern CNG, Gasoline and Diesel Passenger Cars, 8th International Conference on Engines for Automobiles, Capri, Italy, 16–20 September 2007, Technical Paper 2007-24-0123, 12 pp., https://doi.org/10.4271/2007-24-0123, 2007.
Sebastian, M., Kompalli, S. K., Kumar, V. A., Jose, S., Babu, S. S., Pandithurai, G., Singh, S., Hooda, R. K., Soni, V. K., Pierce, J. R., Vakkari, V., Asmi, E., Westervelt, D. M., Hyvärinen, A.-P., and Kanawade, V. P.: Observations of particle number size distributions and new particle formation in six Indian locations, Atmos. Chem. Phys., 22, 4491–4508, https://doi.org/10.5194/acp-22-4491-2022, 2022.
Thamban, N. M., Lalchandani, V., Kumar, V., Mishra, S., Bhattu, D., Slowik, J. G., Prevot, A. S. H., Satish, R., Rastogi, N., and Tripathi, S. N.: Evolution of size and composition of fine particulate matter in the Delhi megacity during later winter, Atmos. Environ., 267, 118752, https://doi.org/10.1016/j.atmosenv.2021.118752, 2021.
Tiwari, S., Bisht, D. S., Srivastava, A. K., Pipal, A. S., Taneja, A., Srivastava, M. K., and Attri, S. D.: Variability in atmospheric particulates and meteorological effects on their mass concentrations over Delhi, India, Atmos. Res., 145–146, 45-56, https://doi.org/10.1016/j.atmosres.2014.03.027, 2014.
Toumasatos, Z., Kontses, A., Doulgeris, S., Samaras, Z., and Ntziachristos, L.: Particle emissions measurements on CNG vehicles focusing on Sub-23 nm, Aerosol Sci. Tech., 55, 182–193, https://doi.org/10.1080/02786826.2020.1830942, 2021.
Tyagi, S., Tiwari, S., Mishra, A., Hopke, P. K., Attri, S. D., Srivastava, A. K., and Bisht, D. S.: Spatial variability of concentrations of gaseous pollutants across the National Capital Region of Delhi, India, Atmos. Pollut. Res., 7, 808–816, https://doi.org/10.1016/j.apr.2016.04.008, 2016.
Vu, T. V., Delgado-Saborit, J. M., and Harrison, R. M.: Particle number size distributions from seven major sources and implications for source apportionment studies, Atmos. Environ., 122, 114–132, https://doi.org/10.1016/j.atmosenv.2015.09.027, 2015.
Wu, T. and Boor, B. E.: Urban aerosol size distributions: a global perspective, Atmos. Chem. Phys., 21, 8883–8914, https://doi.org/10.5194/acp-21-8883-2021, 2021.
Yadav, R., Sahu, L. K., Beig, G., and Jaaffrey, S. N. A.: Role of long-range transport and local meteorology in seasonal variation of surface ozone and its precursors at an urban site in India, Atmos. Res., 176–177, 96–107, https://doi.org/10.1016/j.atmosres.2016.02.018, 2016.
Zhang, Y. M., Zhang, X. Y., Sun, J. Y., Lin, W. L., Gong, S. L., Shen, X. J., and Yang, S.: Characterization of new particle and secondary aerosol formation during summertime in Beijing, China, Tellus B., 63, 382–394, https://doi.org/10.1111/j.1600-0889.2011.00533.x, 2011.
Zhu, C., Li, J. G., Wang, L., Morawska, L., Zhang, X., and Zhang, Y. L.: Size-resolved particle distribution and gaseous concentrations by real-world road tunnel measurement, Indoor Built Environ., 23, 225–235, https://doi.org/10.1177/1420326X13509290, 2014.