the Creative Commons Attribution 4.0 License.
the Creative Commons Attribution 4.0 License.
 | 19 Apr 2022
Measurement report: Introduction to the HyICE-2018 campaign for measurements of ice-nucleating particles and instrument inter-comparison in the Hyytiälä boreal forest
Dimitri Castarède
Michael P. Adams
Saskia Drossaart van Dusseldorp
Paavo Heikkilä
Kimmo Korhonen
Janne Lampilahti
Mikhail Paramonov
Julia Schneider
Franziska Vogel
Yusheng Wu
Jonathan P. D. Abbatt
Nina S. Atanasova
Dennis H. Bamford
Barbara Bertozzi
Matthew Boyer
David Brus
Martin I. Daily
Romy Fösig
Ellen Gute
Alexander D. Harrison
Paula Hietala
Kristina Höhler
Zamin A. Kanji
Jorma Keskinen
Larissa Lacher
Markus Lampimäki
Janne Levula
Antti Manninen
Jens Nadolny
Maija Peltola
Grace C. E. Porter
Pyry Poutanen
Ulrike Proske
Tobias Schorr
Nsikanabasi Silas Umo
János Stenszky
Annele Virtanen
Dmitri Moisseev
Markku Kulmala
Benjamin J. Murray
Tuukka Petäjä
Ottmar Möhler
Jonathan Duplissy
The formation of ice particles in Earth's atmosphere strongly influences the dynamics and optical properties of clouds and their impacts on the climate system. Ice formation in clouds is often triggered heterogeneously by ice-nucleating particles (INPs) that represent a very low number of particles in the atmosphere. To date, many sources of INPs, such as mineral and soil dust, have been investigated and identified in the low and mid latitudes. Although less is known about the sources of ice nucleation at high latitudes, efforts have been made to identify the sources of INPs in the Arctic and boreal environments. In this study, we investigate the INP emission potential from high-latitude boreal forests in the mixed-phase cloud regime. We introduce the HyICE-2018 measurement campaign conducted in the boreal forest of Hyytiälä, Finland, between February and June 2018. The campaign utilized the infrastructure of the Station for Measuring Ecosystem-Atmosphere Relations (SMEAR) II, with additional INP instruments, including the Portable Ice Nucleation Chamber I and II (PINC and PINCii), the SPectrometer for Ice Nuclei (SPIN), the Portable Ice Nucleation Experiment (PINE), the Ice Nucleation SpEctrometer of the Karlsruhe Institute of Technology (INSEKT) and the Microlitre Nucleation by Immersed Particle Instrument (µL-NIPI), used to quantify the INP concentrations and sources in the boreal environment. In this contribution, we describe the measurement infrastructure and operating procedures during HyICE-2018, and we report results from specific time periods where INP instruments were run in parallel for inter-comparison purposes. Our results show that the suite of instruments deployed during HyICE-2018 reports consistent results and therefore lays the foundation for forthcoming results to be considered holistically. In addition, we compare measured INP concentrations to INP parameterizations, and we observe good agreement with the Tobo et al. (2013) parameterization developed from measurements conducted in a ponderosa pine forest ecosystem in Colorado, USA.
- Article
(5005 KB) - Full-text XML
- BibTeX
- EndNote


Atmospheric aerosols are recognized to play an important role in nearly every aspect of the physics and chemistry of the atmosphere (Solomon et al., 2007; Boucher et al., 2013). However, the interactions between aerosols and clouds and how these interactions influence Earth's surface energy budget and water cycle represent significant knowledge gaps in climate science. Thus, it is critical to understand fundamental aerosol processes such as aerosol formation, growth and aerosol–cloud interactions to evaluate the impact of aerosols on Earth's radiative balance.
Certain types of atmospheric particles, called ice-nucleating particles (INPs), have the potential to initiate the formation of ice in clouds, thus affecting the properties of the clouds and often the initiation of precipitation. Heterogeneous ice nucleation processes may include (i) deposition nucleation, where bulk liquid water is presumed to be absent and where ice is formed from vapor supersaturated with respect to ice; (ii) immersion freezing, where ice formation is initiated by an INP located within a body of liquid; (iii) condensation freezing, where an INP simultaneously acts as a cloud condensation nucleus (CCN); (iv) contact freezing, where ice formation is triggered at the air–water interface by an INP that comes into contact with a supercooled liquid droplet; and (v) pore condensation and freezing, where ice is formed via liquid water condensation in pores (Vali et al., 2015; David et al., 2019).
Numerous measurements of INPs have been performed in various settings and environments. However, measurements in boreal forests are largely underrepresented, and little is known concerning the INP sources and properties from this environment. A recent study showed that the boreal forest is an important source of biogenic INPs and that the seasonal cycle of INP concentrations is linked to the abundance of biogenic aerosol particles (Schneider et al., 2021). Boreal forests represent more than one-third of all forests and cover more than 15 × 106 km2 of land (Tunved et al., 2006). The majority of boreal landscape is in the Arctic and sub-Arctic region of the continental Northern Hemisphere, and due to its high-latitude position, the environment experiences strong seasonal changes in meteorological and environmental conditions. Moreover, the boreal forest environment is generally far from large dust sources and strong anthropogenic emissions, which motivates the investigation of biogenic ice nucleation activity in this environment. Finally, INPs from mid- to high-latitude sources may have a disproportionate effect on climate through their influence on shallow clouds (Murray et al., 2021), emphasizing the need to know more about INP sources in these regions, including in boreal forests.
To overcome our lack of knowledge, a measurement campaign was organized in 2018 at the Station for Measuring Ecosystem-Atmosphere Relations (SMEAR) II, at the Hyytiälä Forestry Research Station in Juupajoki, Finland. The intensive field campaign, called HyICE-2018, began in February and extended until June, with longer-term INP monitoring efforts continuing for more than 1 year beyond the intensive measurement period (Schneider et al., 2021).
One aim of the campaign was to utilize the highly instrumented and time-resolved measurements of the SMEAR II station. The station is a well-known atmospheric observatory in a high-latitude location (61∘51′ N) within a boreal forest ecosystem (Hari and Kulmala, 2005). The SMEAR II site has hosted field campaigns for decades and is well suited for investigating potential links between atmospheric and ecosystem processes. The station is equipped with a suite of advanced aerosol instrumentation that has been utilized for significant advancements in aerosol process studies. Therefore, the SMEAR II station is well suited for an intensive campaign focused on measuring INPs in the boreal forest environment.
Additionally, new particle formation (NPF) events are frequently recorded at the SMEAR II station (Kulmala et al., 2013), and there are relevant scientific questions that remain unanswered concerning the role of NPF in the context of ambient INPs. NPF events occur when volatile organic compounds (VOCs) and biogenic volatile organic compounds (BVOCs) are oxidized and condensed to form very small particulate, secondary organic aerosol (SOA), some of which continue to grow to larger sizes that may form CCN and INPs (Kulmala et al., 2013). The role of NPF in forming particles large enough to participate in cloud activation as CCN and INPs has been investigated in laboratory studies (Duplissy et al., 2008; Möhler et al., 2008; Ladino et al., 2014; Ignatius et al., 2016). However, while there is evidence that NPF can play a role in CCN activation (Frosch et al., 2011; Sihto et al., 2011), and studies have shown that SOA can nucleate ice under cirrus conditions (Wilson et al., 2012; Wagner et al., 2017; Wolf et al., 2020), the relationship between NPF and INPs has not been explored with field measurements.
In order to augment the standard SMEAR II monitoring instrumentation for the HyICE-2018 campaign, several institutions deployed INP measurement systems, including the University of Helsinki, the University of Gothenburg, the Karlsruhe Institute of Technology, the University of Leeds, the University of Eastern Finland and the Swiss Federal Institute of Technology in Zurich (ETH Zurich). Furthermore, the Finnish Meteorological Institute and Tampere University contributed remote sensing retrievals and bioaerosol monitoring, respectively. In addition to the individual data collection efforts, several days were utilized for instrument inter-comparison analyses to test the reproducibility of results across instruments and scientific teams in the field setting.
The primary objectives of the campaign were to
- •
quantify and characterize INPs in a boreal environment within different thermodynamic forcing regimes (i.e., different temperatures, T, and saturations with respect to ice, Si),
- •
determine and quantify the existence of INPs seasonal variation,
- •
assess the vertical distribution of INPs above the boreal forest.
This paper gives an overview of the campaign setting and design as an introduction to the Copernicus special issue “Ice nucleation in the boreal atmosphere”, which is anticipated to include several contributions from HyICE-2018. Data from several days dedicated to evaluate instrument inter-comparison is presented to illustrate instrument-to-instrument agreement and to facilitate future presentation and interpretation of data from subsets of instruments.
2.1 Measurement site – SMEAR II
The HyICE-2018 campaign took place at the SMEAR II station in Hyytiälä, Finland (Hari and Kulmala, 2005). The station is located in southern Finland (61∘51′ N, 24∘17′ E; 181 m above sea level) and is surrounded by boreal coniferous forest (Fig. 1). The conditions at the site are typical for a background location, with the main pollution sources being the city of Tampere (60 km to the southwest with ≈238 000 inhabitants as of 2019) and the activity and buildings at the station (Kulmala et al., 2001; Boy et al., 2004). The station has several operational units that span a wide forest area and reach into and above the tree canopy. There are several towers, including a 128 m mast used for atmospheric flux measurements, an 18 m tower for irradiation and flux measurements, a separate 18 m tower for tree physiology measurements, and a 35 m walk-up tower for aerosol measurements. There are also several measurement cottages and containers spread throughout the forest, with a cottage located near the walk-up tower dedicated to measuring the physical properties of aerosols, and a main cottage based near the 128 m mast (Fig. 1).
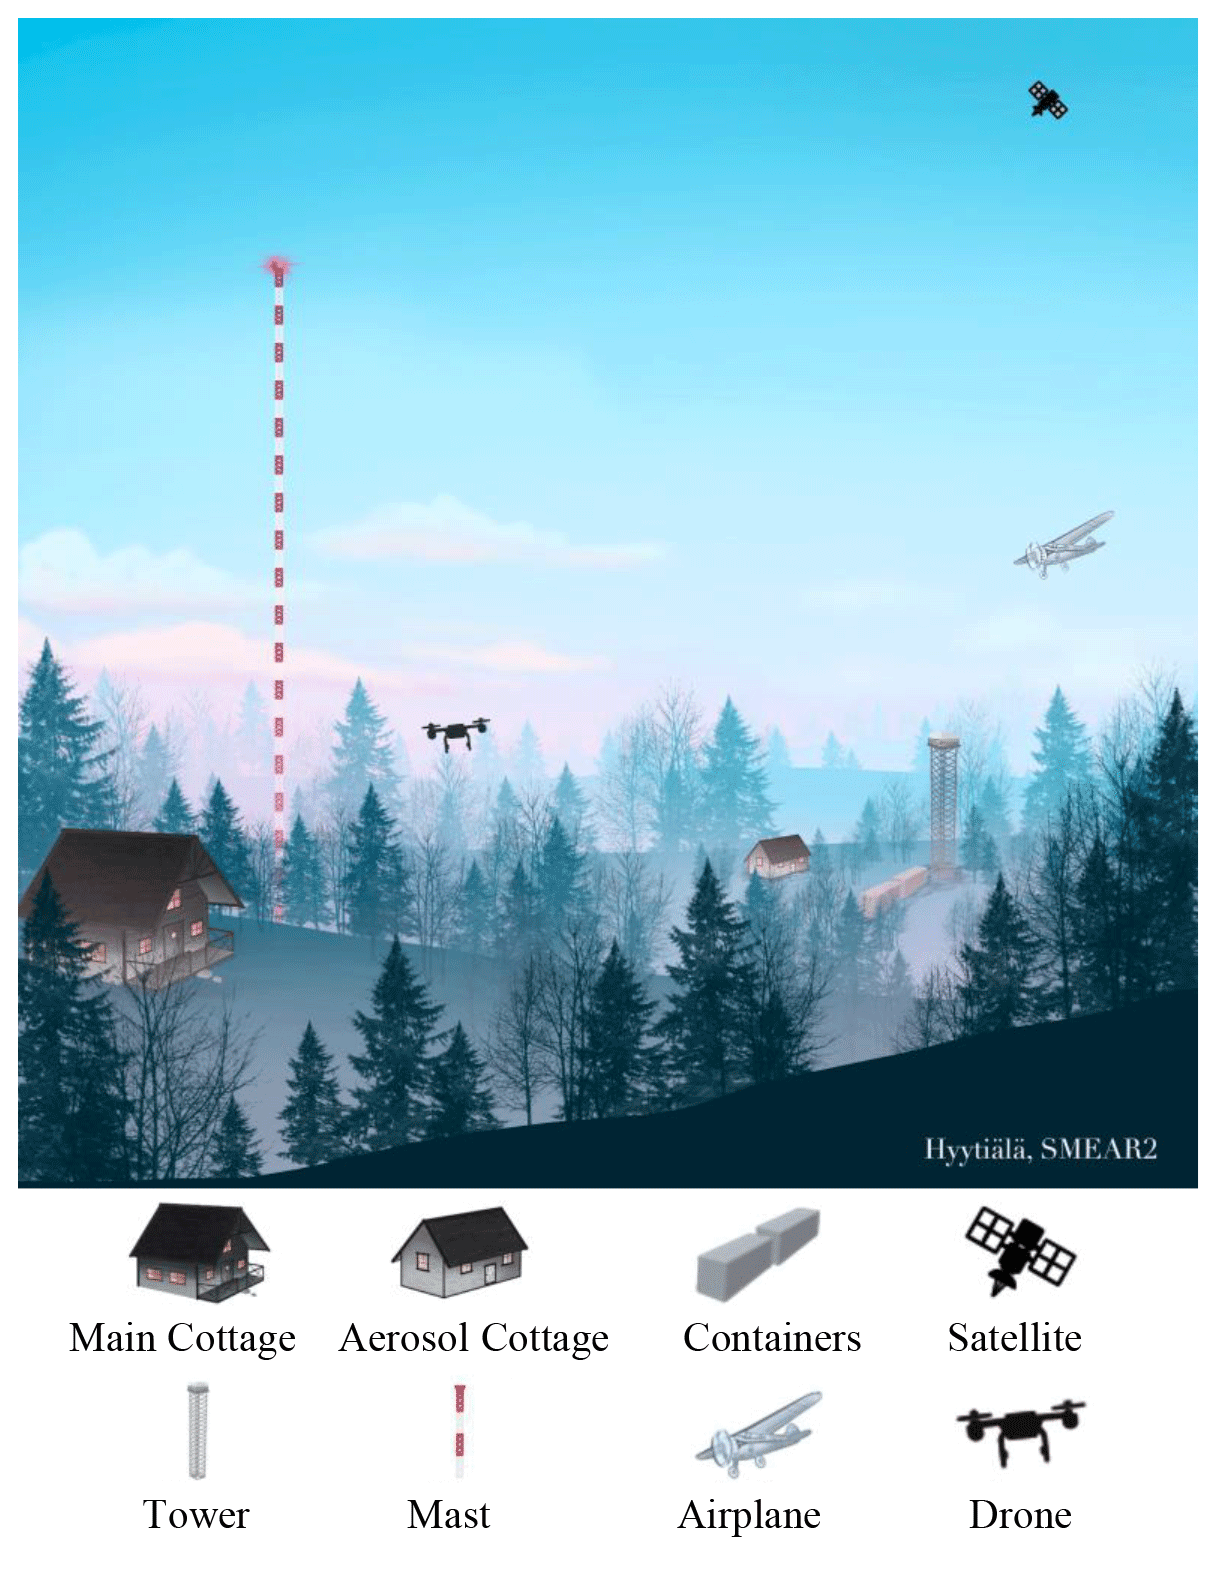
Figure 1Overview of the SMEAR II station in Hyytiälä, Finland, used for staging the HyICE-2018 measurement campaign, with the available infrastructure and measurement platforms depicted.
The SMEAR II station is equipped to monitor the physical and chemical properties of aerosols and gas-phase precursors to aerosol formation with a suite of state-of-the-art monitoring instrumentation. Measurements also cover meteorology, radiation, soil, snow cover and gases. An overview of the instruments in operation at the site during the HyICE-2018 campaign is available in the Appendix (Tables A1, A2 and A3). In this study, data from the SMEAR II differential mobility particle sizer (DMPS) and aerosol particle sizer (APS; TSI model 3321) were used. The DMPS measures aerosol particle size distributions from 3 to 1000 nm in mobility diameter, with a 10 min time resolution (Aalto et al., 2001; Jokinen and Mäkelä, 1997). During HyICE-2018, the instrument was sampling through a total suspended particulate (TSP) inlet 8 m inside the forest canopy and was operated following the guidelines from Aerosols, Clouds and Trace gases Research InfraStructure (ACTRIS; Wiedensohler et al., 2012). The APS is used to measure the supermicron aerosol particle size distribution from 0.5 to 20 µm in aerodynamic diameter. The instrument was sampling through a TSP inlet (DIGITEL Elektronik GmbH) 6 m above ground level, and a vertical sampling line was used to avoid particle losses. In addition, the APS sampling line was heated to 40 ∘C to ensure that the relative humidity in the sampling line remained below 40 %, which prevents condensation and dries the aerosol before measurements.
2.2 Additional INP measurements for the HyICE-2018 campaign
One motivation for HyICE-2018 was to compare different INP measurement instruments and techniques in a field setting. Previous studies have performed inter-comparisons of INP instrumentation in a number of intensive measurement campaigns (DeMott et al., 2011; Wex et al., 2015; Hiranuma et al., 2015; Burkert-Kohn et al., 2017; DeMott et al., 2018; Hiranuma et al., 2019). However, these efforts focused on well-controlled laboratory measurements to assess sampling procedures and to calibrate instruments relative to one another (Hiranuma et al., 2015; Wex et al., 2015). Only a few INP instruments have been colocated for long field measurements of real atmospheric aerosol (DeMott et al., 2017), and continued efforts in multi-instrument measurements can be beneficial for the entire community (Lacher et al., 2020).
During HyICE-2018, several instruments and techniques were used to quantify INPs, as summarized in Table 1. The working principles of the different INP instruments are depicted in Fig. 3. Three continuous-flow diffusion chambers (CFDCs, described in Sect. 2.2.1) and one expansion chamber (described in Sect. 2.2.2) were used to conduct online measurements of INP concentrations, and two droplet-freezing assays (described in Sect. 2.2.3) were used for offline measurements of INP concentrations collected on filters. The intensive measurement campaign took place between February and June 2018, and the dates on which the instruments were operating are depicted in Fig. 2 against a background of the evolving average daytime temperature, which illustrates the changing seasons.
Table 1Instrumentation installed at the SMEAR II research station specifically for the HyICE-2018 campaign. A list of the instruments permanently running at the SMEAR II research station can be found in Tables A1, A2 and A3, including the APS and DMPS which were used in this analysis.
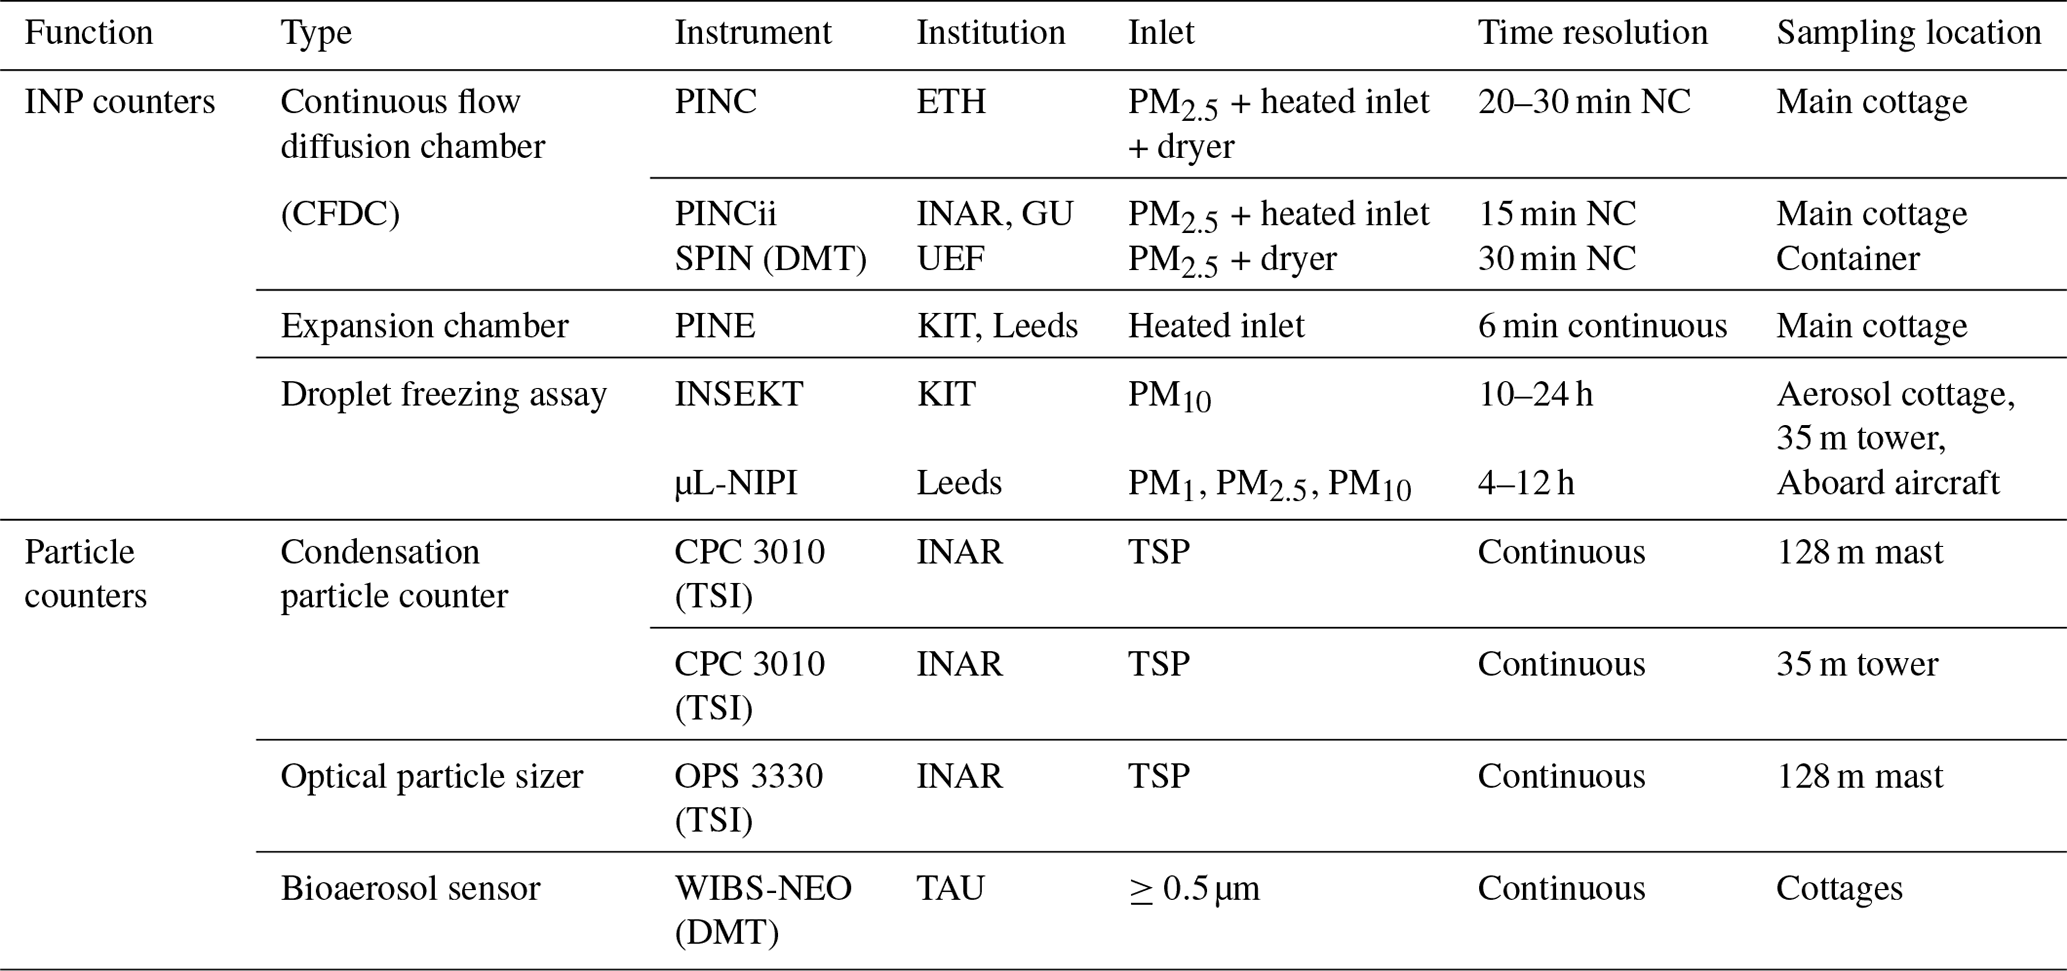
NC = not continuous (continuous = measuring without interruption unless maintenance was required); PM = particulate matter; TSP = total suspended particulate.
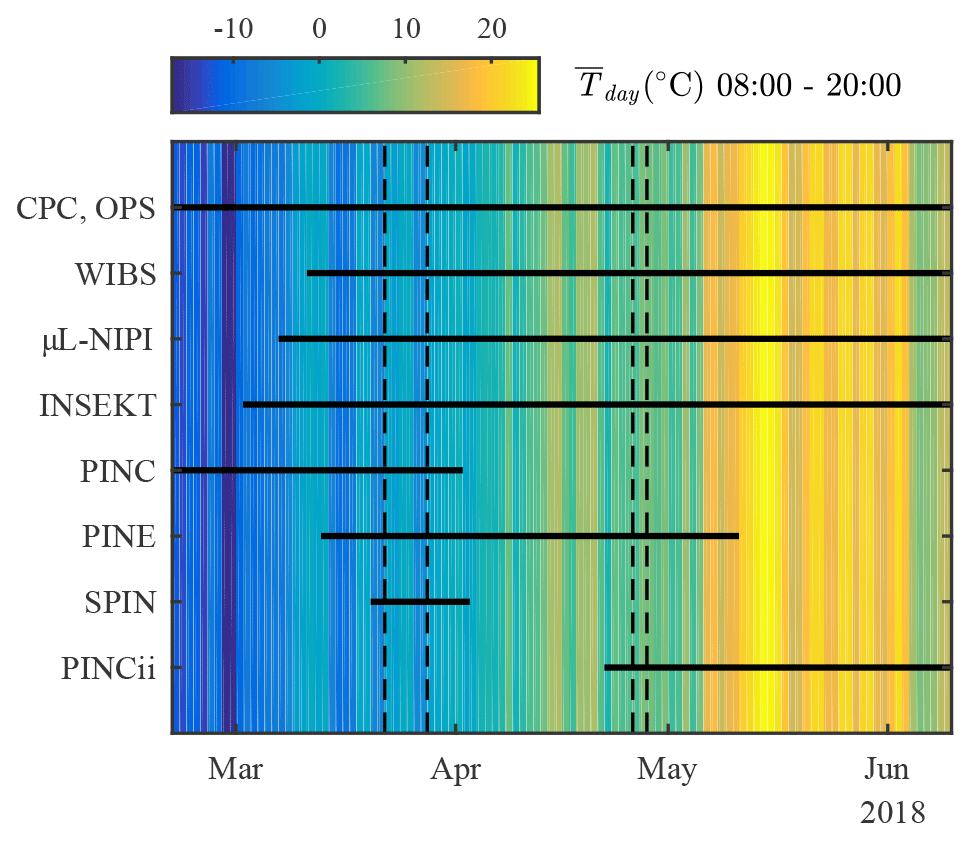
Figure 2Timeline of deployment for the instrumentation installed specifically for the HyICE-2018 campaign. Shading depicts mean daytime air temperature (08:00–20:00, UTC+2) measured at 4.2 m above ground level. Instrument inter-comparison days are indicated by the dashed lines.
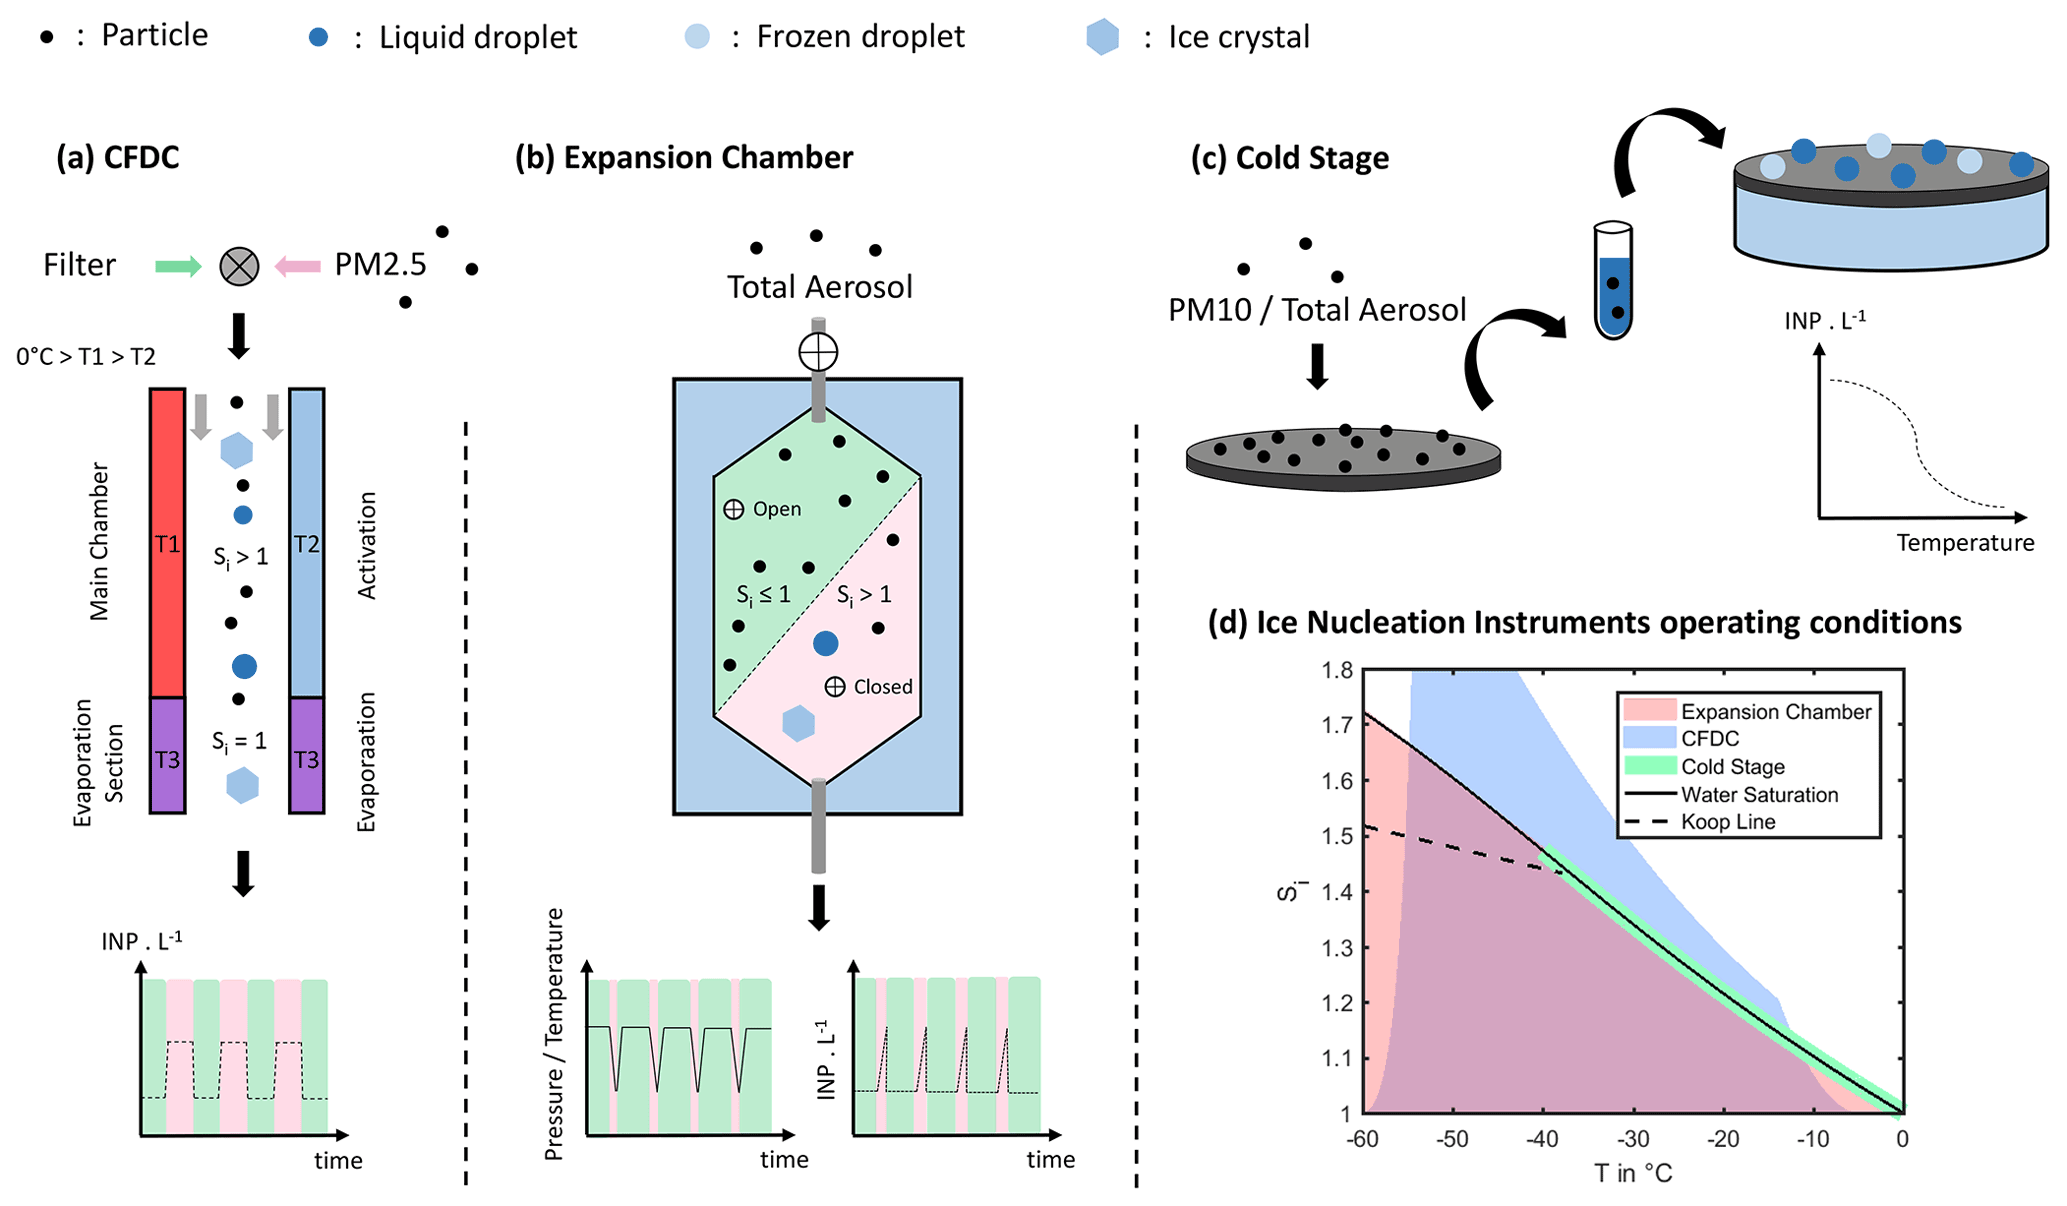
Figure 3Schematic of the working principles of the INP measurement systems deployed during HyICE-2018. (a) The CFDCs operate with activation and evaporation sections and alternate ambient sampling (pink) and filtered background measurements (green). (b) The PINE expansion chamber samples a volume of ambient air before a short expansion cycle activates INP within the trapped volume. In both (a) and (b), optical particle counting is used at the chamber exits to measure particle number. (c) The droplet-freezing assays rely on filter sampling of ambient aerosols. Collected particles are washed from the filters and analyzed for INP content, generating curves of INP temperature spectra. (d) The thermodynamic space typically accessible to different measurement techniques.
2.2.1 Continuous-flow diffusion chambers
Three CFDCs were deployed for online INP measurements (Fig. 3a). These instruments include the Portable Ice Nucleation Chamber (PINC), the Portable Ice Nucleation Chamber II (PINCii) and the SPectrometer for Ice Nuclei (SPIN). The three models are iterations of a design that consists of two parallel ice-coated walls which are cooled to below freezing temperatures (Rogers, 1988; Stetzer et al., 2008; Chou et al., 2011). In the upper part of the chamber, referred to as the main chamber, the walls are held at different temperatures (Fig. 3a), to produce vapor supersaturation in the region between the walls (Rogers, 1988). The lower chamber, or evaporation section, is held at an isothermal condition of ice saturation. During measurements, a continuous flow of sample air, referred to as the sample lamina, is sandwiched between two particle-free sheath flows and is drawn through the chamber, thus exposing any airborne particles to the supersaturated conditions. At a given lamina temperature, Tl, and saturation condition (e.g., saturation with respect to ice, Si), some particles will induce water condensation and/or ice formation by accommodating excess vapor. When the flow leaves the main supersaturated chamber, it immediately enters an evaporation section, which is held at ice saturation, and is thus subsaturated with respect to liquid water. Within the evaporation section, liquid droplets evaporate, creating a size difference between ice crystals and water droplets. When paired with an inlet size cutoff, particles within the exit flow that exceed the cutoff are determined to be ice. They are detected and counted by an optical particle counter (OPC) located at the exit of the chamber. Above a certain Si, CFDCs have an instrument-specific point of “droplet breakthrough” where the residence time of the evaporation section does not enable adequate evaporation for phase differentiation based on cutoff size with standard optical particle counting. During HyICE-2018, the CFDCs were operated at relative humidities below the point of droplet breakthrough in order to prevent such a situation.
CFDCs are online instruments that measure INP concentration in real time with a minimum time resolution determined by the instrument-specific particle counting method. However, since ambient INP concentrations are generally low, measurements typically consist of multi-minute counting averages. For the CFDCs used in this study, sampling intervals varied between 5 and 20 min, depending on the instrument, and were separated by background measurements of clean, filtered air. Ice crystal concentrations were obtained from the OPC counts and averaged over time. Concentrations obtained during background measurements were then subtracted from the concentrations measured during each sampling window to compute the measured INP concentrations, where the lower limit of detection is defined as 1 standard error above the background mean.
Overall, CFDC measurements are time-limited by the quality of the thin ice layer coating the chamber walls, which deteriorates over time and contributes to increasing particle counts as the instruments operate. Single experiments typically last 3 to 5 h, after which the ice coating needs to be regenerated to restore low background conditions. This is done by warming and purging the chamber, before re-cooling and re-coating the walls with ice. This process can last 1 to 3 h, allowing for two to four daily measurement cycles if continuous operation is desired (Paramonov et al., 2020a). In the following sections we describe the instrument specifics for each CFDC run during HyICE-2018.
I. Portable Ice Nucleation Chamber – PINC
PINC is a first-generation, field-deployable, parallel-plate CFDC based on the designs by Stetzer et al. (2008), and it has been operated in many locations around the world for more than a decade (Chou et al., 2011, 2013; Boose et al., 2016; Kanji et al., 2019). During HyICE-2018, PINC was operated from 19 February to 2 April (Fig. 2) in the main aerosol cottage (Figs. 1 and 4), with one to two experimental cycles conducted per day, always during daytime. For the duration of the campaign, PINC was operated at a fixed lamina temperature of Tl = −31 ∘C and a relative humidity with respect to water RHw=105 %. These conditions were selected to simulate mixed-phase cloud conditions and correspond to the condensation/immersion freezing mode(s) of ice nucleation (Vali et al., 2015). Sampling was performed from a total aerosol inlet mounted outside of the building, 6 m above ground level (Fig. 4). The inlet was heated to 25–30 ∘C to evaporate droplets and ice crystals and had a carrier flow rate of 250 L min−1. Individual instruments then sampled from manifolds on this inlet using their own external pumps. For PINC, a 4 L min−1 sample flow was extracted, and a cyclone was used to eliminate particles larger than 2.5 µm. A molecular sieve dryer was installed to keep the relative humidity of the sample below 30 %. After the dryer, the sample flow was split into four: 1 L min−1 to a condensation particle counter (CPC; TSI model 3010), 1 L min−1 to an aerodynamic particle sizer (APS; TSI model 3321), 1 L min−1 to a scanning mobility particle sizer (SMPS; with one Hauke-type differential mobility analyzer (DMA) and one TSI model 3772 CPC) and 1 L min−1 to PINC (Fig. 4 and Paramonov et al., 2020a).
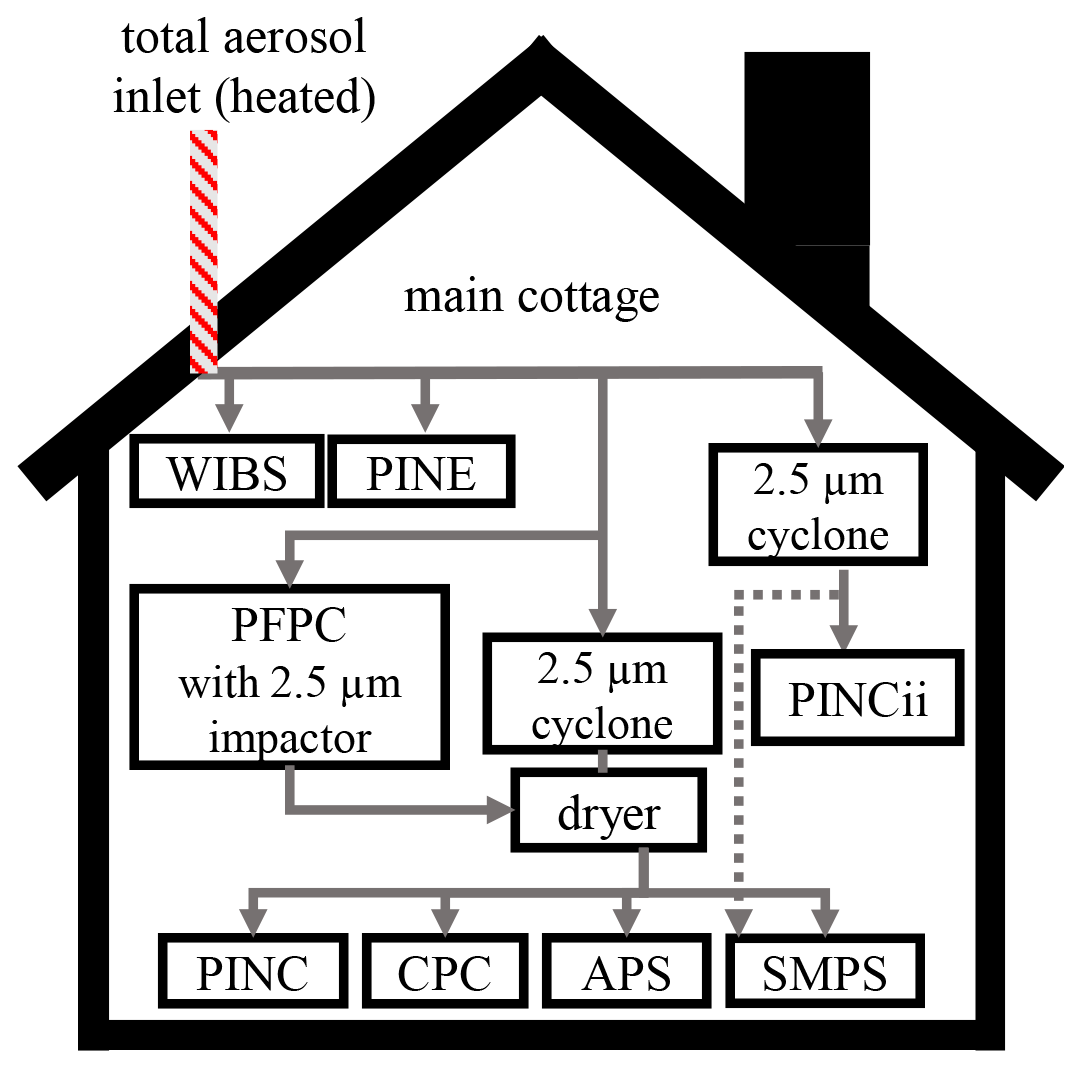
Figure 4Instrumental setup in the main cottage. Note that PINC and its complete setup (PFPC, CPC, APS and SMPS) were used from 19 February to 2 April 2018 and were replaced by PINCii from 22 April to 10 June 2018. Between May 4 and May 23, the SMPS was used in parallel with PINCii, as represented with the dashed lines (see Sect. 2.2.1 for details).
On several occasions, a portable fine particle concentrator (PFPC) was used to concentrate aerosol particles in the sample flow upstream of PINC (Fig. 4). The PFPC, described by Gute et al. (2019) and based on the design by Sioutas et al. (1995), is a multistage concentrator based on virtual impaction. It concentrates aerosol particles with a certain size-dependent enrichment factor where larger particles are concentrated more efficiently than smaller ones. The size-dependent enrichment factor is determined by measuring the particle size distributions before and after the PFPC. The enrichment factor was estimated as 25±6 for ambient particles of diameters between 0.4 and 2.5 µm, when the PFPC was operated at sea level in the vertical configuration (Gute et al., 2019). During the HyICE-2018 campaign, a second enrichment factor was determined before each ice nucleation experiment by calculating the ratio between a concentrated INP measurement point and an ambient measurement point bypassing the PFPC. Ambient INP concentrations were then back-calculated by multiplying the concentrated INP concentrations by this second enrichment factor (Paramonov et al., 2020a).
When the PFPC was used, the 2.5 µm cyclone was removed and replaced by the 2.5 µm impactor located inside the PFPC (see Fig. 4). On 22 March, the cyclone was removed so that PINC directly sampled the inlet air and the operating conditions were changed to ∘C, and RHw=105 % for inter-comparison purposes.
In this article we summarize the performance of PINC during the targeted days of instrument inter-comparison, while the longer-term results from the PINC measurements during HyICE-2018 are presented and discussed by Paramonov et al. (2020a).
II. Portable Ice Nucleation Chamber II – PINCii
PINCii is a parallel-plate CFDC developed as an upgrade to the PINC instrument. Although many specific engineering details differ, the primary differences between PINC and PINCii are the chamber dimensions and cooling power. While PINC's main chamber and evaporation section are 568 and 230 mm in height, respectively (Chou et al., 2011), PINCii is approximately twice as large with a main chamber of 1000 mm and an evaporation section of 440 mm. A manuscript outlining the engineering and operational details of PINCii is in preparation (Castarède et al., 2021).
During the campaign, PINCii was operating from 22 April to 10 June 2018 and measured INP concentrations at fixed ∘C and RHw=105%. PINCii was located in the main cottage and sampled from the heated total aerosol inlet, essentially acting as a substitute for the earlier PINC measurements as depicted in Fig. 4. However, during this later sampling interval, the PFPC was not used, and the additional SMPS was used for the first 2 weeks of May only. For the typical setup during the campaign, PINCii sampled downstream of the 2.5 µm cyclone.
III. SPectrometer for Ice Nuclei – SPIN
SPIN is a commercially developed CFDC manufactured by Droplet Measurement Technologies in Boulder, CO, USA, and based on the parallel-plate PINC design. The design and use of SPIN have been previously documented (Garimella et al., 2016, 2017, 2018), and some SPIN instruments (≈ 10 exist worldwide) have participated in earlier inter-comparison activities (DeMott et al., 2018). For HyICE-2018, the University of Eastern Finland SPIN instrument (UEF-SPIN) was installed and operated for several days between 20 March and 3 April. SPIN was situated in a measurement container approximately 200 m from the main cottage (see Fig. 1). SPIN sampled through a burled PM2.5 inlet (DIGITEL Elektronik AG, Switzerland) located 110 cm above the roof of the container. The PM2.5 inlet had a nominal sampling flow rate of 16.67 L min−1, regulated by an external pump and mass-flow controllers (MFCs) (Fig. 5). A virtual impactor (VI)-type concentrator, which was a scaled-up version of the construction described by Rostedt et al. (2006), was used to enhance SPIN's sampling and detection of INPs (more details about the VI concentrator are provided below). The configuration illustrated in Fig. 5 provided an amplification of the particle number concentration by approximately 9-fold. A CPC (Airmodus model A20) was operated in parallel with the SPIN to monitor the concentrated particle number concentration during measurements.

The use of the VI concentrator may have generated biases in the SPIN measurements. Indeed, the magnification factor of the VI concentrator was most prominent for particles with diameters from 1.3 to 2.5 µm, with an average of 8.45±0.43 (Fig. A1). For smaller particles, the magnification factor decreased steeply, being 4.2 for 850 nm particles. This resulted in larger supermicron particles being over-represented in the sampled particles in comparison to their ambient number concentrations. Indeed, the APS data showed very low number concentrations for particles with diameters larger than 1.3 µm, with a daily average of 0.26 cm−3. Because of the over-representation of supermicron particles, and since larger particles with larger surface areas are increasingly likely to host active sites, making them better INPs (Mason et al., 2016), it can be expected that the role of such particles as INPs is more pronounced in the SPIN observations. Note that, due to the absence of a rigorous correction method for the SPIN measurements during HyICE-2018, the SPIN data presented here are the concentrated INP concentrations per volume of sampled air and not the back-calculated ambient INP concentrations.
During its first 3 measurement days, SPIN was programmed to measure using automated RH scans, where the relative humidity with respect to water, RHw, was increased from 70 % to 110 % while keeping a constant lamina temperature. Such scans were realized for lamina temperatures of , −36 and −32 ∘C. On these 3 measurement days, a total of 33 RH scans were performed with 5 min background checks between successive scans. Thereafter, the sampling program was modified to be more suitable for ambient particle measurements, and a modified scanning protocol was used for the remainder of the campaign. The modified sampling protocol consisted of longer scans at 32 and −28 ∘C, where at each Tl measurements were made with two saturation conditions (RHw=95 % and 110 %). At each of the four conditions, 20 min sampling intervals followed by 5 min of background sampling were used. Measurements continued until the background signal exceeded 10–15 particles L−1, after which the chamber was re-iced to return to a lower background signal (Garimella et al., 2016, 2017, 2018).
For inter-comparison purposes, SPIN sampled at ∘C and RHw=105 % on 22 March and at ∘C and RHw=105 % on 28 March.
2.2.2 Expansion chamber – PINE
The Portable Ice Nucleation Experiment (PINE) chamber (Fig. 3b), as described in Möhler et al. (2021), has been developed based on the working principle of the Aerosol Interactions and Dynamics in the Atmosphere (AIDA) cloud chamber (Bunz et al., 1996; Möhler et al., 2003, 2006), which simulates cloud formation in rising atmospheric air parcels. The PINE chamber is operated in a cycled mode during which it is first flushed with ambient aerosol to renew the sampled volume of air under investigation. During HyICE-2018, this first mode was run for 4 min with a flow rate of 3 L min−1. Then, an expansion mode is initiated by sealing the main inlet valve and pumping air out of the chamber, leading to a decreasing pressure and a decreasing (but well-mixed) particle number concentration within the chamber. As the pressure decreases to 700 mbar in approximately 40 s, the volume of gas expands and the gas temperature decreases, leading to an increase in the relative humidity within the chamber. Upon reaching water saturation, aerosol particles within the chamber activate to form supercooled liquid droplets. If aerosol particles immersed within the droplets are also active as INPs at the respective droplet temperature, then those droplets will freeze via the immersion-freezing pathway. Frozen droplets are optically detected at the exit of the chamber using an OPC (Welas model 2500p) and are differentiated from liquid droplets based on their size. After the expansion, a final refill procedure is conducted, wherein the chamber continues to be depressurized using dry, filtered air to avoid any icing. The total experimental time of the three-mode cycle is approximately 6 min, and each cycle generates one measurement point. Longer averaging times (e.g., 1, 6 or 24 h) are commonly implemented in postprocessing for purposes of statistical analysis. PINE is operated in a way that ensures frost-free walls such that a subtraction of any background ice counts is not needed.
During HyICE-2018, PINE was located in the main cottage (Figs. 1 and 4) and was operated continuously from 13 March until 11 May 2018 at measurement temperatures between −24 and −32 ∘C. During this time, PINE was operating with either a constant temperature or with a stepwise temperature ramping, during which the temperature was lowered three times by 2–3 ∘C each hour. In the main cottage, PINE sampled from the heated total aerosol inlet without using a size cutoff in order to sample the total aerosol. Particle transmission efficiency as a function of particle size (Fig. A2) was investigated by measuring particle concentrations upstream of the PINE chamber inlet and in the ambient air using an OPC (MetOne model GT 526S). The results illustrate that PINE was effectively sampling PM5 aerosol, although the cutoff was not as sharp as would be expected from a traditional impactor.
During the inter-comparison days, PINE was operating at a constant temperature close to the lamina temperature, Tl, selected for the CFDCs. On 22 March, PINE sampled at a temperature of ∘C, while on 28 March the temperature was lowered to ∘C. For the inter-comparison conducted in April, PINE sampled at ∘C.
While this study focuses on PINE's results during the inter-comparison days, the long-term measurements are presented and discussed in Adams et al. (2022).
2.2.3 Filter sampling for droplet-freezing assays
Numerous droplet-freezing assay techniques exist for offline measurements of INP concentrations in aerosol samples. The techniques presented here relied on filter collection and resuspension of collected material into known volumes of liquid (Fig. 3c). The liquid is generally separated into sample aliquots which are exposed to decreasing temperatures and monitored for freezing using optical techniques. Aliquots are assumed to freeze when the most “active” INP in any given sample volume initiates ice formation. A series of assumptions allows the concentration of INP at a given freezing temperature to be calculated from the number of frozen aliquots (Vali, 1971b). It is important to note that these techniques typically assess the ice nucleation tendencies of sample material that is immersed within the liquid (Fig. 3d). During HyICE-2018, two droplet-freezing assay techniques using similar sampling protocols but different freezing systems were deployed, and the analyses were performed in the SMEAR II laboratories.
I. Ice Nucleation SpEctrometer of the Karlsruhe Institute of Technology – INSEKT
The INSEKT is a droplet-freezing assay based on the Colorado State University Ice Spectrometer (CSU-IS) design, which was originally developed by Hill et al. (2014, 2016). A detailed description of the INSEKT setup and working principle can be found in Schiebel (2017). For INSEKT, filters were collected beginning 2 March and continuing through the end of the intensive campaign in mid-June 2018. Further INSEKT filters were collected more intermittently at the site for more than 1 more year (until May 2019), and that data yielded detailed information related to the seasonality of observed INPs (Schneider et al., 2021). Ambient aerosol particles were collected onto 0.2 µm filters (Whatman Nuclepore track-etched polycarbonate membranes, 47 mm), which were precleaned with a 10 % H2O2 solution and subsequently rinsed with deionized water that was passed through a 0.1 µm syringe filter (Whatman). After collection, the filters were stored in sterile petri dishes, wrapped in aluminum foil and frozen until analysis with INSEKT. Sampling was performed at three different SMEAR II locations. The primary sampling unit was installed at the aerosol cottage (Fig. 1) at ground level, where daily 24 h filter samples were collected through a PM10 inlet mounted on a ≈1.8 m vertical sampling line. A secondary filter sampling unit was used in a container on top of the 35 m tower, again using a PM10 inlet and ≈1.8 m vertical sampling line. Generally, from the 35 m tower, two filters were collected per day (≈10 hours during the day and ≈14 h during the night). However, there were 10 d during the campaign when the tower sampling time was extended to 24 h in order to directly compare with the results from the aerosol cottage. On 28 March, two filter samples were collected at the main cottage for inter-comparison with the other INP instruments. For both filters, the sampling time was approximately 3 h, and sampling was carried out using a total aerosol inlet. Higher-altitude air was also sampled using an aircraft-mounted filter sampling unit (see Sect. 2.3.2 for more details).
After sampling, the filters were suspended in 8 mL of Nanopure water that had been passed through a 0.1 µm syringe filter. The sample solution was then spun on a rotator for approximately 20 min in order to wash the collected aerosol particles from the filter. Small 50 µL volumes of the resulting liquid were pipetted into the 192 wells of two polymerase chain reaction (PCR) plates. The plates were then inserted into the freezing apparatus and were cooled with a constant 0.25 or 0.33 ∘C min−1 cooling rate using an ethanol chiller (LAUDA Dr. R. Wobser GmbH & Co. KG.; Proline RP 890 in combination with a LAUDA command module). Brightness changes of the small sample volumes, which correspond to freezing events, were detected using a camera (EO-23122, Edmund Optics monochrome camera) and a custom-made LabVIEW program for image acquisition and analysis. The number of frozen volumes, which increases as the temperature decreases, is used to determine a temperature spectrum of INP concentration (Vali, 1971a). The INSEKT is able to measure INP concentrations at temperatures between −5 and −25 ∘C, which is relevant for heterogeneous freezing conditions within supercooled mixed-phase clouds.
Handling blank filters, which were collected without ambient air flowing through the membranes, were used during the campaign to verify that contamination was not an issue in the absence of ambient particles. Moreover, several control freezing spectra were done using the Nanopure water to ensure that the background freezing due to impurities in the water remained low relative to the number of INPs in the water after aerosol sampling. The INP concentrations reported here were obtained by subtracting the INP concentrations derived from both the handling blank filters and the freezing background measurements.
After quantifying the INP content of the aerosol samples, some heat treatment tests were performed to investigate the heat sensitivity of the sampled aerosol with respect to their freezing ability, which can be used to investigate if biological particles contributed to the INP population (Hill et al., 2016). For the heat treatment tests, a polypropylene test tube (CELLSTAR, Greiner Bio-One) filled with 2 mL of the aerosol suspension was placed in a 100 ∘C water bath for about 20 min. The heat-treated samples were then reanalyzed with the INSEKT to quantify changes in the INP temperature spectra.
II. Microlitre Nucleation by Immersed Particle Instrument – µL-NIPI
The µL-NIPI, similar to INSEKT, is also a droplet-freezing assay instrument for offline measurements of INP concentrations, requiring the collection of aerosol samples on filters. During HyICE-2018, filters were collected from 7 March until 10 June 2018, using omnidirectional ambient air particulate samplers (BGI PQ100, Mesa Laboratories Inc.). Filters were mainly collected at ground level next to the aerosol cottage using PM10, PM2.5 and PM1 inlets on 0.4 µm pore track-etched membrane polycarbonate filters (Nuclepore, Whatman). Some filters were also collected on top of the 35 m tower using a PM10 inlet and aboard an aircraft. In addition, filters were collected using a prototype version of the Selective Height Aerosol Research Kit (SHARK; Porter et al., 2020) to quantify more detailed, size-resolved measurements of the INP population, although this was done only sporadically for a few different sampling periods.
After sampling, collected aerosol particles were washed from filters using 5 mL of Nanopure water that had been filtered through a 0.2 µm filter (Sartorius, model Minisart). Droplets of the sample solution containing particles were pipetted onto a hydrophobic glass slide that holds approximately 50 droplets of 1 µL (Fig. 3c). The glass slide was placed on the temperature-controlled plate of the µL-NIPI, which was cooled to −40 ∘C at 1 ∘C min−1. The freezing temperature of each droplet was recorded via a digital camera using changes in contrast to determine when a droplet had frozen (Whale et al., 2015). Note that, as for INSEKT, handling blank and water background measurements were done to determine the baseline of the results, and only the data that are statistically above the baseline are reported.
Heat tests were performed using the same technique as described for the INSEKT, except the samples were heated for 30 min instead of 20 min (Hill et al., 2016; O'Sullivan et al., 2018). The heated samples were analyzed using the µL-NIPI, and the results were compared to the original unheated sample results in order to quantify any changes in INP activity, which is used to infer information about INPs of biogenic origin.
2.3 Additional aerosol particle characterization
Beyond INP measurements, further enhanced efforts were made to quantify, classify and assess aerosol properties at SMEAR II during the HyICE-2018 campaign. Multiple additional particle counters were installed to provide physical characterization of particles (Table 1). In addition to these ground- and tower-based instruments, airplane, drone flights and remote sensing retrievals were used to provide insight into the vertical distribution of aerosols and INPs. Moreover, the SMEAR II station has a unique boreal location and is known for the documented occurrences of NPF events driven by biogenic volatile organic compounds emitted by the vegetation of the boreal forest (Lehtipalo et al., 2018). Hence, extra effort was made to assess whether any links between biology and INP emerge, with a special focus on the seasonal transition of the forest biome.
2.3.1 Search for bio-ice nucleators
The boreal forest is a diverse ecosystem in which biological drivers of aerosol properties have been previously identified. For example, past research at the SMEAR II research station has shown that gas-phase BVOCs can act as precursors to NPF (Kulmala et al., 2013). In addition, previous studies have identified several biological influences on INPs, including biological detritus (Hiranuma et al., 2019; O’Sullivan et al., 2015), pollen (Dreischmeier et al., 2017), bacteria such as Pseudomonas syringae (Morris et al., 2004), fungi (Morris et al., 2013) and other microorganisms such as viruses (Adams et al., 2021). Therefore, during HyICE-2018, we aimed to assess potential links between biological activity and INPs.
In order to evaluate INPs of biological origin, a wideband integrated bioaerosol sensor (WIBS; Droplet Measurement Technology model WIBS-NEO) was used for online analysis of particles during the campaign. The WIBS measures particles between 0.5 and 30 µm using a light-scattering technique. In addition to particle counting, particles trigger two optically filtered (280 and 370 nm) xenon lamps that excite the fluorescence of biological particles. The emission is monitored in two detection bands (310–400 and 420–650 nm), whereafter an additional fluorescence threshold can be used to distinguish biological particles (strong fluorescence response) from other materials (e.g., some types of dust, soot) that are typically more weakly fluorescent. In this study, a threshold of FT + 9σ (where FT is the mean value of the forced trigger intensities and where σ is their standard deviation) was used to determine if a particle is fluorescent (details in Savage et al., 2017). The use of two excitation wavelengths and two detection channels allows for additional resolution in the fluorescence analysis, because different particle types often have different fluorescence intensities and emission bands (Savage et al., 2017). An additional benefit of the WIBS instrument is that it allows particle asphericity to be calculated (Savage et al., 2017). During HyICE-2018, the WIBS was operated from 11 March to 25 June at a flow rate of 0.3 L min−1 with an acquisition rate of 13 Hz, and the data were later averaged into user-defined time intervals of 10 min. The WIBS was first installed in the main cottage (11 March–3 April; Fig. 4), where it was sampling from the heated total aerosol inlet described previously (Figs. 4 and A2), and was therefore effectively sampling PM5 aerosol. Later, the instrument was moved into the aerosol cottage (3 April–25 June) and attached to a PM10 inlet described in Schmale et al. (2017). Thus the WIBS data reported here are for particles between 0.5 and 5 or 10 µm, depending on the instrument location.
In addition to online measurements, several offline sampling techniques were used to investigate potential biological contributions to INP from primary biological materials. Plant materials were collected and washed to test for ice-nucleation-active biological materials, and additional air samples were collected to cultivate fungal samples for DNA sequencing. For fungal cultivation, filter samples were collected overnight from 21 to 22 May and 22 to 23 May using a ILFH-27 filter holder (HI-Q Environmental Products Company Inc.) with Teflon filters and a flow rate of 20 L min−1. After sampling, the filters were suspended in a buffer solution (100 mM NaCl, 0.5 mM CaCl2, 1.0 mM MgCl2, 20 mM potassium phosphate pH 7.2, filter sterilized through 0.22 µm pore size), and 200 µL of the sample was spread on Luria-Bertani plates and incubated at 22 ∘C for ≈7 d or until visible colonies appeared. Single filamentous colonies of different morphology were isolated and inoculated on fresh media and subsequently incubated at 22 ∘C. The ice nucleation activity of each filamentous colony was then tested using the µL-NIPI, and the results are presented in the Atanasova et al. (2021) manuscript in preparation.
2.3.2 Vertical profiling
The vertical distribution of INPs through the atmospheric mixed layer is a key area of investigation within the INP research community. During HyICE-2018, several techniques were used in order to assess if vertical gradients exist in INP concentrations, which might bias ground-level measurements.
Airborne measurements were made between March and May 2018 using a Cessna 172 aircraft equipped with onboard instrumentation for classifying aerosol physical properties and equipment for INP filter sampling for offline characterization using INSEKT and µL-NIPI. In-flight monitoring of aerosol physical properties was conducted using a particle size magnifier (PSM; Airmodus model A10) and a CPC (TSI model 3776) to measure particle number concentrations. Furthermore, a SMPS and an optical particle sizer (OPS; TSI model 3330) were used to classify particle number size distributions. A shrouded solid diffuser inlet, designed based on the University of Hawaii inlet (McNaughton et al., 2007), with a 5.0 µm aerodynamic diameter cutoff was used. With this setup, particle number size distributions from 1.5 nm to 5.0 µm were measured. Additional sensors (Rotronic HygroClip-S, PT1-100 temperature sensor and LI-COR Li-840) measured relative humidity, temperature, and CO2 and H2O concentrations during the flights. The aircraft's GPS receiver recorded latitude, longitude and flight altitude. The boundary layer depth was estimated during the flights using the real-time measurements of particle concentration, relative humidity and temperature, and it ranged between 500 and 2500 m (mean = 1300 m, SD = 704 m). Filter samples were collected within the boundary layer and the free troposphere to characterize the vertical distribution of INP concentrations. Measurement flights took off from the nearby (≈60 km distant) Tampere–Pirkkala airport, with 3 h flight plans that consisted of 20–40 km segments flown over the SMEAR II research station at different altitudes between 100 and 3500 m above ground level.
Drone flights flown by the Finnish Meteorological Institute's Remotely Piloted Aircraft System (FMI-RPAS) rotorcraft hexacopter were conducted on 27 March in an effort to assess the state of lower boundary layer aerosol and for comparisons with the instruments installed at various heights on the measurement towers. The RPAS carried a payload that included two CPCs (TSI model 3007) with different cutoff diameters (7 and 14 nm), an OPC (Alphasense model N2, 16 size bins from 0.38 to 17 µm) to classify particles by size, and sensors to measure temperature, relative humidity (Vaisala HMP110 probe), and pressure (Arduino Bosch BME280). More details on the platform and the instrumentation setup are given in Brus et al. (2021). During HyICE-2018, flights were typically conducted below 700 m above ground level.
The SMEAR II station is additionally an ACTRIS cloud profiling station equipped with a cloud radar (94 GHz FMCW1 Doppler cloud radar, RPG-FMCW-94-DP), a Doppler lidar (DL, HALO Photonics) and a profiling microwave radiometer (Humidity And Temperature PROfiler, RPG-HATPRO). The cloud profiling instruments were operational during the HyICE-2018 campaign. The cloud observations are used to quantify cloud properties such as cloud boundaries, phase, ice water content and liquid water content (Illingworth et al., 2007). Moreover, radar observations can be used to identify ice particle growth processes like riming (Kneifel and Moisseev, 2020) and the onset of ice particle formation (Oue et al., 2015; Li and Moisseev, 2020). In combination with INP measurements, these observations are useful for identifying cases that may be attributed to secondary ice production (Field et al., 2017; Sinclair et al., 2016).
The wide range of techniques and instrumentation employed during HyICE-2018 has led to many results. In this paper, we summarize the general results for the duration of the intensive campaign and focus on a few instances where defined efforts were made to intercompare different INP measurement techniques and instrumentation. Longer-term and more detailed studies that have emerged from specific instruments and/or activities have been or will be published independently, with many contributions aimed at the Copernicus special issue “Ice nucleation in the boreal atmosphere” (Paramonov et al., 2020a; Schneider et al., 2021).
3.1 Meteorological conditions and seasonal change
The HyICE-2018 campaign aimed to capture the seasonal transition from winter to summer conditions. During winter, the campaign was characterized by deep snow cover (60 cm on average) and cold temperatures (between −17 and 0 ∘C) (Fig. 6a). In 2018, the transition from winter to summer was rather abrupt at the measurement site, and as depicted in Fig. 6a, snow cover went from a near maximum to completely melted away within a couple of weeks in April 2018. This transition coincides with an increase in the fraction of fluorescent particles (Fig. 6c), which are used as a proxy for biological particles (Savage et al., 2017). By mid-May, the forest ecosystem fully transitioned into summer and ambient temperatures reached nearly 30 ∘C. In fact, May 2018 was declared anomalously warm over all of Finland (Sinclair et al., 2019). The seasonal change is also noticeable from particle number size distribution measurements (Fig. 6b), with an increase in particle concentrations beginning in April. The seasonal change is less evident in the NPF event frequency, which is also plotted in Fig. 6b (white diamonds; Dal Maso et al., 2005; Vana et al., 2008). In Fig. 7, aerosol characteristics (concentration and NPF occurrence) are represented as a function of wind direction, air temperature, and time for heights (8.4 and 67.2 m) below and above the forest canopy. Although trends might be expected due to varying source regions (Tunved et al., 2003, 2006), no clear correlation is observed between the aerosol features, the wind direction or the changing seasons. The same conclusion is drawn for the intermediate heights of 16.8 and 33.6 m (see Figs. A3 and A4). Such observations further motivate the search for other seasonally dependent variables, such as aerosol chemical composition and biological activity, that may influence the ice-nucleating potential of the aerosols (Tobo et al., 2013).
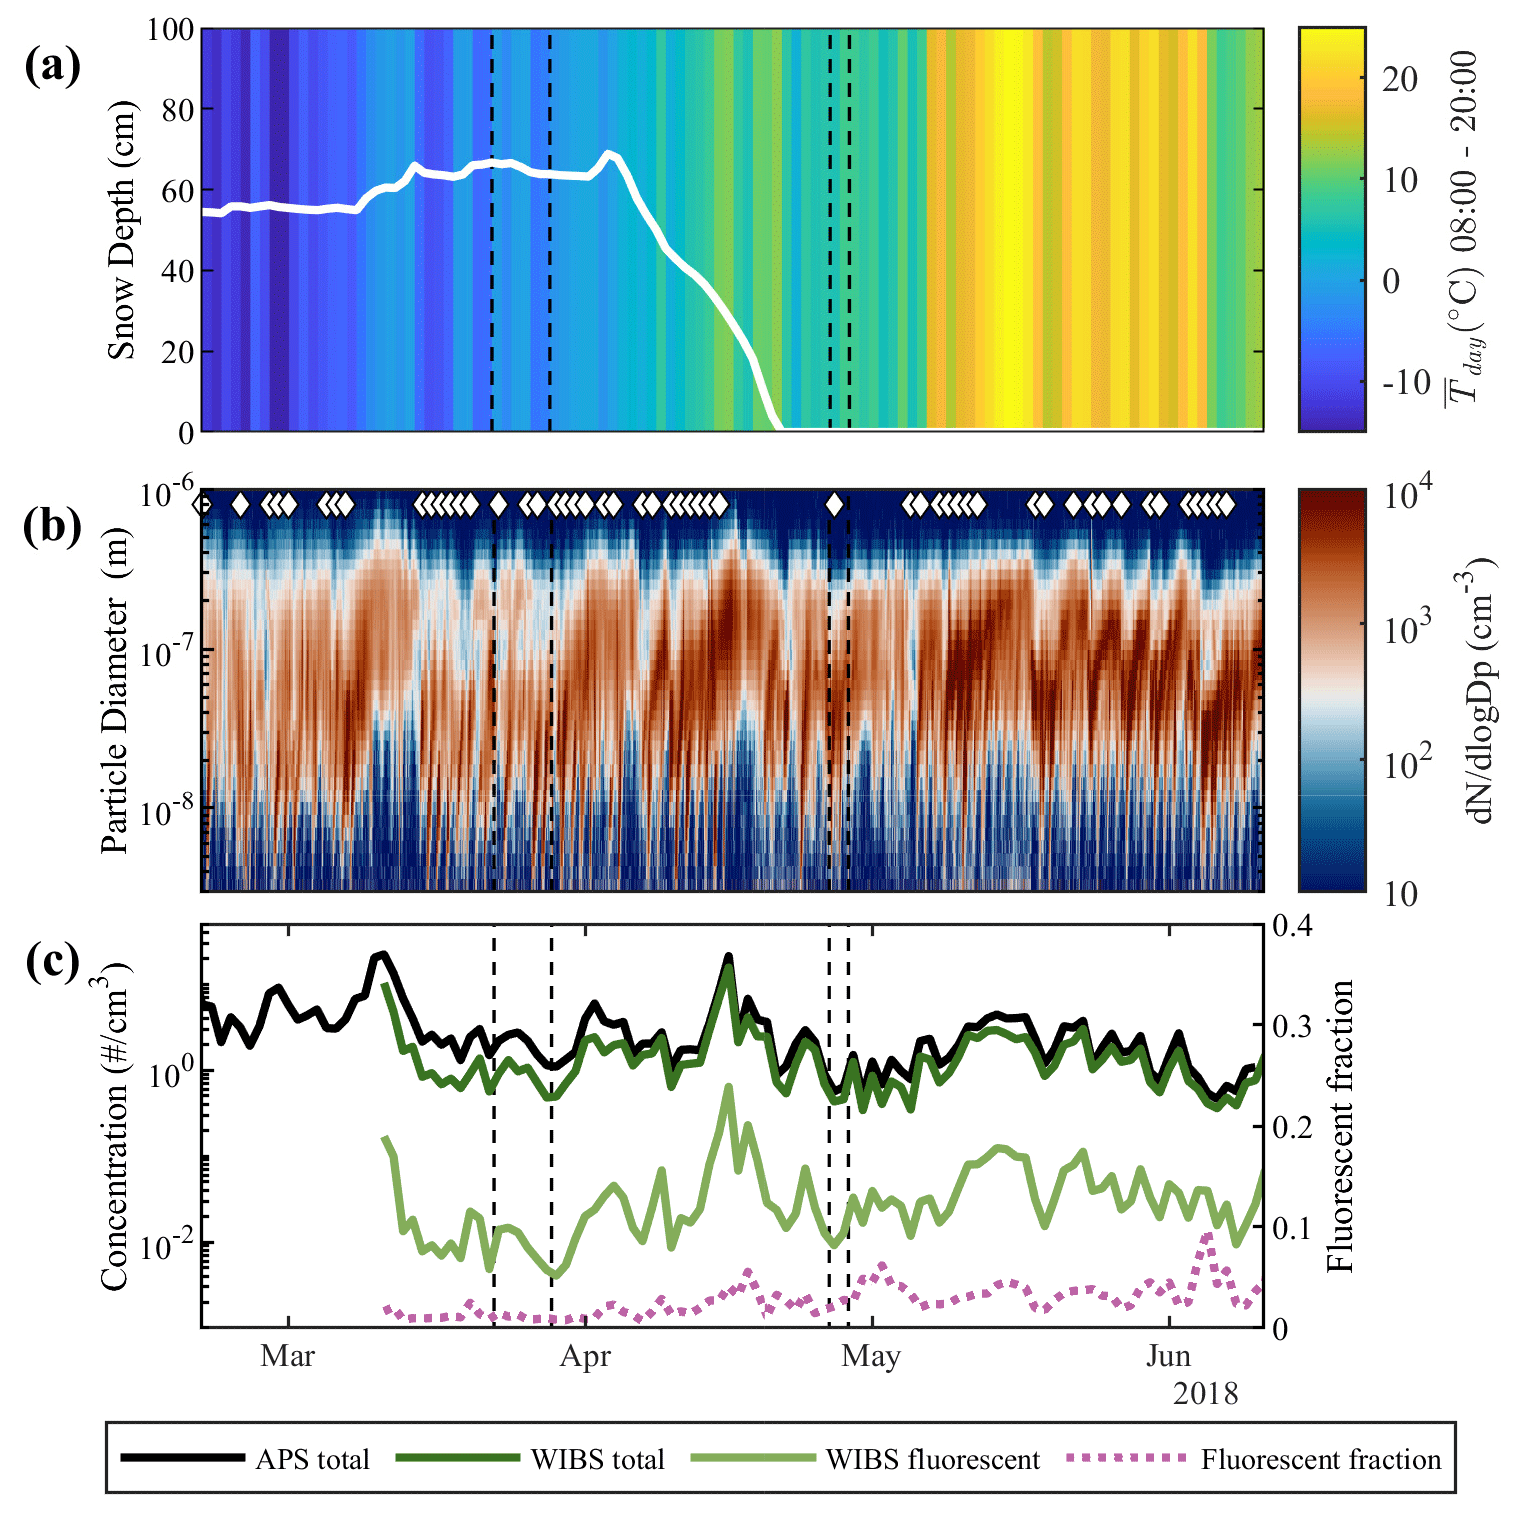
Figure 6(a) Snow depth (1 min resolution, white trace) as a function of time, with the shading representing the mean daytime air temperature. (b) Particle number size distribution from the SMEAR II DMPS. NPF events are indicated by white diamonds. (c) daily average of total particle concentration from the SMEAR II APS, total and fluorescent particle concentration from the WIBS and fluorescent fraction (f = WIBS fluorescent / WIBS total concentration) as a function of time. See Sect. 2.3.1 for more information concerning the WIBS. In all three panels, the instrument inter-comparison days are indicated by the black dashed lines.
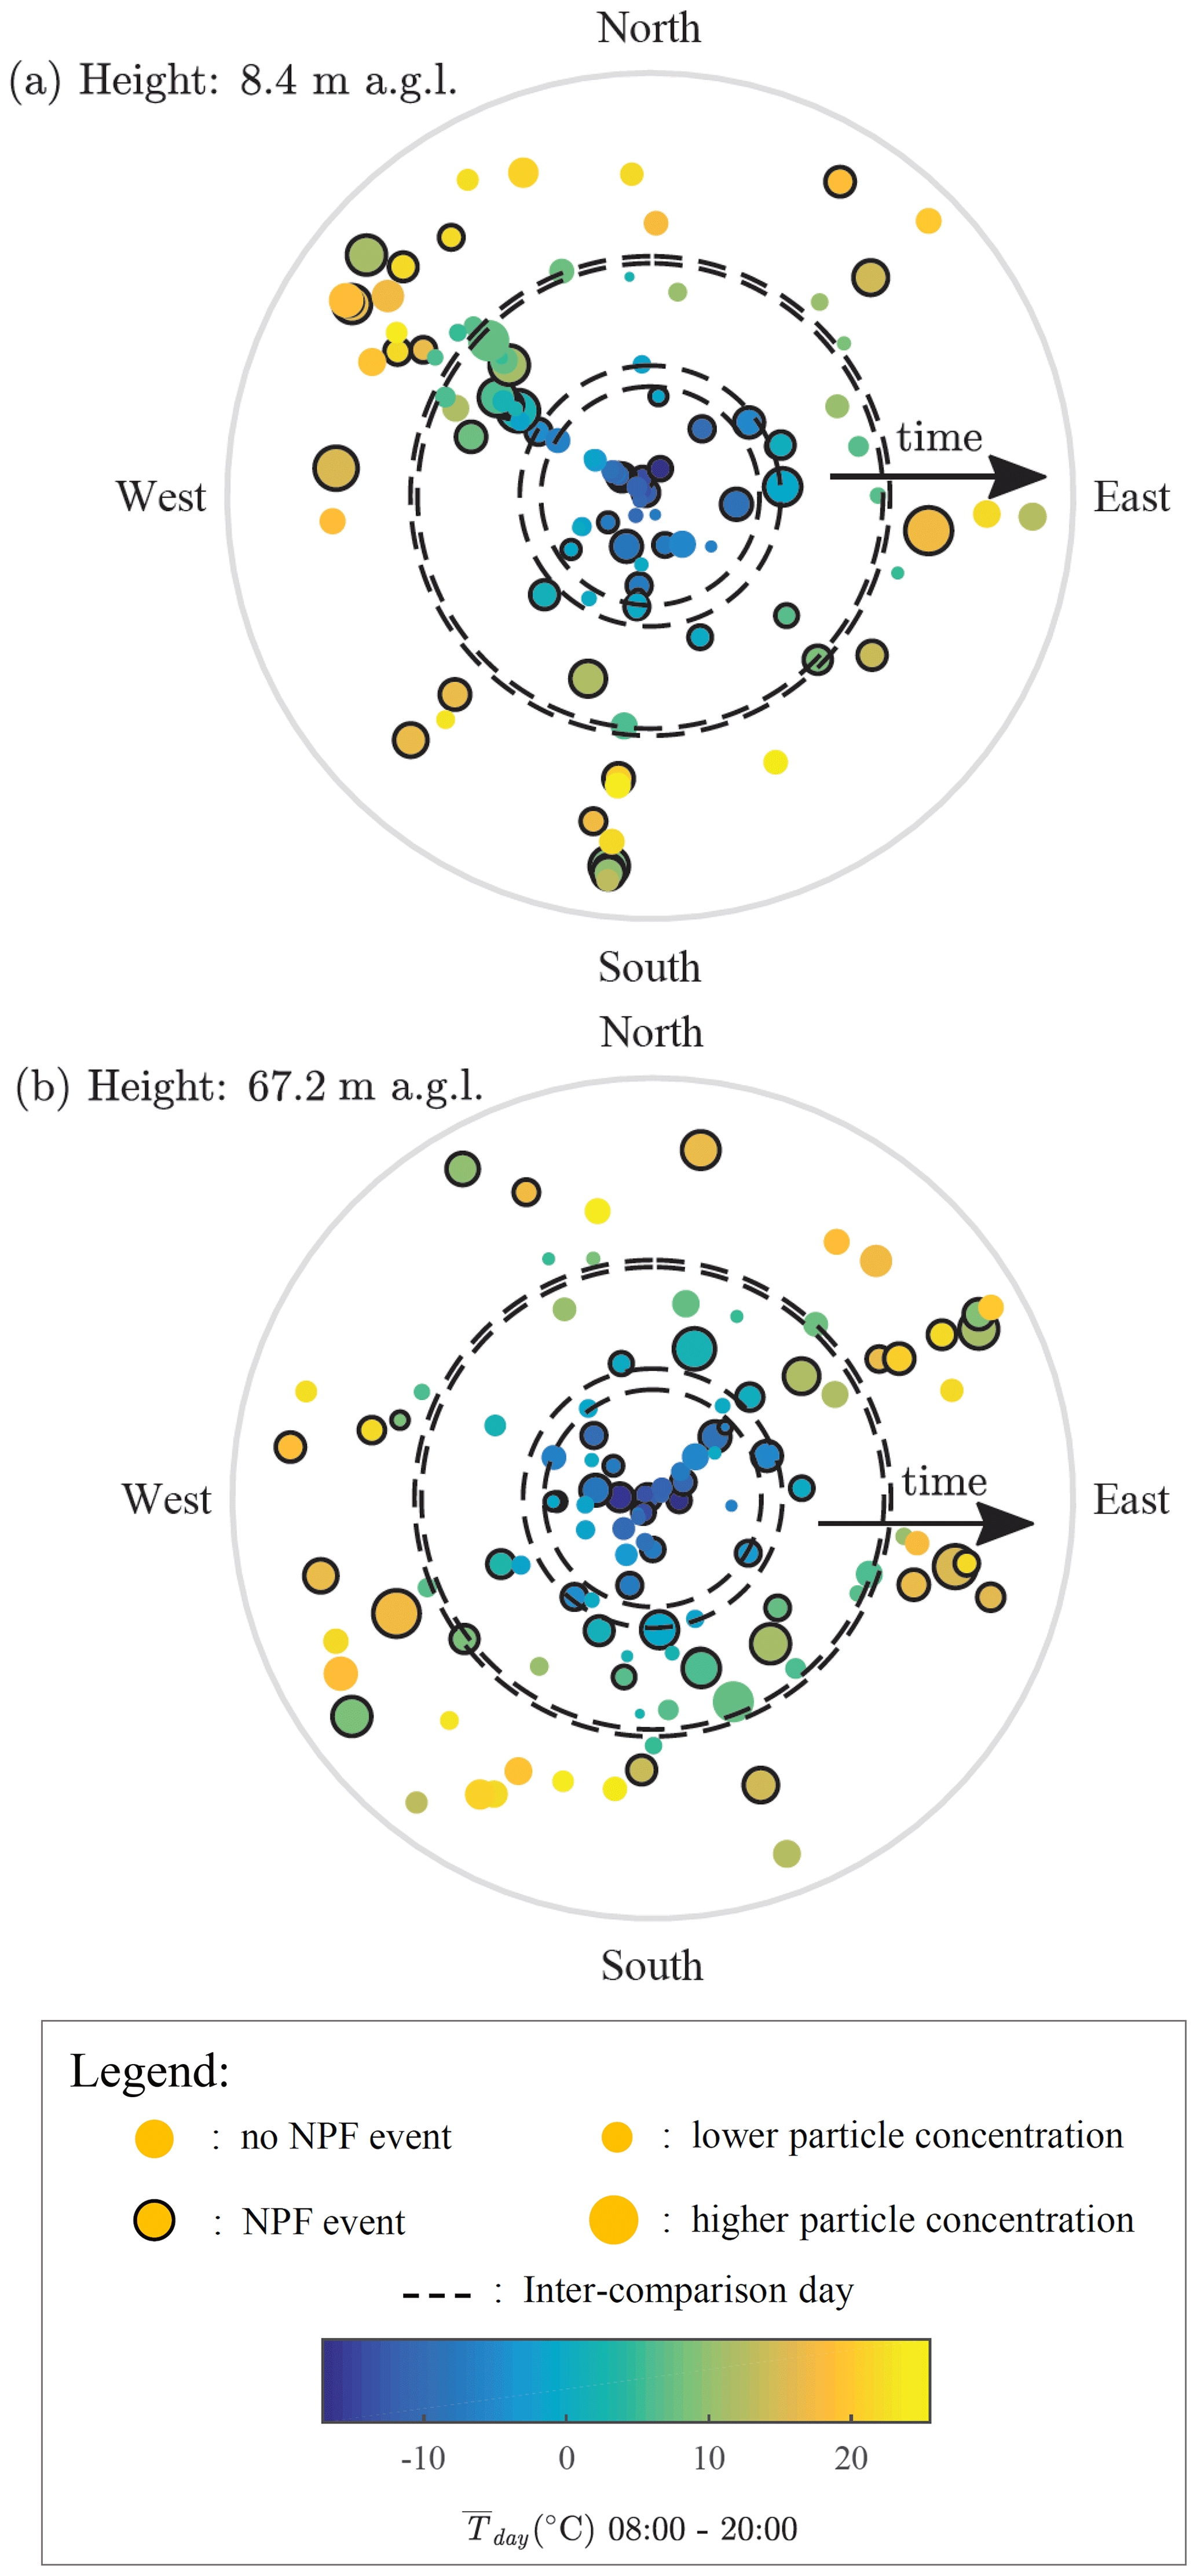
Figure 7Wind roses representing multiple aerosol features, including relative average particle concentration (calculated from the SMEAR II DMPS and APS concentrations) and NPF events, as a function of air temperature, wind direction and time at 8.4 (a) and 67.2 m (b) above ground level on the mast.
3.2 INP measurement inter-comparisons
To maximize the number of instruments that were available for the inter-comparison study, 22 March, 28 March, 26 April and 28 April 2018 were chosen for instrument inter-comparison. During these days, the online chambers PINC, PINCii, SPIN and PINE were operated with thermodynamic conditions close to one another, and an effort was made to maximize the temporal overlap of measurements. Filter sampling for droplet-freezing assay inter-comparison measurements were carried out on 28 March 2018.
3.2.1 Online instrument inter-comparison
A summary of the thermodynamic conditions used with the online chambers during the inter-comparison days is shown in Table 2. Note that, as mentioned earlier, both PINC and SPIN were using concentrators to increase their signal-to-noise ratio, which might lead to potential bias in their results. For PINC, the ambient INP concentration was back-calculated from the concentrated measurements, while the SPIN data presented here are the concentrated INP concentration per volume of sampled air.
Table 2Thermodynamic conditions and inlet settings used for the online instrument inter-comparison studies conducted on on 22 March, 28 March, 26 April and 28 April 2018.
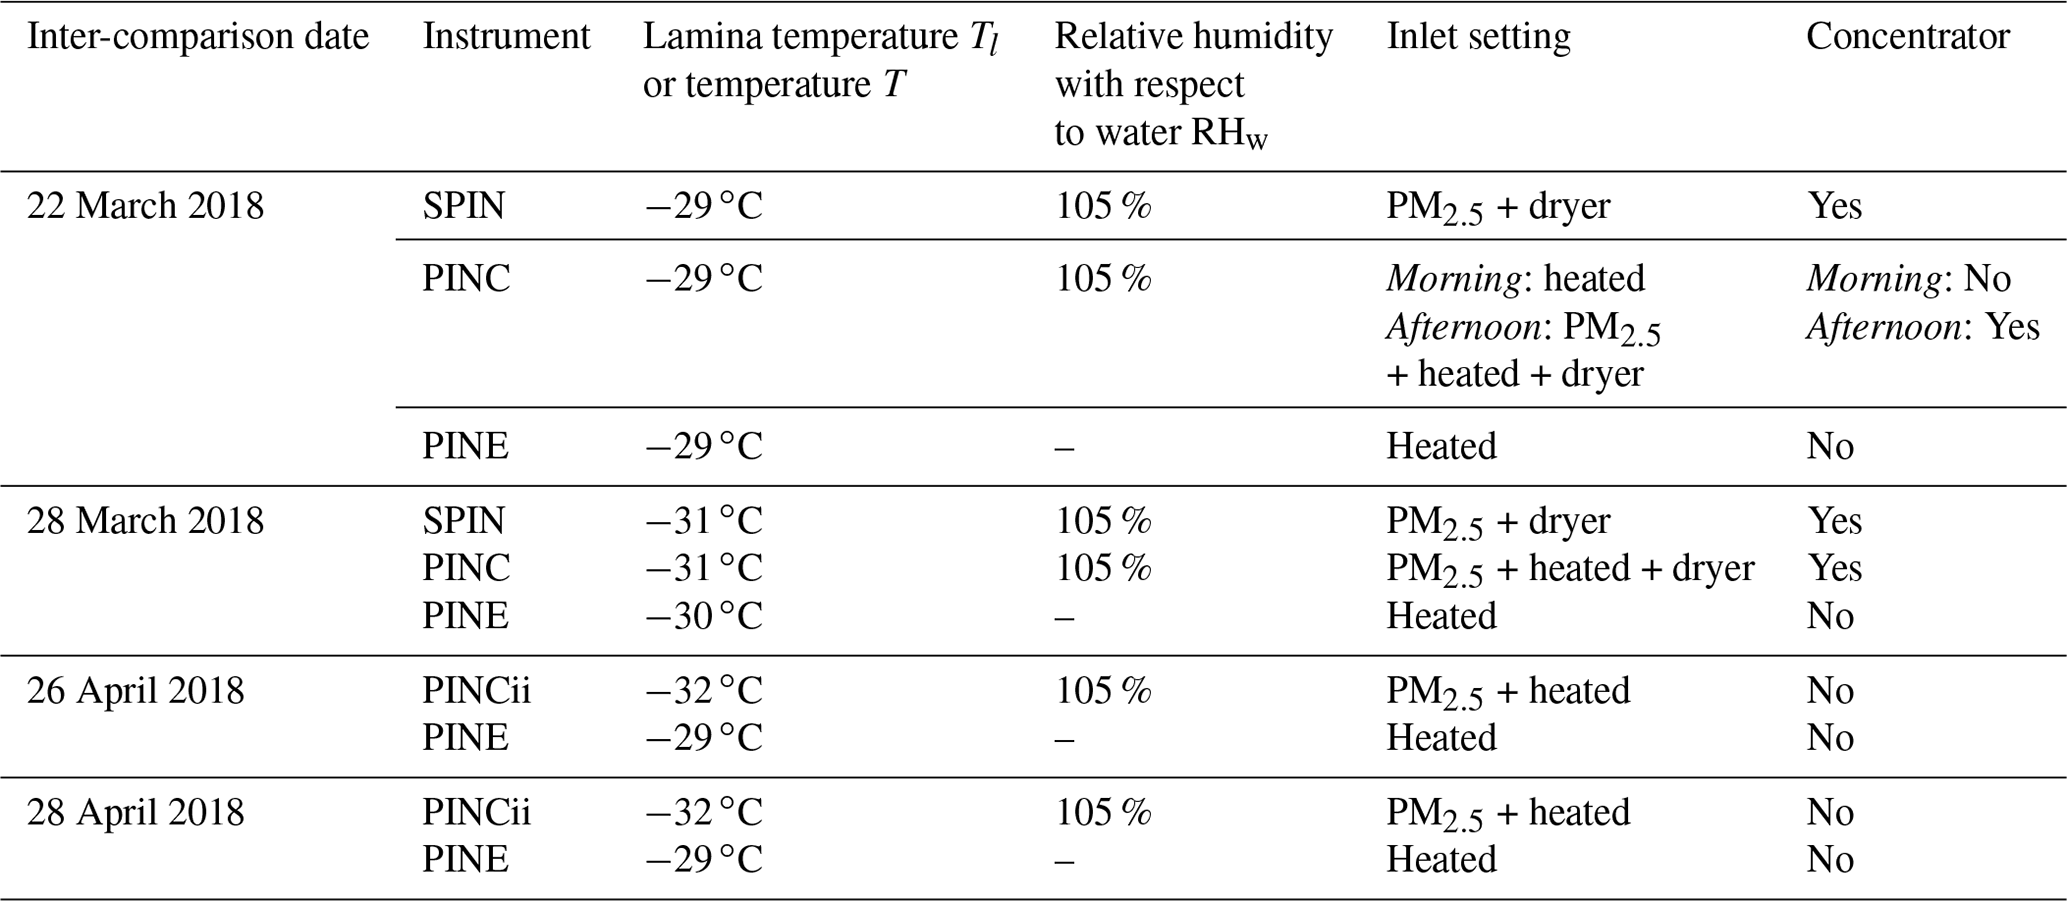
Figure 8 presents the time series of each chamber's measurements during the inter-comparison days. The PINE data are presented as a 5-point moving average to reduce the uncertainty associated with poor counting statistics in the periods when INP concentrations were close to the detection limit (below ≈ 5 L−1 for a single expansion). The error bars represent 20 % uncertainty in absolute INP concentrations (cf. Möhler et al., 2021). The SPIN data are generated from the difference between 15 min sampling averages and 5 min interpolated background concentrations, with error bars that represent ±1 standard deviation of the processed signal. The PINC and PINCii data are processed in an analogous manner to the SPIN data but with sampling windows of 20 and 15 min, respectively, and background windows of 10 and 15 min, respectively.
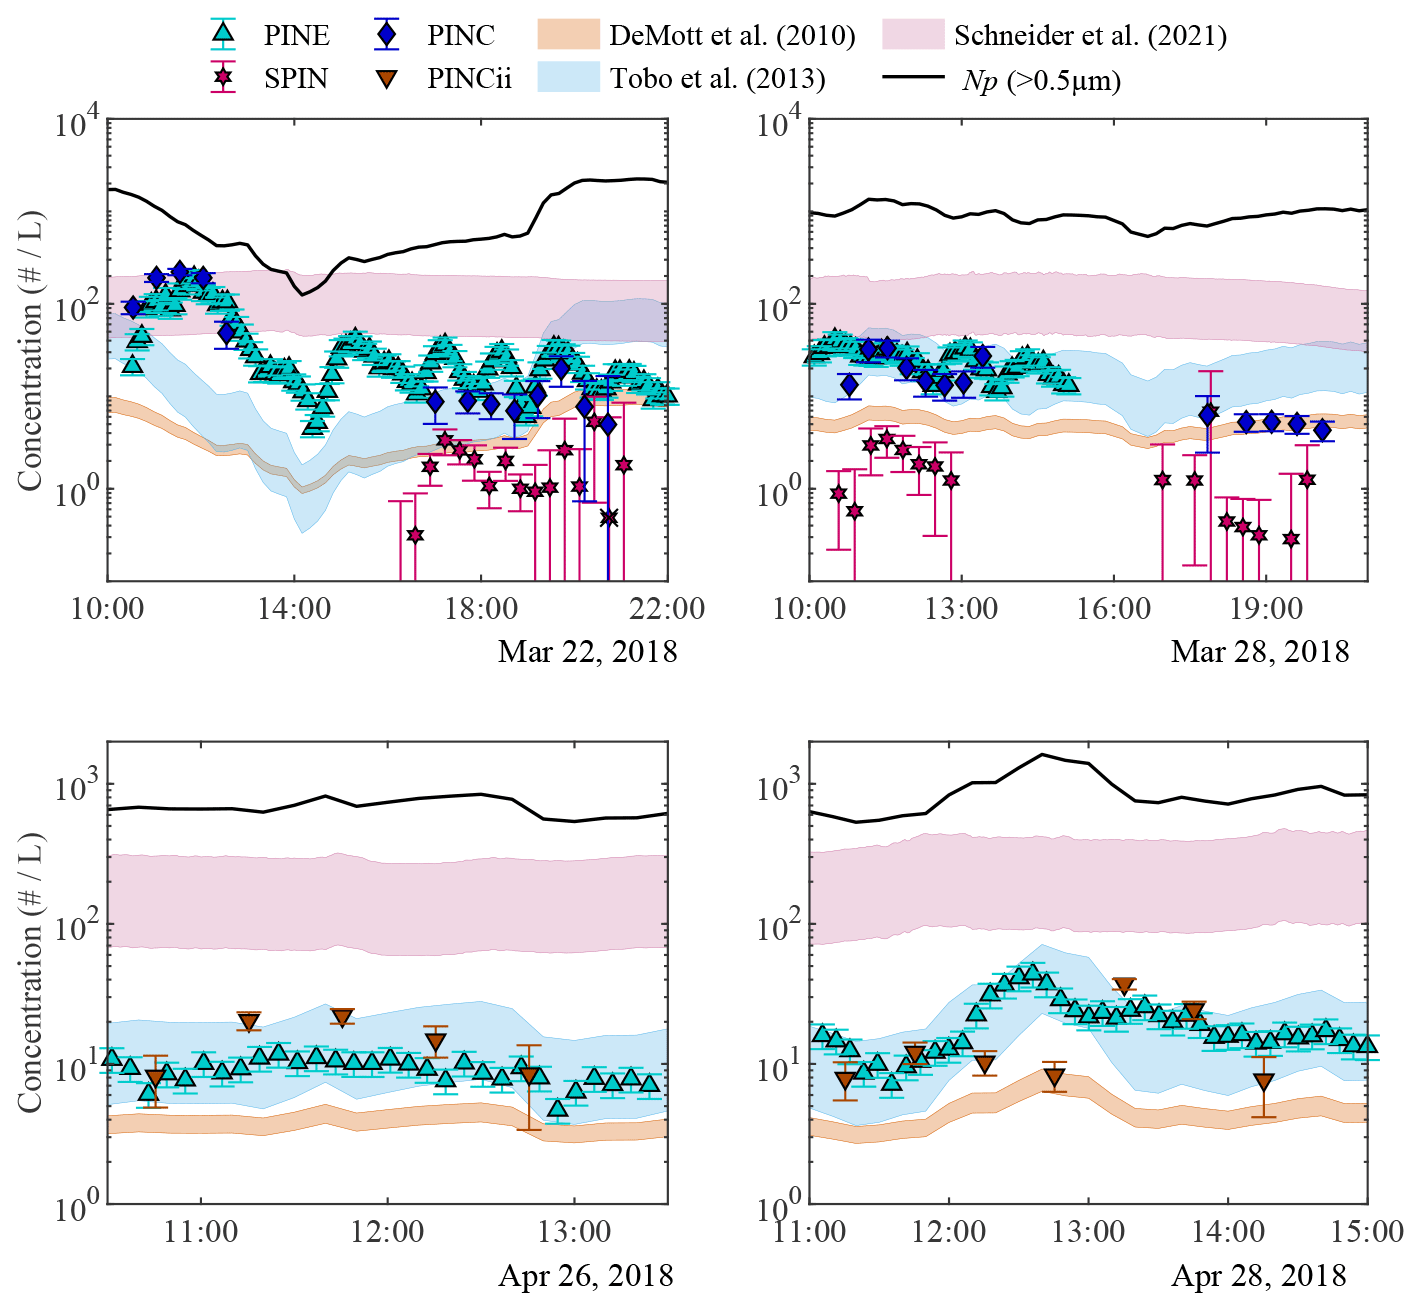
Figure 8INP concentrations measured between −29 to −32 ∘C for the online INP chambers SPIN, PINC and PINE on 22 and 28 March, and for PINE and PINCii on 26 and 28 April 2018. Aerosol number concentration, Np (>0.5 µm), is represented by the black solid line, and the shaded areas represent the three INP parameterizations from DeMott et al. (2010), Tobo et al. (2013) and Schneider et al. (2021). All parameterization envelopes represent a ∘C cloud temperature window. See Table 2 for more information concerning the thermodynamic conditions at which the chambers were running. Note that the single SPIN data point that includes a black cross on 22 March 2018 is deemed to be below the level of detection, defined as the average background signal plus 1 standard error of the mean.
As seen in Fig. 8, overall there is good agreement in the INP concentrations from the PINC and PINE chambers. The INP concentrations are within the same order of magnitude and generally follow the same trend. On 22 March between 17:00 and 19:00 (UTC+2) and on 28 March around 11:30 (UTC+2), the trends in the INP concentration are however opposite. This might be due to the fact that PINE was measuring with a much higher frequency than PINC, and it was therefore able to capture changes in INP concentrations that were not visible in the 30 min PINC data.
In comparison to the PINC and the PINE chambers, the SPIN chamber tends to measure INP concentrations that are lower by a factor of ≈10, despite the use of a concentrator. This systematic offset is likely partially due to instrumental differences. In the cases presented here, the PINC data are corrected by a uniform scaling factor of 1.14 determined from well-characterized particle losses and lamina spreading measured in the instrument (Paramonov et al., 2020a). Currently, no simple scaling factor is available for the SPIN during HyICE-2018; thus, no correction factor is used for the SPIN results. However, the biases in the ice-activated fraction from the SPIN chamber were discussed in Korhonen et al. (2020), when the chamber was used in a separate laboratory experiment. The study shows that at approximately −31 ∘C, the activated fraction is biased low by a factor of ≈3 due to lamina spreading and particle losses, which may partly explain why SPIN measures systematically lower INP concentrations than PINE and PINC during HyICE-2018.
Figure 8 also shows good agreement between the PINE and PINCii chambers, with INP concentrations measured within the same order of magnitude and overall similar trends throughout the days. The main deviation is observed on 28 April between 12:00 and 13:00 (UTC+2), where both chambers show opposite trends in the INP concentration. Although this deviation cannot be explained at this time, it is short-lived and only represents a few data points.
The aerosol number concentration for particles with an aerodynamic diameter between 0.5 and 20 µm (noted Np (>0.5 µm)) obtained from the SMEAR II APS is plotted for comparison (Fig. 8, solid black lines) and suggests a reasonably constant activated fraction throughout the inter-comparison days. On 22 March, the aerosol number concentration gradually decreases between 10:00 and 14:00 (UTC+2), and it is interesting to observe that such variability is reflected in both the PINE and PINC data.
In Fig. 8, we also present three parameterizations that predict INP concentrations for simple comparison purposes and to give context to our ambient measurements. The parameterization by DeMott et al. (2010) was developed by combining observations from nine different field studies, while the parameterization by Tobo et al. (2013) proposes a modified version focusing on fluorescent biological aerosol particles. Both parameterizations use the number concentration of aerosol particles with diameters larger than 0.5 µm and the cloud temperature. In the figures presented here, the DeMott et al. (2010) and Tobo et al. (2013) parameterizations were calculated using the aerosol number concentration obtained from the SMEAR II APS (Np (>0.5 µm)) and a cloud temperature window between −29 and −32 ∘C. The additional Schneider et al. (2021) parameterization presented in Fig. 8 has been developed from long-term observations conducted in Hyytiälä during and after the HyICE-2018 campaign, and it relies on both ambient air and cloud temperatures.
From the figure, the Tobo et al. (2013) parameterization shows the best agreement with the INP concentrations measured during the inter-comparison study. The DeMott et al. (2010) parameterization tends to underestimate the INP concentration measured by all the online chambers except for SPIN, whose uncorrected INP concentration is systematically lower than the concentration measured by the other chambers, as discussed previously. Furthermore, the Schneider et al. (2021) parameterization tends to overestimate the INP concentration measured and does not reflect the variability observed in the INP concentrations. The Schneider et al. (2021) parameterization relies on ambient air temperature, which was relatively constant over the inter-comparison days, and was developed to capture the seasonal variation of INP concentration with a time resolution of 1 to several days. Thus the longer time resolution inherent in the Schneider et al. (2021) parameterization might explain why it fails to reflect the daily variability observed in INP concentrations. Moreover, the parameterization was established using INP data with −23 ∘C minimum temperatures and was not tested for applications at lower temperatures; thus, deviations between the online measured and the calculated INP concentrations were to be expected. On the other hand, the DeMott et al. (2010) parameterization uses data from nine different campaigns conducted in various environments, sometimes well away from aerosol sources (e.g., in the Arctic), which might explain why it tends to underestimate the INP concentrations measured in the boreal forest of Hyytiälä. The good performance of the Tobo et al. (2013) parameterization might be related to the fact that the parameterization focuses on biological aerosol particles, which might represent an important proportion of the aerosol population in Hyytiälä (Fig. 6c).
Despite the reasonable agreement with the Tobo et al. (2013) parameterization, on 22 March none of the parameterizations successfully represents the measured concentrations. Before 13:00 (UTC+2) on 22 March, the INP concentrations are higher than the concentrations predicted by Tobo et al. (2013) and are more comparable to the Schneider et al. (2021) parameterization. In contrast, INP concentrations measured after 20:00 (UTC+2) on 22 March and after 17:00 (UTC+2) on 28 March decrease to below the Tobo et al. (2013) parameterization and are better represented by the DeMott et al. (2010) parameterization. Therefore, although the Tobo et al. (2013) parameterization performs better than the others, the INP concentrations measured during the 4 inter-comparison days seem to be influenced by factors other than those included in the parameterizations. Such an observation highlights the need for new and improved understanding to better represent the INP concentrations in boreal forest environments.
3.2.2 Offline instrument inter-comparison
Filter sampling for the droplet-freezing assay inter-comparison was conducted on 28 March and extended through the morning of 29 March. Figure 9a depicts the time periods during which sampling took place. Although the filters were not collected at the exact same time, efforts were made to coordinate the measurements, and two additional filters were collected at the main cottage as a complement to the filters collected on a daily basis. The INP temperature spectra of the collected filters are presented in Fig. 9b. Although the onset freezing temperatures of the µL-NIPI samples are 5 ∘C lower than for the INSEKT samples, the INP temperature spectra show substantial overlap between the two techniques. Moreover, although the inter-comparison period was relatively short and filters were collected over 24 h only, a reasonable temporal agreement is observed, and both techniques show lower INP concentrations for the filters that were collected during the night compared to the filters collected exclusively during the day. As reflected in Fig. 8, the aerosol number concentration varies slightly during the day, with a minimum of 500 L−1 around 16:00 (UTC+2). Although the variations remain within 1 order of magnitude, changes in the aerosol number concentration could explain the differences in the INP concentration measured between the day and night filters.
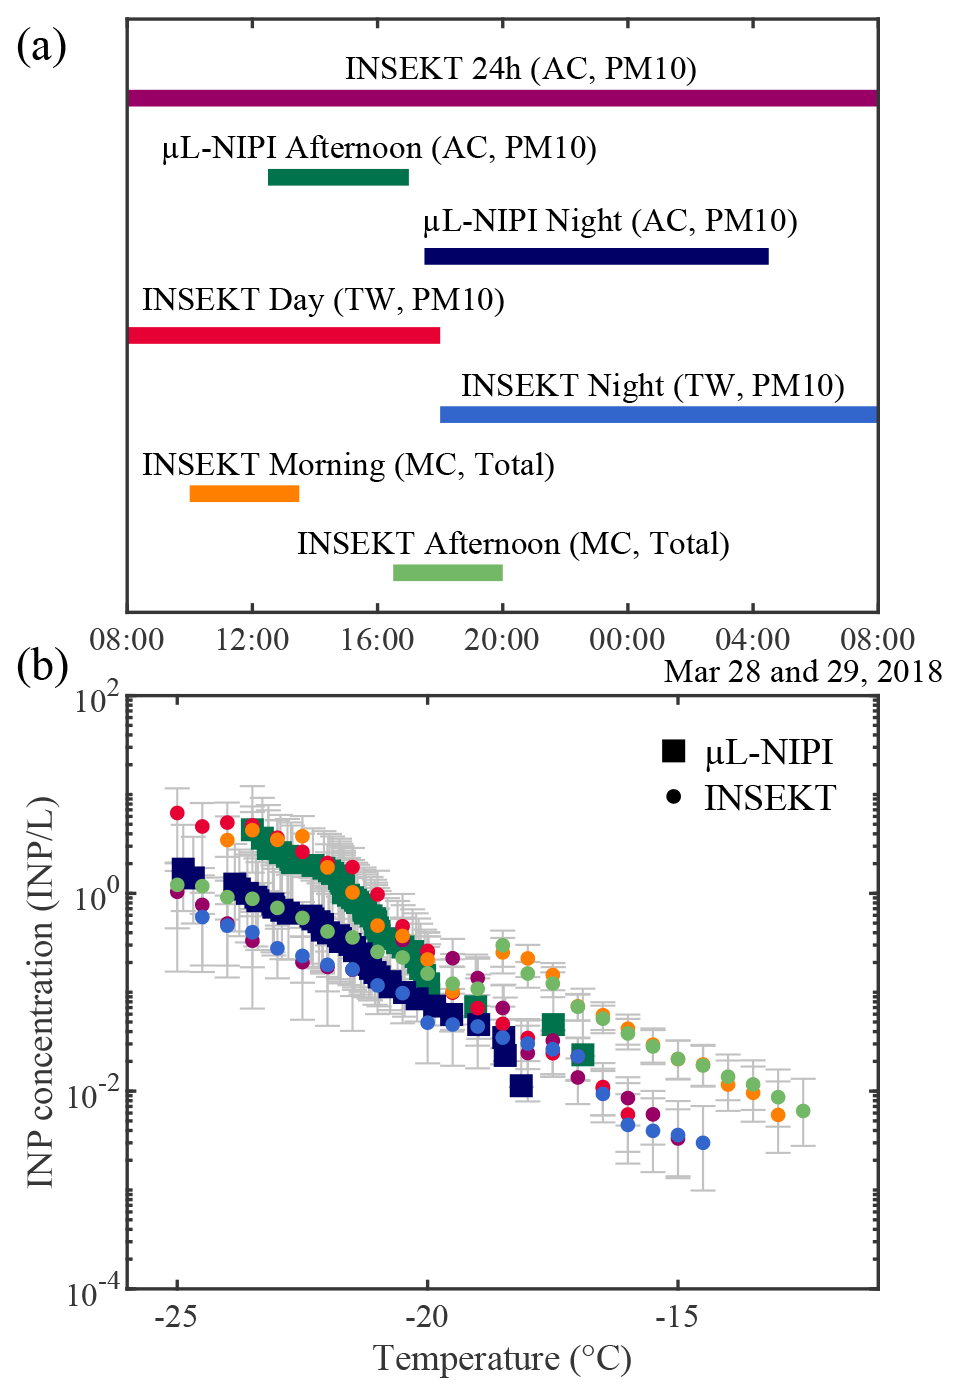
Figure 9(a) Timeline of the filter sampling carried out on 28 March 2018. The droplet-freezing assays used for the INP analysis (INSEKT; µL-NIPI), the sampling locations (MC = main cottage; AC = aerosol cottage; TW = tower) and the inlets used during sampling (Total, PM10) are indicated. The colored bars indicate the various sampling time windows and correspond to the colors used in the INP temperature spectra presented in the bottom panel and in Fig. 11. (b) INP temperature spectra measured for each filter collected on 28 March 2018. For the INSEKT data, the error bars represent the statistical as well as the systematic error of the INSEKT assay. More details related to the calculation of these error bars is given in Schneider et al. (2021). For the µL-NIPI data, the error bars were calculated using the Poisson Monte Carlo procedure as described in Harrison et al. (2016).
It should be noted that dilutions were used to extend the INSEKT detection range to lower temperatures. For the INSEKT measurements presented in Fig. 9, the data points between −12 and −18 ∘C are derived by investigation of the non-diluted aerosol suspension, while the data points at lower temperatures correspond to a suspension that was diluted by a factor of 10. The discontinuous drop observed between the series of data points of both the “INSEKT Morning” and the “INSEKT Afternoon” filters occurs at the dilution step and is nonphysical. It might be a consequence of the shorter sampling period used for these two filters (Fig. 9) or of inhomogeneity in the suspension caused by particle settling (Harrison et al., 2018). All data points are presented here as measured, and consistent overlap, certainly within the uncertainty envelopes, is observed for the INP concentrations that are uniformly increasing with decreasing temperature.
In Fig. 10, the INSEKT and µL-NIPI methods are directly compared. To quantify the agreement between the two methods, the concordance correlation coefficient (CCC) is calculated following the method developed by Lin (1989). Reasonable agreement is observed for the full measurement set, with a CCC of 0.81 (Fig. 10a). The data obtained during the day (Fig. 10b) show the best agreement (CCC = 0.96), while the data obtained during the night (Fig. 10d) show less agreement (CCC = 0.53). The main deviation in the agreement between the two methods is shown in Fig. 10c (CCC = 0.26), which is expected due to a shorter temporal overlap in the sample collection for these two filters. Indeed, the filter for µL-NIPI was collected from 12:20 to 17:00 (UTC+2), while the filter for INSEKT was collected from 16:30 to 20:00 (UTC+2), representing only 30 min of overlap between the measurements. Such short temporal overlap, together with the variations in the aerosol number concentration, could explain the deviation in the INP concentrations measured by the two methods.
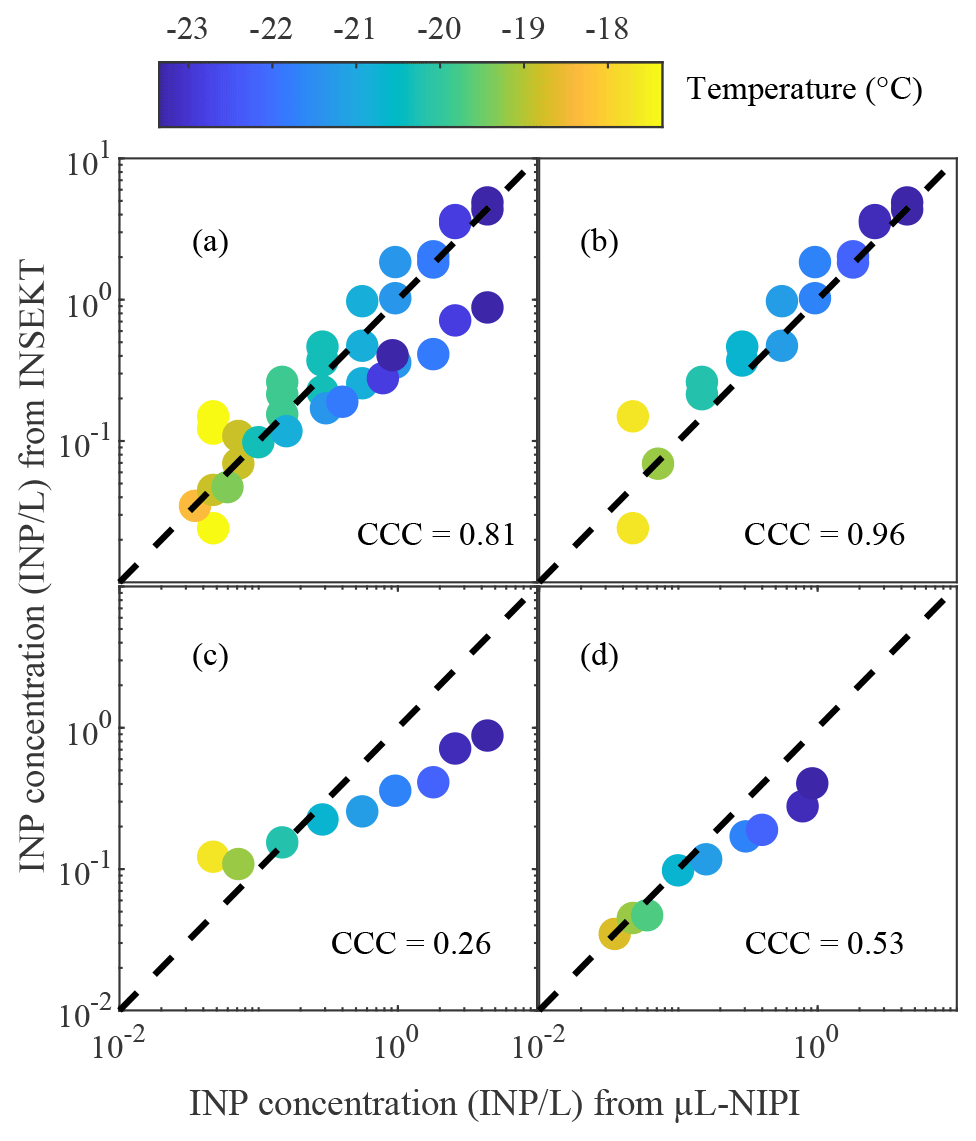
Figure 10INP concentration measurements from INSEKT and µL-NIPI compared to one another for 28 March. Point color represents the ice nucleation temperature. The panels include (a) the full measurement set, (b) INSEKT day and morning (red and orange bars in Fig. 9) versus µL-NIPI afternoon measurements (dark green in Fig. 9), (c) INSEKT afternoon (light green in Fig. 9) versus µL-NIPI afternoon measurements (dark green in Fig. 9) and (d) INSEKT night (dark blue in Fig. 9) versus µL-NIPI night measurements (light blue in Fig. 9). In each case the dashed line represents the 1:1 line, and the concordance correlation coefficient (CCC) is indicated.
3.2.3 Inter-comparison summary
In Fig. 11, the measurements from all INP instruments sampling on 28 March 2018 are presented in the form of INP temperature spectra. The data points from the online INP measurement systems SPIN, PINC and PINE were obtained by averaging the measured INP concentrations over the entire day, and the error bars now represent the standard deviation of the processed data shown in Fig. 8. The selected INP parameterizations are also depicted in the figure, where the shaded regions represent the average aerosol number concentration Np (>0.5 µm) ±1 standard deviation for the DeMott et al. (2010) and Tobo et al. (2013) parameterizations, and the average air temperature standard deviation for the Schneider et al. (2021) parameterization. For each parameterization, the average and standard deviation were calculated between 08:00 (UTC+2) on 28 March and 08:00 (UTC+2) on 29 March 2018.
As expected, in this context the Schneider et al. (2021) parameterization performs better at warmer temperatures (between −12 and −25 ∘C), temperatures for which the parameterization was established. However, it overestimates the INP concentrations measured at colder temperatures by approximately 1 order of magnitude, and only 19 % of the data points fall within its shaded region (Fig. 11). The Tobo et al. (2013) parameterization, on the other hand, is able to reproduce more of the ambient data, with 35 % of the data points within its shaded region. Moreover, although it fails to predict the lowest concentrations obtained from the offline methods, its trend agrees best with both online and offline INP measurements. Conversely, the DeMott et al. (2010) parameterization only reproduces 3 % of the data points and does not capture the ice nucleation behavior observed by the droplet-freezing assays at warmer temperatures. However, the DeMott et al. (2010) parameterization is based on various measurements conducted in very different environments, sometimes well away from aerosol sources; thus, bias can be expected. The performance of the various parameterizations highlights the need to critically assess the validity range(s) of such empirical parameterizations, especially when they are suggested for utilization in predictive models.
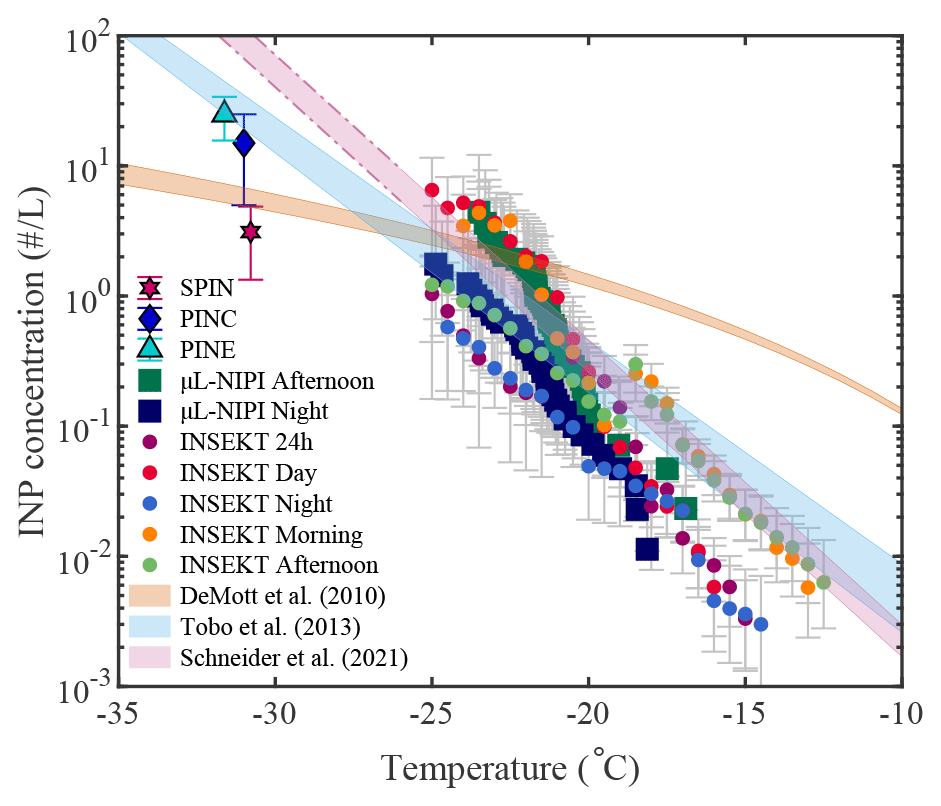
Figure 11INP temperature spectra from all the instruments running on 28 March. Error bars assigned to online measurement techniques represent the standard deviation of the processed data shown in Fig. 8. The DeMott et al. (2010), Tobo et al. (2013) and Schneider et al. (2021) parameterizations are replotted with the envelopes now indicative of the average Np (>0.5 µm) ±1 standard deviation for DeMott et al. (2010) and Tobo et al. (2013), as well as the average air temperature standard deviation for the Schneider parameterization.
In this measurement report we introduced the HyICE-2018 campaign conducted at the SMEAR II research station in the boreal forest of Hyytiälä, Finland. The campaign took place from February to June 2018 and utilized the infrastructure of the SMEAR II station with additional instrumentation focusing on INP measurements. The main objectives of the campaign were to
- •
quantify and characterize INPs in a boreal environment within different thermodynamic conditions,
- •
examine the seasonal variability of the INP concentrations,
- •
study the vertical distribution of INPs above the boreal forest.
Several days during the campaign were selected to intercompare INP measurement systems in a field setting. The instrumentation included three CFDCs (PINC, PINCii and SPIN) and one expansion chamber (PINE) for online measurements of INPs and two droplet-freezing assays (INSEKT and µL-NIPI) for offline analysis of INPs collected on filters. Results from the online measurements show that, despite the differences in setups and measurement settings, there is good agreement between the PINC and PINE chambers and between the PINE and PINCii chambers. The chambers detect INP concentration in the same order of magnitude and show similar trends throughout the inter-comparison days. The SPIN chamber tends to measure lower concentrations than the other chambers, likely in part due to instrumental biases.
Results from the offline measurements show reasonable agreement between the two droplet-freezing assays INSEKT and µL-NIPI, with an overall concordance correlation coefficient of 0.81. A 5 ∘C deviation in the onset freezing temperature is, however, observed between the instruments, and results from the direct comparison of the obtained INP concentrations illustrate the importance of longer sampling durations and longer temporal overlap to improve agreement.
The measurements from the inter-comparison days were compared to three existing parameterizations. Although the comparison is based on limited data and thus might not be representative of the entire HyICE-2018 campaign, results show that the DeMott et al. (2010) parameterization tends to underestimate the INP concentrations observed by the online INP chambers for temperatures between −29 and −32 ∘C, and it does not capture the ice nucleation behavior observed by the droplet-freezing assays at warmer temperatures between −20 and −12 ∘C. The Schneider et al. (2021) parameterization shows better agreement with the INP temperature spectra obtained from the droplet-freezing assays, but it tends to overestimate the INP concentrations measured by the online chambers between −29 and −32 ∘C. The parameterization does not capture the daily variability observed in the INP concentration, but such a result is not surprising since the parameterization was developed to predict seasonal variation of INP concentrations with a time resolution of 1 to several days. Finally, the parameterization by Tobo et al. (2013) shows the best agreement with the measured INP concentrations from both online and offline INP measurement techniques, which is attributed to the fact that it is focused on biological aerosol particles which might represent an important proportion of the aerosol population in the boreal forest of Hyytiälä. The parameterization was developed from measurements conducted in a mid-latitude ponderosa pine forest ecosystem in Colorado, USA, and it is interesting to see that its results are consistent with some of the measurements obtained during the HyICE-2018 campaign. Although more analyses would be required for a systematic comparison of parameterizations with the INP concentrations measured during HyICE-2018, the results suggest that the sources of INPs in the boreal forest might be comparable to those in a North American forest. On the other hand, despite the good agreement with the Tobo et al. (2013) parameterization, there is 1 measurement day of inter-comparison when none of the parameterizations successfully represent the measured concentrations. This suggests that, on that day, the INP concentration might be influenced by factors that are not included in the parameterizations used here and that continuous efforts are required to improve parameterizations to better represent the INP concentrations from boreal forest environments.
Although not all the highlighted objectives were addressed in this paper, a number of results from the campaign will be or have already been presented in separate contributions to the Copernicus special issue “Ice nucleation in the boreal atmosphere”. The special issue already includes an examination of the PINC data accumulated during winter 2018, which showed that no persistent local sources of INPs could be identified and postulated that the INPs detected were the result of long-range transport and dilution of INPs with sources far from the measurement site (Paramonov et al., 2020a). In another study, Schneider et al. (2021) present a more than 1-year record of INP concentrations measured with INSEKT that shows a clear seasonal cycle of INP concentrations and INP types, most likely driven by the abundance of boreal biogenic aerosol. Forthcoming studies will explore atmospheric vertical profiles of INPs, INP sources and transport modeling, plausible links between INP abundance and NPF, and the ice nucleation activity of boreal biology such as flora and fungi; they will also utilize the full suite of available measurements and applied machine learning techniques in an effort to illuminate non-obvious INP processes and feedbacks (Wu et al., 2021).
Table A1Part 1: overview of the SMEAR II instrumentation running throughout the HyICE-2018 campaign.
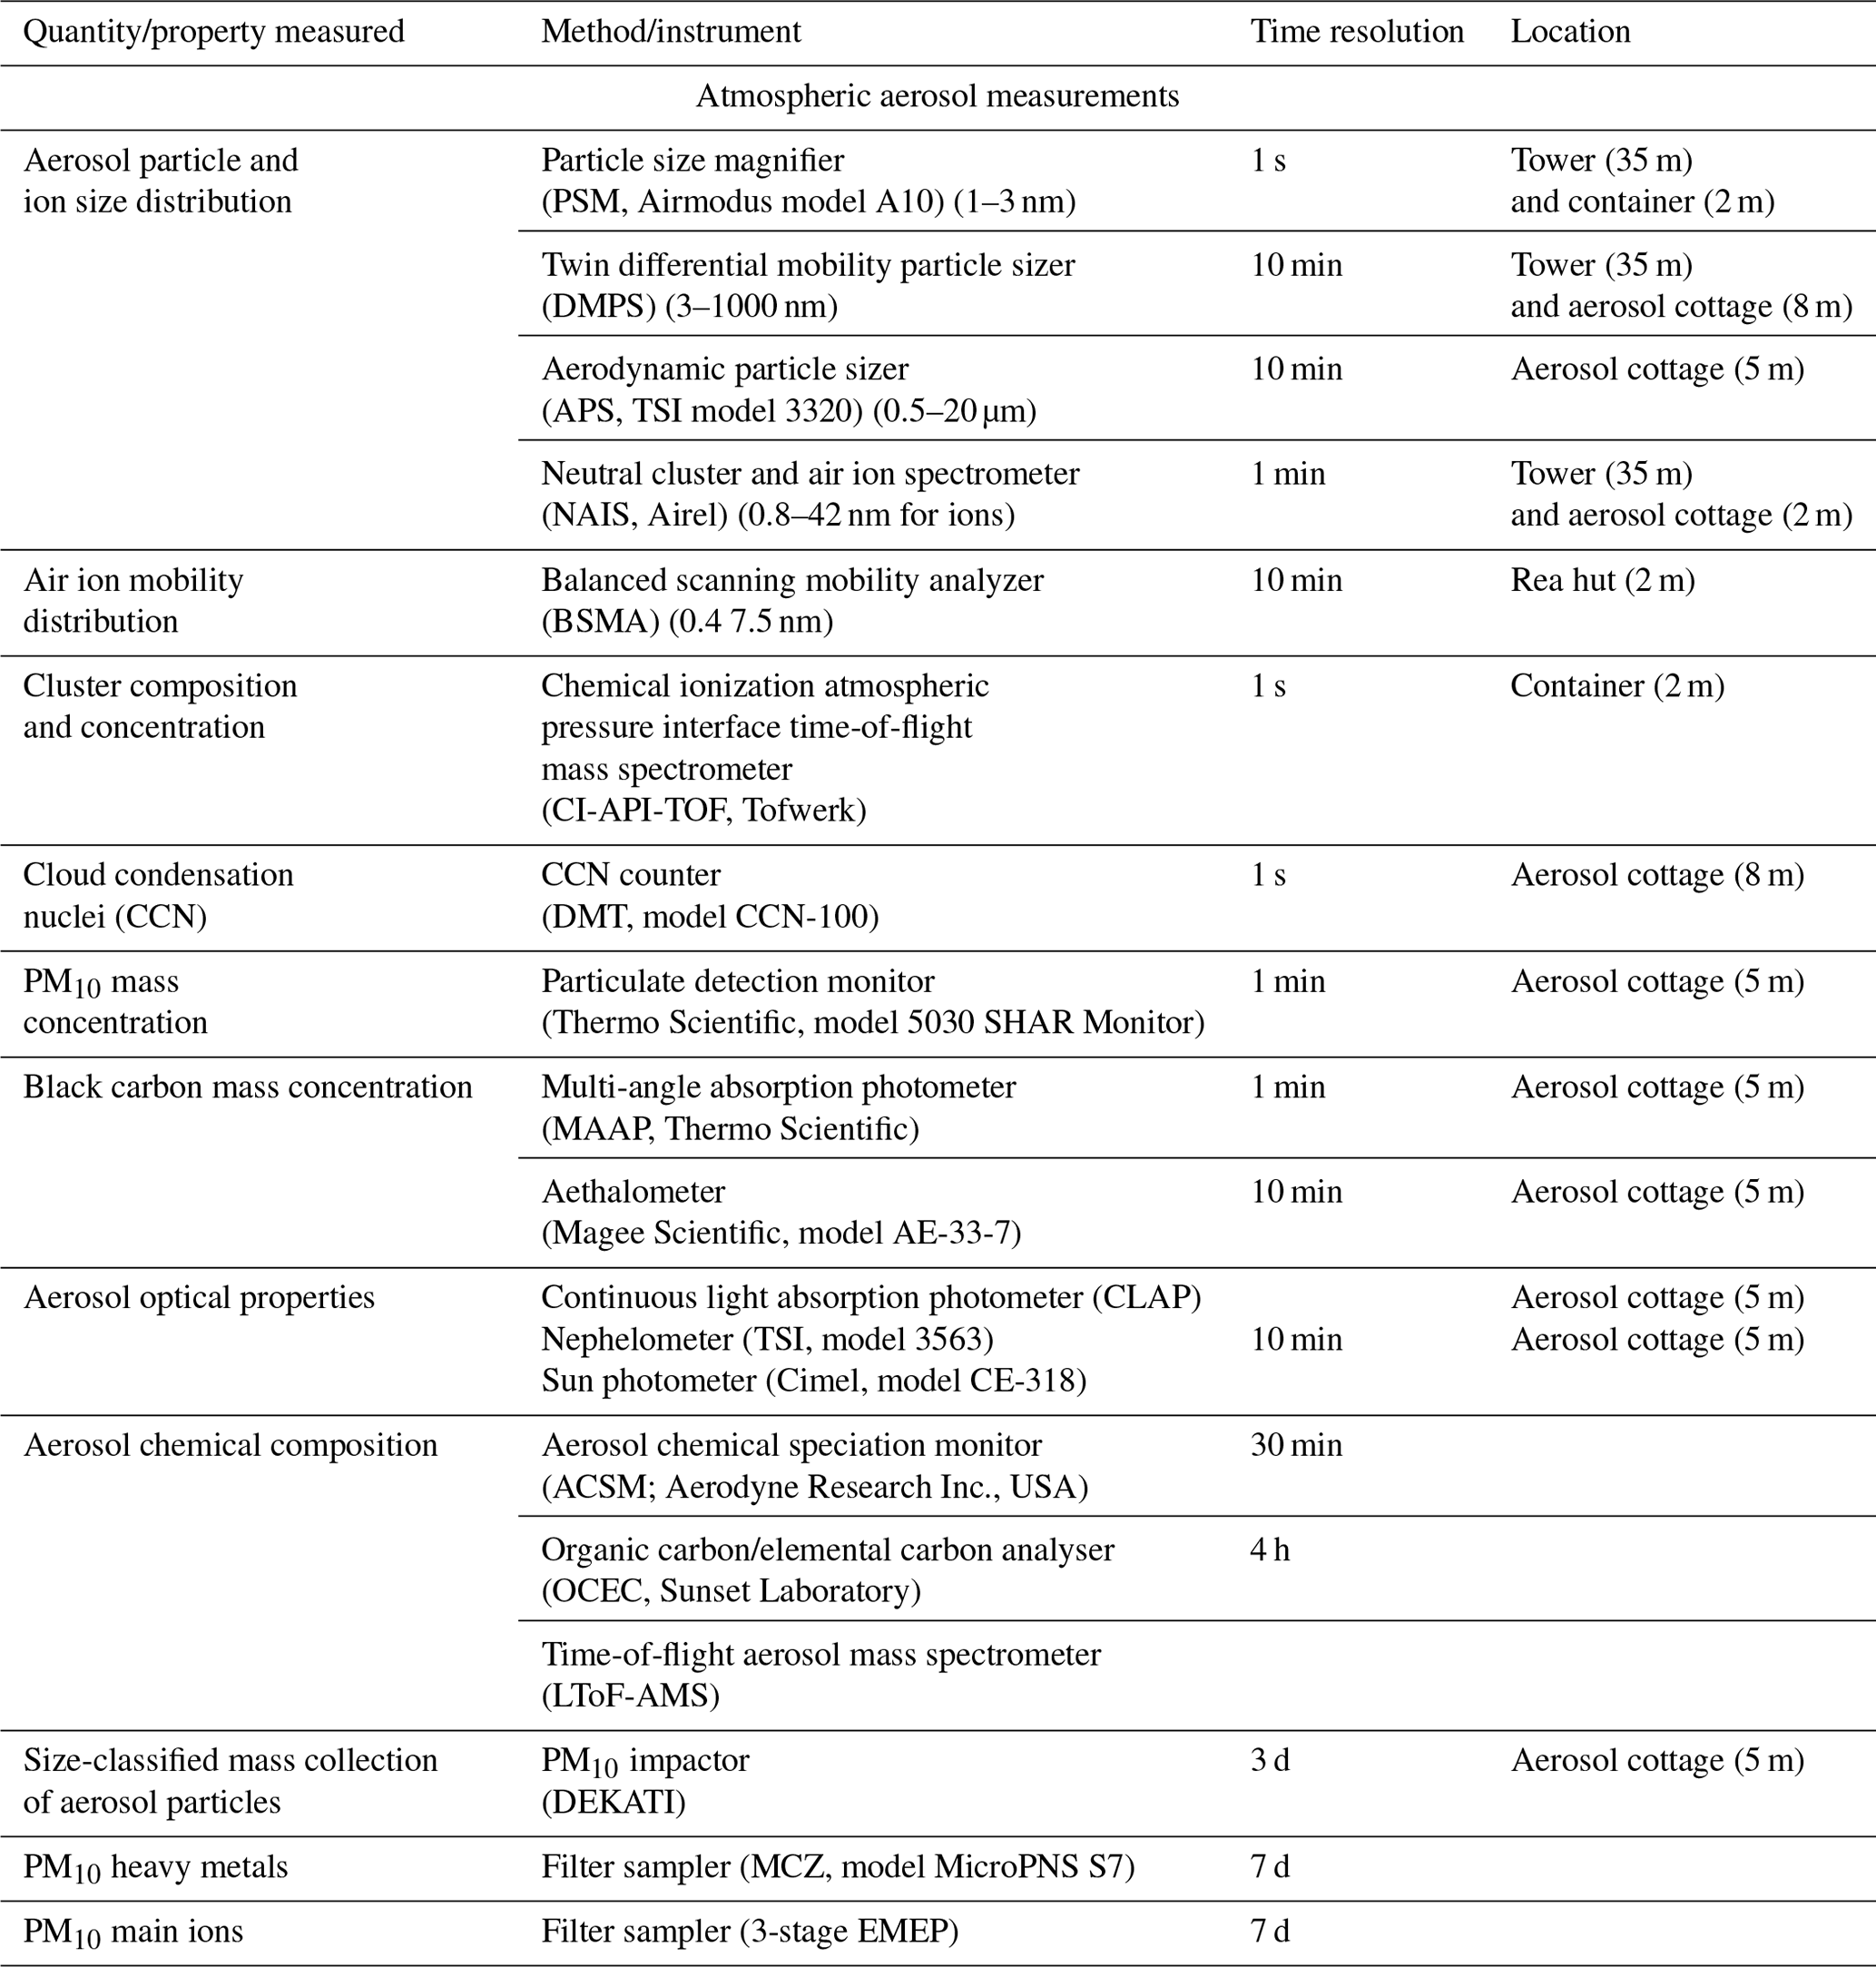
Table A2Part 2: overview of the SMEAR II instrumentation running throughout the HyICE-2018 campaign.
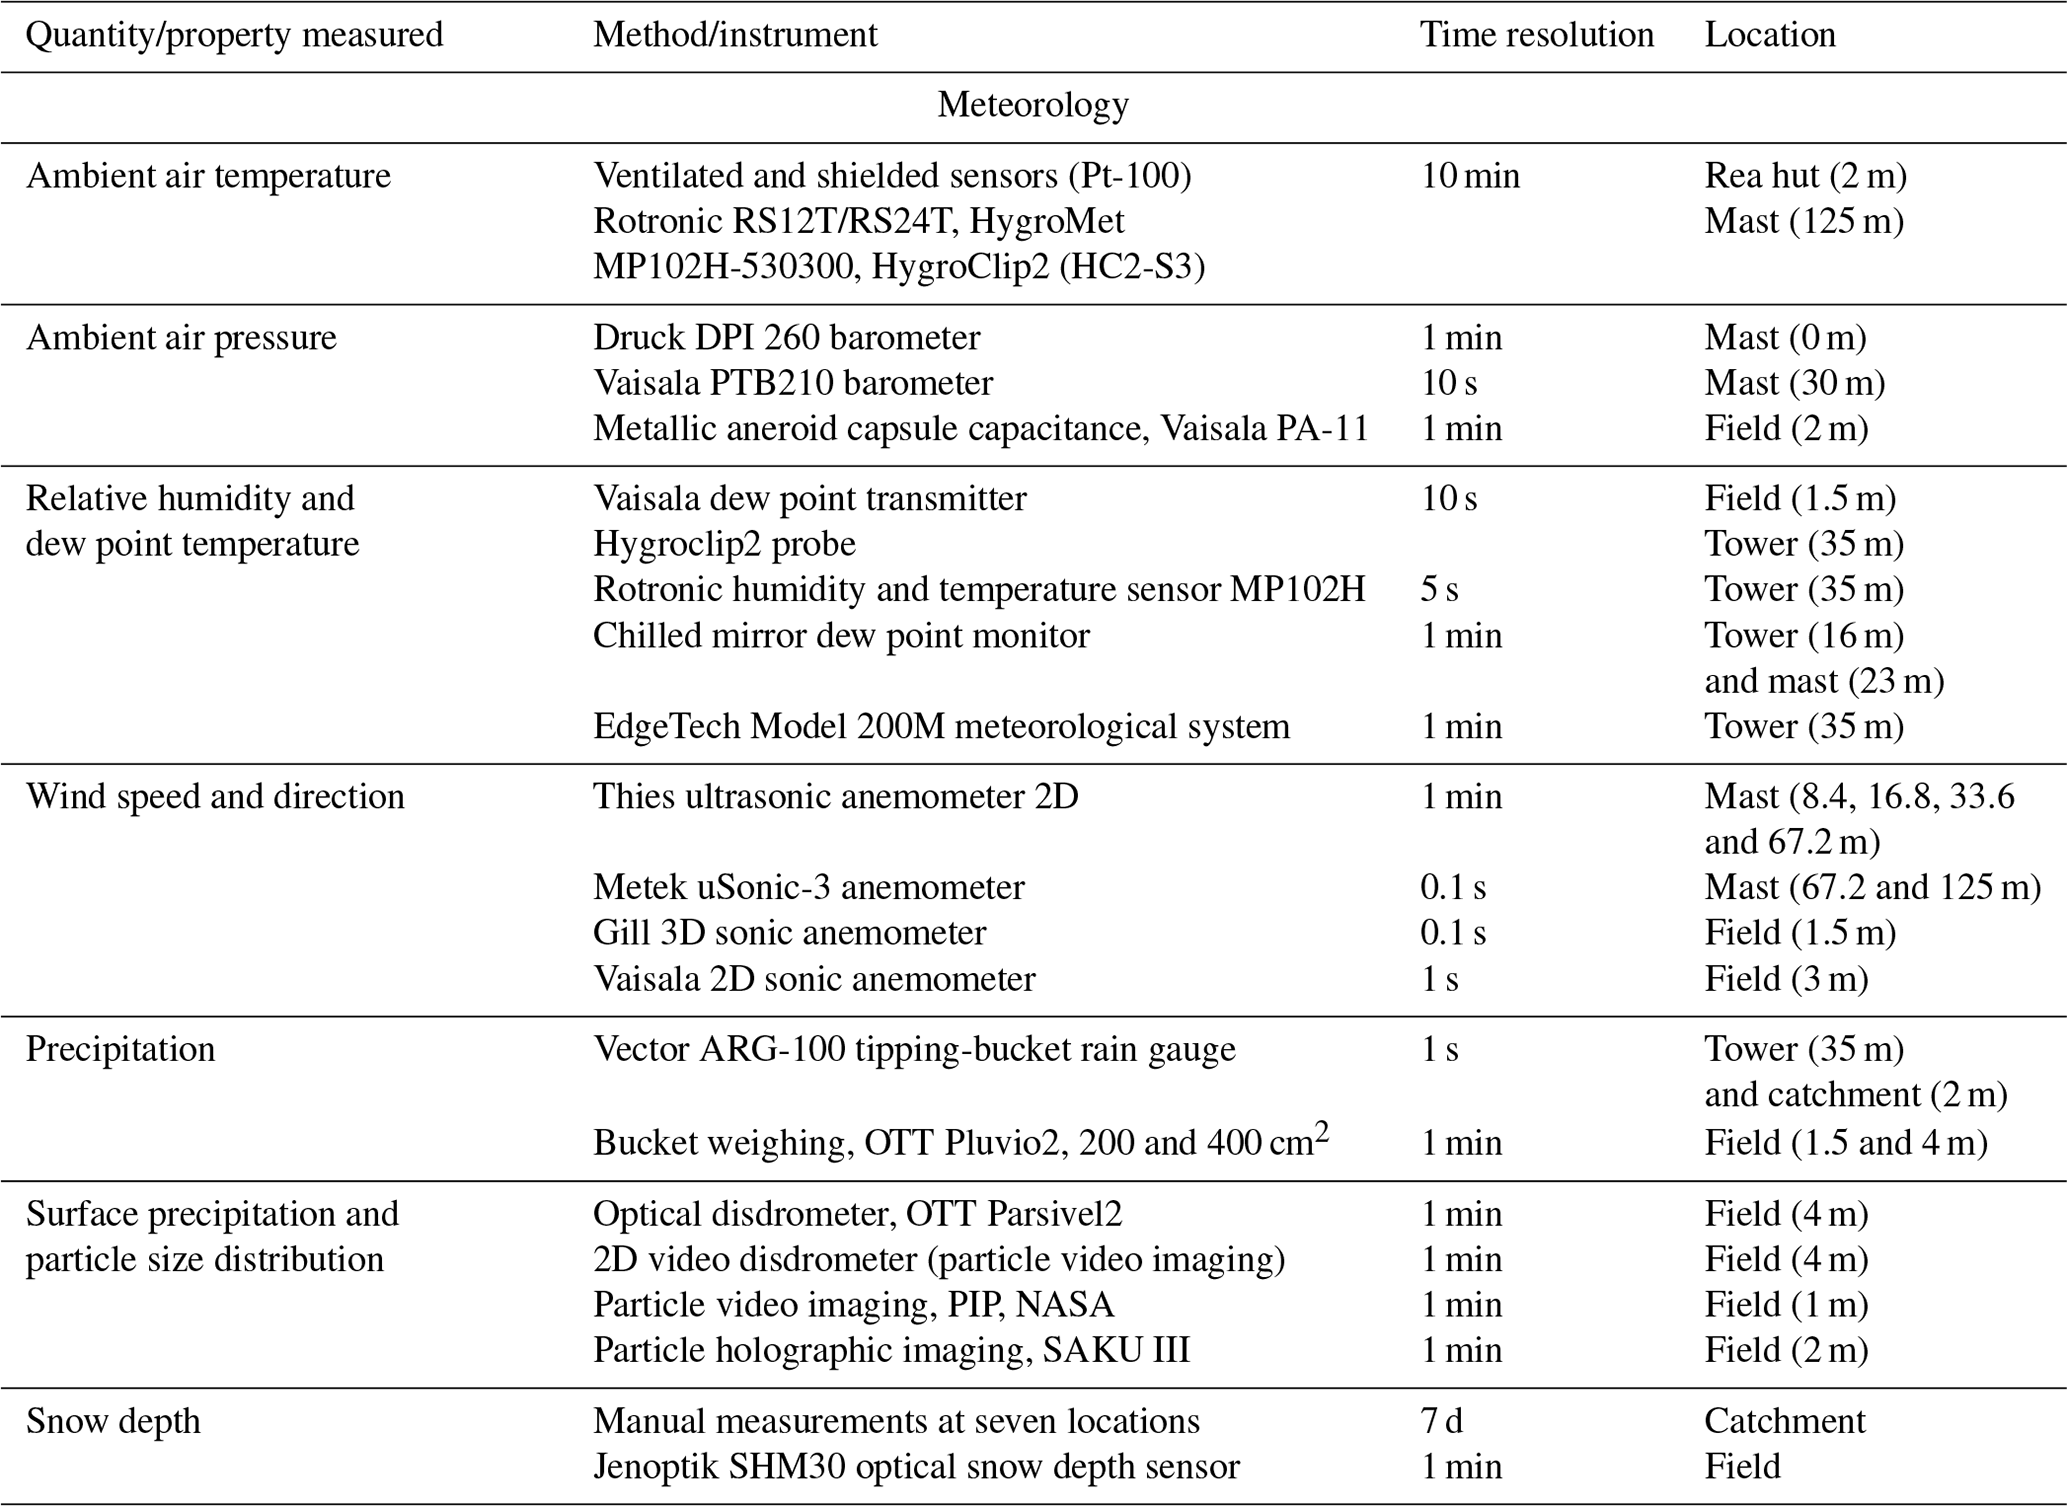
Table A3Part 3: overview of the SMEAR II instrumentation running throughout the HyICE-2018 campaign.
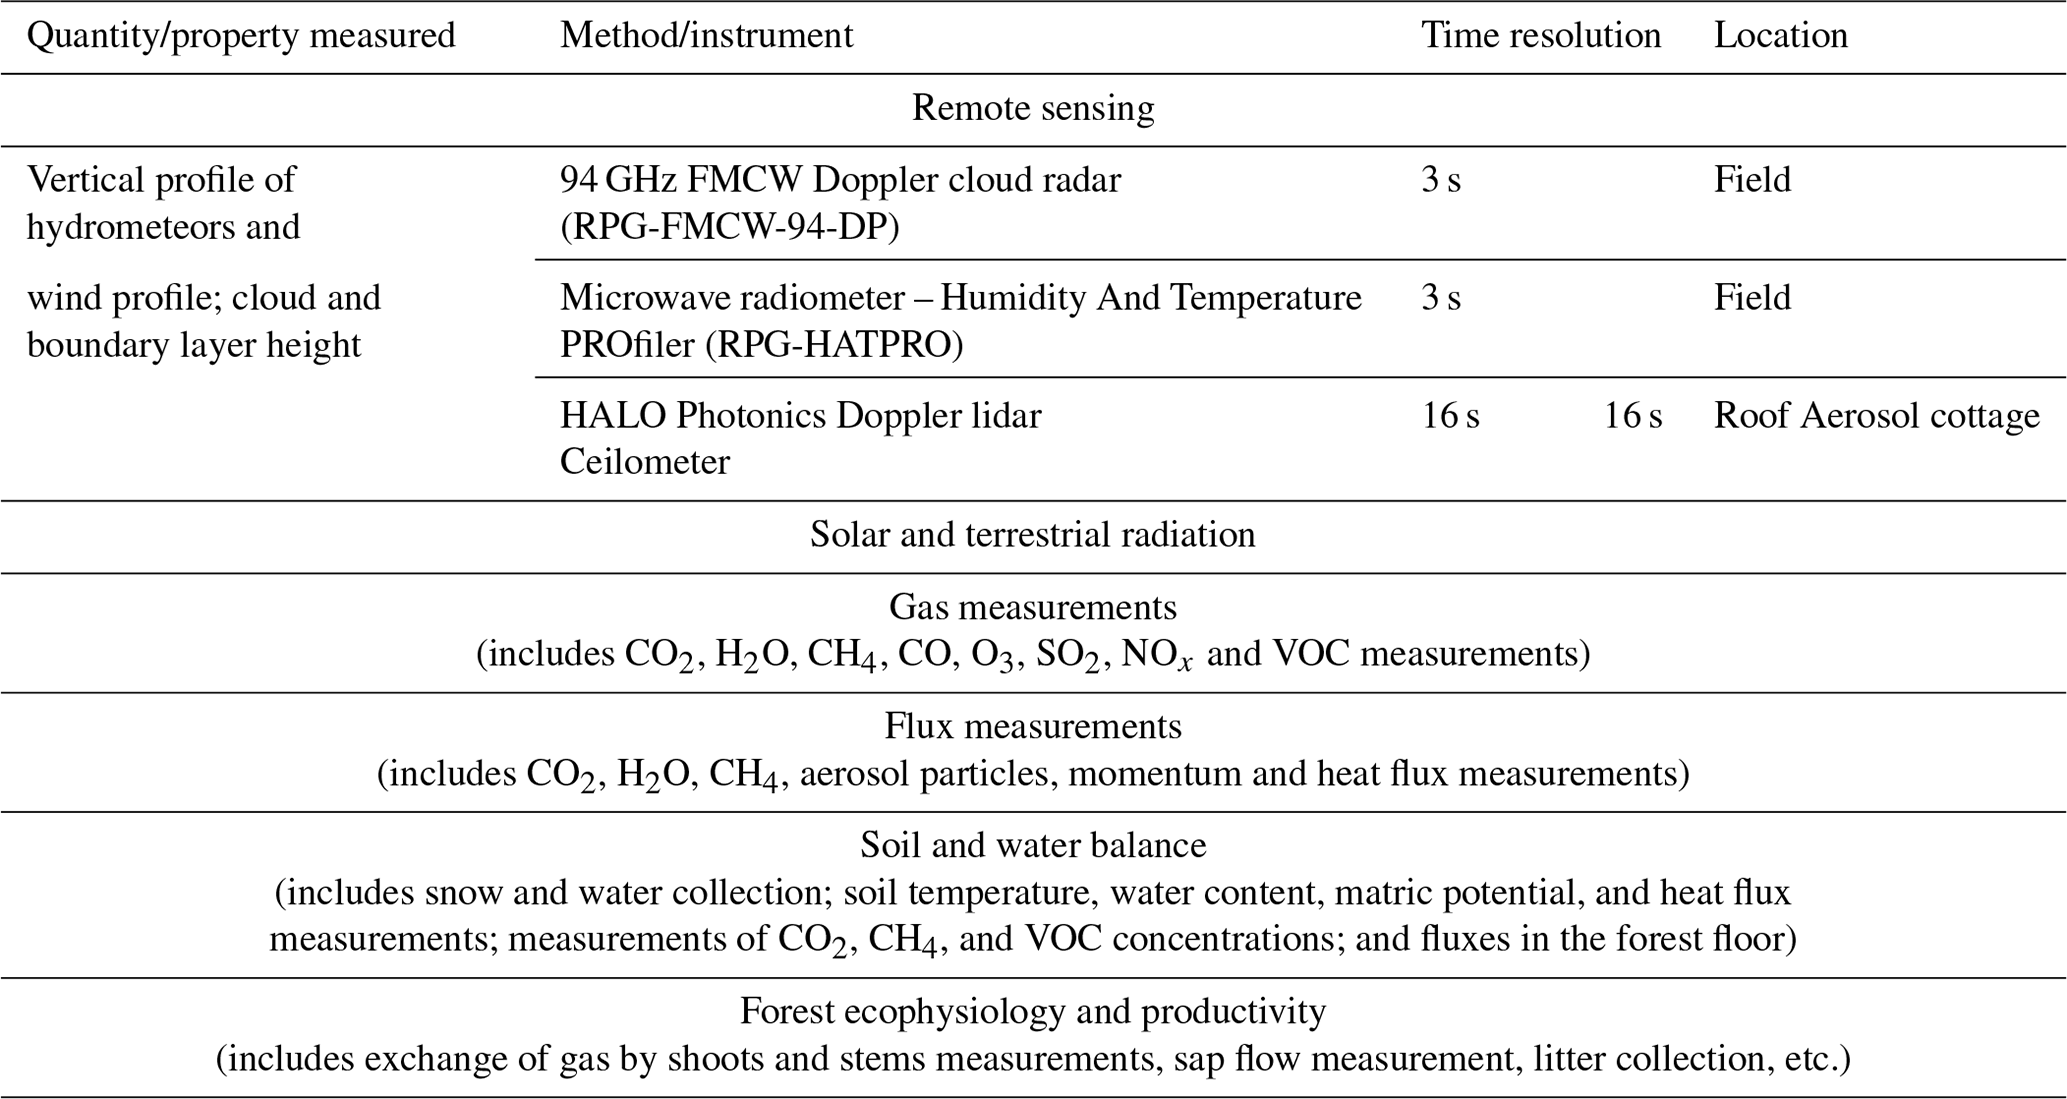

Figure A1Measured magnification factor for the virtual impactor (VI)-type concentrator used with SPIN during the HyICE-2018 campaign. Flow rates of 20 and 2 L min−1 were used for the sheath flow and sample flow, respectively.

Figure A2Transmission efficiency as a function of particle size for the sampling system upstream of PINE. The measurements were made with an OPC (MetOne, GT 526S) with an accuracy of ±10 %.
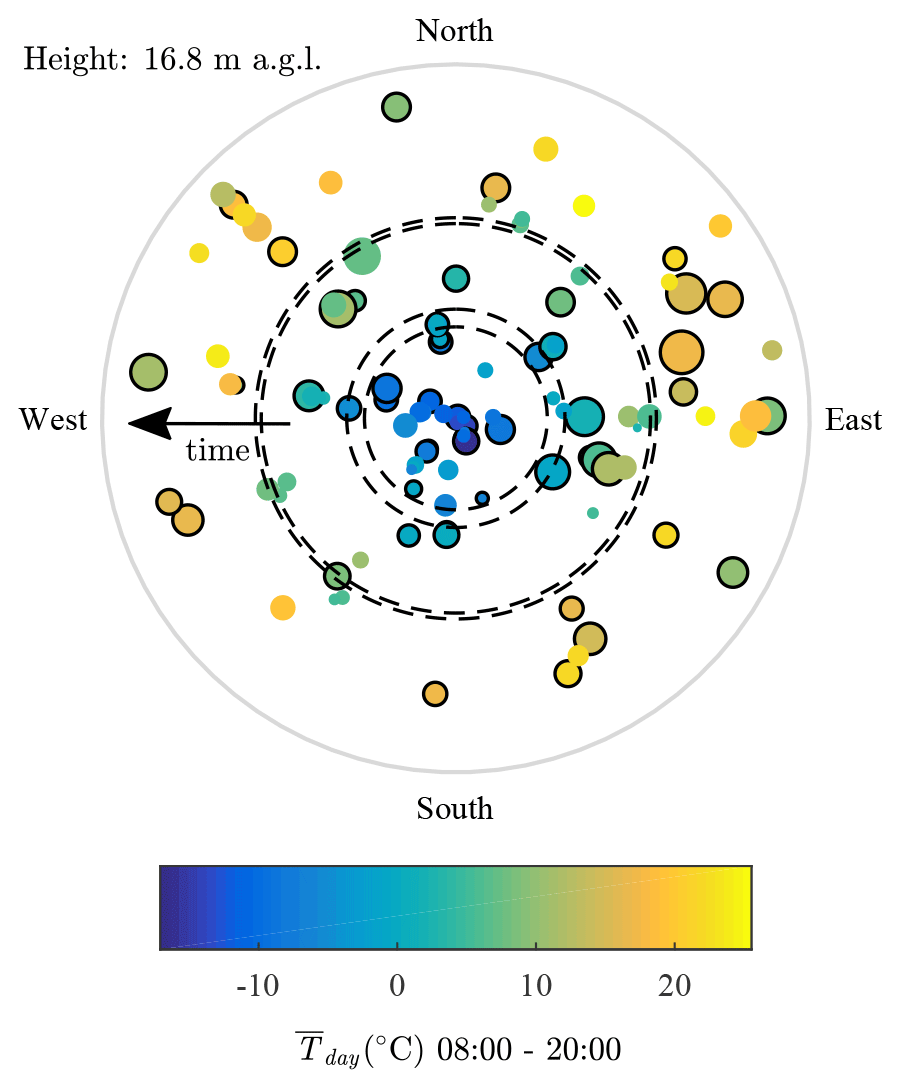
Figure A3Wind rose illustrating multiple aerosol features, including relative average particle concentration (calculated from the SMEAR II DMPS and APS concentrations) and NPF events, as a function of air temperature, wind direction and time at 16.8 m above ground level on the mast.

Figure A4Wind rose illustrating multiple aerosol features, including relative average particle concentration (calculated from the SMEAR II DMPS and APS concentrations) and NPF events, as a function of air temperature, wind direction and time at 33.6 m above ground level on the mast.
The aerosol, trace gas and meteorological data are available at the SmartSMEAR data repository (https://avaa.tdata.fi/web/smart; Junninen et al., 2009). Contact with the original data contributors can be requested from atm-data@helsinki.fi. The INP data presented in this study are available at https://doi.org/10.5281/zenodo.5141574 (Brasseur et al., 2021). Other data are available upon request from the corresponding authors. The data discussed and presented from PINC are also included in Paramonov et al. (2020b) and are available at https://doi.org/10.3929/ethz-b-000397022.
OM, MK, TP, JD and DM initiated and planned the HyICE-2018 campaign. ZB and JD largely coordinated and oversaw the campaign on the ground with the help of the permanent SMEAR II staff. ZB, DC, MPA, SDvD, PH, KK, JLa, MiP, JuS, FV, YW, NSA, BB, DB, MID, ADH, PH, KH, LL, ML, AM, MaP, GCEP, PP, UP, TS and NSU conducted measurements during the HyICE-2018 campaign. ZB, DC, MPA, PH, KK, MiP, JuS and (JáS). FV and YW performed the data analysis of their respective instruments and took part in interpretation of the results. JPDA and EG provided the PFPC, and EG set up the instrument at the station. EST, JPDA, DHB, ZAK, JK, AV, MK, BJM, TP, OM and JD participated as supervisors of the HyICE-2018 campaign. ZB and EST wrote the article and with the help of DC constructed the figures. MB helped with writing and revising the article. All authors reviewed the article and contributed to the review response.
The contact author has declared that neither they nor their co-authors have any competing interests.
Publisher’s note: Copernicus Publications remains neutral with regard to jurisdictional claims in published maps and institutional affiliations.
This article is part of the special issue “Ice nucleation in the boreal atmosphere”. It is not associated with a conference.
The authors would like to gratefully acknowledge Janne Levula, Matti Loponen, Heikki Laakso, Turo Salminen and the rest of the technical staff of the Hyytiälä Forestry Field Station for their expertise, hard work and willingness to help throughout the HyICE-2018 campaign. Erkki Järvinen and the pilots at Air Spark Oy are acknowledged for operating the research airplane. Simo Hakala is acknowledged for his help with the new particle formation event classification. Hanna Danielsson is acknowledged for her significant help with creating Fig. 1.
This project received funding from the European Union's Horizon 2020 research and innovation program under grand agreement nos. 654109 and 739530 and TransNational Access via ACTRIS-2 HyICE-2018 TNA project. The work of the University of Helsinki was supported by the Academy of Finland Centre of Excellence in Atmospheric Science (grant no. 307331) and NANOBIOMASS (307537), ACTRIS-Finland (328616), ACTRISCF (329274) and Arctic Community Resilience to Boreal Environmental change: Assessing risks from fire and disease (ACRoBEAR, 334792) Belmont Forum project. In addition, the work of the University of Helsinki was financially supported by the European Commission through ACTRIS2 (654109) and ACTRIS-IMP (871115) and ACTRIS2 TransNational Access and through integrative and Comprehensive Understanding on Polar Environments (iCUPE, 689443), ERA-NET-Cofund and by the University of Helsinki (ACTRIS-HY). The work of the KIT Institute for Meteorology and Climate Research (IMK-AAF) was supported through the Research Program “Atmosphere and Climate (ATMO)” of the Helmholtz Association and by the KIT Technology Transfer Project PINE (N059). EST and DC have been supported by the Swedish Research Councils, VR (2013-05153, 2020-03497) and FORMAS (2017-00564), and the Swedish Strategic Research Area MERGE. BJM and MPA acknowledge the European Research Council, ERC, MarineIce 648661, for funding. PH and JK acknowledge the funding from the Arctic Academy program “ARKTIKO” of the Academy of Finland under grant no. 286558, and PH acknowledges support from the Maj and Tor Nessling Foundation. NSU acknowledges the support of the Alexander von Humboldt Foundation, Germany (1188375). MP, SDvD and ZAK acknowledge the funding from the European Union's Horizon 2020 research and innovation program (under the Marie Skłodowska-Curie grant agreement no. 751470, “ATM-METFIN” and grant agreement no. 654109) and the European Union Seventh Framework Programme (FP7/2007–2013; grant agreement no. 262254). EG and JPDA acknowledge the support from the NSERC (grant no. RGPIN-2017-05972), and EG acknowledges support from the University of Toronto Centre for Global Change Science Graduate Student Research Award. NSA and DHB acknowledge the funding from the Academy of Finland under the Postdoctoral Researcher Grant 309570 to NSA.
Open-access funding was provided by the Helsinki University Library.
This paper was edited by Yafang Cheng and reviewed by two anonymous referees.
Aalto, P., Hämeri, K., Becker, E., Weber, R., Salm, J., Mäkelä, J. M., Hoell, C., O’dowd, C. D., Hansson, H.-C., Väkevä, M., et al.: Physical characterization of aerosol particles during nucleation events, Tellus B, 53, 344–358, https://doi.org/10.3402/tellusb.v53i4.17127, 2001. a
Adams, M. P., Atanasova, N. S., Sofieva, S., Ravantti, J., Heikkinen, A., Brasseur, Z., Duplissy, J., Bamford, D. H., and Murray, B. J.: Ice nucleation by viruses and their potential for cloud glaciation, Biogeosciences, 18, 4431–4444, https://doi.org/10.5194/bg-18-4431-2021, 2021. a
Adams, M. P., Measurement and characterisation of atmospheric ice-nucleating particles, PhD Thesis, University of Leeds, Leeds, UK, https://etheses.whiterose.ac.uk/28908/ (last access: 15 February 2021), 2020. a
Atanasova, N. S., Adams, M. P., Brasseur, Z., Murray, B. J., and Duplissy, J.: Ice nucleation activity of fungi collected during the HyICE-2018 campaign, in preparation, 2021. a
Boose, Y., Kanji, Z. A., Kohn, M., Sierau, B., Zipori, A., Crawford, I., Lloyd, G., Bukowiecki, N., Herrmann, E., Kupiszewski, P., Steinbacher, M., and Lohmann, U.: Ice nucleating particle measurements at 241 K during Winter months at 3580 m MSL in the Swiss alps, J. Atmos. Sci., 73, 2203–2228, https://doi.org/10.1175/JAS-D-15-0236.1, 2016. a
Boucher, O., Randall, D., Artaxo, P., Bretherton, C., Feingold, G., Forster, P., Kerminen, V.-M., Kondo, Y., Liao, H., Lohmann, U., Rasch, P., Satheesh, S. K., Sherwood, S., Stevens, B., and Zhang, X. Y.: Clouds and aerosols, in: Climate change 2013: the physical science basis. Contribution of Working Group I to the Fifth Assessment Report of the Intergovernmental Panel on Climate Change, 571–657, Cambridge University Press, United Kingdom and New York, NY, USA, 2013. a
Boy, M., Petäjä, T., Dal Maso, M., Rannik, Ü., Rinne, J., Aalto, P., Laaksonen, A., Vaattovaara, P., Joutsensaari, J., Hoffmann, T., Warnke, J., Apostolaki, M., Stephanou, E. G., Tsapakis, M., Kouvarakis, A., Pio, C., Carvalho, A., Römpp, A., Moortgat, G., Spirig, C., Guenther, A., Greenberg, J., Ciccioli, P., and Kulmala, M.: Overview of the field measurement campaign in Hyytiälä, August 2001 in the framework of the EU project OSOA, Atmos. Chem. Phys., 4, 657–678, https://doi.org/10.5194/acp-4-657-2004, 2004. a
Brasseur, Z., Castarède, D., Thomson, E. S., Adams, M. P., Drossaart van Dusseldorp, S., Heikkilä, P., Korhonen, K., Lampilahti, J., Paramonov, M., Schneider, J., Vogel, F., Wu, Y., Abbatt, J. P. D., Atanasova, N. S., Bamford, D. H., Bertozzi, B., Boyer, M., Brus, D., Daily, M. I., Fösig, R., Gute, E., Harrison, A. D., Hietala, P., Höhler, K., Kanji, Z. A., Keskinen, J., Lacher, L., Lampimäki, M., Levula, J., Manninen, A., Nadolny, J., Peltola, M., Porter, G. C. E., Poutanen, P., Proske, U., Schorr, T., Silas Umo, N., Stenszky, J., Virtanen, A., Moisseev, D., Kulmala, M., Murray, B. J., Petäjä, T., Möhler, O., and Duplissy, J.: Measurement report: Introduction to the HyICE-2018 campaign for the measurements of ice nucleating particles in the boreal forest of Hyytiälä (Version 1), Zenodo [data set], https://doi.org/10.5281/zenodo.5141574, 2021. a
Brus, D., Gustafsson, J., Vakkari, V., Kemppinen, O., de Boer, G., and Hirsikko, A.: Measurement report: Properties of aerosol and gases in the vertical profile during the LAPSE-RATE campaign, Atmos. Chem. Phys., 21, 517–533, https://doi.org/10.5194/acp-21-517-2021, 2021. a
Bunz, H., Möhler, O., Naumann, K. H., Saathoff, H., Schöck, W., and Schurath, U.: The novel aerosol chamber facility AIDA: status and first results, in: Proc. 7th European Symposium on the Physico-Chemical Behaviour of Atmospheric Pollutants, http://citeseerx.ist.psu.edu/viewdoc/download?doi=10.1.1.7.106&rep=rep1&type=pdf (last access: 15 July 2021), 1996. a
Burkert-Kohn, M., Wex, H., Welti, A., Hartmann, S., Grawe, S., Hellner, L., Herenz, P., Atkinson, J. D., Stratmann, F., and Kanji, Z. A.: Leipzig Ice Nucleation chamber Comparison (LINC): intercomparison of four online ice nucleation counters, Atmos. Chem. Phys., 17, 11683–11705, https://doi.org/10.5194/acp-17-11683-2017, 2017. a
Castarède, D., Brasseur, Z., Wu, Y., Kanji, A. Z., Bilde, M., Stratmann, F., Swietlicki, E., Svenningsson, B., Sierau, B., Stetzer, O., Nguyen, T. Q., Pettersson, J. B. C., Duplissy, J., and Thomson, E. S.: Development of the Portable Ice Nucleation Chamber PINCii, Ph.D. thesis, University of Gothenburg, Gothenburg, Sweden, ISBN 9789180095815, 2021. a
Chou, C., Stetzer, O., Weingartner, E., Jurányi, Z., Kanji, Z. A., and Lohmann, U.: Ice nuclei properties within a Saharan dust event at the Jungfraujoch in the Swiss Alps, Atmos. Chem. Phys., 11, 4725–4738, https://doi.org/10.5194/acp-11-4725-2011, 2011. a, b, c
Chou, C., Kanji, Z. A., Stetzer, O., Tritscher, T., Chirico, R., Heringa, M. F., Weingartner, E., Prévôt, A. S. H., Baltensperger, U., and Lohmann, U.: Effect of photochemical ageing on the ice nucleation properties of diesel and wood burning particles, Atmos. Chem. Phys., 13, 761–772, https://doi.org/10.5194/acp-13-761-2013, 2013. a
Dal Maso, M., Kulmala, M., Riipinen, I., Wagner, R., Hussein, T., Aalto, P. P., and Lehtinen, K. E.: Formation and growth of fresh atmospheric aerosols: eight years of aerosol size distribution data from SMEAR II, Hyytiala, Finland, Boreal Environ. Res., 10, 323–336, ISSN 1239-6095, 2005. a
David, R. O., Marcolli, C., Fahrni, J., Qiu, Y., Sirkin, Y. A. P., Molinero, V., Mahrt, F., Brühwiler, D., Lohmann, U., and Kanji, Z. A.: Pore condensation and freezing is responsible for ice formation below water saturation for porous particles, Proc. Natl. Acad. Sci., 116, 8184–8189, 2019. a
DeMott, P. J., Prenni, A. J., Liu, X., Kreidenweis, S. M., Petters, M. D., Twohy, C. H., Richardson, M. S., Eidhammer, T., and Rogers, D. C.: Predicting global atmospheric ice nuclei distributions and their impacts on climate, Proc. Natl. Acad. Sci., 107, 11217–11222, https://doi.org/10.1073/pnas.0910818107, 2010. a, b, c, d, e, f, g, h, i, j, k, l
DeMott, P. J., Möhler, O., Stetzer, O., Vali, G., Levin, Z., Petters, M. D., Murakami, M., Leisner, T., Bundke, U., Klein, H., Kanji, Z. A., Cotton, R., Jones, H., Benz, S., Brinkmann, M., Rzesanke, D., Saathoff, H., Nicolet, M., Saito, A., Nillius, B., Bingemer, H., Abbatt, J., Ardon, K., Ganor, E., Georgakopoulos, D. G., and Saunders, C.: Resurgence in Ice Nuclei Measurement Research, Bull. Am. Meteorol. Soc., 92, 1623–1635, https://doi.org/10.1175/2011BAMS3119.1, 2011. a
DeMott, P. J., Hill, T. C. J., Petters, M. D., Bertram, A. K., Tobo, Y., Mason, R. H., Suski, K. J., McCluskey, C. S., Levin, E. J. T., Schill, G. P., Boose, Y., Rauker, A. M., Miller, A. J., Zaragoza, J., Rocci, K., Rothfuss, N. E., Taylor, H. P., Hader, J. D., Chou, C., Huffman, J. A., Pöschl, U., Prenni, A. J., and Kreidenweis, S. M.: Comparative measurements of ambient atmospheric concentrations of ice nucleating particles using multiple immersion freezing methods and a continuous flow diffusion chamber, Atmos. Chem. Phys., 17, 11227–11245, https://doi.org/10.5194/acp-17-11227-2017, 2017. a
DeMott, P. J., Möhler, O., Cziczo, D. J., Hiranuma, N., Petters, M. D., Petters, S. S., Belosi, F., Bingemer, H. G., Brooks, S. D., Budke, C., Burkert-Kohn, M., Collier, K. N., Danielczok, A., Eppers, O., Felgitsch, L., Garimella, S., Grothe, H., Herenz, P., Hill, T. C. J., Höhler, K., Kanji, Z. A., Kiselev, A., Koop, T., Kristensen, T. B., Krüger, K., Kulkarni, G., Levin, E. J. T., Murray, B. J., Nicosia, A., O'Sullivan, D., Peckhaus, A., Polen, M. J., Price, H. C., Reicher, N., Rothenberg, D. A., Rudich, Y., Santachiara, G., Schiebel, T., Schrod, J., Seifried, T. M., Stratmann, F., Sullivan, R. C., Suski, K. J., Szakáll, M., Taylor, H. P., Ullrich, R., Vergara-Temprado, J., Wagner, R., Whale, T. F., Weber, D., Welti, A., Wilson, T. W., Wolf, M. J., and Zenker, J.: The Fifth International Workshop on Ice Nucleation phase 2 (FIN-02): laboratory intercomparison of ice nucleation measurements, Atmos. Meas. Tech., 11, 6231–6257, https://doi.org/10.5194/amt-11-6231-2018, 2018. a, b
Dreischmeier, K., Budke, C., Wiehemeier, L., Kottke, T., and Koop, T.: Boreal pollen contain ice-nucleating as well as ice-binding “antifreeze”polysaccharides, Sci. Rep., 7, 1–13, 2017. a
Duplissy, J., Gysel, M., Alfarra, M. R., Dommen, J., Metzger, A., Prevot, A. S. H., Weingartner, E., Laaksonen, A., Raatikainen, T., Good, N., Turner, S. F., McFiggans, G., and Baltensperger, U.: Cloud forming potential of secondary organic aerosol under near atmospheric conditions, Geophys. Res. Lett., 35, L03818, https://doi.org/10.1029/2007GL031075, 2008. a
Field, P. R., Lawson, R. P., Brown, P. R., Lloyd, G., Westbrook, C., Moisseev, D., Miltenberger, A., Nenes, A., Blyth, A., Choularton, T., Connolly, P., Buehl, J., Crosier, J., Cui, Z., Dearden, C., DeMott, P., Flossmann, A., Heymsfield, A., Huang, Y., Kalesse, H., Kanji, Z. A., Korolev, A., Kirchgaessner, A., Lasher-Trapp, S., Leisner, T., McFarquhar, G., Phillips, V., Stith, J., and Sullivan, S.: Secondary ice production: Current state of the science and recommendations for the future, Meteorol. Monographs, 58, 7–1, https://doi.org/10.1175/AMSMONOGRAPHS-D-16-0014.1, 2017. a
Frosch, M., Bilde, M., DeCarlo, P. F., Juranyi, Z., Tritscher, T., Dommen, J., Donahue, N., Gysel, M., Weingartner, E., and Baltensperger, U.: Relating cloud condensation nuclei activity and oxidation level of α-pinene secondary organic aerosols, J. Geophys. Res.-Atmos., 116, 1984–2012, https://doi.org/10.1029/2011JD016401, 2011. a
Garimella, S., Kristensen, T. B., Ignatius, K., Welti, A., Voigtländer, J., Kulkarni, G. R., Sagan, F., Kok, G. L., Dorsey, J., Nichman, L., Rothenberg, D. A., Rösch, M., Kirchgäßner, A. C. R., Ladkin, R., Wex, H., Wilson, T. W., Ladino, L. A., Abbatt, J. P. D., Stetzer, O., Lohmann, U., Stratmann, F., and Cziczo, D. J.: The SPectrometer for Ice Nuclei (SPIN): an instrument to investigate ice nucleation, Atmos. Meas. Tech., 9, 2781–2795, https://doi.org/10.5194/amt-9-2781-2016, 2016. a, b
Garimella, S., Rothenberg, D. A., Wolf, M. J., David, R. O., Kanji, Z. A., Wang, C., Rösch, M., and Cziczo, D. J.: Uncertainty in counting ice nucleating particles with continuous flow diffusion chambers, Atmos. Chem. Phys., 17, 10855–10864, https://doi.org/10.5194/acp-17-10855-2017, 2017. a, b
Garimella, S., Rothenberg, D. A., Wolf, M. J., Wang, C., and Cziczo, D. J.: How Uncertainty in Field Measurements of Ice Nucleating Particles Influences Modeled Cloud Forcing, J. Atmos. Sci., 75, 179–187, https://doi.org/10.1175/JAS-D-17-0089.1, 2018. a, b
Gute, E., Lacher, L., Kanji, Z. A., Kohl, R., Curtius, J., Weber, D., Bingemer, H., Clemen, H.-C., Schneider, J., Gysel-Beer, M., Ferguson, S. T., and Abbatt, J. P. D.: Field evaluation of a Portable Fine Particle Concentrator (PFPC) for ice nucleating particle measurements, Aerosol Sci. Tech., 53, 1067–1078, https://doi.org/10.1080/02786826.2019.1626346, 2019. a, b
Hari, P. and Kulmala, M.: Station for measuring Ecosystem-Atmosphere relations (SMEAR II), Boreal Environ. Res., 10, 315–322, 2005. a, b
Harrison, A. D., Whale, T. F., Carpenter, M. A., Holden, M. A., Neve, L., O'Sullivan, D., Vergara Temprado, J., and Murray, B. J.: Not all feldspars are equal: a survey of ice nucleating properties across the feldspar group of minerals, Atmos. Chem. Phys., 16, 10927–10940, https://doi.org/10.5194/acp-16-10927-2016, 2016. a
Harrison, A. D., Whale, T. F., Rutledge, R., Lamb, S., Tarn, M. D., Porter, G. C. E., Adams, M. P., McQuaid, J. B., Morris, G. J., and Murray, B. J.: An instrument for quantifying heterogeneous ice nucleation in multiwell plates using infrared emissions to detect freezing, Atmos. Meas. Tech., 11, 5629–5641, https://doi.org/10.5194/amt-11-5629-2018, 2018. a
Hill, T. C. J., Moffett, B. F., DeMott, P. J., Georgakopoulos, D. G., Stump, W. L., and Franc, G. D.: Measurement of Ice Nucleation-Active Bacteria on Plants and in Precipitation by Quantitative PCR, Appl. Environ. Microb., 80, 1256–1267, https://doi.org/10.1128/AEM.02967-13, 2014. a
Hill, T. C. J., DeMott, P. J., Tobo, Y., Fröhlich-Nowoisky, J., Moffett, B. F., Franc, G. D., and Kreidenweis, S. M.: Sources of organic ice nucleating particles in soils, Atmos. Chem. Phys., 16, 7195–7211, https://doi.org/10.5194/acp-16-7195-2016, 2016. a, b, c
Hiranuma, N., Augustin-Bauditz, S., Bingemer, H., Budke, C., Curtius, J., Danielczok, A., Diehl, K., Dreischmeier, K., Ebert, M., Frank, F., Hoffmann, N., Kandler, K., Kiselev, A., Koop, T., Leisner, T., Möhler, O., Nillius, B., Peckhaus, A., Rose, D., Weinbruch, S., Wex, H., Boose, Y., DeMott, P. J., Hader, J. D., Hill, T. C. J., Kanji, Z. A., Kulkarni, G., Levin, E. J. T., McCluskey, C. S., Murakami, M., Murray, B. J., Niedermeier, D., Petters, M. D., O'Sullivan, D., Saito, A., Schill, G. P., Tajiri, T., Tolbert, M. A., Welti, A., Whale, T. F., Wright, T. P., and Yamashita, K.: A comprehensive laboratory study on the immersion freezing behavior of illite NX particles: a comparison of 17 ice nucleation measurement techniques, Atmos. Chem. Phys., 15, 2489–2518, https://doi.org/10.5194/acp-15-2489-2015, 2015. a, b
Hiranuma, N., Adachi, K., Bell, D. M., Belosi, F., Beydoun, H., Bhaduri, B., Bingemer, H., Budke, C., Clemen, H.-C., Conen, F., Cory, K. M., Curtius, J., DeMott, P. J., Eppers, O., Grawe, S., Hartmann, S., Hoffmann, N., Höhler, K., Jantsch, E., Kiselev, A., Koop, T., Kulkarni, G., Mayer, A., Murakami, M., Murray, B. J., Nicosia, A., Petters, M. D., Piazza, M., Polen, M., Reicher, N., Rudich, Y., Saito, A., Santachiara, G., Schiebel, T., Schill, G. P., Schneider, J., Segev, L., Stopelli, E., Sullivan, R. C., Suski, K., Szakáll, M., Tajiri, T., Taylor, H., Tobo, Y., Ullrich, R., Weber, D., Wex, H., Whale, T. F., Whiteside, C. L., Yamashita, K., Zelenyuk, A., and Möhler, O.: A comprehensive characterization of ice nucleation by three different types of cellulose particles immersed in water, Atmos. Chem. Phys., 19, 4823–4849, https://doi.org/10.5194/acp-19-4823-2019, 2019. a, b
Ignatius, K., Kristensen, T. B., Järvinen, E., Nichman, L., Fuchs, C., Gordon, H., Herenz, P., Hoyle, C. R., Duplissy, J., Garimella, S., Dias, A., Frege, C., Höppel, N., Tröstl, J., Wagner, R., Yan, C., Amorim, A., Baltensperger, U., Curtius, J., Donahue, N. M., Gallagher, M. W., Kirkby, J., Kulmala, M., Möhler, O., Saathoff, H., Schnaiter, M., Tomé, A., Virtanen, A., Worsnop, D., and Stratmann, F.: Heterogeneous ice nucleation of viscous secondary organic aerosol produced from ozonolysis of α-pinene, Atmos. Chem. Phys., 16, 6495–6509, https://doi.org/10.5194/acp-16-6495-2016, 2016. a
Illingworth, A., Hogan, R., O'connor, E., Bouniol, D., Brooks, M., Delanoë, J., Donovan, D., Eastment, J., Gaussiat, N., Goddard, J. W. F., Haeffelin, M., Klein Baltink, H., Krasnov, O. A., Pelon, J., Piriou, J.-M., Protat, A., Russchenberg, H. W. J., Seifert, A., Tompkins, A. M., van Zadelhoff, G.-J., Vinit, F., Willén, U., Wilson, D. R., and Wrench, C. L.: Cloudnet: Continuous evaluation of cloud profiles in seven operational models using ground-based observations, Bull. Am. Meteorol. Soc., 88, 883–898, https://doi.org/10.1175/BAMS-88-6-883, 2007. a
Jokinen, V. and Mäkelä, J. M.: Closed-loop arrangement with critical orifice for DMA sheath/excess flow system, J. Aerosol Sci., 28, 643–648, 1997. a
Junninen, H., Lauri, A., Keronen, P., Aalto, P., Hiltunen, V., Hari, P., and Kulmala, M.: Smart-SMEAR: on-line data exploration and visualization tool for SMEAR stations, Boreal Environ. Res. [data set], 14, 447–457, https://avaa.tdata.fi/web/smart (last access: 1 April 2020), 2009. a
Kanji, Z. A., Sullivan, R. C., Niemand, M., DeMott, P. J., Prenni, A. J., Chou, C., Saathoff, H., and Möhler, O.: Heterogeneous ice nucleation properties of natural desert dust particles coated with a surrogate of secondary organic aerosol, Atmos. Chem. Phys., 19, 5091–5110, https://doi.org/10.5194/acp-19-5091-2019, 2019. a
Kneifel, S. and Moisseev, D.: Long-Term Statistics of Riming in Nonconvective Clouds Derived from Ground-Based Doppler Cloud Radar Observations, J. Atmos. Sci., 77, 3495–3508, https://doi.org/10.1175/JAS-D-20-0007.1, 2020. a
Korhonen, K., Kristensen, T. B., Falk, J., Lindgren, R., Andersen, C., Carvalho, R. L., Malmborg, V., Eriksson, A., Boman, C., Pagels, J., Svenningsson, B., Komppula, M., Lehtinen, K. E. J., and Virtanen, A.: Ice-nucleating ability of particulate emissions from solid-biomass-fired cookstoves: an experimental study, Atmos. Chem. Phys., 20, 4951–4968, https://doi.org/10.5194/acp-20-4951-2020, 2020. a
Kulmala, M., Hämeri, K., Aalto, P. P., Mäkelä, J. M., Pirjola, L., Nilsson, E. D., Buzorius, G., Rannik, U., Maso, M. D., Seidl, W., Hoffman, T., Janson, R., Hansson, H.-C., Viisanen, Y., Laaksonen, A., and O'Dowd, C. D.: Overview of the international project on biogenic aerosol formation in the boreal forest (BIOFOR), Tellus B, 53, 324–343, https://doi.org/10.1034/j.1600-0889.2001.530402.x, 2001. a
Kulmala, M., Kontkanen, J., Junninen, H., Lehtipalo, K., Manninen, H. E., Nieminen, T., Petäjä, T., Sipilä, M., Schobesberger, S., Rantala, P., Franchin, A., Jokinen, T., Järvinen, E., Äijälä, M., Kangasluoma, J., Hakala, J., Aalto, P. P., Paasonen, P., Mikkilä, J., Vanhanen, J., Aalto, J., Hakola, H., Makkonen, U., Ruuskanen, T., Mauldin, R. L., Duplissy, J., Vehkamäki, H., Bäck, J., Kortelainen, A., Riipinen, I., Kurtén, T., Johnston, M. V., Smith, J. N., Ehn, M., Mentel, T. F., Lehtinen, K. E. J., Laaksonen, A., Kerminen, V.-M., and Worsnop, D. R.: Direct Observations of Atmospheric Aerosol Nucleation, Science, 339, 943–946, https://doi.org/10.1126/science.1227385, 2013. a, b, c
Lacher, L., Adams, M. P., Barry, K., Bertozzi, B., Bingemer, H., Boffo, C., Bras, Y., Büttner, N., Castarède, D., Cziczo, D. J., DeMott, P. J., Fösig, R., Goodell, M., Höhler, K., Hill, T. C. J., Jentzsch, C., Ladino, L. A., Levin, E. J. T., Mertes, S., Möhler, O., Moore, K. A., Murray, B. J., Nadolny, J., Pfeuffer, T., Picard, D., Ramírez-Romero, C., Ribeiro, M., Richter, S., Schrod, J., Sellegri, K., Stratmann, F., Thomson, E., Wex, H., Wolf, M. J., and Freney, E.: The Puy de Dôme Ice Nucleation Intercomparison Campaign, Presented at the European Aerosol Conference (EAC), Online conference, 30 August–4 September 2020, 164, 2020. a
Ladino, L. A., Zhou, S., Yakobi-Hancock, J. D., Aljawhary, D., and Abbatt, J. P. D.: Factors controlling the ice nucleating abilities of α-pinene SOA particles, J. Geophys. Res.-Atmos., 119, 9041–9051, https://doi.org/10.1002/2014JD021578, 2014. a
Lehtipalo, K., Yan, C., Dada, L., Bianchi, F., Xiao, M., Wagner, R., Stolzenburg, D., Ahonen, L. R., Amorim, A., Baccarini, A., Bauer, P. S., Baumgartner, B., Bergen, A., Bernhammer, A.-K., Breitenlechner, M., Brilke, S., Buchholz, A., Mazon, S. B., Chen, D., Chen, X., Dias, A., Dommen, J., Draper, D. C., Duplissy, J., Ehn, M., Finkenzeller, H., Fischer, L., Frege, C., Fuchs, C., Garmash, O., Gordon, H., Hakala, J., He, X., Heikkinen, L., Heinritzi, M., Helm, J. C., Hofbauer, V., Hoyle, C. R., Jokinen, T., Kangasluoma, J., Kerminen, V.-M., Kim, C., Kirkby, J., Kontkanen, J., Kürten, A., Lawler, M. J., Mai, H., Mathot, S., Mauldin, R. L., Molteni, U., Nichman, L., Nie, W., Nieminen, T., Ojdanic, A., Onnela, A., Passananti, M., Petäjä, T., Piel, F., Pospisilova, V., Quéléver, L. L. J., Rissanen, M. P., Rose, C., Sarnela, N., Schallhart, S., Schuchmann, S., Sengupta, K., Simon, M., Sipilä, M., Tauber, C., Tomé, A., Tröstl, J., Väisänen, O., Vogel, A. L., Volkamer, R., Wagner, A. C., Wang, M., Weitz, L., Wimmer, D., Ye, P., Ylisirniö, A., Zha, Q., Carslaw, K. S., Curtius, J., Donahue, N. M., Flagan, R. C., Hansel, A., Riipinen, I., Virtanen, A., Winkler, P. M., Baltensperger, U., Kulmala, M., and Worsnop, D. R.: Multicomponent new particle formation from sulfuric acid, ammonia, and biogenic vapors, Science advances, 4, eaau5363, https://doi.org/10.1126/sciadv.aau5363, 2018. a
Li, H. and Moisseev, D.: Two layers of melting ice particles within a single radar bright band: Interpretation and implications, Geophys. Res. Lett., 47, e2020GL087499, https://doi.org/10.1029/2020GL087499, 2020. a
Lin, L. I.-K.: A concordance correlation coefficient to evaluate reproducibility, Biometrics, 45, 255–268, https://doi.org/10.2307/2532051, 1989. a
Mason, R. H., Si, M., Chou, C., Irish, V. E., Dickie, R., Elizondo, P., Wong, R., Brintnell, M., Elsasser, M., Lassar, W. M., Pierce, K. M., Leaitch, W. R., MacDonald, A. M., Platt, A., Toom-Sauntry, D., Sarda-Estève, R., Schiller, C. L., Suski, K. J., Hill, T. C. J., Abbatt, J. P. D., Huffman, J. A., DeMott, P. J., and Bertram, A. K.: Size-resolved measurements of ice-nucleating particles at six locations in North America and one in Europe, Atmos. Chem. Phys., 16, 1637–1651, https://doi.org/10.5194/acp-16-1637-2016, 2016. a
McNaughton, C. S., Clarke, A. D., Howell, S. G., Pinkerton, M., Anderson, B., Thornhill, L., Hudgins, C., Winstead, E., Dibb, J. E., Scheuer, E., and Maring, H.: Results from the DC-8 Inlet Characterization Experiment (DICE): Airborne Versus Surface Sampling of Mineral Dust and Sea Salt Aerosols, Aerosol Sci. Tech., 41, 136–159, https://doi.org/10.1080/02786820601118406, 2007. a
Möhler, O., Stetzer, O., Schaefers, S., Linke, C., Schnaiter, M., Tiede, R., Saathoff, H., Krämer, M., Mangold, A., Budz, P., Zink, P., Schreiner, J., Mauersberger, K., Haag, W., Kärcher, B., and Schurath, U.: Experimental investigation of homogeneous freezing of sulphuric acid particles in the aerosol chamber AIDA, Atmos. Chem. Phys., 3, 211–223, https://doi.org/10.5194/acp-3-211-2003, 2003. a
Möhler, O., Field, P. R., Connolly, P., Benz, S., Saathoff, H., Schnaiter, M., Wagner, R., Cotton, R., Krämer, M., Mangold, A., and Heymsfield, A. J.: Efficiency of the deposition mode ice nucleation on mineral dust particles, Atmos. Chem. Phys., 6, 3007–3021, https://doi.org/10.5194/acp-6-3007-2006, 2006. a
Möhler, O., Benz, S., Saathoff, H., Schnaiter, M., Wagner, R., Schneider, J., Walter, S., Ebert, V., and Wagner, S.: The effect of organic coating on the heterogeneous ice nucleation efficiency of mineral dust aerosols, Environ. Res. Lett., 3, 025007, https://doi.org/10.1088/1748-9326/3/2/025007, 2008. a
Möhler, O., Adams, M., Lacher, L., Vogel, F., Nadolny, J., Ullrich, R., Boffo, C., Pfeuffer, T., Hobl, A., Weiß, M., Vepuri, H. S. K., Hiranuma, N., and Murray, B. J.: The Portable Ice Nucleation Experiment (PINE): a new online instrument for laboratory studies and automated long-term field observations of ice-nucleating particles, Atmos. Meas. Tech., 14, 1143–1166, https://doi.org/10.5194/amt-14-1143-2021, 2021. a, b
Morris, C. E., Georgakopoulos, D., and Sands, D.: Ice nucleation active bacteria and their potential role in precipitation, in: J. Phys. IV, EDP sciences, 121, 87–103, https://doi.org/10.1051/jp4:2004121004, 2004. a
Morris, C. E., Sands, D. C., Glaux, C., Samsatly, J., Asaad, S., Moukahel, A. R., Gonçalves, F. L. T., and Bigg, E. K.: Urediospores of rust fungi are ice nucleation active at ∘C and harbor ice nucleation active bacteria, Atmos. Chem. Phys., 13, 4223–4233, https://doi.org/10.5194/acp-13-4223-2013, 2013. a
Murray, B. J., Carslaw, K. S., and Field, P. R.: Opinion: Cloud-phase climate feedback and the importance of ice-nucleating particles, Atmos. Chem. Phys., 21, 665–679, https://doi.org/10.5194/acp-21-665-2021, 2021. a
O’Sullivan, D., Murray, B., Ross, J., Whale, T., Price, H., Atkinson, J., Umo, N., and Webb, M.: The relevance of nanoscale biological fragments for ice nucleation in clouds, Sci. Rep.-UK, 5, 1–7, https://doi.org/10.1038/srep08082, 2015. a
O'Sullivan, D., Adams, M. P., Tarn, M. D., Harrison, A. D., Vergara-Temprado, J., Porter, G. C. E., Holden, M. A., Sanchez-Marroquin, A., Carotenuto, F., Whale, T. F., McQuaid, J. B., Walshaw, R., Hedges, D. H. P., Burke, I. T., Cui, Z., and Murray, B. J.: Contributions of biogenic material to the atmospheric ice-nucleating particle population in North Western Europe, Sci. Rep.-UK, 8, 13821, https://doi.org/10.1038/s41598-018-31981-7, 2018. a
Oue, M., Kumjian, M. R., Lu, Y., Verlinde, J., Aydin, K., and Clothiaux, E. E.: Linear depolarization ratios of columnar ice crystals in a deep precipitating system over the Arctic observed by zenith-pointing Ka-band Doppler radar, J. Appl. Meteorol. Climatol., 54, 1060–1068, https://doi.org/10.1175/JAMC-D-15-0012.1, 2015. a
Paramonov, M., Drossaart van Dusseldorp, S., Gute, E., Abbatt, J. P. D., Heikkilä, P., Keskinen, J., Chen, X., Luoma, K., Heikkinen, L., Hao, L., Petäjä, T., and Kanji, Z. A.: Condensation/immersion mode ice-nucleating particles in a boreal environment, Atmos. Chem. Phys., 20, 6687–6706, https://doi.org/10.5194/acp-20-6687-2020, 2020a. a, b, c, d, e, f, g
Paramonov, M., Drossaart van Dusseldorp, S., Gute, E., Abbatt, J. P., Heikkilä, P., Keskinen, J., Chen, X., Luoma, K., Heikkinen, L., Hao, L., Petäjä, T., and Kanji, Z. A.: Condensation/immersion mode ice nucleating particles in a boreal environment (Version 1), ETH Zurich [data set], https://doi.org/10.3929/ethz-b-000397022, 2020b. a
Porter, G. C. E., Sikora, S. N. F., Adams, M. P., Proske, U., Harrison, A. D., Tarn, M. D., Brooks, I. M., and Murray, B. J.: Resolving the size of ice-nucleating particles with a balloon deployable aerosol sampler: the SHARK, Atmos. Meas. Tech., 13, 2905–2921, https://doi.org/10.5194/amt-13-2905-2020, 2020. a
Rogers, D. C.: Development of a Continuous Flow Thermal Gradient Diffusion Chamber for Ice Nucleation Studies, Atmos. Res., 22, 149–181, 1988. a, b
Rostedt, A., Putkiranta, M., Marjamäki, M., Keskinen, J., Janka, K., Reinivaara, R., and Holma, L.: Optical chamber design for aerosol particle fluorescent measurement, in: Optically Based Biological and Chemical Detection for Defence III, International Society for Optics and Photonics, 6398, 63980G, https://doi.org/10.1117/12.689803, 2006. a
Savage, N. J., Krentz, C. E., Könemann, T., Han, T. T., Mainelis, G., Pöhlker, C., and Huffman, J. A.: Systematic characterization and fluorescence threshold strategies for the wideband integrated bioaerosol sensor (WIBS) using size-resolved biological and interfering particles, Atmos. Meas. Tech., 10, 4279–4302, https://doi.org/10.5194/amt-10-4279-2017, 2017. a, b, c, d
Schiebel, T.: Ice Nucleation Activity of Soil Dust Aerosols, Ph.D. thesis, Karlsruhe Institute of Technology, Karlsruhe, Germany, 131, https://doi.org/10.5445/IR/1000076327 2017. a
Schmale, J., Henning, S., Henzing, B., Keskinen, H., Sellegri, K., Ovadnevaite, J., Bougiatioti, A., Kalivitis, N., Stavroulas, I., Jefferson, A., Park, M., Schlag, P., Kristensson, A., Iwamoto, Y., Pringle, K., Reddington, C., Aalto, P., Äijälä, M., Baltensperger, U., Bialek, J., Birmili, W., Bukowiecki, N., Ehn, M., Fjæraa, A. M., Fiebig, M., Frank, G., Fröhlich, R., Frumau, A., Furuya, M., Hammer, E., Heikkinen, L., Herrmann, E., Holzinger, R., Hyono, H., Kanakidou, M., Kiendler-Scharr, A., Kinouchi, K., Kos, G., Kulmala, M., Mihalopoulos, N., Motos, G., Nenes, A., O'Dowd, C., Paramonov, M., Petäjä, T., Picard, D., Poulain, L., Prévôt, A. H., Slowik, J., Sonntag, A., Swietlicki, E., Svenningsson, B., Tsurumaru, H., Wiedensohler, A., Wittbom, C., Ogren, J. A., Matsuki, A., Yum, S. S., Myhre, C. L., Carslaw, K., Stratmann, F., and Gysel, M.: Collocated observations of cloud condensation nuclei, particle size distributions, and chemical composition, Sci. Data, 4, 170003, https://doi.org/10.1038/sdata.2017.3, 2017. a
Schneider, J., Höhler, K., Heikkilä, P., Keskinen, J., Bertozzi, B., Bogert, P., Schorr, T., Umo, N. S., Vogel, F., Brasseur, Z., Wu, Y., Hakala, S., Duplissy, J., Moisseev, D., Kulmala, M., Adams, M. P., Murray, B. J., Korhonen, K., Hao, L., Thomson, E. S., Castarède, D., Leisner, T., Petäjä, T., and Möhler, O.: The seasonal cycle of ice-nucleating particles linked to the abundance of biogenic aerosol in boreal forests, Atmos. Chem. Phys., 21, 3899–3918, https://doi.org/10.5194/acp-21-3899-2021, 2021. a, b, c, d, e, f, g, h, i, j, k, l, m, n, o, p
Sihto, S.-L., Mikkilä, J., Vanhanen, J., Ehn, M., Liao, L., Lehtipalo, K., Aalto, P. P., Duplissy, J., Petäjä, T., Kerminen, V.-M., Boy, M., and Kulmala, M.: Seasonal variation of CCN concentrations and aerosol activation properties in boreal forest, Atmos. Chem. Phys., 11, 13269–13285, https://doi.org/10.5194/acp-11-13269-2011, 2011. a
Sinclair, V. A., Moisseev, D., and von Lerber, A.: How dual-polarization radar observations can be used to verify model representation of secondary ice, J. Geophys. Res.-Atmos., 121, 10–954, https://doi.org/10.1002/2016JD025381, 2016. a
Sinclair, V. A., Mikkola, J., Rantanen, M., and Räisänen, J.: The summer 2018 heatwave in Finland, Weather, 74, 403–409, https://doi.org/10.1002/wea.3525, 2019. a
Sioutas, C., Koutrakis, P., Ferguson, S. T., and Burton, R. M.: Development and Evaluation of a Prototype Ambient Particle Concentrator for Inhalation Exposure Studies, Inhal. Toxicol., 7, 633–644, https://doi.org/10.3109/08958379509014470, 1995. a
Solomon, S., Qin, D., Manning, M., Alley, R. B., Berntsen, T., Bindoff, N. L., Chen, Z., Chidthaisong, A., Gregory, J. M., Hegerl, G. C., Heimann, M., Hewitson, B., Hoskins, B. J., Joos, F., Jouzel, J., Kattsov, V., Lohmann, U., Matsuno, T., Molina, M., Nicholls, N., Overpeck, J., Raga, G., Ramaswamy, V., Ren, J., Rusticucci, M., Somerville, R., Stocker, T. F., Whetton, P., Wood, R. A., and Wratt, D.: Technical Summary, in: Climate Change 2007: The Physical Science Basis, Contribution of Working Group I to the Fourth Assessment Report of the Intergovernmental Panel on Climate Change, edited by: Solomon, S., Qin, D., Manning, M., Chen, Z., Marquis, M., Averyt, K. B., Tignor, M., and Miller, H. L., Cambridge University Press, Cambridge, United Kingdom and New York, NY, USA, 2007. a
Stetzer, O., Baschek, B., Lueoeond, F., and Lohmann, U.: The Zurich Ice Nucleation Chamber (ZINC) - A new instrument to investigate atmospheric ice formation, Aerosol Sci. Tech., 42, 64–74, https://doi.org/10.1080/02786820701787944, 2008. a, b
Tobo, Y., Prenni, A. J., DeMott, P. J., Huffman, J. A., McCluskey, C. S., Tian, G., Pöhlker, C., Pöschl, U., and Kreidenweis, S. M.: Biological aerosol particles as a key determinant of ice nuclei populations in a forest ecosystem, J. Geophys. Res.-Atmos., 118, 10100–10110, https://doi.org/10.1002/jgrd.50801, 2013. a, b, c, d, e, f, g, h, i, j, k, l, m, n, o, p, q
Tunved, P., Hansson, H.-C., Kulmala, M., Aalto, P., Viisanen, Y., Karlsson, H., Kristensson, A., Swietlicki, E., Dal Maso, M., Ström, J., and Komppula, M.: One year boundary layer aerosol size distribution data from five nordic background stations, Atmos. Chem. Phys., 3, 2183–2205, https://doi.org/10.5194/acp-3-2183-2003, 2003. a
Tunved, P., Hansson, H.-C., Kerminen, V.-M., Ström, J., Maso, M. D., Lihavainen, H., Viisanen, Y., Aalto, P. P., Komppula, M., and Kulmala, M.: High Natural Aerosol Loading over Boreal Forests, Science, 312, 261–263, https://doi.org/10.1126/science.1123052, 2006. a, b
Vali, G.: Quantitative Evaluation of Experimental Results an the Heterogeneous Freezing Nucleation of Supercooled Liquids, J. Atmos. Sci., 28, 402–409, https://doi.org/10.1175/1520-0469(1971)028<0402:QEOERA>2.0.CO;2, 1971a. a
Vali, G.: Supercooling of Water and Nucleation of Ice (Drop Freezer), Am. J. Phys., 39, 1125–1128, https://doi.org/10.1119/1.1976585, 1971b. a
Vali, G., DeMott, P. J., Möhler, O., and Whale, T. F.: Technical Note: A proposal for ice nucleation terminology, Atmos. Chem. Phys., 15, 10263–10270, https://doi.org/10.5194/acp-15-10263-2015, 2015. a, b
Vana, M., Ehn, M., Petäjä, T., Vuollekoski, H., Aalto, P., de Leeuw, G., Ceburnis, D., O'Dowd, C. D., and Kulmala, M.: Characteristic features of air ions at Mace Head on the west coast of Ireland, Atmos. Res., 90, 278–286, https://doi.org/10.1016/j.atmosres.2008.04.007, 2008. a
Wagner, R., Höhler, K., Huang, W., Kiselev, A., Möhler, O., Mohr, C., Pajunoja, A., Saathoff, H., Schiebel, T., Shen, X., and Virtanen, A.: Heterogeneous ice nucleation of α-pinene SOA particles before and after ice cloud processing, J. Geophys. Res.-Atmos., 122, 4924–4943, https://doi.org/10.1002/2016JD026401, 2016JD026401, 2017. a
Wex, H., Augustin-Bauditz, S., Boose, Y., Budke, C., Curtius, J., Diehl, K., Dreyer, A., Frank, F., Hartmann, S., Hiranuma, N., Jantsch, E., Kanji, Z. A., Kiselev, A., Koop, T., Möhler, O., Niedermeier, D., Nillius, B., Rösch, M., Rose, D., Schmidt, C., Steinke, I., and Stratmann, F.: Intercomparing different devices for the investigation of ice nucleating particles using Snomax® as test substance, Atmos. Chem. Phys., 15, 1463–1485, https://doi.org/10.5194/acp-15-1463-2015, 2015. a, b
Whale, T. F., Murray, B. J., O'Sullivan, D., Wilson, T. W., Umo, N. S., Baustian, K. J., Atkinson, J. D., Workneh, D. A., and Morris, G. J.: A technique for quantifying heterogeneous ice nucleation in microlitre supercooled water droplets, Atmos. Meas. Tech., 8, 2437–2447, https://doi.org/10.5194/amt-8-2437-2015, 2015. a
Wiedensohler, A., Birmili, W., Nowak, A., Sonntag, A., Weinhold, K., Merkel, M., Wehner, B., Tuch, T., Pfeifer, S., Fiebig, M., Fjäraa, A. M., Asmi, E., Sellegri, K., Depuy, R., Venzac, H., Villani, P., Laj, P., Aalto, P., Ogren, J. A., Swietlicki, E., Williams, P., Roldin, P., Quincey, P., Hüglin, C., Fierz-Schmidhauser, R., Gysel, M., Weingartner, E., Riccobono, F., Santos, S., Grüning, C., Faloon, K., Beddows, D., Harrison, R., Monahan, C., Jennings, S. G., O'Dowd, C. D., Marinoni, A., Horn, H.-G., Keck, L., Jiang, J., Scheckman, J., McMurry, P. H., Deng, Z., Zhao, C. S., Moerman, M., Henzing, B., de Leeuw, G., Löschau, G., and Bastian, S.: Mobility particle size spectrometers: harmonization of technical standards and data structure to facilitate high quality long-term observations of atmospheric particle number size distributions, Atmos. Meas. Tech., 5, 657–685, https://doi.org/10.5194/amt-5-657-2012, 2012. a
Wilson, T. W., Murray, B. J., Wagner, R., Möhler, O., Saathoff, H., Schnaiter, M., Skrotzki, J., Price, H. C., Malkin, T. L., Dobbie, S., and Al-Jumur, S. M. R. K.: Glassy aerosols with a range of compositions nucleate ice heterogeneously at cirrus temperatures, Atmos. Chem. Phys., 12, 8611–8632, https://doi.org/10.5194/acp-12-8611-2012, 2012. a
Wolf, M. J., Zhang, Y., Zawadowicz, M. A., Goodell, M., Froyd, K., Freney, E., Sellegri, K., Rösch, M., Cui, T., Winter, M., Lacher, L., Axisa, D., DeMott, P. J., Levin, E. J. T., Gute, E., Abbatt, J., Koss, A., Kroll, J. H., Surratt, J. D., and Cziczo, D. J.: A biogenic secondary organic aerosol source of cirrus ice nucleating particles, Nat. Comm., 11, 1–9, https://doi.org/10.1038/s41467-020-18424-6, 2020. a
Wu, Y., Duplissy, J., Brasseur, Z., Castarède, D., and Thomson, E. S.: PINCii measurements during the HyICE-2018 campaign, in preparation, 2021. a
FMCW represents frequency modulated continuous wave.