the Creative Commons Attribution 4.0 License.
the Creative Commons Attribution 4.0 License.
 | 19 Apr 2022
Oxidation pathways and emission sources of atmospheric particulate nitrate in Seoul: based on δ15N and Δ17O measurements
Saehee Lim
Joel Savarino
Paolo Laj
PM2.5 haze pollution driven by secondary inorganic has been a great concern in East Asia. It is, therefore, imperative to identify its sources and oxidation processes, for which nitrogen and oxygen stable isotopes are powerful tracers. Here, we determined the δ15N () and Δ17O () of PM2.5 in Seoul during the summer of 2018 and the winter of 2018–2019 and estimated quantitatively the relative contribution of oxidation pathways for particulate and investigated major NOx emission sources. In the range of PM2.5 mass concentration from 7.5 µg m−3 (summer) to 139.0 µg m−3 (winter), the mean δ15N was −0.7 ‰ ± 3.3 ‰ and 3.8 ‰ ± 3.7 ‰, and the mean Δ17O was 23.2 ‰ ± 2.2 ‰ and 27.7 ‰ ± 2.2 ‰ in the summer and winter, respectively. While OH oxidation was the dominant pathway for during the summer (87 %), nighttime formation via N2O5 and NO3 was relatively more important (38 %) during the winter, when aerosol liquid water content (ALWC) and nitrogen oxidation ratio (NOR) were higher. Interestingly, the highest Δ17O was coupled with the lowest δ15N and highest NOR during the record-breaking winter PM2.5 episodes, revealing the critical role of photochemical oxidation process in severe winter haze development. For NOx sources, atmospheric δ15N (NOx) estimated from measured δ15N () considering isotope fractionation effects indicates vehicle emissions as the most important emission source of NOx in Seoul. The contribution from biogenic soil and coal combustion was slightly increased in summer and winter, respectively. Our results built on a multiple-isotope approach provide the first explicit evidence for formation processes and major NOx emission sources in the Seoul megacity and suggest an effective mitigation measure to improve PM2.5 pollution.
- Article
(1578 KB) - Full-text XML
-
Supplement
(669 KB) - BibTeX
- EndNote


In northeast Asia, air pollution characterized by high PM2.5 (particulate matter with aerodynamic diameter smaller than 2.5 µm) and ozone concentrations has received significant attention due to its serious effects on human health (Lelieveld et al., 2015; Xie et al., 2019). As a result of extensive efforts by East Asian countries to improve the ambient air quality, anthropogenic emissions of SOx, NOx, and CO have been significantly reduced, particularly in China (Cheng et al., 2019). Nonetheless, the number of severe haze events and the duration have been increased, which is not understood clearly.
It is also noteworthy that there are common chemical and meteorological characteristics in the occurrence of the PM2.5 haze pollution in northeast Asia, such as inorganic-species-dominated chemical composition (Liu et al., 2018; Shao et al., 2018; Wang et al., 2019a) and transboundary transport of haze aerosol depending on the synoptic atmospheric circulation (Quan et al., 2020; Shi et al., 2020; Zheng et al., 2019). Overall, approximately 40 % of PM2.5 consists of , , and (secondary inorganic aerosol, SIA) in both urban and background sites in China (Liu et al., 2018) for the period of 2012–2013. The mass contribution of SIA was further augmented up to 69 % at urban Beijing and island sites (Changdao) in the North China Plain (NCP) during the 2016 spring (Lim et al., 2020). A large increase in SIA mass is particularly associated with efficient formation of in cold months (most frequently in December to March), leading to a rapid increase in PM2.5 concentration and developing a persistent haze pollution on a regional scale (Li et al., 2018; Xu et al., 2019). Recent studies suggest that the regional occurrence of the PM2.5 haze events derived by across the Asian continent has been associated with long-range transport of air pollutants promoted by cold fronts and their intrusion in downward regions by the development of the atmospheric boundary layer (Kang et al., 2019; Lee et al., 2019). However, scientific understanding is still limited because the rapid increase of fine-aerosol is the result of the complex interplay of oxidation and transformation mechanisms producing from various fossil and non-fossil sources of NOx with micro-to-synoptic meteorology creating the conditions for formation. In addition, considering that NOx emissions from bottom-up emission inventory are smaller than top-down estimates by satellites (e.g., Goldberg et al., 2019), our understanding of NOx emissions is poor.
In order to better understand processes of formation including NOx emission sources in East Asia, a growing number of recent studies have suggested nitrogen and oxygen stable-isotope-based measurement as a robust and useful tool for providing important clues for formation as well as NOx emission sources (He et al., 2018; Lim et al., 2019, 2020; Song et al., 2019; Zong et al., 2017, 2020). The isotopic composition is expressed in parts per thousand (‰) and reported as δ (‰) with R being the ratio of the heavy isotope over the light isotope (e.g., , , ) in a sample (Rsample) and in the international standard (Rstandard). The international standards are the Vienna Standard Mean Ocean Water (VSMOW) and atmospheric N2 for oxygen and nitrogen ratios. In terms of NOx emission sources, the major NOx sources are distinguished in their nitrogen isotopic compositions: biogenic soil (driven by fertilizer use; −35.1 ‰ ± 10.2 ‰) (Felix and Elliott, 2014; Li and Wang, 2008; Yu and Elliott, 2017), biomass burning (1.8 ‰ ± 1.8 ‰) (Fibiger and Hastings, 2016), vehicle emissions (−2.5 ‰ ± 1.5 ‰) (Walters et al., 2015), and coal combustion (14.2 ‰ ± 4.5 ‰) (Felix et al., 2012; Heaton, 1990). Despite evidence that δ15N (NOx) can serve as a useful tracer of NOx emission sources, during NOy photochemical cycling and its loss processes, the δ15N of initial NOx can be significantly altered by both kinetic and equilibrium isotopic fractionation effects (εN), complicating the link between δ15N () and δ15N (NOx) (Freyer et al., 1993; Li et al., 2020).
The formation processes of HNO3 in the atmosphere consist of NO−NO2 photochemical cycle Reactions (R1)–(R3) and post NO2 oxidation Reactions (R4)–(R8). During the NOx cycling, nitrogen isotopic fractionation is affected by unidirectional reactions of the Leighton cycle and NOx isotope exchange equilibrium. A recent laboratory experiment has shown that the Leighton cycle isotope effect (LCIE) associated solely with O3 Reaction (R1) and equilibrium isotopic effect (EIE) were −10 ‰ and 28.9 ‰ at room temperature, respectively (Li et al., 2020). The relative importance of these two effects on δ15N (NO2) also depends on NOx levels, leading to an increase (decrease) in δ15N (NO2) relative to δ15N (NOx) values at high (low) NOx conditions (Kamezaki et al., 2019; Li et al., 2020; Walters et al., 2018). Overall, the nitrogen isotope exchange equilibrium has been suggested to be the dominant fractionation process in NO−NO2 cycling at urban atmosphere (Freyer et al., 1993) and oxidation reactions forming nitric acid (HNO3) and particulate (Savarino et al., 2013).
where M is an unreactive third body and R is any organic group.
The kinetic fractionation effect during daytime oxidation of NO2 to HNO3 Reaction (R4) is relatively minor, being estimated to be −3 ‰ (Freyer, 1991). During the nighttime when most NO is oxidized to NO2 without NOx photolysis, the isotopic equilibrium between NO2, NO3, and N2O5 should be achieved (Reaction R6). The nighttime thermal equilibrium likely favors the partitioning of 15N into N2O5 relative to NO2 and consequently induces a large isotopic fractionation effect of 25.5 ‰ (Reactions R5–R6; Walters and Michalski, 2015). On the other hand, the nitrogen partitioning between NO2 and NO3 Reaction (R5) may induce a fractionation effect of about −18 ‰ (Walters and Michalski, 2015). These N isotope fractionation effects should be first evaluated to explore NOx source contributions, which should be based on combining with a robust tracer for the contributions of oxidation pathways.
Lately, Δ17O () has been used for tracing oxidation pathways (Alexander et al., 2009, 2020; Morin et al., 2009; Savarino et al., 2007, 2013). Earlier researches observed that atmospheric is anomalously enriched in 17O (Michalski et al., 2003), which stems from O3 formation reactions, where a rare isotope effect leads to excess 17O enrichment relative to what is expected based on the 18O enrichments (Thiemens, 1999, 2006). This enrichment is quantified by Δ17O notation (17O excess, defined as δ17OO). Since non-zero Δ17O strictly reflects a photochemical effect, produced by denitrification in soils should have Δ17O of zero. The mass-independent Δ17O signature of O3 is transferred to NOx, in which the number of oxygen atoms from O3 is involved in NOx. In this way, the Δ17O () is served as a conservative marker to track the chemical formation of atmospheric . Photochemical formation by peroxy radicals (HO2 and RO2) leads to a relatively low Δ17O (), whereas nighttime formation through N2O5 and NO3 results in high Δ17O (Michalski et al., 2003; Morin et al., 2009; Savarino et al., 2007). Consequently, the difference in Δ17O () suggests approaching a proportional contribution of daytime and nighttime oxidation of .
To date, few field studies have coupled Δ17O () and δ15N () to investigate NOx-to- oxidation processes and emission sources of NOx, e.g., field researches in Japan (Nelson et al., 2018); West Virginia, USA (Rose et al., 2019); Shanghai, China (He et al., 2020); and Beijing, China (He et al., 2018; Song et al., 2020).
In this study, we present the measurement results of δ15N and Δ17O of in Seoul during the summer of 2018 and the winter of 2018–2019, when we encountered the record-breaking PM2.5 concentrations. Then, the δ15N and Δ17O measurements are used to evaluate seasonally distinct atmospheric oxidation pathways of and to explore major NOx source contributions in the study region.
2.1 Sampling
We collected PM2.5 filter samples on the rooftop of the six-story Asan science building at the Korea University campus located in northeast Seoul, the capital of South Korea (37.59∘ N, 127.02∘ E; Fig. 1) during the summer of 2018 (26 May to 22 August; n=13) and the winter of 2018–2019 (27 December to 8 March; n=18). Seoul is a metropolitan area with a population of 9.77 million and known to be influenced by heavy road traffic all around. The PM2.5 particulates were collected on quartz filters (20 cm× 25 cm; Pallflex Products, Putnam, USA) at a nominal flow rate of 96 m3 hr−1 for 1 to 3 d using a high-volume air sampler (3000 series, Ecotech, Australia). Filters were analyzed for water-soluble ions, carbonaceous compounds, total nitrogen (TN) and carbon (TC), and stable nitrogen and oxygen isotopic ratios. Reactive gases including O3, NO, NO2, SO2, and CO and a meteorological suite including air temperature, relative humidity, and wind speed and direction were measured hourly at the nearby monitoring sites run by the National Institute of Environmental Research (NIER) and the Korea Meteorological Administration (KAM), respectively. These data were averaged daily for comparison with filter-based chemical composition data, if necessary.
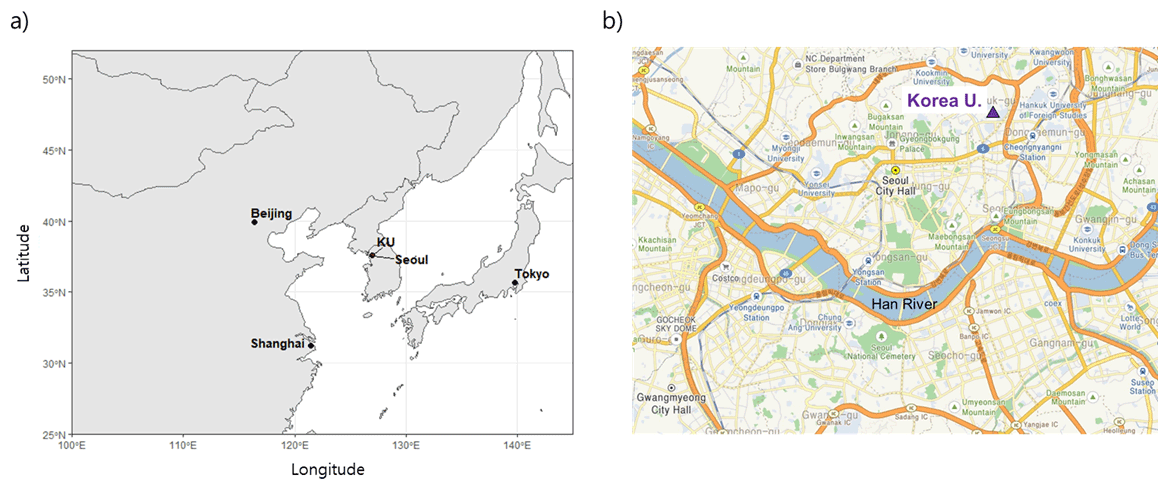
Figure 1Location of the study region. (a) Seoul metropolitan area in South Korea; the map was generated using the open-source software R (http://www.R-project.org/, last access: 2 February 2021). (b) Sampling site of the Korea University campus in the northeast Seoul; the map was taken from © Kakao maps (https://map.kakao.com/, last access: 29 December 2021).
2.2 Chemical analyses
Filters were stored in a freezer pending chemical analysis. Chemical composition of PM2.5 was determined for eight water-soluble ions (Cl−, , , Na+, , K+, Ca2+, and Mg2+) by ion chromatography (IC; Eco IC, Metrohm, Switzerland), organic carbon (OC) and elemental carbon (EC) by an OC-EC analyzer (Sunset Laboratory Inc., US) using the thermo-optical transmittance method (NIOSH870), and TC and total nitrogen (TN) by an elemental analyzer (EA, Fisons NA-1500NC, Thermo, Waltham, MA, USA). Mass concentrations of these constituents were corrected for laboratory and field blanks. The detection limit, determined as 3 standard deviations (SD) above blank concentrations, was <0.1 ppm for ionic species, 0.5 µg cm−3 for TC (the sum of OC and EC), and 0.8 g µgN and 0.5 µgC per punched filter area for TN and TC, respectively. Details of the analytical methods can be found elsewhere (Lim et al., 2020).
Following the bacterial denitrifier method (Casciotti et al., 2002; McIlvin and Casciotti, 2011), the Δ17O of was measured simultaneously with δ18O and δ15N coupled with an isotope ratio mass spectrometry (IRMS) measurement using an in-house peripheral system at the Université Grenoble Alpes (Morin et al., 2009). In brief, of samples was converted to N2O via bacterial denitrification, and the N2O was further converted into O2 and N2, which were separated via a gas chromatography column before being introduced to the IRMS system (Thermo Finnigan MAT 253 isotope ratio mass spectrometer). Samples were measured in batch with reference materials following strictly the identical treatment principles, including the same water matrix for standards and samples. Together with samples, a subset of international nitrate reference materials (US Geological Survey 32, 34, and 35, as well as their mixtures) was measured for correction and calibration of Δ17O and δ18O values relative to VSMOW and δ15N values relative to air N2. The overall accuracy of the method is estimated as the reduced standard deviation of the residuals from the linear regression between the measured reference materials and their expected values (Morin et al., 2009). For these sets of analyses, the obtained uncertainties (1σ) were 0.4 ‰ and 0.3 ‰ for Δ17O () and δ15N (), respectively. The analytical procedure used in this study strictly followed the method described in Morin et al. (2009), which adheres to the new standard bacterial method coupled with the gold catalyst for the thermal decomposition of N2O into N2 and O2 (Kaiser et al., 2007).
2.3 Quantifying isotope fractionation effects
2.3.1 Isotope fractionation effects of NO2 oxidation to atmospheric particulate : δ15N ()
The HNO3 forms through three major pathways including (i) OH pathway, (ii) O3 pathway associated with N2O5, and (iii) O3 pathway associated with NO3.
OH pathway
When NO and NO2 coexist in similar quantities due to the Leighton cycle, 15N is preferentially partitioned into NO2 via the equilibrium isotope effect, leading to higher δ15N in NO2 relative to NO and NOx (Freyer et al., 1993; Walters et al., 2016). Considering the comparable concentrations of NO and NO2 over a year in Seoul (Fig. S1 in the Supplement), the N isotope effects on δ15N () should be significantly affected by NOx photochemical interactions. The relative importance of EIE and LCIE to δ15N(NO2) can be assessed by comparing lifetimes of NO2 with respect to isotope exchange with NO (τexchange) and photolysis (). In this regard, the “A” factor was defined as cm3 s−1, Sharma et al., 1970) by Li et al. (2020, 2021). These studies demonstrated that A was as small as 0.01–0.5 in the EIE-dominated regime with NOx >20 ppbv and the ratio of <0.6. In Seoul, to simply evaluate the relative importance of EIE and LCIE only (not for 15N correction), the A factor was estimated to be 0.08±0.20 (median ± SD) and 0.60±0.51 during the winter and summer months, respectively, indicating the significant influence of the equilibrium isotope effect on NO−NO2 isotopic fractionation. The time series was calculated using the Master Chemical Mechanism (MCM) model (Saunders et al., 2003).
After NOx photochemical cycling, NO2 is oxidized by the reaction with OH radical to form atmospheric HNO3 (HNO3 Reaction R4 pathway). The N fractionation effect of particulate produced via the HNO3 Reaction (R4) pathway (ε1, unit in ‰) can be expressed as the following, neglecting kinetic isotope effects associated with the HNO3 Reaction (R4) pathway (Walters and Michalski, 2016):
where is the fraction of NO2 relative to the total NOx, and is the temperature-dependent isotope equilibrium exchange fractionation factor for (Walters et al., 2016). In the present study, the measured was used individually for summer samples, and a seasonal mean (0.69) was applied to winter samples due to the lack of availability of continuous NO−NO2 measurement data.
Oxidation of NOx to HNO3 is regarded as the formation pathway of particulate via the HNO3 Reaction (R4) pathway due to the unconstrained isotope fractionation effect between HNO3 and , resulting in the following equation:
O3 pathways associated with N2O5 and NO3
During the nighttime when NO is oxidized into NO2 without photolyzing back to NO and fresh emissions of NO are negligible, NOx exists almost as NO2, and thus δ15N (NO2) should be reflective of the δ15N of NOx sources. If NO2 is oxidized to N2O5, the isotopic equilibrium is likely to be achieved between NO2, NO3, and N2O5 by chemical equilibrium Reaction (R6), and the δ15N values of N2O5 and NO3 will reflect the isotope equilibrium fractionation factors relative to NO2 (i.e., and ; values were adopted from the Supplement Table S5 in Walters and Michalski, 2016). Finally, δ15N of particulate produced from dark pathways can be expressed as the following, neglecting currently unconstrained kinetic isotopic fractionation associated with Reactions (R7) and (R8) (Walters and Michalski, 2016):
Therefore, the δ15N (NOx) in the atmosphere can be expressed using measured δ15N () and the net N isotope fractionation effect, εN.
where ε1, ε2, and ε3 are the abovementioned N isotope fractionation effect of pathways (i), (ii), and (iii), respectively, and the proportional contributions (f1, f2, and f3) of the three formation pathways were estimated from Δ17O measurements (Sect. 2.3.2).
2.3.2 Proportional contributions of three formation pathways to atmospheric particulate Δ17O ()
Due to its mass-independent nature, Δ17O of particulate is a conservative tracer of photochemical formation (Michalski et al., 2003, 2004). At photochemical steady state, the Δ17O of NO2 is determined by the relative production rate of NO2 via O3 oxidation Reaction (R1) in NO2 production Reactions (R1) and (R2) () and the mass-independent Δ17O anomaly transferred from O3 during Reaction (R1) (Δ17):
was adopted from a previous study conducted in Beijing (Wang et al., 2019b), where the seasonal mean was 0.858 and 0.918 for summer and winter, respectively. Δ17 can be approximated as 1.5×Δ17O−O3 because of the isotopic asymmetry of O3 (Michalski and Bhattacharya, 2009). In this study, the Δ17 is 37.5 ‰ ± 2.2 ‰ (mean ± SD) averaged from literature sources as the isotopic composition of ozone shows a remarkable stability in the lower troposphere (Ishino et al., 2017; Vicars et al., 2012; Vicars and Savarino, 2014)
The Δ17O of particulate produced via the three formation pathways can be predicted by distinct Δ17O transfer functions as the following (Morin et al., 2011):
Finally, the Δ17O () can be expressed as the following:
where Δ17O ()measured is the measured value in this study, and the three endmember values of Δ17O () Reaction (R4), Δ17O () Reaction (R7), and Δ17O () Reaction (R8) are calculated using Eqs. (6a)–(6c). The proportional contributions of the three formation pathways () were estimated by the Stable Isotope Analysis in R (SIAR) model (Sect. 2.5) for the winter and the summer months.
2.4 Estimation of PM2.5 aerosol liquid water content (ALWC) and aerosol pH
ISORROPIA II is a thermodynamic equilibrium model for the Cl−, , , Na+, , K+, Ca2+, Mg2+, and H2O aerosol system (Fountoukis and Nenes, 2007). In the present study, the model was run as a forward and metastable mode to calculate aerosol liquid water content (ALWC) and pH. The detailed information of the model is found in Fountoukis and Nenes (2007). As input parameters, the concentrations of water-soluble ions that were measured by NIER and ambient RH and temperature were used for the model.
2.5 Bayesian stable isotope mixing model (stable isotope analysis in R, SIAR)
For quantifying proportional contribution of three formation pathways (f1, f2, and f3 in Eq. 4b), we used the Bayesian stable isotope mixing model (Parnell et al., 2013) implemented in the simmr package in R software, which is available at https://cran.r-project.org/web/packages/simmr/index.html (last access: 10 March 2021). The Bayesian Markov chain Monte Carlo approach is adequate to provide the relative contribution of the endmembers. Detailed information of the SIAR can be found in Parnell et al. (2010). As input data, measured Δ17O () and estimated Δ17O () endmember values of each pathway were treated in the SIAR model. Similar use of the SIAR model can be found elsewhere (Song et al., 2020; Wang et al., 2019b).
2.6 Backward air mass trajectory
Two-day air mass backward trajectories were analyzed using the HYSPLIT (Hybrid Single-Particle Lagrangian Integrated Trajectory) model with meteorological input from the global data assimilation system (a regular 1∘ × 1 ∘ longitude–latitude grid) (Stein et al., 2015; https://ready.arl.noaa.gov/HYSPLIT.php, last access: 27 May 2020). The trajectories were calculated every 6 h at an elevation of 500 m a.s.l. The potential source contribution function (PSCF) was then applied to calculate the probable source location (latitude i and longitude j), which is determined here as the ratio of the number of trajectory end points associated with measured δ15N () values higher than a threshold value (set to the 95th percentile of δ15N () (mij) to the total number of points (nij) in the ijth grid cell). The PSCF calculation and the determination of the gridded trajectory frequencies were made in the openair R package (https://cran.r-project.org/web/packages/openair/index.html, last access: 4 January 2021) (Carslaw and Ropkins, 2012).
3.1 Seasonal characteristics of PM2.5 concentration, δ15N (), and Δ17O ()
PM2.5 mass concentration varied from 7.5 to 139.0 µg m−3 for the whole sampling period. According to the typical synoptic weather patterns of East Asia (Kim et al., 2007), the measurements are divided into summer (May–August) and winter (October–March) groups. A clear seasonal difference in PM2.5 concentration and its composition were observed with significantly higher concentrations of mass and inorganic constituent in the winter than in the summer (Table 1 and Fig. S1).
Table 1Measurement summary of PM2.5 chemical constituents and isotopic compositions in Seoul during the sampling period of May 2018–March 2019. Arithmetic mean ± 1 SD (mass fraction, %) for mass concentrations and concentration-weighted mean ± 1 SD for isotope ratios.
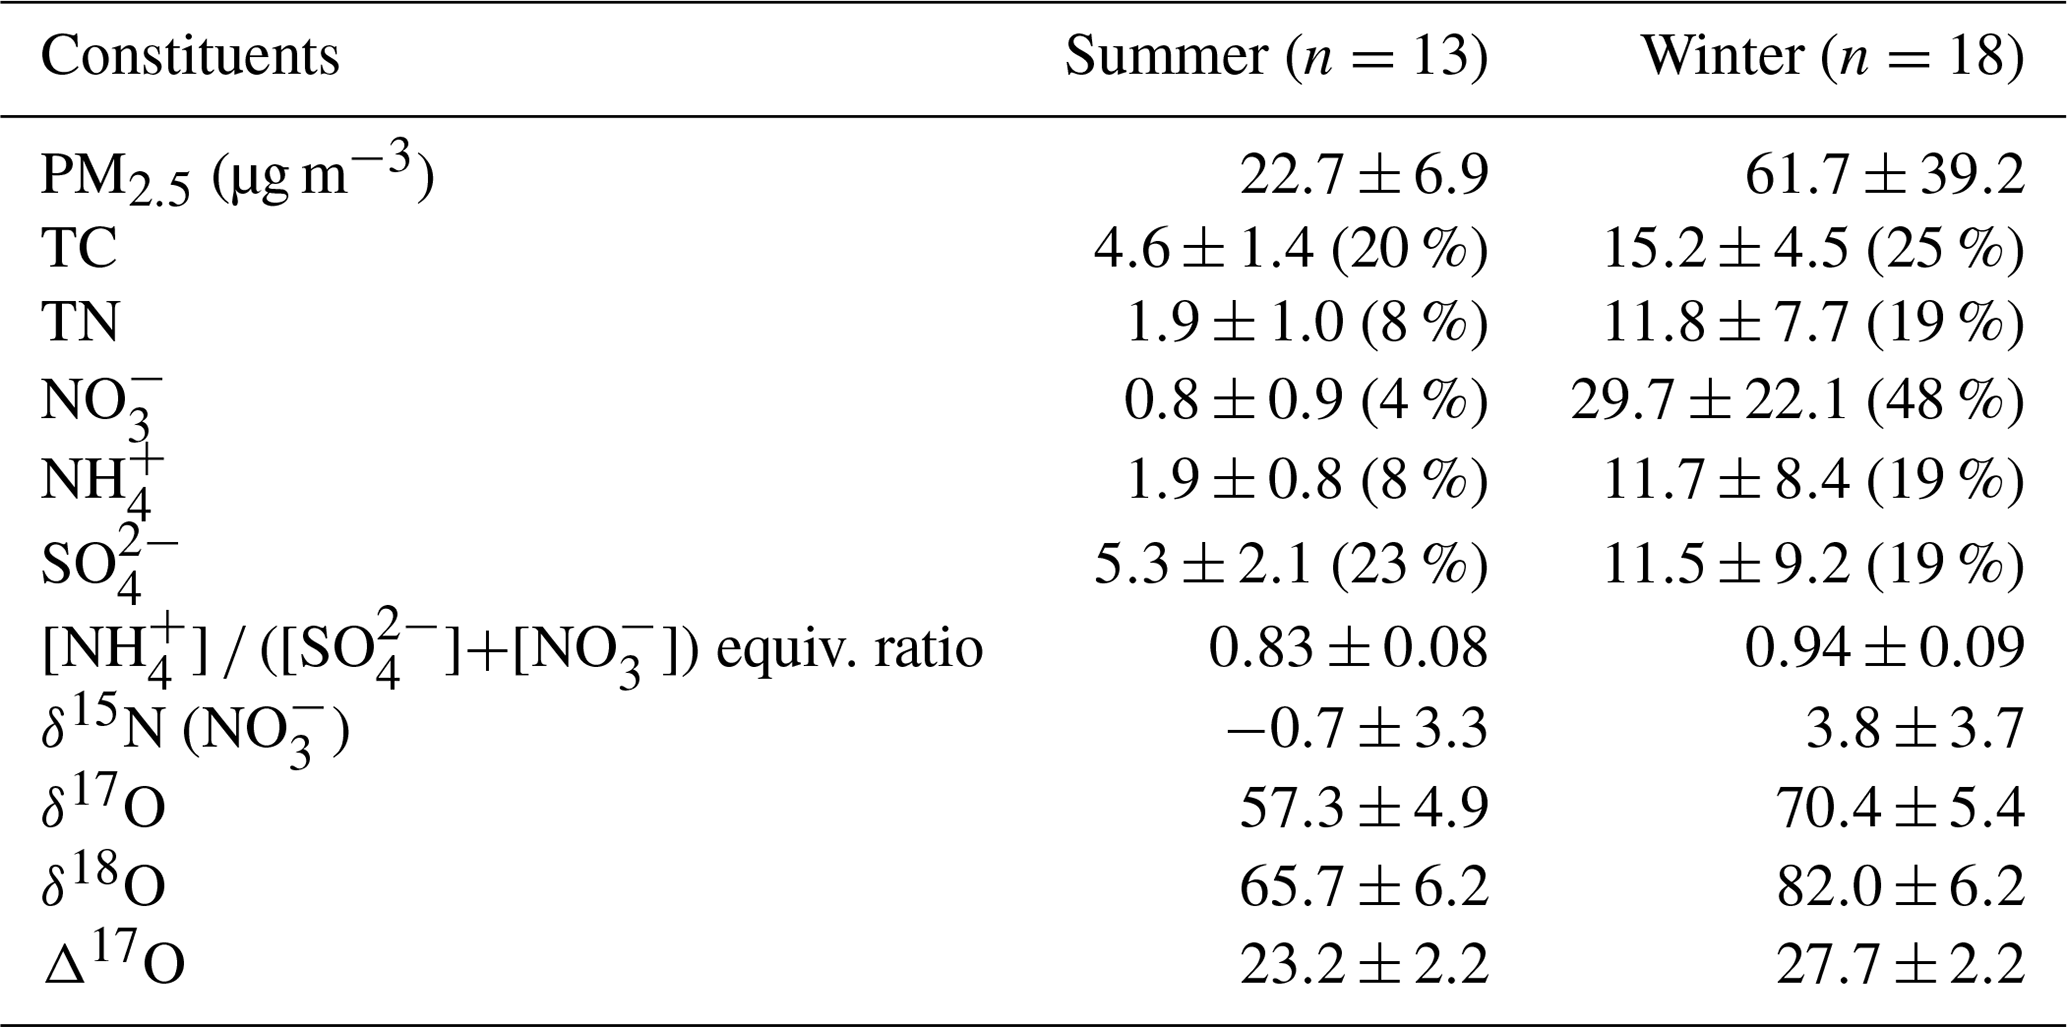
During the summer, PM2.5 concentration ranged from 7.5 to 34.5 µg m−3 with a mean of 22.7±6.9 µg m−3. The mean concentration of TC and TN was 4.6±1.4 µgC m−3 and 1.9±1.0 µgN m−3, respectively, resulting in the mean TC TN ratio of 2.7±2.0. The mass concentrations of all measured species were much higher in the winter, during which PM2.5 concentration was raised up to 139.0 from 10.6 µg m−3 with a mean of 61.7±39.2 µg m−3. Accordingly, the mean of TC and TN was 15.2±4.5 µgC m−3 and 11.8±7.7 µgN m−3, respectively, and the mean TC TN ratio of 0.9±0.7 was noticeably lower than that of the summer.
For the entire experiment, the mean mass fraction against PM2.5 was the highest for (26 % ± 23 %), followed by (20 % ± 1 %) and (14 % ± 1 %), highlighting the contribution of SIA to PM2.5 mass. The mass concentration varied from 0.2 to 69.3 µg m−3 with a mean of 17.6±22.1 µg m−3. Seasonally, the concentration was significantly higher in the winter (29.7±22.1 µg m−3) than summer (0.8±0.9 µg m−3). TN existed completely as inorganic N from both and during the winter (regression slope of 1.0). During the summer, and comprised 67 % of TN, and the rest (33 %) was assumed to be organic nitrogen (ON) components. In contrast, the mass fraction of against PM2.5 was higher in the summer (23 %) than winter (19 %). The seasonal characteristics of chemical composition imply the significant role of inorganic nitrogen species in PM2.5 mass increase in winter and ON and sulfate in summer.
Both δ15N () and Δ17O () exhibited an inverse correlation with ambient temperature ( and , respectively). The δ15N () exhibited higher values in winter with a weight mean of −0.7 ‰ ± 3.3 ‰ and 3.8 ‰ ± 3.7 ‰ in the summer and the winter, respectively. This seasonal pattern of δ15N () has been typically observed in East Asia regions (Li et al., 2019; Song et al., 2019; Zong et al., 2020). Analysis of backward air mass trajectory indicates that the lower and the upper bound of δ15N () were associated with air masses from the ocean by southerly and easterly winds in the summer and from Siberia by northerly winds in winter, respectively (Fig. S3 in the Supplement). In comparison with urban China (Fig. 2a), averaged summer δ15N () values were comparable between Seoul and all urban Chinese sites reported here, whereas in winter, δ15N () of Seoul was similar to that of Shanghai and Guangzhou rather than δ15N () of Beijing, which was higher than 10 ‰. Another observation at a mountain station in Taiwan shows that the highest δ15N () was found in spring when the level of anthropogenic constituents was elevated (Guha et al., 2017). These observations over East Asia may suggest to some extent that the seasonal pattern of δ15N () is basically associated with a synoptic meteorological condition that controls the type and strength of emission sources, where low and high δ15N () values indicate biogenic soil emissions and fossil combustion, respectively (Elliott et al., 2019).
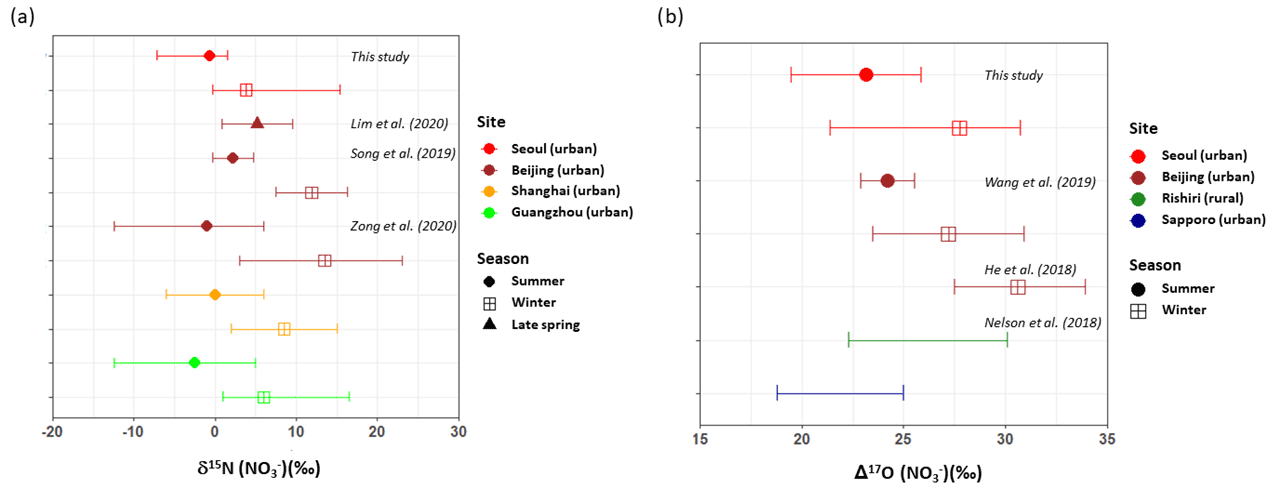
Figure 2(a) δ15N () and (b) Δ17O () PM2.5 observed in northeast Asia are compared: Seoul in this study (red); Beijing (brown), Shanghai (orange), and Guangzhou (light) in China; and Rishiri (green) and Sapporo (blue) in Japan during summer (circle) and winter (square). Annual ranges were presented for Rishiri and Sapporo. Marker indicates mean value (concentration-weighted average for Seoul samples of the present study), and lower and upper whiskers denote minimum and maximum values (this study; He et al., 2018; Lim et al., 2020; Nelson et al., 2018), mean ± SD (Song et al., 2019; Wang et al., 2019b), or 25th and 75th percentiles (Zong et al., 2020). Different marker shapes indicate different seasons.
Along with nitrogen isotope, heavier oxygen isotopes were also enriched in during the winter compared to the summer, when the weight-mean values of δ17O, δ18O, and Δ17O in were 70.4 ‰ ± 5.4 ‰, 82.0 ‰ ± 6.2 ‰, and 27.7 ‰ ± 2.2 ‰ for the winter and 57.3 ‰ ± 4.9 ‰, 65.7 ‰ ± 6.2 ‰, and 23.2 ‰ ± 2.2 ‰ for the summer. These results of high winter and low summer Δ17O () were consistent with previous observations at urban Beijing (He et al., 2018; Wang et al., 2019b; Fig. 2b), indicative of relatively greater contribution of nighttime oxidation pathways in winter. It is also noteworthy that our summer and winter Δ17O () values were similar to annual Δ17O () values of an urban (Sapporo) and a rural (Rishiri) site in Japan, respectively (Nelson et al., 2018). It is likely suggestive that the winter Δ17O value in Seoul has undergone a considerable atmospheric processing on a regional scale.
Given that PM2.5 concentrations reflect the seasonality, atmospheric chemical composition and meteorological properties were examined in relation to PM2.5 concentrations (Fig. 3). Clearly, for the winter samples with PM2.5 concentration greater than 40 µg m−3, meteorological conditions varied relative to low PM2.5 samples; relatively high temperature and RH staying at 0 to 10∘ and 45 % to 65 %, respectively, and a low wind speed of 1 to 2 m s−1, representing the meteorological characteristics of winter PM2.5 episodes. Particularly in winter, a strong linearity of PM2.5 was found with most chemical constituents considered in this study, such as SIA species, TN, NOR, and SOR (sulfur oxidation ratio). However, although elevated in level, NO2 and O3 mixing ratios showed non-linearity with PM2.5 concentrations. Isotope ratios were correlated either linearly or inversely with PM2.5 concentrations. In winter, Δ17O () showed the best correlation with PM2.5 concentrations, but δ15N () was inversely related with PM2.5 level.

Figure 3Relationships of PM2.5 mass concentration with meteorological parameters (a–c), concentrations of reactive gases (d–f, k) and aerosol chemical constituents (g–j, l–n), and N and O isotopic compositions (o–q) measured in Seoul during the summer (open circle) and the winter (blue ribbon).
3.2 Graphical representation of dual isotopes: Δ17O and δ15N of
The isotope ratios of source endmembers are scarce in the study region and in the aerosol measurements, and the isotope fractionation effect during gas-to-particle conversion is often estimated with thermodynamic constants and reasonable assumptions. In this regard, the graphical representation of dual isotopes enables the complex signatures of atmospheric samples to be distinguished and allows their oxidation processes to be constrained. Figure 4 displays measured δ15N () and Δ17O () coordinates with related chemical parameters in colors.
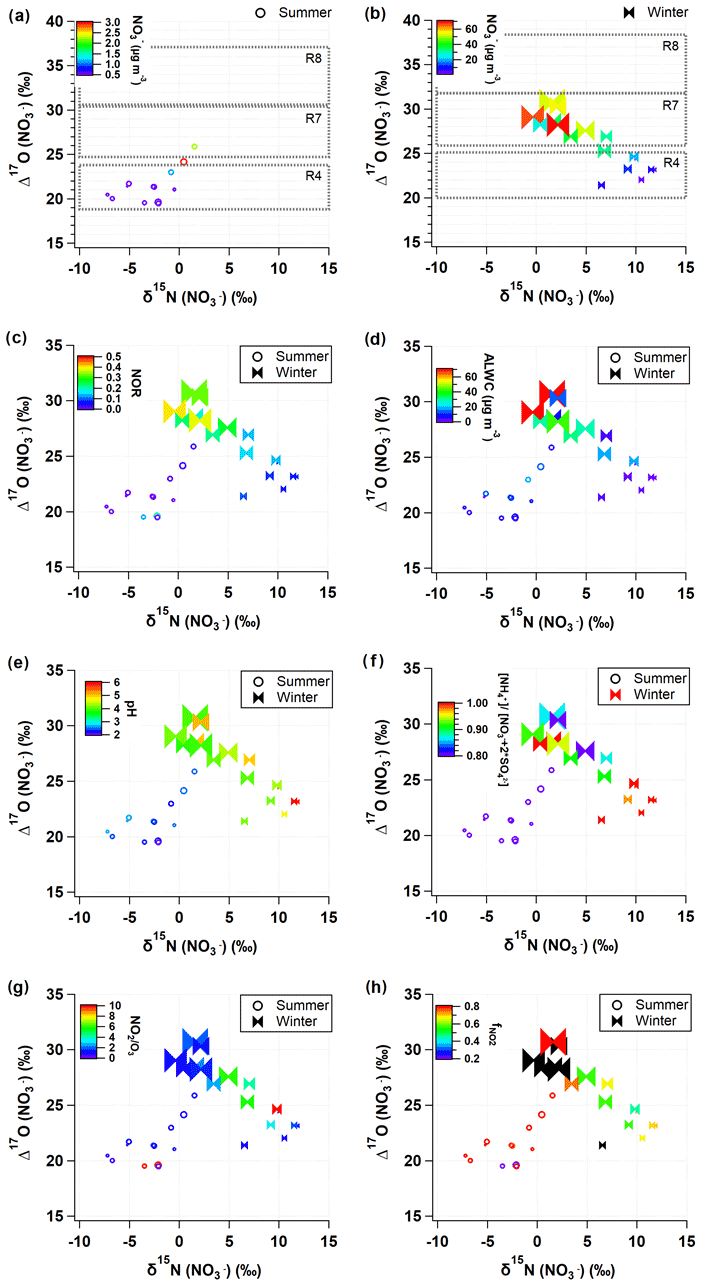
Figure 4Relationship of measured δ15N () and Δ17O () values with key parameters during the summer (open circle) and winter (closed ribbon). The predicted Δ17O () values are presented as dotted rectangles for the three major formation pathways (Reactions R4, R7, and R8; see Sect. 2.3.2 for details) in (a) summer and (b) winter. Data are color coded by (a, b) nitrate concentrations, (c) NOR, (d) ALWC, (e) pH, (f) equivalent ratio, (g) ratio, and (h) . Marker size is proportional to PM2.5 concentration ranging from 10 to 100 µg m−3.
In Fig. 4a and b, the range of Δ17O () endmembers for the three oxidation pathways calculated in Sect. 2.3.2 is presented by black dotted boxes, which are successfully distinguished. The Δ17O () values of all samples fell into the predicted ranges of the Δ17O endmembers but were separated into seasonal groups. Most of summer Δ17O () values indicate the Reaction (R4) pathway. It is in accordance with what has been reported in temperate areas during summer (Alexander et al., 2009; Michalski et al., 2003). In field measurements of δ15N () and δ18O () in Chinese cities, the proportional contribution of the OH-oxidation pathway was significantly correlated with latitudes (Zong et al., 2020), confirming the evidence of the formation through OH oxidation depending on UV radiation intensity.
In comparison, more than half of winter samples are located in the domains indicating Reactions (R7) and (R8) pathways. In particular, for winter samples with mass concentration higher than ∼30 µg m−3, Δ17O () values clearly represent the Reaction (R7) pathway. The winter Δ17O () was proportional to the NOR (Fig. 4c), which is indicative of the efficient conversion of NOx to via O3 oxidation pathways. In the summer periods when concentrations were relatively high (above ∼3 µg m−3), the contributions of O3 oxidation pathways became elevated, which is a similar pattern to what was observed in the winter. This result suggests that the O3 oxidation pathways are likely to be responsible for the rapid conversion of particulate observed during winter and summer PM2.5 episodes in the study region.
The formation of N2O5 Reaction (R6) is dependent on both NO2 and O3, which are reciprocally correlated in source regions. The equilibrium of Reaction (R6) shifts to N2O5 at low temperature, and its lifetime against photolysis is long under the low sunlight. For these reasons, the dark formation of Reaction (R7) would be favorable in urban outflows in winter. The hydrolysis of N2O5 on aerosol surface Reaction (R7) is highly dependent on RH, aerosol liquid water content (ALWC), and chemical composition (Hallquist et al., 2003; Wahner et al., 1998). To evaluate the Δ17O () signature observed, we calculated ALWC and acidity of aerosol, pH, using the ISORROPIA II model (Sect. 2.4). Given the high concentration of nano-particles from various sources in the urban areas, it is assured that aerosol surface is enough for the Reaction (R7) pathway. The calculated ALWC was higher by 90 % (19.1±22.8 µg m−3) in the winter and lower by 21 % (7.8±5.2 µg m−3) in the summer relative to the annual mean of the 2 years. When mass concentrations were greater than ∼3 µg m−3 in the summer and ∼30 µg m−3 in the winter, ALWC was 14.3 and 31.7 µg m−3, respectively, which were greater by 166 % and 183 % than the seasonal mean, respectively (Fig. 4d). Furthermore, the high Δ17O () and ALWC coincided with the lower bound (about 4) of winter pH varying from 4 to 6, whereas aerosol pH was 2–3 during the summer. The low aerosol pH concurrent with the high Δ17O () and ALWC is coherent with the aqueous-phase HNO3 formation on liquid aerosol through Reaction (R7).
While Δ17O () allows insights into the oxidation pathway of , δ15N () values are affected by various factors, most of which are not well constrained due to the complicated chemistry of nitrogen oxides in the Earth's environment. In this study, δ15N () variability versus PM2.5 concentration resembled the variability of NO2 versus PM2.5 concentration (Fig. 3f and o), implying a close link between NO2 oxidation and δ15N (). Therefore, in addition to the role of Δ17O () as a tracer of an oxidation pathway, we evaluated whether a variation of δ15N () indicates NOx oxidation efficiency between NO and NO2 (Freyer et al., 1993; Nelson et al., 2018; Walters et al., 2016). A possible effect on δ15N during NOx photochemical cycling cannot be predicted in the same way under varying conditions of NO, NO2, and O3 abundances. The shift in δ15N (NO2) relative to δ15N (NOx) in the atmosphere will change depending on and temperature-dependent (Freyer et al., 1993; Li et al., 2020; Walters et al., 2016). When O3 mixing ratio is high, NO is almost completely oxidized to NO2, leading to an increasing value, and the δ15N (NO2) should correspond to the δ15N of NOx sources (Freyer et al., 1993).
In the dual isotope coordinates of δ15N () and Δ17O () (Fig. 4), it is evident that the samples taken during a record-breaking winter's PM2.5 pollution events are associated with the lower bound values of δ15N () (−1 ‰ to 4 ‰) and the highest Δ17O () values (28 ‰ to 31 ‰). Simultaneous measurements of PM1 chemical composition in Seoul and Beijing demonstrated that the regionally processed air masses were long-range transported to Seoul within approximately 2 d during these episodes (H. Kim et al., 2020). Their ratio (1 to 2) was clearly lower with higher (0.7 to 0.8) compared to the other winter samples (Fig. 4g and h). This result implies that O3 level was high enough to efficiently oxidize NO to NO2 during the severe PM2.5 pollution events. In this condition, the shift in δ15N (NO2) relative to δ15N (NOx) is insignificant, and, consequently, δ15N (NO2) would be lower than those of other winter samples unless both emission sources and changed significantly. Considering that is the key driver of the high PM2.5 in Seoul, the higher degree of NOx oxidation efficiency is worth highlighting, in conjunction with a strong linear relationship between Δ17O () and NOR (Fig. 4c) revealing an efficient conversion of NO2 to through pathway Reactions (R5)+(R6)+(R7)+(R8) via O3.
3.3 Contributions of major HNO3 oxidation pathways
Combining the Δ17O () measurements and the calculation of Δ17O transferred from O3 to HNO3, the contributions of three major formation pathways were quantitatively accounted for, despite the inherent uncertainties in the calculation (Sect. 2.5).
pathway Reaction (R4) dominated the total formation (87 % ± 6 %) in summer. In contrast, the nighttime pathways through N2O5 and NO3 (pathways Reactions R7 and R8) were responsible for 24 % and 14 % of the formation in the winter, respectively. The contributions increased further to 40 % and 30 %, respectively, on haze days when PM2.5 concentration exceeded 75 µg m−3, the “very bad” alert of the national air quality standard. The significant nighttime oxidation of has been observed broadly at urban sites in northeast Asia. The results of this study are consistent with those conducted in Beijing, showing low Δ17O values in summertime (about 17 ‰ to 25 ‰) and substantially high Δ17O values (about 25 ‰ to 34 ‰ ) in wintertime when -driven PM2.5 haze pollution occurred (He et al., 2018; Song et al., 2020; Wang et al., 2019b). In general, nighttime pathways accounted for more than 60 % and up to 97 % in Beijing (He et al., 2018; Song et al., 2020; Wang et al., 2019b). From a global perspective, the chemical transport model demonstrated that N2O5 heterogeneous hydrolysis was of comparable importance to NO2+OH (41 %) for formation at below 1 km altitude (Alexander et al., 2020).
It is noteworthy that although the seasonal patterns are similar in northeast Asia, the average proportional contributions estimated from Δ17O () are highly sensitive to input parameters (i.e, and Δ17). In this study, the seasonal was assumed to be equal to those estimated for Beijing and set to 0.858±0.05 and 0.918±0.05 for the warm and cold months, respectively (Wang et al., 2019b), which are comparable to other estimates for Beijing (0.86) and Shanghai (0.97) (He et al., 2018, 2020) and the annual mean of 0.85 in a global model (Alexander et al., 2020).
The uncertainty associated with Δ17 has been recognized as the largest source of uncertainty in estimating production pathways from Δ17O () (Alexander et al., 2009, 2020). In this study, the Δ17 of 37.5 ‰ ± 2.2 ‰ was averaged from previous observations, corresponding to Δ17O-bulk O3 of 25 ‰ (Ishino et al., 2017; Vicars et al., 2012; Vicars and Savarino, 2014). Our mean Δ17 of 37.5 ‰ was 2.8 ‰ higher and 1.5 ‰ lower than what was used in the field studies (Song et al., 2020; Wang et al., 2019b) and other studies (He et al., 2018, 2020), respectively, for urban Beijing and Shanghai. When a sensitivity test was conducted for the proportional contribution of the three oxidation pathways, a 2.8 ‰ change in Δ17 value caused a 1.6 ‰, 2.1 ‰, and 2.5 ‰ change in the endmember for the pathways for Reactions (R4), (R7), and (R8), respectively. As a result, the average contribution of the nighttime pathways, including Reaction (R7) and Reaction (R8), increased to 23 % in summer and 65 % in winter. This suggests that a proper use of key parameters driving endmember values is a prerequisite for more realistic quantification of oxidation pathway contributions.
3.4 Major NOx emission sources
To investigate major emission sources of atmospheric NOx in Seoul, δ15N (NOx) in the atmosphere (δ15N (NOx)atmosphere) was estimated from measured δ15N () considering nitrogen isotopic fractionation effects (εN) based on a dual isotopes approach (Δ17O and δ15N). Estimated εN values were 5.9 ‰ ± 1.5 ‰ and 12.2 ‰± 0.5 ‰, and accordingly the δ15N (NOx)atmosphere was −8.7 ‰± 3.3 ‰ and −5.8 ‰± 4.2 ‰ in summer and winter, respectively. The larger winter εN reveals the enhanced contribution of the nighttime oxidation pathway via N2O5. As a result, a seasonal difference in δ15N (NOx)atmosphere was as small as 2.9 ‰ on average, which is suggestive of little seasonal difference in major NOx emission sources in Seoul.
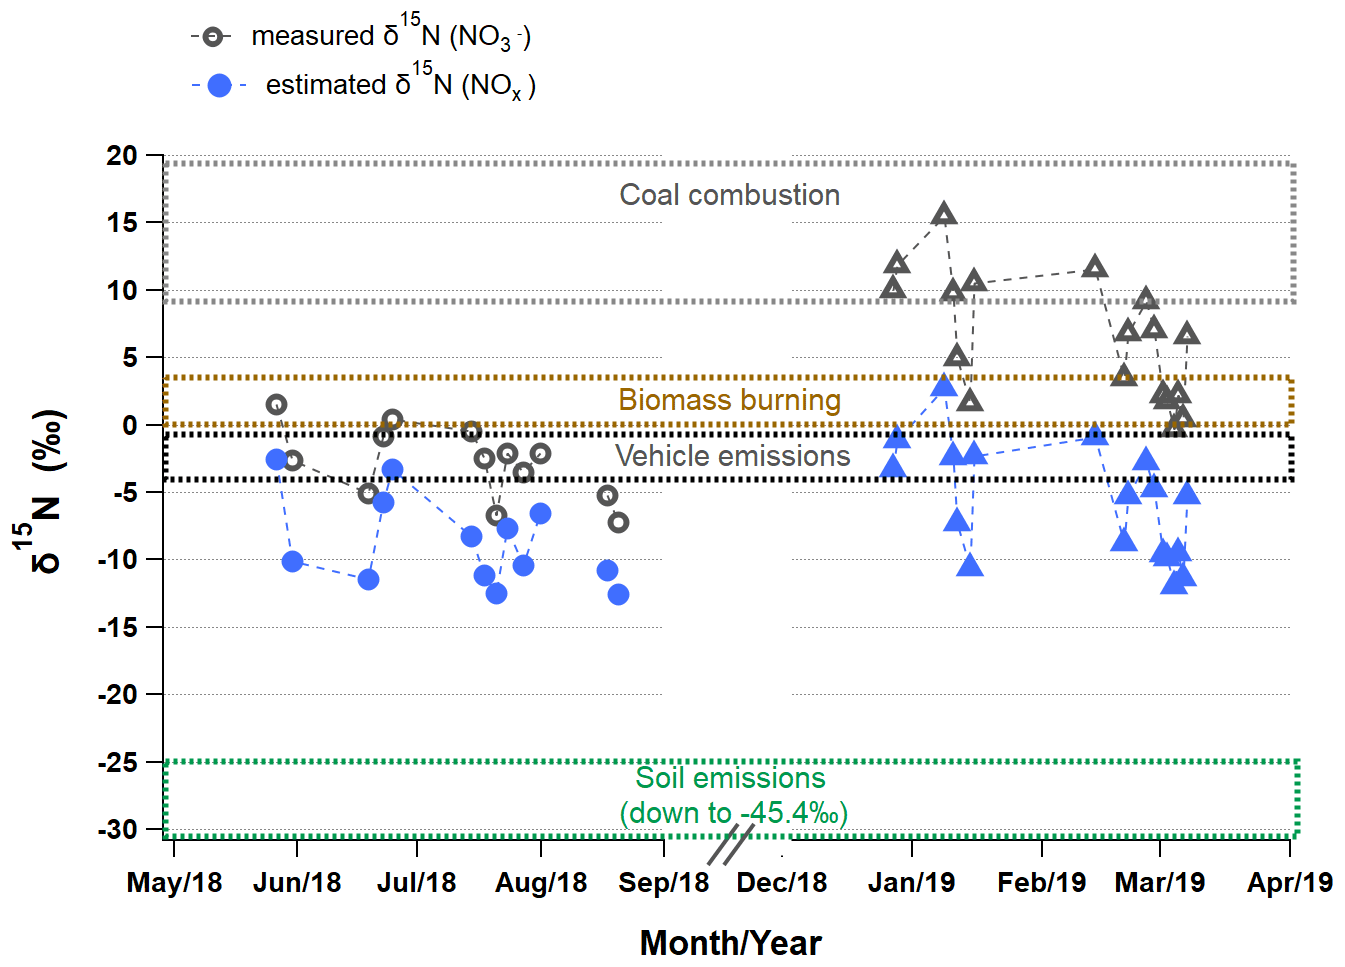
Figure 5Variations in measured δ15N () (open) and estimated δ15N (NOx)atmosphere (closed) in Seoul during the summer (circle) and winter (triangle). The δ15N (NOx) range (mean ± 1 SD) of source endmembers is distinguished by dotted boxes in different colors: coal combustion (14.2 ‰±4.5 ‰; Felix et al., 2012; Heaton, 1990), biomass burning (1.8 ‰ ± 1.8 ‰; Fibiger and Hastings, 2016), vehicle emissions (−2.5 ‰ ± 1.5 ‰; Walters et al., 2015), and biogenic soil emissions (−35.1 ‰ ± 10.2 ‰; Felix and Elliott, 2014; Li and Wang, 2008; Yu and Elliott, 2017).
Figure 5 displays the measured δ15N () and estimated δ15N (NOx)atmosphere of individual samples together with δ15N (NOx) domains of emission source endmembers reported in literature: biogenic soil (driven by fertilizer use, −35.1 ‰± 10.2 ‰; Felix and Elliott, 2014; Li and Wang, 2008; Yu and Elliott, 2017), biomass burning (1.8 ‰ ± 1.8 ‰; Fibiger and Hastings, 2016), vehicle emissions (−2.5 ‰ ± 1.5 ‰; Walters et al., 2015), and coal combustion (14.2 ‰ ± 4.5 ‰; Felix et al., 2012; Heaton, 1990). Both in summer and winter, δ15N (NOx)atmosphere values are the closest to the domain of vehicle emissions δ15N (NOx), highlighting the largest contribution of vehicle emissions to NOx in Seoul (Fig. 5). However, the winter δ15N () without isotope fractionation effect apparently points to coal emissions, which could lead to misleading conclusions about major NOx sources. This result is supported by a better correlation of NO2 with CO than with SO2 for both seasons. According to an (anthropogenic) bottom-up emissions inventory, the Clean Air Policy Support System (CAPSS), total mobile sources account for about two-thirds of NOx emissions in Korea, followed by combustion sources such as energy and manufacturing industries (33 %). The highest NO2 column densities are distinct in Seoul metropolitan areas, which is mostly due to the emissions from transportation (H. C. Kim et al., 2020). Our results of the isotope measurements are in fairly good agreement with the national emission inventories and satellite observations, highlighting the largest contribution of vehicle emissions to NOx sources in Seoul.
Other than vehicle emissions, the lower bound summer δ15N (NOx)atmosphere and the upper bound winter δ15N (NOx)atmosphere were relatively closer to the δ15N (NOx) of fertilized soil emissions and coal combustion, respectively. These seasonally distinct contributions from soil emissions and coal combustion were consistent with the results from previous studies conducted in China, revealing common seasonal emission characteristics on a regional scale in East Asia. It was evident that the upper bound winter δ15N (NOx)atmosphere coincided with an elevated mass ratio by 2–3 times. During these periods, trajectory analysis indicates that air masses originated from cold regions in northeastern China, such as Liaoning province, where heavy and coal-fired industries are located. In Beijing, located in northeastern China, coal combustion is an important fossil-fuel source as the highest contribution source to atmospheric NOx emissions during winter, about 30 % to 40 %, regardless of approaches used for estimating oxidation pathways, either Δ17O or δ18O (Li et al., 2019; Song et al., 2019, 2020; Zong et al., 2020). Thus, in this study, the upper bound winter δ15N (NOx)atmosphere suggests enhanced contributions of coal combustion to atmospheric NOx emissions. It is particularly noteworthy that the lower winter δ15N () and thus relatively lower contribution of coal combustion of the present study confirms the recent trend that emissions from coal combustion have been reduced in China (Cheng et al., 2019; Tong et al., 2018). Our study was conducted in later years (2018–2019) than their studies (2013–2017), in which δ15N () values were rather comparable to the winter mean δ15N () observed in Seoul during January 2014 to February 2016 (11.9 ‰ ± 2.5 ‰; Park et al., 2018). The lower bound of winter δ15N () values associated with the highest and PM2.5 concentrations (Figs. 3 and 4) was considered a result of complex effects of isotopic fractionation, as discussed above.
This study region is under the influence of various biomass burning sources throughout a year, such as agricultural combustion in the vicinities of Seoul and over eastern China from spring to fall (Chen et al., 2017; Zhao et al., 2017), wild fires over Siberia and the Russian Far East in summer (van der Werf et al., 2010), and residential biomass combustion for heating over east Asia in winter. Some winter δ15N (NOx)atmosphere values fell in the δ15N (NOx) range of biomass burning endmembers (Fibiger and Hastings, 2016; Fig. 5). When assessing contributions of biomass burning based on few endmember δ15N (NOx), however, caution should be exerted considering the fact that δ15N (NOx) varied among biomass types from −7 ‰ to 12 ‰ (Fibiger and Hastings, 2016), and there is currently a lack of understanding of biomass combustion that could potentially affect air quality in Seoul.
Our δ15N- and Δ17O-based study confirms that vehicle emissions are the main source of in PM2.5 in Seoul during the summer and the winter. In addition, the qualitative estimates of NOx emission sources provide suggestive evidence for enhanced contributions from coal combustion and biogenic soil emissions in the winter and the summer, respectively. Moreover, severe winter haze events with daily PM2.5 exceeding 100 µg m−3 were mainly driven by (up to ∼60 % in PM2.5). Reducing NOx emissions from vehicles is, therefore, essential for an effective mitigation measure to improve fine aerosol pollution in the study region. In particular, the highest PM2.5 was concurrent with the lowest δ15N () and the highest Δ17O () and NOR, revealing the efficient NO-to-NO2 conversion and heterogeneous conversion of HNO3 to particulate through the O3 oxidation pathway during the winter haze episodes. The multiple-isotope signatures of particulate , including 17O, 18O, and 15N, highlight the secondary nature of fine aerosol pollution intimately coupled with the photochemical oxidation process.
While our results demonstrate that δ15N and Δ17O are robust tracers for major NOx sources, quantitative source apportionment using the isotope method requires further elaboration of isotope equilibrium and/or kinetic fractionation effects involved in photochemical cycling of nitrogen oxides and δ15N of NOx source endmembers representing local or regional emissions in East Asia. In well-designed field studies, the δ15N and Δ17O measurements of multiphase and their vertical structures allow us to test the isotope fractionation effects suggested by laboratory experiments and theoretical calculations, as well as to characterize the atmospheric processing that influences them. In addition, there is an urgent need to document the δ15N (NOx) values of emissions from vehicles with/without selective catalytic reduction (SCR) and from biomass combustion as a function of biomass type and combustion conditions. Consequently, a comprehensive and quantitative understanding of the oxidation pathways and emission sources of nitrogen oxides using δ15N and Δ17O measurements will be able to elucidate the detailed mechanisms driving severe haze development in megacities of northeast Asia, including Seoul.
Data used in this study are available upon request to the corresponding author.
The supplement related to this article is available online at: https://doi.org/10.5194/acp-22-5099-2022-supplement.
SL and ML conceived the project and carried out the aerosol sampling and the analysis of aerosol chemical compositions. SL conceptualized and wrote the article. ML supervised the study and wrote the article. JS conducted stable isotope analysis on the samples and helped SL in interpreting the results. The results of the study were discussed by all authors but especially by PL.
The contact author has declared that neither they nor their co-authors have any competing interests.
Publisher's note: Copernicus Publications remains neutral with regard to jurisdictional claims in published maps and institutional affiliations.
This article is part of the special issue “Effect of Megacities on the Transport and Transformation of Pollutants at Regional and Global Scales (EMeRGe) (ACP/AMT inter-journal SI)”. It is not associated with a conference.
This research was supported by the National Strategic Project Fine Particle of the National Research Foundation of Korea (NRF), funded by the Ministry of Science and ICT (MSIT), Ministry of Environment (ME), and Ministry of Health and Welfare (MOHW) (grant no. 2017M3D8A1092015). Funding to Saehee Lim was provided by the National Research Foundation of Korea (NRF) from the Ministry of Science and ICT (grant no. 2018R1D1A1B07050849). Meehye Lee thanks for the support from NRF (grant no. 2020R1A2C3014592). Joel Savarino thanks the French National Research Agency (Investissements d'avenir grant no. ANR-15-IDEX-02) and the INSU program LEFE-CHAT for supporting the stable isotope laboratory. This is publication 4 of PANDA platform on which isotope analyses were performed. The authors especially thank Nicolas Caillon for performing the analysis of the ammonium–nitrogen isotope ratio. The authors thank the Korea National Institute of Environmental Research (NIER) and Korea Meteorological Administration (KMA) for their monitoring data used in this study.
This research has been supported by the National Research Foundation of Korea (grant nos. 2017M3D8A1092015, 2018R1D1A1B07050849, and 2020R1A2C3014592).
This paper was edited by Manabu Shiraiwa and reviewed by two anonymous referees.
Alexander, B., Hastings, M. G., Allman, D. J., Dachs, J., Thornton, J. A., and Kunasek, S. A.: Quantifying atmospheric nitrate formation pathways based on a global model of the oxygen isotopic composition (Δ17O) of atmospheric nitrate, Atmos. Chem. Phys., 9, 5043–5056, https://doi.org/10.5194/acp-9-5043-2009, 2009.
Alexander, B., Sherwen, T., Holmes, C. D., Fisher, J. A., Chen, Q., Evans, M. J., and Kasibhatla, P.: Global inorganic nitrate production mechanisms: comparison of a global model with nitrate isotope observations, Atmos. Chem. Phys., 20, 3859–3877, https://doi.org/10.5194/acp-20-3859-2020, 2020.
Carslaw, D. C. and Ropkins, K.: openair – An R package for air quality data analysis, Environ. Model. Softw., 27–28, 52–61, https://doi.org/10.1016/j.envsoft.2011.09.008, 2012.
Casciotti, K. L., Sigman, D. M., Hastings, M. G., Bohlke, J. K., and Hilkert, A.: Measurement of the oxygen isotopic composition of nitrate in seawater and freshwater using the denitrifier method, Anal. Chem., 74, 4905–4912, https://doi.org/10.1021/ac020113w, 2002.
Chen, J., Li, C., Ristovski, Z., Milic, A., Gu, Y., Islam, M. S., Wang, S., Hao, J., Zhang, H., He, C., Guo, H., Fu, H., Miljevic, B., Morawska, L., Thai, P., LAM, Y. F., Pereira, G., Ding, A., Huang, X., and Dumka, U. C.: A review of biomass burning: Emissions and impacts on air quality, health and climate in China, Sci. Total Environ., 579, 1000–1034, https://doi.org/10.1016/j.scitotenv.2016.11.025, 2017.
Cheng, J., Su, J., Cui, T., Li, X., Dong, X., Sun, F., Yang, Y., Tong, D., Zheng, Y., Li, Y., Li, J., Zhang, Q., and He, K.: Dominant role of emission reduction in PM2.5 air quality improvement in Beijing during 2013–2017: a model-based decomposition analysis, Atmos. Chem. Phys., 19, 6125–6146, https://doi.org/10.5194/acp-19-6125-2019, 2019
Elliott, E. M., Yu, Z., Cole, A. S., and Coughlin, J. G.: Isotopic advances in understanding reactive nitrogen deposition and atmospheric processing, Sci. Total Environ., 662, 393–403, https://doi.org/10.1016/J.SCITOTENV.2018.12.177, 2019.
Felix, J. D. and Elliott, E. M.: Isotopic composition of passively collected nitrogen dioxide emissions: Vehicle, soil and livestock source signatures, Atmos. Environ., 92, 359–366, https://doi.org/10.1016/j.atmosenv.2014.04.005, 2014.
Felix, J. D., Elliott, E. M., and Shaw, S. L.: Nitrogen Isotopic Composition of Coal-Fired Power Plant NOx: Influence of Emission Controls and Implications for Global Emission Inventories, Environ. Sci. Technol., 46, 3528–3535, https://doi.org/10.1021/es203355v, 2012.
Fibiger, D. L. and Hastings, M. G.: First Measurements of the Nitrogen Isotopic Composition of NOx from Biomass Burning, Environ. Sci. Technol., 50, 11569–11574, https://doi.org/10.1021/acs.est.6b03510, 2016.
Fountoukis, C. and Nenes, A.: ISORROPIA II: a computationally efficient thermodynamic equilibrium model for K+–Ca2+–Mg2+––Na+–––Cl−–H2O aerosols, Atmos. Chem. Phys., 7, 4639–4659, https://doi.org/10.5194/acp-7-4639-2007, 2007.
Freyer, H. D.: Seasonal variation of 15N 14N ratios in atmospheric nitrate species, Tellus B, 43, 30–44, https://doi.org/10.1034/j.1600-0889.1991.00003.x, 1991.
Freyer, H. D., Kley, D., Volz-Thomas, A., and Kobel, K.: On the interaction of isotopic exchange processes with photochemical reactions in atmospheric oxides of nitrogen, J. Geophys. Res., 98, 14791, https://doi.org/10.1029/93JD00874, 1993.
Goldberg, D. L., Saide, P. E., Lamsal, L. N., de Foy, B., Lu, Z., Woo, J.-H., Kim, Y., Kim, J., Gao, M., Carmichael, G., and Streets, D. G.: A top-down assessment using OMI NO2 suggests an underestimate in the NOx emissions inventory in Seoul, South Korea, during KORUS-AQ, Atmos. Chem. Phys., 19, 1801–1818, https://doi.org/10.5194/acp-19-1801-2019, 2019.
Guha, T., Lin, C. T., Bhattacharya, S. K., Mahajan, A. S., Ou-Yang, C.-F., Lan, Y.-P., Hsu, S. C., and Liang, M.-C.: Isotopic ratios of nitrate in aerosol samples from Mt. Lulin, a high-altitude station in Central Taiwan, Atmos. Environ., 154, 53–69, https://doi.org/10.1016/J.ATMOSENV.2017.01.036, 2017.
Hallquist, M., Stewart, D. J., Stephenson, S. K., and Anthony Cox, R.: Hydrolysis of N2O5 on sub-micron sulfate aerosols, Phys. Chem. Chem. Phys., 5, 3453, https://doi.org/10.1039/b301827j, 2003.
He, P., Xie, Z., Chi, X., Yu, X., Fan, S., Kang, H., Liu, C., and Zhan, H.: Atmospheric Δ17O() reveals nocturnal chemistry dominates nitrate production in Beijing haze, Atmos. Chem. Phys., 18, 14465–14476, https://doi.org/10.5194/acp-18-14465-2018, 2018.
He, P., Xie, Z., Yu, X., Wang, L., Kang, H., and Yue, F.: The observation of isotopic compositions of atmospheric nitrate in Shanghai China and its implication for reactive nitrogen chemistry, Sci. Total Environ., 714, 136727, https://doi.org/10.1016/J.SCITOTENV.2020.136727, 2020.
Heaton, T. H. E.: ratios of NOx from vehicle engines and coal-fired power stations, Tellus B, 42, 304–307, https://doi.org/10.1034/j.1600-0889.1990.00007.x-i1, 1990.
Ishino, S., Hattori, S., Savarino, J., Jourdain, B., Preunkert, S., Legrand, M., Caillon, N., Barbero, A., Kuribayashi, K., and Yoshida, N.: Seasonal variations of triple oxygen isotopic compositions of atmospheric sulfate, nitrate, and ozone at Dumont d'Urville, coastal Antarctica, Atmos. Chem. Phys., 17, 3713–3727, https://doi.org/10.5194/acp-17-3713-2017, 2017.
Kaiser, J., Hastings, M. G., Houlton, B. Z., Rockmann, T., and Sigman, D. M.: Triple oxygen isotope analysis of nitrate using the denitrifier method and thermal decomposition of N2O, Anal. Chem., 79, 599–607, https://doi.org/10.1021/ac061022s, 2007.
Kamezaki, K., Hattori, S., Iwamoto, Y., Ishino, S., Furutani, H., Miki, Y., Uematsu, M., Miura, K., and Yoshida, N.: Tracing the sources and formation pathways of atmospheric particulate nitrate over the Pacific Ocean using stable isotopes, Atmos. Environ., 209, 152–166, https://doi.org/10.1016/J.ATMOSENV.2019.04.026, 2019.
Kang, H., Zhu, B., Gao, J., He, Y., Wang, H., Su, J., Pan, C., Zhu, T., and Yu, B.: Potential impacts of cold frontal passage on air quality over the Yangtze River Delta, China, Atmos. Chem. Phys., 19, 3673–3685, https://doi.org/10.5194/acp-19-3673-2019, 2019.
Kim, H., Zhang, Q., and Sun, Y.: Measurement report: Characterization of severe spring haze episodes and influences of long-range transport in the Seoul metropolitan area in March 2019, Atmos. Chem. Phys., 20, 11527–11550, https://doi.org/10.5194/acp-20-11527-2020, 2020.
Kim, H. C., Kim, S., Lee, S.-H., Kim, B.-U., and Lee, P.: Fine-Scale Columnar and Surface NOx Concentrations over South Korea: Comparison of Surface Monitors, TROPOMI, CMAQ and CAPSS Inventory, Atmosphere-Basel, 11, 101, https://doi.org/10.3390/atmos11010101, 2020.
Kim, S.-W., Yoon, S.-C., Kim, J., and Kim, S.-Y.: Seasonal and monthly variations of columnar aerosol optical properties over east Asia determined from multi-year MODIS, LIDAR, and AERONET Sun/sky radiometer measurements, Atmos. Environ., 41, 1634–1651, https://doi.org/10.1016/j.atmosenv.2006.10.044, 2007.
Lee, H.-J., Jo, H.-Y., Kim, S.-W., Park, M.-S., and Kim, C.-H.: Impacts of atmospheric vertical structures on transboundary aerosol transport from China to South Korea, Sci. Rep., 9, 13040, https://doi.org/10.1038/s41598-019-49691-z, 2019.
Lelieveld, J., Evans, J. S., Fnais, M., Giannadaki, D., and Pozzer, A.: The contribution of outdoor air pollution sources to premature mortality on a global scale, Nature, 525, 367–371, https://doi.org/10.1038/nature15371, 2015.
Li, D. and Wang, X.: Nitrogen isotopic signature of soil-released nitric oxide (NO) after fertilizer application, Atmos. Environ., 42, 4747–4754, https://doi.org/10.1016/j.atmosenv.2008.01.042, 2008.
Li, H., Zhang, Q., Zheng, B., Chen, C., Wu, N., Guo, H., Zhang, Y., Zheng, Y., Li, X., and He, K.: Nitrate-driven urban haze pollution during summertime over the North China Plain, Atmos. Chem. Phys., 18, 5293–5306, https://doi.org/10.5194/acp-18-5293-2018, 2018.
Li, J., Zhang, X., Orlando, J., Tyndall, G., and Michalski, G.: Quantifying the nitrogen isotope effects during photochemical equilibrium between NO and NO2: implications for Δ15N in tropospheric reactive nitrogen, Atmos. Chem. Phys., 20, 9805–9819, https://doi.org/10.5194/acp-20-9805-2020, 2020.
Li, J., Davy, P., Harvey, M., Katzman, T., Mitchell, T., and Michalski, G.: Nitrogen isotopes in nitrate aerosols collected in the remote marine boundary layer: Implications for nitrogen isotopic fractionations among atmospheric reactive nitrogen species, Atmos. Environ., 245, 118028, https://doi.org/10.1016/j.atmosenv.2020.118028, 2021.
Li, Z., Walters, W. W., Hastings, M. G., Zhang, Y., Song, L., Liu, D., Zhang, W., Pan, Y., Fu, P., and Fang, Y.: Nitrate Isotopic Composition in Precipitation at a Chinese Megacity: Seasonal Variations, Atmospheric Processes, and Implications for Sources, Earth Sp. Sci., 6, 2200–2213, https://doi.org/10.1029/2019EA000759, 2019.
Lim, S., Lee, M., Czimczik, C. I., Joo, T., Holden, S., Mouteva, G., Santos, G. M., Xu, X., Walker, J., Kim, S., Kim, H. S., Kim, S., and Lee, S.: Source signatures from combined isotopic analyses of PM2.5 carbonaceous and nitrogen aerosols at the peri-urban Taehwa Research Forest, South Korea in summer and fall, Sci. Total Environ., 655, 1505–1514, https://doi.org/10.1016/j.scitotenv.2018.11.157, 2019.
Lim, S., Yang, X., Lee, M., Li, G., Gao, Y., Shang, X., Zhang, K., Czimczik, C. I., Xu, X., Bae, M.-S., Moon, K.-J., and Jeon, K.: Fossil-driven secondary inorganic PM2.5 enhancement in the North China Plain: Evidence from carbon and nitrogen isotopes, Environ. Pollut., 266, 115163, https://doi.org/10.1016/J.ENVPOL.2020.115163, 2020.
Liu, Z., Gao, W., Yu, Y., Hu, B., Xin, J., Sun, Y., Wang, L., Wang, G., Bi, X., Zhang, G., Xu, H., Cong, Z., He, J., Xu, J., and Wang, Y.: Characteristics of PM2.5 mass concentrations and chemical species in urban and background areas of China: emerging results from the CARE-China network, Atmos. Chem. Phys., 18, 8849–8871, https://doi.org/10.5194/acp-18-8849-2018, 2018.
McIlvin, M. R. and Casciotti, K. L.: Technical updates to the bacterial method for nitrate isotopic analyses, Anal. Chem., 83, 1850–1856, https://doi.org/10.1021/AC1028984, 2011.
Michalski, G. and Bhattacharya, S. K.: The role of symmetry in the mass independent isotope effect in ozone, P. Natl. Acad. Sci. USA, 106, 5493–5496, https://doi.org/10.1073/PNAS.0812755106, 2009.
Michalski, G., Scott, Z., Kabiling, M., and Thiemens, M. H.: First measurements and modeling of Δ17O in atmospheric nitrate, Geophys. Res. Lett., 30, 1870, https://doi.org/10.1029/2003GL017015, 2003.
Michalski, G., Meixner, T., Fenn, M., Hernandez, L., Sirulnik, A., Edith Allen, A., and Thiemens, M.: Tracing Atmospheric Nitrate Deposition in a Complex Semiarid Ecosystem Using Δ17O, Environ. Sci. Technol., 38, 2175–2181, https://doi.org/10.1021/ES034980+, 2004.
Morin, S., Savarino, J., Frey, M. M., Domine, F., Jacobi, H.-W., Kaleschke, L., and Martins, J. M. F.: Comprehensive isotopic composition of atmospheric nitrate in the Atlantic Ocean boundary layer from 65∘ S to 79∘ N, J. Geophys. Res., 114, D05303, https://doi.org/10.1029/2008JD010696, 2009.
Morin, S., Sander, R., and Savarino, J.: Simulation of the diurnal variations of the oxygen isotope anomaly (Δ17O) of reactive atmospheric species, Atmos. Chem. Phys., 11, 3653–3671, https://doi.org/10.5194/acp-11-3653-2011, 2011.
Nelson, D. M., Tsunogai, U., Ding, D., Ohyama, T., Komatsu, D. D., Nakagawa, F., Noguchi, I., and Yamaguchi, T.: Triple oxygen isotopes indicate urbanization affects sources of nitrate in wet and dry atmospheric deposition, Atmos. Chem. Phys., 18, 6381–6392, https://doi.org/10.5194/acp-18-6381-2018, 2018.
Park, Y., Park, K., Kim, H., Yu, S., Noh, S., Kim, M., Kim, J., Ahn, J., Lee, M., Seok, K., and Kim, Y.: Characterizing isotopic compositions of TC−C, , and in PM2.5 in South Korea: Impact of China's winter heating, Environ. Pollut., 233, 735–744, https://doi.org/10.1016/J.ENVPOL.2017.10.072, 2018.
Parnell, A. C., Inger, R., Bearhop, S., and Jackson, A. L.: Source Partitioning Using Stable Isotopes: Coping with Too Much Variation, PLoS One, 5, e9672, https://doi.org/10.1371/journal.pone.0009672, 2010.
Parnell, A. C., Phillips, D. L., Bearhop, S., Semmens, B. X., Ward, E. J., Moore, J. W., Jackson, A. L., Grey, J., Kelly, D. J., and Inger, R.: Bayesian stable isotope mixing models, Environmetrics, 24, 387–399, https://doi.org/10.1002/env.2221, 2013.
Quan, J., Dou, Y., Zhao, X., Liu, Q., Sun, Z., Pan, Y., Jia, X., Cheng, Z., Ma, P., Su, J., Xin, J., and Liu, Y.: Regional atmospheric pollutant transport mechanisms over the North China Plain driven by topography and planetary boundary layer processes, Atmos. Environ., 221, 117098, https://doi.org/10.1016/J.ATMOSENV.2019.117098, 2020.
Rose, L. A., Yu, Z., Bain, D. J., and Elliott, E. M.: High resolution, extreme isotopic variability of precipitation nitrate, Atmos. Environ., 207, 63–74, https://doi.org/10.1016/J.ATMOSENV.2019.03.012, 2019.
Saunders, S. M., Jenkin, M. E., Derwent, R. G., and Pilling, M. J.: Protocol for the development of the Master Chemical Mechanism, MCM v3 (Part A): tropospheric degradation of non-aromatic volatile organic compounds, Atmos. Chem. Phys., 3, 161–180, https://doi.org/10.5194/acp-3-161-2003, 2003.
Savarino, J., Kaiser, J., Morin, S., Sigman, D. M., and Thiemens, M. H.: Nitrogen and oxygen isotopic constraints on the origin of atmospheric nitrate in coastal Antarctica, Atmos. Chem. Phys., 7, 1925–1945, https://doi.org/10.5194/acp-7-1925-2007, 2007.
Savarino, J., Morin, S., Erbland, J., Grannec, F., Patey, M. D., Vicars, W., Alexander, B., and Achterberg, E. P.: Isotopic composition of atmospheric nitrate in a tropical marine boundary layer., P. Natl. Acad. Sci. USA, 110, 17668–73, https://doi.org/10.1073/pnas.1216639110, 2013.
Shao, P., Tian, H., Sun, Y., Liu, H., Wu, B., Liu, S., Liu, X., Wu, Y., Liang, W., Wang, Y., Gao, J., Xue, Y., Bai, X., Liu, W., Lin, S., and Hu, G.: Characterizing remarkable changes of severe haze events and chemical compositions in multi-size airborne particles (PM1, PM2.5 and PM10) from January 2013 to 2016–2017 winter in Beijing, China, Atmos. Environ., 189, 133–144, https://doi.org/10.1016/J.ATMOSENV.2018.06.038, 2018.
Sharma, H. D., Jervis, R. E., and Wong, K. Y.: Isotopic exchange reactions in nitrogen oxides, J. Phys. Chem., 74, 923–933, https://doi.org/10.1021/j100699a044, 1970.
Shi, C., Nduka, I. C., Yang, Y., Huang, Y., Yao, R., Zhang, H., He, B., Xie, C., Wang, Z., and Yim, S. H. L.: Characteristics and meteorological mechanisms of transboundary air pollution in a persistent heavy PM2.5 pollution episode in Central-East China, Atmos. Environ., 223, 117239, https://doi.org/10.1016/J.ATMOSENV.2019.117239, 2020.
Song, W., Wang, Y.-L., Yang, W., Sun, X.-C., Tong, Y.-D., Wang, X.-M., Liu, C.-Q., Bai, Z.-P., and Liu, X.-Y.: Isotopic evaluation on relative contributions of major NOx sources to nitrate of PM2.5 in Beijing, Environ. Pollut., 248, 183–190, https://doi.org/10.1016/J.ENVPOL.2019.01.081, 2019.
Song, W., Liu, X.-Y., Wang, Y.-L., Tong, Y.-D., Bai, Z.-P., and Liu, C.-Q.: Nitrogen isotope differences between atmospheric nitrate and corresponding nitrogen oxides: A new constraint using oxygen isotopes, Sci. Total Environ., 701, 134515, https://doi.org/10.1016/J.SCITOTENV.2019.134515, 2020.
Stein, A. F., Draxler, R. R., Rolph, G. D., Stunder, B. J. B., Cohen, M. D., and Ngan, F.: NOAA's HYSPLIT Atmospheric Transport and Dispersion Modeling System, B. Am. Meteorol. Soc., 96, 2059–2077, https://doi.org/10.1175/BAMS-D-14-00110.1, 2015.
Thiemens, M. H.: Mass-Independent Isotope Effects in Planetary Atmospheres and the Early Solar System, Science, 283, 341–345, https://doi.org/10.1126/science.283.5400.341, 1999.
Thiemens, M. H.: HISTORY AND APPLICATIONS OF MASS-INDEPENDENT ISOTOPE EFFECTS, Annu. Rev. Earth Planet. Sci., 34, 217–262, https://doi.org/10.1146/annurev.earth.34.031405.125026, 2006.
Tong, D., Zhang, Q., Liu, F., Geng, G., Zheng, Y., Xue, T., Hong, C., Wu, R., Qin, Y., Zhao, H., Yan, L., and He, K.: Current Emissions and Future Mitigation Pathways of Coal-Fired Power Plants in China from 2010 to 2030, Environ. Sci. Technol., 52, 12905–12914, https://doi.org/10.1021/acs.est.8b02919, 2018.
van der Werf, G. R., Randerson, J. T., Giglio, L., Collatz, G. J., Mu, M., Kasibhatla, P. S., Morton, D. C., DeFries, R. S., Jin, Y., and van Leeuwen, T. T.: Global fire emissions and the contribution of deforestation, savanna, forest, agricultural, and peat fires (1997–2009), Atmos. Chem. Phys., 10, 11707–11735, https://doi.org/10.5194/acp-10-11707-2010, 2010.
Vicars, W. C. and Savarino, J.: Quantitative constraints on the 17O-excess (Δ17O) signature of surface ozone: Ambient measurements from 50∘ N to 50∘ S using the nitrite-coated filter technique, Geochim. Cosmochim. Acta, 135, 270–287, https://doi.org/10.1016/J.GCA.2014.03.023, 2014.
Vicars, W. C., Bhattacharya, S. K., Erbland, J., and Savarino, J.: Measurement of the 17O-excess (Δ17O) of tropospheric ozone using a nitrite-coated filter, Rapid Commun. Mass Spectrom., 26, 1219–1231, https://doi.org/10.1002/rcm.6218, 2012.
Wahner, A., Mentel, T. F., Sohn, M., and Stier, J.: Heterogeneous reaction of N2O5 on sodium nitrate aerosol, J. Geophys. Res. Atmos., 103, 31103–31112, https://doi.org/10.1029/1998JD100022, 1998.
Walters, W. W. and Michalski, G.: Theoretical calculation of nitrogen isotope equilibrium exchange fractionation factors for various NOy molecules, Geochim. Cosmochim. Acta, 164, 284–297, https://doi.org/10.1016/J.GCA.2015.05.029, 2015.
Walters, W. W. and Michalski, G.: Theoretical calculation of oxygen equilibrium isotope fractionation factors involving various NO molecules, OH, and H2O and its implications for isotope variations in atmospheric nitrate, Geochim. Cosmochim. Acta, 191, 89–101, https://doi.org/10.1016/j.gca.2016.06.039, 2016.
Walters, W. W., Goodwin, S. R., and Michalski, G.: Nitrogen Stable Isotope Composition (δ15N) of Vehicle-Emitted NOx, Environ. Sci. Technol., 49, 2278–2285, https://doi.org/10.1021/es505580v, 2015.
Walters, W. W., Simonini, D. S., and Michalski, G.: Nitrogen isotope exchange between NO and NO2 and its implications for δ15N variations in tropospheric NOx and atmospheric nitrate, Geophys. Res. Lett., 43, 440–448, https://doi.org/10.1002/2015GL066438, 2016.
Walters, W. W., Fang, H., and Michalski, G.: Summertime diurnal variations in the isotopic composition of atmospheric nitrogen dioxide at a small midwestern United States city, Atmos. Environ., 179, 1–11, https://doi.org/10.1016/J.ATMOSENV.2018.01.047, 2018.
Wang, Y., Wang, Y., Wang, L., Petäjä, T., Zha, Q., Gong, C., Li, S., Pan, Y., Hu, B., Xin, J., and Kulmala, M.: Increased inorganic aerosol fraction contributes to air pollution and haze in China, Atmos. Chem. Phys., 19, 5881–5888, https://doi.org/10.5194/acp-19-5881-2019, 2019a.
Wang, Y., Song, W., Yang, W., Sun, X., Tong, Y., Wang, X., Liu, C., Bai, Z., and Liu, X.: Influences of Atmospheric Pollution on the Contributions of Major Oxidation Pathways to PM 2.5 Nitrate Formation in Beijing, J. Geophys. Res. Atmos., 124, 4174–4185, https://doi.org/10.1029/2019JD030284, 2019b.
Xie, Y., Dai, H., Zhang, Y., Wu, Y., Hanaoka, T., and Masui, T.: Comparison of health and economic impacts of PM2.5 and ozone pollution in China, Environ. Int., 130, 104881, https://doi.org/10.1016/J.ENVINT.2019.05.075, 2019.
Xu, W., Sun, Y., Wang, Q., Zhao, J., Wang, J., Ge, X., Xie, C., Zhou, W., Du, W., Li, J., Fu, P., Wang, Z., Worsnop, D. R., and Coe, H.: Changes in Aerosol Chemistry From 2014 to 2016 in Winter in Beijing: Insights From High-Resolution Aerosol Mass Spectrometry, J. Geophys. Res. Atmos., 124, 1132–1147, https://doi.org/10.1029/2018JD029245, 2019.
Yu, Z. and Elliott, E. M.: Novel method for nitrogen isotopic analysis of soil-emitted nitric oxide, Environ. Sci. Technol., 51, 6268–6278, https://doi.org/10.1021/acs.est.7b00592, 2017.
Zhao, H., Zhang, X., Zhang, S., Chen, W., Tong, D., Xiu, A., Zhao, H., Zhang, X., Zhang, S., Chen, W., Tong, D. Q., and Xiu, A.: Effects of Agricultural Biomass Burning on Regional Haze in China: A Review, Atmosphere-Basel, 8, 88, https://doi.org/10.3390/atmos8050088, 2017.
Zheng, H., Kong, S., Wu, F., Cheng, Y., Niu, Z., Zheng, S., Yang, G., Yao, L., Yan, Q., Wu, J., Zheng, M., Chen, N., Xu, K., Yan, Y., Liu, D., Zhao, D., Zhao, T., Bai, Y., Li, S., and Qi, S.: Intra-regional transport of black carbon between the south edge of the North China Plain and central China during winter haze episodes, Atmos. Chem. Phys., 19, 4499–4516, https://doi.org/10.5194/acp-19-4499-2019, 2019.
Zong, Z., Wang, X., Tian, C., Chen, Y., Fang, Y., Zhang, F., Li, C., Sun, J., Li, J., and Zhang, G.: First assessment of NOx sources at a regional background site in north China using isotopic analysis linked with modeling, Environ. Sci. Technol., 51, 5923–5931, https://doi.org/10.1021/acs.est.6b06316, 2017.
Zong, Z., Tan, Y., Wang, X., Tian, C., Li, J., Fang, Y., Chen, Y., Cui, S., and Zhang, G.: Dual-modelling-based source apportionment of NOx in five Chinese megacities: Providing the isotopic footprint from 2013 to 2014, Environ. Int., 137, 105592, https://doi.org/10.1016/J.ENVINT.2020.105592, 2020.