the Creative Commons Attribution 4.0 License.
the Creative Commons Attribution 4.0 License.
 | 14 Apr 2022
Measurement report: Characterization and source apportionment of coarse particulate matter in Hong Kong: insights into the constituents of unidentified mass and source origins in a coastal city in southern China
Kin Man Liu
Claisen Yeung
Kenneth K. M. Leung
Coarse particulate matter (i.e. PM with an aerodynamic diameter between 2.5 and 10 µm – PM2.5 and PM10 – or PMcoarse) has been increasingly recognized for its importance in PM10 regulation because of its growing proportion in PM10 and the accumulative evidence for its adverse health impact. In this work, we present comprehensive PMcoarse speciation results obtained through a 1-year-long (January 2020–February 2021) joint PM10 and PM2.5 chemical speciation study in Hong Kong, a coastal and highly urbanized city in southern China. The annual average concentration of PMcoarse is 14.9 ± 8.6 µg m−3 (± standard deviation), accounting for 45 % of PM10 (32.9 ± 18.5 µg m−3). The measured chemical components explain ∼75 % of the PMcoarse mass. The unexplained part is contributed by unmeasured geological components and residue liquid water content, supported through analyses by positive matrix factorization (PMF) and the thermodynamic equilibrium model ISORROPIA II. The PMcoarse mass is apportioned to four sources resolved by PMF, namely soil dust/industrial and coal combustion, construction dust/copper-rich emissions, fresh sea salt, and an aged sea salt factor containing secondary inorganic aerosols (mostly nitrate). The PMcoarse concentration and source composition exhibit a distinct seasonal variation, a result mainly driven by the source areas the air masses have travelled through as revealed by back-trajectory analysis. In summer when the site is dominated by marine air mass, PMcoarse is the lowest (average = 8.1 µg m−3) and sea salt the largest contributor (47 %), followed by the two dust factors (36 % in total). In winter when the site receives air mass mainly from the northern continental region, PMcoarse concentration triples (24.8 µg m−3), with the two dust factors contributing three quarters of the aerosol mass. The potential dust source areas are mapped using the concentration-weighted trajectory technique, showing either the Greater Bay Area or the greater part of southern China as the origin of fugitive dust emissions leading to elevated ambient PMcoarse loadings in Hong Kong. This study, the first of this kind in our region, provides highly relevant guidance for other locations with similar monitoring needs. Additionally, the study findings point to the need for further research on the sources, transport, aerosol processes, and health effects of PMcoarse.
- Article
(4473 KB) - Full-text XML
-
Supplement
(2966 KB) - BibTeX
- EndNote


Coarse particulate matter (PMcoarse), defined as PM with an aerodynamic diameter of 2.5–10 µm (PM2.5 and PM10) in the World Health Organization's air quality guidelines, plays important roles in air quality, public health, and global climate. Progress in reducing fine PM (PM2.5) pollution in the past makes it increasingly important to explore possibilities to control PMcoarse for PM10 regulation. In the United States, PMcoarse constituted half of PM10 mass nationwide in 2012–2016 (Hand et al., 2019). The relative contribution of PMcoarse to PM10 mass was reported to increase by 0.7 %–1.2 % annually over 2000–2016. While the health impact of PMcoarse examined by earlier epidemiological studies was inconclusive (Adar et al., 2014), more recent epidemiological studies in China showed evidence for the adverse health impact of PMcoarse (Chen et al., 2019; Lei et al., 2022). The health impact of PMcoarse depends on the exposure to and concentration and composition of PMcoarse, which may explain the varied health implications found in different studies (Adar et al., 2014; Chen et al., 2019; Lei et al., 2022).
Understanding the sources of PMcoarse is important for developing control strategies. PMcoarse is primarily generated by mechanical processes such as wind and erosion, and the sources can be naturally and anthropogenically related. The natural processes include ejection of sea spray, resuspension of soil dust, release of plant-related particles, etc. Common anthropogenic PMcoarse sources include road dust resuspended by road traffic, brake/tire wearing, construction dust, fly ash, and metallurgical process. While PMcoarse is mostly directly emitted, certain components in PMcoarse can be related to secondary formation. For example, nitrate in the coarse mode is formed by the reaction between nitric acid (HNO3) from oxidation of NOx and pre-existing alkaline aerosols, such as sea salt and dust particles (Bian et al., 2014). A recent study showed that mineral dust can serve as a medium for rapid secondary inorganic and organic aerosol formation under high photochemical activity and relative humidity conditions, which has important implications for the life cycle of secondary aerosols (Xu et al., 2020). PMcoarse also exerts an impact on earth's climate because of its continuous loading in the atmosphere and its ability to scatter and absorb radiation or act as cloud condensation and ice nuclei (USEPA, 2019).
As a coastal and highly urbanized city and being a part of the Guangdong–Hong Kong–Macau Greater Bay Area (GBA) economic and business hub in southern China, Hong Kong is facing atmospheric PM pollution originating from both local and regional influences. Continuous improvement in local and regional PM concentrations is noted in the last few years (HKEPD, 2020). The ambient PM10 concentration has been reduced by 24 % from 42 µg m−3 in 2012 to 32 µg m−3 in 2019. The reduction was contributed mostly by PM2.5, which correspondingly decreased by 32 % from 28 to 19 µg m−3. By taking the difference between PM10 and PM2.5, it can be deduced that PMcoarse only decreased slightly from 14 to 13 µg m−3 in the corresponding period. Because of the disproportionate reduction in PM2.5, the relative contribution of PMcoarse to PM10 increased from 33 % in 2012 to 41 % in 2019. The analysis has two important implications. First, PM2.5 and PMcoarse in Hong Kong have different sources. Second, it is important to characterize the sources of PMcoarse, which has gained increasing importance in PM10 contribution.
Previous PMcoarse studies in Hong Kong were focused on suburban coastal areas (Cohen et al., 2004), roadside environments (Cheng et al., 2015), and public transport micro-environments (Jiang et al., 2017). These studies provide limited representation of the general PMcoarse pollution characteristics given the predisposition to the influence of nearby sources, for example, sea spray in coastal environments or traffic-related emissions in roadside environments. Hong Kong has been operating a PM10 monitoring network since 1998, which consists of six general stations and one roadside station. The network collects 24 h samples on quartz fibre filters on a 1 in 6 d schedule by high-volume (HV) samplers which operate at a flow rate of 1.13 m3 min−1. The HV quartz fibre filters are used for gravimetric analysis and chemical speciation including major ions, elements, organic carbon (OC), and elemental carbon (EC) (Zhang et al., 2018). The PM2.5 speciation network in Hong Kong started to operate in 2011. PM2.5 samples are collected on Teflon filters and quartz fibre filters by middle-volume samplers which operate at a flow rate of 16.7 L min−1. The Teflon filters are used for gravimetric and elemental analyses, while the quartz fibre filters are analysed for major ions, OC, and EC (Yu and Zhang, 2018). It should be noted that Si and Ti, which are important markers for quantifying dust contribution, are not determined in PM10 samples due to the high background in inductively coupled plasma atomic emission spectroscopy (ICP-OES) analysis. On the other hand, the PM2.5 network employs X-ray fluorescence techniques for elemental analysis and thus has no difficulty in reporting the concentrations of these two elements. Additionally, carbonaceous components in PM10 and PM2.5 are determined using different thermal methods (NIOSH protocol for PM10 and IMPROVE protocol for PM2.5). In view of the aforementioned, the two PM monitoring networks in Hong Kong adopt different sampling and laboratory analysis protocols which would introduce uncertainties to the analysis results. The possibility of deriving a solid understanding of the composition and sources of PMcoarse using existing data sets certainly requires further investigation.
We present in this work the first joint PM10 and PM2.5 speciation effort in Hong Kong in which all the sampling and chemical analysis work was conducted using identical methods and by the same laboratory. The aim is to obtain high-quality composition data for PMcoarse. It has been reported in a number of studies that a notable fraction of PMcoarse was often unable to be identified. Cheung et al. (2011) reported an up to 25 % contribution from such unidentified mass in the Los Angeles area, while Putaud et al. (2010) reported 6 %–43 % in urban Europe. Although it has been suggested that the unidentified mass was associated with liquid water content and mineral components, their exact contributions have remained largely uncharacterized. By using positive matrix factorization (PMF), we showed that the unidentified masses can be allocated to the resolved sources, providing qualitative and quantitative information on their origins. We propose the unidentified mass in PMcoarse in our study region is mainly composed of unmeasured mineral components and liquid water content. The measured PMcoarse in its entirety was successfully apportioned to various contributing sources by PMF, and the potential source origins are identified using backward air mass trajectory analysis. With the robust source apportionment analysis, we found that fugitive dust associated with regional influence is the dominant contributor of high PMcoarse loading in Hong Kong. The methodology and results from this study can serve to provide guidance to other locations with similar monitoring needs.
2.1 Ambient sampling
Aerosol sampling was conducted in Hong Kong at the Tuen Mun Air Quality Monitoring Station (TMC AQMS), which is located on the rooftop of a public library building (22∘23′28.4′′ N, 113∘58′37.1′′ E; ∼30 m a.g.l., above ground level). The AQMS is situated in the northwestern part of Hong Kong. The city, with a territory area of ∼1110 km2 and a population of ∼7.5 million, is part of the larger economic and business hub, the Greater Bay Area (GBA) (∼56 000 km2, population of ∼85 million), in Guangdong Province of China. Located in the sub-tropical region along the southeast coast of China, Hong Kong exhibits season-dependent air pollution characteristics that are closely related to the seasonal evolution of the East Asian Monsoon system. Generally, air pollution during colder seasons is more severe than in warm seasons. This will be elaborated when the measurement results are discussed.
Samples taken over 24 h (midnight to midnight) for PM10 and PM2.5 were collected simultaneously on a once every 3 d schedule. The sampling lasted for over a year from 18 January 2020 to 9 February 2021. In each sampling event, one 47 mm Teflon and one 47 mm quartz fibre filter sample was collected for each of the PM size fractions. The sample collection was accomplished by deploying two pairs of federal reference method samplers operated at a flow rate of 16.7 L min−1. The first pair (Partisol Plus 2025, Thermo Fisher Scientific, MA, USA) was equipped with PM10 sampling inlets to collect PM10, whereas in the second pair (BGI PQ200, Mesa Labs, CO, USA) the Very Sharp Cut Cyclones were installed downstream of the PM10 inlets for PM2.5 fine particle collection. Field blanks (Teflon and quartz) were collected during the last sampling of each month. All the filter samples were delivered back to the balance laboratory for conditioning followed by gravimetric analysis within 1 week. The filters were subsequently stored at −20∘C until chemical analysis.
2.2 Mass and chemical composition determination for PMcoarse
The mass concentration and chemical composition of PMcoarse were determined as the difference between PM10 and PM2.5 measurements. The PM10 and PM2.5 samples were speciated using the identical protocol that has been adopted in the Hong Kong PM2.5 speciation network for regular monitoring of PM2.5 composition since 2011 (Huang et al., 2014). The protocol is based on the speciation guideline by the U.S. Environmental Protection Agency (Chow and Watson, 1998). The design of joint sampling and chemical analysis of PM10 and PM2.5 eliminates data incompatibility issues observed for data from the existing networks.
All the gravimetric and chemical analyses of the filter samples were conducted by the same laboratory in the Hong Kong University of Science and Technology. PM mass concentration was determined on the Teflon filter samples by gravimetry with a digital microbalance (Sartorius AG, Model MC 5-0CE, Göttingen, Germany, sensitivity of ± 1 µg) under a temperature- and relative-humidity-controlled environment (20–23 ∘C and 30 %–40 %). Elements from Al to U were quantified on the Teflon filters by an energy dispersive X-ray fluorescence spectrometer (ED-XRF) (Epsilon 5, PANalytical, The Netherlands). OC and EC were quantified on the quartz fibre filters with an aerosol carbon analyser (DRI Model 2001A, Atmoslytic, Calabasas, CA, USA) based on the thermal and optical reflectance method, adopting the IMPROVE_A temperature protocol (Chow et al., 2007). Ionic species including Cl−, NO, SO, NH, Na+, Mg2+, K+, and Ca2+ were analysed on the quartz fibre filters by ion chromatography (IC) (Dionex ICS-1100, Thermo Fisher Scientific, MA, USA).
The species concentrations in PM10 and PM2.5 samples were blank corrected. The measurement precision was propagated from the precision of volumetric measurements during sampling, chemical analyses, and field blank variability (Yu and Zhang, 2018). Duplicate analysis of the aerosol samples was performed for every 10 measurements to derive precision for the chemical analyses. The measurement precision for PMcoarse speciation was propagated from the precision of the PM10 and PM2.5 measurements.
2.3 Source apportionment by positive matrix factorization
Source identification and quantification for PMcoarse was conducted by analysing the speciation data matrix with PMF. PMF decomposes the speciation data matrix into factor profiles and factor contribution matrices with non-negative constraints, with the objective of minimizing the uncertainty-weighted differences between observed and apportioned species concentrations represented by an objective function Q (Paatero and Tapper, 1994). The USEPA (United States Environmental Protection Agency) PMF 5.0 software was used for this undertaking (Norris et al., 2014). The fitting species include total PMcoarse mass and a suite of chemical species including Na+, NH, Mg2+, Cl−, NO, SO, OC, EC, Al, Si, K, Ca, Ti, V, Mn, Fe, Ni, Cu, Zn, and Pb. The measurement precision for each species in each sample described in Sect. 2.2 was used as the uncertainty inputs for the PMF modelling. The uncertainty of PMcoarse mass was tripled to downweigh its influence in the source apportioning. This allows the total PMcoarse mass to be apportioned mainly according to its covariance with other species. Concentrations below the method detection limit (MDL) were replaced by MDL with corresponding uncertainties set to be MDL as recommended in the PMF user manual. The input speciation data matrix consists of 123 PMcoarse samples.
3.1 Abundance and composition of PMcoarse
3.1.1 Annual average and comparison with other locations
The speciation data quality was evaluated by examining the consistency between species concentrations measured by different methods: for example, gravimetric mass vs. mass from continuous monitor, gravimetric mass vs. reconstructed mass, SO vs. total S, K+ vs. total K, etc. Deming regression was applied in the examination using the scatter plot computer programme developed by Wu and Yu (2018), which is available at https://doi.org/10.5281/zenodo.832417 (last access: 9 December 2021). This technique is applied to consider the measurement uncertainties of both variables to be compared in the regression. Details of the evaluation are provided in Sect. S1 in the Supplement. In short, the evaluation shows that the speciation data are of adequate quality for the ensuing analyses.
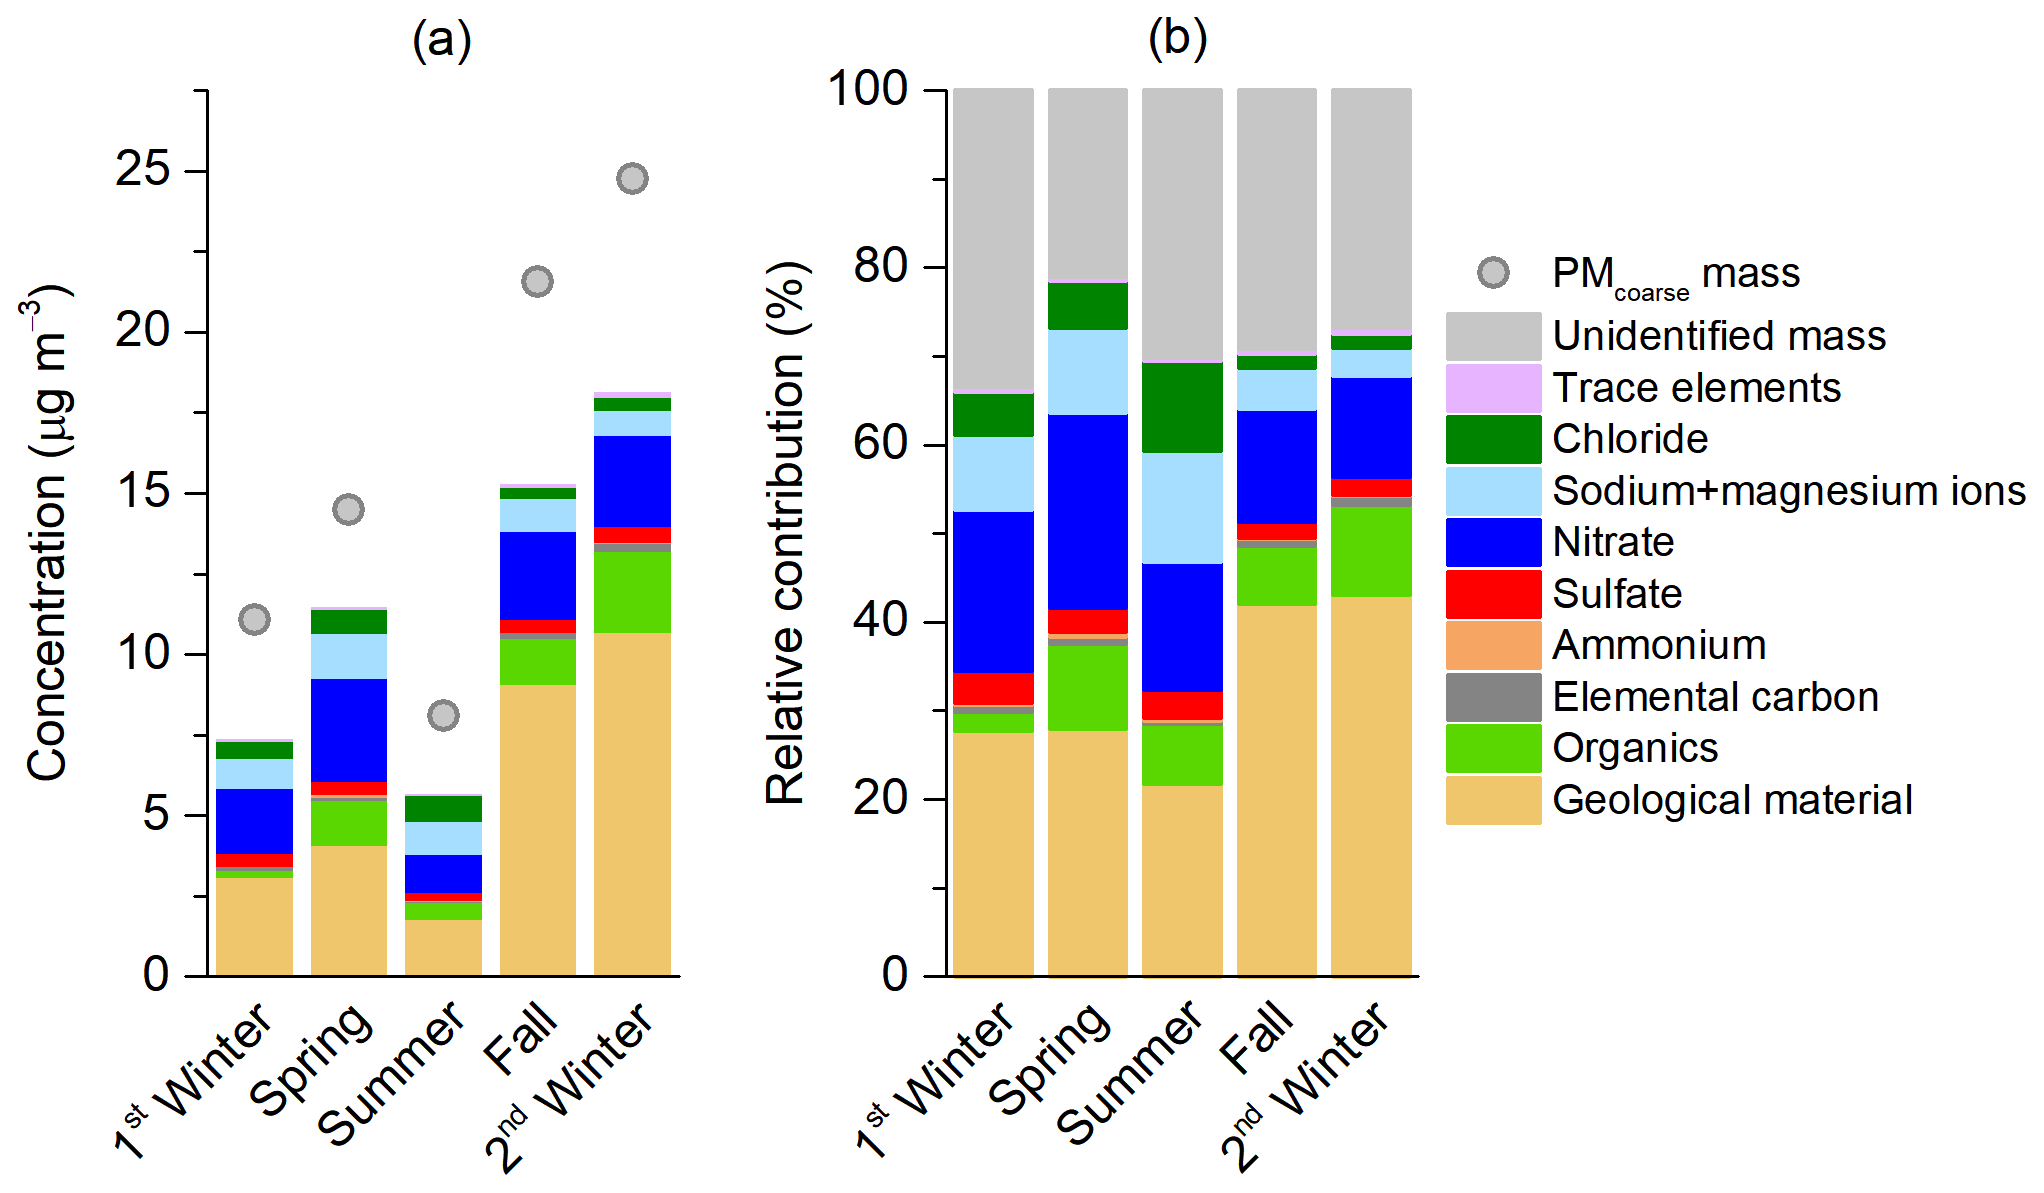
Figure 1Seasonal variations in concentration and composition of PMcoarse observed at the Tuen Mun Air Quality Monitoring Station in Hong Kong. Panels (a) and (b) show the results in absolute concentration and relative contribution, respectively.
The study-wide average concentration of PMcoarse is 14.9 ± 8.6 µg m−3 (± standard deviation), accounting for 45 % of ambient PM10 (32.9 ± 18.5 µg m−3). The daily concentrations range from 2.9 to 40.4 µg m−3. The contribution of geological material is estimated by assuming the crustal elements are in oxide forms, i.e. . This component has the largest contribution, making up 5.2 µg m−3 or 35 % of the PMcoarse mass. The next important component is nitrate (2.2 µg m−3, 15 %), followed by sea-salt-related ions (i.e. Na+, Mg2+, and Cl−) and organics, which represent 11 % and 8 %, respectively. The coarse organics were estimated by multiplying the measured OC by a factor of 2, assuming the organics are mainly associated with biological particles which are enriched in oxygenated compounds such as polyols and carboxylic acids (Edgerton et al., 2009). The composition forms a stark contrast with that of PM2.5 (18.0 ± 11.2 µg m−3), in which carbonaceous components (organics and EC, 41 %) and secondary ions (NH, NO, and SO, 38 %) are the major components. The difference is consistent with combustion and secondary aerosol formation processes being the major sources of fine particles, whereas coarse particles are primarily generated by mechanical processes. The organics here were approximated to be 1.6× [OC] considering typical features of urban aerosols with both primary and secondary contributions (Turpin and Lim, 2001).
The annual average concentrations of PMcoarse and selected major components measured in this study are compared with those in other locations in Table 1. Only studies that spanned at least 1 year or more and had all major species measured (i.e. elements, ions, OC, and EC) are considered. Our PMcoarse level is similar to those in other urban locations, more than 2 times higher than Milan in Italy, and ∼5 µg m−3 higher than Central Los Angeles, as well as only half of that in Casa Grande in Arizona and a 10th of that in Lahore in Pakistan. Our concentration is also comparable to two roadside studies carried out in Bern in Switzerland and in London and Birmingham in the UK. We note the PMcoarse concentration in a Hong Kong roadside study is ∼10 µg m−3 higher than the current study. Yet a straightforward urban vs. roadside comparison is not feasible given the roadside measurement was conducted more than 15 years ago. We also note that all the cited measurements were taken at least a decade ago. The lack of more recent measurements highlights the need for more PMcoarse speciation effort, considering the growing importance of PMcoarse in aerosol mass loading and health effect contributions as PM2.5 has been controlled effectively in many locations. Our PMcoarse concentration is also 3–4 times lower than that measured in the desert area in Arizona but one third higher than a desert-like area in Lancaster in Los Angeles.
Geological material is the single largest component in PMcoarse across all studies including ours, accounting for roughly 30 %–50 % (Lahore shows 74 %), underlining the importance in identifying fugitive dust sources (e.g. natural vs. anthropogenic) for effective mitigation of PMcoarse. We note that our nitrate concentration is the highest among all studies (except for the Lahore study, which is comparable to ours), constituting 2.2 µg m−3 or 15 % of the PMcoarse. Coarse-mode nitrate mainly forms by the uptake of HNO3 by pre-existing alkaline particles forming NaNO3 in reaction with sea salt and Ca(NO3)2 with soil dust (Bian et al., 2014). Our total carbon level of 0.7 µg C m−3 is among the lowest compared to other studies, with 86 % of it coming from OC. A quarter of PMcoarse mass is regarded as unidentified in this study. The percentage share is among those observed in other studies, which range between 8 % and 38 %. The nature of the unidentified mass will be discussed in Sect. 3.3.
3.1.2 Seasonal variations in PMcoarse mass and composition
The seasonal evolution of weather in Hong Kong is largely driven by the East Asian Monsoon system. Correspondingly, the atmospheric PM pollution in Hong Kong displays a distinct seasonal characteristic. In general, the PM loading in summer is mainly governed by local emissions due to the prevailing southerlies carrying clean marine air masses. In winter, the prevailing northerlies place Hong Kong immediately downwind of the continental region with intense industrial and agricultural activities. Under this situation, the PM loading is affected by both local and regional sources. The transient seasons – spring and fall – have more mixed wind directions. The seasonal contrast in precipitation frequency and ambient temperature, both being higher in summer and lower in winter, also contributes to the variation in PM concentration across different seasons (Louie et al., 2005; Yu et al., 2004).
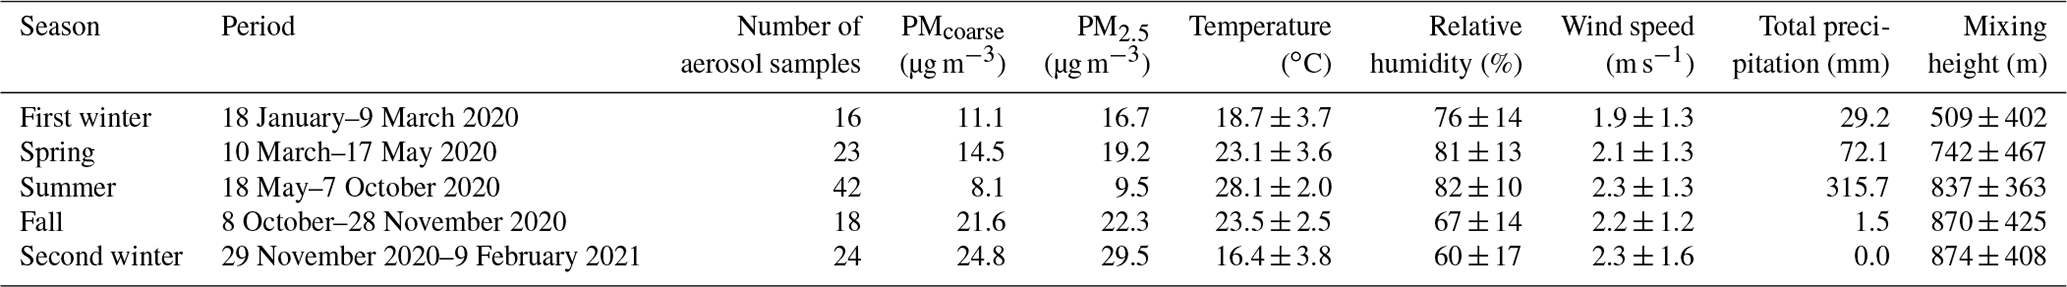
The sampling period in this study is divided into four seasons based on the observed meteorological and weather patterns as analysed in Sect. S2. Table 2 lists the starting and ending dates of individual seasons, along with the seasonal averages of PM concentrations and several meteorological parameters. Note that the two winter periods at the beginning and the end of the sampling programme are regarded as two different winter periods considering the variability in weather conditions and that they span mostly different calendar months.
Figure 1 presents the PMcoarse concentration and composition by season. The PMcoarse exhibits a significant variation across different seasons, ranging from the lowest 8.1 µg m−3 in summer to the highest 24.8 µg m−3 in the second winter. Washout by precipitation plausibly plays a role in the seasonal contrast given that summer takes up 75 % of the rainfall for the whole study period (Table 2). Mixing layer height appears to play an insignificant role in controlling the variation in PMcoarse level. For example, although the mixing height in the first winter is the lowest among all seasons (509 ± 402 m) while that in the second winter is the highest (874 ± 408 m), the PMcoarse in the latter is more than twice higher than the former. The wind speed also shows small variation across the seasons, with a range of 1.9 to 2.3 m s−1. This range corresponds to a Beaufort scale number of 1–2, referring to the light wind condition. The meteorological data imply that the seasonal variation in PMcoarse levels is likely caused by changes in source intensity and/or air mass origin.
The composition information indicates that geological material is largely responsible for the variability in PMcoarse. This component takes up 22 %–43 % of the PMcoarse mass. The seasonal contrast in the contribution of this component could be attributed to enhanced wet deposition in the warmer season and elevated contribution from regional transport in the colder season. The unidentified mass also represents a major component in most seasons (except spring), accounting for 20 %–32 % of PMcoarse mass. Like geological material, this fraction has a significantly enhanced contribution in the colder season compared to the warmer season. As for other components, nitrate has the highest absolute contribution in spring and lowest in summer (3.2 vs. 1.2 µg m−3). Organics are the highest in the second winter and lowest in the first winter, showing an order of magnitude difference (2.5 vs. 0.2 µg m−3). The concentrations of sea-salt-related ions (i.e. Na+, Mg2+, and Cl−) are higher in the warmer season than that in the colder season, which is consistent with the enhanced influence of marine air mass in the warmer season.
Table 1Comparison of PMcoarse concentration and major composition in micrograms per cubic metre (percentage contribution to PMcoarse shown in parentheses) in Hong Kong and measurements in other locations.
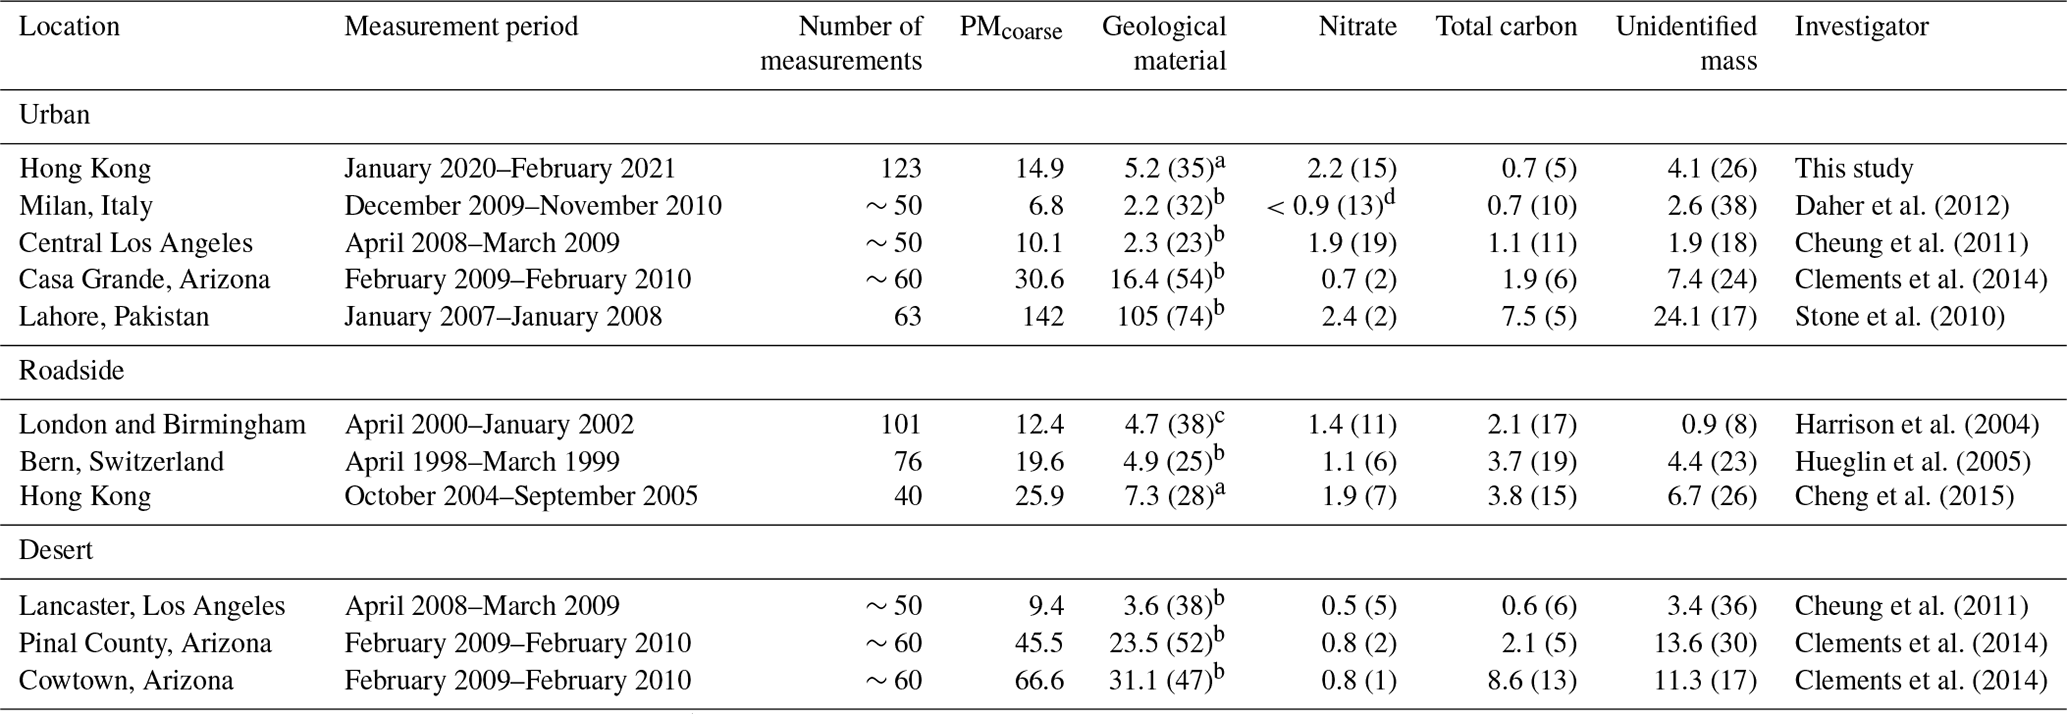
a Estimated by the investigators assuming oxides formed of crustal elements. b Estimated by the investigators assuming [Si] = 3.4 × [Al] since Si was not measured. c Estimated by the investigators using Ca and Fe as the markers for gypsum and soil dust, respectively. d Only aggregate ion concentration was reported by the investigators.
Table 2Summary of season division, PM concentrations, and meteorological parameters in Tuen Mun during the sampling period.
3.2 Source characterization for PMcoarse
3.2.1 Source identification by PMF analysis
Here the source origins of PMcoarse are discussed. The number of factors (or source categories) contributing to PMcoarse was determined in the PMF analysis. The PMF solution with four factors was selected for source interpretation after an examination of the physical interpretability of the resolved factor profiles for a series of PMF solutions with different factor numbers. The details are provided in Sect. S3. In brief, the three-factor solution was discarded as it gave poor modelling result for Cu, which is an important species in PM health effects associated with reactive oxygen species formation (Bates et al., 2019). The five-factor solution was not considered either because the fifth factor, which is a secondary nitrate factor, was assessed to be chemically inexplainable after examining the charge balance of the ionic composition. The stability of the four-factor solution has been tested against the bootstrapping and displacement functions embedded in the PMF software. The results show that the PMF solution is statistically robust for source analysis. Details of the uncertainty estimation are summarized in Table S2.
The factor profiles resolved in the four-factor solution are shown in Fig. 2. The four factors can be broadly classified into the sea salt category consisting of the first and second factors and the dust category consisting of the third and fourth factors. The first factor is marked by the high loading of Cl− with the additional presence of Na+ and Mg2+, which are strong indicators for fresh sea salt. The molar equivalent of Cl− is balanced by that of Na+ and Mg2+, and it has an anion-to-cation equivalence ratio of 0.99, adding credence to the validity of this factor. The second factor is loaded with a substantial fraction of Na+ and Mg2+, which are markers for sea salt. The absence of Cl− and presence of NO indicate this factor specifically represents aged sea salt given that Cl− in sea salt is actively depleted by gaseous HNO3 forming non-volatile NaNO3 (Bian et al., 2014). This factor is termed aged sea salt mixed with secondary inorganic aerosols. The third and fourth factors are clearly associated with fugitive dust, as indicated by the high abundance of crustal elements (e.g. Al, Si, Ca, Ti, and Fe). However, the chemical fingerprints in these two factor profiles only provide limited information for pinpointing the more specific sources responsible for the aerosol burden.
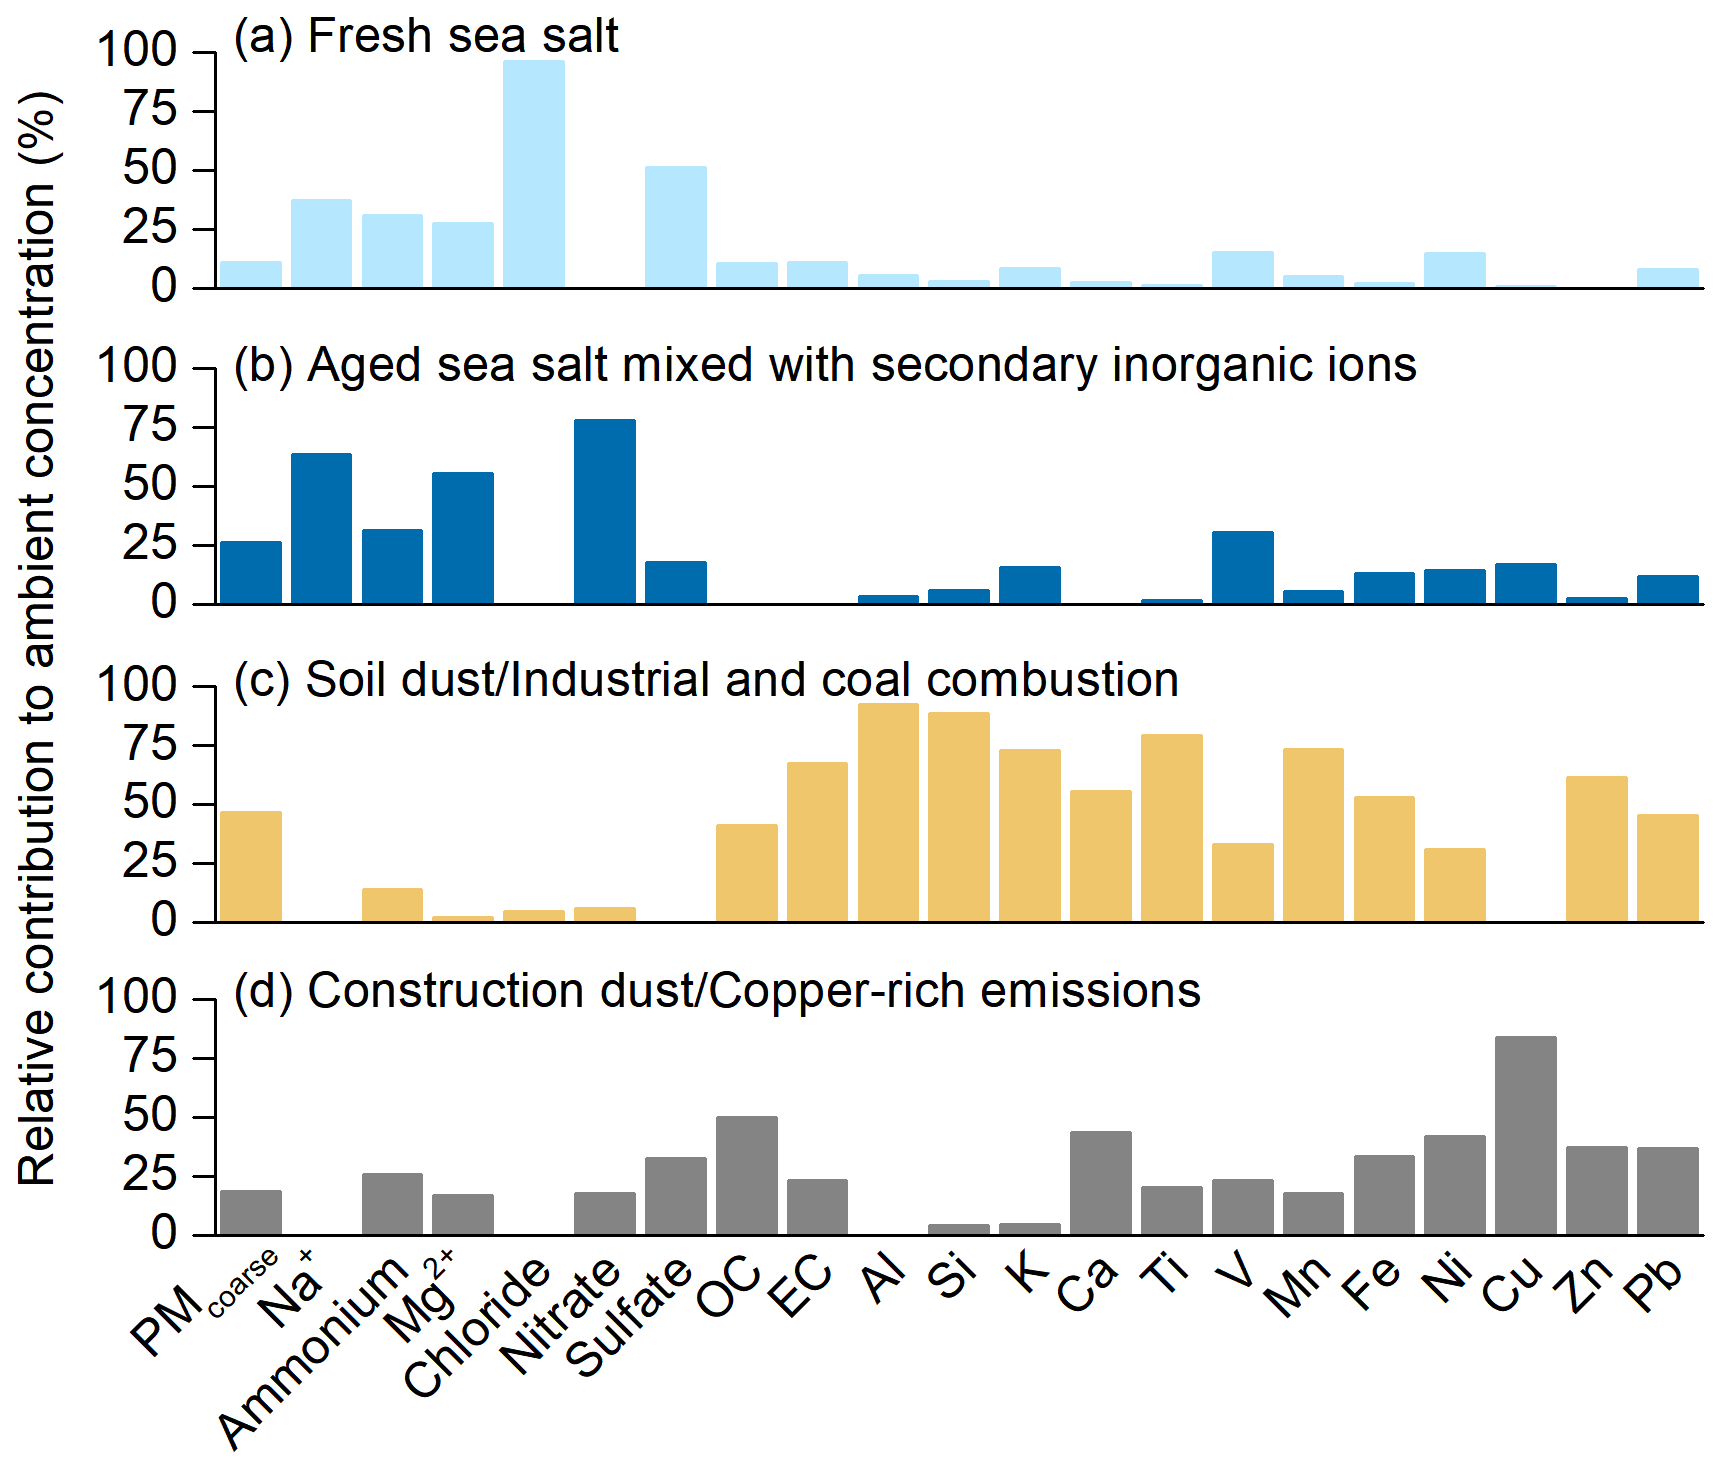
Figure 2Factor profiles resolved by positive matrix factorization for source apportionment of PMcoarse measured at Tuen Mun Air Quality Monitoring Station in Hong Kong.
3.2.2 Source identification by backward air mass trajectory analysis
To better understand the sources behind the PMF-resolved factors, the association between air mass origins and source contributions was investigated through backward air mass trajectory analysis. The back-trajectories were computed by the Hybrid Single-Particle Lagrangian Integrated Trajectory (HYSPLIT) model using meteorological data from the 1∘ horizontal resolution Global Data Assimilation System (Stein et al., 2015). Past 48 h back-trajectories of air mass reaching Hong Kong at 300 m height at the end of each sampling event at midnight were computed. The trajectories were clustered based on similarity between the trajectory end points. Four trajectory clusters are resolved, and the means for each cluster are displayed in Fig. 3a. The average source composition associated with each cluster is shown in Fig. 3b.
As shown in Fig. 3, the source compositions exhibit features that agree with the travelled source areas of the corresponding air masses. For example, both fresh and aged sea salt contributions are higher when the monitoring site is under the influence of a marine air mass (clusters 2 to 4) than under the influence of a continental air mass from the north (cluster 1). It is also noted that the contribution of aged sea salt is higher in clusters 2 and 3. By examining the individual trajectories in these clusters, it can be seen that cluster 2 is mostly composed of air masses passing through the coastal areas, whereas cluster 3 consists of a mix of marine air masses from the east and short-distance continental air masses from the northeast direction (see Fig. S6). The higher aged sea salt contribution could possibly be explained by the observation that clusters 2 and 3 have more mixed contributions from sea salt and HNO3, whereas for the other two clusters either there is a deficiency in the availability of sea salt as in cluster 1 or deficiency in HNO3 as in cluster 4.
The magnitude of total dust contribution exhibits a descending order from clusters 1 to 4, corresponding to a transition from a continental air mass from the north to a coastal air mass from the northeast/east and to an oceanic air mass from the south (Fig. 3). The results suggest the inner continental region to the north of Hong Kong could be a significant dust-emitting area, with source intensity strong enough to influence the dust aerosol burden in Hong Kong through regional transport. Recent studies on anthropogenic air pollutant emissions in Guangdong Province (a larger geographical territory of GBA) based on emission inventory developments showed that the dust source and the industrial process source are the main contributors of PM10 loading (Bian et al., 2019; Huang et al., 2021). For those emission inventories, the dust source mainly consists of road dust and construction dust emissions, whereas the industrial process source includes emissions from the manufacturing processes of a list of raw materials, including paper, rubber, steel, ceramics, cement, etc. Analysing the hourly field measurement data for elemental species with PMF approach, Zhou et al. (2018) resolved two dust-related source categories responsible for the atmospheric PMcoarse loading in the city of Foshan in Guangdong Province. The first category is road dust with brake and tire wear, while the second is construction dust. Being one of the most important industrial hubs in the GBA, Foshan could represent one of the source areas responsible for the degraded air quality in Hong Kong resulting from regional transport of air pollutants.
The source nature of our dust factors is inferred by comparing our factor profiles with those in Zhou et al. (2018). We noted that the chemical profile of their PMF factor containing road dust is similar to that of our third factor, both accounting for over half of the coarse Al, Si, K, Ca, Ti, and Fe by mass, inferring contributions from road dust. The elemental ratios of our third factor are also close to that of the local paved road dust reported by Ho et al. (2003): for example, 0.39 in our study vs. 0.39 in Ho et al. (2003) for , 0.30 vs. 0.46 for , and 0.23 vs. 0.26 for . Aside from road dust, industrial emissions and coal combustion could also be the contributors due to the presence of Zn and Pb. High loadings of both Zn and Pb are also seen in the industrial coal combustion factor by Zhou et al. (2018). Tire wear could also be a potential source of Zn (Pant and Harrison, 2013; Zhou et al., 2018). The carbonaceous components in this factor can be attributed to deposition of combustion emissions on aerosol dust and emission of biological aerosols. Taken together, this dust factor is named “soil dust/industrial and coal combustion”. The term soil dust is used instead of road dust because soil dust is broader, covering both road dust and desert dust potentially contributed by desert or loose soil dust from the inner continental region to the north of Hong Kong; it is inferred from Fig. 3 that cluster 1 samples have the highest dust contribution.
Both the construction dust factor of Zhou et al. (2018) and our fourth factor differ from the first dust factor by a higher abundance of Ca than Si, while they are depleted in Al, Si, and K. The enrichment in Ca can be regarded as an indication of construction activity. This element is enriched in construction dust because of the use of cementitious materials. A point to note is that the fourth factor contains a high loading of Cu. Common sources of Cu in PMcoarse include brake wear generated from abrasion of brake lining material and brake discs (Pant and Harrison, 2013) and industrial emissions (Taiwo et al., 2014). However, no coarse-mode Cu was reported in the PMF factor profiles by Zhou et al. (2018), and hence it remains uncertain to what extent the fourth factor resolved in this study is similar to the construction dust factor resolved by Zhou et al. (2018). Considering the additional presence of the characteristic Cu peak, the fourth factor is termed “construction dust/copper-rich emissions”.
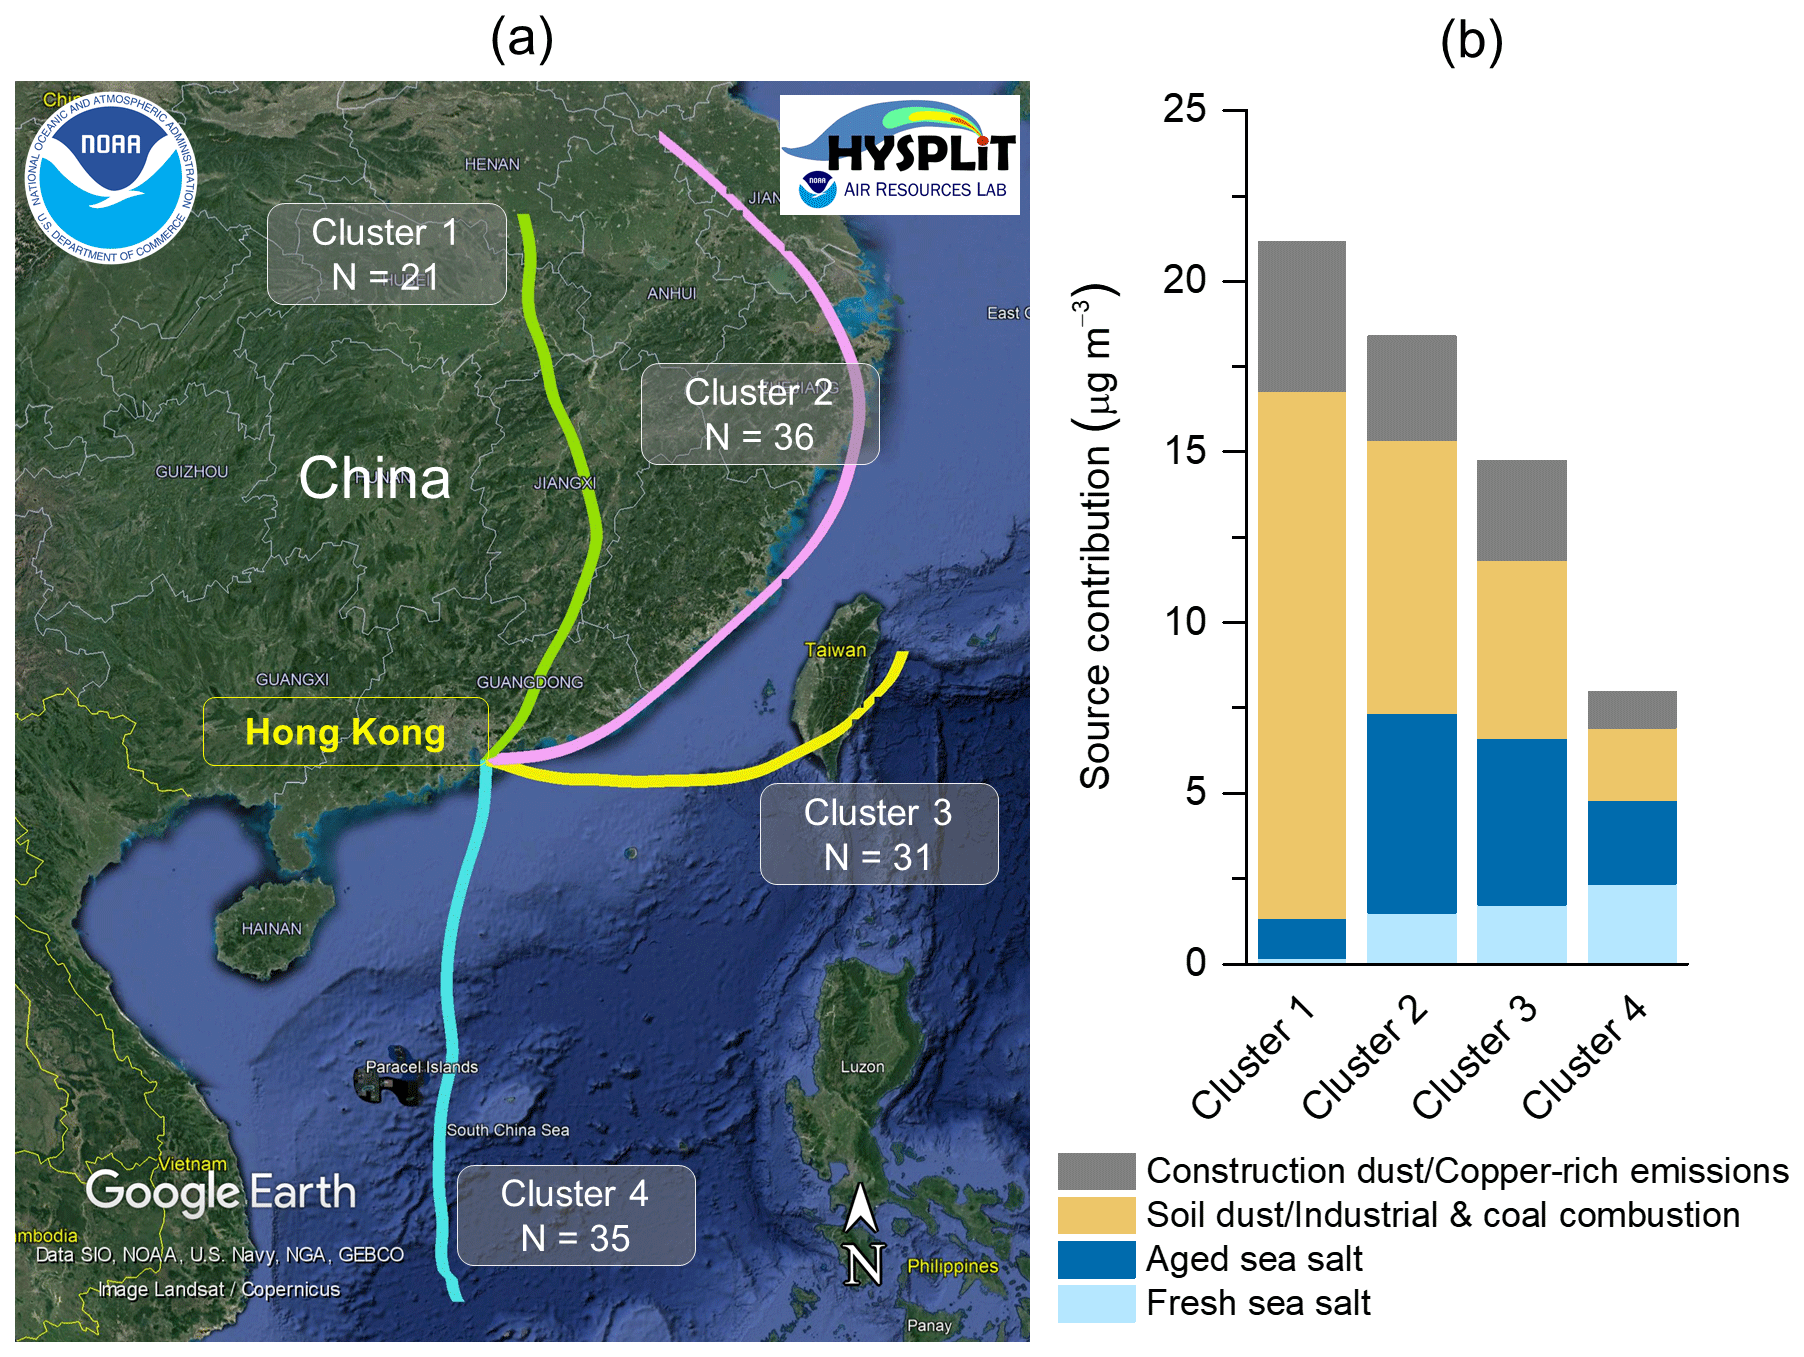
Figure 3Source contributions to PMcoarse grouped by air masses associated with different back-trajectory clusters. Past 48 h backward trajectories of air masses reaching Hong Kong (height = 300 m a.g.l.) during the end of each sampling event at midnight are considered. Panel (a) shows the mean trajectories of the four clustered trajectories (map data: Google Earth, Data SIO, NOAA, U.S. Navy, NGA, GEBCO, Image Landsat/Copernicus), while (b) shows the source contributions for the corresponding clusters.
3.3 Characterization of the unidentified PMcoarse mass
As mentioned in Sect. 2.3, the total PMcoarse mass was considered in PMF modelling as a total variable. The apportioned masses show an excellent agreement with measurements, with R2 value of 0.98 and slope of 1.04 (intercept = −0.57). A test was performed to examine if including the total mass would affect the source apportionment. It shows that inclusion of total mass has a negligible impact on the PMF solution. Specifically, the apportioning of all individual species is unaffected after including PMcoarse mass as a total variable (see Table S1). The test result implies that the PMcoarse mass in its entirety can be explained by the resolved sources. Based on this finding, the unidentified mass can be allocated to the individual sources by taking the difference between the PMF-apportioned mass and reconstructed mass in individual factors.
The unidentified mass derived from PMF (average = 5.2 µg m−3) shows reasonable agreement with that from direct subtraction using speciation data (average = 4.1 µg m−3), with R2 of 0.70 and slope of 1.07. The soil dust/industrial and coal combustion factor represents the largest contributor to the unidentified mass, contributing 46 % (2.4 µg m−3). The contribution by construction dust/Cu-rich emissions is 23 % (1.2 µg m−3). Carbonate, a potentially important component in PMcoarse, is typically enriched with dust particles. As carbonate was not measured in this study, its quantity is estimated by two methods. The first method assumes all the excess cationic charge is balanced by carbonate. This method gives an average contribution of 0.6 µg m−3. The second method assumes all Ca detected is in the form of CaCO3. The resulting carbonate contribution is 1.5 µg m−3 and is construed as the upper estimate. Considering Ca is mostly (98 %) apportioned to the two dust factors, carbonate at most accounts for 42 % of the unidentified mass in the combined dust factors (3.6 µg m−3), thus suggesting other unmeasured constituents exist.
It is reported that residue liquid water content (LWC) could be an important contributor to the unidentified mass in PM samples even at low relative humidity (RH) condition for gravimetric measurement (Hueglin et al., 2005). The thermodynamic equilibrium model ISORROPIA II (http://nenes.eas.gatech.edu/ISORROPIA, last access: 9 December 2021) is applied to estimate the aerosol LWC under the RH and temperature conditions of gravimetric measurements in the balance laboratory (i.e. temperature = 22 ∘C, RH = 35 %) (Fountoukis and Nenes, 2007). The calculation is performed assuming an open system in which only aerosol-phase concentrations are considered, and the aerosol is in metastable state. When comparing the LWC with individual soluble ions, including Na+, Mg2+, K+, Ca2+, Cl−, nitrate, and sulfate (shown in Fig. S5), we find moderate to strong correlations between LWC and ions associated with sea salt: Na+, Mg2+, Cl−, and nitrate (R2=0.49–0.78). By contrast, sulfate, Ca2+, and K+ appear to be less relevant (R2<0.15). The results imply that sea salt components play a key role in governing the LWC in PMcoarse. The average LWC is estimated to be 1.2 µg m−3, which agrees with the unidentified mass (1.6 µg m−3) in the combined fresh and aged sea salt factors. The unidentified mass in aged sea salt mixed with secondary inorganic aerosols being higher than fresh sea salt (1.3 vs. 0.3 µg m−3) is in line with the fact that NaNO3 is more hygroscopic than NaCl.
After including carbonate and residue LWC, about half of the PMF-apportioned PM mass remains unidentified, and this fraction is mainly contributed by the two dust-related factors. The mass discrepancy is likely attributed to the underprediction of geological mass in the mass reconstruction method, which only accounts for oxides of crustal elements. It is documented that other mineral constituents can exist in soil dust. For example, a field study in Morocco showed that over half of the PMcoarse mass was made up of silicates (Kandler et al., 2009). Silicates commonly exist as illite and chloritoid, which contain mineral-bound water that is not considered in the thermodynamic equilibrium model. Determining the missing components in the aerosol dust and achieving a mass closure require further investigation with different techniques (e.g. microscopy). Overall, the results from the analysis of unidentified mass are consistent with the established knowledge. It provides support to the source apportionment results for the observed coarse particulates in its entirety, forming a strong basis for understanding their source contributions.

Figure 4Source contributions to PMcoarse during the study period. Panel (a) shows the results in µg m−3, while (b) shows the results in percentage share. The circle markers in (a) represent the PMcoarse concentration measured by gravimetric analysis.
3.4 Source contributions to PMcoarse
3.4.1 Seasonal variation
Figure 4 presents the absolute and relative source contributions by season in ascending order of PMcoarse concentration. The secondary nitrate represents the nitrate from all factors to better characterize the contribution by nitrogen oxides (NOx) emission. The two nitrate-free sea salt factors are aggregated into one sea salt factor. During summer when oceanic wind from the south prevails and ambient PMcoarse is the lowest in concentration, sea salt contributes nearly half of the PMcoarse, representing the most important contributor in this season (47 % or 3.7 µg m−3). Note that the source contributions are based on the PMF-apportioned mass, and thus the contributions include residue LWC, which is mainly associated with enhanced uptake of water by aged sea salt aerosols. The soil dust/industrial and coal combustion factor accounts for 24 % (1.8 µg m−3) of the PMcoarse, followed by secondary nitrate (16 % or 1.2 µg m−3) and the construction dust/Cu-rich emission factors (13 % or 1.0 µg m−3). The source composition changes slightly in the first winter and spring periods when PMcoarse is higher, with sea salt and soil dust/industrial and coal combustion similarly contributing to one third of the PMcoarse in both periods. The rest is evenly shared by the other two sources in both periods, i.e. 18 %–19 % for secondary nitrate and 14 %–17 % for construction dust/ Cu-rich emissions.
The significantly elevated PMcoarse concentration observed in fall and the second winter is driven by the increase in dust contribution, which can be attributed to the prevailing northerlies from the continental region. The two dust-related factors cause a disproportionate impact on the ambient PMcoarse loading during these two seasons, contributing three quarters (72 %–79 %) of the PMcoarse mass in total. Compared to summer, the total contribution is 5 times higher or more in fall and the second winter, being 16.0 and 19.8 µg m−3, respectively. The seasonal difference is consistent with an earlier source apportionment study by Yuan et al. (2013), in which an 11-year-long (1998–2008) speciation data set obtained from the Hong Kong PM10 network was analysed by receptor modelling approach. Specifically, the study reported a 3 times higher crustal soil and dust contribution to PM10 in winter than in summer (9.7 vs. 3.2 µg m−3). Moreover, it showed the contributions of this source category are spatially and temporally similar across different monitoring stations in Hong Kong, implying the regional nature of this source.
The Foshan source apportionment study of Zhou et al. (2018) mentioned earlier was conducted in October–December 2014. Assuming the difference between PM10 and PM2.5 contributions by their motor vehicles/road dust factor is due to road dust, their road dust and construction dust sources contributed to 17.7 and 9.4 µg m−3 of PMcoarse, respectively. These contributions are higher than the 12.9–15.2 and 3.2–4.6 µg m−3 levels estimated for the soil dust/industrial and coal combustion and construction dust/Cu-rich emission factors in fall and the second winter of this study. This spatial gradient lends support to the dust contributions in Hong Kong being associated with regional transport. Once entrained into the atmosphere, the lifetime of mineral dust can be up to several days, and therefore it can be transported over long distances (over thousands of kilometres), and the concentration would decrease with transport distance away from the source regions.
3.4.2 Potential source regions
The potential source areas are mapped by coupling the PMF-derived source contributions at the receptor with the associated backward air mass trajectory. In this analysis, the geographical domain of interest is divided and represented by a grid cell matrix. By coupling the trajectory end points in the grid cells with the concentrations at the receptor, each grid cell will receive a value representing the potential source strength in the corresponding area. The concentration-weighted trajectory (CWT) method is applied for the analysis (Hsu et al., 2003). In this method, each grid cell receives a weighted concentration value obtained by averaging the sample concentration that has associated trajectories crossing the corresponding grid cell, weighted by the residence time of air mass in that grid cell. The weighted concentration value (or CWT value) is expressed by Eq. (1):
where Cl is the concentration at the receptor site associated with back-trajectory l, τijl is the number of end points of trajectory l falling into grid cell i,j (i.e. the residence time of the trajectory in the grid cell), and L is the total number of trajectories over a time period. To improve the robustness of the CWT analysis, the input trajectory information was augmented by considering all the trajectories calculated every 3 h for each sampling day and assuming the same concentrations over the day (Petit et al., 2017). The geographical domain was defined based on the spatial range of the trajectories travelled, with the dimension of grid cells set to be . A weighting function was applied to down-weight grid cells with an insufficient number of end points following the software guidelines. The CWT analysis was performed using the Zefir programme (Petit et al., 2017). The analysis was performed by season to account for the potential variability in source strength and meteorological conditions.
Figure 5 presents the CWT results for summer and the second winter and indicates the potential source areas. The results for other seasons are displayed in Fig. S7. It can be seen that for the two dust-related factors, the elevated contributions are associated with continental air masses originating from the north, whereas the sea-salt-related contributions are associated with marine and coastal air masses. These results are consistent with the general understanding of source origins of these categories of sources. An important finding revealed from this analysis is that the GBA or the greater part of southern China is shown to have significant fugitive-dust-related emission sources and that these dust sources are implicated in causing days of high ambient PMcoarse loading in Hong Kong.
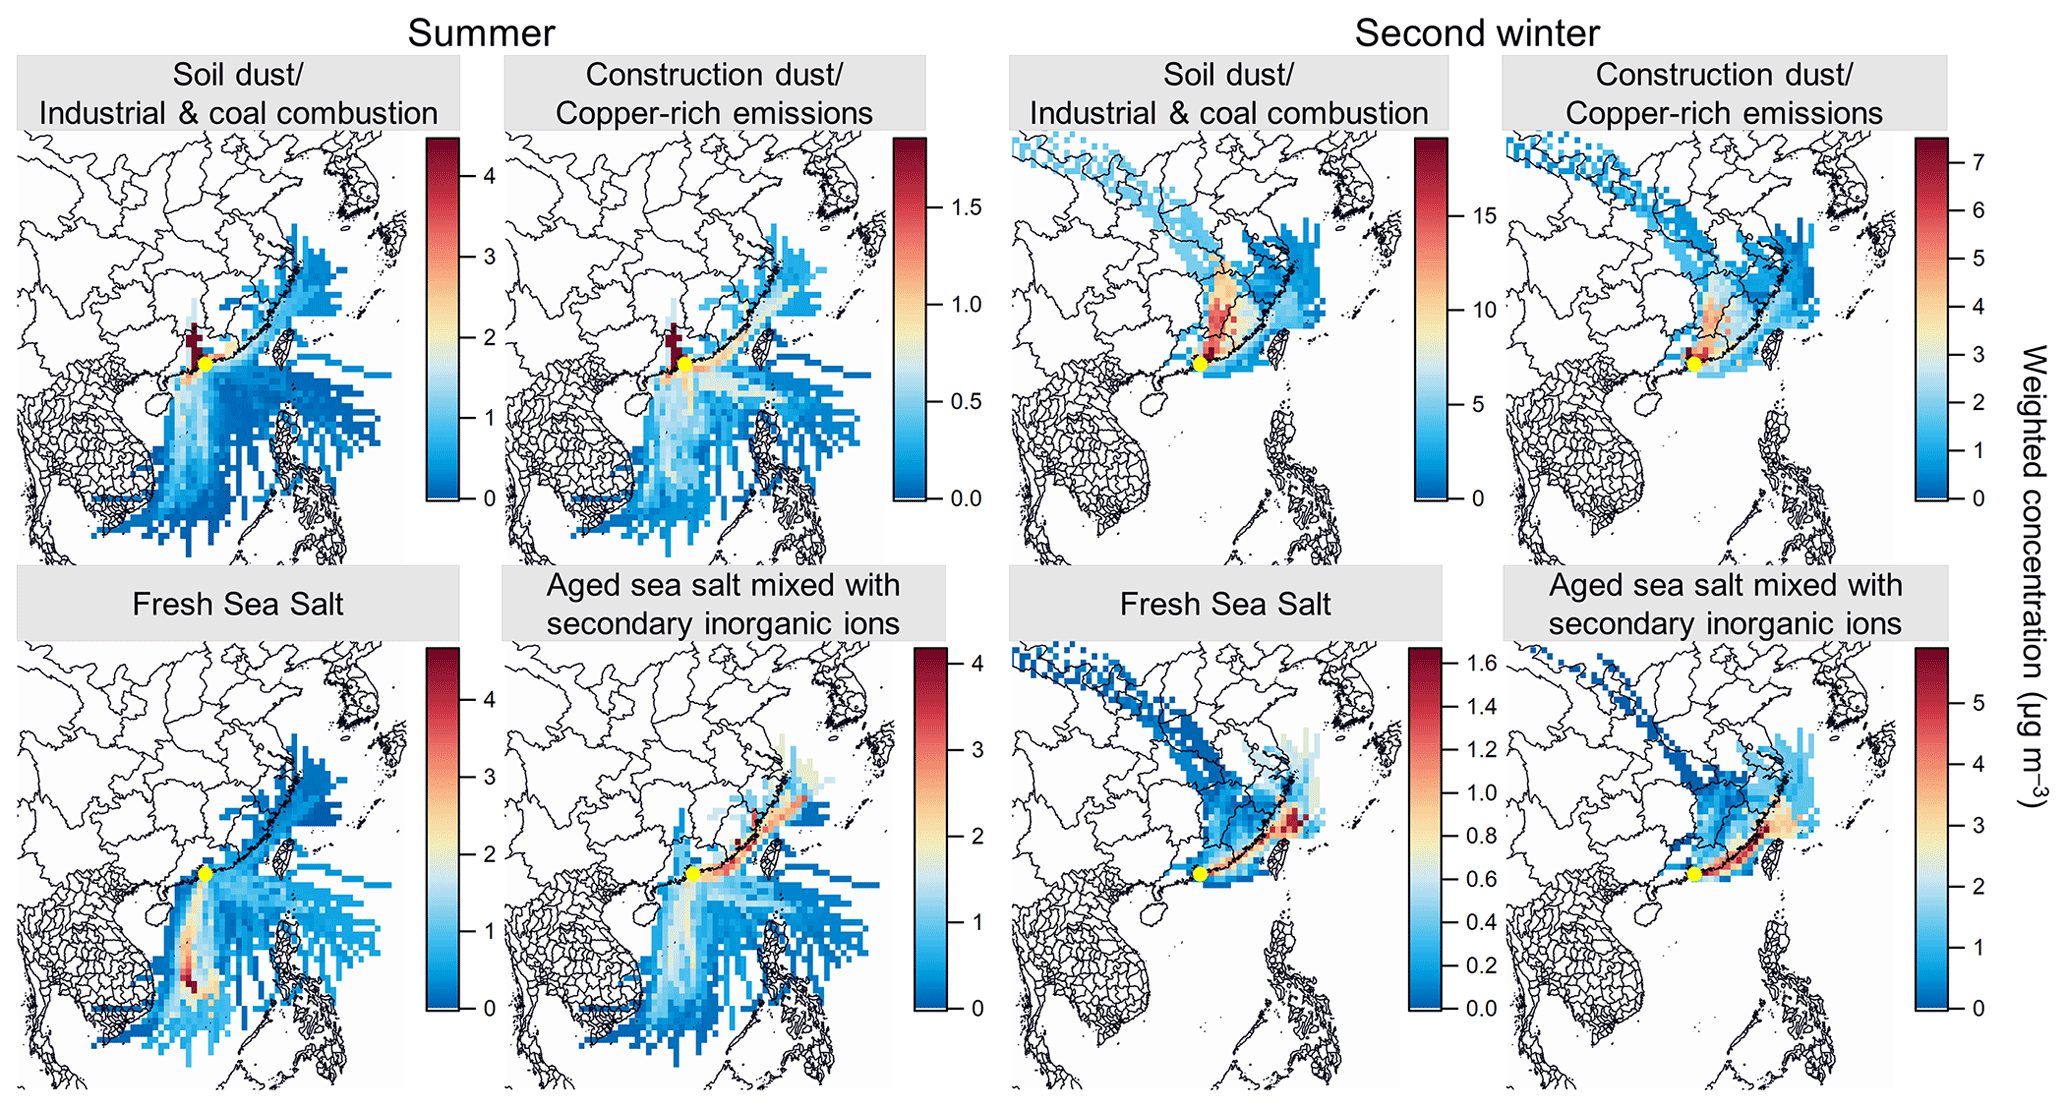
Figure 5Concentration-weighted trajectory results for individual PMcoarse-contributing sources in summer and the second winter. The location of the receptor site (Hong Kong) is represented by the yellow marker. The results for the other seasons are provided in Fig. S7.
3.5 Implications for atmospheric research and public health
As indicated in two field studies measuring size-segregated PM composition in Hong Kong, the distribution of nitrate in fine- and coarse-mode particles in a coastal environment depends on the amount of gaseous HNO3 and alkaline particles (e.g. sea salt and soil dust) (Bian et al., 2014; Xue et al., 2014). The former is mainly controlled by the NH4NO3–NH3 + HNO3 equilibrium that is closely related to fine particle pH, temperature, and relative humidity, while the latter was shown to be more closely related to sea salt. The source apportionment analysis for PMcoarse in this study reaffirms that sea salt plays a dominant role in the uptake of HNO3 in our coastal environment. Based on the PMF results, 77 % of coarse nitrate is associated with sea salt, with the rest associated with fugitive dust. Despite the fact that fugitive-dust-related aerosols represent a significant part of PMcoarse loading in our study area, this component has a less important role to play in coarse nitrate formation. Nonetheless, the results indicate that controlling HNO3 precursors would reduce nitrate in both PM2.5 and PMcoarse. A limitation to note is that the aerosol samples collected in this study were not corrected for a sampling artefact of nitrate, which would affect the accuracy of the measured nitrate concentrations. The extent of the nitrate sampling artefact is expected to be dependent on temperature and aerosol chemical composition; therefore it varies on a day-to-day basis. This variable nature makes its correction difficult. The effect of this type of artefact on coarse nitrate measurement warrants further investigation. The possible inter-particle interaction between fine and coarse particles on the PM10 samples is also neglected, which potentially biases the nitrate measurements in the two size modes.
The comprehensive and high-quality PMcoarse speciation and source apportionment results identify fugitive dust as the significant contributor to PMcoarse, especially during high PMcoarse days. It should be noted that the high loading of dust was not caused by transient dust storm events but occurred over the entire fall and winter season, indicating the constant emission of dust particles. A recent study conducted in northern China showed that coarse dust particles can act as a medium for rapid secondary inorganic and organic aerosol formation in highly polluted conditions (Xu et al., 2020). Considering that southern China is more humid than northern China, our study region presents an atmospheric condition different from that in Xu et al.'s (2020) study, which is more favourable to adsorption of water on mineral dust and consequently leads to different impacts on atmospheric chemistry and climate (Tang et al., 2016). In this study, 90 % of coarse OC is apportioned to the two dust-related factors by PMF. Given both PM2.5 and PMcoarse in our study region typically experience long transport distances, more detailed speciation on organic markers might be helpful in elucidating the natural vs. anthropogenic and primary vs. secondary nature of the organics in PMcoarse.
Accumulative evidence has shown the positive link between adverse health effects and PMcoarse exposure. Nationwide studies in China have provided evidence for the association between short-term exposure to PMcoarse and mortality and reduced pulmonary function in adult asthmatic patients (Chen et al., 2019; Lei et al., 2022). These studies indicate a stronger association in southern China compared to the northern part, which might be attributed to the difference in the source composition. For example, dust aerosols in the north typically contain a higher proportion of windblown dust from natural sources, while those in the south might have a larger influence from industrial and traffic-related emissions. The oxidative potential of PM has been shown to be a useful metric for PM health impact. Copper and humic-like substances (HULIS) are important active species in catalysing the formation of reactive oxygen species leading to oxidative stress in the human body (Lin and Yu, 2011; Bates et al., 2019). The former is likely found in industrial emissions and non-tailpipe emissions (brake/tire wear), while the latter is likely associated with biological material in soil. In this study, the average concentrations of fine- and coarse-mode Cu are comparable, being 8.1 ± 5.4 and 7.6 ± 4.7 ng m−3, respectively. Given that Cu is the important species governing the response of acellular assay for PM oxidative potential measurement, the similar magnitude in concentration calls for further investigation into the sources and potential health effects of PMcoarse.
PMcoarse has an important role to play in formulating policies to control PM10 given its growing relative contribution to PM10 loading in urban atmospheres. We have conducted the first joint chemical speciation of PM10 and PM2.5 in Hong Kong, a coastal and highly urbanized city in southern China. This enables us to derive a high-quality PMcoarse composition data set spanning a 1-year-long period from January 2020 to February 2021. The annual average concentration of PMcoarse is 14.9 ± 8.6 µg m−3 (± standard deviation), representing nearly half (45 %) of ambient PM10 (32.9 ± 18.5 µg m−3). The PMcoarse also exhibits a large seasonal variation, ranging from 8.1 µg m−3 in summer to 24.8 µg m−3 in the second winter period. Meteorological data suggest the seasonal contrast is driven by the variations in source intensity and/or air mass origin.
Among the measured constituents, geological material calculated by assuming oxides of crustal elements represents the largest PMcoarse component (35 %), followed by nitrate (15 %), sea salt ions (11 %), and organics (8 %). A quarter of PMcoarse mass (4.1 µg m−3) was regarded as unidentified mass according to a mass closure analysis. Positive matrix factorization analysis apportioned the PMcoarse mass to four sources, including soil dust/industrial and coal combustion, construction dust/copper-rich emissions, fresh sea salt, and aged sea salt mixed with secondary inorganic aerosols. Additionally, these four sources are able to account for the unidentified mass. The results show that ∼70 % of the unidentified mass is associated with the two dust factors, while the rest is residue liquid water content as implied from thermodynamic modelling using ISORROPIA II.
The source composition of PMcoarse exhibits a distinct seasonal variation, mainly resulting from the changes in the source area the air mass has travelled through. In summer when the site mainly receives air mass travelling from the sea, sea salt components represent the largest contributor (47 %), followed by the two dust-related factors (38 % in total). In fall and winter when the site is under the influences of air masses travelling from the northern continental region, the two dust-related factors dominate the ambient PMcoarse burden, constituting 72 %–79 % of the PMcoarse mass in total. Additionally, this study shows that the majority of coarse nitrate (77 %) is formed via reaction with sea salt, with the rest being associated with fugitive dust.
The source contribution and back-trajectory results were coupled and analysed by the concentration-weighted trajectory method to map the potential source areas. The results show that either the Greater Bay Area or the greater part of southern China have a source intensity of fugitive-dust-related emissions sufficiently large to result in the high ambient PMcoarse loadings in Hong Kong, especially when the meteorological condition is favourable for regional transport of air pollutants. This study identified several aspects for further PMcoarse or PM10 research, including pinpointing the exact dust generation processes leading to the high PMcoarse loadings in the study region, elucidating the roles of coarse particles in mediating secondary aerosol formation, and examining the potential health burden of PMcoarse exposure through oxidative potential measurement.
The chemical composition data cannot be made publicly accessible by the authors at the moment as the data are exclusively owned by the Hong Kong Environmental Protection Department. However, the data can be requested by emailing enquiry@epd.gov.hk or contacting the corresponding authors (envrykwong@ust.hk, jian.yu@ust.hk).
The supplement related to this article is available online at: https://doi.org/10.5194/acp-22-5017-2022-supplement.
YKW, JZY, and KKML formulated the overall design of the study. YKW, KML, and CY carried out the chemical analyses. YKW analysed the data with contributions from JZY and KKML. YKW and JZY prepared the manuscript with contributions from all co-authors.
The contact author has declared that neither they nor their co-authors have any competing interests.
The content of this paper does not necessarily reflect the views and
policies of the HKSAR Government, nor does the mention of trade names or
commercial products constitute an endorsement or recommendation of their
use.
Publisher’s note: Copernicus Publications remains neutral with regard to jurisdictional claims in published maps and institutional affiliations.
We thank Robert Tang and Rebecca Kwan of the Hong Kong Environmental Protection Department for their inputs and assistance in project logistics. We gratefully acknowledge the NOAA Air Resources Laboratory (ARL) for the provision of the HYSPLIT transport and dispersion model used in this publication.
This research has been supported by the Hong Kong Environmental Protection Department (tender refs. 19-01121 and 19-01177).
This paper was edited by Willy Maenhaut and reviewed by two anonymous referees.
Adar, S. D., Filigrana, P. A., Clements, N., and Peel, J. L.: Ambient coarse particulate matter and human health: A systematic review and meta-analysis, Curr. Environ. Health Rep., 1, 258–274, https://doi.org/10.1007/s40572-014-0022-z, 2014.
Bates, J. T., Fang, T., Verma, V., Zeng, L. H., Weber, R. J., Tolbert, P. E., Abrams, J. Y., Sarnat, S. E., Klein, M., Mulholland, J. A., and Russell, A. G.: Review of acellular assays of ambient particulate matter oxidative potential: Methods and relationships with composition, sources, and health effects, Environ. Sci. Technol., 53, 4003–4019, https://doi.org/10.1021/acs.est.8b03430, 2019.
Bian, Q., Huang, X. H. H., and Yu, J. Z.: One-year observations of size distribution characteristics of major aerosol constituents at a coastal receptor site in Hong Kong – Part 1: Inorganic ions and oxalate, Atmos. Chem. Phys., 14, 9013–9027, https://doi.org/10.5194/acp-14-9013-2014, 2014.
Bian, Y., Huang, Z., Ou, J., Zhong, Z., Xu, Y., Zhang, Z., Xiao, X., Ye, X., Wu, Y., Yin, X., Li, C., Chen, L., Shao, M., and Zheng, J.: Evolution of anthropogenic air pollutant emissions in Guangdong Province, China, from 2006 to 2015, Atmos. Chem. Phys., 19, 11701–11719, https://doi.org/10.5194/acp-19-11701-2019, 2019.
Chen, R. J., Yin, P., Meng, X., Wang, L. J., Liu, C., Niu, Y., Liu, Y. N., Liu, J. M., Qi, J. L., You, J. L., Kan, H. D., and Zhou, M. G.: Associations between coarse particulate matter air pollution and cause-specific mortality: A nationwide analysis in 272 Chinese cities, Environ. Health Perspect., 127, 017008, https://doi.org/10.1289/ehp2711, 2019.
Cheng, Y., Lee, S. C., Gu, Z. L., Ho, K. F., Zhang, Y. W., Huang, Y., Chow, J. C., Watson, J. G., Cao, J. J., and Zhang, R. J.: PM2.5 and PM10−2.5 chemical composition and source apportionment near a Hong Kong roadway, Particuology, 18, 96–104, https://doi.org/10.1016/j.partic.2013.10.003, 2015.
Cheung, K., Daher, N., Kam, W., Shafer, M. M., Ning, Z., Schauer, J. J., and Sioutas, C.: Spatial and temporal variation of chemical composition and mass closure of ambient coarse particulate matter (PM10−2.5) in the Los Angeles area, Atmos. Environ., 45, 2651–2662, https://doi.org/10.1016/j.atmosenv.2011.02.066, 2011.
Chow, J. C. and Watson, J. G.: Guideline on Speciated Particulate Monitoring, https://www3.epa.gov/ttn/amtic/files/ambient/pm25/spec/drispec.pdf (last access: 9 December 2021), 1998.
Chow, J. C., Watson, J. G., Chen, L. W. A., Chang, M. C. O., Robinson, N. F., Trimble, D., and Kohl, S.: The IMPROVE_A temperature protocol for thermal/optical carbon analysis: maintaining consistency with a long-term database, J. Air Waste Manage., 57, 1014–1023, https://doi.org/10.3155/1047-3289.57.9.1014, 2007.
Clements, A. L., Fraser, M. P., Upadhyay, N., Herckes, P., Sundblom, M., Lantz, J., and Solomon, P. A.: Chemical characterization of coarse particulate matter in the Desert Southwest – Pinal County Arizona, USA, Atmos. Pollut. Res., 5, 52–61, https://doi.org/10.5094/APR.2014.007, 2014.
Cohen, D. D., Garton, D., Stelcer, E., Hawas, O., Wang, T., Poon, S., Kim, J., Choi, B. C., Oh, S. N., Shin, H. J., Ko, M. Y., and Uematsu, M.: Multielemental analysis and characterization of fine aerosols at several key ACE-Asia sites, J. Geophys. Res.-Atmos., 109, D19S12, https://doi.org/10.1029/2003JD003569, 2004.
Daher, N., Ruprecht, A., Invernizzi, G., De Marco, C., Miller-Schulze, J., Heo, J. B., Shafer, M. M., Shelton, B. R., Schauer, J. J., and Sioutas, C.: Characterization, sources and redox activity of fine and coarse particulate matter in Milan, Italy, Atmos. Environ., 49, 130–141, https://doi.org/10.1016/j.atmosenv.2011.12.011, 2012.
Edgerton, E. S., Casuccio, G. S., Saylor, R. D., Lersch, T. L., Hartsell, B. E., Jansen, J. J., and Hansen, D. A.: Measurements of OC and EC in coarse particulate matter in the Southeastern United States, J. Air Waste Manage., 59, 78–90, https://doi.org/10.3155/1047-3289.59.1.78, 2009.
Fountoukis, C. and Nenes, A.: ISORROPIA II: a computationally efficient thermodynamic equilibrium model for K+–Ca2+–Mg2+–NH–Na+–SO–NO–Cl−–H2O aerosols, Atmos. Chem. Phys., 7, 4639–4659, https://doi.org/10.5194/acp-7-4639-2007, 2007.
Hand, J. L., Gill, T. E., and Schichtel, B. A.: Urban and rural coarse aerosol mass across the United States: Spatial and seasonal variability and long-term trends, Atmos. Environ., 218, 117025, https://doi.org/10.1016/j.atmosenv.2019.117025, 2019.
Harrison, R. M., Jones, A. M., and Lawrence, R. G.: Major component composition of PM10 and PM2.5 from roadside and urban background sites, Atmos. Environ., 38, 4531–4538, https://doi.org/10.1016/j.atmosenv.2004.05.022, 2004.
HKEPD: Air quality in Hong Kong 2019, Hong Kong Environmental Protection Department, Hong Kong, https://www.aqhi.gov.hk/api_history/english/report/files/AQR2019e_final.pdf (last access: 9 December 2021), 2020.
Ho, K. F., Lee, S. C., Chow, J. C., and Watson, J. G.: Characterization of PM10 and PM2.5 source profiles for fugitive dust in Hong Kong, Atmos. Environ., 37, 1023–1032, https://doi.org/10.1016/S1352-2310(02)01028-2, 2003.
Hsu, Y. K., Holsen, T. M., and Hopke, P. K.: Comparison of hybrid receptor models to locate PCB sources in Chicago, Atmos. Environ., 37, 545–562, https://doi.org/10.1016/S1352-2310(02)00886-5, 2003.
Huang, X. H. H., Bian, Q. J., Ng, W. M., Louie, P. K. K., and Yu, J. Z.: Characterization of PM2.5 major components and source investigation in suburban Hong Kong: A one year monitoring study, Aerosol Air Qual. Res., 14, 237–250, https://doi.org/10.4209/aaqr.2013.01.0020, 2014.
Huang, Z. J., Zhong, Z. M., Sha, Q. G., Xu, Y. Q., Zhang, Z. W., Wu, L. L., Wang, Y. Z., Zhang, L. H., Cui, X. Z., Tang, M. S., Shi, B. W., Zheng, C. Z., Li, Z., Hu, M. M., Bi, L. L., Zheng, J. Y., and Yan, M.: An updated model-ready emission inventory for Guangdong Province by incorporating big data and mapping onto multiple chemical mechanisms, Sci. Total Environ., 769, 144535, https://doi.org/10.1016/j.scitotenv.2020.144535, 2021.
Hueglin, C., Gehrig, R., Baltensperger, U., Gysel, M., Monn, C., and Vonmont, H.: Chemical characterisation of PM2.5, PM10 and coarse particles at urban, near-city and rural sites in Switzerland, Atmos. Environ., 39, 637–651, https://doi.org/10.1016/j.atmosenv.2004.10.027, 2005.
Jiang, S. Y. N., Gali, N. K., Yang, F. H., Zhang, J. K., and Ning, Z.: Chemical characterization of size-segregated PM from different public transport modes and implications of source specific contribution to public exposure, Environ. Sci. Pollut. Res., 24, 20029–20040, https://doi.org/10.1007/s11356-017-9661-6, 2017.
Kandler, K., Schütz, L., Deutscher, C., Ebert, M., Hofmann, H., Jäckel, S., Jaenicke, R., Knippertz, P., Lieke, K., Massling, A., Petzold, A., Schladitz, A., Weinzierl, B., Wiedensohler, A., Zorn, S., and Weinbruch, S.: Size distribution, mass concentration, chemical and mineralogical composition and derived optical parameters of the boundary layer aerosol at Tinfou, Morocco, during SAMUM 2006, Tellus B, 61, 32–50, https://doi.org/10.1111/j.1600-0889.2008.00385.x, 2009.
Lei, J., Yang, T., Huang, S. J., Li, H. C., Zhu, Y. X., Gao, Y., Jiang, Y. X., Wang, W. D., Liu, C., Kan, H. D., and Chen, R. J.: Hourly concentrations of fine and coarse particulate matter and dynamic pulmonary function measurements among 4992 adult asthmatic patients in 25 Chinese cities, Environ. Int., 158, 106942, https://doi.org/10.1016/j.envint.2021.106942, 2022.
Lin, P. and Yu, J. Z.: Generation of reactive oxygen species mediated by humic-like substances in atmospheric aerosols, Environ. Sci. Technol., 45, 10362–10368, https://doi.org/10.1021/es2028229, 2011.
Louie, P. K. K., Watson, J. G., Chow, J. C., Chen, A., Sin, D. W., and Lau, A. K.: Seasonal characteristics and regional transport of PM2.5 in Hong Kong, Atmos. Environ., 39, 1695–1710, https://doi.org/10.1016/j.atmosenv.2004.11.017, 2005.
Norris, G., Duvall, R., Brown, S., and Bai, S.: EPA Positive Matrix Factorization (PMF) 5.0 fundamentals and user guide, prepared for the U. S. Environmental Protection Agency, Office of Research and Development, Washington, DC, https://www.epa.gov/sites/default/files/2015-02/documents/pmf_5.0_user_guide.pdf (last access: 9 December 2021), 2014.
Paatero, P. and Tapper, U.: Positive matrix factorization: A non-negative factor model with optimal utilization of error estimates of data values, Environmetrics, 5, 111–126. https://doi.org/10.1002/env.3170050203, 1994.
Pant, P. and Harrison, R. M.: Estimation of the contribution of road traffic emissions to particulate matter concentrations from field measurements: A review, Atmos. Environ., 77, 78–97, https://doi.org/10.1016/j.atmosenv.2013.04.028, 2013.
Petit, J. E., Favez, O., Albinet, A., and Canonaco, F.: A user-friendly tool for comprehensive evaluation of the geographical origins of atmospheric pollution: Wind and trajectory analyses, Environ. Model. Softw., 88, 183–187, https://doi.org/10.1016/j.envsoft.2016.11.022, 2017.
Putaud, J. P., Van Dingenen, R., Alastuey, A., Bauer, H., Birmili, W., Cyrys, J., Flentje, H., Fuzzi, S., Gehrig, R., Hansson, H. C., Harrison, R. M., Herrmann, H., Hitzenberger, R., Hüglin, C., Jones, A. M., Kasper-Giebl, A., Kiss, G., Kousa, A., Kuhlbusch, T. A. J., Löschau, G., Maenhaut, W., Molnar, A., Moreno, T., Pekkanen, J., Perrino, C., Pitz, M., Puxbaum, H., Querol, X., Rodriguez, S., Salma, I., Schwarz, J., Smolik, J., Schneider, J., Spindler, G., Brink, H. T., Tursic, J., Viana,M., Wiedensohler, A., and Raes, F.: A European aerosol phenomenology – 3: Physical and chemical characteristics of particulate matter from 60 rural, urban, and kerbside sites across Europe, Atmos. Environ., 44, 1308–1320, https://doi.org/10.1016/j.atmosenv.2009.12.011, 2010.
Stein, A. F., Draxler, R. R., Rolph, G. D., Stunder, B. J., Cohen, M. D., and Ngan, F.: NOAA's HYSPLIT atmospheric transport and dispersion modeling system, B. Am. Meteorol. Soc., 96, 2059–2077, https://doi.org/10.1175/BAMS-D-14-00110.1, 2015.
Stone, E., Schauer, J., Quraishi, T. A., and Mahmood, A.: Chemical characterization and source apportionment of fine and coarse particulate matter in Lahore, Pakistan, Atmos. Environ., 44, 1062–1070, https://doi.org/10.1016/j.atmosenv.2009.12.015, 2010.
Taiwo, A. M., Harrison, R. M., and Shi, Z. B.: A review of receptor modelling of industrially emitted particulate matter, Atmos. Environ., 97, 109–120, https://doi.org/10.1016/j.atmosenv.2014.07.051, 2014.
Tang, M., Cziczo, D. J., and Grassian, V. H.: Interactions of water with mineral dust aerosol: water adsorption, hygroscopicity, cloud condensation, and ice nucleation, Chem. Rev., 116, 4205–4259, https://doi.org/10.1021/acs.chemrev.5b00529, 2016.
USEPA: Integrated Science Assessment for Particulate Matter, the U.S. Environmental Protection Agency, Research Triangle Park, NC, https://www.epa.gov/isa/integrated-science-assessment-isa-particulate-matter (last access: 9 December 2021), 2019.
Turpin, B. J. and Lim, H. J.: Species contributions to PM2.5 mass concentrations: Revisiting common assumptions for estimating organic mass, Aerosol Sci. Technol., 35, 602–610, https://doi.org/10.1080/02786820119445, 2001.
Wu, C. and Yu, J. Z.: Evaluation of linear regression techniques for atmospheric applications: the importance of appropriate weighting, Atmos. Meas. Tech., 11, 1233–1250, https://doi.org/10.5194/amt-11-1233-2018, 2018.
Xu, W. Y., Kuang, Y., Liang, L. L., He, Y., Cheng, H. B., Bian, Y. X., Tao, J. C., Zhang, G., Zhao, P. S., Ma, N., Zhao, H. R., Zhou, G. S., Su, H., Cheng, Y. F., Xu, X. B., Shao, M., and Sun, Y.: Dust-dominated coarse particles as a medium for rapid secondary organic and inorganic aerosol formation in highly polluted air, Environ. Sci. Technol., 54, 15710–15721, https://doi.org/10.1021/acs.est.0c07243, 2020.
Xue, J., Yuan, Z. B., Lau, A. K. H., and Yu, J. Z.: Insights into factors affecting nitrate in PM2.5 in a polluted high NOx environment through hourly observations and size distribution measurements, J. Geophys. Res.-Atmos., 119, 4888–4902, https://doi.org/10.1002/2013JD021108, 2014.
Yu, J. Z. and Zhang, T.: Chemical speciation of PM2.5 filter samples – January 1 through December 31, 2017, Final report submitted to the Hong Kong Environmental Protection Department, The Government of the Hong Kong Special Administrative Region, https://www.epd.gov.hk/epd/sites/default/files/epd/english/ (last access: 9 December 2021), 2018.
Yu, J. Z., Tung, J. W. T., Wu, A. W. M., Lau, A. K. H., Louie, P. K. K., and Fung, J. C. H.: Abundance and seasonal characteristics of elemental and organic carbon in Hong Kong PM10, Atmos. Environ., 38, 1511–1521, https://doi.org/10.1016/j.atmosenv.2003.11.035, 2004.
Yuan, Z. B., Yadav, V., Turner, J. R., Louie, P. K. K., and Lau, A. K. H.: Long-term trends of ambient particulate matter emission source contributions and the accountability of control strategies in Hong Kong over 1998–2008, Atmos. Environ., 76, 21–31, https://doi.org/10.1016/j.atmosenv.2012.09.026, 2013.
Zhang, X. X., Yuan, Z. B., Li, W. S., Lau, A. K. H., Yu, J. Z., Fung, J. C. H., Zheng, J. Y., and Yu, A. L. C.: Eighteen-year trends of local and non-local impacts to ambient PM10 in Hong Kong based on chemical speciation and source apportionment, Atmos. Res., 214, 1–9, https://doi.org/10.1016/j.atmosres.2018.07.004, 2018.
Zhou, S., Davy, P. K., Huang, M., Duan, J., Wang, X., Fan, Q., Chang, M., Liu, Y., Chen, W., Xie, S., Ancelet, T., and Trompetter, W. J.: High-resolution sampling and analysis of ambient particulate matter in the Pearl River Delta region of southern China: source apportionment and health risk implications, Atmos. Chem. Phys., 18, 2049–2064, https://doi.org/10.5194/acp-18-2049-2018, 2018.