the Creative Commons Attribution 4.0 License.
the Creative Commons Attribution 4.0 License.
 | 14 Apr 2022
Kinetics of OH + SO2 + M: temperature-dependent rate coefficients in the fall-off regime and the influence of water vapour
Wenyu Sun
Matias Berasategui
Andrea Pozzer
Jos Lelieveld
The OH-initiated oxidation of SO2 is the dominant, first step in the transformation of this atmospherically important trace gas to particulate sulfate, and accurate rate coefficients for the title reaction under all atmospheric conditions (pressures, temperatures, and humidity) are required to assess its role in, for example, new particle formation. Prior to this study, no temperature-dependent data were available in the fall-off regime for atmospherically relevant bath gases. We thus address an important omission in the kinetic database for this reaction and highlight significant discrepancies in recommended parameterizations. In this work, generation of OH via pulsed laser photolysis at 248 and 351 nm was coupled to its detection by laser-induced fluorescence to obtain rate coefficients (k1) for the title reaction at pressures of 14–742 Torr (1 Torr = 1.333 hPa) and temperatures of 220–333 K in N2 bath gas. In situ SO2 concentrations, central to accurate kinetic measurements under pseudo-first-order conditions, were measured by optical absorption. Under the conditions of the present study, the termolecular reaction between OH and SO2 is in the fall-off regime, and we parameterized the rate coefficients in N2 in terms of low- (k1,0) and high-pressure (k1,∞) limiting rate coefficients and a broadening factor (FC) to obtain ( K)−4.10 cm6 molecule−2 s−1, cm3 molecule−1 s−1, and FC=0.58. The effects of water vapour on the title reaction were explored through measurements in N2–H2O mixtures at 273, 298, and 333 K using the same experimental methods. The rate coefficients are significantly enhanced by the presence of water vapour with ( K)−4.90 cm6 molecule−2 s−1, which indicates that H2O is a factor >5 more efficient in quenching the HOSO2* association complex than N2. A model-based comparison of our rate coefficients and parameterization with previous literature measurements and recommendations of evaluation panels are presented and discussed. The use of the new parameterization instead of the IUPAC or NASA evaluations, particularly after including H2O as a third-body quencher, leads to a significant (10 %–30 %) reduction in the lifetime of SO2 in some parts of the atmosphere and increases the ratio concomitantly.
- Article
(4694 KB) - Full-text XML
-
Supplement
(616 KB) - BibTeX
- EndNote


Sulfur enters the atmosphere predominantly in the form of gaseous sulfur dioxide (SO2), which results from both natural and anthropogenic sources (Stevenson et al., 2003). The amount of SO2 produced from human activities, particularly via fossil fuel combustion, is similar to that resulting from natural emissions (e.g. volcanic eruptions) and can be dominant on a regional scale (Brown, 1982; Brimblecombe, 2013; Lelieveld et al., 1997). SO2 is a key intermediate during the complex chemical and photochemical reactions that ultimately transform reduced sulfur compounds to sulfates. The oxidation of SO2 in the atmosphere occurs in the gas phase as well as in droplets and aerosol particles (Liu et al., 2020; Cox, 1979; Beilke and Gravenhorst, 1978). The gas-phase oxidation of SO2 is initiated mainly by the OH radical (Reaction R1), with a small contribution in forested regions by stabilized Criegee intermediates (Mauldin Iii et al., 2012; Huang and Chao, 2015). Based on a seasonal, global average boundary layer OH concentration of 1 × 10⁶ molecule cm−3 and the present recommendation for the rate coefficient (Atkinson et al., 2004; IUPAC, 2021), the lifetime of SO2 with respect to reaction with OH (to form HOSO2) is a few days.
Once collisionally stabilized HOSO2 reacts with O2 to form SO3 (Reaction R2), which is hydrolysed to sulfuric acid (H2SO4) (Reaction R3),
H2SO4 can initiate particle formation (e.g. via reactions with basic trace gases such as NH3) or condense on existing particles, thus contributing to aerosol formation, growth, and cloud droplet nucleation (Kulmala et al., 1998; Vehkamäki et al., 2002; Sipilä et al., 2010; Saltzman et al., 1983). The aforementioned processes occur throughout the atmosphere, affecting ecosystems as well as the earth troposphere radiation budget and thus climate (Badr and Probert, 1994; Lelieveld and Heintzenberg, 1992; Stevenson et al., 2003; Feichter et al., 1996). In addition, the oxidation of SO2 to sulfate is a major sink of stratospheric OH and water (Bekki, 1995) and provides surface area for heterogeneous processes that, for example, contribute to stratospheric ozone depletion (Weisenstein et al., 1996; Heckendorn et al., 2009).
As a result of its central importance to atmospheric chemistry, the kinetics of the title reaction have been investigated in numerous experimental studies. The results of laboratory investigations of k1, which serve as the basis for the IUPAC (IUPAC, 2021) and NASA (Burkholder et al., 2020) evaluation panels, are summarized in Table 1. A few early measurements of k1 at around 298 K and 1 atm N2 (or air) (Izumi et al., 1984; Barnes et al., 1986; Davis et al., 1979; Castleman Jr. and Tang, 1976; Cox and Sheppard, 1980) are not included in Table 1, as they do not contain information on the pressure or temperature dependence of the title reaction and display relatively large differences in k1 at 298 K and 1 atm, with values ranging from 5.99 × 10⁻¹³ to 1.22 × 10⁻¹² cm3 molecule−1 s−1. Surprisingly, for such an important reaction in atmospheric chemistry, no temperature-dependent measurements of k1 in the fall-off regime have been carried out in atmospherically relevant bath gases (e.g. air or N2) but in He, for which the collision efficiency is much lower than for N2 and O2, the dominant components of the atmosphere. In addition, the latest measurements of k1, (Blitz et al., 2017a) using modern, laser-based photolysis methods, suggest that previous measurements were strongly biased (to larger values) by the photoexcitation/dissociation of SO2 (see later).
Table 1Temperature- and pressure-dependent measurements of k1.

Notes: DF-RF is discharge flow–resonance fluorescence, FP-RA is flash photolysis–resonance absorption, FP-RF is flash photolysis–resonance fluorescence, DF-EPR-MS is discharge flow–electric paramagnetic resonance/mass spectrometry, FP-LIF is flash photolysis–laser-induced fluorescence, LP-LIF is laser flash photolysis–laser-induced fluorescence. RT is room temperature.
The title reaction is in the fall-off regime across the temperature and pressure ranges in the atmosphere. To parameterize the rate coefficients for such reactions, the Troe-type formulation (Troe, 1983) is widely used, which requires experimentally determined high-pressure (k1,∞) and low-pressure (k1,0) limiting rate coefficients as well as a broadening factor describing the transition at intermediate pressures. To date, the rate coefficient at the high-pressure limit has not been measured directly, and the value of k1 at 298 K of ∼ 2.4 × 10⁻¹² cm3 molecule−1 s−1 at 96 bar (72 000 Torr) of He, the highest pressure explored to date, is still below the extrapolated k1,∞ value of 3.6 × 10⁻¹² cm3 molecule−1 s−1 (Fulle et al., 1999). Blitz et al. (2017a) derived values of k1,∞ indirectly via measurements of the vibrational relaxation of OH in collision with SO2 but obtained a much lower value of cm3 molecule−1 s−1. The values of k1,∞, presently recommended by IUPAC (last updated in November 2017) and NASA (last updated in May 2020), are 2.0 × 10⁻¹² and 1.7 × 10⁻¹² cm3 molecule−1 s−1, respectively, falling between those of Fulle et al. (1999) and Blitz et al. (2017a).
From the studies reporting low-pressure limiting rate coefficients, largely obtained in flow-tube experiments, it is unclear whether k1,0 could be accurately derived through linear fitting to measured values of k1 over a small pressure range, as measurements at the experimental pressures (a few Torr) were already impacted by fall-off. As discussed by Amedro et al. (2019), other factors such as wall losses of OH add to the difficulty of deriving accurate low-pressure limiting rate coefficients in flow-tube experiments, especially at low temperatures.
Apart from N2 and O2, water vapour (H2O) is a major atmospheric component. In particular, in the relatively warm boundary layer, for example, in the tropics, the mixing ratio of water vapour can exceed 5 %. For termolecular reactions involving OH, H2O may be expected to be a more efficient third-body quenching agent than N2 and O2 (Troe, 2003; Amedro et al., 2020), and the presence of water vapour can significantly enhance rate coefficients of third-body reactions in the low-pressure and fall-off regimes. A recent study (Amedro et al., 2020) demonstrated that neglecting to consider the influence of water vapour would lead to an underestimation in the rate coefficients of the OH + NO2 reaction by ∼ 10 % in some parts of the lower atmosphere. Given the similarities between the title reaction and the OH + NO2 reaction, the participation of H2O as a third-body quencher may also significantly enhance k1, and such effects need to be examined experimentally.
The goals of this study were to address some of the shortcomings in the present dataset on the reaction of OH with SO2 by accurately measuring k1 in N2 bath gas over a wide temperature/pressure range relevant for the atmosphere and to elucidate the role of water vapour as a third-body quencher in the title reaction. Such datasets are expected to yield a new parameterization for k1 with reduced uncertainties.
Rate coefficients for the title reaction were derived using the pulsed-laser-photolysis (PLP) laser-induced fluorescence (LIF) technique under pseudo-first-order conditions ([SO2] ≫ [OH]; see Sect. 3.2). The concentrations of SO2, as well as H2O in the experiments exploring the effect of water vapour, were obtained online via optical absorption measurements.
2.1 PLP-LIF technique
Detailed descriptions of the PLP-LIF setup are given in previous publications (Wollenhaupt et al., 2000; Amedro et al., 2019). Briefly, the reaction took place in a jacketed, cylindrical quartz reactor with a volume of ∼ 500 cm3, and the temperature inside the reactor was regulated by circulating ethanol (at 220 K) or 60 : 40 ethylene glycol mixture (250, 273, and 333 K) through an outer jacket. The temperature at the centre of the reaction volume was monitored by a J-type thermocouple before and after each experiment; the pressure was measured using 100 and 1000 Torr capacitance manometers. The average linear velocity of gas flowing through the tubular reactor was kept at ∼ 8–9 cm s−1 by adjusting the total flow rates. As the flow direction and laser beams (0.8 cm diameter) are perpendicular to each other, a linear velocity of over 8 cm−1 ensures that a fresh gas sample was photolysed at each laser pulse (10 Hz), and the volume of gas imaged onto the photomultiplier tube (PMT) is replenished between pulses. For the vast majority of experiments, a KrF excimer laser (COMPex 205F, Coherent) provided pulses of 248 nm light (∼ 20 ns) to photolyse H2O2 or HNO3 for the generation of OH radicals in the vibrational ground state (Schiffman et al., 1993).
In addition, a limited set of experiments were carried out in which HONO was photolysed at 351 nm (XeF excimer laser):
OH radicals thus generated were excited at 282 nm by a YAG-pumped dye laser, and the subsequent OH fluorescence was detected by a photomultiplier placed behind a 309 nm interference filter and a BG 26 glass cut-off filter. The photolysis laser fluence was measured by a Joule meter placed behind the exit window of the reactor, and the shot-to-shot variation in the intensity of the dye laser was monitored by a photodiode. The timing between the triggers of the photolysis and probe lasers was scanned using a digital delay generator; time-dependent OH profiles were obtained by accumulating the fluorescence signals using a boxcar integrator. Fluorescence resulting from the excitation of SO2 at 282 nm was also observed using this setup, which results in a constant background signal during each experiment. Typically, 20 points were recorded before triggering the excimer laser to measure the background signal, which also includes a component from electronic noise. The background signal was subtracted from the measured OH profile before further kinetic analyses.
2.2 Online optical absorption measurements
The accurate determination of the rate coefficients under pseudo-first-order conditions requires reliable quantification of SO2 concentrations ([SO2]). In this work, online optical absorption cells were located both upstream and downstream of the reactor to monitor the SO2 concentration at room temperature (298 K). Upstream of the reactor, light from a deuterium lamp was directed through a multi-pass absorption cell (l=110 cm cm) and detected by a low-resolution (Δλ=2 nm) spectrograph (Ocean-Optics USB 2000). The measured optical density over the wavelength range of 240–325 nm was fit to a reference spectrum (Manatt and Lane, 1993) to derive SO2 concentrations. The second (downstream) optical absorption cell (l=34.8 cm) was equipped with a low-pressure zinc lamp and monitored optical density at 213.86 nm to measure the concentration of SO2 (see Sect. 3.1) and the OH precursors H2O2 and HNO3. SO2 concentrations were calculated using a 213.86 nm cross-section derived in separate experiments (see later). Concentrations of H2O2 and HNO3 were calculated using σ213.86 nm (H2O2) (Vaghjiani and Ravishankara, 1989) and σ213.86 nm (HNO3) cm2 molecule−1 (Dulitz et al., 2018).
Approximate, initial concentrations of OH radicals were calculated from the precursor concentrations and the excimer laser fluence as recorded by the Joule-meter. A third absorption cell (l=40 cm, located downstream of the 213.86 nm cell) equipped with a low-pressure 184.95 nm Hg lamp as light source was additionally used in the experiments exploring the impact of water vapour. In this case, a cross-section of σ184.95 nm (H2O) = 7.14 × 10⁻²⁰ cm2 molecule−1 (Cantrell et al., 1997) was used.
2.3 Chemicals
Nitrogen (N2; 99.999 %) was supplied by Westfalen and used without further purification. SO2 (Merck, 99.8 %) was diluted in N2 and stored in a stainless-steel cylinder. Hydrogen peroxide (H2O2, AppliChem, 35 %) was vacuum-distilled to >90 wt % purity. Anhydrous HNO3 was synthesized by mixing potassium nitrate (KNO3; Sigma-Aldrich, 99 %) and sulfuric acid (H2SO4; Roth, 98 %) and condensing the HNO3 vapour in a trap cooled with liquid nitrogen. Distilled water (Merck, liquid-chromatography-grade) was degassed before use.
3.1 Quantification of SO2 concentrations
SO2 absorption spectra over 170–330 nm at room temperature are presented in Fig. 1, including a low-resolution (Δλ=0.1 nm) dataset reviewed and compiled by Manatt and Lane (1993) and a set of higher-resolution data ( nm) spanning 198–325 nm reported by Stark et al. (Stark et al., 1999; Rufus et al., 2003). The two absorption bands (240–330 and 170–230 nm) correspond to the and the transitions, respectively (Rollins et al., 2016). The high-resolution measurements by Stark et al. (1999) reveal very narrow rotational–vibrational lines in the 200–220 nm region and cross-sections that are factors of 2–3 larger than those of Manatt and Lane (1993). Clearly, the use of an inappropriate cross-section at the wavelength of our very narrow Zn atomic emission line (∼ 213.86 nm) could introduce large uncertainty in SO2 concentration. For this reason, we derived an effective cross-section for our Zn-lamp emission by comparing absorption measurements in the multi-pass cell and the 213.86 nm cell for a flowing gas mixture of SO2 in N2. We refer to this cross-section as an “effective” cross-section as nearby, weaker atomic lines will also pass through the interference filter (214 ± 5 nm) used to isolate the 213.86 nm line. In Fig. 1, broadband (240–325 nm, resolution ∼ 2 nm) absorption measurements recorded using the multi-pass cell are compared to the reference spectrum of Manatt and Lane (1993). SO2 concentrations were determined through least-squares fitting the measured optical density to the reference spectrum degraded to the same resolution as our spectrometer. The effective cross-section at 213.86 nm was then derived according to the Beer–Lambert law, taking into account pressure differences in the two absorption cells, as shown in Fig. 2. The slope of a linear regression through the data points is the effective cross-section of SO2 at the emission wavelength of our low-pressure Zn lamp. The value obtained (4.00 × 10⁻¹⁸ cm2 molecule−1) is very close (within ∼ 3 %) to the value of 4.07 × 10⁻¹⁸ cm2 molecule−1 listed at 213.86 nm by Stark et al. (1999) and the value of 3.87 × 10⁻¹⁸ cm2 molecule−1 derived by Wine et al. (1984) using a similar experimental setup. The high coefficient of determination (R2=0.9984) for the linear regression of all data points obtained at different pressures (41 to 494 Torr) indicates that the effective value of σ213.86(SO2) is independent of pressure. SO2 concentration measurements using the two absorption cells in the experiments at different temperatures are plotted in Fig. 3. The good agreement (slope very close to 1) between the measured (at room temperature) SO2 concentrations upstream and downstream of the reactor (held at temperatures between 220 and 333 K) shows that no SO2 is lost in transit (e.g. via adsorption to surfaces or condensation) through the cold/hot reactor. The scatter in this plot is caused by small baseline shifts in the long path measurements upstream of the reactor.

Figure 1SO2 absorption spectra reported by Manatt and Lane (1993) and Stark et al. (1999; Rufus et al., 2003). The black line is the result of degrading the resolution in the 240–325 nm region to that of our optical density measurements (blue line).
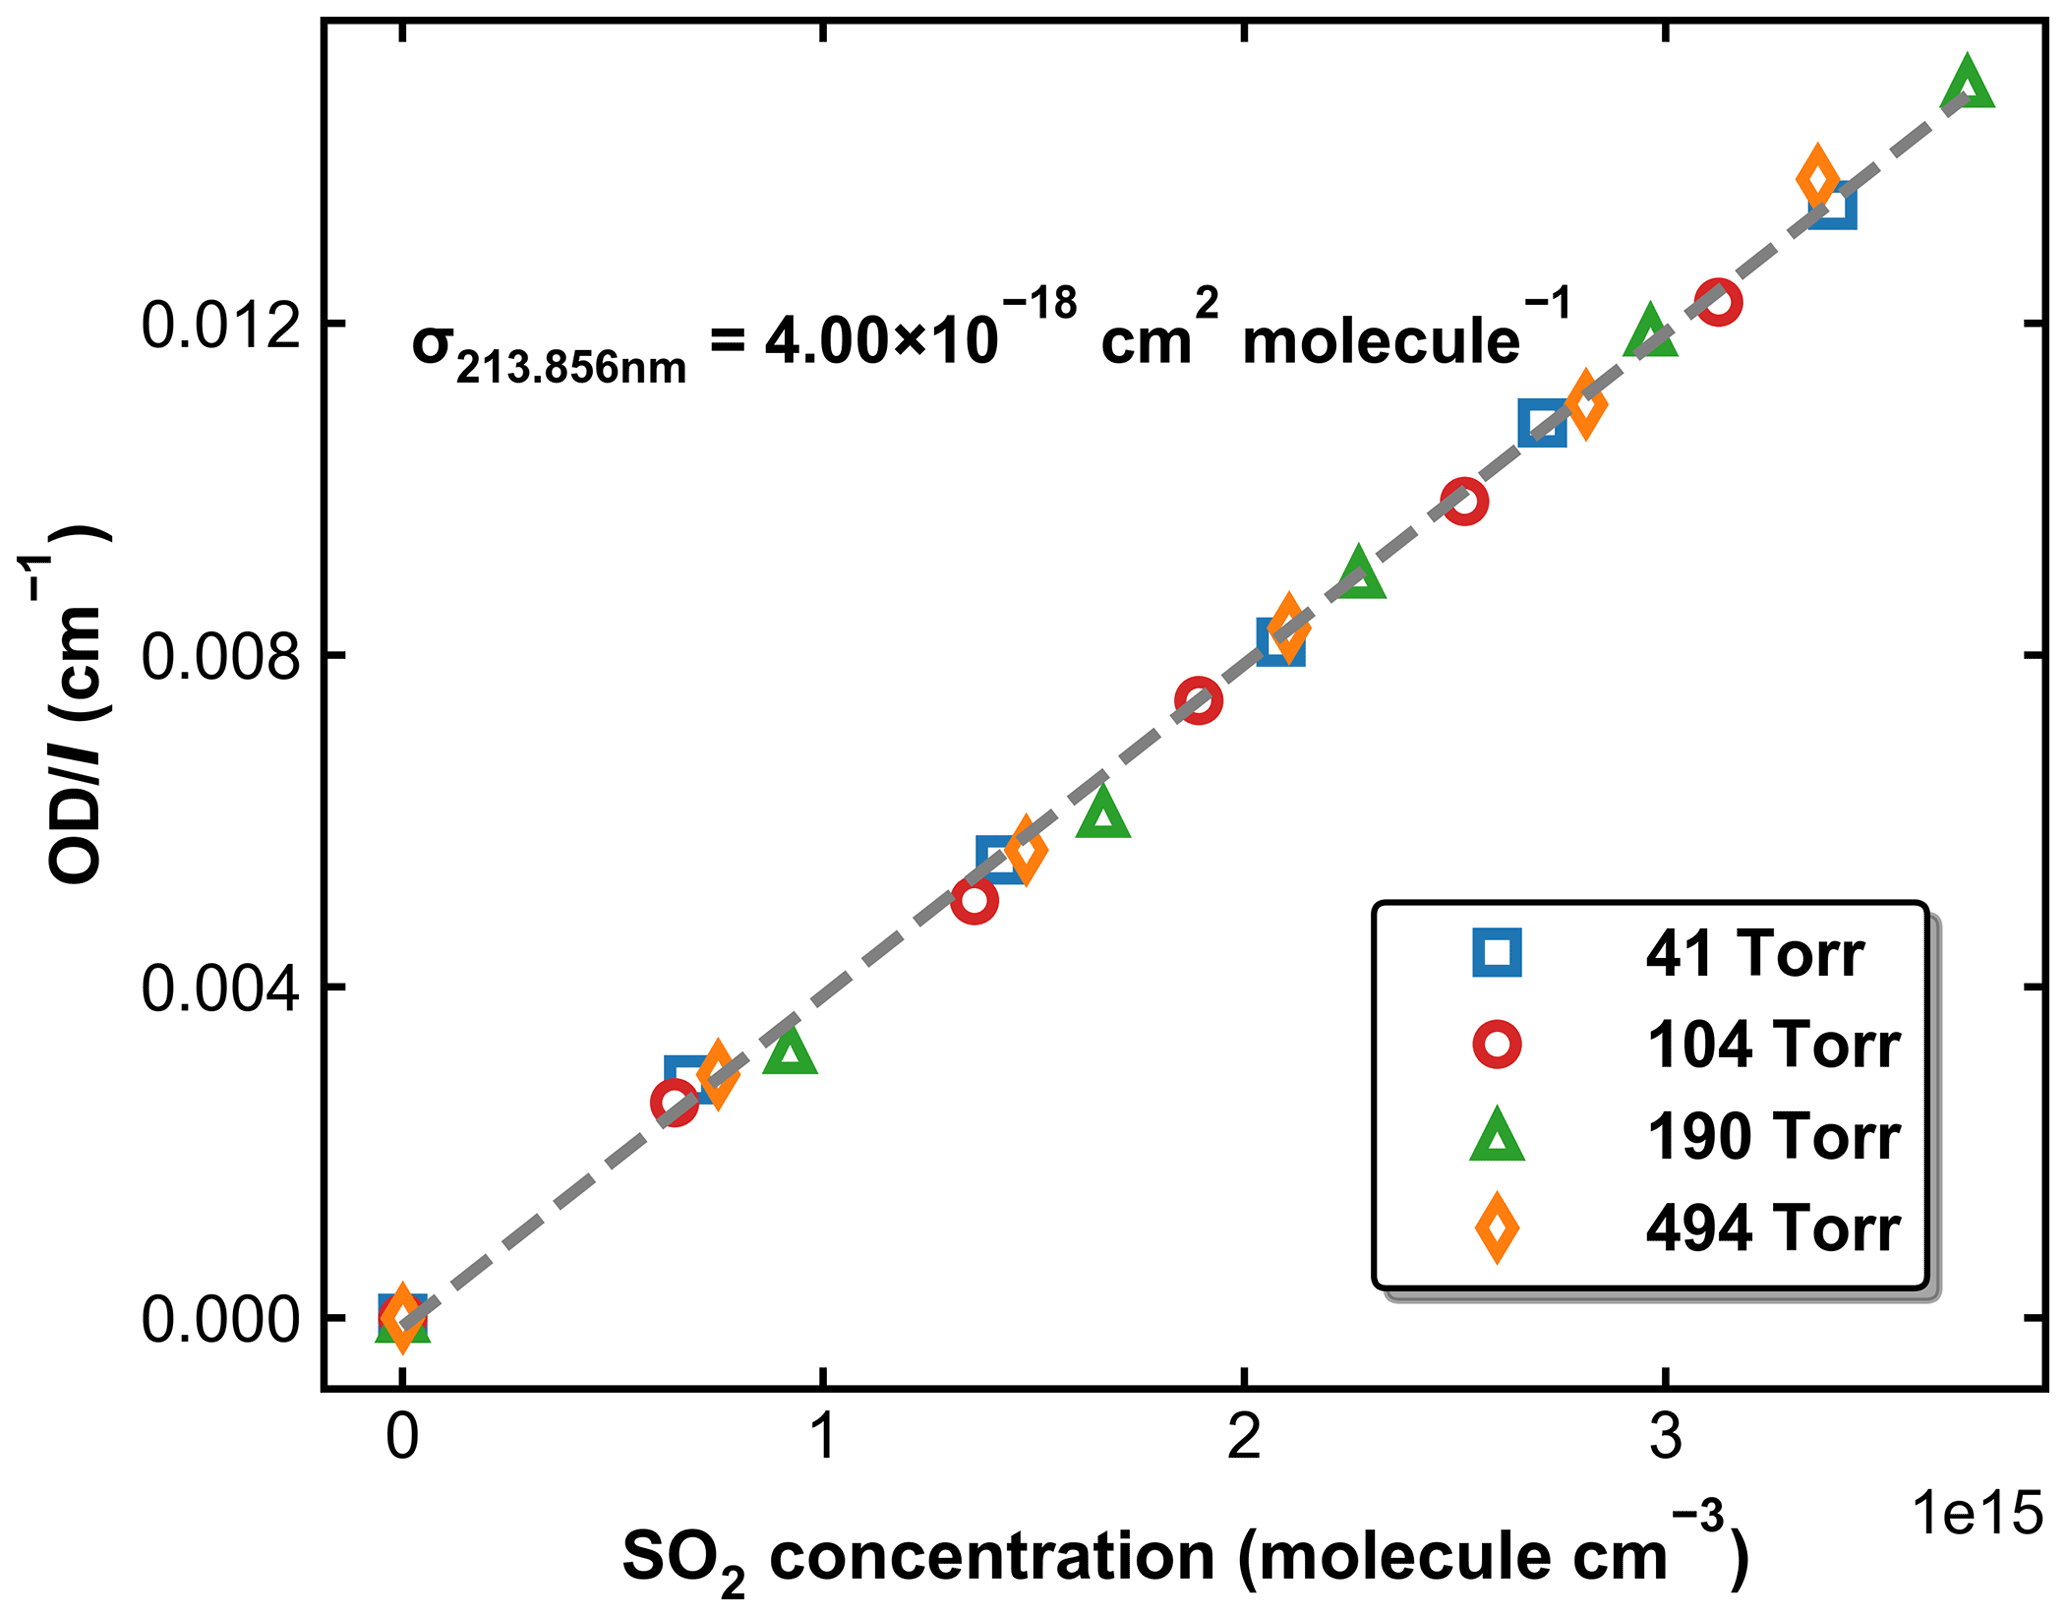
Figure 2Normalized optical density in the 213.86 nm absorption cell as a function of SO2 concentration measured using the multi-pass absorption cell. The experiments were performed at 298 K and pressures of 41, 104, 190, and 494 Torr. The dashed grey line is a linear regression, for which the slope is the effective cross-section of SO2 at 213.86 nm.
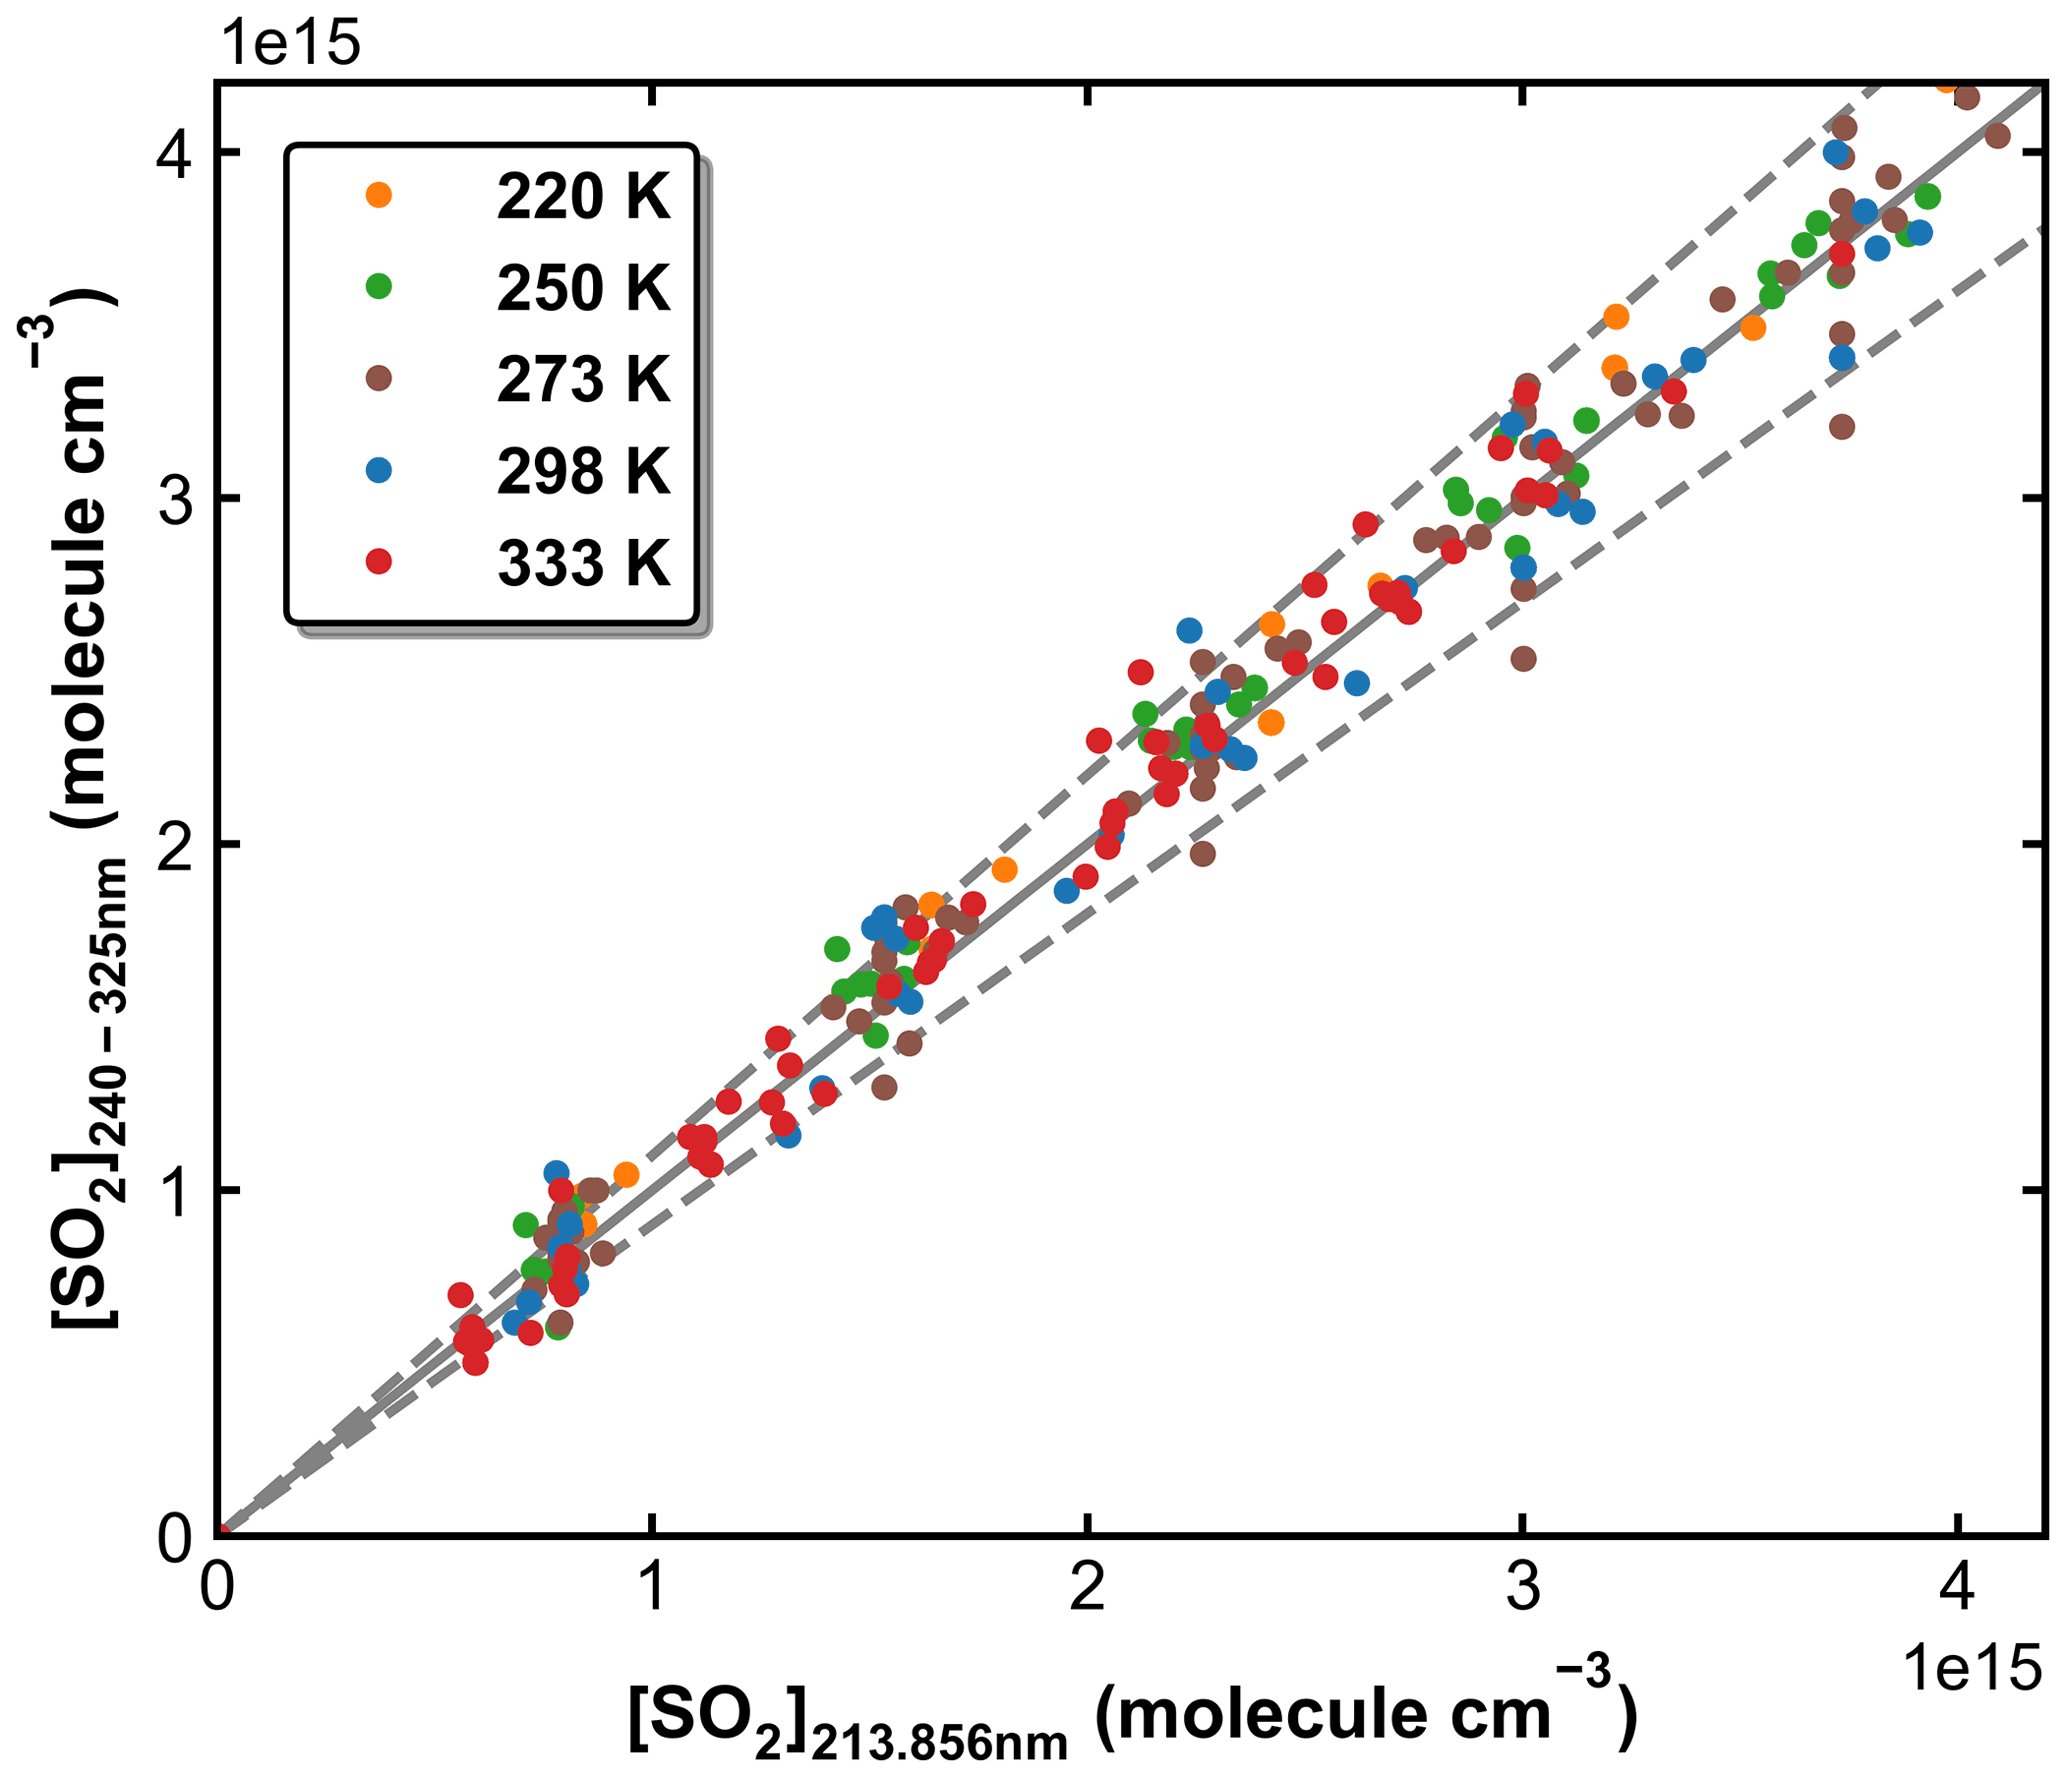
Figure 3SO2 concentrations measured in experiments at different temperatures using the multi-pass absorption cell upstream of the reactor (y axis) and the 213.86 nm absorption cell downstream of the reactor (x axis). The solid line represents y=x, and the dashed lines are y=1.1x and y=0.9x.
3.2 Rate coefficients for the title reaction in N2
Rate coefficients for the title reaction in N2 bath were measured at pressures between 14 and 742 Torr at five different temperatures (220, 250, 273, 298, and 333 K). In deriving a parameterization for the rate coefficient in air (see later), we assume that, as is the case for the vast majority of termolecular reactions, N2 and O2 (the major components of air) have the same collisional quenching efficiency. In all experiments, the initial OH concentration was kept sufficiently low (1011–1012 molecule cm−3) relative to that of SO2 (6 × 10¹⁴ to 6 × 10¹⁵ molecule cm−3), so that pseudo-first-order conditions applied and the decay of OH may be described by
where [OH]t is the OH concentration at time t after the photolysis laser pulse, and k′ is the pseudo-first-order rate coefficient defined as
where k1 (in cm3 molecule−1 s−1) is the bimolecular rate coefficient for the title reaction, and kd (in s−1) accounts for the OH removal through reactions with H2O2 or HNO3 (Reaction R7 or R8) as well as OH loss due to diffusion out of the reaction zone.
Figure 4 displays a set of OH decay profiles at six different SO2 concentrations ranging from 0 to 5.34 × 10¹⁵ molecule cm−3 at 298 K in 59.9 Torr N2. H2O2 was used as OH precursor in this dataset, and the initial OH concentration was ∼ 4 × 10¹¹ molecule cm−3. Each OH decay is the average of 20 measurements taken over a period of ∼ 5 min. For each profile, the decay constant k′ was obtained through least-squares fitting to Eq. (1). From each set of OH decays at a given temperature, pressure, and bath gas, the associated bimolecular rate coefficient k1 was derived using Eq. (2) as shown in Fig. 5, which plots k′ against [SO2] at 298 K at four different pressures.
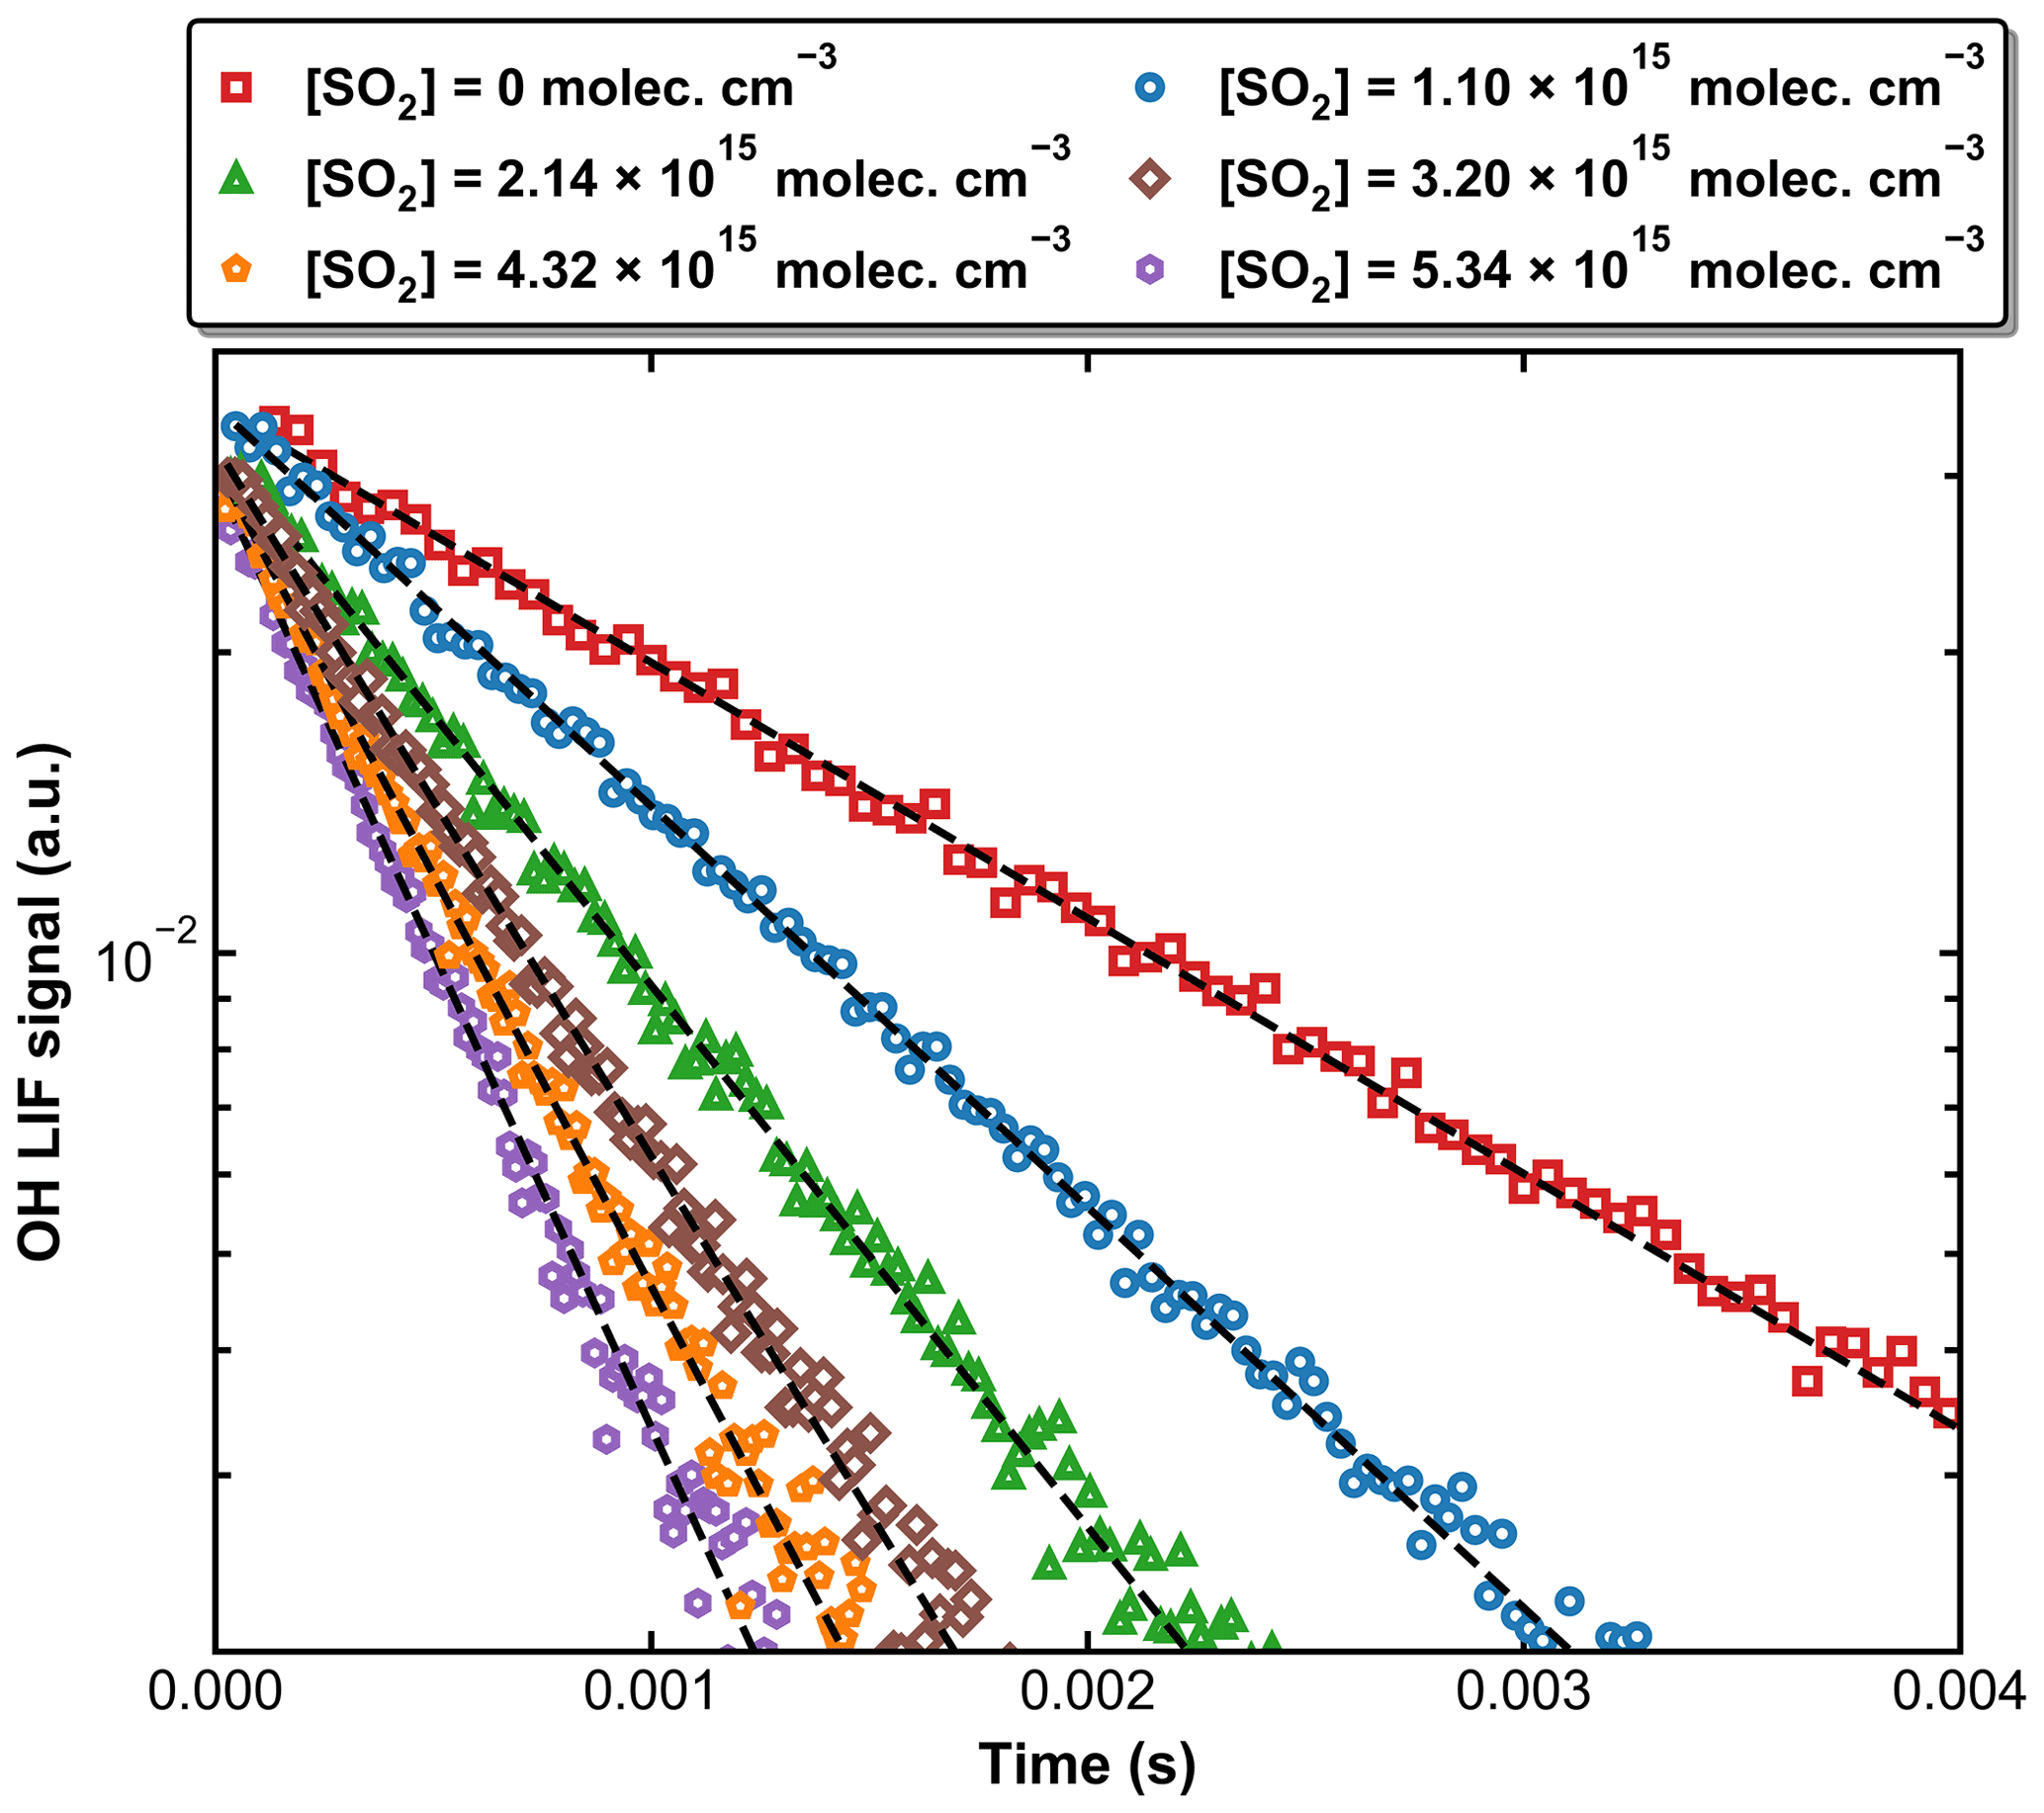
Figure 4Exponential decay of OH at 298 K and 59.9 Torr (N2 bath gas) in the presence of six different SO2 concentrations. OH was generated by the photolysis of H2O2 at 248 nm. The dashed black lines are fits using Eq. (1).
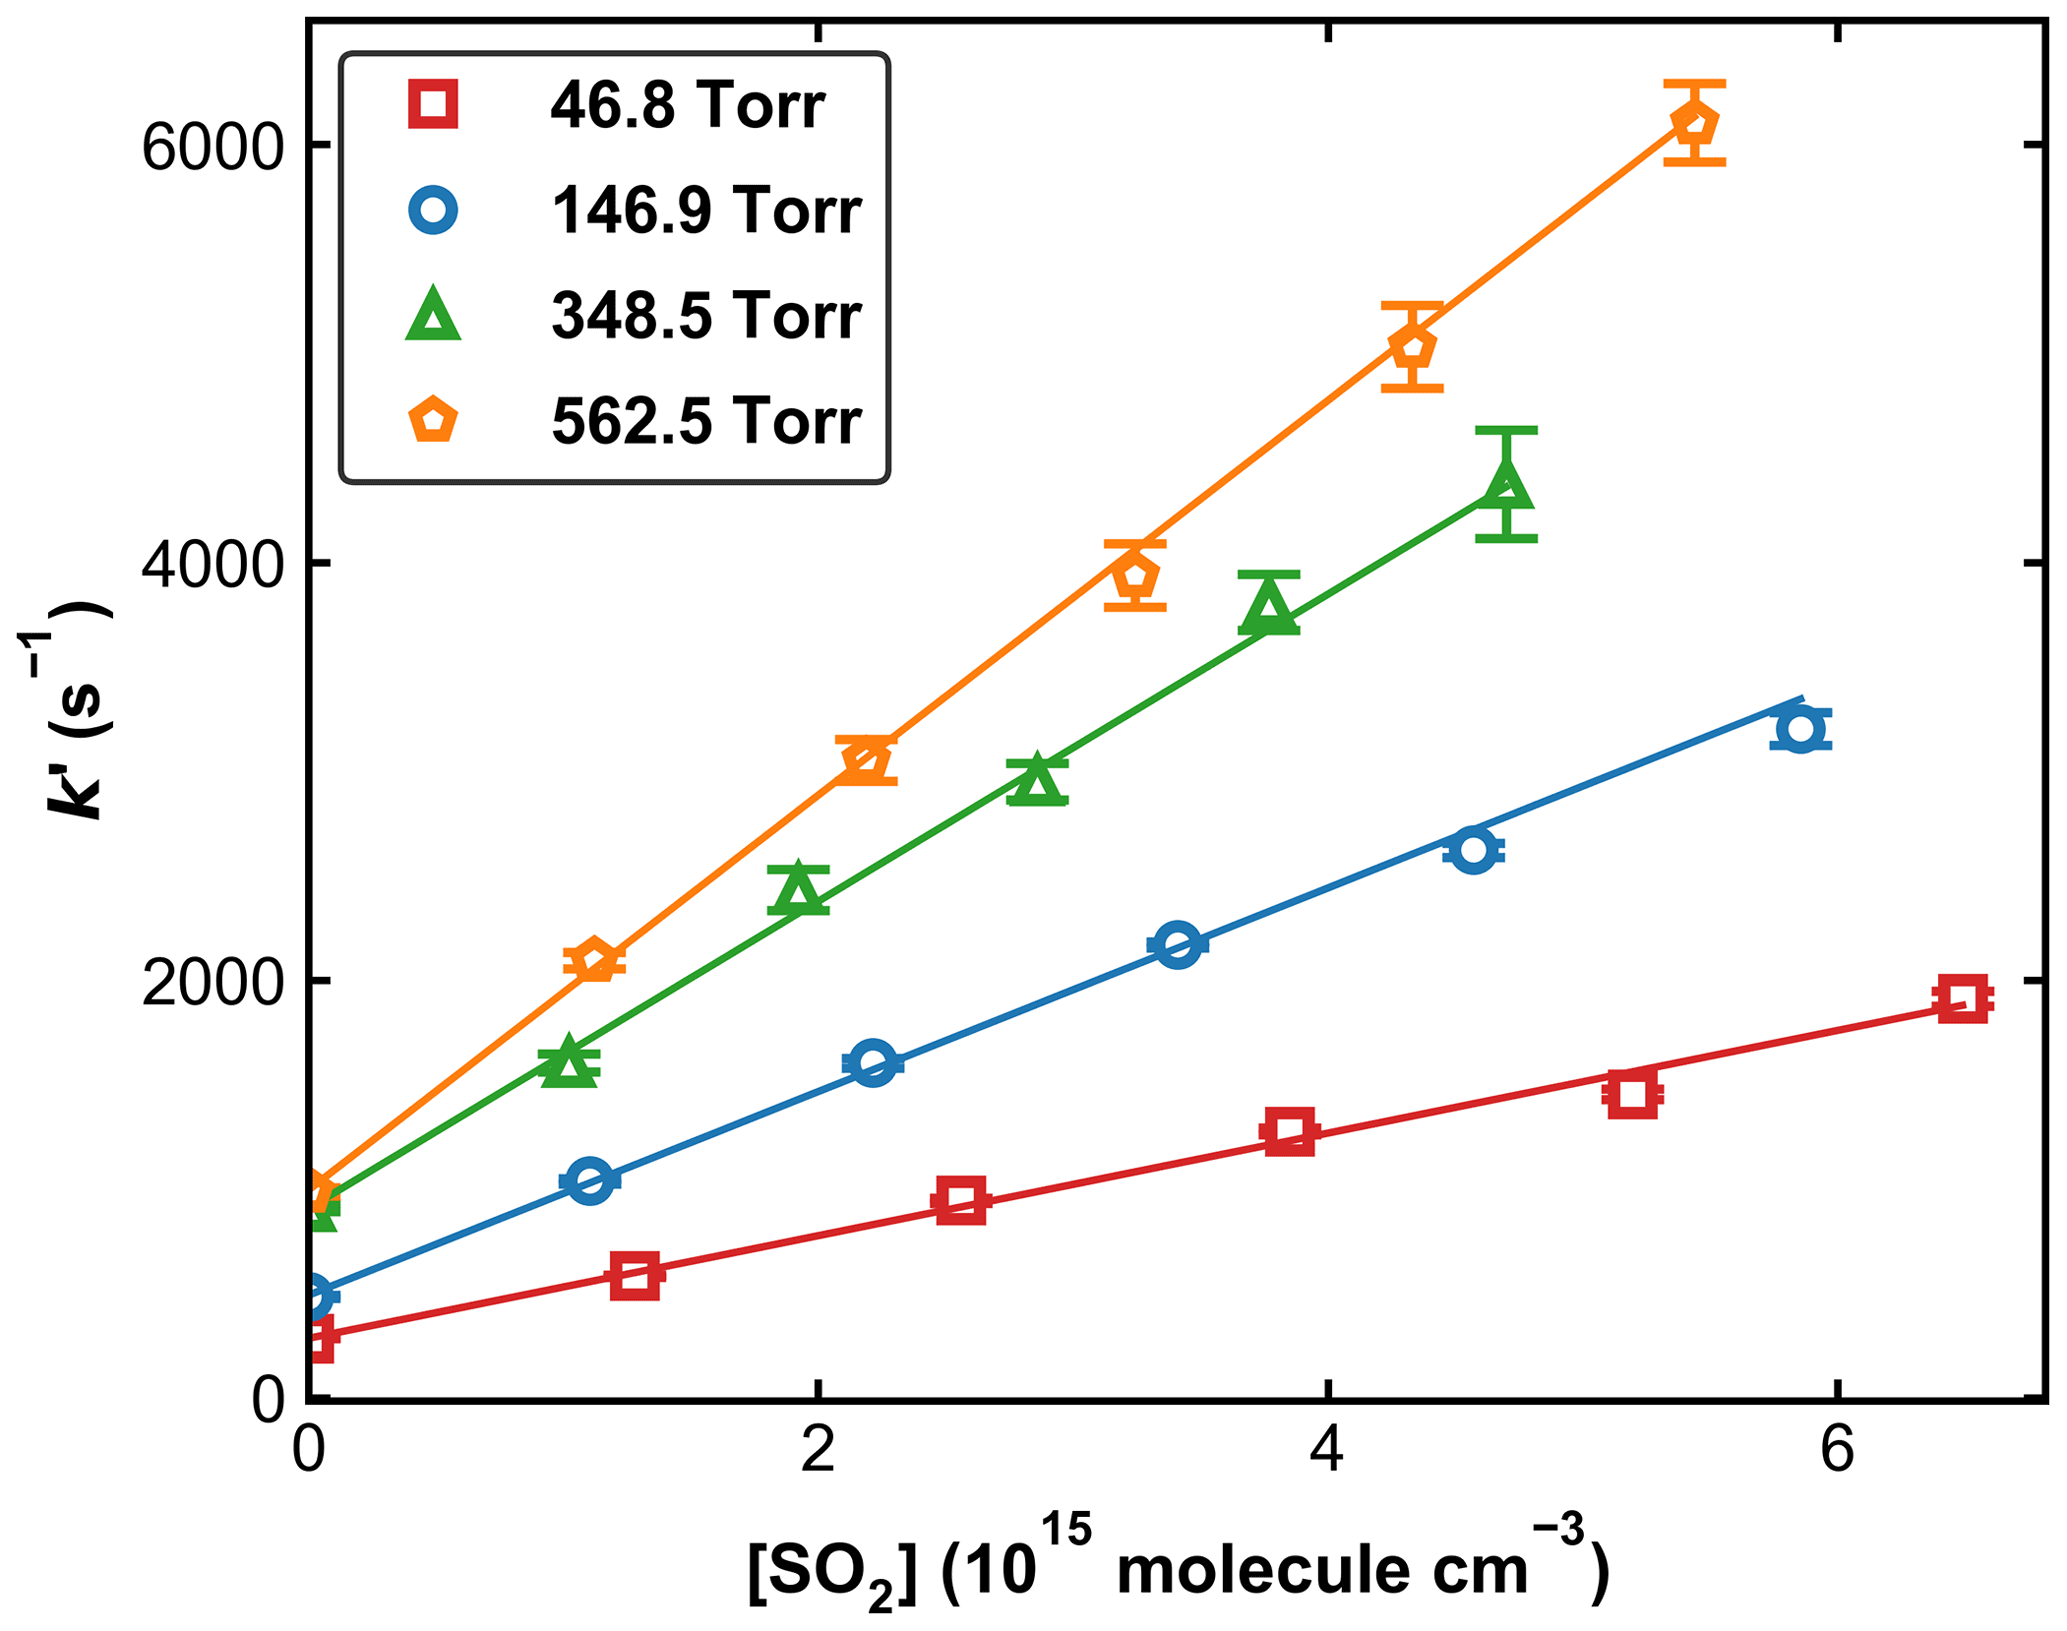
Figure 5Pseudo-first-order rate coefficients (k′) as a function of the SO2 concentration ([SO2]) at four different pressures at 298 K. Error bars represent 2σ statistical uncertainty. The lines are weighted, linear regressions.
Previous experimental studies have reported that the photoexcitation/dissociation of SO2 can have a large impact on the kinetics of OH loss. To circumvent this, optical filters containing SO2 have been used to reduce the absorption of, for example, light from flash lamps (160–220 nm) (Paraskevopoulos et al., 1983; Wine et al., 1984). The 248 nm laser light used in the current setup is beyond the SO2 photodissociation threshold of 219 nm, so single-photon SO2 photodissociation cannot affect the measurements for k1. However, using a similar setup at 248 nm, Blitz et al. (2017b, a) found evidence for two-photon dissociation of SO2 in their experiments in He and reported a high-pressure limiting rate coefficient that is lower (by a factor of 2–5) than all other measurements or recommendations by evaluation panels. Blitz et al. (2017b) suggested that previous measurements were biased by additional OH removal by radical–radical reactions initiated by the two-photon dissociation of SO2. In order to evaluate whether SO2 photoexcitation could have impacted on our measurements of k1 in N2, we conducted measurements at 298 K and 14 Torr in N2 with the excimer laser power varied by a factor of ∼ 14. Over this energy range, the impact of any two-photon processes would scale by a factor of ∼ 200. k1 was thus measured in a total of 10 experiments, for which SO2 concentrations ranged from 1.2 × 10¹⁵ to 6.0 × 10¹⁵ molecule cm−3, the concentration of H2O2 was kept at around 3 × 10¹⁴ molecule cm−3, and the laser fluence was varied from ∼ 0.5 to ∼ 9.5 mJ cm−2. Values of k1 as a function of the 248 nm laser fluence are displayed in Fig. 6. Our data clearly show that k1 is independent of laser fluence (the average value is 1.29 ± 0.05 × 10⁻¹³ cm3 molecule−1 s−1), suggesting that, under our experimental conditions in N2 bath, secondary reactions between OH radicals resulting from the photoexcitation of SO2 are insignificant. This observation helps to rule out that single- or two-photon processes involving SO2 excitation or dissociation do not bias the OH decay and that reactions of OH with, for example, products of Reaction (R1) (i.e. HOSO2) or reaction with HO2 and NO3 (formed in Reactions R7 and R8), are unimportant. To examine the potential for two-photon photolysis of SO2 in He bath gas, we added H2O to a reaction mixture of H2O2, SO2, and He and observed non-exponential OH kinetics, suggesting the intermediacy of O(1D):
We emphasize that such effects were not seen in N2 bath gas in which O(1D) is rapidly quenched to less reactive O(3P).

Figure 6Values of k1 measured at 298 K and in 14 Torr of N2 bath gas. The 248 nm laser fluence was varied by a factor of ∼ 14. The dashed line represents the average rate coefficient.
To confirm beyond doubt that our measurements using 248 nm PLP are not biased by SO2 excitation, an additional experiment was performed (193.2 Torr and 298 K) using HONO photolysis at 351 nm as OH precursor. At 351 nm, the SO2 absorption cross-section is ∼ 3 orders of magnitude lower than at 248 nm, and SO2 excitation is negligible. HONO was generated in situ by the dropwise addition of a 0.1 M NaNO2 solution to a 20 wt % H2SO4 solution, and the characteristic bands at around 342, 354, and 368 nm (Stutz et al., 2000) were monitored by the multi-pass optical absorption cell. This setup provided sufficient amounts of HONO (∼ 1014 molecule cm−3) for kinetic measurements for about 1–1.5 h after adding a few drops of the NaNO2 solution. Note that the concentration of H2O above the H2SO4 solution is very low, so that these can be considered to be dry experiments (i.e. in N2 bath gas).
Unlike the H2O2 and HNO3 sources of OH described above, the concentration of HONO was not stable over the time required to measure a series of values of k′ in the presence of various amounts of SO2. Therefore, measurements of k′ with and without SO2 were conducted intermittently. Figure 7 displays the measured first-order OH decay rate constants (k′) with different amounts of SO2 present in the system and over a period of ∼ 2.5 h. In the absence of SO2 (blue symbols), the k′ decreased from an initial value of ∼ 2800 s−1 to one of ∼ 800 s−1 at 5200 s. This is mainly due to the reaction of OH with HONO and impurities such as NO2 and NO. After ∼ 5400 s a few drops of NaNO2 were again added to the H2SO4 solution, and the increase in [HONO] was accompanied by an increase in k′. The decay in k′ over time was fit with a second-order polynomial function, which, via interpolation, was used to calculate the contribution of OH loss in the absence of SO2 (i.e. kd) from the individual values obtained with SO2 present. Based on the loss rate constants in the absence of SO2 and the rate coefficient for reaction of OH with HONO (k11 (298 K) = 6.0 × 10⁻¹² cm3 molecule−1 s−1) (Atkinson et al., 2004), we estimate the HONO concentrations to be ∼ 1–5 × 10¹⁴ molecule cm−3.
Combined with the photolysis laser fluence of around 1 mJ cm−2, this results in an initial OH concentration of 0.3–1.5 × 10¹¹ molecule cm−3. A total of five different SO2 concentrations were used in these experiments, and at each SO2 concentration, the measurement of k′ was repeated four times. The averaged values of k′, after correction for the contribution from reactions of OH with HONO and other impurities, as well as diffusion loss of OH, are plotted against SO2 concentration in Fig. 8. A linear regression yields a value of k1= 4.91 ± 0.13 × 10⁻¹³ cm3 molecule−1 s−1. A similar set of experiments at 273 K and 295 Torr yielded k1= 8.44 ± 0.19 × 10⁻¹³ cm3 molecule−1 s−1. Owing to the more convoluted experimental procedure and data analysis and also the larger OH losses in the absence of SO2 (up to ∼ 3000 s−1), the overall uncertainty of the rate coefficient obtained in this manner is larger than that obtained using H2O2 and HNO3 as OH precursors and the difference (∼ 10 %) between the rate constant obtained using the 248 nm photolysis of H2O2 or HNO3 or HONO as OH source is not considered significant. In any case, this level of agreement (combined with the laser fluence variation described above) rules out a bias to k1 of the magnitude reported by Blitz et al. (2017b) when working at 248 nm in N2 bath gas.
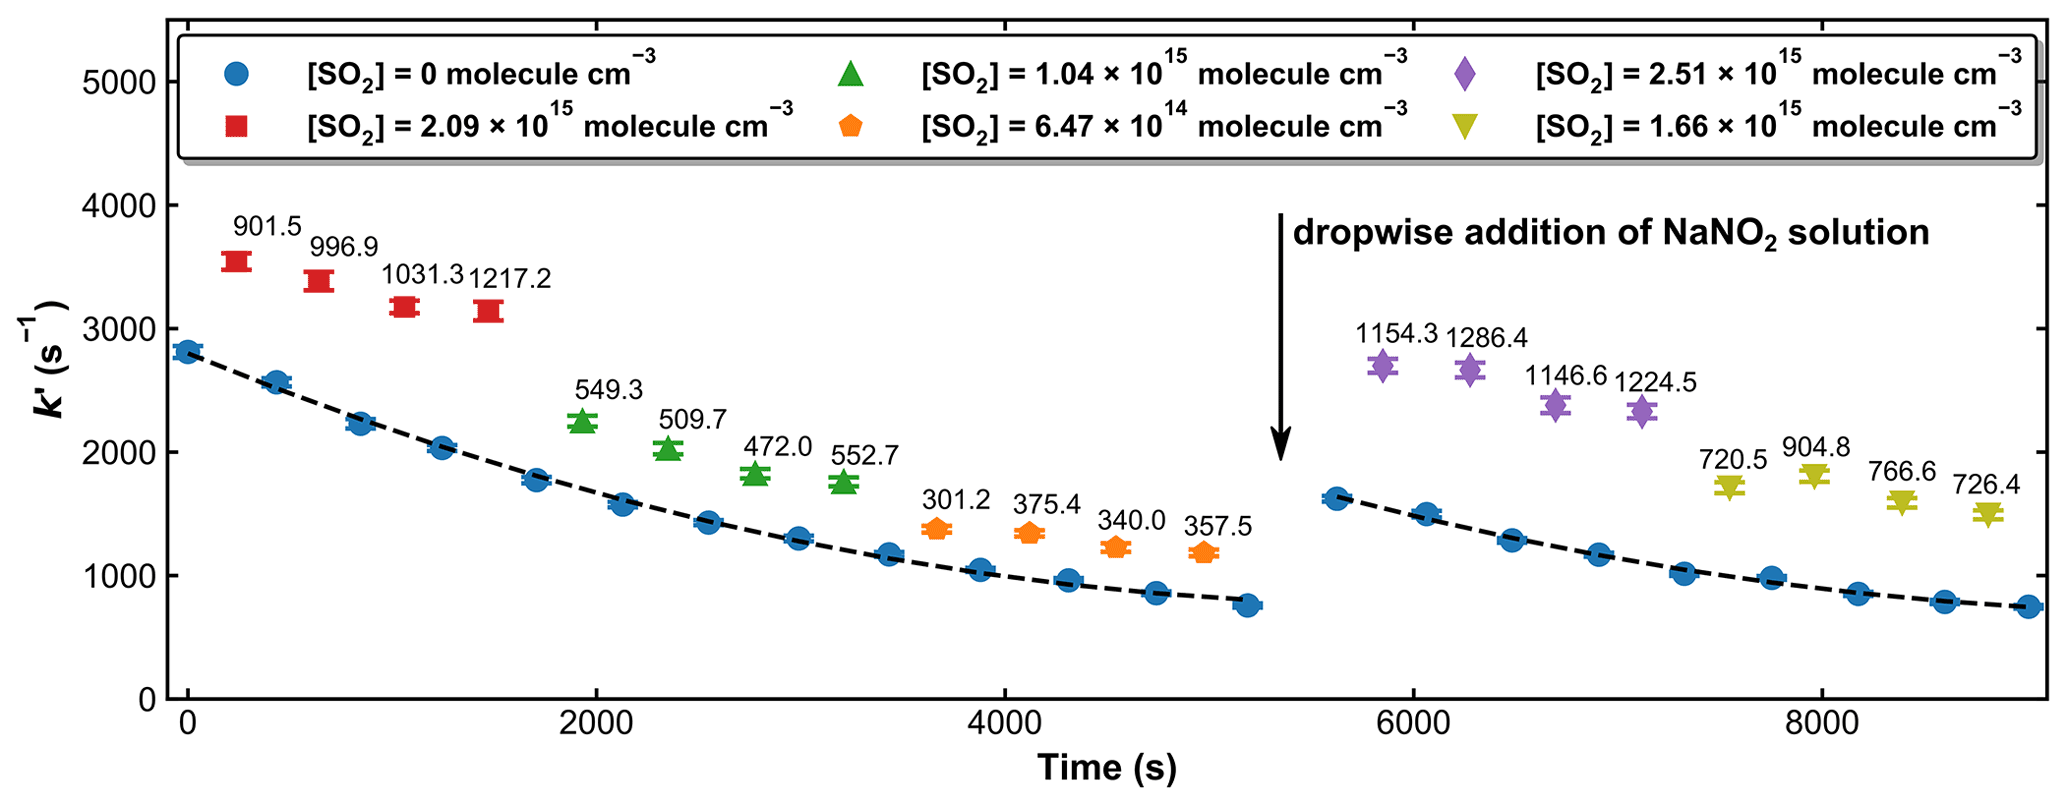
Figure 7Pseudo-first-order rate coefficients (k′) at 193.2 Torr and 298 K, whereby OH was generated by the 351 nm photolysis of HONO. The time-dependent OH decay constants in the absence of SO2 (blue symbols) were fit to a second-degree polynomial (dashed black lines). The number on the top of each data point when SO2 is present (red-, green-, orange-, purple-, and olive-coloured symbols) represents the difference in k′ to that obtained (by interpolation) in the absence of SO2. A few drops of the NaNO2 solution were re-added after about 90 min to maintain OH levels and thus a good signal-to-noise ratio.
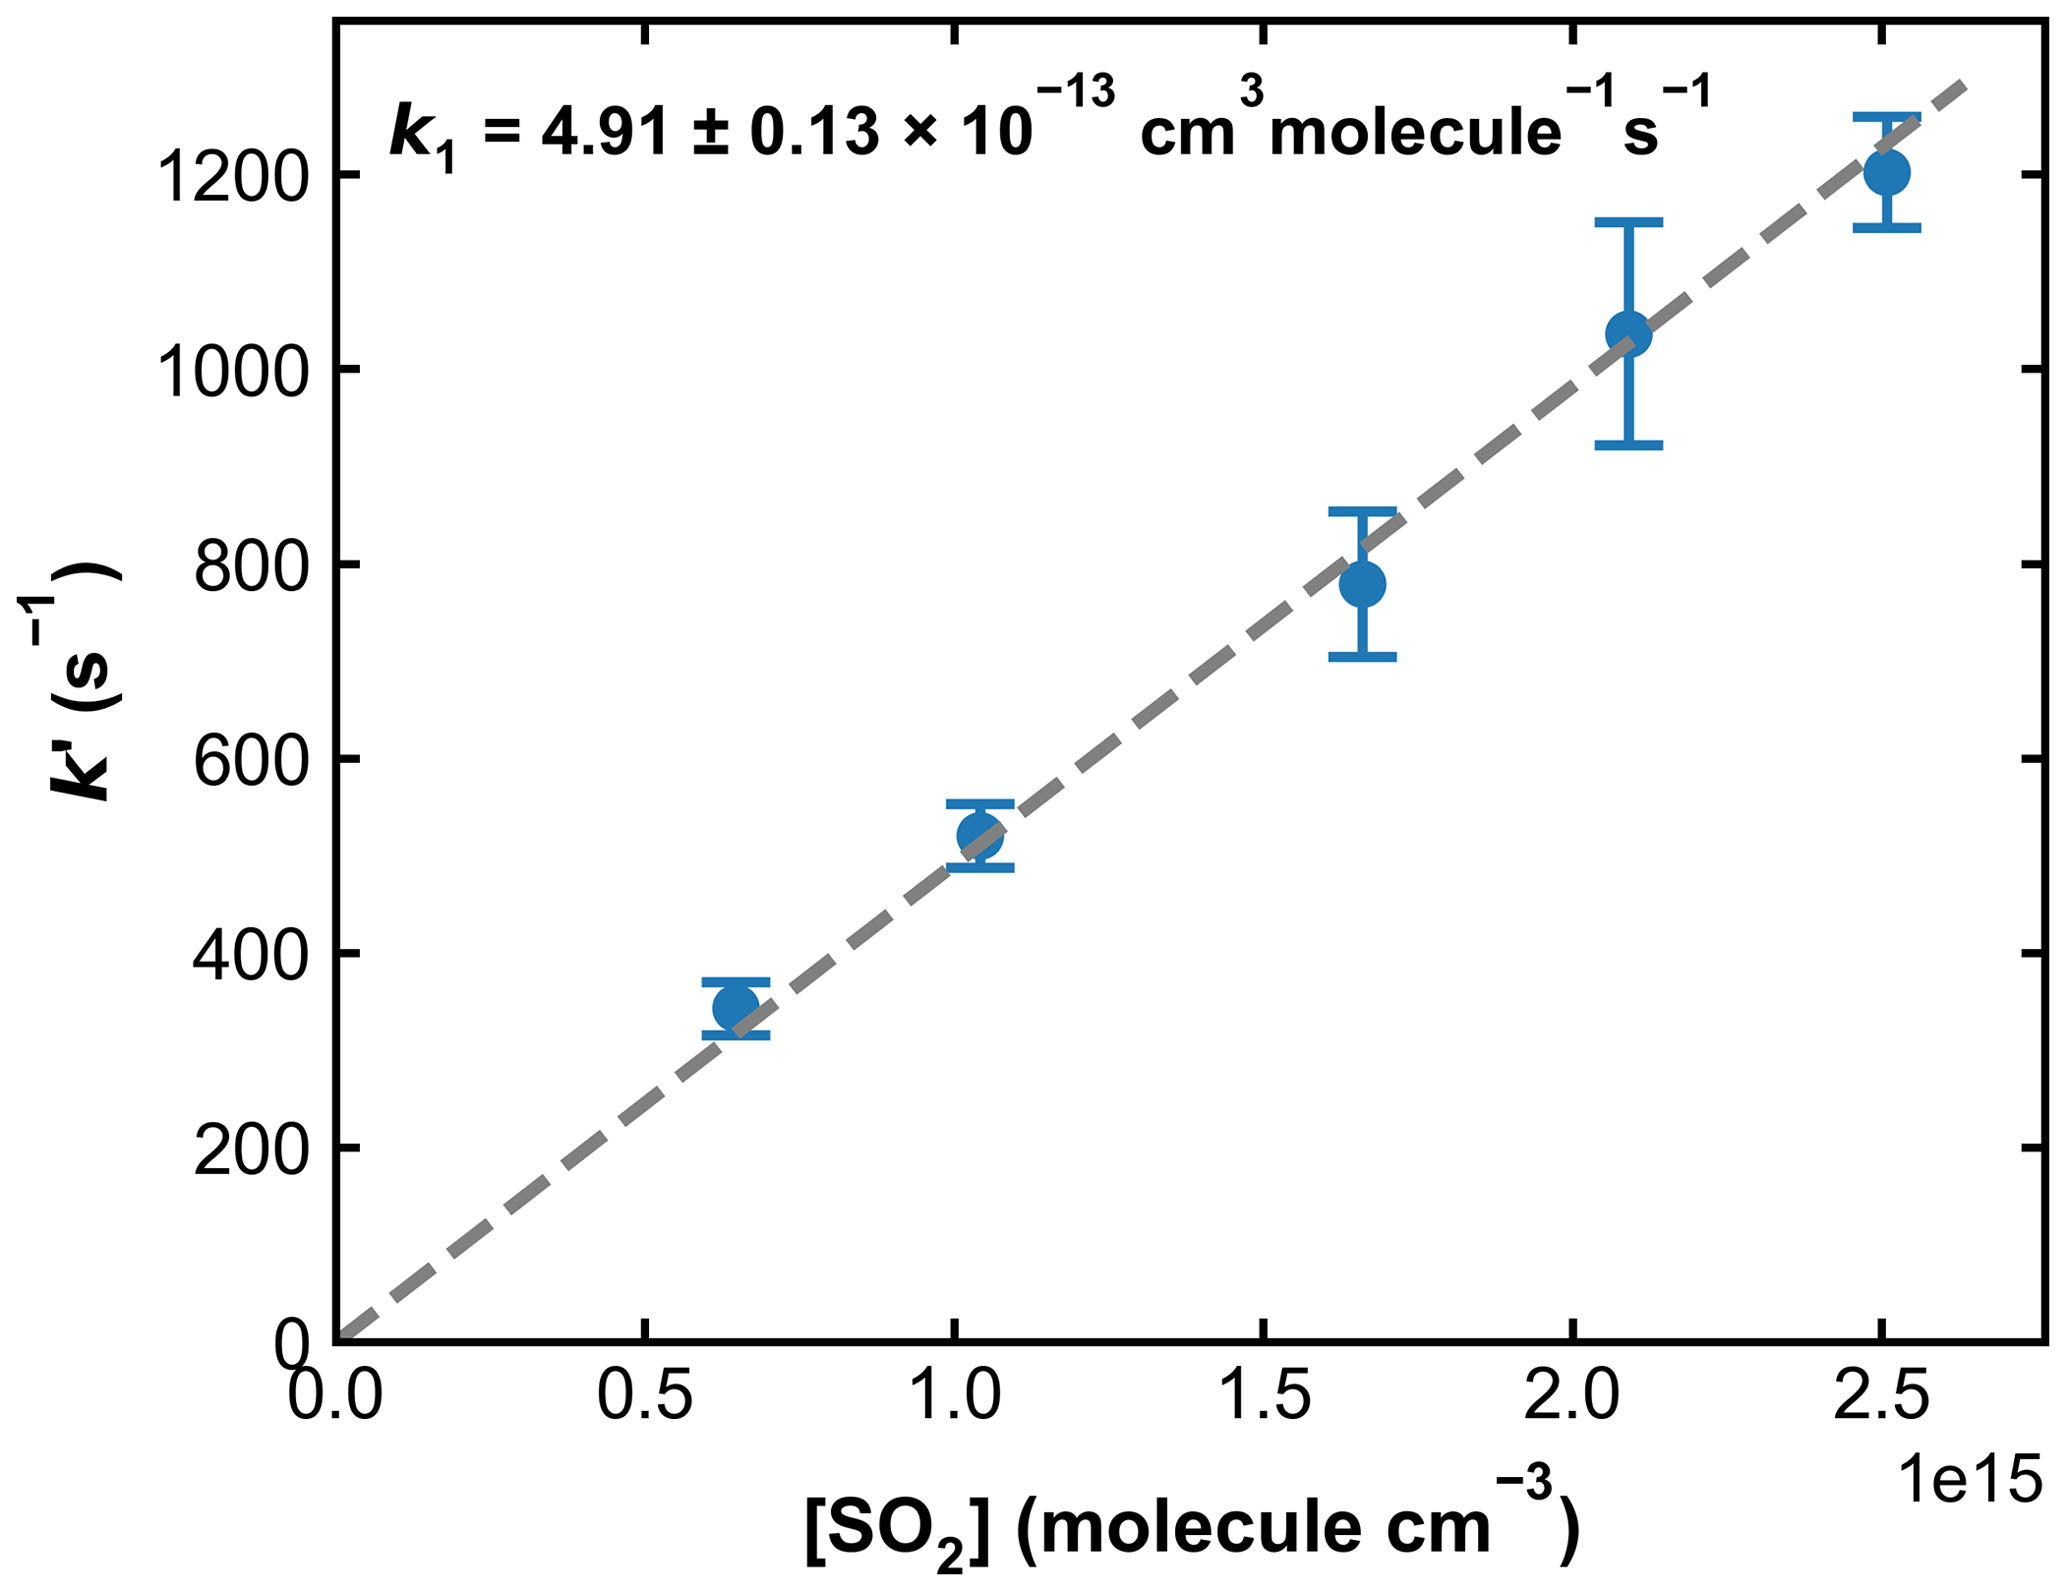
Figure 8Pseudo-first-order rate coefficients (k′) as a function of the SO2 concentration ([SO2]) at 193.2 Torr N2 and 298 K. OH was generated through HONO photolysis at 351 nm. Each data point is an average over four individual measurements, and the error bars represent 2σ statistical uncertainties. k1 was obtained from the slope of the linear regression.
Our measurements of k1 obtained in N2 bath gas (in total >100) are plotted against the N2 concentration, at five different temperatures in Fig. 9. The rate coefficients and associated experimental conditions are listed in Table S1 in the Supplement. The rate coefficients obtained using H2O2 and HNO3 as OH precursors (at 273 and 298 K) are indistinguishable from each other, indicating that the values obtained are not influenced by secondary chemistry. The overall uncertainty in k1 (using H2O2 and HNO3 precursors for OH) is estimated to be ∼ 7 %, which takes into account estimated systematic bias in the SO2 cross-section at 213.86 nm.
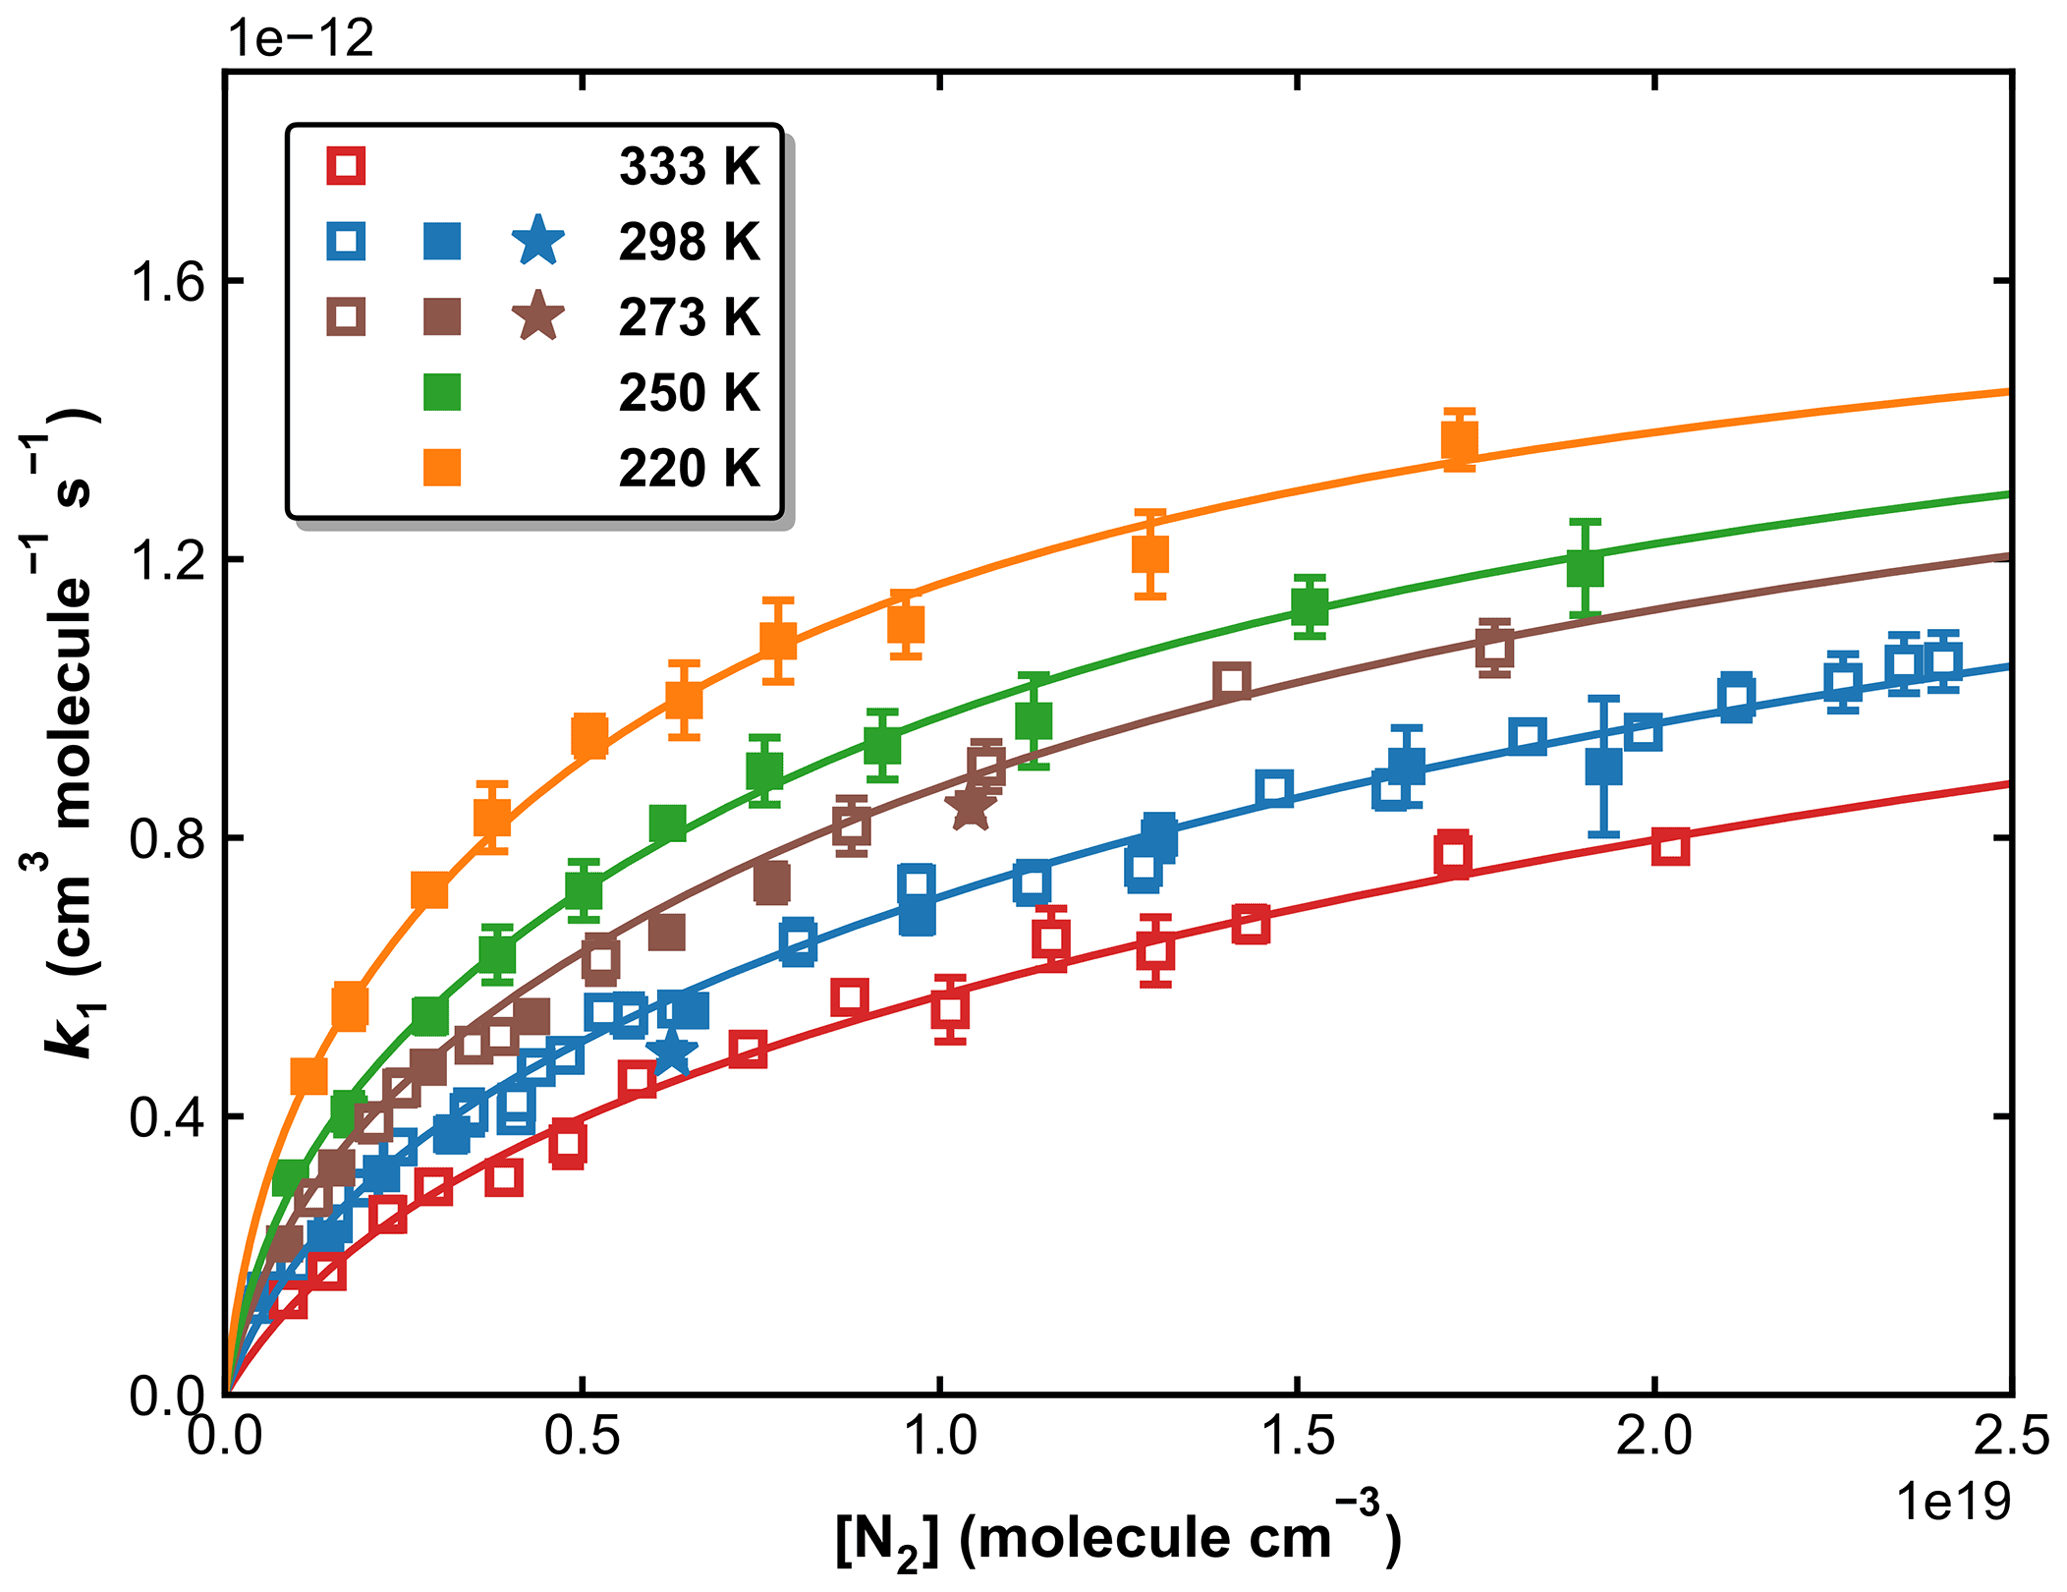
Figure 9k1 as a function of N2 concentration in the fall-off regime at five different temperatures. Open squares, closed squares, and stars represent data obtained using H2O2, HNO3, and HONO as OH precursors, respectively. The error bars represent 2σ statistical uncertainties. The solid lines are the fits of the experimental data to Eq. (3) with × 10−31 cm6 molecule−2 s−1, × 10−12 cm3 molecule−1 s−1, n=4.10, m=0 and FC=0.58.
The solid lines are fits to the experimental data according to the Troe formalism for termolecular reactions (Troe, 1983).
where (cm6 molecule−2 s−1) and (cm3 molecule−1 s−1) are the high-pressure and low-pressure limiting rate coefficients, respectively, T is the temperature (K), [M] is the molecular density (molecule cm−3), and n and m are temperature exponents. The broadening factor F (which accounts for the lower rate coefficients measured in the fall-off regime than predictions by the Lindemann–Hinshelwood mechanism) is expressed as
where , and FC is the broadening factor at the centre of the fall-off curve.
In order to reduce the number of variables when fitting, we assume that k1,∞ is independent of the temperature (m=0). This assumption is reasonable as m is expected to be small, and the data at high pressures (neither in this work nor in the literature) do not accurately define this parameter. If all remaining variables (, k1,∞, FC, and m) are allowed to float, the least-squares optimization using Eqs. (3) and (4) gives cm6 molecule−2 s−1, × 10−12 cm3 molecule−1 s−1, FC=0.58, and n=4.10 (see Table 2, Method 1). These parameters, with a small residual standard deviation (RSD) of 2.27 × 10⁻¹⁴ cm3 molecule−1 s−1, accurately reproduce all our measurements in N2 bath gas, as shown in Fig. 9.
Table 2Parameterization of k1 in N2.
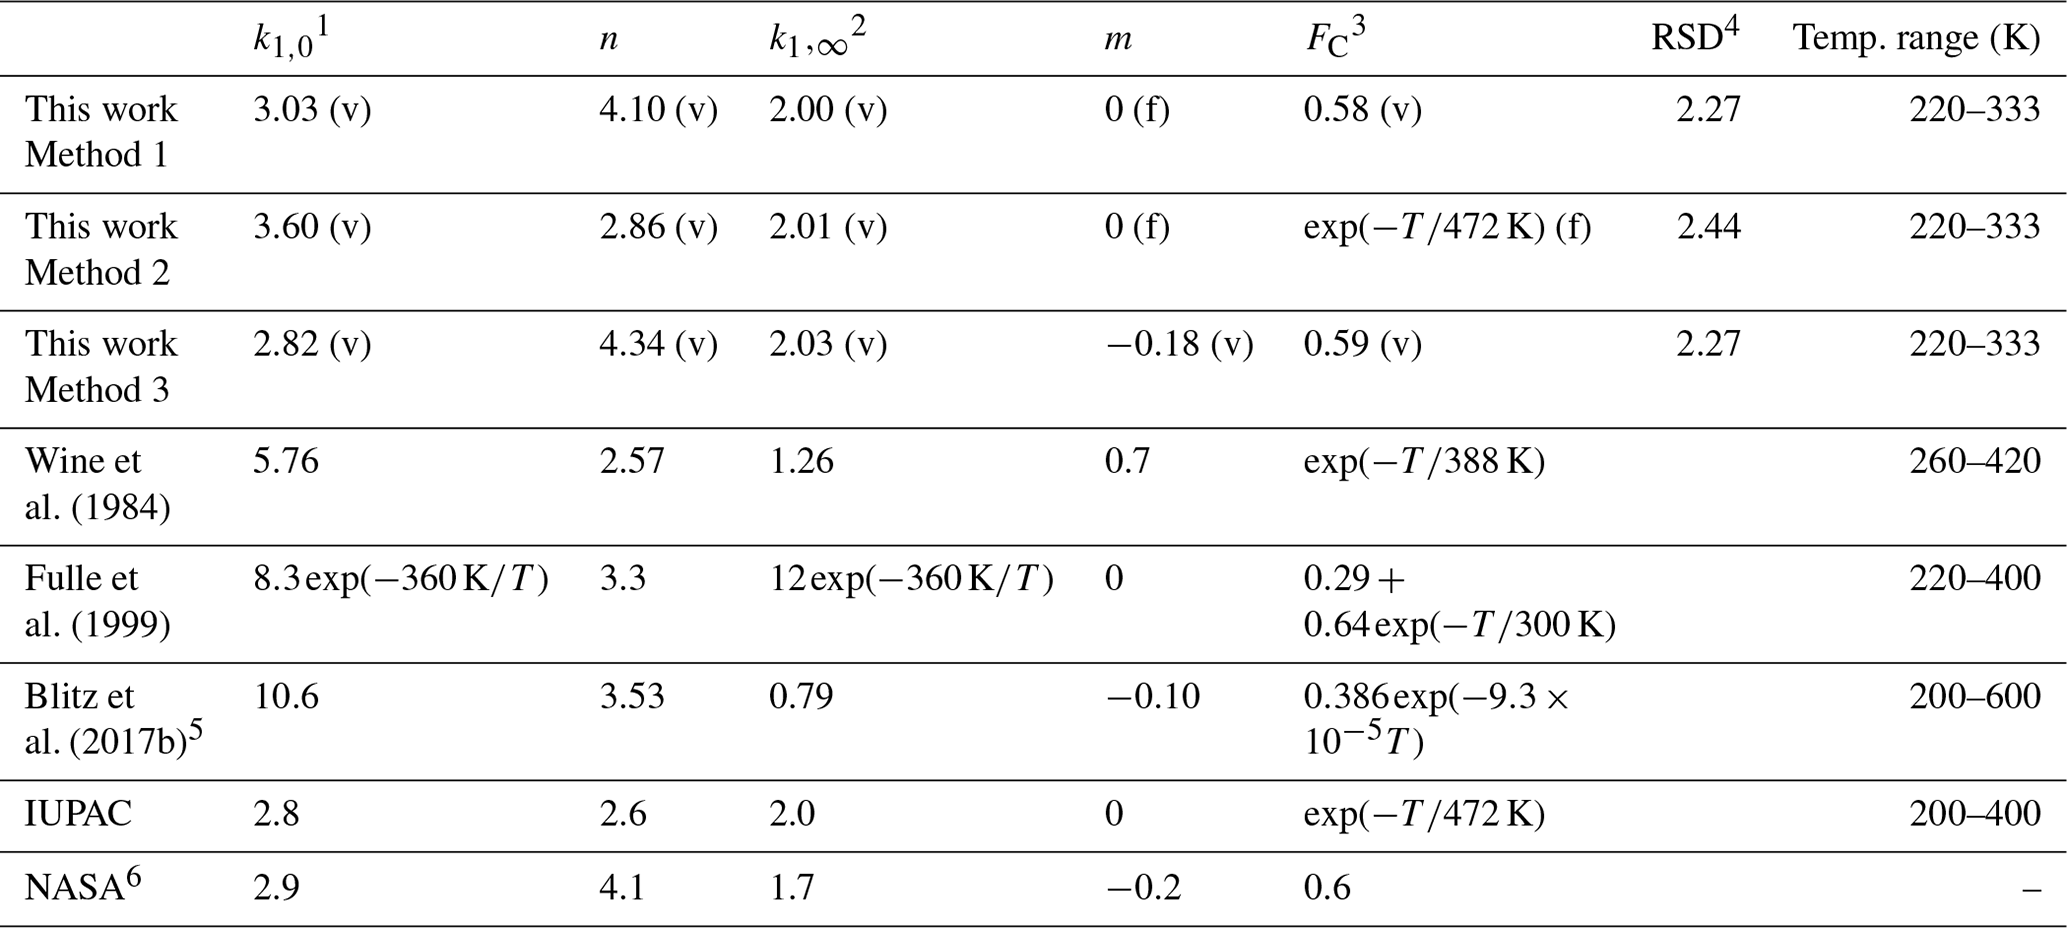
1 Units of 10−31 cm6 molecule−2 s−1. 2 Units of 10−12 cm3 molecule−1 s−1. 3 Temperature (T) in kelvin. 4 RSD (residual standard deviation with the unit of 10−14 cm3 molecule−1 s−1) for the fitting is defined as , where k1 and are the measured and the fitted rate coefficients, and N is the total number of the data points. (v) denotes parameters allowed to vary during fitting, (f) denotes parameters fixed during fitting. 5 The parameters, which are different from those given in Blitz et al. (2017b), are from a personal communication with Mark Blitz (2022). The parameterization is based on the modified fall-off parameterization in Troe and Ushakov (2014); details are given in the Supplement. 6 The simplified form of the Troe expression for termolecular reactions used by NASA can be found in the Supplement.
As the range of temperatures encountered in the Earth's atmosphere is relatively narrow, temperature-dependent forms of FC are no longer widely used in IUPAC evaluations, though a value of is still recommended for the reaction between OH and SO2. We therefore also explored the effect of setting FC to and allowing a smaller set of variables, , k1,∞, and n, to float while fitting. This results in a 20 % higher of 3.60 × 10⁻³¹ cm6 molecule−2 s−1, an almost identical value of × 10−12 cm3 molecule−1 s−1 and n=2.86 (Table 2, Method 2). In addition, we examined the effect of varying the parameter m (i.e. making k1,∞ temperature-dependent) while FC was varied (but kept temperature-independent). In this case we obtained × 10−12 cm3 molecule−1 s−1 with and a lower value of (2.82 × 10⁻³¹ cm6 molecule−2 s−1) with n=4.34 (Table 2, Method 3).
The quality of the fits obtained using Methods 1, 2, or 3 is very similar (see values for the residual standard deviation and correlation coefficients in Table 2), as highlighted in Fig. S1 of the Supplement, where pressure- and temperature-dependent values of k1 calculated using all three methods are plotted, along with the experimental data. We also show in Fig. S2 a plot of k1 derived using each method versus altitude with the appropriate altitude-dependent change in temperature and pressure for a standard atmosphere. Clearly, Methods 1 and 3, which have the lowest residual standard deviations, are in excellent agreement throughout the atmosphere, with slight differences to Method 2 in the stratosphere. The pressure and temperature dependence of k1 cancels each other in the lowest 10 km of the Earth's atmosphere, so that k1 is roughly constant at a value close to 1 × 10⁻¹² cm3 molecule−1 s−1, which is about 5 % higher than the IUPAC and NASA recommendations.
For the purpose of modelling the Earth's atmosphere, it is more important to ensure that the data at low and intermediate pressures and temperatures are correctly reproduced by the parameterization, with correct definition of k1,∞ of secondary importance. For this reason, we have chosen to use the parameters derived in Method 1 to calculate k1 and for comparison with previous datasets and evaluations.
3.3 Comparison with previous parameterizations for N2 bath gas
Despite the importance of the title reaction in the atmosphere there were no prior temperature-dependent measurements of k1 in atmospherically relevant bath gases. In experiments designed to define k1,0, low-pressure flow-tube studies (Leu, 1982; Lee et al., 1990) measured values of k1 at N2 pressures between 0.6 and 5 Torr. In order to access k1,∞, Fulle et al. (1999) performed experiments in He bath gas at pressures of up to 96 bar. However, under all experimental conditions investigated so far, the title reaction is still in the fall-off regime, and neither high- nor low-pressure limits for the title reactions have been attained directly, experimentally.
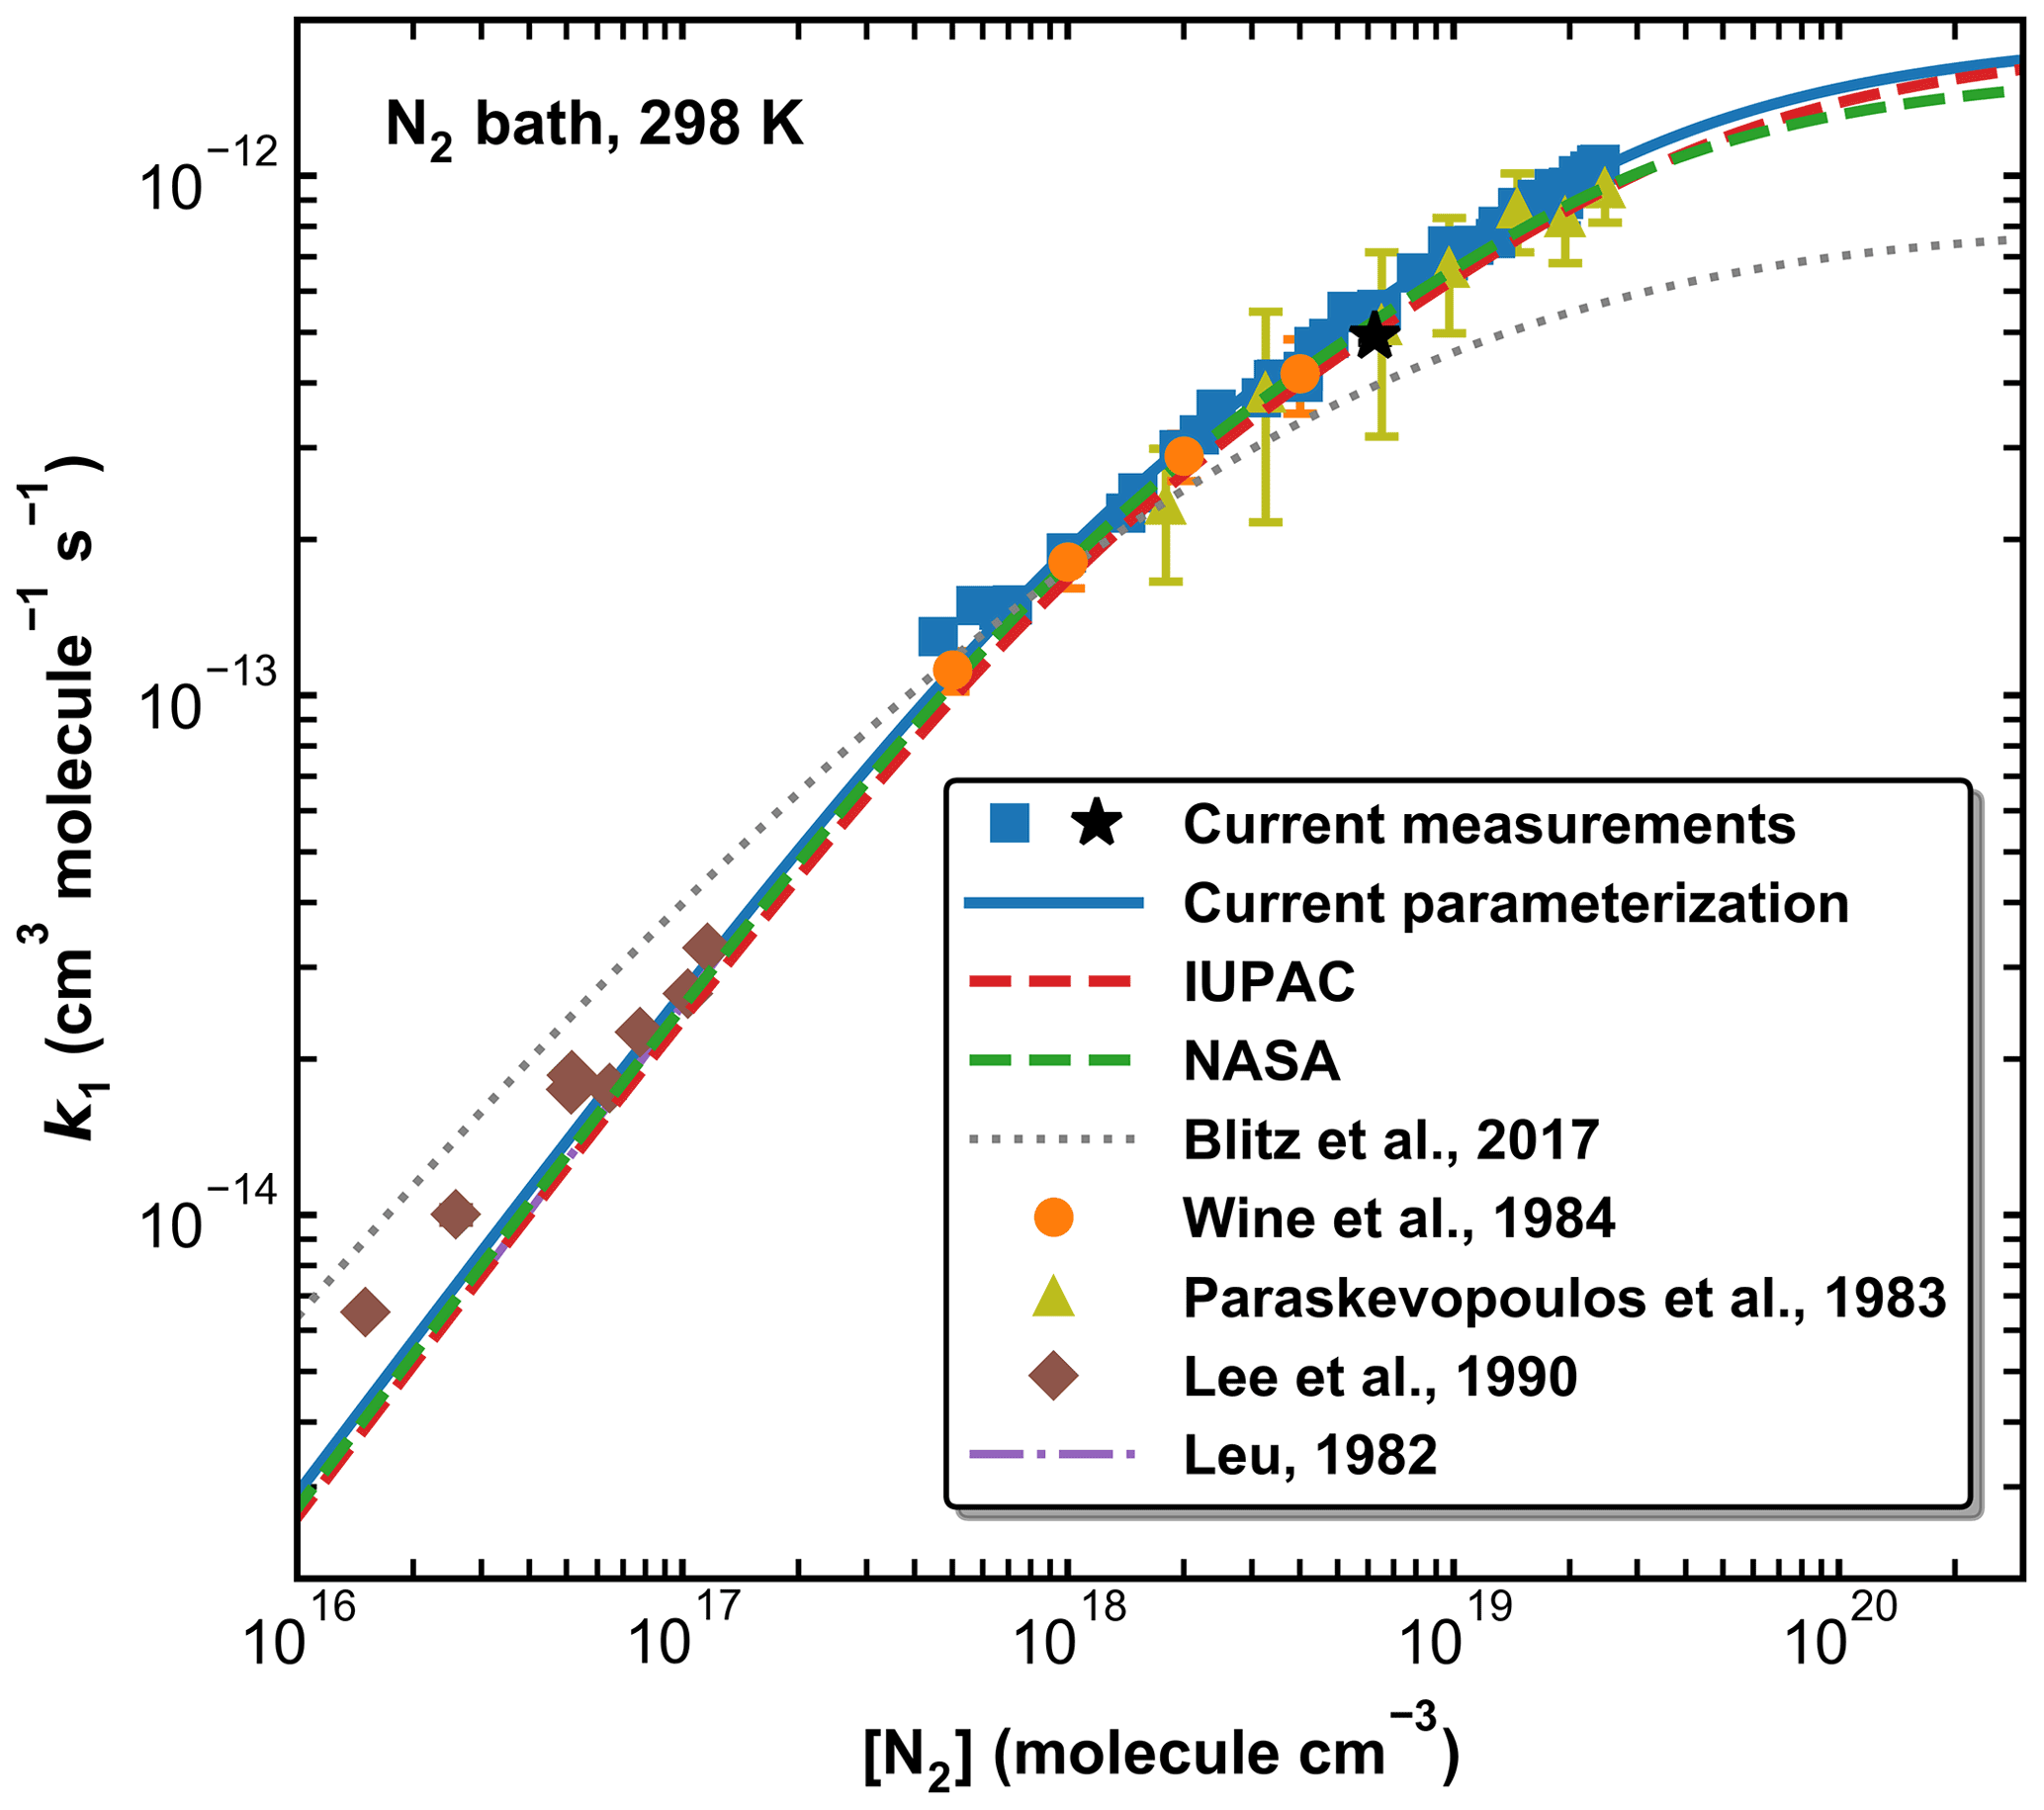
Figure 10A comparison of previous measurements of k1 at 298 K (N2 bath gas only) with our parameterization and those of IUPAC, NASA, and Blitz et al. (2017b) (see Table 2 for details). The black star represents the measurement using HONO photolysis at 351 nm to generate OH.
In Table 2 we compare our values of k0, k∞, FC, n, and m obtained in N2 with the IUPAC and NASA expressions (both for N2 bath gas), as well as parameterizations reported by previous studies (Wine et al., 1984; Fulle et al., 1999; Blitz et al., 2017b), which were mostly based on temperature-dependent measurements in other bath gases. The value of derived in this work (Method 1) is close to that of 2.8 × 10⁻³¹ and 2.9 × 10⁻³¹ cm6 molecule−2 s−1 preferred by IUPAC and NASA, respectively, and the current value of k∞ is identical to the IUPAC recommendation of 2.0 × 10⁻¹² cm3 molecule−1 s−1; The current value of n is equal to the value of 4.1 used in the NASA expression but larger than the IUPAC preferred value of 2.6 unless we adopt the temperature-dependent value for FC which IUPAC uses. In that case our value of n=2.86 is close to that of IUPAC. This is readily understood as our value of FC=0.58 is very close to the “standard” NASA value of FC=0.6.
Figure 10 provides a comparison between our data points and parameterization (Method 1) with the literature data at 298 K obtained in N2 (Leu, 1982; Lee et al., 1990; Paraskevopoulos et al., 1983; Wine et al., 1984) and with the IUPAC and NASA evaluations. In Fig. S3 of the Supplement we plot the ratios of literature rate constants obtained at 298 K in N2 to our parameterization. Also presented in Fig. 10 is a modified parameterization based on Blitz et al. (2017b) (master equation analyses of the Paraskevopoulos et al., 1983, and Wine et al., 1984, datasets). Note that the curve plotted cannot be reproduced using the parameters listed in Table 3 of Blitz et al. (2017b) but is based on data (listed in Table 2) sent in a personal communication with Mark Blitz (2022) and takes care of various errors in the published analysis. The comparison in N2 is restricted to 298 K as, prior to this study, all temperature-dependent studies were performed in SiF6, He, or Ar.
In the common pressure range (in the fall-off regime), our values of k1 agree very well with those reported by Paraskevopoulos et al. (1983) and Wine et al. (1984). The fall-off curves described by our parameterization and the IUPAC and NASA recommendations are very similar over this pressure range, though our parameterization gives a slightly higher value of k1 (298 K, 1 atm) (1.04 × 10⁻¹² cm3 molecule−1 s−1) than the values proposed by IUPAC and NASA (9.38 and 9.50 × 10⁻¹³ cm3 molecule−1 s−1, respectively). In this context, we note that the value of k1,∞ chosen by IUPAC was a compromise between the rate coefficients measured at extended pressures of He by Fulle et al. (1999) and the data from Blitz et al. (2017a). These values are however very divergent, with 3.6 × 10⁻¹² cm3 molecule−1 s−1 and 7.5 × 10⁻¹³ cm3 molecule−1 s−1, respectively. We show below that at 220 K, our value of k1 in 400 Torr of N2 (13.71±0.41 × 10⁻¹³ cm3 molecule−1 s−1), while clearly still in the fall-off regime, is a factor of 2 larger than the value of 7.5 × 10⁻¹³ cm3 molecule−1 s−1 reported by Blitz et al. (2017a). Similarly, our value obtained using 351 nm photolysis of HONO as OH source (i.e. when SO2 excitation can be ruled out) results in × 10−13 cm3 molecule−1 s−1 in 295 Torr of N2 at 273 K, again above the high-pressure limit reported by Blitz et al. (2017a). Blitz et al. (2017b) suggested that the larger literature values of k1,∞ available at the time of their study were a result of photoexcitation/dissociation of SO2. However, our results have clearly shown that (a) such effects are absent in N2 bath gas when using 248 nm photolysis to generate OH and (b) can be ruled out when working at 351 nm (see above). The excellent agreement between the present rate coefficients and those obtained previously in N2 at 298 K (Paraskevopoulos et al., 1983; Wine et al., 1984) using completely different OH generation methods strongly suggests that data in N2 are unaffected by such processes, though we cannot rule out that they are the cause of the large values of k1,∞ obtained by Fulle et al. (1999) in He. The present and previous datasets in N2 indicate that k1,∞ is close to 2 × 10⁻¹² cm3 molecule−1 s−1.
At lower pressures, the IUPAC, NASA, and present parameterizations capture the flow-tube measurements at 1 Torr and above (Leu, 1982; Lee et al., 1990), whereas at the very lowest pressures, there is substantial deviation. This is likely to reflect bias in the flow-tube data caused, for example, by wall losses of OH and large corrections for axial diffusion.
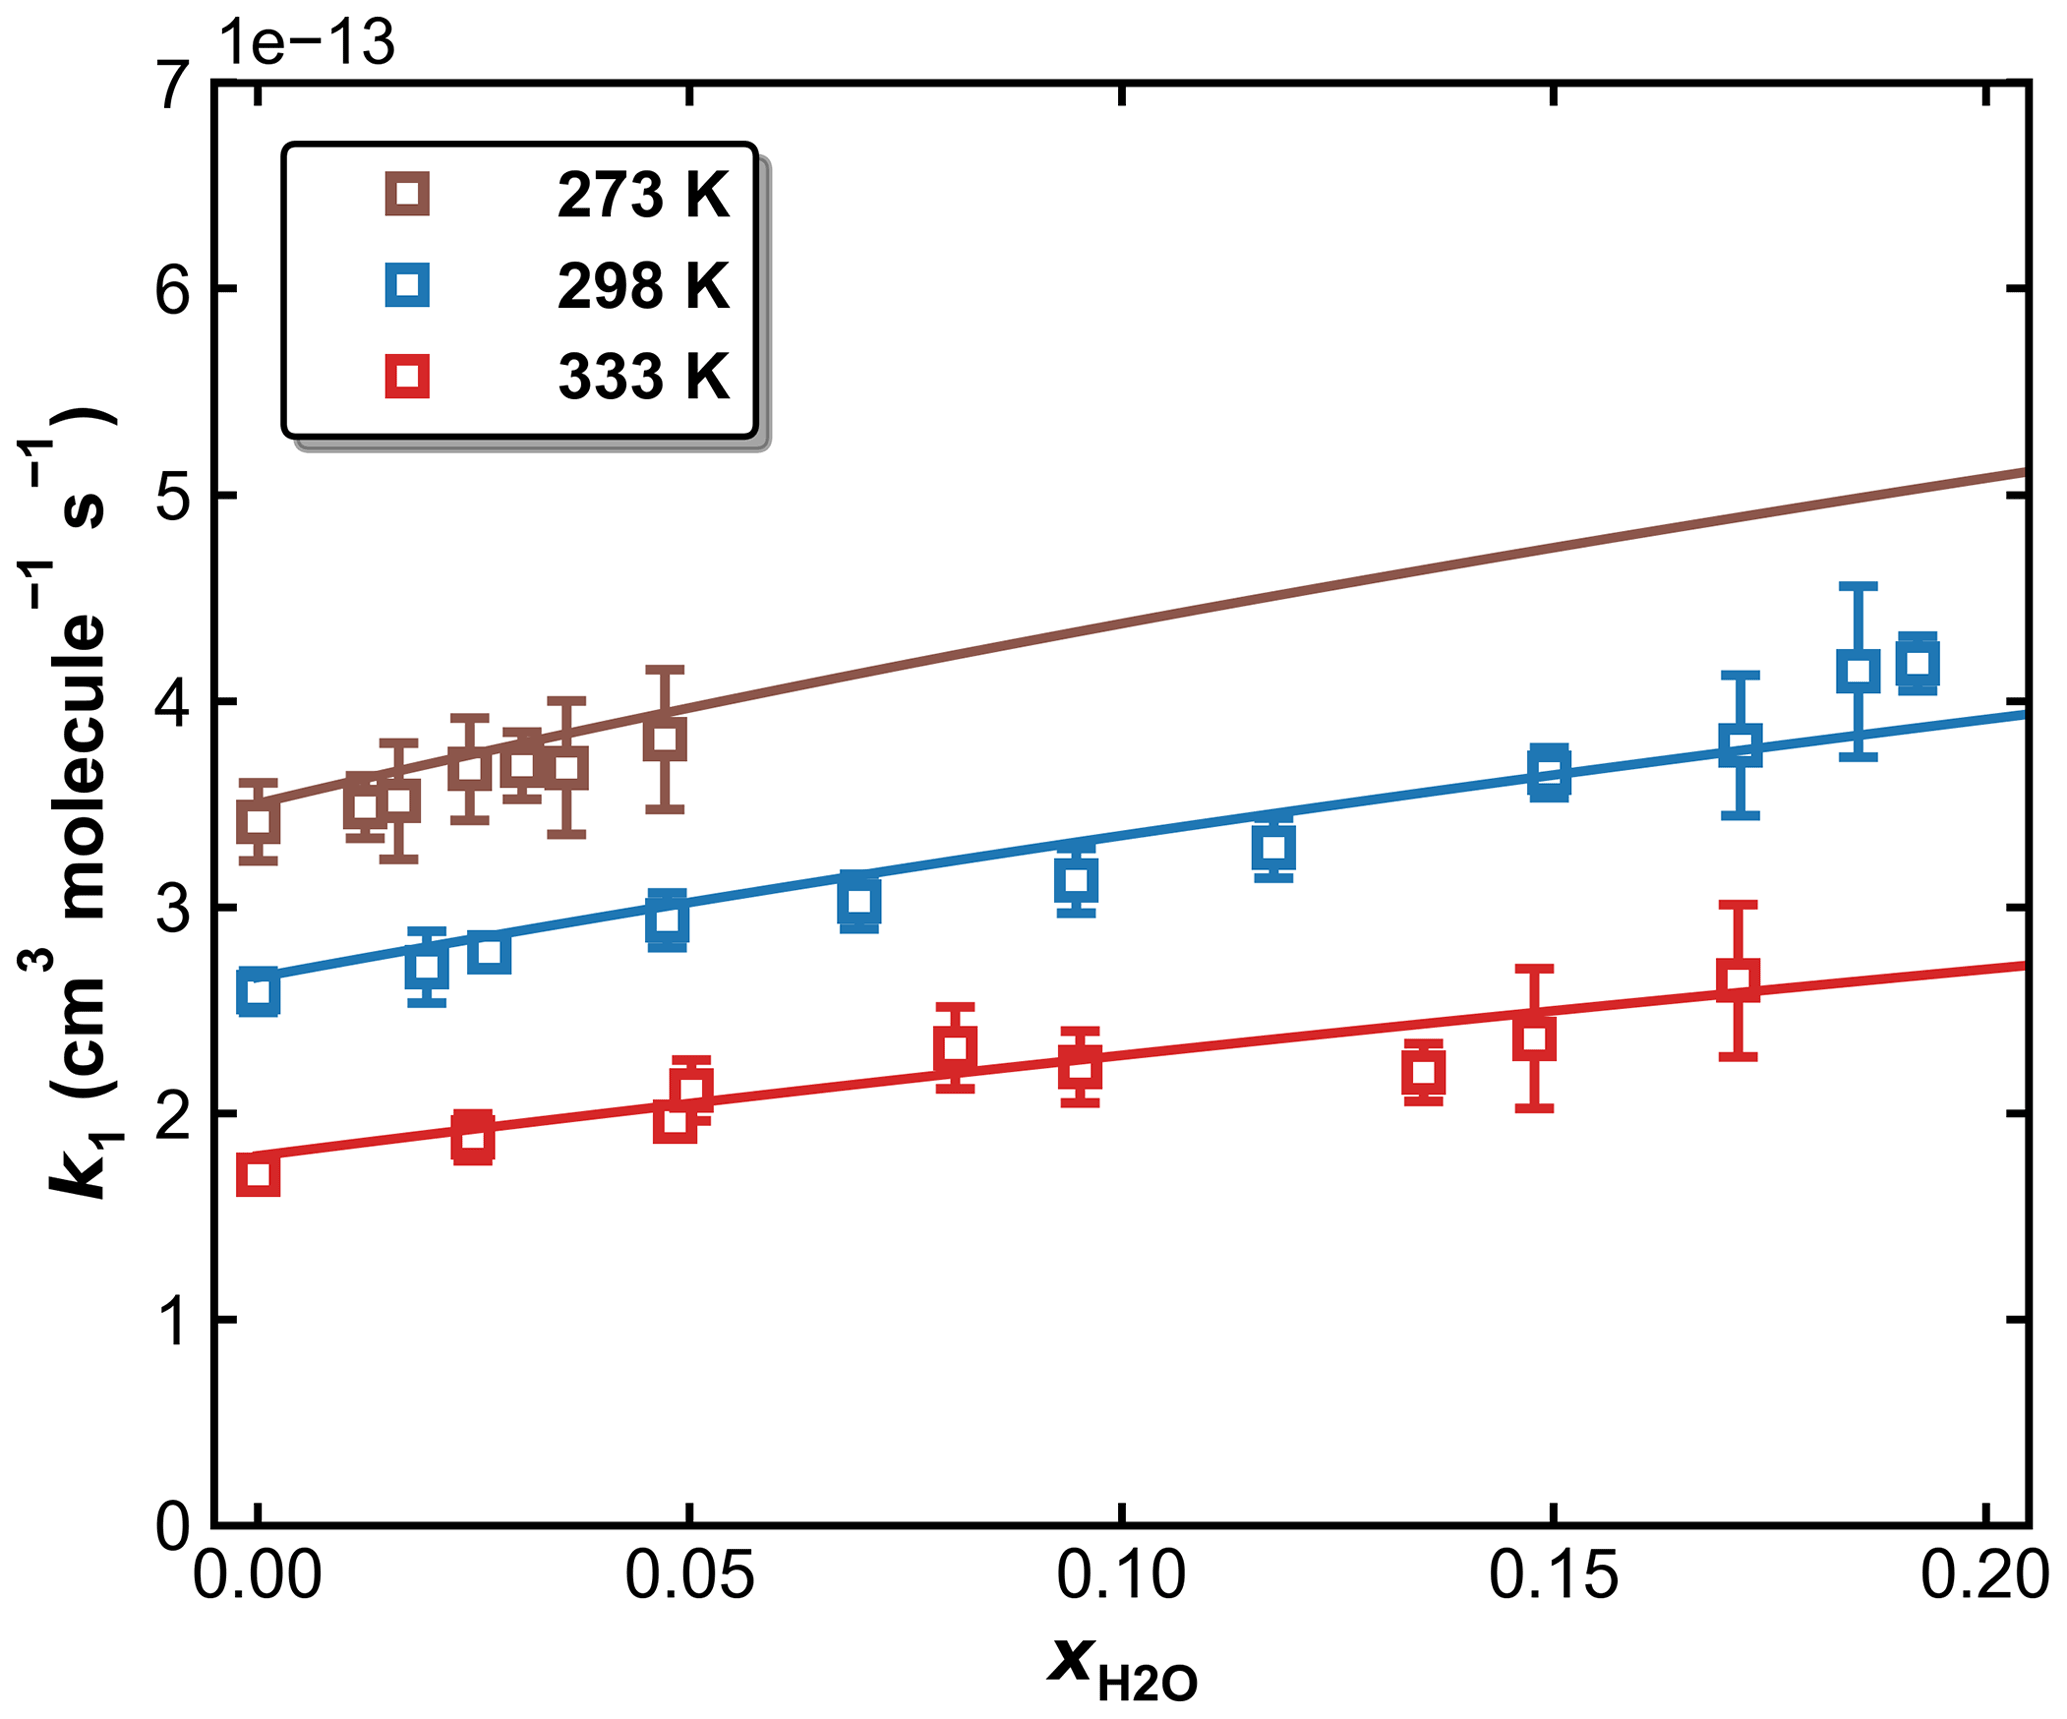
Figure 11k1 as a function of in N2–H2O bath gas at a total pressure of 50 Torr and different temperatures of 273, 298, and 333 K. The symbols represent measurements, and the solid lines are fits to Eqs. (5) and (6), with × 10−12 cm6 molecule−2 s−1, × 10−31 cm6 molecule−2 s−1, n=4.10, m=0, and FC=0.58. The resulting parameters for water are × 10−30 cm6 molecule−2 s−1, o=4.90.
3.4 Influence of water vapour on k1
To examine the effects of water vapour (e.g. as a third-body quenching agent) on the kinetics of the title reaction, k1 was measured in N2–H2O mixtures at 273, 298, and 333 K. A total pressure of 50 Torr (N2+ H2O) was chosen for these experiments as sensitivity to a potential increase in k1 through the presence of water is highest at conditions far from k1,∞. As described in Sect. 2.2, both SO2 (at 213.856 nm) and H2O (at 184.95 nm) were monitored online by optical absorption. The large absorption cross-section of HNO3 at 184.95 nm (1.61 × 10⁻¹⁷ cm2 molecule−1) (Dulitz et al., 2018) would hinder the accurate determination of the H2O concentration, and H2O2 was therefore used as the OH precursor in all measurements in N2–H2O bath gas. The molar H2O mixing ratio in N2 () was varied up to 0.2 for measurements at 298 and 333 K and up to 0.05 at 273 K to avoid condensation of water in the reactor and optical absorption cells. The results are summarized in Table S2, and measured values of k1 are plotted versus in Fig. 11, in which k1 is seen to increase with the water content of the bath gas, indicating that H2O is a more efficient third-body quencher than N2 for the title reaction. This is illustrated in Fig. 12 where we plot the fall-off curves for k1 in N2 and H2O bath gases. We note that, as for examining the water-vapour effect in the OH + NO2 reaction (Amedro et al., 2020), continuous, in situ measurement of the SO2 concentration is critical to obtaining the correct result as SO2 concentrations (i.e. optical density at 213.86 nm) decreased when H2O was added to the flowing mixture. This presumably reflects losses of SO2 on the glass surfaces of the apparatus on which H2O would have been adsorbed.
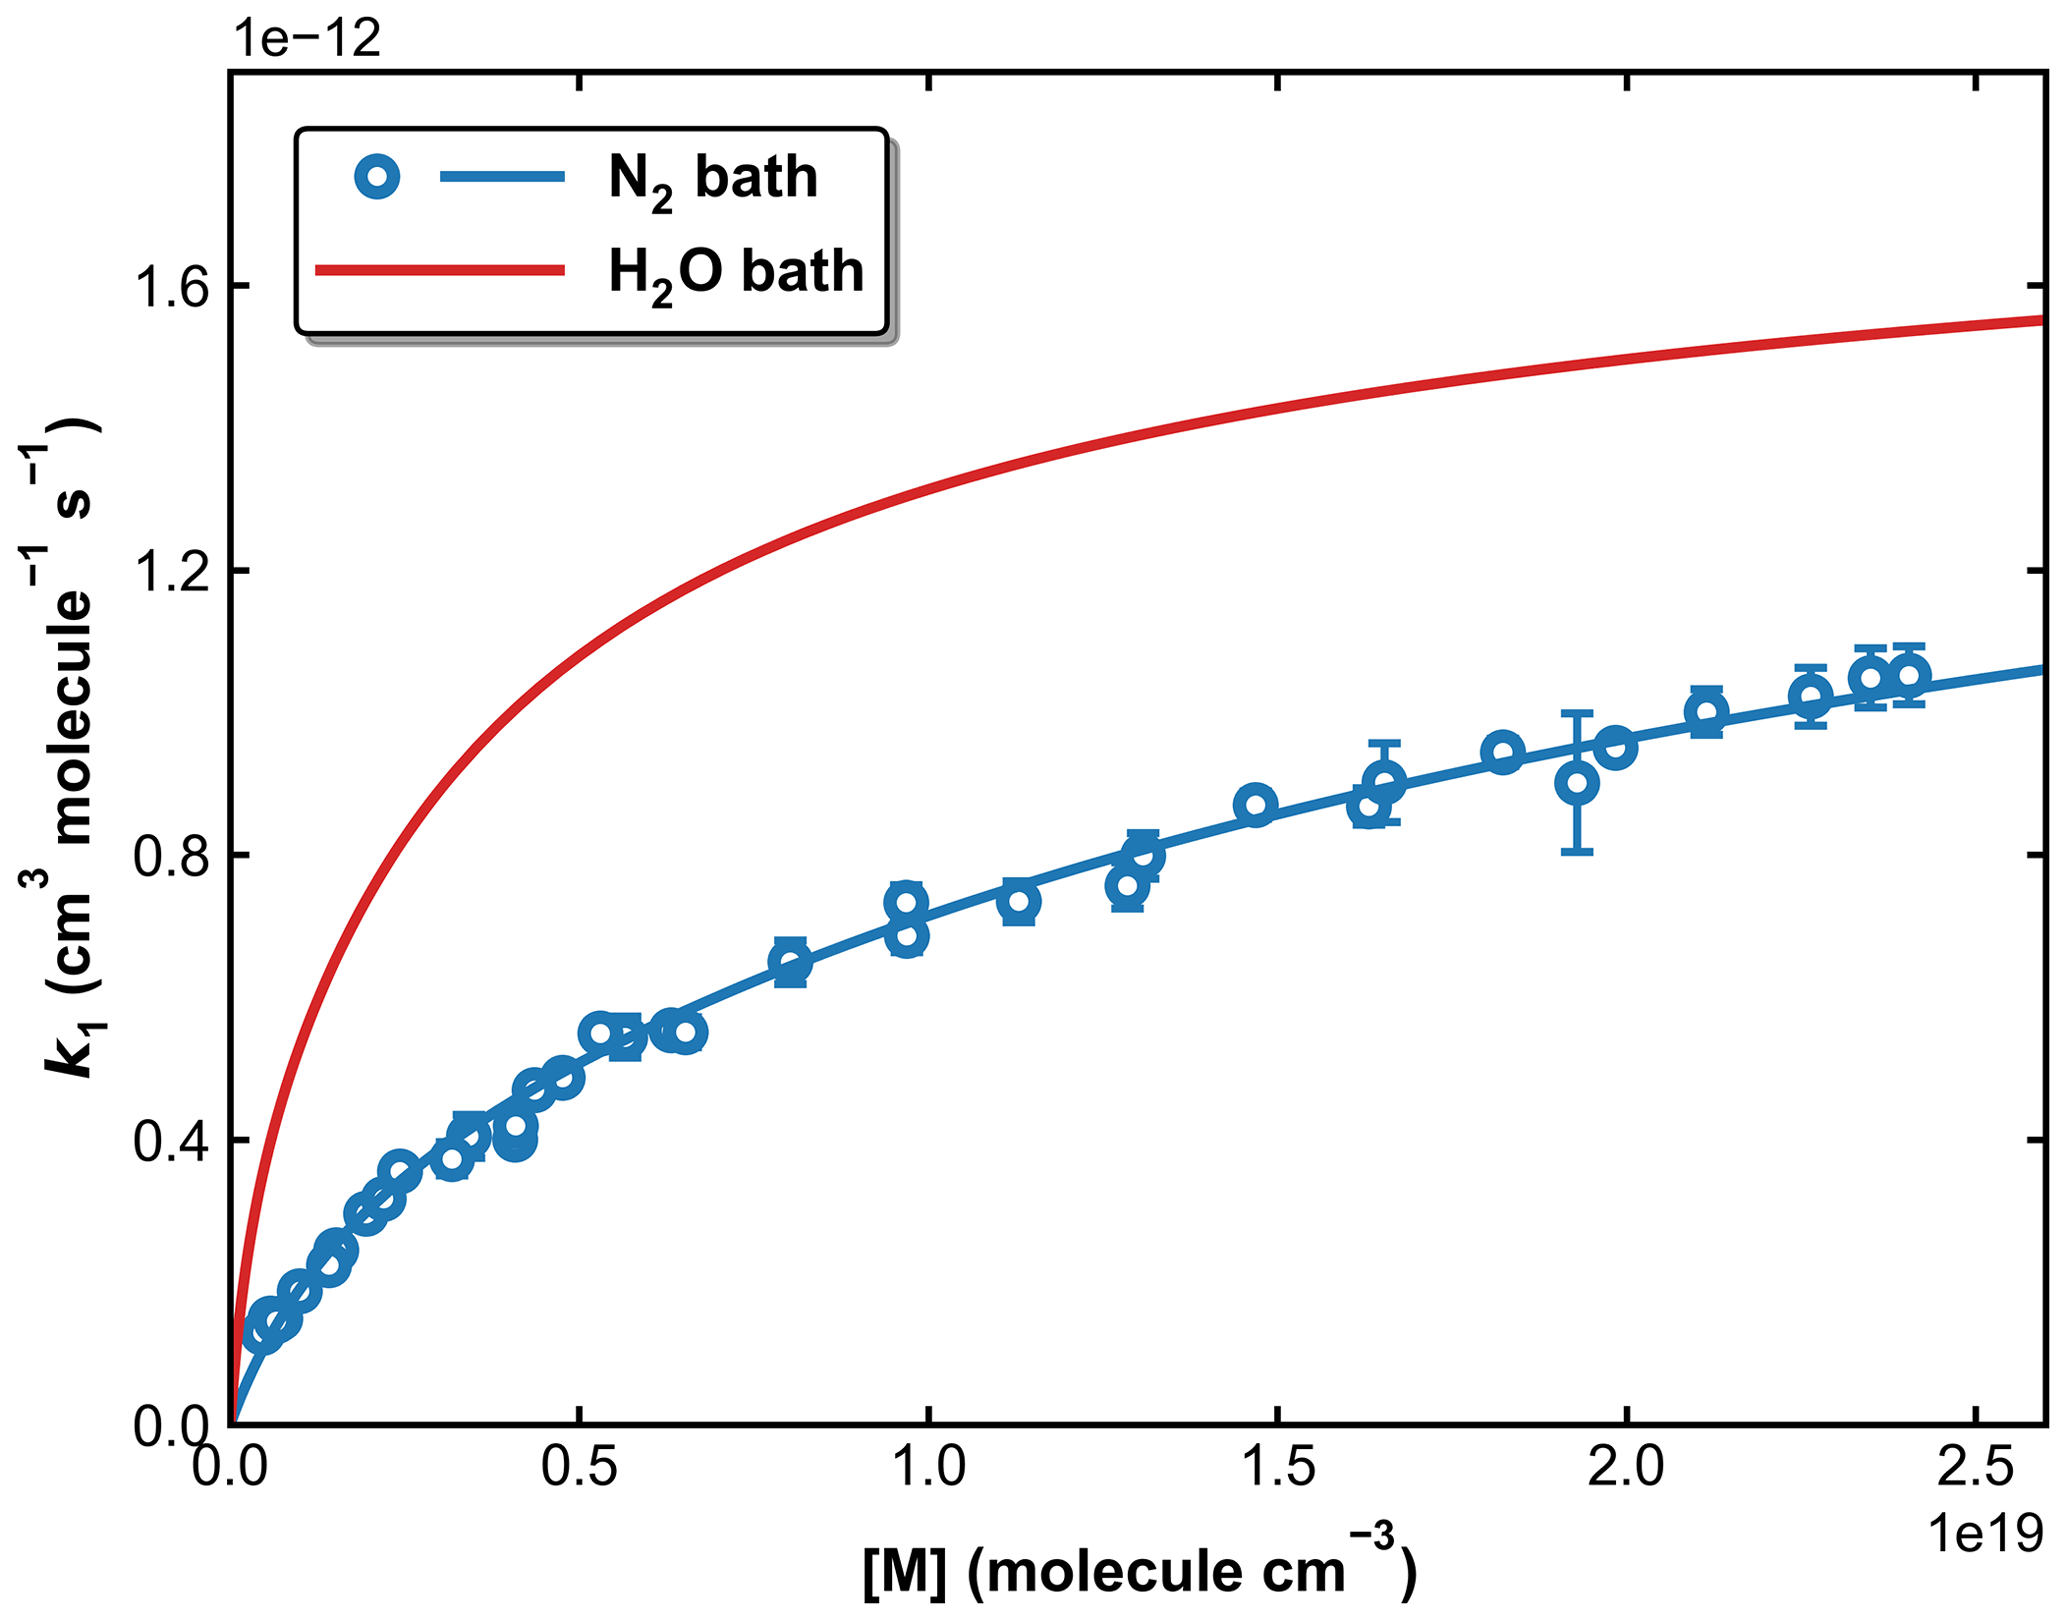
Figure 12Fall-off curves for k1 in N2 and H2O bath gases at 298 K. The solid lines are our preferred parameterization with × 10−12 cm3 molecule−1 s−1 (independent of bath gas), × 10−31 cm6 molecule−2 s−1, and × 10−30 cm6 molecule−2 s−1, .
To evaluate the role of water in the rate coefficient of the title reaction, a parameterization of the third-body effect of H2O is required, and we adopt the approach used in Amedro et al. (2020) for the OH + NO2 reaction.
Extending Eq. (3), k1 in the N2–H2O mixture can be expressed by
where and are the mole fraction of H2O and N2, is the low-pressure limiting rate coefficients (cm6 molecule−2 s−1) in pure H2O, and o is a dimensionless temperature exponent. The broadening factor F is then
Here, the low-pressure limiting rate coefficients in pure N2 and pure H2O are linearly mixed, and the same value of FC is assumed for simplification. By inputting the values of , k1,∞, FC, and n listed in Table 2 (Method 1), a multivariate, least-squares fit (solid lines in Fig. 9) results in × 10−30 cm6 molecule−2 s−1 and o=4.90, indicating that H2O, as a third-body collider, is at least 5 times more efficient than N2.
We also consider the use of different values of FC for N2 and H2O, which may be more appropriate for bath gases with distinctly different properties (Burke and Song, 2017) and adopted for the OH+NO2 reaction in He–H2O mixtures (Amedro et al., 2020). In the present case, however, FC for N2 is already close to 0.6, so the differences are expected to be small, and the use of the more complex expression for the purpose of atmospheric modelling of the reaction is not warranted. This is detailed in the Supplement.
3.5 Atmospheric modelling of the OH + SO2 reaction including the effect of water vapour
The chemistry and climate simulation model used is EMAC (ECHAM-MESSy), which uses the fifth-generation European Centre Hamburg general circulation model (ECHAM5; Roeckner et al., 2006) as core atmospheric general circulation model (Jöckel et al., 2006, 2010). In this study we used EMAC (ECHAM5 version 5.3.02, MESSy version 2.55.0) at T63L47MA-resolution, i.e. with a spherical truncation of T63 (∼ 1.8 by 1.8∘ in latitude and longitude), with 47 vertical hybrid-terrain-following pressure levels up to 0.01 hPa. The model was weakly nudged in spectral space, applying Newtonian relaxation of the parameters temperature, vorticity, divergence, and surface pressure to meteorological reanalysis data (Jeuken et al., 1996). The model setup is identical to the simulation RED presented in Reifenberg et al. (2021), where the model was evaluated against an aircraft campaign over Europe. In addition, the model has been evaluated on many occasions (Pozzer et al., 2012a, b; Yan et al., 2019). For additional references, see http://www.messy-interface.org (last access: 2021). As in Reifenberg et al. (2021), EMAC was used in a chemical-transport model (Deckert et al., 2011) without feedbacks between photochemistry, radiation, and atmospheric dynamics. In this work, we performed three identical simulations for the year 2019 but with three different parameterizations of k1 from this work and from the IUPAC and NASA evaluations panels. For the simulations we assume that O2 has the same collisional quenching efficiency as N2 as is for the case for nearly all termolecular processes of atmospheric importance.
In Fig. 13, we illustrate the impact of H2O vapour on the rate coefficient, by plotting the reduction in k1 at the Earth's surface (lowest 1–2 km of the atmosphere) when setting to zero relative to using EMAC water-vapour fields. The greatest effect of water vapour on k1 is found in warm, tropical regions, where an average underestimation of the rate coefficient by up to ≈5 % is found when . At higher/lower latitudes, the effect is diminished, and water vapour accounts for only a few percent of the overall rate coefficient at 40∘ N/S. The presence of water vapour does not impact values of k1 above the boundary layer significantly.
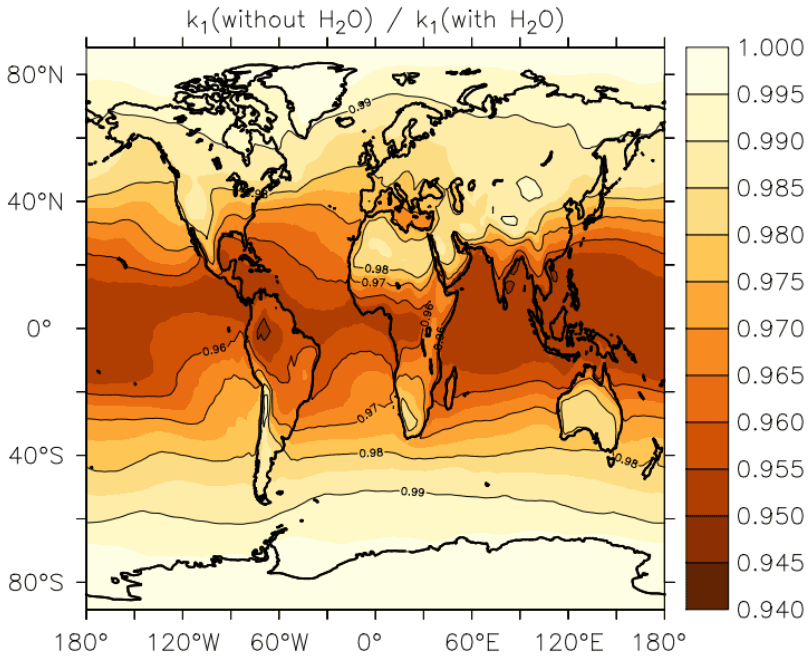
Figure 13Annual, average effect of H2O on k1 expressed as the fractional change in the rate coefficient near the Earth's surface (altitude of 1–2 km) when setting the mole fraction of water vapour to zero in Eqs. (5) and (6).
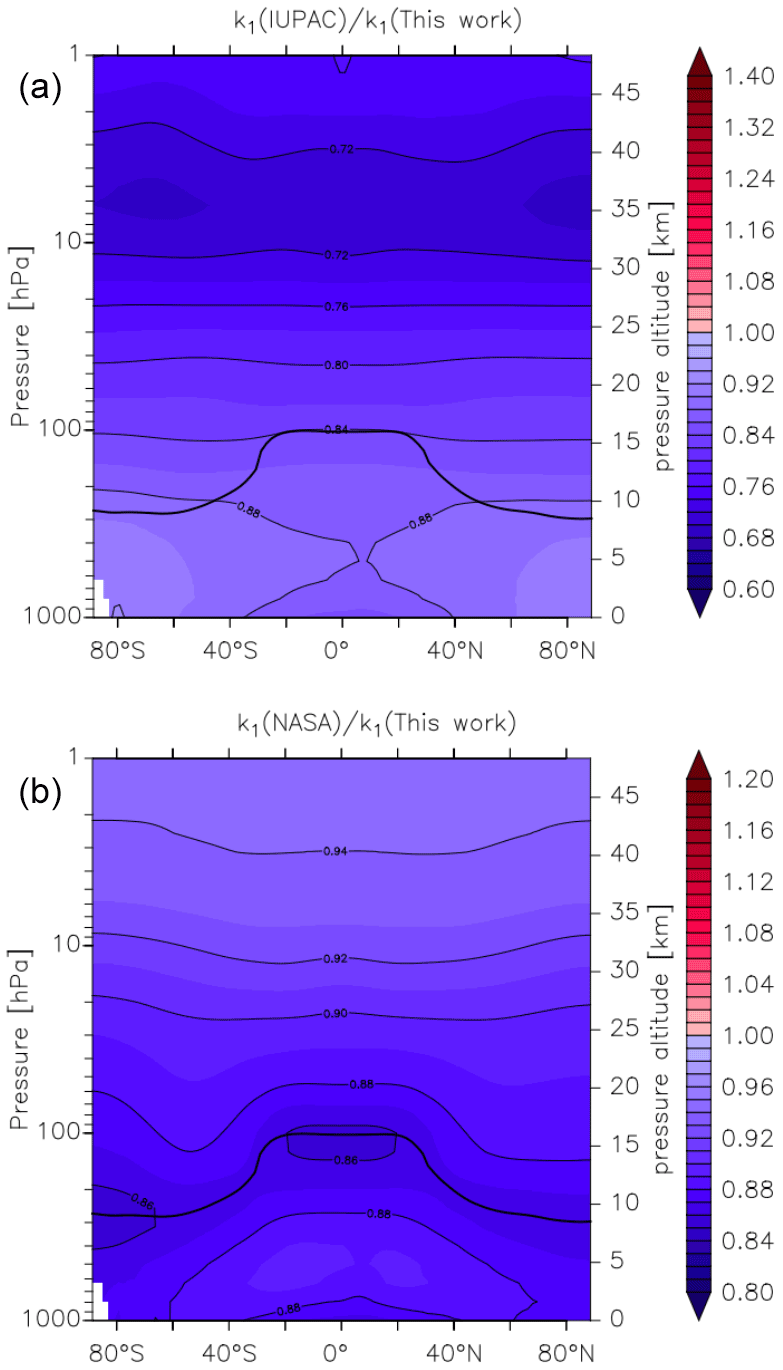
Figure 14Global values of (a) and (b). k1 was calculated using the parameters from this work and those presently recommended by the IUPAC and NASA data evaluation panels. The relatively thick black line between 300 and 100 hPa represents the mean model tropopause.
In Fig. 14 we compare our new parameterization with preferred parameterizations of the IUPAC and NASA evaluation panels and plot values of k1(IUPAC) k1 (this work) and k1(NASA) k1 (this work) at different altitudes and latitudes. We parameterized k1 using the expressions given in this work (Eq. 5, Table 2) and in the latest evaluations of IUPAC (IUPAC, 2021) and NASA (Burkholder et al., 2020). k1(IUPAC) k1 (this work) varies between 0.88 close to the Earth's surface to 0.72 at altitudes above ∼ 30 km, whereas k1(NASA) k1 (this work) varies between 0.88 at the Earth's surface to 0.92 at ∼ 30 km. Thus, while both evaluations under-predict k1 by ≈12 % at the Earth's surface (a combined consequence of their lower values of k1 in N2 (dry air) and neglecting water-vapour effects), the NASA parameterization does well in the lower stratosphere (under-predicting our result by less than 10 %), whereas the IUPAC parameters result in a rate coefficient that is too low by almost 30 %. At high altitudes, the divergent rate coefficients recommended by the evaluation panels reflect the choice of experimental data used to derive the low-pressure limiting rate coefficient and its temperature dependence.
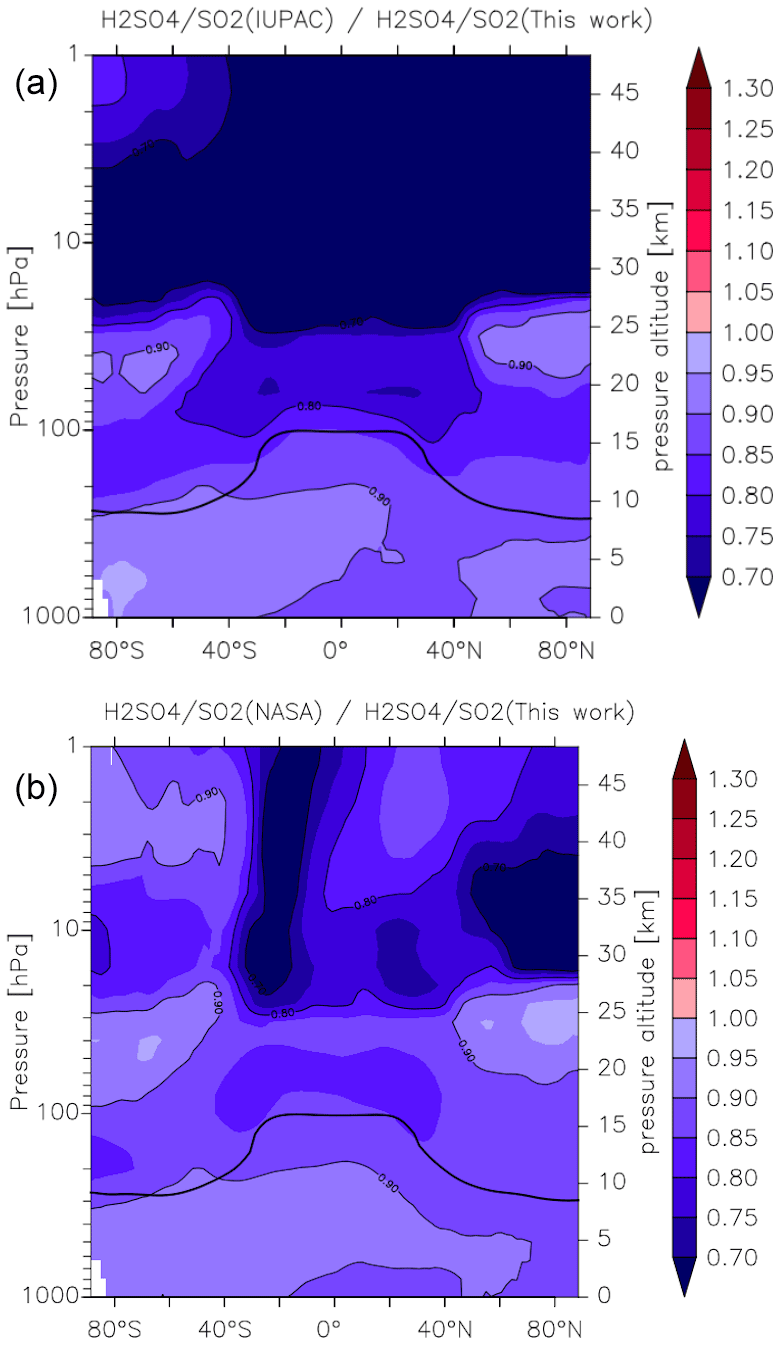
Figure 15Effect of different parameterizations of k1 on the global (zonal and yearly averaged) H2SO4 to SO2 ratio. Panel (a) plots (this work), and panel (b) plots (this work). The relatively thick black line between 300 and 100 hPa represents the mean model tropopause.
As the reaction between OH and SO2 ultimately results in the formation of H2SO4, the atmospheric ratio is sensitive to the rate coefficient k1, with an increase in k1 resulting in a decrease in SO2 and an increase in H2SO4, thus amplifying the impact. In Fig. 15 we plot zonally and yearly averaged model values of (this work) and (this work). Compared to the parameterization of k1 in this work, the IUPAC evaluation returns ratios that are close to 0.9 at the Earth's surface but decrease to 0.7 in the lower to mid-stratosphere at low latitudes. Again, the NASA parameterization performs somewhat better, though here we also find an underestimation of the ratio of between 10 % and 20 % throughout most of the atmosphere. The impact on the H2SO4 to SO2 ratio is thus similar to the change in the rate coefficients, so that the expected amplification is not observed in the model. This is related to an increase in the sink term of H2SO4 (via nucleation), which counteracts the increase in its production rate.
The modelling studies indicate that use of IUPAC and NASA parameterizations results in very different values of k1 in some parts of the atmosphere and will result in divergent predictions of partitioning of reactive sulfur gases between SO2 and H2SO4. The present parameterization, based on precise and accurate temperature-dependent measurements in the fall-off regime in N2, does not rely on potentially erroneous data at very low and very high pressures and is expected to lead to more accurate values of k1 for modelling the title reaction in the Earth's atmosphere, both at the surface (where the effect of water vapour has been considered for the first time) and at the low pressures and temperatures prevalent in the upper troposphere–lower stratosphere (UT-LS) region.
Rate coefficients for the reaction of SO2+OH (k1) in fall-off regime were experimentally determined in a wide range of pressures and temperatures relevant to the atmosphere. More than 100 individual measurements for k1 were carried out in N2 and bath gases using pulsed laser photolytic (PLP) generation of OH coupled to real-time detection of OH via laser-induced fluorescence (LIF). The presence of water vapour was found to enhance the rate coefficient of the title reaction significantly, indicating that H2O is a more efficient third-body collider than N2 or O2 (by a factor of >5). Based on our comprehensive dataset in the fall-off regime, we derived a new parameterization of the rate coefficient which results in values of k1 that are larger than those preferred by the IUPAC and NASA panels, leading to a more rapid removal of SO2 through gas-phase oxidation than previously assumed and thus to an underestimation of the ratio in nearly all regions of the Earth's atmosphere.
The rate coefficients measured during this experimental study are listed in the Supplement.
The supplement related to this article is available online at: https://doi.org/10.5194/acp-22-4969-2022-supplement.
The experiments were carried out by WS with assistance from MB and JNC. The data analysis was performed by WS. The global modelling was performed by AP. The manuscript was written by WS with assistance from JNC and JL.
The contact author has declared that neither they nor their co-authors have any competing interests.
Publisher's note: Copernicus Publications remains neutral with regard to jurisdictional claims in published maps and institutional affiliations.
We thank Mark Blitz for communicating revised parameters for the University of Leeds dataset on the title reaction.
The article processing charges for this open-access publication were covered by the Max Planck Society.
This paper was edited by Sergey A. Nizkorodov and reviewed by two anonymous referees.
Amedro, D., Bunkan, A. J. C., Berasategui, M., and Crowley, J. N.: Kinetics of the OH + NO2 reaction: rate coefficients (217–333 K, 16–1200 mbar) and fall-off parameters for N2 and O2 bath gases, Atmos. Chem. Phys., 19, 10643–10657, https://doi.org/10.5194/acp-19-10643-2019, 2019.
Amedro, D., Berasategui, M., Bunkan, A. J. C., Pozzer, A., Lelieveld, J., and Crowley, J. N.: Kinetics of the OH + NO2 reaction: effect of water vapour and new parameterization for global modelling, Atmos. Chem. Phys., 20, 3091–3105, https://doi.org/10.5194/acp-20-3091-2020, 2020.
Atkinson, R., Baulch, D. L., Cox, R. A., Crowley, J. N., Hampson, R. F., Hynes, R. G., Jenkin, M. E., Rossi, M. J., and Troe, J.: Evaluated kinetic and photochemical data for atmospheric chemistry: Volume I – gas phase reactions of Ox, HOx, NOx and SOx species, Atmos. Chem. Phys., 4, 1461–1738, https://doi.org/10.5194/acp-4-1461-2004, 2004.
Badr, O. and Probert, S.: Atmospheric sulphur: trends, sources, sinks and environmental impacts, Appl. Energ., 47, 1–67, 1994.
Barnes, I., Bastian, V., Becker, K., Fink, E., and Nelsen, W.: Oxidation of sulphur compounds in the atmosphere: I. Rate constants of OH radical reactions with sulphur dioxide, hydrogen sulphide, aliphatic thiols and thiophenol, J. Atmos. Chem., 4, 445–466, https://doi.org/10.1007/BF00053845, 1986.
Beilke, S. and Gravenhorst, G.: Heterogeneous SO2-oxidation in the droplet phase, in: Sulfur in the Atmosphere, Elsevier, 231–239, https://doi.org/10.1016/B978-0-08-022932-4.50025-2, 1978.
Bekki, S.: Oxidation of volcanic SO2: a sink for stratospheric OH and H2O, Geophys. Res. Lett., 22, 913–916, https://doi.org/10.1029/95GL00534, 1995.
Blitz, M. A., Hughes, K. J., and Pilling, M. J.: Determination of the high-pressure limiting rate coefficient and the enthalpy of reaction for OH+SO2, J. Phys. Chem. A, 107, 1971–1978, 2003.
Blitz, M. A., Salter, R. J., Heard, D. E., and Seakins, P. W.: An experimental study of the kinetics of OH/OD (v= 1, 2, 3)+ SO2: the limiting high-pressure rate coefficients as a function of temperature, J. Phys. Chem. A, 121, 3175–3183, https://doi.org/10.1021/acs.jpca.7b01294, 2017a.
Blitz, M. A., Salter, R. J., Heard, D. E., and Seakins, P. W.: An Experimental and Master Equation Study of the Kinetics of OH/OD+ SO2: The Limiting High-Pressure Rate Coefficients, J. Phys. Chem. A, 121, 3184–3191, https://doi.org/10.1021/acs.jpca.7b01295, 2017b.
Brimblecombe, P.: The global sulfur cycle, in: Treatise on Geochemistry: Second edn., Elsevier Inc., 559–591, https://doi.org/10.1016/B978-0-08-095975-7.00814-7, 2013.
Brown, K. A.: Sulphur in the environment: a review, Environ. Pollut. B, 3, 47–80, https://doi.org/10.1016/0143-148X(82)90042-8, 1982.
Burke, M. P. and Song, R.: Evaluating mixture rules for multi-component pressure dependence: H+O2 (+M)=HO2 (+M), P. Combust. Inst., 36, 245–253, https://doi.org/10.1016/j.proci.2016.06.068, 2017.
Burkholder, J. B., Sander, S. P., Abbatt, J., Barker, J. R., Cappa, C., Crounse, J. D., Dibble, T. S., Huie, R. E., Kolb, C. E., Kurylo, M. J., Orkin, V. L., Percival, C. J., Wilmouth, D. M., and Wine, P. H.: Chemical Kinetics and Photochemical Data for Use in Atmospheric Studies, Evaluation No. 19, JPL Publication 19-5, Jet Propulsion Laboratory, Pasadena, https://jpldataeval.jpl.nasa.gov/ (last access: October 2021), 2019.
Cantrell, C. A., Zimmer, A., and Tyndall, G. S.: Absorption cross sections for water vapor from 183 to 193 nm, Geophys. Res. Lett., 24, 2195–2198, 1997.
Castleman Jr., A. and Tang, I.: Kinetics of the association reaction of SO2 with the hydroxyl radical, J. Photochem., 6, 349–354, https://doi.org/10.1016/0047-2670(76)85073-3, 1976.
Cox, R.: Photochemical oxidation of atmospheric sulphur dioxide, Philos. T. Roy. Soc. A, 290, 543–550, https://doi.org/10.1098/rsta.1979.0013, 1979.
Cox, R. and Sheppard, D.: Reactions of OH radicals with gaseous sulphur compounds, Nature, 284, 330–331, https://doi.org/10.1038/284330a0, 1980.
Davis, D., Ravishankara, A., and Fischer, S.: SO2 oxidation via the hydroxyl radical: atmospheric fate of HSOx radicals, Geophys. Res. Lett., 6, 113–116, https://doi.org/10.1029/GL006i002p00113, 1979.
Deckert, R., Jöckel, P., Grewe, V., Gottschaldt, K.-D., and Hoor, P.: A quasi chemistry-transport model mode for EMAC, Geosci. Model Dev., 4, 195–206, https://doi.org/10.5194/gmd-4-195-2011, 2011.
Dulitz, K., Amedro, D., Dillon, T. J., Pozzer, A., and Crowley, J. N.: Temperature-(208–318 K) and pressure-(18–696 Torr) dependent rate coefficients for the reaction between OH and HNO3, Atmos. Chem. Phys., 18, 2381–2394, https://doi.org/10.5194/acp-18-2381-2018, 2018.
Feichter, J., Kjellström, E., Rodhe, H., Dentener, F., Lelieveldi, J., and Roelofs, G.-J.: Simulation of the tropospheric sulfur cycle in a global climate model, Atmos. Env., 30, 1693–1707, https://doi.org/10.1016/1352-2310(95)00394-0, 1996.
Fulle, D., Hamann, H. F., and Hippler, H.: The pressure and temperature dependence of the recombination reaction HO+SO2+M?HOSO2+M, Phys. Chem. Chem. Phys., 1, 2695–2702, https://doi.org/10.1039/A901596E, 1999.
Heckendorn, P., Weisenstein, D., Fueglistaler, S., Luo, B. P., Rozanov, E., Schraner, M., Thomason, L. W., and Peter, T.: The impact of geoengineering aerosols on stratospheric temperature and ozone, Environ. Res. Lett., 4, 045108, https://doi.org/10.1088/1748-9326/4/4/045108, 2009.
Huang, H.-L. and Chao, W.: Kinetics of a Criegee intermediate that would survive high humidity and may oxidize atmospheric SO2, P. Natl. Acad. Sci., 112, 10857–10862, https://doi.org/10.1073/pnas.1513149112, 2015.
IUPAC Task Group on Atmospheric Chemical Kinetic Data Evaluation: Evaluated Kinetis Data, edited by: Ammann, M., Cox, R. A., Crowley, J. N., Herrmann, H., Jenkin, M. E., McNeill, V. F., Mellouki, A., Rossi, M. J., Troe, J., and Wallington, T. J., https://iupac.aeris-data.fr/en/home/, last access: September 2021.
Izumi, K., Mizuochi, M., Yoshioka, M., Murano, K., and Fukuyama, T.: Redetermination of the rate constant for the reaction of hydroxyl radicals with sulfur dioxide, Env. Sci. Tech., 18, 116–118, https://doi.org/10.1021/es00120a014, 1984.
Jeuken, A. B. M., Siegmund, P. C., Heijboer, L. C., Feichter, J., and Bengtsson, L.: On the potential of assimilating meteorological analyses in a global climate model for the purpose of model validation, J. Geophys. Res.-Atmos., 101, 16939–16950, 1996.
Jöckel, P., Tost, H., Pozzer, A., Brühl, C., Buchholz, J., Ganzeveld, L., Hoor, P., Kerkweg, A., Lawrence, M. G., Sander, R., Steil, B., Stiller, G., Tanarhte, M., Taraborrelli, D., van Aardenne, J., and Lelieveld, J.: The atmospheric chemistry general circulation model ECHAM5/MESSy1: consistent simulation of ozone from the surface to the mesosphere, Atmos. Chem. Phys., 6, 5067–5104, https://doi.org/10.5194/acp-6-5067-2006, 2006.
Jöckel, P., Kerkweg, A., Pozzer, A., Sander, R., Tost, H., Riede, H., Baumgaertner, A., Gromov, S., and Kern, B.: Development cycle 2 of the Modular Earth Submodel System (MESSy2), Geosci. Model Dev., 3, 717–752, https://doi.org/10.5194/gmd-3-717-2010, 2010.
Kulmala, M., Laaksonen, A., and Pirjola, L.: Parameterizations for sulfuric acid/water nucleation rates, J. Geophys. Res.-Atmos., 103, 8301–8307, https://doi.org/10.1029/97JD03718, 1998.
Lee, Y. Y., Kao, W. C., and Lee, Y. P.: Kinetics of the reaction hydroxyl + sulfur dioxide in helium, nitrogen, and oxygen at low pressure, J. Phys. Chem., 94, 4535–4540, https://doi.org/10.1021/j100374a035, 1990.
Lelieveld, J. and Heintzenberg, J.: Sulfate cooling effect on climate through in-cloud oxidation of anthropogenic SO2, Science, 258, 117–120, https://doi.org/10.1126/science.258.5079.117, 1992.
Lelieveld, J., Roelofs, G. J., Ganzeveld, L., Feichter, J., and Rodhe, H.: Terrestrial sources and distribution of atmospheric sulphur, Philos. T. Roy. Soc. B, 352, 149–158, https://doi.org/10.1098/rstb.1997.0010, 1997.
Leu, M. T.: Rate constants for the reaction of hydroxyl with sulfur dioxide at low pressure, J. Phys. Chem., 86, 4558–4562, https://doi.org/10.1021/es00120a014, 1982.
Liu, T., Clegg, S. L., and Abbatt, J. P.: Fast oxidation of sulfur dioxide by hydrogen peroxide in deliquesced aerosol particles, P. Natl. Acad. Sci., 117, 1354–1359, https://doi.org/10.1073/pnas.1916401117, 2020.
Manatt, S. L. and Lane, A. L.: A compilation of the absorption cross-sections of SO2 from 106 to 403 nm, J. Quant. Spectrosc. Ra., 50, 267–276, https://doi.org/10.1016/0022-4073(93)90077-U, 1993.
Martin, D., Jourdain, J., and Le Bras, G.: Discharge flow measurements of the rate constants for the reaction OH+SO2+He and HOSO2+O2 in relation with the atmospheric oxidation of sulfur dioxide, J. Phys. Chem., 90, 4143–4147, https://doi.org/10.1021/j100408a061, 1986.
Mauldin Iii, R., Berndt, T., Sipilä, M., Paasonen, P., Petäjä, T., Kim, S., Kurtén, T., Stratmann, F., Kerminen, V.-M., and Kulmala, M.: A new atmospherically relevant oxidant of sulphur dioxide, Nature, 488, 193–196, https://doi.org/10.1038/nature11278, 2012.
Paraskevopoulos, G., Singleton, D. L., and Irwin, R. S.: Rates of OH radical reactions. The reaction OH+ SO2+ N2, Chem. Phys. Lett., 100, 83–87, https://doi.org/10.1016/0009-2614(83)87267-4, 1983.
Pozzer, A., de Meij, A., Pringle, K. J., Tost, H., Doering, U. M., van Aardenne, J., and Lelieveld, J.: Distributions and regional budgets of aerosols and their precursors simulated with the EMAC chemistry-climate model, Atmos. Chem. Phys., 12, 961–987, https://doi.org/10.5194/acp-12-961-2012, 2012a.
Pozzer, A., Zimmermann, P., Doering, U. M., van Aardenne, J., Tost, H., Dentener, F., Janssens-Maenhout, G., and Lelieveld, J.: Effects of business-as-usual anthropogenic emissions on air quality, Atmos. Chem. Phys., 12, 6915–6937, https://doi.org/10.5194/acp-12-6915-2012, 2012b.
Reifenberg, S. F., Martin, A., Kohl, M., Hamryszczak, Z., Tadic, I., Röder, L., Crowley, D. J., Fischer, H., Kaiser, K., Schneider, J., Dörich, R., Crowley, J. N., Tomsche, L., Marsing, A., Voigt, C., Zahn, A., Pöhlker, C., Holanda, B., Krüger, O. O., Pöschl, U., Pöhlker, M., Jöckel, P., Dorf, M., Schumann, U., Williams, J., Curtius, J., Harder, H., Schlager, H., Lelieveld, J., and Pozzer, A.: Impact of reduced emissions on direct and indirect aerosol radiative forcing during COVID–19 lockdown in Europe, Atmos. Chem. Phys. Discuss. [preprint], https://doi.org/10.5194/acp-2021-1005, in review, 2021.
Roeckner, E., Brokopf, R., Esch, M., Giorgetta, M., Hagemann, S., Kornblueh, L., Manzini, E., Schlese, U., and Schulzweida, U.: Sensitivity of simulated climate to horizontal and vertical resolution in the ECHAM5 atmosphere model, J. Clim., 19, 3771–3791, 2006.
Rollins, A. W., Thornberry, T. D., Ciciora, S. J., McLaughlin, R. J., Watts, L. A., Hanisco, T. F., Baumann, E., Giorgetta, F. R., Bui, T. V., Fahey, D. W., and Gao, R.-S.: A laser-induced fluorescence instrument for aircraft measurements of sulfur dioxide in the upper troposphere and lower stratosphere, Atmos. Meas. Tech., 9, 4601–4613, https://doi.org/10.5194/amt-9-4601-2016, 2016.
Rufus, J., Stark, G., Smith, P. L., Pickering, J. C., and Thorne, A. P.: High-resolution photoabsorption cross sectionmeasurements of SO2, 2: 220 to 325 nm at 295 K, J. Geophys. Res., 108, 5011, https://doi.org/10.1029/2002JE001931, 2003.
Saltzman, E., Brass, G., and Price, D.: The mechanism of sulfate aerosol formation: Chemical and sulfur isotopic evidence, Geophys. Res. Lett., 10, 513–516, https://doi.org/10.1029/GL010i007p00513, 1983.
Schiffman, A., Nelson Jr., D., and Nesbitt, D. J.: Quantum yields for OH production from 193 and 248 nm photolysis of HNO3 and H2O2, J. Chem. Phys., 98, 6935–6946, https://doi.org/10.1063/1.464735, 1993.
Sipilä, M., Berndt, T., Petäjä, T., Brus, D., Vanhanen, J., Stratmann, F., Patokoski, J., Mauldin, R. L., Hyvärinen, A.-P., and Lihavainen, H.: The role of sulfuric acid in atmospheric nucleation, Science, 327, 1243–1246, https://doi.org/10.1126/science.1180315, 2010.
Stark, G., Smith, P. L., Rufus, J., Thorne, A., Pickering, J., and Cox, G.: High-resolution photoabsorption cross-section measurements of SO2 at 295 K between 198 and 220 nm, J. Geophys. Res.-Planet, 104, 16585–16590, https://doi.org/10.1029/2002JE001931, 1999.
Stevenson, D., Johnson, C., Collins, W., and Derwent, R.: The tropospheric sulphur cycle and the role of volcanic SO2, Geological Society, London, Special Publications, 213, 295–305, https://doi.org/10.1144/GSL.SP.2003.213.01.18, 2003.
Stutz, J., Kim, E., Platt, U., Bruno, P., Perrino, C., and Febo, A.: UV-visible absorption cross sections of nitrous acid, J. Geophys. Res.-Atmos., 105, 14585–14592, https://doi.org/10.1016/S1352-2310(99)00322-2, 2000.
Troe, J.: Theory of thermal unimolecular reactions in the fall-off range. I. Strong collision rate constants, Berichte der Bunsengesellschaft für physikalische Chemie, 87, 161–169, 1983.
Troe, J.: Toward a Quantitative Analysis of Association Reactions in the Atmosphere, Chem. Rev., 103, 4565–4576, https://doi.org/10.1021/cr020514b, 2003.
Troe, J. and Ushakov, V. G.: Representation of “broad” falloff curves for dissociation and recombination reactions, Z. Phys. Chem., 228, 1–10, https://doi.org/10.1515/zpch-2014-0468, 2014.
Vaghjiani, G. L. and Ravishankara, A.: Absorption cross sections of CH3OOH, H2O2, and D2O2 vapors between 210 and 365 nm at 297 K, J. Geophys. Res.-Atmos., 94, 3487–3492, https://doi.org/10.1029/JD094iD03p03487, 1989.
Vehkamäki, H., Kulmala, M., Napari, I., Lehtinen, K. E., Timmreck, C., Noppel, M., and Laaksonen, A.: An improved parameterization for sulfuric acid–water nucleation rates for tropospheric and stratospheric conditions, J. Geophys. Res.-Atmos., 107, AAC 3-1–AAC 3-10, https://doi.org/10.1029/2002JD002184, 2002.
Weisenstein, D. K., Ko, M. K., Sze, N. D., and Rodriguez, J. M.: Potential impact of SO2 emissions from stratospheric aircraft on ozone, Geophys. Res. Lett., 23, 161–164, https://doi.org/10.1029/95GL03781, 1996.
Wine, P., Thompson, R., Ravishankara, A., Semmes, D., Gump, C., Torabi, A., and Nicovich, J.: Kinetics of the reaction OH+ SO2+ M. fwdarw. HOSO2+ M. Temperature and pressure dependence in the fall-off region, J. Phys. Chem., 88, 2095–2104, https://doi.org/10.1021/j150654a031, 1984.
Wollenhaupt, M., Carl, S., Horowitz, A., and Crowley, J.: Rate coefficients for reaction of OH with acetone between 202 and 395 K, J. Phys. Chem. A, 104, 2695–2705, https://doi.org/10.1021/jp993738f, 2000.
Yan, Y. Y., Lin, J. T., Pozzer, A., Kong, S. F., and Lelieveld, J.: Trend reversal from high-to-low and from rural-to-urban ozone concentrations over Europe, Atmos. Env., 213, 25–36, https://doi.org/10.1016/j.atmosenv.2019.05.067, 2019.