the Creative Commons Attribution 4.0 License.
the Creative Commons Attribution 4.0 License.
 | 11 Apr 2022
North China Plain as a hot spot of ozone pollution exacerbated by extreme high temperatures
Pinya Wang
Huimin Li
Lei Chen
Ruijun Dang
Daokai Xue
Baojie Li
Jianping Tang
L. Ruby Leung
Hong Liao
A large population in China has been exposed to both severe ozone (O3) pollution and extreme heat under global warming. Here, the spatiotemporal characteristics of coupled extremes in surface O3 and heat (OPCs) over China are investigated using surface observations, a process-based chemical transport model (GEOS-Chem), and multi-model simulations from Phase 6 of the Coupled Model Intercomparison Project (CMIP6). North China Plain (NCP; 37–41∘ N; 114–120∘ E) is identified as a hot spot of OPCs, where more than half of the O3 pollution days are accompanied by high temperature extremes. OPCs over NCP exceeded 40 d during 2014–2019, exhibiting an increasing trend. Both O3 concentrations and temperatures are elevated during OPCs compared with O3 pollution days occurring individually (OPIs). Therefore, OPCs impose more severe health impacts to humans than OPIs, but the stronger health effects are mainly driven by the higher temperatures. GEOS-Chem simulations further reveal that enhanced chemical production resulting from hot and stable atmospheric conditions under anomalous weather patterns primarily contributes to the exacerbated O3 levels during OPCs. In the future, CMIP6 projections suggest increased occurrences of OPCs over NCP in the middle of this century, but by the end of this century, OPCs may decrease or increase depending on the pollutant emission scenarios. However, for all future scenarios, extreme high temperatures will play an increasingly important role in modulating O3 pollution in a warming climate.
- Article
(5322 KB) - Full-text XML
-
Supplement
(4723 KB) - BibTeX
- EndNote


With rapid economic development, car ownership, and fossil fuel consumption, China has been struck by severe air pollution in recent decades (Lu et al., 2018). Research and air quality controls have been prioritized to tackle the problem of particulate matter (PM2.5; T. Wang et al., 2017). Since the implementation of China's Action Plan on the Prevention and Control of Air Pollution Plan in 2013, anthropogenic emissions of many air pollutants and their precursor gases, including sulfur dioxide (SO2), nitrogen oxide (NOx), carbon monoxide (CO), black carbon (BC), and organic carbon (OC), decreased by 21 %–59 % between 2013 and 2017, despite an 11 % increase in anthropogenic emissions of nonmethane volatile organic compounds (NMVOCs; Zheng et al., 2018). Correspondingly, the annual average PM2.5 concentrations decreased from 72 to 47 µg m−3 in 74 major cities in China (Huang et al., 2018). In contrast, ozone (O3) concentrations in China show an apparently increasing trend during 2013–2017, with the annual average O3 concentrations in 74 key cities increasing from 140 to 160 µg m−3 (Huang et al., 2018). During the warm season (April to September) of the same period, the daily maximum 8 h average O3 concentration (MDA8 O3) increased at a rate of 3 % yr−1, far exceeding the rates in many other countries, such as Japan, Korea, and some in Europe (Lu et al., 2018). Long-term exposure to high O3 concentrations can seriously damage human health, agriculture, buildings, and ecology (Sharma et al., 2017; Yue et al., 2017). Therefore, the rising O3 concentration in recent years has caused great public concerns in China.
With global warming, extreme high temperatures and heat events have become natural hazards in China in recent decades, with substantial effect on socioeconomics, ecosystems, and human health (Lau and Nath, 2014; Meehl and Tebaldi, 2004). For instance, southern China was hit by a widespread heat wave with a record-breaking maximum temperature of 43.2 ∘C during summer 2003. The extreme heat event lasted for more than 40 d and caused heightened levels of human mortality (Tan et al., 2007; Wang et al., 2018). Such disastrous high temperatures have become more frequent in China (Wang et al., 2016). Mideastern China experienced an excessively long heat wave over a wide-ranging area from mid-July to mid-August 2018. The local maximum temperatures exceeded 40 ∘C, and the spatial extent involved 18 provinces, resulting in record-breaking overloaded power grids in many areas (M. Li et al., 2019; Lu et al., 2020). Recent studies found that extreme high temperatures and heat events have intensified in the past 60 years and are expected to become more frequent and severe in the coming decades (P. Wang et al., 2019a, 2017).
Extreme high temperatures are conducive to O3 pollution. Specifically, high temperatures can increase the production rate of surface O3 in the presence of abundant O3 precursors (Camalier et al., 2007; Lu et al., 2019a). As O3 concentration increases nonlinearly with temperature, extreme high temperatures have disproportionate impacts on O3 (Lin et al., 2020). Therefore, O3 pollution often co-occurs with extreme heat (Schnell and Prather, 2017). Besides the direct impacts of air temperatures on O3 production, the co-occurrence of extreme heat and O3 pollution arise from their shared underlying drivers, i.e., persistent high pressure, strong solar radiation, low humidity, and weak wind speeds (P. Wang et al., 2017, 2018; Perkins, 2015). Hence, despite reductions in anthropogenic emissions of O3 precursors in the U.S., Europe, and China, high O3 episodes will likely continue in the future due to increasing heat waves under climate warming (Zhang et al., 2018).
The coupled extremes in heat and O3 pollution lead to higher mortality rates than O3 pollution or hot extreme acting alone (Krug et al., 2019). While the impacts of extreme high temperatures on O3 pollution have been investigated using case studies in China (Ma et al., 2019; Pu et al., 2017), there is a gap in understanding the spatiotemporal characteristics and underlying mechanisms of coupled extremes in high temperatures and O3 pollution due to a lack of systematic analyses. Although extreme high temperatures are expected to be more frequent and intense in the future with accelerated warming, surface O3 concentrations are expected to decrease because of curtailment in O3 precursor emissions. Therefore, considerable uncertainties exist in the future changes of coupled extremes in heat and O3.
In this study, based on the available surface O3 concentrations and air temperature observations during 2014–2019, we investigate the spatiotemporal characteristics of co-occurrences of extremes in air temperatures and surface O3 in China, highlighting North China Plain (NCP; defined here as 37–41∘ N; 114–120∘ E; see Fig. 1) as a hot spot which has already suffered from the most severe O3 pollution in recent years (K. Li et al., 2019). The underlying mechanisms governing the coupled extreme are examined using the global chemical transport model GEOS-Chem. The associated health burden during the coupled extreme days is also discussed. In addition, future projections of the coupled extremes in the warming climate are explored based on the latest multi-model simulations from Phase 6 of the Coupled Model Intercomparison Project (CMIP6).
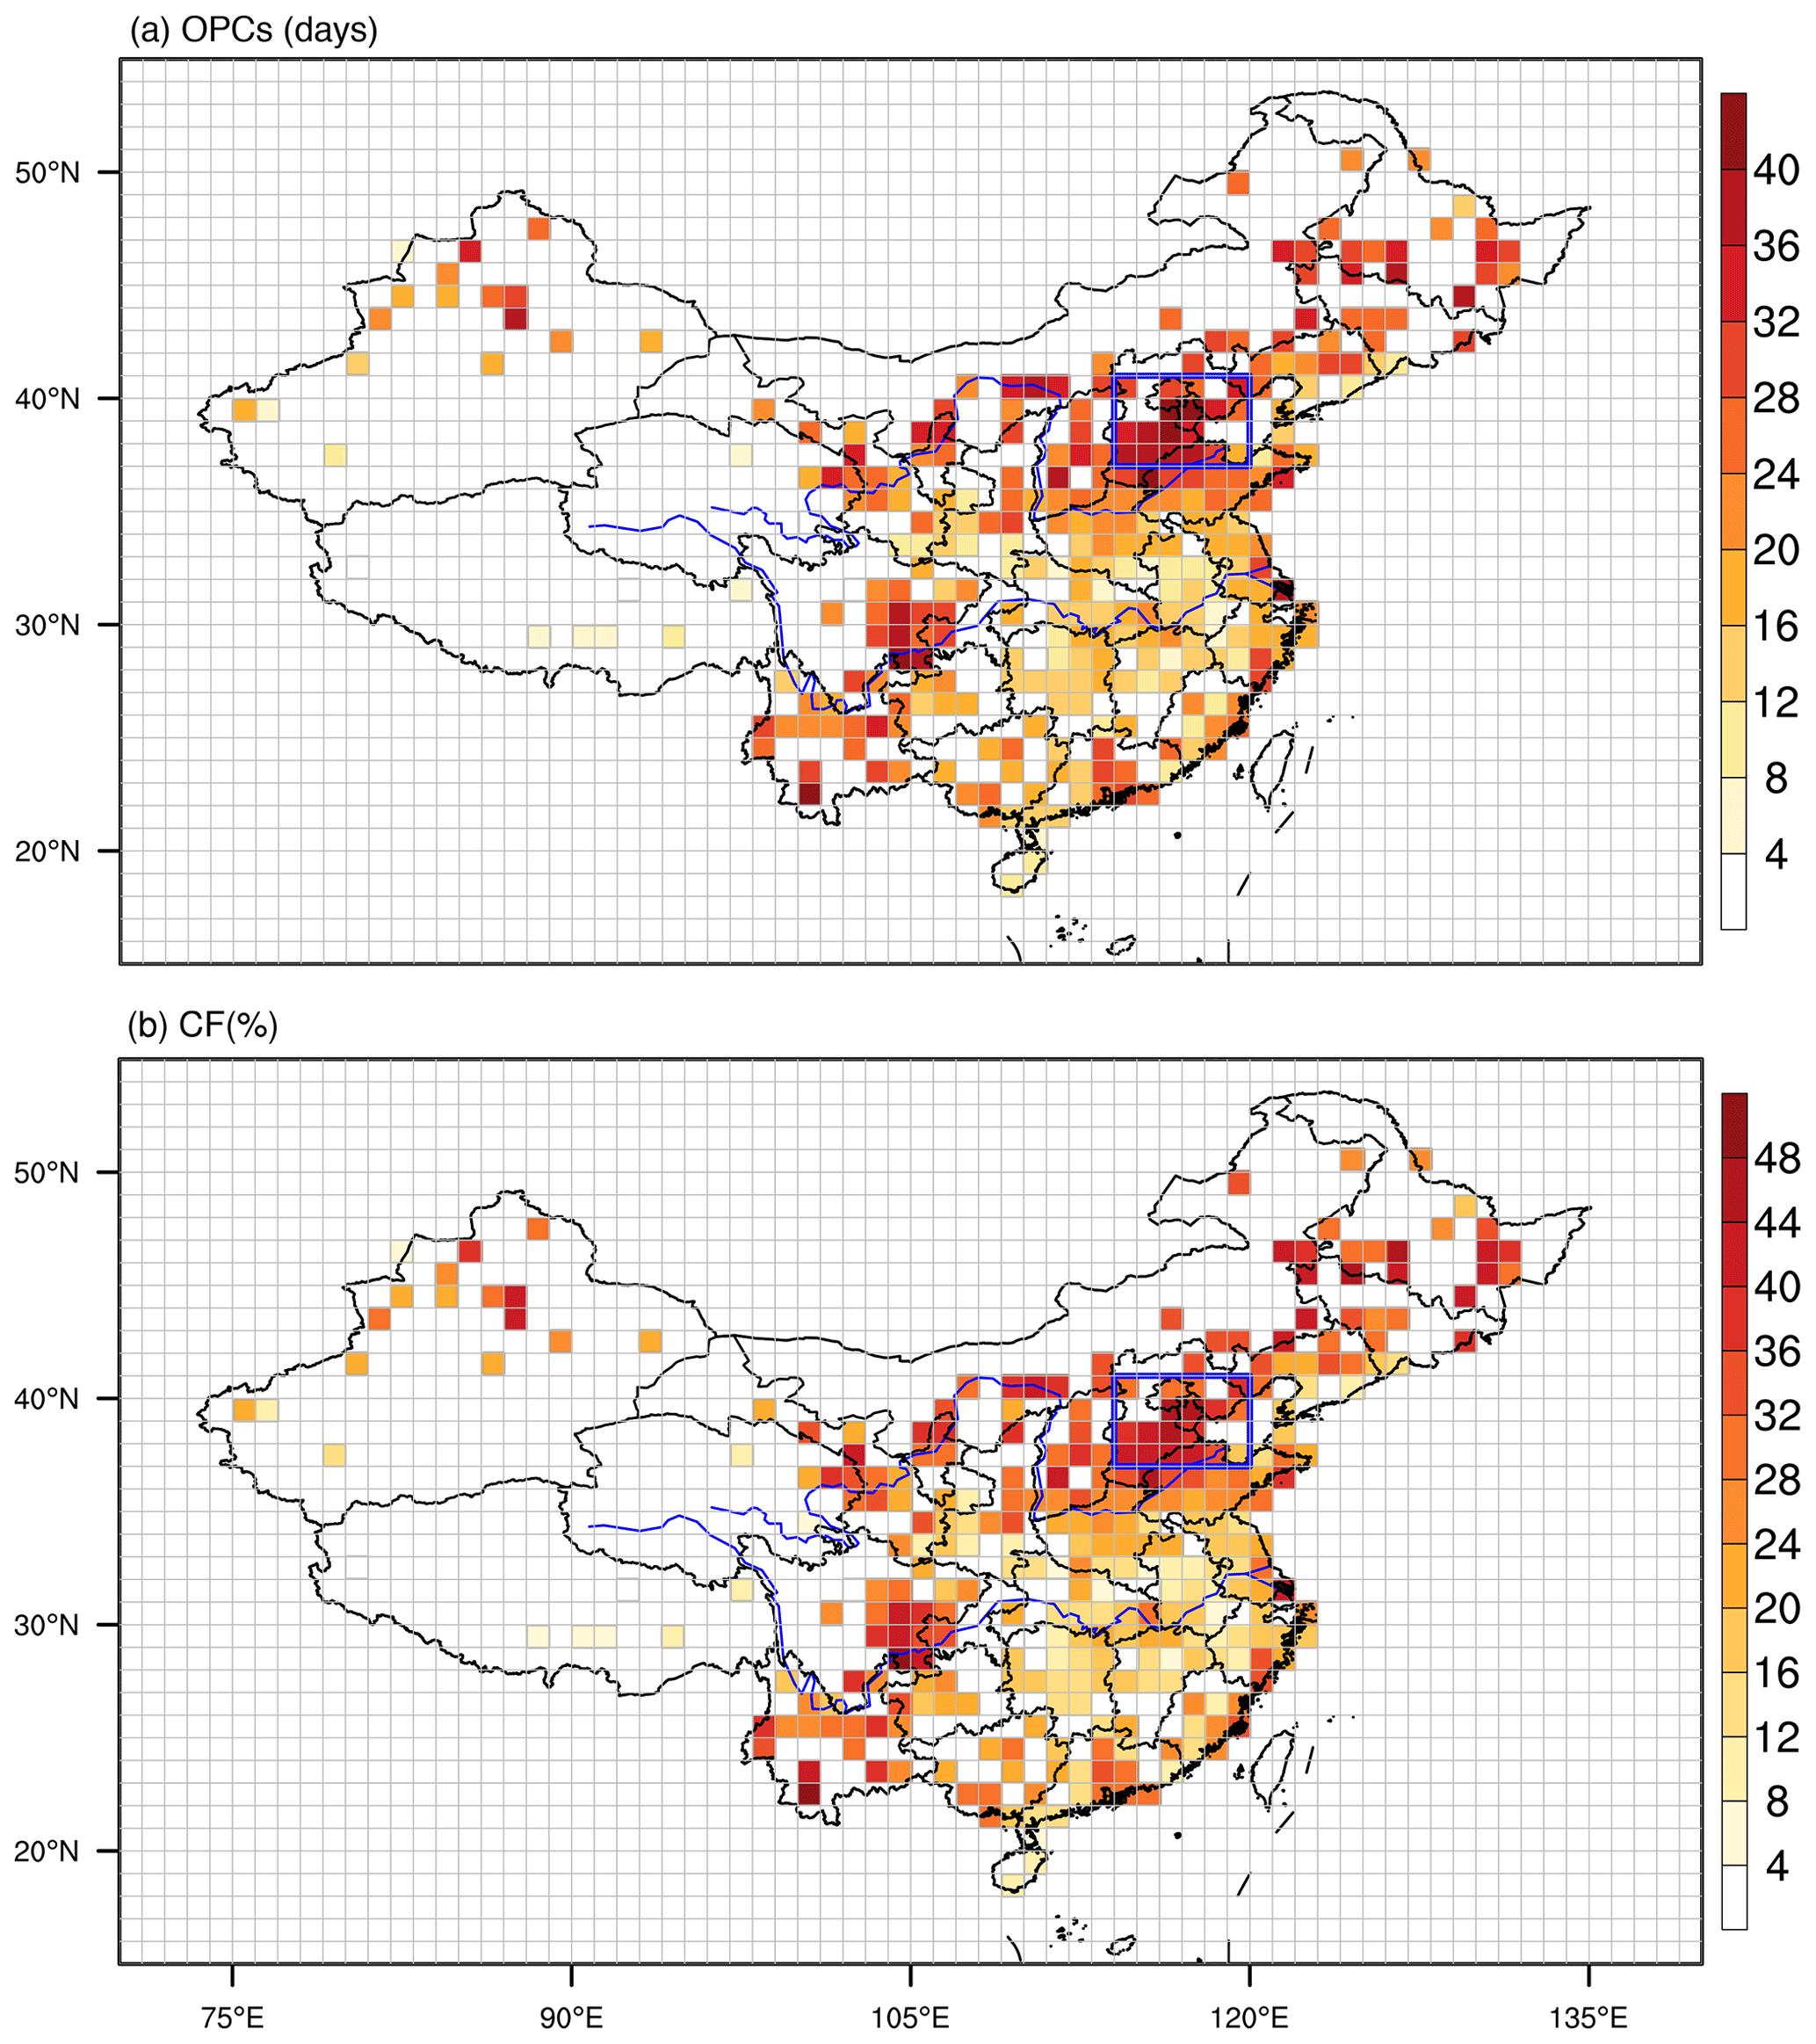
Figure 1Spatial patterns of (a) OPCs (days), frequency of coupled extremes at high temperatures, and surface O3 concentration, and (b) the corresponding CF values (%) and the ratio of OPCs to total O3 pollution days, during May to September of 2014–2019, from observations. The blue box area indicates the NCP region (37–41∘ N; 114–120∘ E).
2.1 Observed O3 concentration and reanalysis data
Hourly O3 concentrations for 2014–2019 were obtained from China National Environmental Monitoring Centre (CNEMC). The network covered 944 sites in 2014 that grew to about 1600 sites in 2019. The daily maximum air temperatures (Tmax) for more than 2000 observation sites during the same period were provided by the National Meteorological Information Centre of the China Meteorological Administration (CMA). The dataset has been quality controlled, homogenized (Li et al., 2004), and widely used in previous works (Wang et al., 2019b). Here in this study, we focus on the extreme high temperatures and surface O3 of warm season during May to September. To unify the spatial resolutions of Tmax and O3 concentration, the two observational datasets are mapped to 1∘ × 1∘ grid boxes, and the values in each box represent the averaged observations within that box. The spatial distributions of averaged daily Tmax and MDA8 O3 over May to September during 2014–2019 are shown in Fig. S1 in the Supplement. We have also tested the grid size of 0.5∘ and found that the different grid resolutions have a negligible influence on the results.
Meteorological conditions during extremes of O3 and high temperatures are calculated using variables derived from the new Japanese 55-year Reanalysis (JRA-55) at 1.25∘ × 1.25∘ resolution (Ebita et al., 2011), including geopotential height (HGT), winds, relative humidity (RH), 2 m air temperature (T2m), surface soil moisture (SM), downward solar radiation flux (DSR), and sensible heat flux (SH) at surface. Following Gong and Liao (2019), daily time series of a meteorological parameter x at a specific model grid cell over the months of May to September in the years 2014–2019 is standardized by
where xi indicates the parameter x on day i, n is the total number of days during May to September for 2014–2019, s indicates the standard deviation of the daily time series and [xi] is the standardized anomaly for parameter x on day i. The standardized meteorological variables enable a direct comparison among their magnitudes during extreme O3 and/or high temperatures.
2.2 GEOS-Chem model
To explore the physical and chemical mechanisms related to the O3 extremes, the 3-D global chemical transport model (GEOS-Chem, version 12.9.3) was utilized to simulate O3 concentrations during May–September for 2014–2017, driven by assimilated meteorological data of version 2 of Modern-Era Retrospective analysis for Research and Applications (MERRA-2; Gelaro et al., 2017). The simulations were performed at a horizontal resolution of 2∘ latitude × 2.5∘ longitude with 47 vertical levels. By examining the simulations of surface O3 over the U.S. with a regional climate model and the global GEOS-Chem model, Fiore et al. (2003) indicated that the ability to resolve local O3 maxima is compromised, but the spatial correlation improves when the model resolution coarsens. The coarse-resolution global model can successfully capture the synoptic-scale processes modulating O3 concentrations, whereas a finer spatial resolution may improve the representation of processes occurring on smaller scales. The anthropogenic emissions of O3 precursor gases, including CO, NOx, and volatile organic compounds (VOCs) in China, were obtained from the MEIC emission inventory (http://meicmodel.org/, last access: 10 April 2020), which included emissions from industry, power, residential, and transportation sectors. Biogenic volatile organic compound (BVOC) emissions also play a vital role in modulating the formation of ozone and secondary organic aerosols (Ma et al., 2021; Gao et al., 2022). For biogenic emissions in GEOS-Chem, the Model of Emissions of Gases and Aerosols from Nature (MEGAN) v2.1 biogenic emissions were applied with updates from Guenther et al. (2012). Lacking anthropogenic emissions for 2018–2019, simulations were conducted for 2014–2017 by GEOS-Chem and we used observations during 2014–2017 to validate the model's results.
2.3 CMIP6 data
We use O3 and Tmax outputs from future projections of Scenario Model Intercomparison Project (ScenarioMIP) in the CMIP6 archive to determine how the coupled extremes will change in a warmer climate. ScenarioMIP is the primary activity within CMIP6 that provides multi-model climate projections driven by different scenarios of future emissions and land use changes (O'Neill et al., 2016), produced based on the shared socioeconomic pathways (SSPs) combining socioeconomic developments and the feedback of global climate changes (Z. Li et al., 2020). More details about the SSP scenarios can be found in O'Neill et al. (2016).
Currently, four SSP scenarios in ScenarioMIP simulations provide hourly O3 concentration and daily Tmax from the present day to the end of the 21st century (2015–2100), i.e., SSP1–2.6, SSP2–4.5, SSP3–7.0, and SSP5–8.5 (combination of low, intermediate, relatively high, and high societal vulnerabilities and forcing levels, respectively). Among the four SSPs, SSP3–7.0 and SSP2–4.5 have the weakest and medium air pollution controls pathways, respectively, while strong air pollution controls are assumed in SSP1–2.6 and SSP5–8.5 (Gidden et al., 2019). Five global climate models (GCMs), i.e., MOHC.UKESM1-0-LL, CESM2-WACCM, GFDL-ESM4, MPI-ESM-1-2-HAM, and EC-Earth3-AerChem from ScenarioMIP under CMIP6 that provide both hourly O3 and daily Tmax, were adopted in this work. The horizontal resolutions and institutions of the five GCMs are listed in Table S1 in the Supplement. Note that the numbers of available models vary across different scenarios (see Table S2 in the supplement for details). The results from the five GCMs are re-gridded to the observation boxes using linear interpolation to facilitate spatial comparison. In this study, 2015–2019 is regarded as the historical period and the overall performance of the CMIP6 simulations in reproducing the occurrences of coupled extremes is evaluated against the observations during 2015–2019. For the projection of coupled extremes, we focused on the two periods of 2046–2050 and 2096–2100 under different SSPs.
2.4 Identification of extremes in O3 and temperature
Following Schnell and Prather (2017), in this study, we use the local-specific thresholds for each grid to identity the extreme cases of surface air temperatures and O3 concentrations, specifically, the 90th percentile of daily Tmax and daily MDA8 O3 from May to September for 2014–2019. The local-specific thresholds have been widely used in recent studies of ozone pollution (e.g., Schnell and Prather, 2017; Lin et al., 2019; Qin et al., 2021). Note that the 90th percentile of MDA8 O3 over NCP, Yangtze River Delta, Sichuan Basin, and Pearl River Delta are 97.7, 84.4, 73.7, and 76.8 ppb, respectively, close to China's grade II air quality standard for MDA8 O3 (around 80 ppb under standard atmospheric conditions).
To characterize the co-occurrences of extremes in high temperatures and surface O3 and investigate the impacts of extreme high temperatures on O3 pollution, the following extremes are defined:
-
Total O3 pollution days (OPs): all days when daily MDA8 O3 is above its threshold.
-
Individual O3 pollution days (OPIs): days when MDA8 O3 is above its threshold while Tmax is lower than its threshold.
-
Coupled extreme days (OPCs): days when both daily Tmax and daily MDA8 O3 exceed their corresponding thresholds.
We use a co-occurrence frequency ratio (CF, in percent) to characterize the dependence of extreme high O3 levels on extreme high temperatures. CF is defined as the ratio of the frequency of OPCs (days) to the frequency of OPs (days). Thus, a higher CF value indicates a higher dependence of O3 pollution on extreme high temperatures:
2.5 Health impact of coupled extremes
Following Lee et al. (2017), in this study, we apply a ratio index to describe the combined human health impacts caused by O3 and temperatures during OPCs, which represents the potential enhancement in mortality rates (MR) related to O3 and temperature levels during OPC compared to those during OPIs. And the MR is defined as below:
where RRozone,i (RRozone,j) and RRtemperature,i (RRtemperature,j) are the relative risks due to O3 concentration and temperature exceedance, respectively, on a coupled extreme day i (an individual O3 pollution day j), m is the total days of coupled extremes, and n is the total days of individual O3 pollution day. MRozone (MRtemperature) is the enhanced mortality rates attributed to O3 concentration (temperature) changes, while MR is the combined effects from both O3 and temperature changes.
Because China has higher air pollution levels and may also differ in terms of age structure, population sensitivity to air pollution/heat exposures, and components of air pollution mixture compared with developed countries (Chen et al., 2018), we use China-specific concentration and temperature response functions in the present study, as indicated in the recent nationwide studies (Yin et al., 2017; Huang et al., 2015). β1 is the concentration response factor corresponding to a 0.24 % [95 % confidence interval: 0.13 %, 0.35 %] increase in daily mortality per 10 µg m−3 increase in MDA8 O3 above C0 (Yin et al., 2017). Following Huang et al. (2015) in calculating RRtemperature in 66 Chinese communities, β2 indicates a 1.09 % [95 % confidence interval: 0.72 % to 1.46 %] excess mortality per 1 ∘C increase in temperature above T0. Note that the algorithms here to calculate MR, MRozone, and MRtemperature do not consider the possible amplification/inhibition effect of combining O3 and air temperature in affecting human health. Previous studies have claimed that O3-related mortality increases with higher temperatures, although several studies have presented contrasting results or inconsistent relationships for different regions (Chen et al., 2014; Jhun et al., 2014; Ren et al., 2008). By analyzing the total mortality rates associated with short-term O3 exposure over East Asia among four seasons, Chen et al. (2014) found that the higher temperatures in summer significantly increased the O3-related mortality rates.
3.1 Spatial and temporal patterns of coupled extremes
The spatial patterns of OPCs and their ratio to the total O3 pollutions days (CF values) during May to September for the recent 6 years (2014–2019) highly resemble each other (Fig. 1), with the highest values located over NCP which has suffered the most severe O3 pollution in recent years (Fig. S1a in the Supplement). The highest OPCs exceed 40 d over NCP and the corresponding CF is more than 56 % (Fig. 1). That means, the coupled extreme days account for more than half of the total O3 pollution days, indicating a strong dependence of O3 pollution on extreme high temperatures over NCP. It has been suggested that the dependence of O3 concentration on high temperature increases with the O3 levels (Lin et al., 2020). However, coupled extremes occur much less frequently over the Yangtze River Delta (YRD; 30–33∘ N; 118–122∘ E) compared with NCP, and the regional averaged CF in YRD is below 20 %, even though the MDA8 O3 level and temperature in YRD are both as high as those in NCP (Fig. S1 in the Supplement). The distinctive relationships between extreme high temperature and O3 concentration over NCP and YRD are driven by their different climatology during warm season. Southern China receives substantial monsoon rainfall during summer, accompanied by increased relative humidity and reduced radiation (Zhou and Yu, 2005), which can suppress surface O3 levels (Han et al., 2020). Delineating the local daily maximum air temperatures (Tmax) and RH of all O3 pollution days over NCP and YRD (Fig. S2 in the Supplement), OPCs occur more frequently over NCP than over YRD, and a higher fraction of the O3 pollution days over NCP co-occur with extreme high temperatures and low-to-moderate RH (Fig. S2a in the Supplement). Humid environment dampens the occurrence of O3 pollution over YRD and extreme O3 pollution mostly occurs on days with relatively low RH when air temperatures are moderate (Fig. S2b), which explains the lower OPCs and CF in YRD compared with NCP. Therefore, we focus on the coupled extremes over NCP.
Daily variations of the occurrence of OPIs and OPCs over NCP during 2014–2019 are shown in Fig. 2. O3 pollution days have appeared since 2015, but coupled extremes OPCs have only been observed since 2017, mostly during May to July (Fig. 2a). The abrupt increase in the occurrence of coupled extremes in 2017 is consistent with the significant increasing trends of both MDA8 O3 and Tmax (95 % confidence level) over NCP in recent years (Fig. 2b). The strong increasing trends of MDA8 O3 and air temperatures are consistent with previous results (K. Li et al., 2019, 2020). As addressed previously (K. Li et al., 2020), the temperature trends during 2014–2019 reflect interannual climate variability rather than a long-term warming trend. Notably, daily MDA8 O3 exhibits increasing sensitivity to Tmax from 2014 to 2019 (Fig. 2c), supporting the increase in OPCs during the same time period. Note that the linear regression slopes between daily MDA8 O3 and Tmax are not strictly monotonically increasing. For example, the slopes are 3.96, 3.43, and 4.56 ppb ∘C in 2017, 2018, and 2019 (Fig. 2c). In fact, the yearly occurrences of OPCs are 15, 13, and 18 d in 2017, 2018, 2019, consistent with the ozone and temperature relationship. Thus, what we emphasize here is the overall increasing OPCs during 2014–2019 with an abrupt increase in OPCs since 2017. The contrasting MDA8 O3 and Tmax associated with OPCs and OPIs over NCP are evident in Fig. 3. Both O3 levels and air temperatures are higher during OPCs than during OPIs over the NCP region (Fig. 3a, b), with the regional mean anomalies of Tmax and MDA8 O3 during OPCs reaching 3.36∘ and 5.49 ppb, respectively, compared with those during OPIs. A north–south contrast in the MDA8 O3 and Tmax difference between OPCs and OPIs is evident (Fig. 3b), suggesting that contrasting environments north and south of the Yangtze River during the summer monsoon may play a key role in the dependence of O3 pollution on extreme Tmax in China.
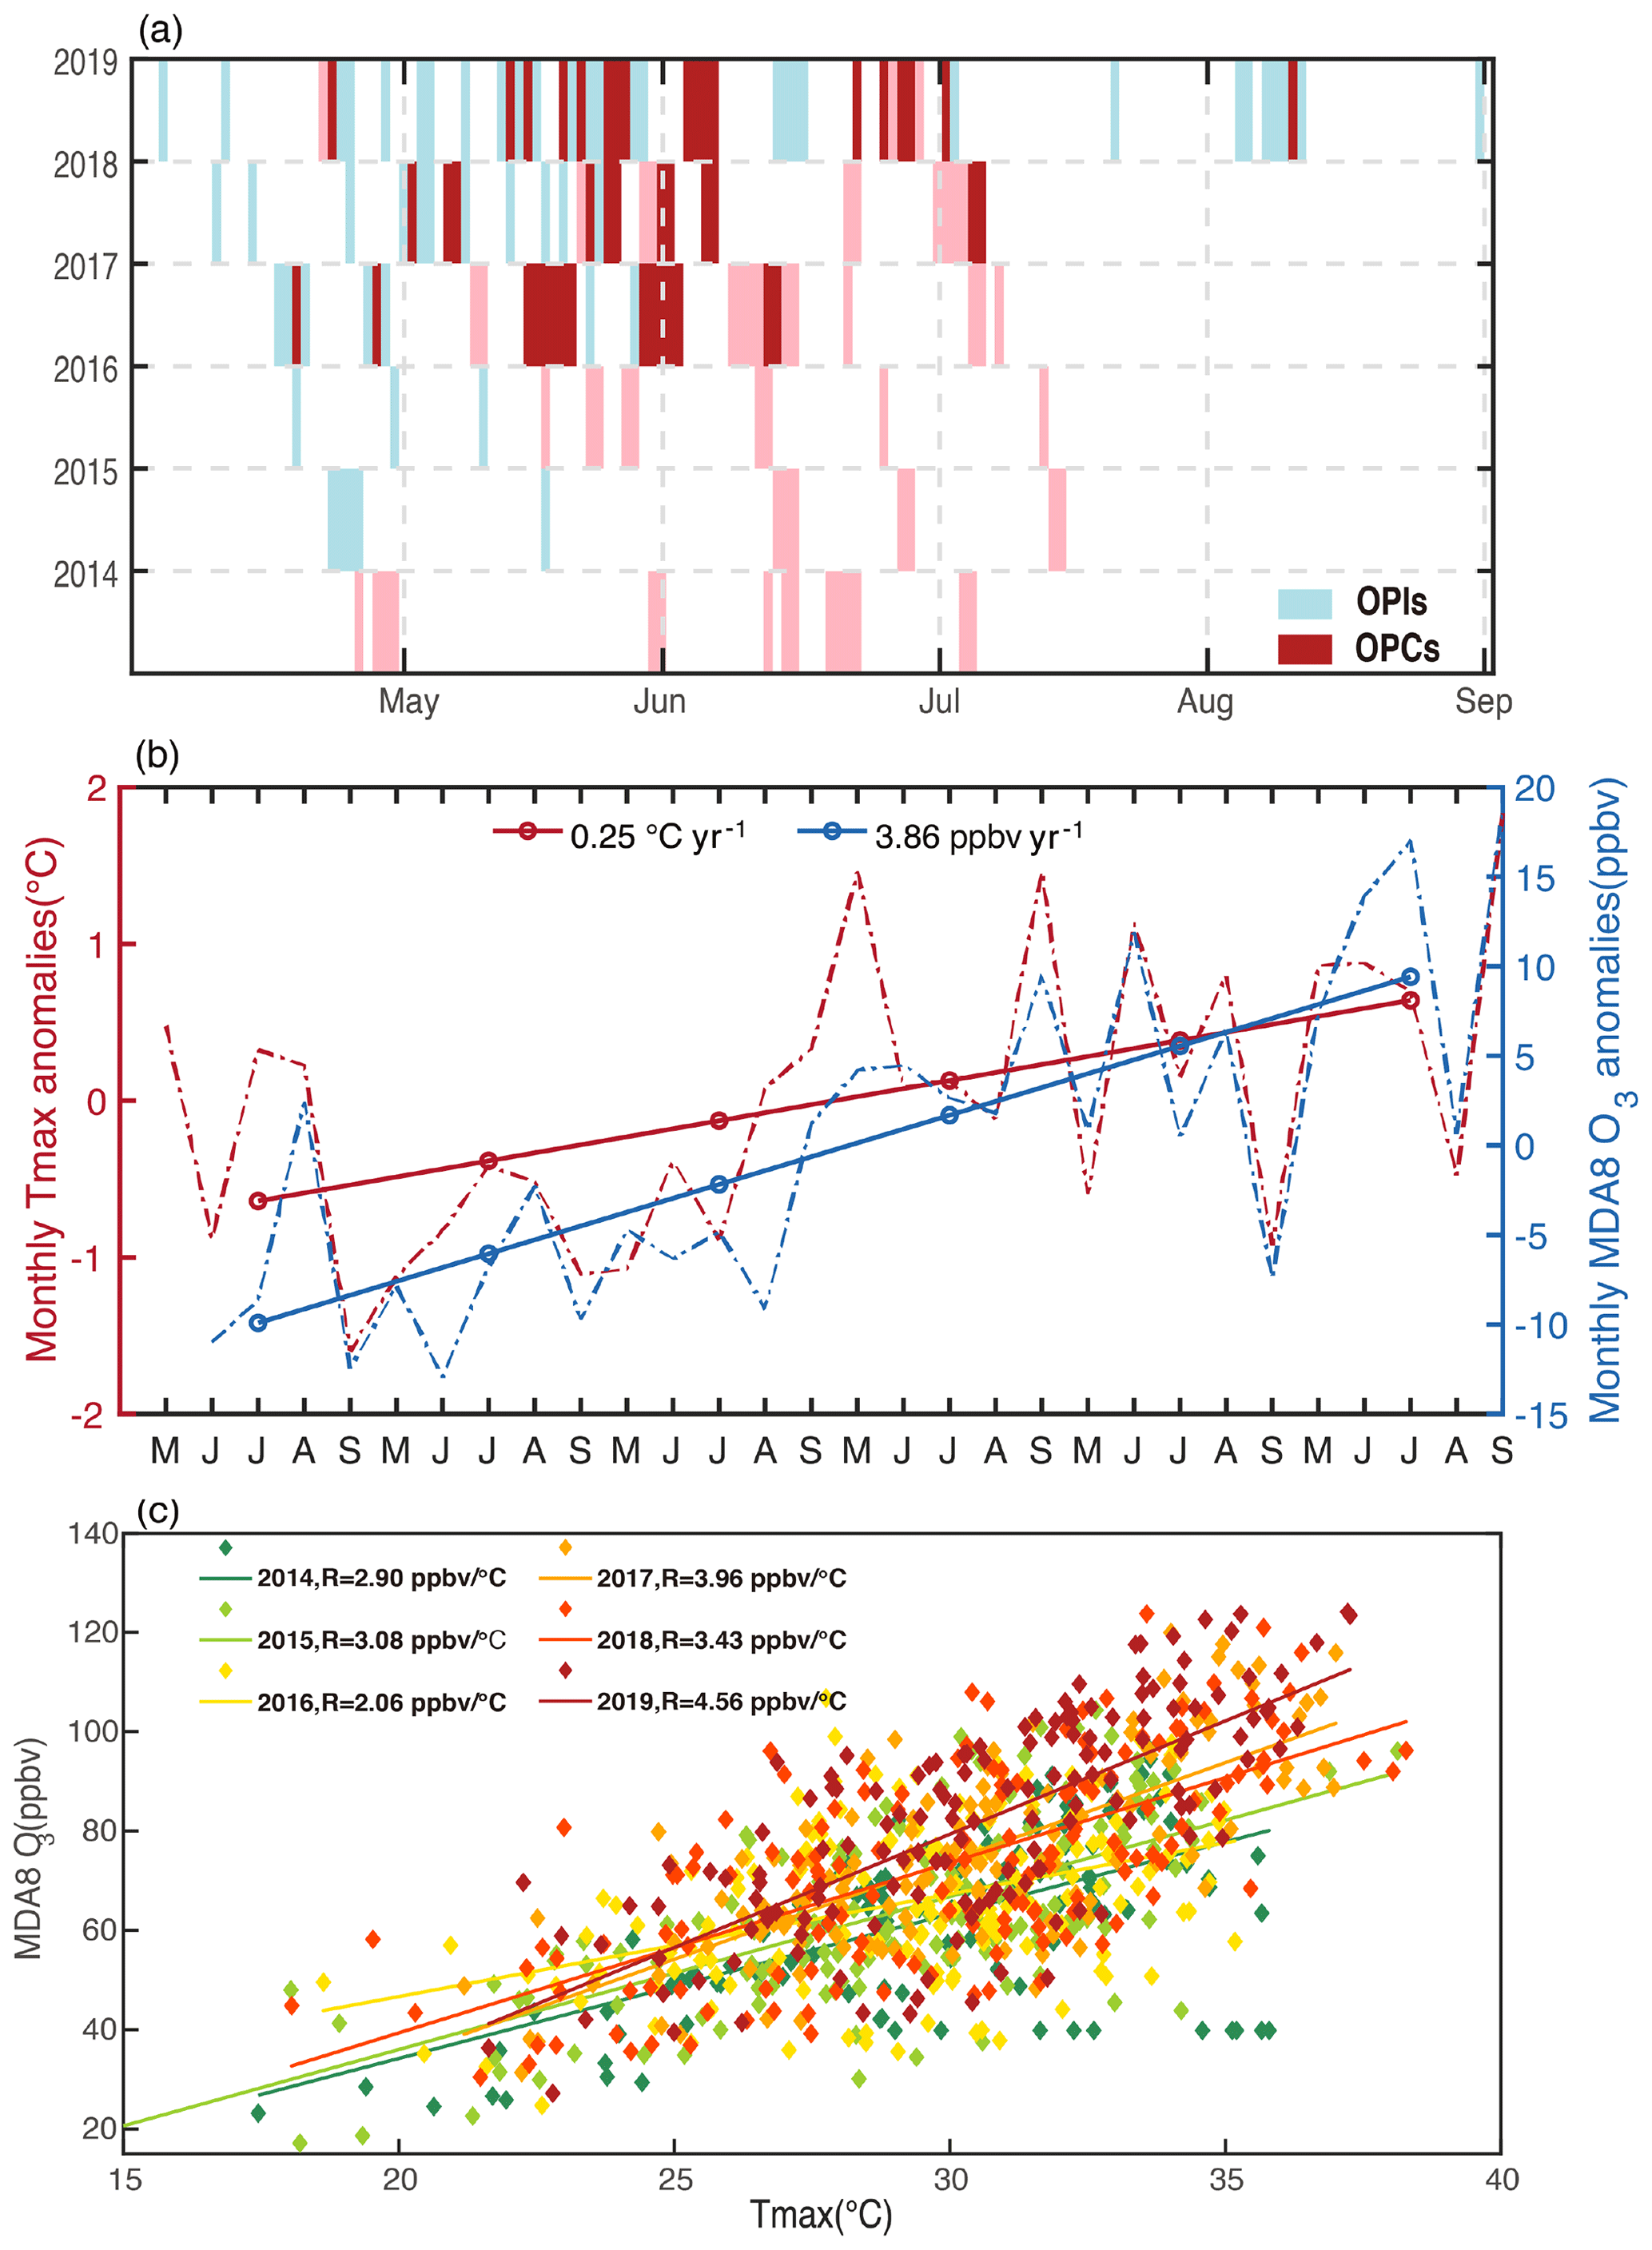
Figure 2(a) Observed daily variations of the occurrence of OPIs (blue) and OPCs (red) in NCP during 2014–2019. The pink boxes indicate hot days when daily Tmax exceeds its threshold while MDA8 O3 does not exceed its threshold. (b) Monthly mean MDA8 O3 (dashed blue line) and Tmax (dashed magenta line) anomalies during May to September of 2014–2019 for the NCP region. For each month, anomalies are computed relative to the 2014–2019 means for that month of the year. The linear trends of the 5-month averaged MDA8 O3 and Tmax anomalies for each year is shown by the solid lines, with the regression slopes shown near the top of the panel. (c) Scatterplot of daily MDA8 O3 versus Tmax over NCP for May to September of each year identified by the color in 2014–2019. Linear regression lines and the slope (R) values (unit: ppb per degree) are shown for each year, indicating a general trend of increasing R from 2014 to 2019.
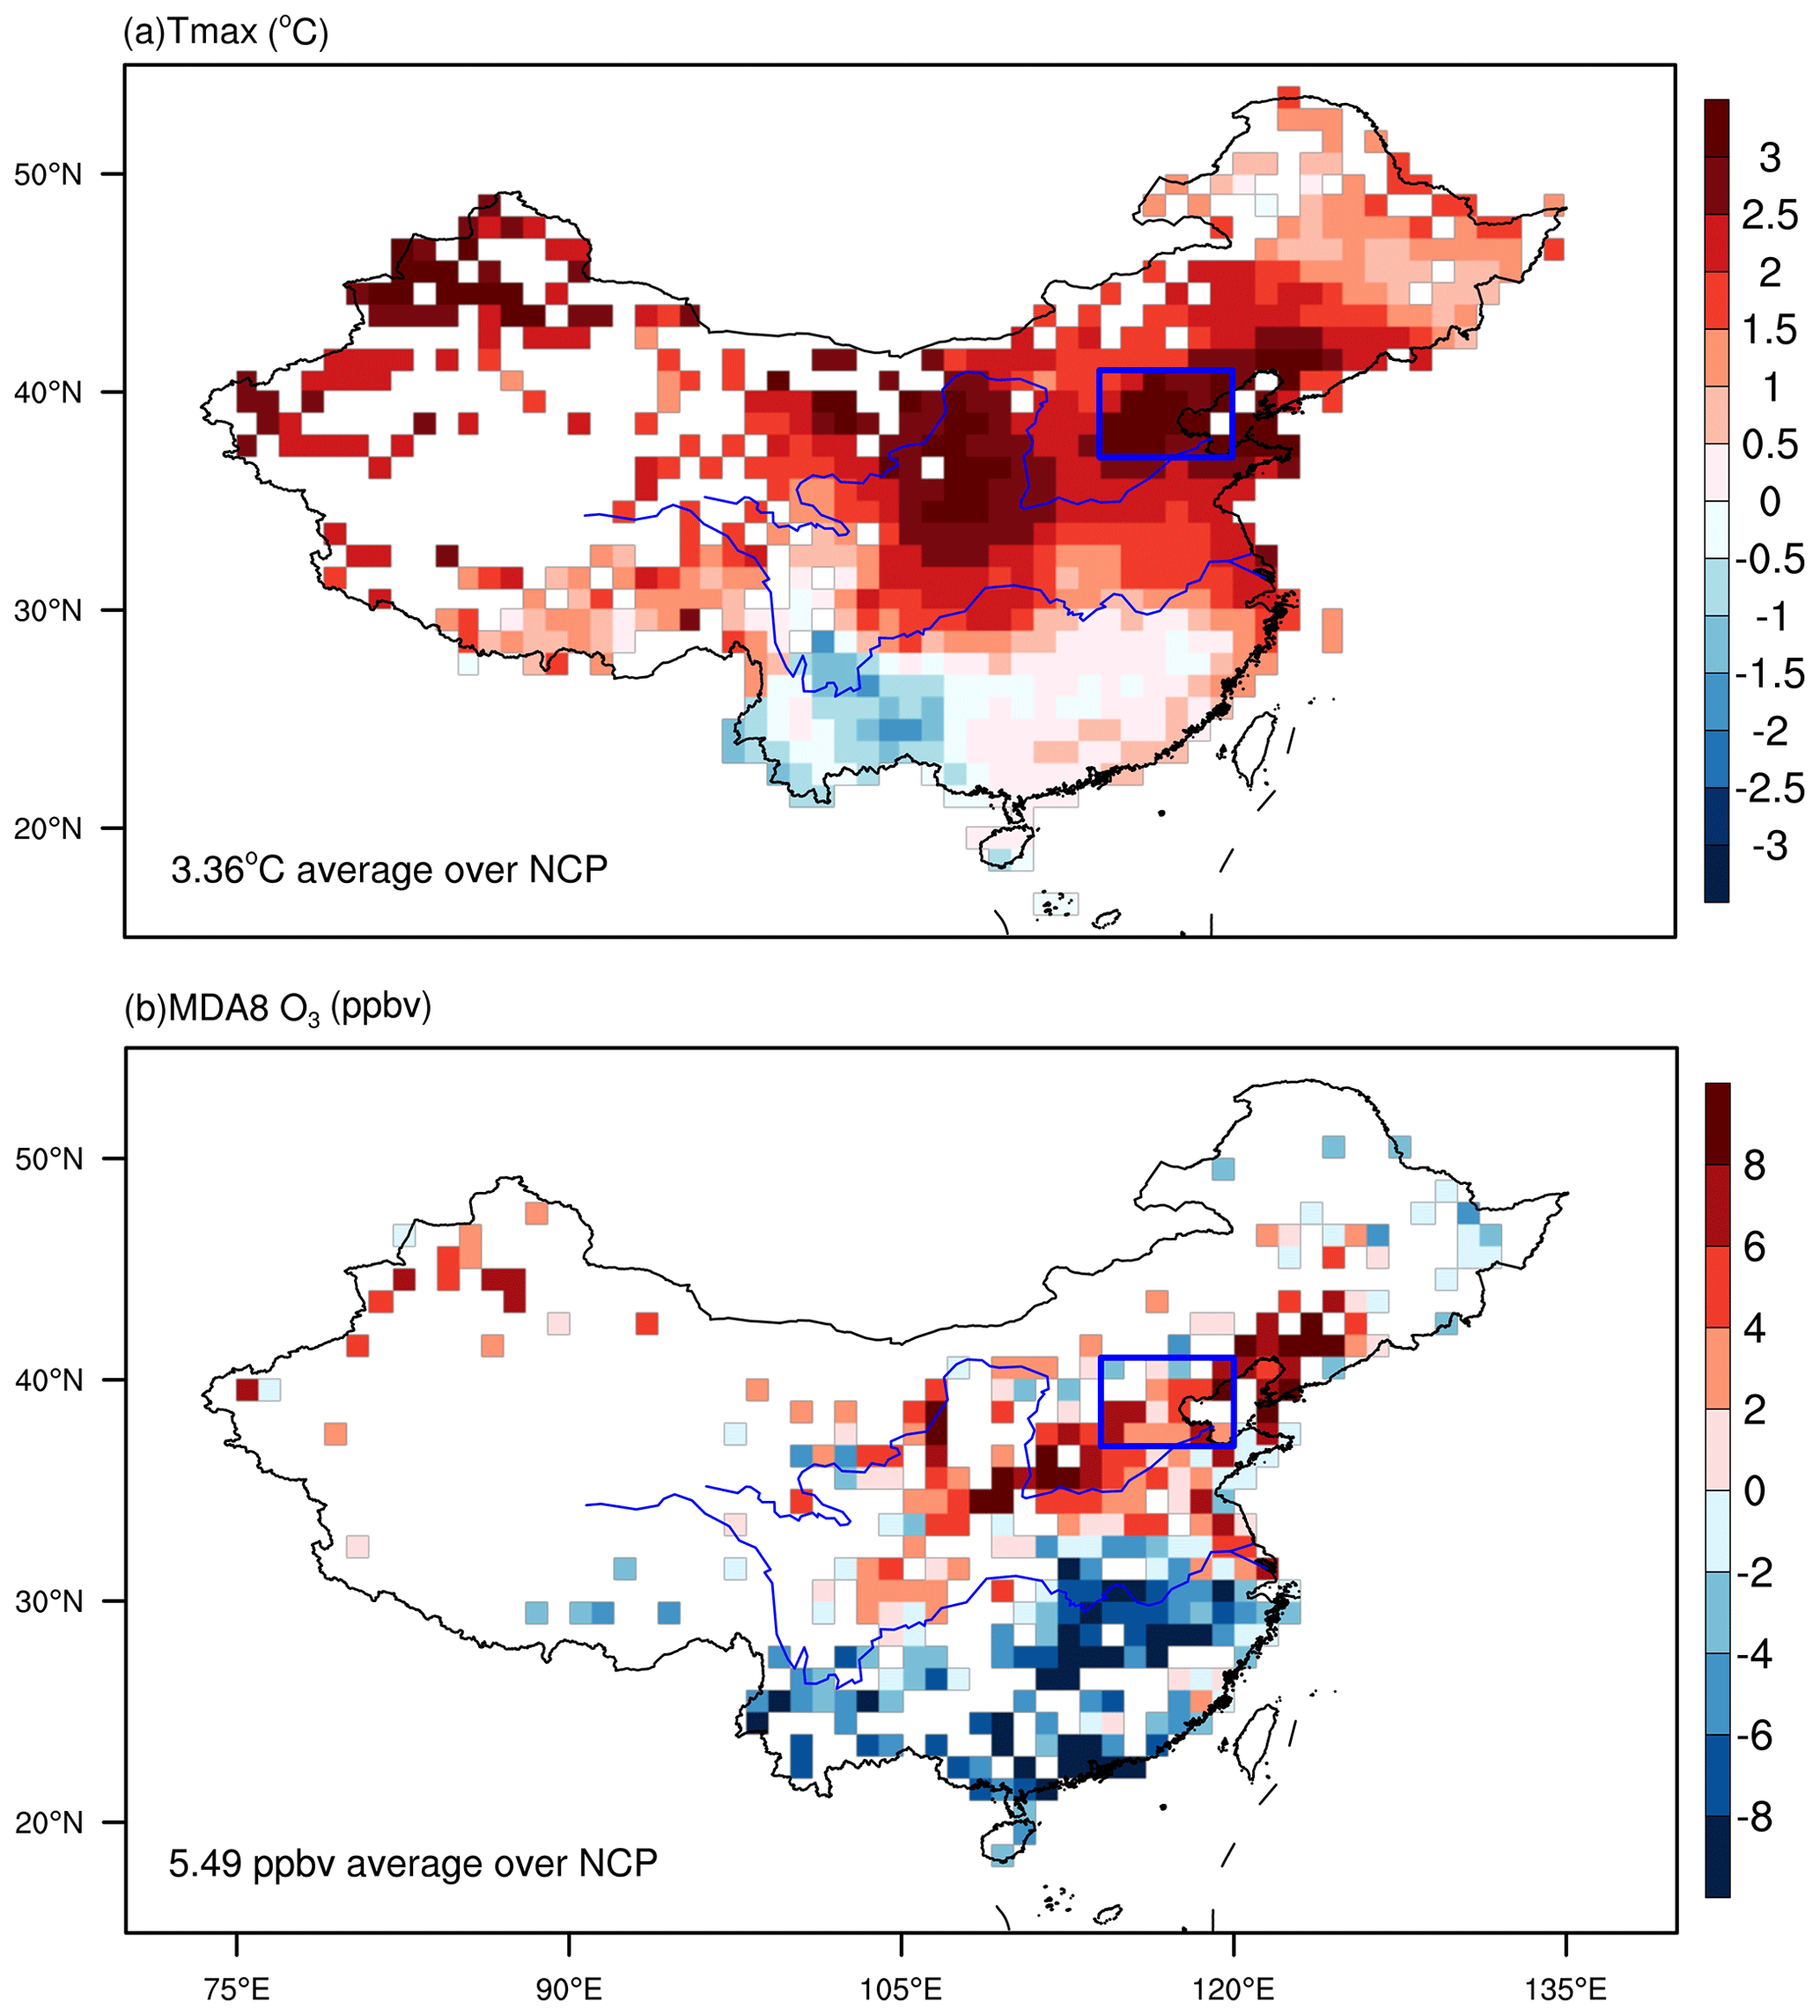
Figure 3Spatial patterns of the averaged difference in (a) Tmax and (b) MDA8 O3 between OPCs and OPIs (OPCs minus OPIs). The blue box in each panel indicates the NCP region (37–41∘ N; 114–120∘ E).
3.2 Weather patterns and ozone processes during coupled extremes
Figure 4 shows the composites of normalized anomalies (see Sect. 2) of meteorological fields during coupled extreme days over NCP for 2014–2019. During OPCs, anomalous high pressure and anticyclonic circulation dominate NCP and the surrounding region north of the Yangtze River in the mid-troposphere (500 hPa), with anomalous easterlies prevailing over NCP (Fig. 4a). Associated with the anomalous high-pressure system is clear sky with enhanced downward solar radiation (DSR) at the surface (Fig. 4c), leading to hotter near surface temperature (Fig. 4b), reduced RH and soil moisture (Fig. 4d, e), and enhanced surface sensible heat flux (Fig. 4f) that further intensifies the temperatures (Fig. 4b). These anomalous conditions are all stronger during OPCs than OPIs over NCP (Fig. S3 in the Supplement) and more conducive to O3 pollution (Lu et al., 2019b). Among the meteorological factors, the intensification in surface temperatures is the strongest among different meteorological variables with the highest magnitudes (Fig. S3b in the Supplement), supporting that air temperature is the most influential meteorological variable of surface O3 over NCP (K. Li et al., 2019).
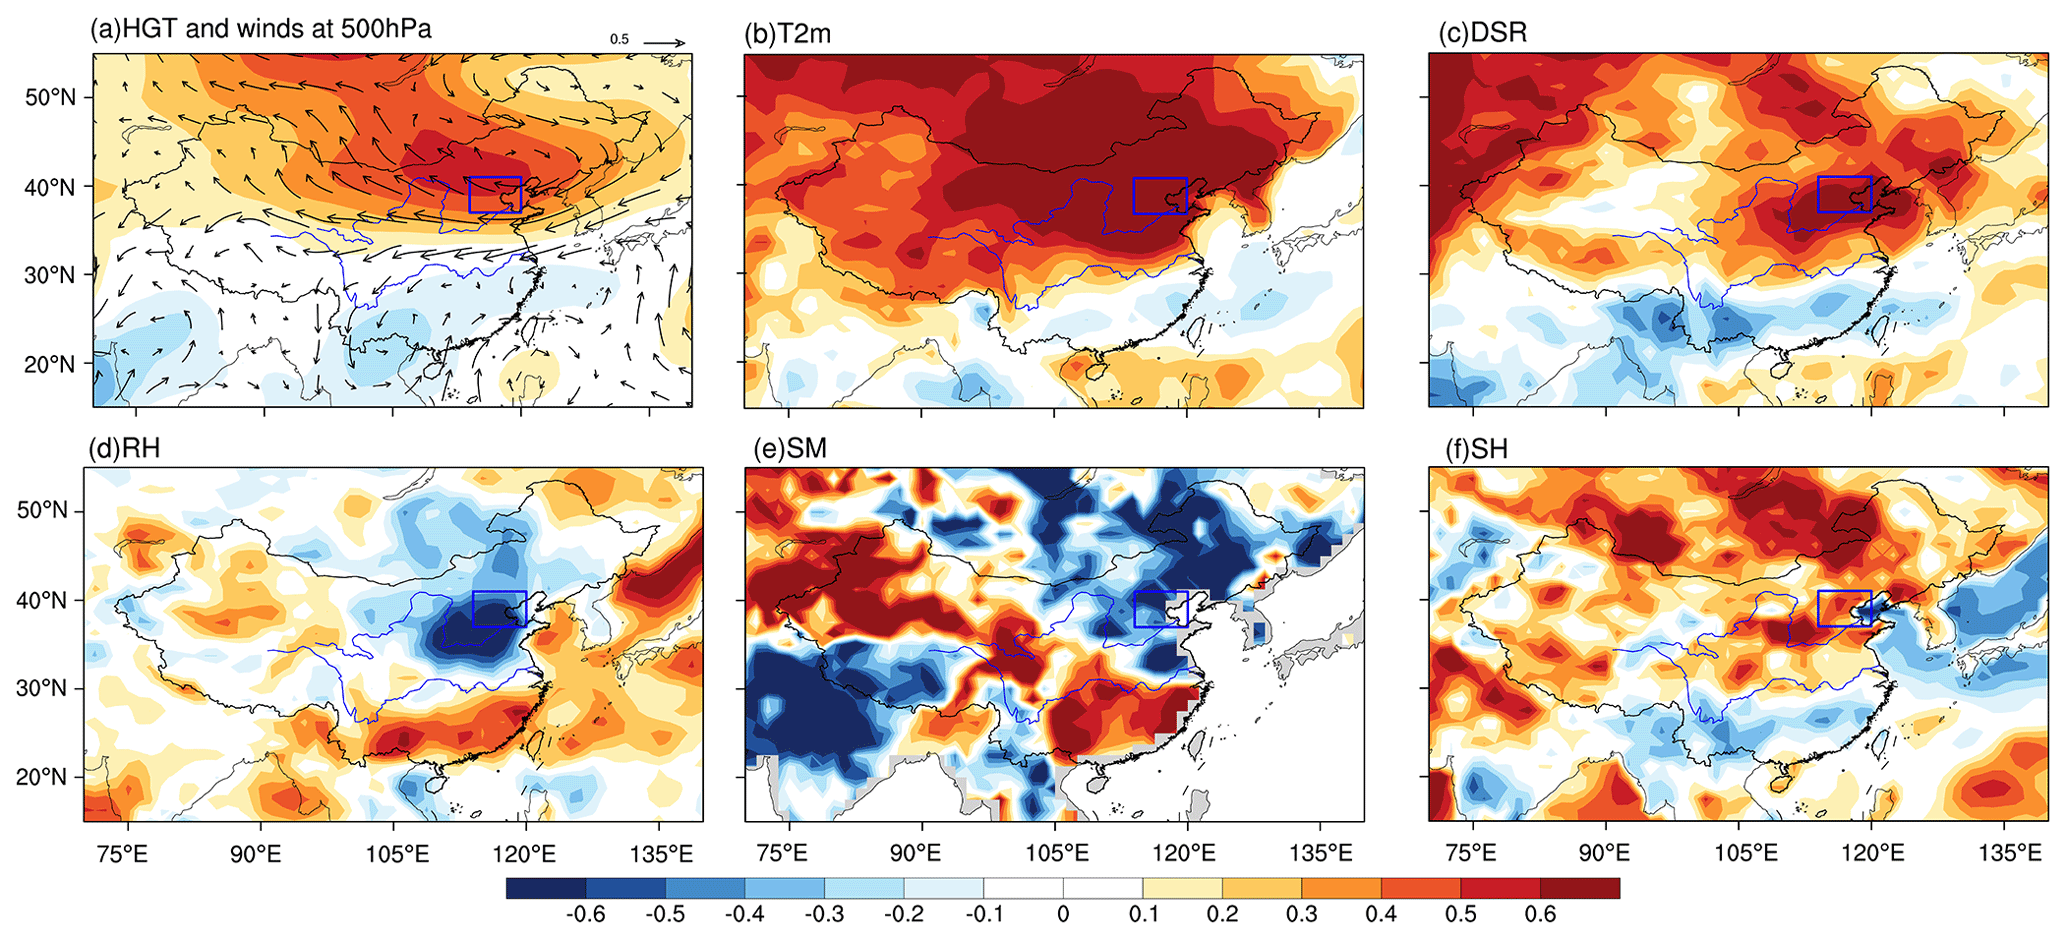
Figure 4Composites of normalized anomalous (a) geopotential height (HGT) and winds at 500 hPa, (b) 2 m air temperature (T2m), (c) downward solar radiation flux (DSR), (d) relative humidity (RH), (e) soil moisture content (SM), and (f) sensible heat flux (SH) at the surface during coupled extremes (OPCs). The blue box in each panel indicates the NCP region.
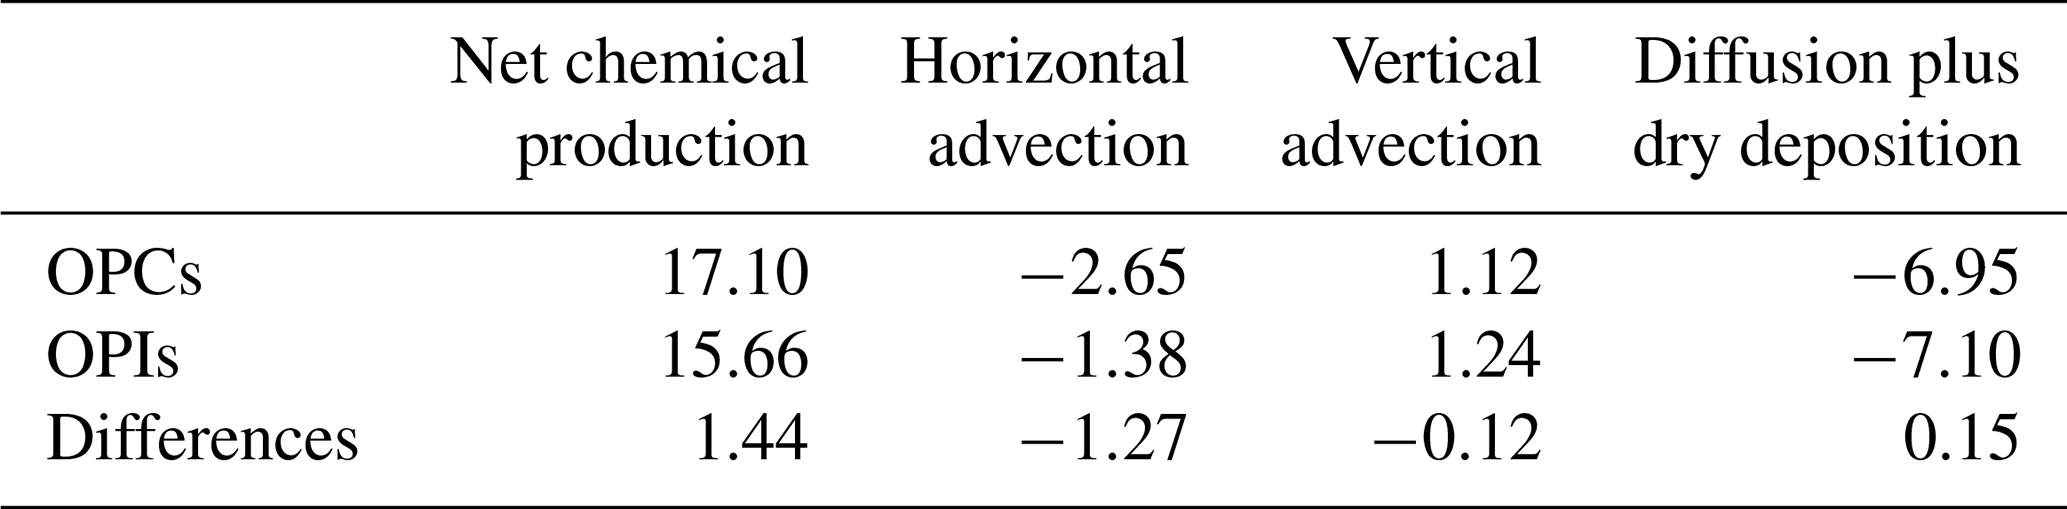
The impacts of weather patterns on surface O3 level can be understood via changes in physical and chemical processes, both sensitive to meteorology (Chen et al., 2020). The contributions of different chemical and physical processes to OPCs over NCP under the anomalous weather pattern of Fig. 4 are quantified by GEOS-Chem simulations of O3 during May to September of 2014–2017. GEOS-Chem can reasonably capture the spatial pattern and magnitude of OPCs in observations during 2014–2017 (Text S1 and Fig. S4 in the Supplement). Four processes affecting O3 levels are considered, including net chemical production, horizontal advection, vertical advection, and mixing (diffusion plus dry deposition), and are listed in Table 1. For both OPIs and OPCs, chemical production contributes the most to O3 mass within the boundary layer. Compared with OPIs, the higher O3 levels during OPCs (Fig. 3b) are contributed by stronger chemical production and weakened mixing, but vertical advection and horizontal advection tend to reduce the O3 concentrations, with enhanced chemical production playing the dominant role. Therefore, we conclude that the hotter near surface temperature induced by anomalous weather patterns and amplified by land-atmosphere feedbacks during OPCs (Fig. 4) is the primary cause of the enhanced formation of O3 and eventually a higher surface O3 level than during OPIs. Besides meteorological effects, the O3 precursor emissions should partially contribute to the spatiotemporal variations of OPCs over China. It is reported that surface O3 pollution levels are strongly correlated with daytime surface temperatures, especially in highly polluted regions, with strong precursor emissions (Porter and Heald, 2019). NCP has the highest anthropogenic emissions compared with the other regions in China, which should benefit the higher correlations between surface O3 and air temperatures, and thus the higher OPCs therein. Moreover, the increasing trend of OPCs over NCP in recent years may be associated with the continued anthropogenic increases in O3, as well as the unmitigated emissions of VOCs (K. Li et al., 2020), emphasizing the need for controlling anthropogenic emissions of VOCs. In addition, Fu et al. (2015) have indicated that the enhanced biogenic emissions and the accelerated photochemical reaction rates both act to increase surface ozone over the USA during 1988–2011. Thus, the increasing trend of biogenic emissions due to vegetation biomass variability over China (Cao et al., 2022) may also have potential impacts on the variations of OPCs.
Table 1Simulated net changes in O3 mass (Gg O3 d−1) in the boundary layer due to different processes in North China Plain (37–41∘ N; 114–120∘ E) during OPCs and OPIs of 2014–2017, as well as their differences (OPCs–OPIs).
3.3 Health impacts of coupled extremes
As both surface O3 and air temperatures are amplified during coupled relative to individual O3 pollution days (Fig. 3), we investigated the potential influences of OPCs on human health. The enhanced mortality rates for OPCs compared with OPIs during May to September for each year of 2017–2019 are illustrated in Fig. 5 and attributed to air temperature and/or O3 concentration changes (MRtemperature, MRozone, and MR; see Sect. 2). It should be noted that coupled extreme days are only observed since 2017. MR, MRozone, and MRTemperature are above 1.0 for all 3 years, indicating a harsher environment for people to survive during OPCs. Importantly, MRtemperature is significantly higher than MRozone for all years of 2017–2019, suggesting that extreme high temperature caused many more mortalities than extreme O3 concentrations over NCP. The averaged MRozone, MRTemperature, and MR for 2017–2019 are 1.003, 1.037, and 1.040, respectively. Compared with the individual O3 pollution days OPIs, the daily mortality rate in NCP increases by 4.0 % during coupled extremes OPCs, the majority of which are attributed to the temperature increase, with less than one-tenth contributed by the O3 concentration increase. That is, coupled extremes amplify health impacts compared with individual O3 pollution days primarily because of the higher mortality risk associated with elevated air temperatures. Moreover, we estimate that around 100 daily excess deaths over NCP are attributable to the higher temperatures and O3 level during OPCs than OPIs (See Text S3 in the Supplement).
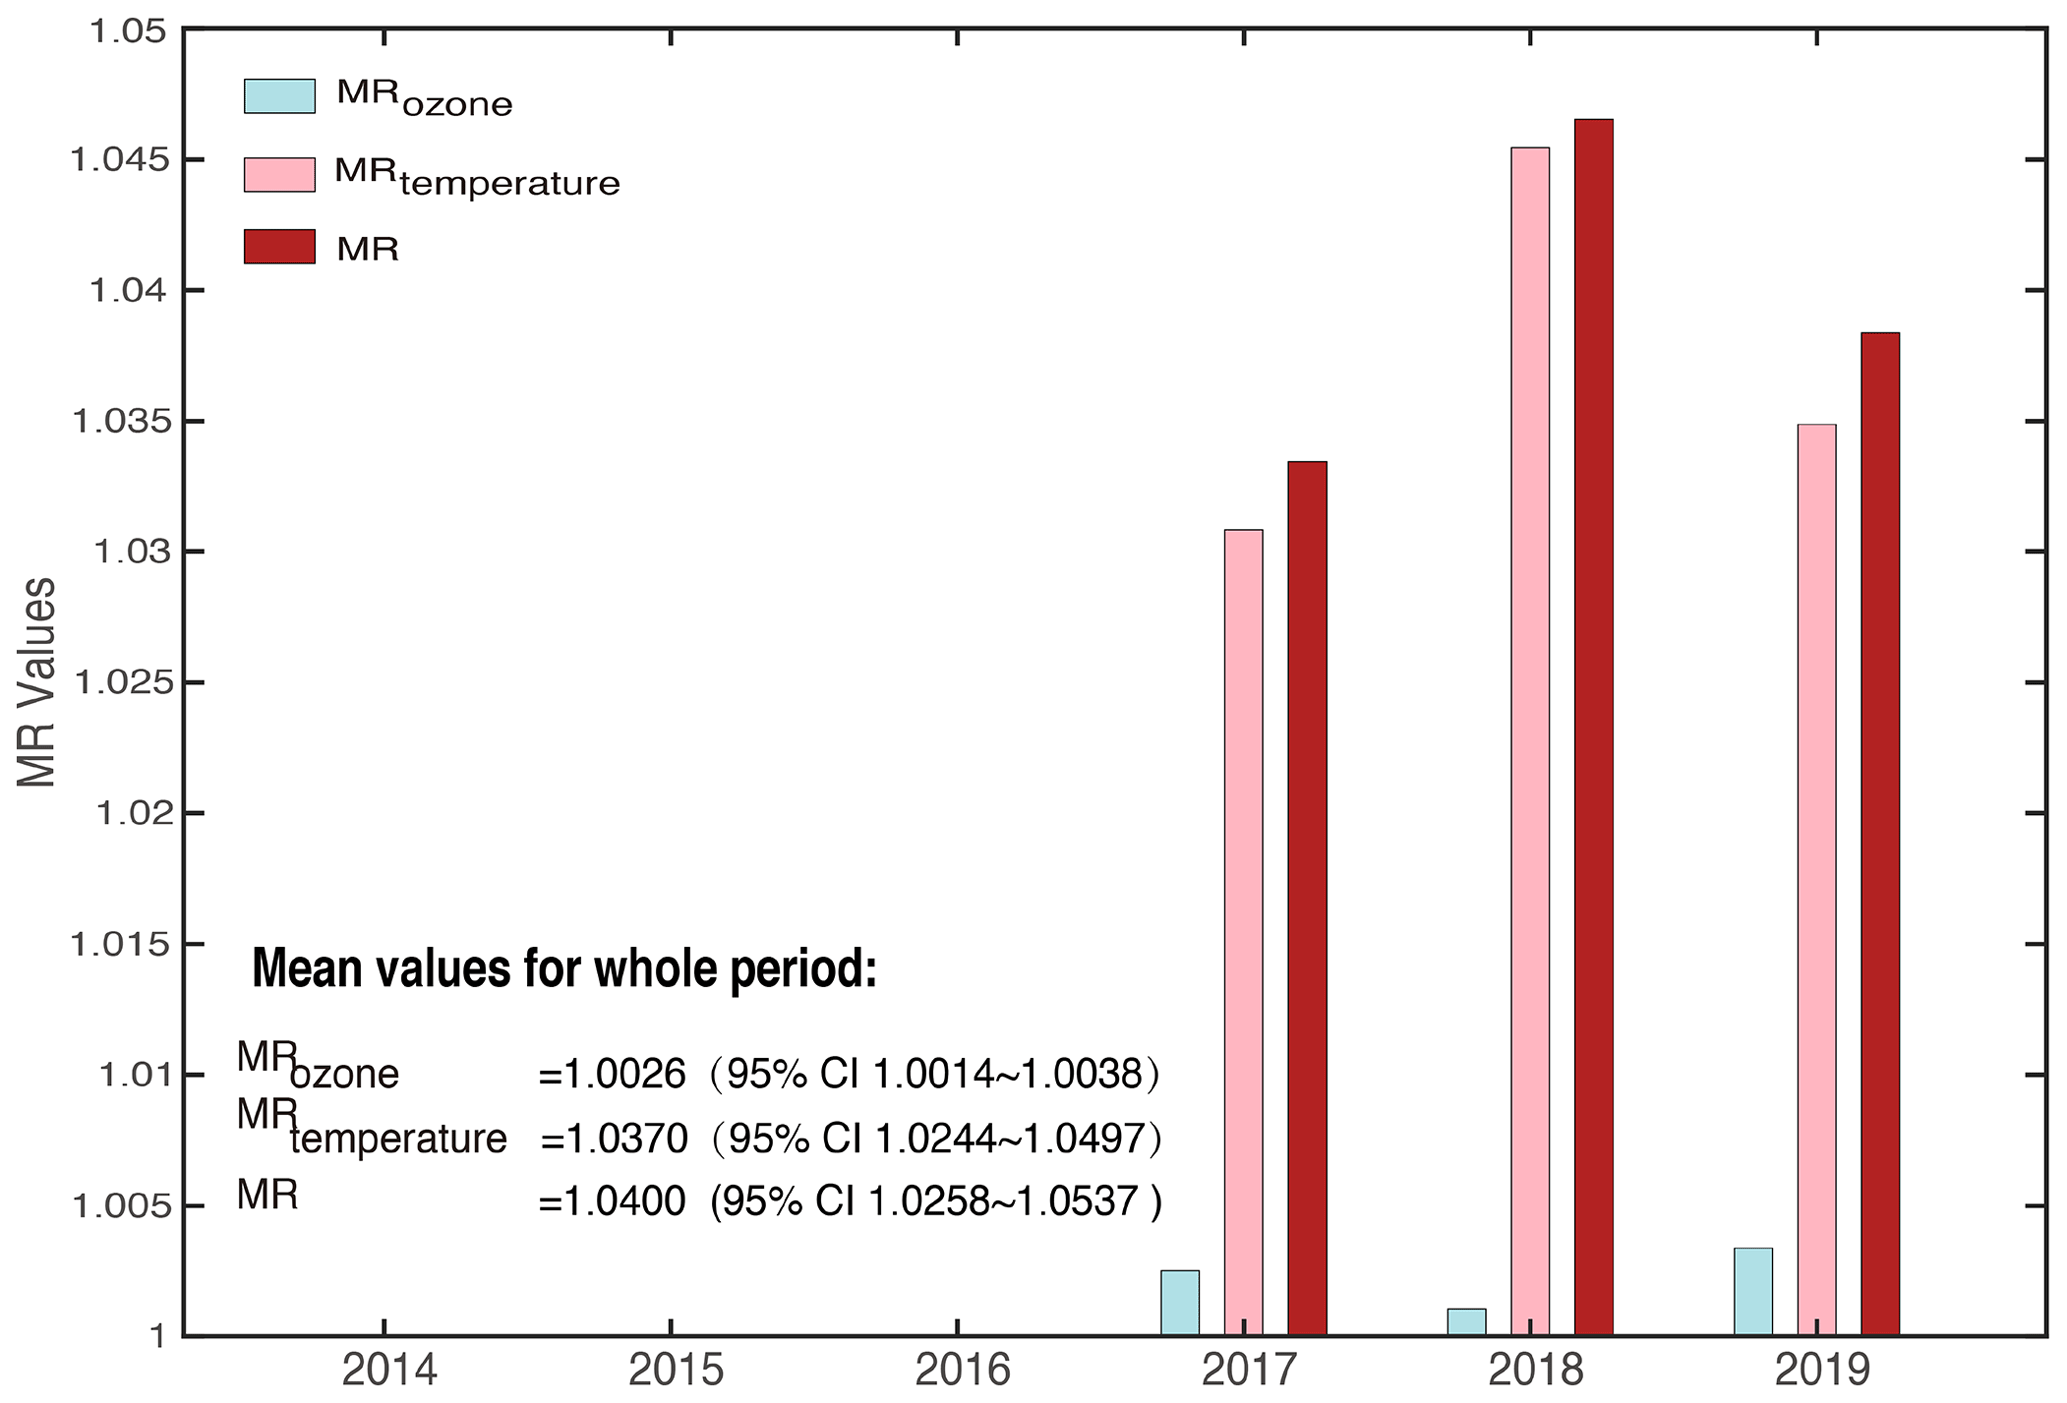
Figure 5MRozone, MRtemperature, and MR between OPCs and OPCs during May to September for each year of 2017–2019. The average values for 2017–2019 are given in the left corner. MRozone, MRtemperature, and MR indicate the mortality changes between OPCs and OPIs due to differences in O3 levels alone, air temperatures alone, and both O3 levels and temperatures, respectively.
3.4 Projected coupled extremes in future climate
As O3 precursors (i.e., NOx and NMVOCs) are expected to keep declining due to the continued emission controls in China while extreme high temperatures will become more frequent and intense under global warming, uncertainties exist in the projection of the co-occurrences of extremes in high temperatures and O3 pollution. Here, we investigate the projections of OPCs and CF values based on CMIP6 simulations under SSP1–2.6, SSP2–4.5, SSP3–7.0, and SSP5–8.5. OPCs in the simulations are identified in the same way as for the observations (see Text S2 and Fig. S5 in the Supplement for details). We focus on the historical period of 2015–2019 (referred to as 2019) and the projected periods of 2046–2050 (referred to as 2050) and 2096–2100 (referred to as 2100). Note that OPCs during the projected periods are identified based on the historical thresholds for extreme O3 level and high temperatures, and the analyses are based on the multi-model ensemble mean of projected OPCs for different scenarios. The multi-model ensemble means can reasonably capture the observed spatial pattern of coupled extremes and their magnitudes over NCP during 2015–2019 (Fig. S5 in the Supplement).
The averaged OPCs over NCP under each SSP increase from the historical period to the mid-century (Fig. 6a), with a maximum increase under SSP5–8.5 (spatial distribution shown in Fig. S6 in the Supplement). From mid-century to the end of the century, OPCs decrease under SSP1–2.6, SSP2–4.5, and SSP5–8.5, but OPCs by 2100 obviously surpass those in 2050 under SSP3–7.0, with an average increase from 46 to 196 d (spatial patterns in Fig. S6e, f in the Supplement). Due to the weak air pollution control under SSP3–7.0 (Turnock et al., 2020), MDA8 O3 in 2100 under this scenario is highest among the four SSPs (Fig. 7). In contrast, OPCs are substantially reduced to below 5 d by 2100 under SSP1–2.6 and SSP2–4.5, highlighting the benefit of strong actions in mitigating climate and reducing air pollutant emissions. In the future by 2050 and 2100, NCP will still be the most vulnerable region in China to the coupled extreme (Fig. S6 in the Supplement), while most other areas will be much less threatened by the coupled extremes by the end of the century under SSP1–2.6, SSP2–4.5, and SSP5–8.5 (Fig. S6b, d, and h in the Supplement).
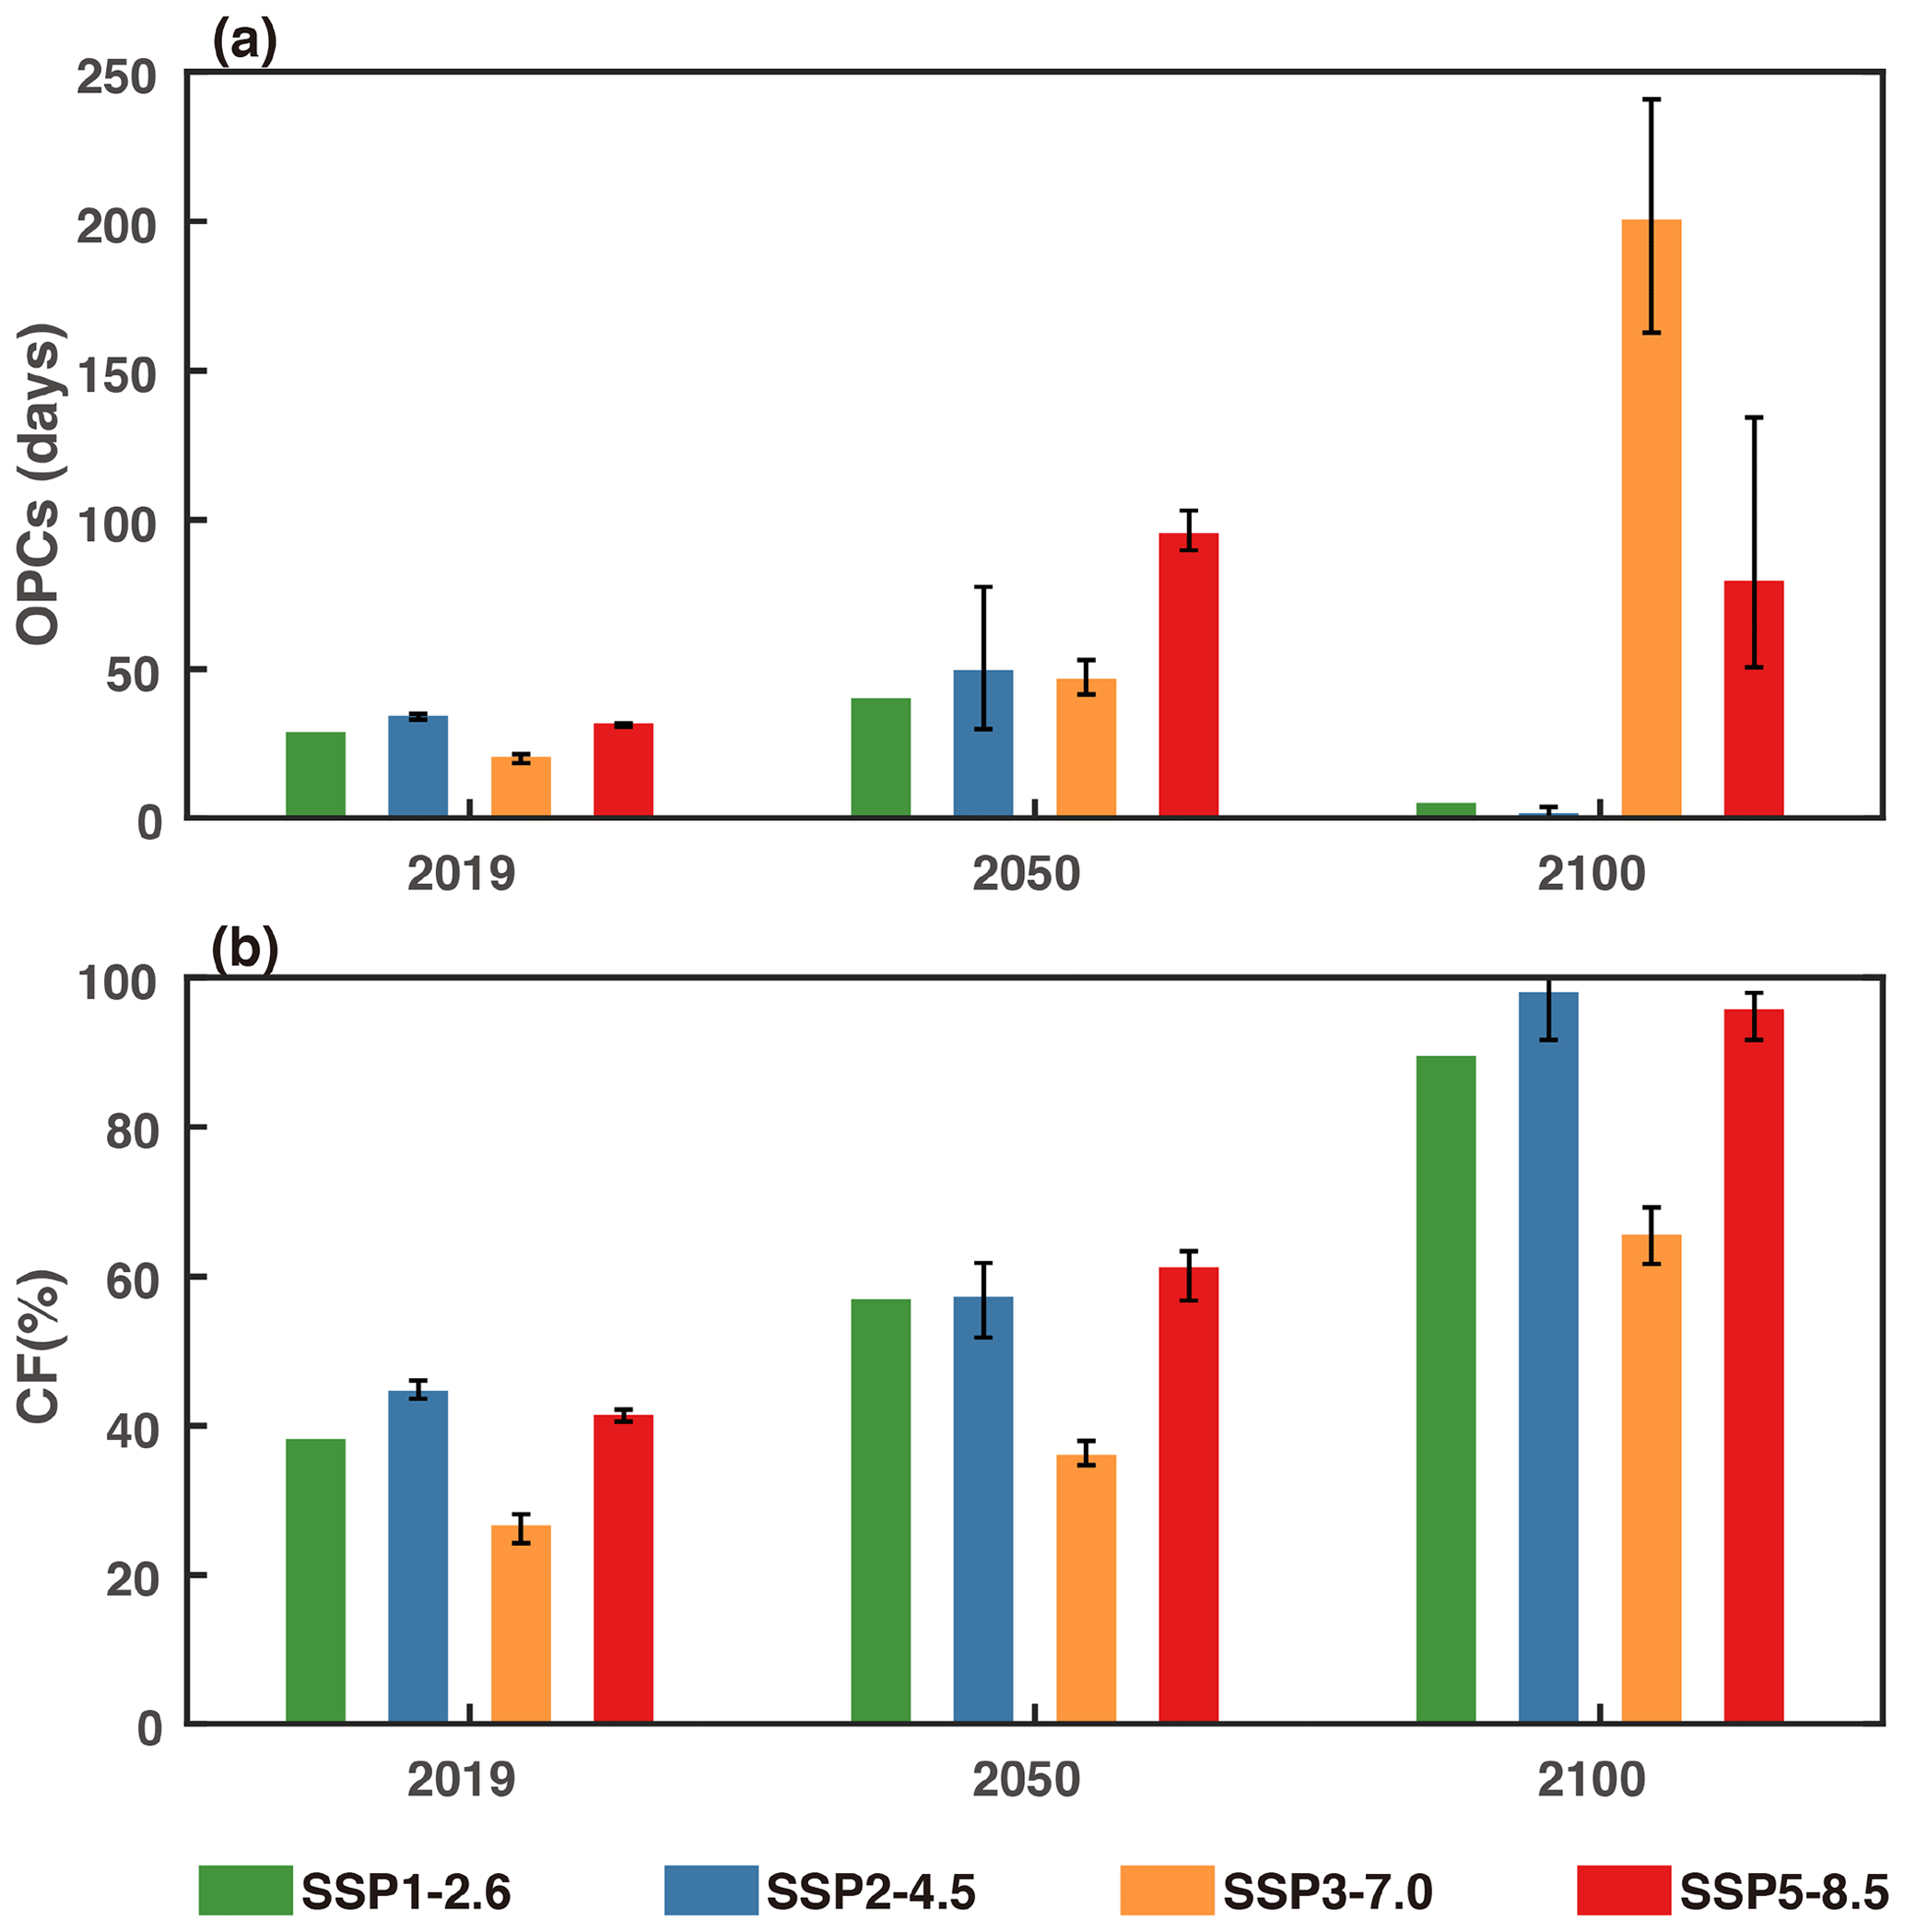
Figure 6Averaged (a) OPCs and (b) CF values over NCP based on CMIP6 simulations under different SSPs for the periods of 2015–2019, 2046–2050, and 2096–2100. The error bar shows the minimum and maximum values simulated by the CMIP6 models for each SSP. Note that only one GCM is available for SSP1–2.6.

Figure 7Changes in annual mean (a) Tmax and (b) MDA8 O3 averaged over NCP (37–41∘ N; 114–120∘ E) relative to 2015 under SSP1–2.6, SSP2–4.5, SSP3–7.0, and SSP5–8.5. The colored lines indicate the multi-model ensemble mean for each SSP and the scattered dots with the same color denote results across the available CMIP6 models. The three periods of 2015– 2019, 2046–2050, and 2096–2100 are marked with gray shading.
Unlike OPCs, CF over NCP obviously increases by the 2050 and 2100 scenarios compared with 2019 under all four SSPs (Fig. 6b). The projected increases of CF over NCP indicate the higher dependence of O3 pollution on extreme high temperatures in the future, consistent with the increased sensitivity of MDA8 O3 to Tmax at higher Tmax in historical periods (Fig. 2c). Spatially, the NCP region will still see the highest CF values in the future, especially under SSP1–2.6, SSP2–4.5, and SSP5–8.5 (Fig. S7 in the Supplement). This means that regardless of the economic pathways, extreme high temperature will play an increasingly important role in modulating O3 pollution in the warming climate. Therefore, besides the management strategies on pollutant emissions, global warming mitigations will undoubtedly benefit O3 pollution control, especially for regions facing severe air quality issues. Note that for the future changes of OPCs, the influences of natural variability are less considered, whereas previous studies have emphasized the significant role of natural variability on altering the robustness of climate projections and their impacts on air quality (e.g, Garcia-Menendez et al., 2017). The detection of the anthropogenic-forced signal demands a larger model ensemble and a longer simulation length that deserves further explorations.
Climate change can impact local air quality. Higher temperatures associated with climate change can lead to an increase in surface O3, and high temperatures and surface O3 are highly temporally correlated over many regions (Porter and Heald, 2019). A large population in China has been increasingly exposed to both severe O3 pollution and extreme heat under global warming. With combined surface observations of air temperature and O3 concentration, process-based model simulations, and multi-model projections, this study first presented a comprehensive analysis of the co-occurrences of extreme high temperatures and O3 pollution in China. It is highlighted that NCP is a hot spot in China most threatened by the co-occurrence of extremes in heat and O3 pollution. The higher co-occurrence over NCP than other regions in China is linked to their distinctive relationships to meteorological variables, as temperature is the top meteorological factor directly leading to O3 pollution over NCP, whereas relative humidity is the most influential variable for O3 pollution over southern China (Han et al., 2020). Recently, the compound extreme events (e.g., co-occurrence of two extreme weather events simultaneously) have been raised as a substantial concern to O3 formation. For example, the co-occurrences of heat wave and air stagnation promote higher O3 concentration compared with the single extreme events of heat wave or stagnation in the USA in the future relative to the present (Zhang et al., 2018; Gao et al., 2020).
The concurrent increasing trends in both surface O3 and temperature over NCP in recent years account for the increasing coupled extremes in surface O3 and heat in recent years. Besides, has been previously reported that the increasing trend of temperature is higher over northern China than southern China (P. Wang et al., 2017; Qian and Qin, 2006). The increase in air temperature can accelerate the O3 production. Using a physically based model (GEOS-Chem), we have provided support for the dominant role of higher temperatures associated with stable atmospheric conditions under favorable weather patterns in amplifying O3 pollution through enhanced chemical production during coupled extremes, compared with the individual ozone pollution days not accompanied by extreme temperatures. In addition, the increases in surface O3 over NCP are much stronger than the other regions in recent years, which is also possibly linked to the stimulation effect from enhanced hydroperoxyl radicals (HO2) due to a reduction in aerosol sink resulting from the decrease in PM2.5 during this period (K. Li et al., 2019). Thus, the hot spot of co-occurrences of extremes in heat and O3 over NCP could be attributed to the co-effects of stronger increasing trends of temperature and surface O3 therein.
It is a prevalent concept that the coupled extremes pose greater health impacts or risks to humans than the simply summed impacts of the single extremes acting alone (Smith et al., 2014). It is revealed here that both the O3 concentration and air temperatures are higher during the coupled extremes than the individual O3 pollution, leading to an even heavier health burden to humans. This study also underscores the elevated air temperatures during the coupled extremes as the major driver for increased mortality rates, while the simultaneously elevated O3 concentrations act as an additional stressor. However, as mentioned above, how the interactions between temperature and O3 influence human health during coupled extremes is still an unanswered question that deserves future studies using more health-related data.
Currently, China has the highest emission of greenhouse gases, and the emission rates have increased significantly since the beginning of the 21st century (Friedlingstein et al., 2020). To prevent the dangerous climate change impacts, the Chinese government has declared an ambitious goal by pledging to peak emissions before 2030 and reach carbon neutrality before 2060. With global warming, hot extremes in China are projected to be more frequent, stronger, and longer lasting, which may present challenges for O3 pollution control. Based on ScenarioMIP simulations from CMIP6, this study demonstrates that the coupled extremes over NCP are projected to be more frequent in the middle of this century, but their frequency decreases or increases by the end of the century under strong or weak air pollution control scenarios, respectively. Also, with higher sensitivity of O3 concentration to higher temperatures, O3 extremes will increasingly co-occur with extreme high temperatures over NCP as the climate warms, regardless of the economic pathways. Thus, our results further reinforce the notion that determined actions are vital to make our communities less vulnerable to climate change impacts already in progress. On the other hand, tropospheric O3 levels are projected to increase in the near decades (see Fig. 7b; Turnock et al., 2020). As the third important anthropogenic greenhouse gas after CO2 and CH4, higher tropospheric O3 levels can cause temperature changes by altering the energy balance between the atmosphere and the earth (Dang and Liao, 2019), which may cause feedback on the air quality. Thus, potential co-benefits may be gained through O3 pollution control and climate change managements in suppressing the occurrences of coupled extremes and tackling their consequences to air quality, human health, and climate.
Hourly O3 concentrations are obtained from the public website of the China National Environmental Monitoring Centre (http://www.cnemc.cn/en/, CNEMC, 2020). Daily maximum air temperature is provided by the National Meteorological Information Centre of the China Meteorological Administration (http://data.cma.cn/en/, CMA, 2020). Reanalysis datasets are derived from the new Japanese 55-year Reanalysis (https://doi.org/10.5065/D6HH6H41, Japan Meteorological Agency/Japan, 2013). Multi-model projections are from Scenario Model Intercomparison Project in Phase 6 of the Coupled Model Intercomparison Project (https://esgf-node.llnl.gov/search/cmip6/, Coupled Model Intercomparison Project, 2020). The GEOS-Chem model is available at https://geos-chem.seas.harvard.edu/ (Atmospheric Chemistry Modeling Group, 2020).
The supplement related to this article is available online at: https://doi.org/10.5194/acp-22-4705-2022-supplement.
PW performed the analyses and wrote the initial draft. YY conceived and supervised the study. HL performed the GEOS-Chem simulations. YY and LRL reviewed and edited the initial draft. All the authors discussed the results and contributed to the final manuscript.
The contact author has declared that neither they nor their co-authors have any competing interests.
Publisher’s note: Copernicus Publications remains neutral with regard to jurisdictional claims in published maps and institutional affiliations.
We appreciate the efforts of the China Ministry of Ecology and Environment and China Meteorological Administration with respect to supporting the nationwide observation network. We acknowledge the JRA55 project for reanalysis data. We appreciate the efforts of NASA GMAO with respect to providing the MERRA-2 reanalysis data. We acknowledge the efforts of the GEOS-Chem working groups for developing and managing the model.
This study was supported by the National Key Research and Development Program of China (grant nos. 2020YFA0607803 and 2019YFA0606800), the National Natural Science Foundation of China (grant no. 42105166), and the Jiangsu Science Fund for Distinguished Young Scholars (grant no. BK20211541). L. Ruby Leung was supported by the Biological and Environmental Research (BER) program (US Department of Energy, Office of Science) and by the Regional and Global Modeling and Analysis (RGMA) program (US Department of Energy). The Pacific Northwest National Laboratory (PNNL) is operated for the US Department of Energy by the Battelle Memorial Institute under contract DE-AC05-76RL01830.
This paper was edited by Qiang Zhang and reviewed by two anonymous referees.
Atmospheric Chemistry Modeling Group – Harvard University: GEOS-Chem model, https://geos-chem.seas.harvard.edu/, last access: 10 April 2020.
Camalier, L., Cox, W., and Dolwick, P.: The effects of meteorology on ozone in urban areas and their use in assessing ozone trends, Atmos. Environ., 41, 7127–7137, 2007.
Cao, J., Situ, S., Hao, Y., Xie, S., and Li, L.: Enhanced summertime ozone and SOA from biogenic volatile organic compound (BVOC) emissions due to vegetation biomass variability during 1981–2018 in China, Atmos. Chem. Phys., 22, 2351–2364, https://doi.org/10.5194/acp-22-2351-2022, 2022.
CNEMC: China National Environmental Monitoring Centre, http://www.cnemc.cn/en/, last access: 10 April 2020.
Chen, K., Fiore, A. M., Chen, R., Jiang, L., Jones, B., Schneider, A., Peters, A., Bi, J., Kan, H., and Kinney, P. L.: Future ozone-related acute excess mortality under climate and population change scenarios in China: A modeling study, PLOS Med., 15, e1002598, https://doi.org/10.1371/journal.pmed.1002598, 2018.
Chen, L., Zhu, J., Liao, H., Yang, Y., and Yue, X.: Meteorological influences on PM2.5 and O3 trends and associated health burden since China's clean air actions, Sci. Total Environ., 744, 140837, https://doi.org/10.1016/j.scitotenv.2020.140837, 2020.
Chen, R., Cai, J., Meng, X., Kim, H., Honda, Y., Guo, Y. L., Samoli, E., Yang, X., and Kan, H.: Ozone and daily mortality rate in 21 cities of East Asia: how does season modify the association?, Am. J. Epidemiol., 180, 729–736, 2014.
CMA: National Meteorological Information Centre of the China Meteorological Administration, http://data.cma.cn/en/, last access: 10 April 2020.
Coupled Model Intercomparison Project: Scenario Model Intercomparison Project in Phase 6, https://esgf-node.llnl.gov/search/cmip6/, last access: 10 April 2020.
Dang, R. and Liao, H.: Radiative forcing and health impact of aerosols and ozone in China as the consequence of clean air actions over 2012–2017, Geophys. Res. Lett., 46, 12511–12519, 2019.
Ebita, A., Kobayashi, S., Ota, Y., Moriya, M., Kumabe, R., Onogi, K., Harada, Y., Yasui, S., Miyaoka, K., Takahashi, K., Kamahori, H., Kobayashi, C., Endo, H., Soma, M., Oikawa, Y., and Ishimizu, T.: The Japanese 55-year Reanalysis “JRA-55”: An Interim Report, Sola, 7, 149–152, https://doi.org/10.2151/sola.2011-038, 2011.
Fiore, A. M., Jacob, D. J., Mathur, R., and Martin, R. V.: Application of empirical orthogonal functions to evaluate ozone simulations with regional and global models, J. Geophys. Res., 108, ACH 10-1–ACH 10-8, https://doi.org/10.1029/2002JD003151, 2003.
Friedlingstein, P., O'Sullivan, M., Jones, M. W., Andrew, R. M., Hauck, J., Olsen, A., Peters, G. P., Peters, W., Pongratz, J., Sitch, S., Le Quéré, C., Canadell, J. G., Ciais, P., Jackson, R. B., Alin, S., Aragão, L. E. O. C., Arneth, A., Arora, V., Bates, N. R., Becker, M., Benoit-Cattin, A., Bittig, H. C., Bopp, L., Bultan, S., Chandra, N., Chevallier, F., Chini, L. P., Evans, W., Florentie, L., Forster, P. M., Gasser, T., Gehlen, M., Gilfillan, D., Gkritzalis, T., Gregor, L., Gruber, N., Harris, I., Hartung, K., Haverd, V., Houghton, R. A., Ilyina, T., Jain, A. K., Joetzjer, E., Kadono, K., Kato, E., Kitidis, V., Korsbakken, J. I., Landschützer, P., Lefèvre, N., Lenton, A., Lienert, S., Liu, Z., Lombardozzi, D., Marland, G., Metzl, N., Munro, D. R., Nabel, J. E. M. S., Nakaoka, S.-I., Niwa, Y., O'Brien, K., Ono, T., Palmer, P. I., Pierrot, D., Poulter, B., Resplandy, L., Robertson, E., Rödenbeck, C., Schwinger, J., Séférian, R., Skjelvan, I., Smith, A. J. P., Sutton, A. J., Tanhua, T., Tans, P. P., Tian, H., Tilbrook, B., van der Werf, G., Vuichard, N., Walker, A. P., Wanninkhof, R., Watson, A. J., Willis, D., Wiltshire, A. J., Yuan, W., Yue, X., and Zaehle, S.: Global Carbon Budget 2020, Earth Syst. Sci. Data, 12, 3269–3340, https://doi.org/10.5194/essd-12-3269-2020, 2020.
Fu, T.-M., Zheng, Y., Paulot, F., Mao, J., and Yantosca, R. M.: Positive but variable sensitivity of August surface ozone to large-scale warming in the southeast United States, Nature, 5, 454–458, 2015.
Gao, Y., Zhang, J., Yan, F., Leung, L. R., Luo, K., Zhang, Y., and Bell, M. L.: Nonlinear effect of compound extreme weather events on ozone formation over the United States, Weather and Climate Extremes, 30, 100285, https://doi.org/10.1016/j.wace.2020.100285, 2020.
Gao, Y., Yan, F., Ma, M., Ding, A., Liao, H., Wang, S., Wang, X., Zhao, B., Cai, W., and Su, H., Yao, X., and Gao, H.: Unveiling the dipole synergic effect of biogenic and anthropogenic emissions on ozone concentrations, Sci. Total Environ., 818, 151722, https://doi.org/10.1016/j.scitotenv.2021.151722, 2022.
Garcia-Menendez, F., Monier, E., and Selin, N. E.: The role of natural variability in projections of climate change impacts on US ozone pollution, Geophys. Res. Lett., 44, 2911–2921, 2017.
Gelaro, R., McCarty, W., Suarez, M. J., Todling, R., Molod, A., Takacs, L., Randles, C., Darmenov, A., Bosilovich, M. G., Reichle, R., Wargan, K., Coy, L., Cullather, R., Draper, C., Akella, S., Buchard, V., Conaty, A., da Silva, A., Gu, W., Kim, G. K., Koster, R., Lucchesi, R., Merkova, D., Nielsen, J. E., Partyka, G., Pawson, S., Putman, W., Rienecker, M., Schubert, S. D., Sienkiewicz, M., and Zhao, B.: The Modern-Era Retrospective Analysis for Research and Applications, Version 2 (MERRA-2), J. Climate, 30, 5419–5454, https://doi.org/10.1175/JCLI-D-16-0758.1, 2017.
Gidden, M. J., Riahi, K., Smith, S. J., Fujimori, S., Luderer, G., Kriegler, E., van Vuuren, D. P., van den Berg, M., Feng, L., Klein, D., Calvin, K., Doelman, J. C., Frank, S., Fricko, O., Harmsen, M., Hasegawa, T., Havlik, P., Hilaire, J., Hoesly, R., Horing, J., Popp, A., Stehfest, E., and Takahashi, K.: Global emissions pathways under different socioeconomic scenarios for use in CMIP6: a dataset of harmonized emissions trajectories through the end of the century, Geosci. Model Dev., 12, 1443–1475, https://doi.org/10.5194/gmd-12-1443-2019, 2019.
Gong, C. and Liao, H.: A typical weather pattern for ozone pollution events in North China, Atmos. Chem. Phys., 19, 13725–13740, https://doi.org/10.5194/acp-19-13725-2019, 2019.
Guenther, A. B., Jiang, X., Heald, C. L., Sakulyanontvittaya, T., Duhl, T., Emmons, L. K., and Wang, X.: The Model of Emissions of Gases and Aerosols from Nature version 2.1 (MEGAN2.1): an extended and updated framework for modeling biogenic emissions, Geosci. Model Dev., 5, 1471–1492, https://doi.org/10.5194/gmd-5-1471-2012, 2012.
Han, H., Liu, J., Shu, L., Wang, T., and Yuan, H.: Local and synoptic meteorological influences on daily variability in summertime surface ozone in eastern China, Atmos. Chem. Phys., 20, 203–222, https://doi.org/10.5194/acp-20-203-2020, 2020.
Huang, J., Pan, X., Guo, X., and Li, G.: Health impact of China's Air Pollution Prevention and Control Action Plan: an analysis of national air quality monitoring and mortality data, Lancet, 2, e313–e323, 2018.
Huang, Z., Lin, H., Liu, Y., Zhou, M., Liu, T., Xiao, J., Zeng, W., Li, X., Zhang, Y., and Ebi, K. L. J. B. O.: Individual-level and communitylevel effect modifiers of the temperature–mortality relationship in 66 Chinese communities, BMJ Open, 5, e009172, https://doi.org/10.1136/bmjopen-2015-009172, 2015.
Japan Meteorological Agency/Japan: JRA-55: Japanese 55-year Reanalysis, Daily 3-Hourly and 6-Hourly Data, updated monthly, Research Data Archive at the National Center for Atmospheric Research, Computational and Information Systems Laboratory [data set], https://doi.org/10.5065/D6HH6H41, 2013.
Jhun, I., Fann, N., Zanobetti, A., and Hubbell, B.: Effect modification of ozone-related mortality risks by temperature in 97 US cities, Environ. Int., 73, 128–134, 2014.
Krug, A., Fenner, D., Holtmann, A., and Scherer, D.: Occurrence and Coupling of Heat and Ozone Events and Their Relation to Mortality Rates in Berlin, Germany, between 2000 and 2014, Atmosphere, 10, 348, https://doi.org/10.3390/atmos10060348, 2019.
Lau, N. C. and Nath, M. J.: Model Simulation and Projection of European Heat Waves in Present-Day and Future Climates, J. Climate, 27, 3713–3730, 2014.
Lee, J. Y., Lee, S. H., Hong, S.-C., and Kim, H.: Projecting future summer mortality due to ambient ozone concentration and temperature changes, Atmos. Environ., 156, 88–94, https://doi.org/10.1016/j.atmosenv.2017.02.034, 2017.
Li, K., Jacob, D. J., Liao, H., Shen, L., Zhang, Q., and Bates, K. H.: Anthropogenic drivers of 2013–2017 trends in summer surface ozone in China, P. Natl. Acad. Sci. USA, 116, 422–427, https://doi.org/10.1073/pnas.1812168116, 2019.
Li, K., Jacob, D. J., Shen, L., Lu, X., De Smedt, I., and Liao, H.: Increases in surface ozone pollution in China from 2013 to 2019: anthropogenic and meteorological influences, Atmos. Chem. Phys., 20, 11423–11433, https://doi.org/10.5194/acp-20-11423-2020, 2020.
Li, M., Yao, Y., Luo, D., and Zhong, L.: The linkage of the large-scale circulation pattern to a long-lived heatwave over mideastern China in 2018, Atmosphere, 10, 89, https://doi.org/10.3390/atmos10020089, 2019.
Li, Q., Liu, X., Zhang, H., Peterson, T. C., and Easterling, D. R.: Detecting and adjusting temporal inhomogeneity in Chinese mean surface air temperature data, Adv. Atmos. Sci., 21, 260–268, https://doi.org/10.1007/bf02915712, 2004.
Li, Z., Tao, H., Hartmann, H., Su, B., Wang, Y., and Jiang, T.: Variation of projected atmospheric water vapor in central Asia using multi-models from CMIP6, Atmosphere, 11, 909, https://doi.org/10.3390/atmos11090909, 2020.
Lin, M., Horowitz, L. W., Xie, Y., Paulot, F., and Pilegaard, K.: Vegetation feedbacks during drought exacerbate ozone air pollution extremes in Europe, Nature, 10, 444–451, 2020.
Lin, X., Yuan, Z., Yang, L., Luo, H., and Li, W.: Impact of extreme meteorological events on ozone in the Pearl River Delta, China, Aerosol Air Qual. Res., 19, 1307–1324, 2019.
Lu, C., Ye, J., Wang, S., Yang, M., Li, Q., He, W., Qin, Y., Cai, J., and Mao, J.: An unusual heat wave in North China during midsummer, 2018, Front. Earth Sci., 8, 238, https://doi.org/10.3389/feart.2020.00238, 2020.
Lu, X., Hong, J., Zhang, L., Cooper, O. R., Schultz, M. G., Xu, X., Wang, T., Gao, M., Zhao, Y., and Zhang, Y.: Severe Surface Ozone Pollution in China: A Global Perspective, Environ. Sci. Tech. Let., 5, 487–494, https://doi.org/10.1021/acs.estlett.8b00366, 2018.
Lu, X., Zhang, L., and Shen, L.: Meteorology and Climate Influences on Tropospheric Ozone: a Review of Natural Sources, Chemistry, and Transport Patterns, Current Pollution Reports, 5, 238–260, https://doi.org/10.1007/s40726-019-00118-3, 2019a.
Lu, X., Zhang, L., Chen, Y., Zhou, M., Zheng, B., Li, K., Liu, Y., Lin, J., Fu, T.-M., and Zhang, Q.: Exploring 2016–2017 surface ozone pollution over China: source contributions and meteorological influences, Atmos. Chem. Phys., 19, 8339–8361, https://doi.org/10.5194/acp-19-8339-2019, 2019b.
Ma, M., Gao, Y., Wang, Y., Zhang, S., Leung, L. R., Liu, C., Wang, S., Zhao, B., Chang, X., Su, H., Zhang, T., Sheng, L., Yao, X., and Gao, H.: Substantial ozone enhancement over the North China Plain from increased biogenic emissions due to heat waves and land cover in summer 2017, Atmos. Chem. Phys., 19, 12195–12207, https://doi.org/10.5194/acp-19-12195-2019, 2019.
Ma, M., Gao, Y., Ding, A., Su, H., Liao, H., Wang, S., Wang, X., Zhao, B., Zhang, S., Fu, P., Guenther, A. B., Wang, M., Li, S., Chu, B., Yao, X., and Gao, H.: Development and Assessment of a High-Resolution Biogenic Emission Inventory from Urban Green Spaces in China, Environ. Sci. Technol., 56, 175–184, 2021.
Meehl, G. A. and Tebaldi, C.: More intense, more frequent, and longer lasting heat waves in the 21st century, Science, 305, 994–997, 2004.
O'Neill, B. C., Tebaldi, C., van Vuuren, D. P., Eyring, V., Friedlingstein, P., Hurtt, G., Knutti, R., Kriegler, E., Lamarque, J.-F., Lowe, J., Meehl, G. A., Moss, R., Riahi, K., and Sanderson, B. M.: The Scenario Model Intercomparison Project (ScenarioMIP) for CMIP6, Geosci. Model Dev., 9, 3461–3482, https://doi.org/10.5194/gmd-9-3461-2016, 2016.
Perkins, S. E.: A review on the scientific understanding of heatwaves – Their measurement, driving mechanisms, and changes at the global scale, Atmos. Res., 164–165, 242–267, 2015.
Porter, W. C. and Heald, C. L.: The mechanisms and meteorological drivers of the summertime ozone–temperature relationship, Atmos. Chem. Phys., 19, 13367–13381, https://doi.org/10.5194/acp-19-13367-2019, 2019.
Pu, X., Wang, T. J., Huang, X., Melas, D., Zanis, P., Papanastasiou, D. K., and Poupkou, A.: Enhanced surface ozone during the heat wave of 2013 in Yangtze River Delta region, China, Sci. Total Environ., 603–604, 807–816, https://doi.org/10.1016/j.scitotenv.2017.03.056, 2017.
Qian, W. and Qin, A.: Spatial-temporal characteristics of temperature variation in China, Meteorol. Atmos. Phys., 93, 1–16, 2006.
Qin, Y., Li, J., Gong, K., Wu, Z., Chen, M., Qin, M., Huang, L., and Hu, J.: Double high pollution events in the Yangtze River Delta from 2015 to 2019: Characteristics, trends, and meteorological situations, Sci. Total Environ., 792, 148349, https://doi.org/10.1016/j.scitotenv.2021.148349, 2021.
Ren, C., Williams, G. M., Mengersen, K., Morawska, L., and Tong, S.: Does temperature modify short-term effects of ozone on total mortality in 60 large eastern US communities? – An assessment using the NMMAPS data, Environ. Int., 34, 451–458, 2008.
Schnell, J. L. and Prather, M. J.: Co-occurrence of extremes in surface ozone, particulate matter, and temperature over eastern North America, P. Natl. Acad. Sci. USA, 114, 2854–2859, https://doi.org/10.1073/pnas.1614453114, 2017.
Sharma, S., Sharma, P., and Khare, M.: Photo-chemical transport modelling of tropospheric ozone: A review, Atmos. Environ., 159, 34–54, https://doi.org/10.1016/j.atmosenv.2017.03.047, 2017.
Smith, K., Woodward, A, Campbell-Lendrum, D., Chadee D., Honda, Y., Liu, Q., Olwoch, J., Revich, B., and Sauerborn, R.: Human health: impacts, adaptation, and cobenefits, in: Climate Change 2014: Impacts, Adaptation, and Vulnerability. Part A: Global and Sectoral Aspects. Contribution of Working Group II to the Fifth Assessment Report of the Intergovernmental Panel on Climate Change, edited by: Field, C., Barros, V., Dokken, D., Mach, K., Mastrandrea, M., Bilir, T., Chatterjee, M., Ebi, K., Estrada, Y., Genova, R., Girma, B., Kissel, E., Levy, A., MacCracken, S., Mastrandrea, P., and White, L., Cambridge University Press, Cambridge, United Kingdom and New York, NY, USA, 709–754, 2014.
Tan, J., Zheng, Y., Song, G., Kalkstein, L. S., Kalkstein, A. J., and Tang, X.: Heat wave impacts on mortality in Shanghai, 1998 and 2003, Int. J. Biometeorol., 51, 193–200, 2007.
Turnock, S. T., Allen, R. J., Andrews, M., Bauer, S. E., Deushi, M., Emmons, L., Good, P., Horowitz, L., John, J. G., Michou, M., Nabat, P., Naik, V., Neubauer, D., O'Connor, F. M., Olivié, D., Oshima, N., Schulz, M., Sellar, A., Shim, S., Takemura, T., Tilmes, S., Tsigaridis, K., Wu, T., and Zhang, J.: Historical and future changes in air pollutants from CMIP6 models, Atmos. Chem. Phys., 20, 14547–14579, https://doi.org/10.5194/acp-20-14547-2020, 2020.
Wang, P., Hui, P., Xue, D., and Tang, J.: Future projection of heat waves over China under global warming within the CORDEX-EA-II project, Clim. Dynam., 53, 957–973, 2019a.
Wang, P., Leung, L. R., Lu, J., Song, F., and Tang, J.: Extreme Wet-Bulb Temperatures in China: The Significant Role of Moisture, J. Geophys. Res.-Atmos., 124, 11944–11960, 2019b.
Wang, P., Tang, J., Wang, S., Dong, X., and Fang, J.: Regional heatwaves in china: a cluster analysis, Clim. Dynam., 50, 1901–1917, https://doi.org/10.1007/s00382-017-3728-4, 2018.
Wang, P., Tang, J., Sun, X., Wang, S., Wu, J., Dong, X., and Fang, J.: Heatwaves in China: definitions, leading patterns and connections to large-scale atmospheric circulation and SSTs, J. Geophys. Res.-Atmos., 122, 10679–10699, https://doi.org/10.1002/2017JD027180, 2017.
Wang, T., Xue, L., Brimblecombe, P., Lam, Y. F., Li, L., and Zhang, L.: Ozone pollution in China: A review of concentrations, meteorological influences, chemical precursors, and effects, Sci. Total Environ., 575, 1582–1596, https://doi.org/10.1016/j.scitotenv.2016.10.081, 2017.
Wang, W., Zhou, W., Li, X., Wang, X., and Wang, D.: Synoptic-scale characteristics and atmospheric controls of summer heat waves in China, Clim. Dynam., 46, 2923–2941, 2016.
Yin, P., Chen, R., Wang, L., Meng, X., Liu, C., Niu, Y., Lin, Z., Liu, Y., Liu, J., and Qi, J., You, J., Zhou, M., and Kan, H.: Ambient ozone pollution and daily mortality: a nationwide study in 272 Chinese cities, Environ. Health Persp., 125, 117006, https://doi.org/10.1289/EHP1849, 2017.
Yue, X., Unger, N., Harper, K., Xia, X., Liao, H., Zhu, T., Xiao, J., Feng, Z., and Li, J.: Ozone and haze pollution weakens net primary productivity in China, Atmos. Chem. Phys., 17, 6073–6089, https://doi.org/10.5194/acp-17-6073-2017, 2017.
Zhang, J., Gao, Y., Luo, K., Leung, L. R., Zhang, Y., Wang, K., and Fan, J.: Impacts of compound extreme weather events on ozone in the present and future, Atmos. Chem. Phys., 18, 9861–9877, https://doi.org/10.5194/acp-18-9861-2018, 2018.
Zheng, B., Tong, D., Li, M., Liu, F., Hong, C., Geng, G., Li, H., Li, X., Peng, L., Qi, J., Yan, L., Zhang, Y., Zhao, H., Zheng, Y., He, K., and Zhang, Q.: Trends in China's anthropogenic emissions since 2010 as the consequence of clean air actions, Atmos. Chem. Phys., 18, 14095–14111, https://doi.org/10.5194/acp-18-14095-2018, 2018.
Zhou, T. J. and Yu, R. C.: Atmospheric water vapor transport associated with typical anomalous summer rainfall patterns in China, J. Geophys. Res.-Atmos., 110, 211–211, 2005.