the Creative Commons Attribution 4.0 License.
the Creative Commons Attribution 4.0 License.
 | 13 Jan 2022
Measurement report: Particle-size-dependent fluorescence properties of water-soluble organic compounds (WSOCs) and their atmospheric implications for the aging of WSOCs
Juanjuan Qin
Jihua Tan
Xueming Zhou
Yanrong Yang
Yuanyuan Qin
Xiaobo Wang
Shaoxuan Shi
Kang Xiao
Xinming Wang
Water-soluble organic compounds (WSOCs) play important roles in atmospheric particle formation, migration, and transformation processes. Size-segregated atmospheric particles were collected in a rural area of Beijing. Three-dimensional fluorescence spectroscopy was used to investigate the optical properties of WSOCs as a means of inferring information about their atmospheric sources. Sophisticated analysis on fluorescence data was performed to characteristically estimate the connections among particles of different sizes. WSOC concentrations and the average fluorescence intensity (AFI) showed a monomodal distribution in winter and a bimodal distribution in summer, with the dominant mode in the 0.26–0.44 µm size range in both seasons. The excitation–emission matrix (EEM) spectra of WSOCs varied with particle size, likely due to changing sources and/or the chemical transformation of organics. Size distributions of the fluorescence regional integration (regions III and V) and humification index (HIX) indicate that the humification degree or aromaticity of WSOCs was the highest in the particle size range of 0.26–0.44 µm. The Stokes shift (SS) and the harmonic mean of the excitation and emission wavelengths (WH) reflected that π-conjugated systems were high in the same particle size range. The parallel factor analysis (PARAFAC) results showed that humic-like substances were abundant in fine particles (< 1 µm) and peaked at 0.26–0.44 µm. All evidence supported the fact that the humification degree of WSOCs increased with particle size in the submicron mode (< 0.44 µm) and then decreased gradually with particle size, which implied that the condensation of organics occurred in submicron particles, resulting in the highest degree of humification in the particle size range of 0.26–0.44 µm rather than in the < 0.26 µm range. Synthetically analyzing three-dimensional fluorescence data could efficiently reveal the secondary transformation processes of WSOCs.
- Article
(3841 KB) - Full-text XML
-
Supplement
(6300 KB) - BibTeX
- EndNote


The environmental, health, and climate effects of atmospheric aerosol particles have been reiterated for many years (Pósfai and Buseck, 2010; Burnett et al., 2018; Yan et al., 2020; Fan et al., 2020). Water-soluble organic compounds (WSOCs) comprise 10 % to 80 % of organic compounds in atmospheric aerosols (Qin et al., 2018; Almeida et al., 2020; Cai et al., 2020). WSOCs play significant roles in cloud formation, solar irradiation, and atmospheric chemistry (Asa-Awuku et al., 2009; Duarte et al., 2019). However, only 10 % to 20 % of organic compounds have been structurally identified, and the majority of WSOCs remain uncharacterized. Generally, a WSOC mixture contains both aromatic nuclei and aliphatic chains (Decesari et al., 2001; Dasari et al., 2019), with functional groups or heteroatoms like hydroxyl, carboxyl, aldehyde, ketone, amino, and other nitrogen-containing groups (Duarte et al., 2007; Cai et al., 2020). Biomass burning and secondary transformation of organics are believed to be the main sources of WSOCs (Park et al., 2017; Xiang et al., 2017).
Many sophisticated analytical techniques have been developed to unveil the chemical structure of WSOCs (Johnston and Kerecman, 2019). Nuclear magnetic resonance (NMR) is a powerful tool used to obtain the structures of organics (Stark et al., 2013; Duarte et al., 2015, 2020; Chalbot et al., 2016). The application of other existing technologies used for identifying organics' structure, including electrospray ionization with ultrahigh-resolution Fourier transform ion cyclotron resonance mass spectrometry (ESI-FT-ICR-MS), proton transfer reaction mass spectrometry (PTR-MS), isotopic ratio mass spectroscopy (IRMS), and accelerator mass spectroscopy (AMS), has also been increasing due to the growing requirement for further insight into organics in particulate matter (Cai et al., 2020; Mayorga et al., 2021) and into source characterization for organic emissions from fossil combustion or biogenic origin (Masalaite et al., 2018; Zhao et al., 2019; Huang et al., 2020).
The abovementioned instruments are generally expensive to operate. In contrast, optical instruments like ultraviolet and fluorescence spectrophotometers are relatively low-cost and efficient. Moreover, data generated by the optical instruments can provide quantitative and qualitative information simultaneously, which warrants their broad application on organics research, such as investigating WSOCs and dissolved organic matter (DOM) in water (Hecobian et al., 2010; Qin et al., 2018; Xiao et al., 2016). Three-dimensional fluorescence spectroscopy is an optical instrument that has been used in analyzing atmospheric WSOCs (Duarte et al., 2004; Fu et al., 2014). Fluorescence analysis can identify chromophoric organics like aromatics, proteins, and other organic matter containing π-conjugated systems (Xiao et al., 2018, 2020). The excitation–emission matrix (EEM) can be extracted from fluorescence spectra (acquired on a fluorescence spectrometer) and visualized to show fluorescence regions and possible categories of WSOCs by the spectral characteristics (Duarte et al., 2004; Santos et al., 2009) as well as to study the aging of WSOCs by examining the red or blue shift of fluorescence peaks (Lee et al., 2013; Fu et al., 2015; Vione et al., 2019). Fluorescence indices, determined by the chemical structure of pollutants, are important subsidiary approaches to statistically analyze the fluorescence properties of WSOCs (Andrade-Eiroa et al., 2013a; Qin et al., 2018; Yue et al., 2019).
Earlier studies have investigated the size distributions of WSOCs (Deshmukh et al., 2016; Frka et al., 2018), and more recent studies have focused on the optical properties of size-segregated WSOCs (Chen et al., 2019; Yue et al., 2019. Generally, the mass concentrations of WSOCs show bimodal distributions with the dominant mass concentration in the accumulation mode (0.05–2 µm) (Yu et al., 2004, 2016). Structural investigations on coal-burning- and biomass-burning-affected humic-like substances (HULIS; a significant fraction of WSOCs) in four size ranges found consistent organic species through all of the size ranges; however, the absorption bands of aromatic groups were more intense compared with carboxylic groups in the sub-3 µm fractions (Park et al., 2017; Voliotis et al., 2017). Jang et al. (2019) comprehensively analyzed the structures of size-segregated humic-like substances extracted from PM2.5 (particulate matter with an aerodynamic diameter less than 2.5 nm) in Songdo, South Korea, during periods of pre-heating, current heating, and post-heating, and found that the chemical structures of HULIS changed with particle size. Liu et al. (2013) examined the light absorption properties of size-resolved brown carbon (BrC) and methanol extracts in Georgia, and they found that chromophores were predominant in the accumulation mode, with an aerodynamic mean diameter of 0.5 µm. More recently, fluorescence properties of size-segregated ambient WSOCs and bioaerosols were estimated in a coal-burning city and at a mountain site (Chen et al., 2019; Yue et al., 2019).
To date, comprehensive analysis of the fluorescence properties of size-resolved aerosols is still very limited, with an enormous amount of information being hidden in the EEM spectra. The present study was designed to fill this knowledge gap by investigating the fluorescence properties of WSOCs with different particle sizes. Six-stage size-segregated particle samples were collected in winter and summer in rural Beijing. The light-absorbing and fluorescence properties of size-segregated WSOCs were obtained using the fast and efficient ultraviolet–visible (UV–Vis) and fluorescence methods. A number of fluorescence indices, Stokes shift, and parallel factor analysis (PARAFAC) were performed to quantitatively disclose the connections and transformations of WSOCs. The grey relational degree was used to show the relations between particles.
2.1 Sampling site
Size-segregated particle samples were collected by a six-stage micro-orifice uniform deposit impactor (MOUDI) with respective aerodynamic cut-point diameters of 0.26, 0.44, 0.77, 1.4, 2.5, and 10 µm. Sample collection started at 08:00 LT (UTC-8) and concluded at 07:00 LT the next day, leaving 1 h for operation. All samples were collected on quartz filters (Whatman), which were prebaked for 5 h (500 ∘C) before sample collection, and were wrapped in aluminum foil and stored at −20 ∘C.
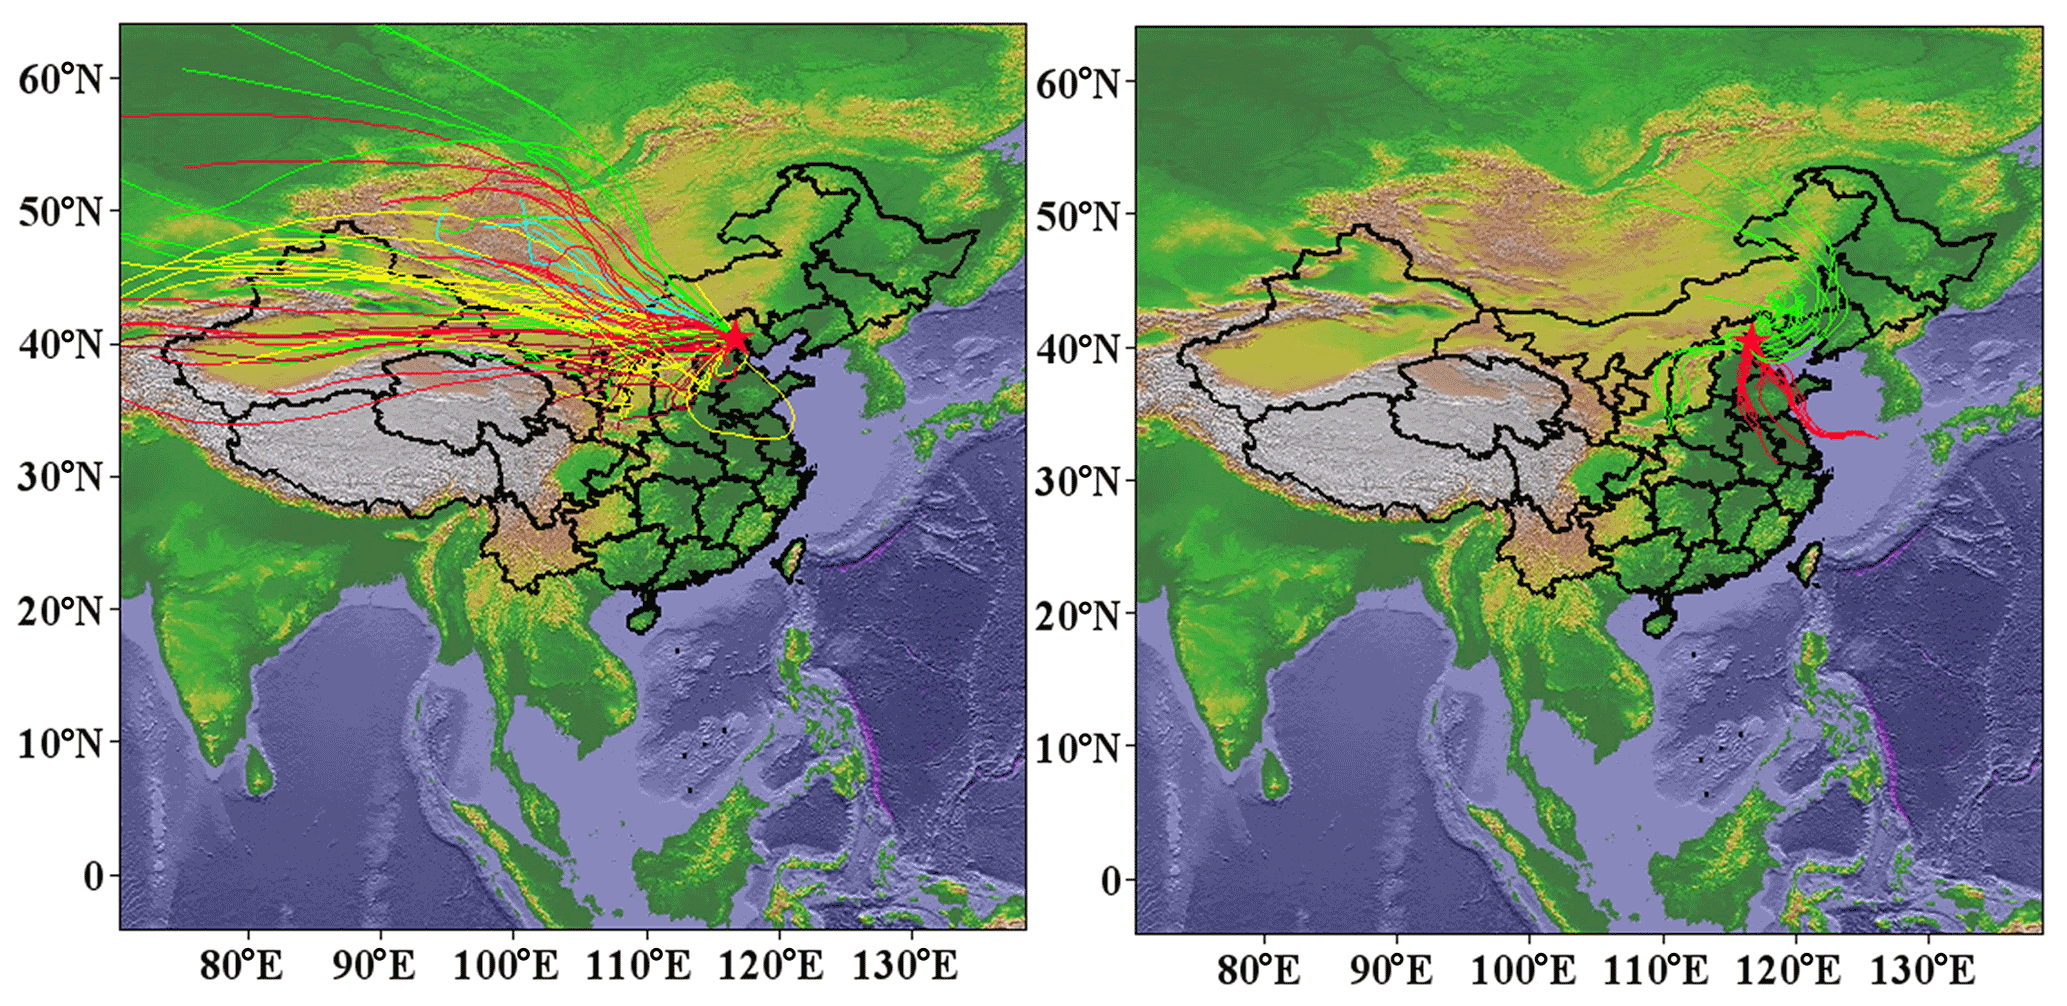
Figure 1The sampling site and air-quality-index-weighted 72 h backward trajectory of winter and summer sampling days, respectively.
A total of 20 sets of six-stage size-segregated aerosol samples were collected at a rural site in Huairou District, Beijing, from 14 November to 30 December 2016 and from 30 June to 8 September 2017. The sample collection days were randomly selected, and samples were later categorized according to the degree of air pollution. Winter sampling days covered six levels of air quality from excellent to severe pollution, whereas summer sampling days only covered good and moderate air quality. The air-quality-index-weighted 72 h backward trajectories during the sampling period are exhibited in Fig. 1.
2.2 Chemical analysis
Organic and elemental carbon (OC and EC, respectively) were determined using a thermal–optical carbon analyzer (DRI), and the IMPROVE (Interagency Monitoring of Protected Visual Environments) thermal evolution protocol was adapted. Detailed information can be found in earlier studies (Cheng et al., 2009; Tan et al., 2016). The detection limit of OC and EC was 1.0 µg m−3, as quantified by a filter and filter blank. Quality assurance (QA) and quality control (QC) were performed by replicate analyses every 10 samples, and the repeatability was better than 5 %.
A quarter of the filter sample was ultrasonically extracted twice with 5 mL ultrapure water each time and mixed up after extraction. The extracts were then filtered through a 0.22 µm membrane filter to remove impurities (Xiang et al., 2017). The measurement of WSOCs was performed by a TOC (total organic carbon) analyzer (multi N/C 3100, Analytic Jena AG, Germany).
The extraction procedures for water-soluble ions (WSINs) were similar to those for WSOCs, but a 0.22 µm Teflon filter was used to remove impurities. Ion chromatography (IC, Dionex ICS 900 and 1100) was used in the detection, with eight WSIN species analyzed (Cl−, , , , Na+, K+, Ca2+, and Mg2+). The recovery (90 %–110 %) and reproducibility (relative standard deviation of each ion lower than 5 %) of the ions were implemented as well.
Table 1Size-segregated average WSOC and WSIN concentrations as well as their standard deviations.
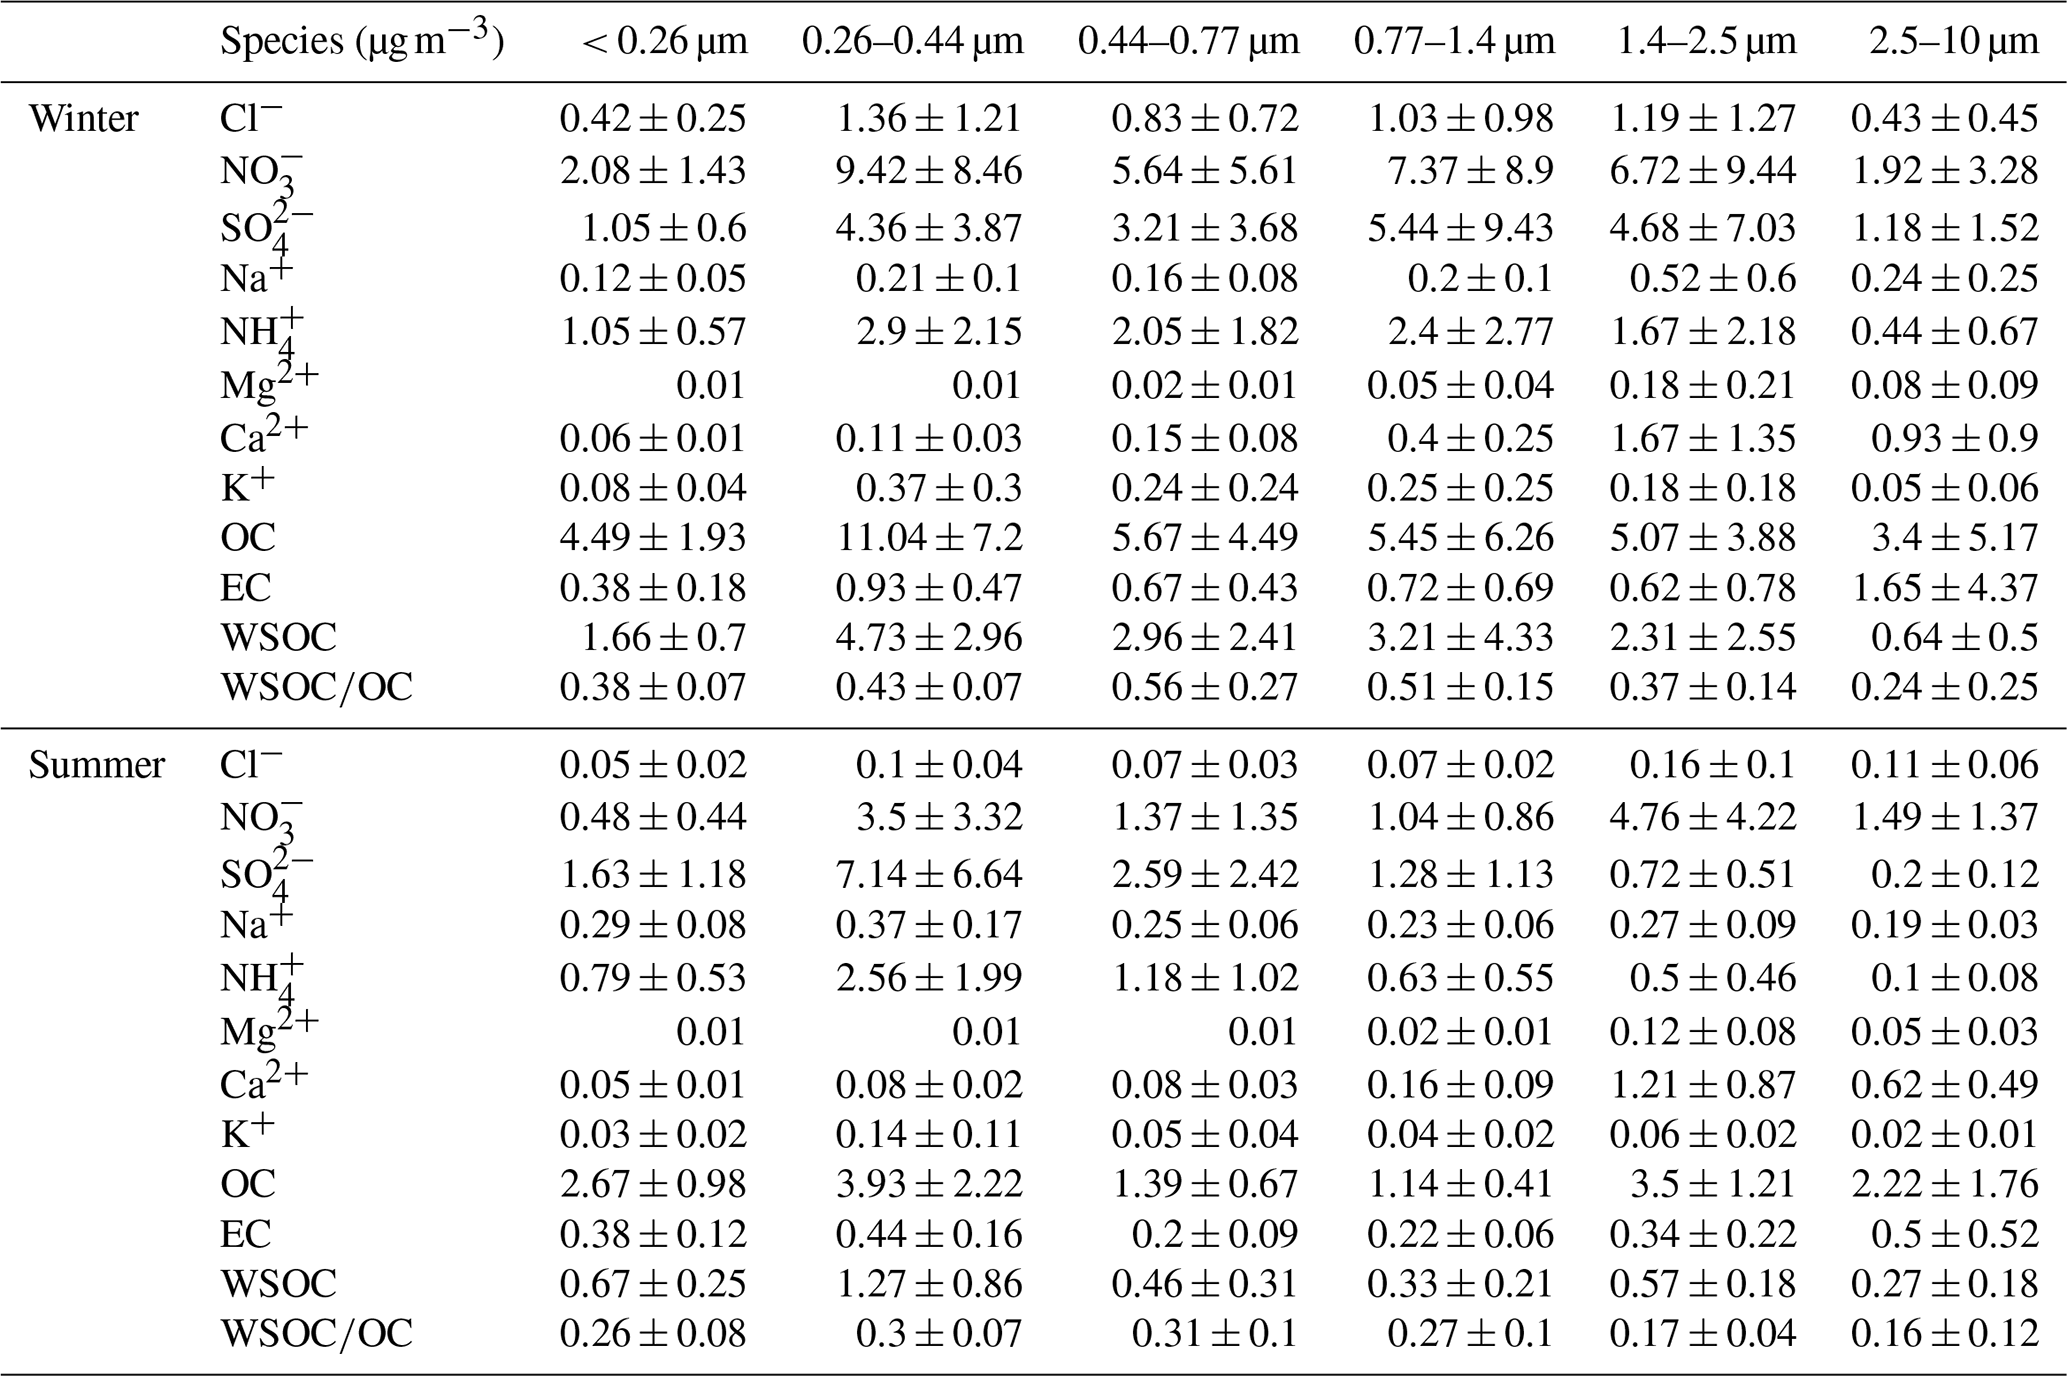
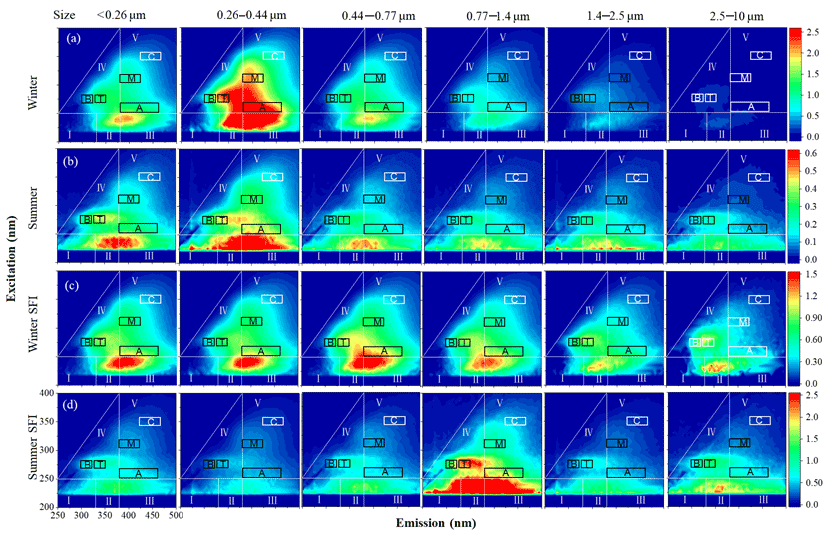
Figure 2The excitation–emission matrix (EEM) spectra of size-segregated samples in winter and summer; their excitation and emission wavelength ranges were the same and are only shown in the first EEM (left panel) in (d). All spectra were partitioned into five regions and were assigned as protein-like pollutants (I and II), fulvic acid (III), soluble microbial byproduct-like substances (IV), and humic-like acid (V), respectively (Birdwell and Engel, 2010). Peaks A, B, C, M, and T were generally considered as humic-like fluorophores, tyrosine-like fluorophores, humic-like carbon with larger molecular weight, marine humic-like fluorophore, and tryptophan-like fluorophores (Coble, 1996). Rows (a) and (b) show the size-segregated EEM spectra of the winter and summer samples, respectively (unit: RU), and rows (c) and (d) show the corresponding EEM spectra of fluorescence emitted per unit of WSOC carbon (unit: RU L mg−1).
2.3 Spectrophotometer analysis
The extraction procedures for samples subject to fluorescence and ultraviolet–visible (UV–Vis) sampling were the same as for WSOC detection. The excitation–emission spectra were obtained using a fluorescence spectrophotometer (F-7000, Hitachi, Japan), and UV–Vis spectra were obtained using an ultraviolet spectrophotometer (UV-2401PC, Shimadzu, Japan). Briefly, the wavelength ranges were 200–400 nm for excitation and 250–500 nm for emission with a 5 nm interval for fluorescence spectroscopy (Qin et al., 2018). UV–Vis was measured between 200 and 500 nm with a 5 nm interval. All EEM data in the present study are in Raman units (RU). The background signals, interfering signals (first- and second-order Rayleigh and Raman scatterings), and the inner-filter effects were removed by subtracting a blank EEM spectrum, replacing Rayleigh scatters with a band of missing values, and inserting a triangular set of zeros in the “emission far below excitation” area (Bahram et al., 2006). Data correction and standardization followed the procedures described in Xiao et al. (2016). As shown in Fig. 2, the EEM spectra were partitioned into five regions (Birdwell and Engel, 2010), and the fluorescence regional integration (FRI) method was applied to examine the fluorescence intensities of the accordant regions with respect to the total fluorescence intensity. The specific fluorescence intensity (SFI) was the fluorescence intensity divided by the WSOC concentrations.
2.4 Data analysis
2.4.1 Fluorescence indices
Fluorescence indices based on intensity ratios may provide clues about the condensation state of WSOCs. The humification index (HIX) was used to reflect the degree of humification (Kalbitz et al., 2000; Coble, 2014):
Fluorescence is the light emission of a substance that has absorbed light or other electromagnetic radiation. The energy loss from fluorophore relaxation is expressed as the Stokes shift (SS), which was described in Xiao et al. (2019). In brief, the SS is calculated according to Eq. (2) below, where λEx is the excitation wavelength and λEm is the emission wavelength. The harmonic mean of the Ex/Em wavelength (WH) in Eq. (3) could represent the average energy level of excited states. Thus, the SS and WH of each fluorescence intensity could be identified in an EEM spectrum.
2.4.2 PARAFAC
The PARAFAC model can decompose complex EEM spectra into several main components using a statistical method. The excitation spectrum, emission spectrum, and scores of each component are as follows:
where x represents the fluorescence intensity; f is the number of components resolved by PARAFAC; a is proportional to the concentration of the fth component; b and c are the scaled estimation of the emission and excitation spectra; the subscript i is the sample number; and j and k represent the emission and excitation wavelength, respectively. Before performing PARAFAC, all EEM data were normalized to unit norm to reduce concentration-related collinearity and avoid extremely different leverages (Wang et al., 2020). The Tucker congruence coefficient (TCC) was determined for each excitation spectrum and emission spectrum, and a threshold of 0.95 was applied to confirm the spectral congruence. The model was determined by half-split validation.
2.4.3 Grey relational analysis
Grey relational analysis is part of the grey system theory proposed by Deng (1982), which can be used to describe the relative changes among factors in a system whose information is partly known (this system is defined as a grey system). Grey relational analysis is suitable for solving complicated problems with interrelationships between multiple factors and variables (Morán et al., 2006). It has also been used for solving environmental issues (Kuo et al., 2008; Xu et al., 2011; You et al., 2017). In the present study, atmospheric particles can be treated as a grey system, due to their high complexity and indeterminacy; thus, the grey relational analysis can be employed. The grey relational degree (GRD) is the result of grey relational analysis, and the detailed calculation of this parameter is outlined in the Supplement. Generally, a reference line and one or a series of comparison sequences are selected to calculate the GRD; the results are evaluated on a scale from 0 to 1, with high values indicating a closer compactness degree of the reference line and comparison line.
Here, two sets of GRD values were obtained from WSOC concentrations and previously calculated fluorescence indices for each season. Firstly, considering the evolution of particle size as a changing system, larger particles might come from the accumulation and transformation of smaller particles, especially for ultrafine particles. By setting the data from all particles < 0.26 µm (factors like WSOC concentrations, the average fluorescence intensity – AFI, or UV) as the reference sequence and corresponding factors for particles larger than 0.26 µm as comparison sequences for each season, their affinities were analyzed. Secondly, because only a part of WSOCs is fluorescent, by setting the WSOC concentrations of all samples as a reference sequence and their AFI (or UV) as a comparison sequence, the GRD between WSOCs and the AFI was calculated.
3.1 Chemical compounds of size-segregated particles
Table 1 shows the size-segregated mass concentrations of WSINs, WSOCs, and OC as well as their ratios generated from the data collected at a rural site in Beijing during winter and summer. WSOCs showed a monomodal distribution in winter and a bimodal distribution in summer, with a dominant mode between 0.26 and 0.44 µm in both seasons and a small secondary mode in particles larger than 1 µm in summer, indicating that carbonaceous species were mainly rich in fine particles (Huang et al., 2020). Contemporary reports by other researchers have observed a bimodal distribution in WSOCs, with peaks located at 0.8 and 7 µm, respectively, in Shenzhen, China, and at 0.4–0.5 and 2–3 µm, respectively, in Gwangju, Korea (Yu et al., 2016; Huang et al., 2020).
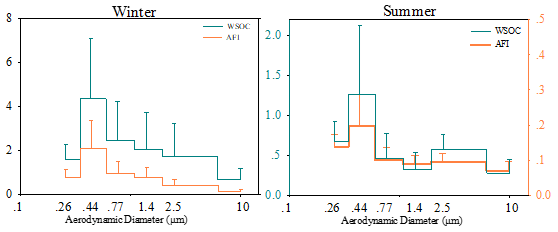
Figure 3Size distributions of WSOCs and the AFI in winter and summer. The AFI is in Raman units.
The ratios were 0.24–0.56 in winter and 0.16–0.31 in summer. These values were smaller than those previously reported for a polluted period in Beijing and in other cities in China (Tian et al., 2014; Wu et al., 2020). Earlier studies have suggested higher ratios in summer than in winter (Xiang et al., 2017; Qin et al., 2018), which is in contrast with the results of the present study. Contrasting seasonal patterns in ratios have also been reported between urban and rural sites in Georgia, USA (Zhang et al., 2012), which seems to support our results presented above. In this work, the ratios were higher in particles with an aerodynamic diameter smaller than 1.4 µm compared with the coarse mode (PM2.5–10), which is accordant with findings previously reported for clear days in Beijing (Tian et al., 2016).
3.2 Excitation–emission spectra of size-segregated WSOCs
The size-segregated EEM spectra of winter and summer WSOCs are depicted in Fig. 2a and b, respectively, and their specific fluorescence intensities (SFIs) per unit WSOC are shown in Fig. 2c and d, respectively. The overall fluorescence peaks were mainly produced among regions II–V, and the peaks were peak A, peak T, and peak M, which could be categorized as humic-like, tyrosine-like, and oxygenated organic substances, respectively (Qin et al., 2018). The fluorophores first increased with increasing particle size, reached their highest intensities at particle sizes of 0.26–0.44 µm, and then decreased with increasing particle size in both seasons. Although the fluorescence peaks of WSOCs were mainly produced in similar regions between the two seasons, the relative abundance was different (more quantitative analysis below). The aggregated fluorescence spectra of all size-segregated samples resembled the spectra of total suspended particles (TSP) and PM2.5, shown in Fig. S1 in the Supplement, with some subtle nuance in border shape (Chen et al., 2016a; Qin et al., 2018).
The detailed characteristics of the fluorescence spectra could be found in the SFI spectra. The SFI showed evident differences between fine- and coarse-mode particles in both seasons. The spectra of coarse-mode WSOCs covered a wide range of natural sources (according to our unpublished research), whereas the spectra of fine particles widely overlapped with that of PM2.5 in Fig. S2 in the Supplement (matched with anthropogenic sources and secondary sources from our study), indicating that the sources of WSOCs affected their fluorescence properties. Moreover, the SFI spectra showed a clear blue shift within regions I to III with increasing particle size in winter as well as humble variations in summer.
Figure 3 shows the size distribution of WSOCs and their average fluorescence intensity (AFI) in the two seasons. The AFI showed a monomodal distribution with a peak at a particle size of between 0.26 and 0.44 µm in winter as well as a bimodal distribution in summer, which was accordant with the size distribution of WSOCs. ratios could represent the overall average fluorescence density of WSOCs (Xiao et al., 2016). The ratios ranged from 0.22 to 0.57 in winter and from 0.18 to 0.34 in summer. These values were higher than that in the industrial city of Lanzhou (Qin et al., 2018). Our unpublished research found that the ratios were lower than 0.2 for anthropogenic source samples.
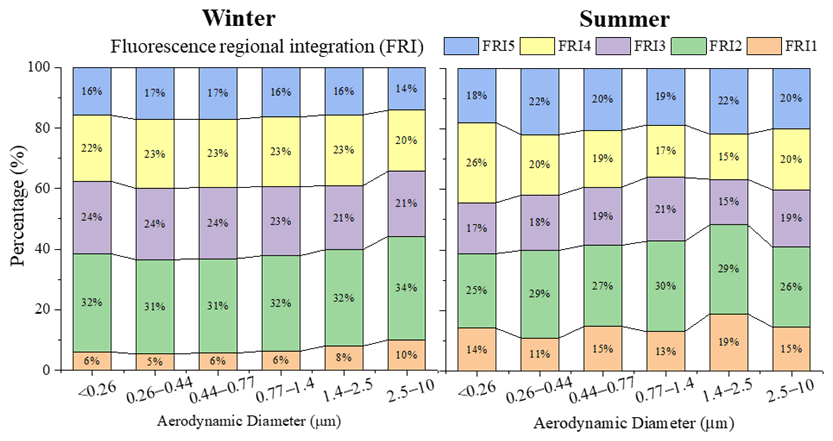
Figure 4The size distribution of the fluorescence regional integration (FRI) for winter and summer. FRI1 to FRI5 are the FRI values of fluorescence regions I to V, respectively.
The fluorescence regional integration (FRI) was calculated to quantify the relative strength of the fluorescence intensity in regions I to V, represented by FRI1 to FRI5, respectively (Fig. 4). FRI I and FRI II (protein-like species) increased with increasing particle size and peaked at the coarse mode in winter. FRI III and FRI V (HULIS) were mainly abundant in fine particles. FRI IV (microbial-related species) showed little variation in the particle size range from 0.26 to 2.5 µm but decreased with particle size from 2.5 to 10 µm. In summer, the sum of FRI I–FRI III increased with increasing particle size, peaked at 1.4 µm, and decreased with particle size from 1.4 to 10 µm. FRI IV showed the inverse: decreased with particle size in the range from 0.26 to 1.4 µm and increased with particle size in the size range from 1.4 to 10 µm. FRI V did not show a clear tendency, but these species displayed high abundance from 0.26 to 0.44 µm and 0.77 to 1.4 µm.
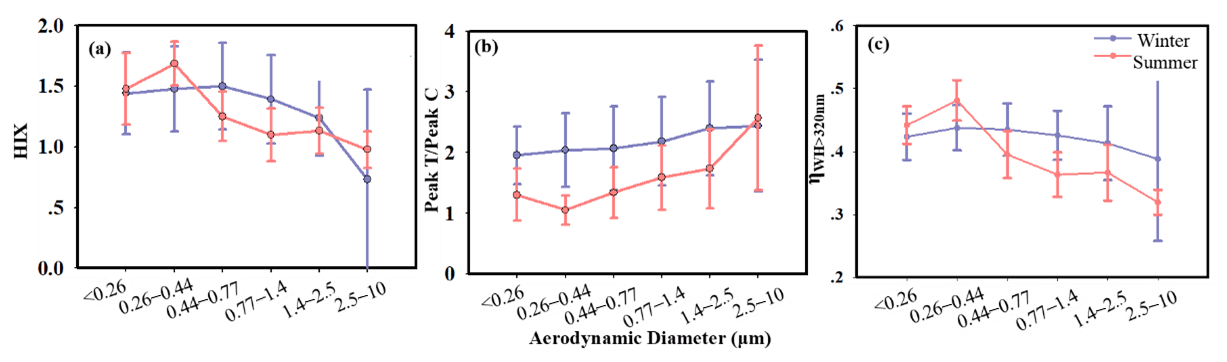
Figure 5The humidification index (HIX) and the ratio served as indictors of the humification degree and the possibility of the biodegradation of WSOCs. Panel (a) shows the HIX for different particle sizes, with a large HIX value indicating a high humification degree or high aromaticity for fluorescent organics. Panel (b) shows the ratios for different particle sizes, with a large value indicating more microbial metabolites in the fluorescent organics. Panel (c) shows the size distributions of ηWH>320 for the winter and summer samples, respectively.
3.3 Fluorescence indices and properties associated with fluorescence mechanisms
Inclusive information was stored in fluorescence spectra, with some regularities being extracted by dividing fluorescence intensities between wavelengths. The humification index (HIX) represents the humification degree or aromaticity of fluorescent organics. , the ratio between tryptophan and humics, can reflect the biodegradability of organics. Some other fluorescence indices are listed in Table S1 in the Supplement. Figure 5 shows the size distribution of the HIX and ratio. The HIX showed a monomodal distribution, peaking between 0.26 and 0.44 µm in summer and between 0.44 and 0.77 µm in winter, indicating that the aromaticity of size-segregated WSOCs initially increased and then decreased with increasing particle size. The ratio increased gradually with increasing particle size in winter, whereas it first decreased in fine particles and then increased with particle size in summer. peaked in the coarse mode in both seasons, indicating that fluorescent microbial-related species likely existed on large atmospheric particles. It was reported that biogenic oxygenated organics are more inclined to adhere to coarse-mode particles (Huang et al., 2020).
The Stokes shift (SS) is the energy loss due to fluorophore relaxation, which might be associated with the π-conjugated system and electron cloud density (Lakowicz, 2006). High SS values indicate greater energy loss due to relaxation in the excited states. Organic compounds with larger π-conjugation scales possibly exhibit a high fluorescence intensity in the high SS region (Xiao et al., 2020). Xiao et al. (2019) found that a SS near 1.2 µm−1 is an important border for hydrophobic and hydrophilic components. Hydrophobic fractions tend to have higher intensity in SS > 1.2, possibly as a result of the large scale of the π-conjugated system. In contrast, hydrophilic fractions usually have ionogenic groups bond with fluorescent aromatics, reducing π-conjugated systems and leading to high fluorescence intensities existing on both sides of a SS of 1.2. Note that the same research also reported that hydrophobic fractions tended to present fluorescence peaks at SS > 1 (Xiao et al., 2016). Thus, the ratios of fluorescence intensity for high SS (> 1.1) values are calculated as follows:
The harmonic mean of the excitation and emission wavelengths (WH) reflects the average energy level of the excited states. In a large π-conjugated system, the electron in the ground state needs relatively low excitation energy to jump to the excited state (Berberan-Santos and Valeur, 2012). The ratios of the fluorescence intensity in the low-energy state (WH > 320) are calculated as follows:
The size-segregated SS, average SS, and ηSS>1.1 are shown in Figs S4 and S5 in the Supplement. The SS values of all particle sizes showed similar distributions, in terms of the consistency of the fluorescence energy for WSOCs. The intensities for SS < 1.1 were of the same level as those for SS > 1.1, indicating the predominance of hydrophilic fluorescent contents in WSOCs. The average SS showed unobtrusive variations with increasing particle size in both seasons, and ηSS>1.1 was slightly higher for particle sizes < 1.4 µm compared with other particle sizes in winter. ηWH>320 tended to increase from a particle size of 0.26 to 0.44 µm and then decrease afterwards in both winter and summer (Fig. 5c), indicating the existence of a large-scale π-conjugated system or high π-electron density around 0.44 µm, and then decreased with particle size from 0.44 to 10 µm.
3.4 Fluorophores revealed by the classification of PARAFAC results
PARAFAC is a mathematical method capable of separating chemically independent but spectrally overlapping fluorescence components, based on the assumption that EEM spectra are independent, linearly related, and additive (Murphy et al., 2011). Several prior studies have been carried out using the PARAFAC method to investigate fluorescent WSOCs in atmospheric aerosols (Pohlker et al., 2012; Chen et al., 2019; Yue et al., 2019). The results have shown that bioaerosols exhibited high bimodal signals at an excitation wavelength of 275 nm and at an emission wavelength of 320 nm, which is classified as protein-like organic matter. In a typical coal-burning city in China, fluorophores emerging at excitation wavelength between 230 and 250 nm and an emission wavelength between 380 and 410 nm were associated with humic-like substances with a high molecular weight.
The present study conducted PARAFAC analysis for winter and summer samples separately to reveal seasonally dependent fluorescence spectra. Three components (C) were extracted from winter spectra: C1, defined as HULIS-1; C2, representing a protein-like component; and C3, defined as HULIS-2 (Chen et al., 2016b). However, only two recognizable components were identified in summer: C1, characterized as HULIS-1, and C2, characterized as protein-like components. Component C3 in the summer EEM spectra was of no physical significance (multiple emission peak points at one single excitation wavelength) and was characterized as a noise signal.
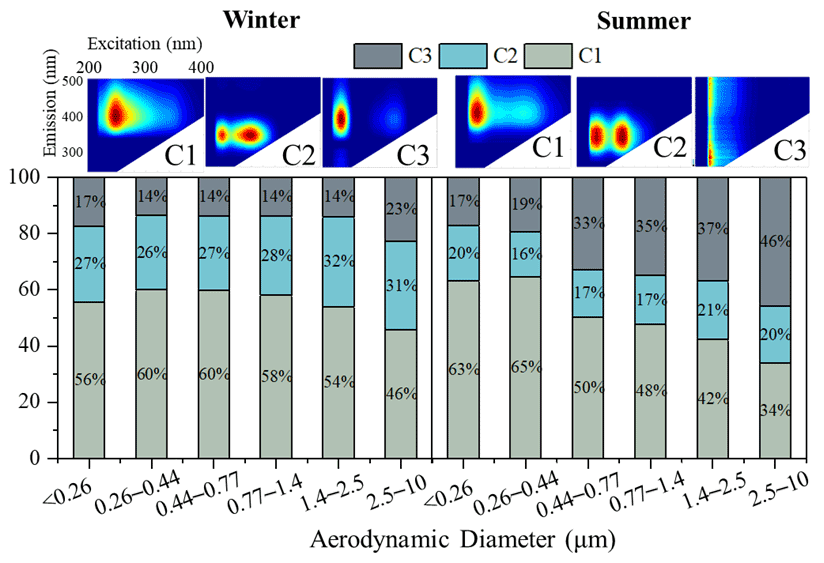
Figure 6PARAFAC results of EEM in winter and summer, respectively. Three components were extracted for both seasons, and the proportions of each component for different particle sizes are also shown.
The proportions of the extracted components are shown in Fig. 6 along with the PARAFAC results. Protein-like compounds were more abundant in particles larger than 2.5 µm in both seasons (37 %–40 % in winter and 20 %–21 % in summer), and HULIS showed higher fractions in fine-mode than coarse-mode particles in both seasons. This quantitatively demonstrated that microbial-related WSOCs more likely existed in large particles and that HULIS was rich in fine particles. The ratios of HULIS-1 HULIS-2 in winter were higher in fine particles with an aerodynamic diameter of 0.44–2.5 µm than in ultrafine particles (< 0.26 µm) or coarse-mode particles. HULIS-2 was likely freshly emitted fluorescent WSOCs, and HULIS-1 exhibited fluorescence characteristics of oxidized HULIS (Vione et al., 2019). The low HULIS-1 HULIS-2 ratios in ultrafine and coarse-mode particles might be due to abundant sources of freshly emitted WSOCs.
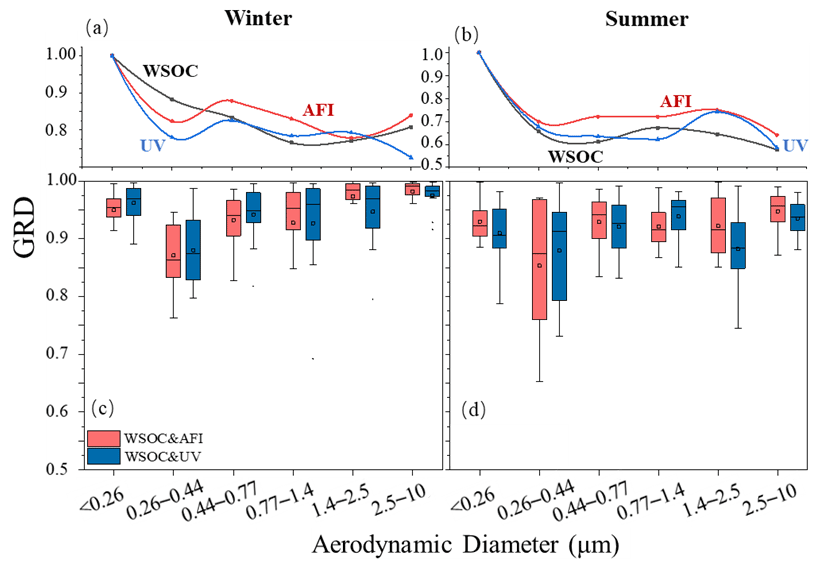
Figure 7The GRD of size-segregated WSOCs, AFI, and average UV: (a, b) the GRD calculated by the WSOCs, AFI, and average UV of each sample, setting data < 0.26 µm as a reference, GRD (< 0.26) = 1; (c, d) the GRD between the WSOCs and the light absorption indices, setting WSOCs as a reference.
3.5 Specific relations among size-segregated WSOCs and fluorescence properties weighted by GRD
A high GRD represents a strong connection between the reference and comparison factors. By setting the WSOCs (or AFI and UV) of particles < 0.26 µm as a reference and using those of larger particles for comparisons, the relations among particle sizes can be depicted by the GRD of size-segregated WSOCs (or AFI and UV), as shown in Fig. 7a for winter samples and in Fig. 7b for summer samples. In winter, GRD0.44–GRD2.5 showed a downward tendency, varying from 0.88 to 0.76 for WSOCs and from 0.88 to 0.78 for the AFI, indicating that the WSOC concentration and the AFI gradually deviate from their original situation with increasing particle size. In summer, GRD0.44–GRD2.5 showed little variation, with average values of 0.64 for WSOCs and 0.73 for the AFI, but decreased in GRD10, indicating that WSOCs in particles larger than 0.26 µm had little inheritance from the primal fine particle.
The relations of WSOCs with the AFI and average UV (referred to as UV below) of different particles are shown in Fig. 7c and d for winter and summer, respectively. The AFI and UV showed a high GRD in both seasons for all particle sizes (with an average GRD > 0.9), indicating that the fluorescence intensity and light absorption were closely connected with the WSOC concentration. However, clear variations in the GRD were observed with increasing particle size, with contrasting patterns to those of fluorescence indices. Thus, it was speculated that these variations resulted from the secondary transformation of WSOCs, as indicated by the fluorescence indices. Moreover, the GRD was strongly negatively correlated with the estimated secondary organic carbon (SOC) concentration, with a correlation efficient r of −0.64 (p < 0.000) in winter and −0.63 in summer. The lowest GRD was found for particle sizes of 0.26–0.44 µm. The high AFI, large π-conjugation scale, rich HULIS, and low GRD in this particle size range indicated that the fluorescent WSOCs of these particles were highly affected by secondary processes. Thus, the GRD between WSOCs and AFI could serve as an indicator of secondary formation.
By characteristically analyzing the fluorescence properties of size-segregated WSOCs, we have gained a better understanding of the hidden relations between fluorescence and the WSOC concentration, the possible evolution of fluorescence properties during particle size growth, and the source distinction of fluorescent WSOCs between fine and coarse particles.
Accordant with earlier reports, the fluorescence intensities were positively correlated with WSOC concentrations in both winter and summer (Spearman's r > 0.8, p < 0.001) (Qin et al., 2018; Chen et al., 2019). The size distributions of the AFI remained in step with those of the WSOC concentrations and showed monomodal distributions in winter and bimodal distributions in summer, peaking at particle sizes between 0.26 and 0.44 µm (Fig. 2a, b). The EEM spectra of size-segregated WSOCs were mainly exhibited in regions II–V and underwent a blue shift with increasing particle size (0.44 to 10 µm).
The SFI spectra (fluorescence intensity per unit WSOC) showed different properties in different seasons or particle sizes. The size-segregated ratios were relatively high in fine particles with sizes between 0.26 and 1.4 µm (mainly affected by anthropogenic sources and secondary process) and low in large particles (PM2.5), but all ratios were higher than those of source samples. Freshly emitted WSOCs from the source sample contained more unsaturated groups like aromatics and had lower ratio than aged WSOCs (Zhang et al., 2018; Cai et al., 2020). Substitution and oxidation reactions of ambient organics might widen the delocalization of π electronics and reduce the excitation energy, thereby resulting in a red shift of fluorescence spectra (Kalberer et al., 2004). The specific fluorescence area was widened in the ambient sample and, thus, had a higher ratio when WSOC concentrations were at a comparable level. The continuous oxidation of organics may break up the π system of organics and extinct fluorescence (Zanca et al., 2017). It could be inferred that ambient WSOCs tended to exhibit higher ratios, whereas both freshly emitted WSOCs and completely oxidized WSOCs could lead to lower values.
The fluorescence indices showed clear particle-size-dependent changes and vague seasonal variations. The same tendencies (i.e., increased first, peaked in the particle size between 0.22 and 0.44 µm, and then decreased with particle size) were observed in the fluorescence indices of HIX and ηWH>320, indicating that the π-conjugated system of WSOCs increased and then decreased with particle size. Moreover, in the EEM spectra, peak M was strong in particle sizes lower than 0.77 µm and bleached in larger particles, and peak A underwent a blue shift with increasing particle size. Contemporary research also found that aromatic secondary organic aerosol increased during the haze period (Yu et al., 2019). Furthermore, it was noticed that the HIX and showed similar size distributions except for the larger peak particle size of values compared with the HIX. Because fine particles with relatively large sizes could exist for a long time in the atmospheric environment, the ratios increase gradually; however, the oxidation process could also cause fluorescence quenching and lead to a decrease in the HIX (Vione et al., 2019). Thus, the HIX peaked at a smaller particle size compared with .
All of the evidence on fluorescence spectra and indices discussed above suggests that aging WSOCs might have experienced evolutionary processes during particle size change. During the particle size increase process, fluorescence and π-conjugated system increased and peaked between 0.22 and 0.44 µm, and peak M sparkled. Two possible mechanisms were proposed to explain this phenomenon. The first one was that the heterogeneous polymerization of gas- and liquid-phase organics enlarged the delocalization of π electrons and led to the increase in fluorescence (Kalberer et al., 2004). De Laurentiis et al. (2013) found that the triplet state of 1-nitronaphthalene directly reacted with phenol and formed biopolymer transformation intermediates in the liquid phase and that the fluorescence spectra shifted to peak M during irradiation. The second mechanism was that oxygen heteroatomic rings formed or chromophoric groups like –NO2 and –OH added to the fluorescent organics during the oxidation processes of organics in small particles; both of these processes could increase the π-conjugated system. Lee et al. (2014) observed that the fluorescence intensity of secondary organic aerosol produced by the high-NOx photooxidation of naphthalene (NAP SOA) increased when they were solar irradiated. During the particle size decrease process, fluorescence decreased with increasing particle size and peak M dribbled away. This might be because further oxidation process gradually broke up the aromatic rings or unsaturated bonds in organic matter, and fluorescence quenched. Laboratory results also confirmed that the fluorescence intensity of fluorescent organics eventually decreased following a long period of irradiation (De Laurentiis et al., 2013, Lee et al., 2014).
PARAFAC results showed that HULIS was rich in fine particles and that protein-like compounds were rich in coarse particles in both seasons, which is accordant with earlier reports (Chen et al., 2019; Huang et al., 2020). In winter, the wavelength of HULIS-1 was slightly higher than that of HULIS-2. The EEM spectra of HULIS-1 observed in the present study were similar to the PARAFAC results for highly oxygenated species, whereas those of HULIS-2 were similar to the less-oxygenated species reported in Chen et al. (2016b) for chromophoric WSOCs. Only HULIS-1 was distinguished in summer in the present study, which could be allocated to highly oxygenated species.
The particle-size-dependent variations in HULIS-1 reflected that the contents of the highly oxygenated species in WSOCs increased first, peaked between 0.26 and 0.44 µm, and then decreased with particle size, which cogently confirmed the size-dependent chemical composition of WSOCs. Such a finding is consistent with the trend in the ratio in size-resolved samples in Shenzhen in winter (Huang et al., 2020). The variations in HULIS-1 further suggested that secondary processes were active during the particle formation process, which confirmed that the GRD value can be applied as an indicator of the aging state of WSOCs.
In this study, a six-stage micro-orifice uniform deposit impactor (MOUDI) sampler was adopted to collected size-segregated samples of aerosol particles in a rural site in Beijing. The WSOC concentrations, UV absorption, fluorescence properties, and the energy information of fluorophores of different particle sizes were analyzed. The PARAFAC method was used to decompose the mixture of fluorophores. The connections between WSOCs and the AFI of different particles were analyzed using the grey relational degree (GRD). WSOCs and the AFI showed monomodal distributions in winter and bimodal distributions in summer. The fluorescence efficiency () was higher in winter than in summer and higher for particle sizes < 1.4 µm than for larger particles. The variations in the fluorescence indices – the HIX and the ratio – and the ηWH>320 indicated that the aromaticity or π-conjugated systems of WSOCs increased in ultrafine particles (< 0.44 µm) and decreased with increasing particle size. The PARAFAC results showed that HULIS was rich in fine-mode particles and that protein-like sources were rich in large particles. The GRD results suggested that fluorescent WSOCs in particle sizes between 0.26 and 0.44 µm were highly affected by secondary sources.
The SFI spectra of coarse-mode WSOCs were relatively stable and could serve as a reference for identifying natural sources of WSOCs. The ratio in ambient WSOCs showed vast distinction from that of the source samples, and it could be used as a potential indicator of the oxidation degree of secondary WSOCs. More research on the ratio is recommended in order to generate representative values for different sources and transformation processes.
The particle-size-dependent variations in the fluorescence characteristics suggest the potential for the application of the fluorescence method to investigate the aging processes of WSOCs. Along with the fluorescence indices, extensive information could be gleaned from a fluorescence spectrum, including the fluorescence intensities, the humification degree, the energy state, and the sources of WSOCs. If the connections between the fluorescence properties and the chemical structure of organic matter are well understood, it might be possible to only use fluorescence data to understand the oxidation states of organics. The seasonal and particle-size-dependent variations in the fluorescence of WSOCs suggested that the sources and the transformations of anthropogenic sources were quite different in winter and summer and that secondary processes could induce fluorescence variations in WSOCs. Therefore, future research could work to establish the fluorescence characteristics of secondary WSOCs.
The data used in this study are given in the Supplement.
The supplement related to this article is available online at: https://doi.org/10.5194/acp-22-465-2022-supplement.
JT and KX designed the experiments, and JQ and YY carried them out. JQ collected all of the samples. JQ performed the data analysis and index calculations under the supervision of KX. YQ, XinW, and SS provided advice on data analysis and English revisions. XZ, XiaW, KX, and JT provided technical consultation on the article writing. JQ prepared the manuscript with contributions from all co-authors.
The contact author has declared that neither they nor their co-authors have any competing interests.
Publisher's note: Copernicus Publications remains neutral with regard to jurisdictional claims in published maps and institutional affiliations.
This work was supported by the National Natural Science Foundation of China (grant nos. 41675127 and 41475116). We also appreciate the valuable advice from the editor, who greatly improved the paper.
This research has been supported by the National Natural Science Foundation of China (grant nos. 41675127 and 41475116).
This paper was edited by Alex Huffman and reviewed by three anonymous referees.
Almeida, A. S., Ferreira, R. M. P., Silva, A. M. S., Duarte, A. C., Neves, B. M., and Duarte, R.: Structural features and pro-inflammatory effects of water-soluble organic matter in inhalable fine urban air particles, Environ. Sci. Technol., 54, 1082–1091, https://doi.org/10.1021/acs.est.9b04596, 2020.
Andrade-Eiroa, Á., Canle, M., and Cerdá, V.: Environmental applications of excitation-emission spectrofluorimetry: An in-depth review I, Appl. Spectrosc. Rev., 48, 1–49, https://doi.org/10.1080/05704928.2012.692104, 2013.
Asa-Awuku, A., Engelhart, G. J., Lee, B. H., Pandis, S. N., and Nenes, A.: Relating CCN activity, volatility, and droplet growth kinetics of β-caryophyllene secondary organic aerosol, Atmos. Chem. Phys., 9, 795–812, https://doi.org/10.5194/acp-9-795-2009, 2009.
Bahram, M., Bro, R., Stedmon, C., and Afkhami, A.: Handling of Rayleigh and Raman scatter for PARAFAC modeling of fluorescence data using interpolation, J. Chemometr., 20, 99–105, https://doi.org/10.1002/cem.978, 2006.
Berberan-Santos, M. N. and Valeur, B.: Molecular fluorescence: Principles and Applications, second edn., Wiley-VCH, Germany, https://doi.org/10.1002/9783527650002.index, 2012.
Birdwell, J. E. and Engel, A. S.: Characterization of dissolved organic matter in cave and spring waters using UV-Vis absorbance and fluorescence spectroscopy, Org. Geochem., 41, 270–280, https://doi.org/10.1016/j.orggeochem.2009.11.002, 2010.
Burnett, R., Chen, H., Szyszkowicz, M., Fann, N., Hubbell, B., Pope, C. A., Apte, J. S., Brauer, M., Cohen, A., Weichenthal, S., Coggins, J., Di, Q., Brunekreef, B., Frostad, J., Lim, S. S., Kan, H., Walker, K. D., Thurston, G. D., Hayes, R. B., Lim, C. C., Turner, M. C., Jerrett, M., Krewski, D., Gapstur, S. M., Diver, W. R., Ostro, B., Goldberg, D., Crouse, D. L., Martin, R. V., Peters, P., Pinault, L., Tjepkema, M., van Donkelaar, A., Villeneuve, P. J., Miller, A. B., Yin, P., Zhou, M., Wang, L., Janssen, N. A. H., Marra, M., Atkinson, R. W., Tsang, H., Quoc Thach, T., Cannon, J. B., Allen, R. T., Hart, J. E., Laden, F., Cesaroni, G., Forastiere, F., Weinmayr, G., Jaensch, A., Nagel, G., Concin, H., and Spadaro, J. V.: Global estimates of mortality associated with long-term exposure to outdoor fine particulate matter, P. Natl. Acad. Sci. USA, 115, 9592, https://doi.org/10.1073/pnas.1803222115, 2018.
Cai, J., Zeng, X., Zhi, G., Gligorovski, S., Sheng, G., Yu, Z., Wang, X., and Peng, P.: Molecular composition and photochemical evolution of water-soluble organic carbon (WSOC) extracted from field biomass burning aerosols using high-resolution mass spectrometry, Atmos. Chem. Phys., 20, 6115–6128, https://doi.org/10.5194/acp-20-6115-2020, 2020.
Chalbot, M. G., Chitranshi, P., da Costa, G. G., Pollock, E., and Kavouras, I. G.: Characterization of water-soluble organic matter in urban aerosol by 1H-NMR spectroscopy, Atmos. Environ., 128, 235–245, https://doi.org/10.1016/j.atmosenv.2015.12.067, 2016.
Chen, Q., Mu, Z., Song, W., Wang, Y., Yang, Z., Zhang, L., and Zhang, Y. L.: Size-resolved characterization of the chromophores in atmospheric particulate matter from a typical coal-burning city in China, J. Geophys. Res.-Atmos, 124, 10546–10563, https://doi.org/10.1029/2019jd031149, 2019.
Chen, Q. C., Ikemori, F., and Mochida, M.: Light absorption and excitation-emission fluorescence of urban organic aerosol components and their relationship to chemical structure, Environ. Sci. Technol., 50, 10859–10868, https://doi.org/10.1021/acs.est.6b02541, 2016a.
Chen, Q. C., Miyazaki, Y., Kawamura, K., Matsumoto, K., Coburn, S., Volkamer, R., Iwamoto, Y., Kagami, S., Deng, Y. G., Ogawa, S., Ramasamy, S., Kato, S., Ida, A., Kajii, Y., and Mochida, M.: Characterization of chromophoric water-soluble organic matter in urban, forest, and marine aerosols by HR-ToF-MS analysis and excitation emission matrix spectroscopy, Environ. Sci. Technol., 50, 10351–10360, https://doi.org/10.1021/acs.est.6b01643, 2016b.
Cheng, Y., He, K. B., Duan, F. K., Zheng, M., Ma, Y. L., and Tan, J. H.: Measurement of semivolatile carbonaceous aerosols and its implications: A review, Environ. Int., 35, 674–681, https://doi.org/10.1016/j.envint.2008.11.007, 2009.
Coble, P.: Aquatic organic matter fluorescence, Cambridge University Press, New York, USA, https://doi.org/10.1017/CBO9781139045452, 2014.
Coble, P. G.: Characterization of marine and terrestrial DOM in seawater using excitation emission matrix spectroscopy, Mar. Chem., 51, 325–346, https://doi.org/10.1016/0304-4203(95)00062-3, 1996.
Dasari, S., Andersson, A., Bikkina, S., Holmstrand, H., Budhavant, K., Satheesh, S., Asmi, E., Kesti, J., Backman, J., Salam, A., Bisht, D. S., Tiwari, S., Hameed, Z., and Gustafsson, Ö.: Photochemical degradation affects the light absorption of water-soluble brown carbon in the South Asian outflow, Sci. Adv., 10, eaau8066, https://doi.org/10.1126/sciadv.aau8066, 2019.
De Laurentiis, E., Sur, B., Pazzi, M., Maurino, V., Minero, C., Mailhot, G., Brigante, M., and Vione, D.: Phenol transformation and dimerisation, photosensitised by the triplet state of 1-nitronaphthalene: A possible pathway to humic-like substances (HULIS) in atmospheric waters, Atmos. Environ., 70, 318–327, https://doi.org/10.1016/j.atmosenv.2013.01.014, 2013.
Decesari, S., Facchini, M. C., Matta, E., Lettini, F., Mircea, M., Fuzzi, S., Tagliavini, E., and Putaud, J. P.: Chemical features and seasonal variation of fine aerosol water-soluble organic compounds in the Po Valley, Italy, Atmos. Environ., 35, 3691–3699, https://doi.org/10.1016/s1352-2310(00)00509-4, 2001.
Deng, J.-L.: Control problems of grey systems, Syst. Control Lett., 1, 288–294, https://doi.org/10.1016/S0167-6911(82)80025-X, 1982.
Deshmukh, D. K., Kawamura, K., and Deb, M. K.: Dicarboxylic acids, omega-oxocarboxylic acids, alpha-dicarbonyls, WSOC, OC, EC, and inorganic ions in wintertime size segregated aerosols from central India: Sources and formation processes, Chemosphere, 161, 27–42, https://doi.org/10.1016/j.chemosphere.2016.06.107, 2016.
Duarte, R., Pio, C. A., and Duarte, A. C.: Synchronous scan and excitation-emission matrix fluorescence spectroscopy of water-soluble organic compounds in atmospheric aerosols, J. Atmos. Chem., 48, 157–171, https://doi.org/10.1023/B:JOCH.0000036845.82039.8c, 2004.
Duarte, R., Santos, E. B. H., Pio, C. A., and Duarte, A. C.: Comparison of structural features of water-soluble organic matter from atmospheric aerosols with those of aquatic humic substances, Atmos. Environ., 41, 8100–8113, https://doi.org/10.1016/j.atmosenv.2007.06.034, 2007.
Duarte, R., Pineiro-Iglesias, M., Lopez-Mahia, P., Muniategui-Lorenzo, S., Moreda-Pineiro, J., Silva, A. M. S., and Duarte, A. C.: Comparative study of atmospheric water-soluble organic aerosols composition in contrasting suburban environments in the Iberian Peninsula Coast, Sci. Total Environ., 648, 430–441, https://doi.org/10.1016/j.scitotenv.2018.08.171, 2019.
Duarte, R. M. B. O., Freire, S. M. S. C., and Duarte, A. C.: Investigating the water-soluble organic functionality of urban aerosols using two-dimensional correlation of solid-state 13C-NMR and FTIR spectral data, Atmos. Environ., 116, 245–252, https://doi.org/10.1016/j.atmosenv.2015.06.043, 2015.
Duarte, R. M. B. O., Duan, P., Mao, J., Chu, W., Duarte, A. C., and Schmidt-Rohr, K.: Exploring water-soluble organic aerosols structures in urban atmosphere using advanced solid-state 13C-NMR spectroscopy, Atmos. Environ., 230, 117503, https://doi.org/10.1016/j.atmosenv.2020.117503, 2020.
Fan, J., Rosenfeld, D., Zhang, Y., Giangrande, S. E., Li, Z., Machado, L. A. T., Martin, S. T., Yang, Y., Wang, J., Artaxo, P., Barbosa, H. M. J., Braga, R. C., Comstock, J. M., Feng, Z., Gao, W., Gomes, H. B., Mei, F., Pöhlker, C., Pöhlker, M. L., Pöschl, U., and de Souza, R. A. F.: Substantial convection and precipitation enhancements by ultrafine aerosol particles, Science, 359, 8, https://doi.org/10.1126/science.aan8461, 2020.
Frka, S., Grgić, I., Turšič, J., Gini, M. I., and Eleftheriadis, K.: Seasonal variability of carbon in humic-like matter of ambient size segregated water-soluble organic aerosols from urban background environment, Atmos. Environ., 173, 239–247, https://doi.org/10.1016/j.atmosenv.2017.11.013, 2018.
Fu, P., Kawamura, K., Chen, J., and Miyazaki, Y.: Secondary production of organic aerosols from biogenic VOCs over Mt. Fuji, Japan, Environ. Sci. Technol., 48, 8491–8497, https://doi.org/10.1021/es500794d, 2014.
Fu, P., Kawamura, K., Chen, J., Qin, M., Ren, L., Sun, Y., Wang, Z., Barrie, L. A., Tachibana, E., Ding, A., and Yamashita, Y.: Fluorescent water-soluble organic aerosols in the High Arctic atmosphere, Sci. Rep.-UK, 5, 9845, https://doi.org/10.1038/srep09845, 2015.
Hecobian, A., Zhang, X., Zheng, M., Frank, N., Edgerton, E. S., and Weber, R. J.: Water-Soluble Organic Aerosol material and the light-absorption characteristics of aqueous extracts measured over the Southeastern United States, Atmos. Chem. Phys., 10, 5965–5977, https://doi.org/10.5194/acp-10-5965-2010, 2010.
Huang, X. F., Dai, J., Zhu, Q., Yu, K., and Du, K.: Abundant biogenic oxygenated organic aerosol in atmospheric coarse particles: plausible sources and atmospheric implications, Environ. Sci. Technol., 54, 1425–1430, https://doi.org/10.1021/acs.est.9b06311, 2020.
Jang, K.-S., Choi, A. Y., Choi, M., Kang, H., Kim, T.-W., and Park, K.-T.: Size segregated chemical compositions of HULISs in ambient aerosols collected during the winter season in Songdo, South Korea, Atmosphere, 10, 226, https://doi.org/10.3390/atmos10040226, 2019.
Johnston, M. V. and Kerecman, D. E.: Molecular Characterization of Atmospheric Organic Aerosol by Mass Spectrometry, Annu. Rev. Anal. Chem., 12, 247–274, https://doi.org/10.1146/annurev-anchem-061516-045135, 2019.
Kalberer, M., Paulsen, D., Sax, M., Steinbacher, M., Dommen, J., Prevot, A. S. H., Fisseha, R., Weingartner, E., Frankevich, V., and Zenobi, R.: Identification of polymers as major components of atmospheric organic aerosols, Science, 303, 1659–1662, https://doi.org/10.1126/science.1092185, 2004.
Kalbitz, K., Geyer, S., and Geyer, W.: A comparative characterization of dissolved organic matter by means of original aqueous samples and isolated humic substances, Chemosphere, 40, 1305–1312, https://doi.org/10.1016/S0045-6535(99)00238-6, 2000.
Kuo, Y., Yang, T., and Huang, G. W.: The use of grey relational analysis in solving multiple attribute decision-making problems, Comput. Ind. Eng., 55, 80–93, https://doi.org/10.1016/j.cie.2007.12.002, 2008.
Lakowicz, J. R.: Principles of Fluorescence Spectroscopy, Springer US, Baltimore, USA, https://doi.org/10.1007/978-0-387-46312-4, 2006.
Lee, H. J., Laskin, A., Laskin, J., and Nizkorodov, S. A.: Excitation-emission spectra and fluorescence quantum yields for fresh and aged biogenic secondary organic aerosols, Environ. Sci. Technol., 47, 5763–5770, https://doi.org/10.1021/es400644c, 2013.
Lee, H. J., Aiona, P. K., Laskin, A., Laskin, J., and Nizkorodov, S. A.: Effect of solar radiation on the optical properties and molecular composition of laboratory proxies of atmospheric brown carbon, Environ. Sci. Technol., 48, 10217–10226, https://doi.org/10.1021/es502515r, 2014.
Liu, J., Bergin, M., Guo, H., King, L., Kotra, N., Edgerton, E., and Weber, R. J.: Size-resolved measurements of brown carbon in water and methanol extracts and estimates of their contribution to ambient fine-particle light absorption, Atmos. Chem. Phys., 13, 12389–12404, https://doi.org/10.5194/acp-13-12389-2013, 2013.
Masalaite, A., Holzinger, R., Ceburnis, D., Remeikis, V., Ulevicius, V., Rockmann, T., and Dusek, U.: Sources and atmospheric processing of size segregated aerosol particles revealed by stable carbon isotope ratios and chemical speciation, Environ. Pollut., 240, 286–296, https://doi.org/10.1016/j.envpol.2018.04.073, 2018.
Mayorga, R. J., Zhao, Z., and Zhang, H.: Formation of secondary organic aerosol from nitrate radical oxidation of phenolic VOCs: Implications for nitration mechanisms and brown carbon formation, Atmos. Environ., 244, 117910, https://doi.org/10.1016/j.atmosenv.2020.117910, 2021.
Morán, J., Granada, E., Míguez, J. L., and Porteiro, J.: Use of grey relational analysis to assess and optimize small biomass boilers, Fuel Process. Technol., 87, 123–127, https://doi.org/10.1016/j.fuproc.2005.08.008, 2006.
Murphy, K. R., Hambly, A., Singh, S., Henderson, R. K., Baker, A., Stuetz, R., and Khan, S. J.: Organic matter fluorescence in municipal water recycling schemes: toward a unified PARAFAC model, Environ. Sci. Technol., 45, 2909–2916, https://doi.org/10.1021/es103015e, 2011.
Park S., Yu, J., Yu, G.-H., and Bae, M.-S.: Chemical and absorption characteristics of water-soluble organic carbon and humic-like substances in size segregated particles from biomass burning emissions, Asian J. Atmos. Environ., 11, 96–106, https://doi.org/10.5572/ajae.2017.11.2.096, 2017.
Pöhlker, C., Huffman, J. A., and Pöschl, U.: Autofluorescence of atmospheric bioaerosols – fluorescent biomolecules and potential interferences, Atmos. Meas. Tech., 5, 37–71, https://doi.org/10.5194/amt-5-37-2012, 2012.
Pósfai, M. and Buseck, P. R.: Nature and climate effects of individual tropospheric aerosol particles, Annu. Rev. Earth. Pl. Sc., 38, 17–43, https://doi.org/10.1146/annurev.earth.031208.100032, 2010.
Qin, J., Zhang, L., Zhou, X., Duan, J., Mu, S., Xiao, K., Hu, J., and Tan, J.: Fluorescence fingerprinting properties for exploring water-soluble organic compounds in PM2.5 in an industrial city of northwest China, Atmos. Environ., 184, 203–211, https://doi.org/10.1016/j.atmosenv.2018.04.049, 2018.
Santos, P. S. M., Duarte, R., and Duarte, A. C.: Absorption and fluorescence properties of rainwater during the cold season at a town in Western Portugal, J. Atmos. Chem., 62, 45–57, https://doi.org/10.1007/s10874-009-9138-1, 2009.
Stark, R. E., Yu, B., Zhong, J., Yan, B., Wu, G., and Tian, S.: Environmental NMR: High-resolution Magic-angle Spinning, eMagRes, 2, 377–388, https://doi.org/10.1002/9780470034590.emrstm1340, 2013.
Tan, J., Xiang, P., Zhou, X., Duan, J., Ma, Y., He, K., Cheng, Y., Yu, J., and Querol, X.: Chemical characterization of humic-like substances (HULIS) in PM2.5 in Lanzhou, China, Sci. Total Environ., 573, 1481–1490, https://doi.org/10.1016/j.scitotenv.2016.08.025, 2016.
Tian, S., Pan, Y., Liu, Z., Wen, T., and Wang, Y.: Size-resolved aerosol chemical analysis of extreme haze pollution events during early 2013 in urban Beijing, China, J. Hazard. Mater., 279, 452–460, https://doi.org/10.1016/j.jhazmat.2014.07.023, 2014.
Tian, S. L., Pan, Y. P., and Wang, Y. S.: Size-resolved source apportionment of particulate matter in urban Beijing during haze and non-haze episodes, Atmos. Chem. Phys., 16, 1–19, https://doi.org/10.5194/acp-16-1-2016, 2016.
Vione, D., Albinet, A., Barsotti, F., Mekic, M., Jiang, B., Minero, C., Brigante, M., and Gligorovski, S.: Formation of substances with humic-like fluorescence properties, upon photoinduced oligomerization of typical phenolic compounds emitted by biomass burning, Atmos. Environ., 206, 197–207, https://doi.org/10.1016/j.atmosenv.2019.03.005, 2019.
Voliotis, A., Prokeš, R., Lammel, G., and Samara, C.: New insights on humic-like substances associated with wintertime urban aerosols from central and southern Europe: Size-resolved chemical characterization and optical properties, Atmos. Environ., 166, 286–299, https://doi.org/10.1016/j.atmosenv.2017.07.024, 2017.
Wang, H., Zhang, L., Huo, T., Wang, B., Yang, F., Chen, Y., Tian, M., Qiao, B., and Peng, C.: Application of parallel factor analysis model to decompose excitation-emission matrix fluorescence spectra for characterizing sources of water-soluble brown carbon in PM2.5, Atmos. Environ., 223, 117–192, https://doi.org/10.1016/j.atmosenv.2019.117192, 2020.
Wu, C., Wang, G., Li, J., Li, J., Cao, C., Ge, S., Xie, Y., Chen, J., Li, X., Xue, G., Wang, X., Zhao, Z., and Cao, F.: The characteristics of atmospheric brown carbon in Xi'an, inland China: sources, size distributions and optical properties, Atmos. Chem. Phys., 20, 2017–2030, https://doi.org/10.5194/acp-20-2017-2020, 2020.
Xiang, P., Zhou, X. M., Duan, J. C., Tan, J. H., He, K. B., Yuan, C., Ma, Y. L., and Zhang, Y. X.: Chemical characteristics of water-soluble organic compounds (WSOC) in PM2.5 in Beijing, China: 2011–2012, Atmos. Res., 183, 104–112, https://doi.org/10.1016/j.atmosres.2016.08.020, 2017.
Xiao, K., Sun, J.-Y., Shen, Y.-X., Liang, S., Liang, P., Wang, X.-M., and Huang, X.: Fluorescence properties of dissolved organic matter as a function of hydrophobicity and molecular weight: case studies from two membrane bioreactors and an oxidation ditch, RSC Adv., 6, 24050–24059, https://doi.org/10.1039/C5RA23167A, 2016.
Xiao, K., Shen, Y., Liang, S., Tan, J., Wang, X., Liang, P., and Huang, X.: Characteristic regions of the fluorescence excitation-emission matrix (EEM) to identify hydrophobic/hydrophilic contents of organic matter in membrane bioreactors, Environ. Sci. Technol., 52, 11251–11258, https://doi.org/10.1021/acs.est.8b02684, 2018.
Xiao, K., Han, B., Sun, J., Tan, J., Yu, J., Liang, S., Shen, Y., and Huang, X.: Stokes shift and specific fluorescence as potential indicators of organic matter hydrophobicity and molecular weight in membrane bioreactors, Environ. Sci. Technol., 53, 8985–8993, https://doi.org/10.1021/acs.est.9b02114, 2019.
Xiao, K., Yu, J., Wang, S., Du, J., Tan, J., Xue, K., Wang, Y., and Huang, X.: Relationship between fluorescence excitation-emission matrix properties and the relative degree of DOM hydrophobicity in wastewater treatment effluents, Chemosphere, 254, 126830, https://doi.org/10.1016/j.chemosphere.2020.126830, 2020.
Xu, J. A., Sheng, G. P., Luo, H. W., Fang, F., Li, W. W., Zeng, R. J., Tong, Z. H., and Yu, H. Q.: Evaluating the influence of process parameters on soluble microbial products formation using response surface methodology coupled with grey relational analysis, Water Res., 45, 674–680, https://doi.org/10.1016/j.watres.2010.08.032, 2011.
Yan, C., Nie, W., Vogel, A. L., Dada, L., Lehtipalo, K., Stolzenburg, D., Wagner, R., Rissanen, M. P., Xiao, M., Ahonen, L., Fischer, L., Rose, C., Bianchi, F., Gordon, H., Simon, M., Heinritzi, M., Garmash, O., Roldin, P., Dias, A., Ye, P., Hofbauer, V., Amorim, A., Bauer, P. S., Bergen, A., Bernhammer, A.-K., Breitenlechner, M., Brilke, S., Buchholz, A., Mazon, S. B., Canagaratna, M. R., Chen, X., Ding, A., Dommen, J., Draper, D. C., Duplissy, J., Frege, C., Heyn, C., Guida, R., Hakala, J., Heikkinen, L., Hoyle, C. R., Jokinen, T., Kangasluoma, J., Kirkby, J., Kontkanen, J., Kürten, A., Lawler, M. J., Mai, H., Mathot, S., Mauldin, R. L., Molteni, U., Nichman, L., Nieminen, T., Nowak, J., Ojdanic, A., Onnela, A., Pajunoja, A., Petäjä, T., Piel, F., Quéléver, L. L. J., Sarnela, N., Schallhart, S., Sengupta, K., Sipilä, M., Tomé, A., Tröstl, J., Väisänen, O., Wagner, A. C., Ylisirniö, A., Zha, Q., Baltensperger, U., Carslaw, K. S., Curtius, J., Flagan, R. C., Hansel, A., Riipinen, I., Smith, J. N., Virtanen, A., Winkler, P. M., Donahue, N. M., Kerminen, V.-M., Kulmala, M., Ehn, M., and Worsnop, D. R.: Size-dependent influence of NOx on the growth rates of organic aerosol particles, Sci. Adv., 6, eaay4945, https://doi.org/10.1126/sciadv.aay4945, 2020.
You, M. L., Shu, C. M., Chen, W. T., and Shyu, M. L.: Analysis of cardinal grey relational grade and grey entropy on achievement of air pollution reduction by evaluating air quality trend in Japan, J. Clean. Prod., 142, 3883–3889, https://doi.org/10.1016/j.jclepro.2016.10.072, 2017.
Yu, G. H., Park, S., and Lee, K. H.: Source contributions and potential source regions of size-resolved water-soluble organic carbon measured at an urban site over one year, Environ. Sci.-Proc. Imp., 18, 1343–1358, https://doi.org/10.1039/c6em00416d, 2016.
Yu, J. Z., Yang, H., Zhang, H. Y., and Lau, A. K. H.: Size distributions of water-soluble organic carbon in ambient aerosols and its size-resolved thermal characteristics, Atmos. Environ., 38, 1061–1071, https://doi.org/10.1016/j.atmosenv.2003.10.049, 2004.
Yu, Q., Chen, J., Qin, W., Cheng, S., Zhang, Y., Ahmad, M., and Ouyang, W.: Characteristics and secondary formation of water-soluble organic acids in PM1, PM2.5 and PM10 in Beijing during haze episodes, Sci. Total. Environ., 669, 175–184, https://doi.org/10.1016/j.scitotenv.2019.03.131, 2019.
Yue, S., Ren, L., Song, T., Li, L., Xie, Q., Li, W., Kang, M., Zhao, W., Wei, L., Ren, H., Sun, Y., Wang, Z., Ellam, R. M., Liu, C. Q., Kawamura, K., and Fu, P.: Abundance and Diurnal Trends of Fluorescent Bioaerosols in the Troposphere over Mt. Tai, China, in Spring, J. Geophys. Res.-Atmos., 124, 4158–4173, https://doi.org/10.1029/2018jd029486, 2019.
Zanca, N., Lambe, A. T., Massoli, P., Paglione, M., Croasdale, D. R., Parmar, Y., Tagliavini, E., Gilardoni, S., and Decesari, S.: Characterizing source fingerprints and ageing processes in laboratory-generated secondary organic aerosols using proton-nuclear magnetic resonance (1H-NMR) analysis and HPLC HULIS determination, Atmos. Chem. Phys., 17, 10405–10421, https://doi.org/10.5194/acp-17-10405-2017, 2017.
Zhang, X., Liu, Z., Hecobian, A., Zheng, M., Frank, N. H., Edgerton, E. S., and Weber, R. J.: Spatial and seasonal variations of fine particle water-soluble organic carbon (WSOC) over the southeastern United States: implications for secondary organic aerosol formation, Atmos. Chem. Phys., 12, 6593–6607, https://doi.org/10.5194/acp-12-6593-2012, 2012.
Zhang, X., Xu, J., Kang, S., Liu, Y., and Zhang, Q.: Chemical characterization of long-range transport biomass burning emissions to the Himalayas: insights from high-resolution aerosol mass spectrometry, Atmos. Chem. Phys., 18, 4617–4638, https://doi.org/10.5194/acp-18-4617-2018, 2018.
Zhao, W., Fu, P., Yue, S., Li, L., Xie, Q., Zhu, C., Wei, L., Ren, H., Li, P., Li, W., Sun, Y., Wang, Z., Kawamura, K., and Chen, J.: Excitation-emission matrix fluorescence, molecular characterization and compound-specific stable carbon isotopic composition of dissolved organic matter in cloud water over Mt. Tai, Atmos. Environ., 213, 608–619, https://doi.org/10.1016/j.atmosenv.2019.06.034, 2019.