the Creative Commons Attribution 4.0 License.
the Creative Commons Attribution 4.0 License.
 | 01 Apr 2022
Photochemical evolution of the 2013 California Rim Fire: synergistic impacts of reactive hydrocarbons and enhanced oxidants
Thomas F. Hanisco
Heather L. Arkinson
Donald R. Blake
Armin Wisthaler
Tomas Mikoviny
Thomas B. Ryerson
Ilana Pollack
Jeff Peischl
Paul O. Wennberg
John D. Crounse
Jason M. St. Clair
Alex Teng
L. Gregory Huey
Xiaoxi Liu
Alan Fried
Petter Weibring
Dirk Richter
James Walega
Samuel R. Hall
Kirk Ullmann
Jose L. Jimenez
Pedro Campuzano-Jost
T. Paul Bui
Glenn Diskin
James R. Podolske
Glen Sachse
Ronald C. Cohen
Large wildfires influence regional atmospheric composition, but chemical complexity challenges model predictions of downwind impacts. Here, we elucidate key connections within gas-phase photochemistry and assess novel chemical processes via a case study of the 2013 California Rim Fire plume. Airborne in situ observations, acquired during the NASA Studies of Emissions, Atmospheric Composition, Clouds and Climate Coupling by Regional Surveys (SEAC4RS) mission, illustrate the evolution of volatile organic compounds (VOCs), oxidants, and reactive nitrogen over 12 h of atmospheric aging. Measurements show rapid formation of ozone and peroxyacyl nitrates (PNs), sustained peroxide production, and prolonged enhancements in oxygenated VOCs and nitrogen oxides (NOx).
Observations and Lagrangian trajectories constrain a 0-D puff model that approximates plume photochemical history and provides a framework for evaluating process interactions. Simulations examine the effects of (1) previously unmeasured reactive VOCs identified in recent laboratory studies and (2) emissions and secondary production of nitrous acid (HONO). Inclusion of estimated unmeasured VOCs leads to a 250 % increase in OH reactivity and a 70 % increase in radical production via oxygenated VOC photolysis. HONO amplifies radical cycling and serves as a downwind NOx source, although impacts depend on how HONO is introduced. The addition of initial HONO (representing primary emissions) or particulate nitrate photolysis amplifies ozone production, while heterogeneous conversion of NO2 suppresses ozone formation. Analysis of radical initiation rates suggests that oxygenated VOC photolysis is a major radical source, exceeding HONO photolysis when averaged over the first 2 h of aging. Ozone production chemistry transitions from VOC sensitive to NOx sensitive within the first hour of plume aging, with both peroxide and organic nitrate formation contributing significantly to radical termination. To simulate smoke plume chemistry accurately, models should simultaneously account for the full reactive VOC pool and all relevant oxidant sources.
- Article
(3574 KB) - Full-text XML
-
Supplement
(2037 KB) - BibTeX
- EndNote


Biomass burning accounts for at least 30 % of global emissions of non-methane volatile organic compounds (VOCs; Akagi et al., 2011; Andreae, 2019; Yokelson et al., 2008). Pyrogenic VOC fuel production of ozone and secondary organic aerosol, with significant consequences for air quality and climate (Jaffe and Wigder, 2012; McClure and Jaffe, 2018; Buysse et al., 2019; Val Martin et al., 2015; Hodshire et al., 2019). Pyrogenic emissions consist of thousands of unique compounds. Existing emission inventories include over 100 individual VOCs (Andreae, 2019; Akagi et al., 2011). These compilations are incomplete, and it is estimated that previously unidentified VOCs account for ∼ 50 % of total pyrogenic VOC mass (Akagi et al., 2011; Yokelson et al., 2013; Gilman et al., 2015). Recent advances in instrumentation have broadened the suite of detectable VOCs to over 500 species (Sekimoto et al., 2018; Hatch et al., 2017, 2019; Koss et al., 2018), although significant uncertainty remains regarding the speciation, reactivity, and fate of this extended VOC pool.
The photochemistry of biomass burning plumes is perhaps less well understood than emissions, especially within the context of total reactive VOC. Observations of ambient smoke typically encompass a few hours of physical age and include a limited set of compounds (Akagi et al., 2012, 2013; Alvarado et al., 2010; Liu et al., 2016; Müller et al., 2016). Detailed simulations may provide some insight into the chemistry of unidentified VOCs, though models are often under-constrained, and both model and measurement uncertainties can be large (Lonsdale et al., 2020; Alvarado et al., 2015; Müller et al., 2016; Mason et al., 2001; Liu et al., 2016). With extended VOC inventories from recent laboratory work (Hatch et al., 2017; Koss et al., 2018), several studies have begun characterizing the impacts of previously unidentified VOC. Analyzing a series of laboratory burns, Coggon et al. (2019) estimate that the species included in the Master Chemical Mechanism (MCMv3.3.1) account for ∼ 60 % of the primary hydroxyl radical (OH) reactivity measured via proton transfer time-of-flight mass spectrometry. This study also demonstrates that furans, a previously unconsidered class of reactive VOCs, may increase ozone (O3) production within an agricultural fire plume by ∼ 10 % over the first hour of aging. Decker et al. (2019) estimate that the MCM accounts for ∼ 30 % of the observed nitrate radical (NO3) reactivity in the same laboratory experiments.
Despite improved knowledge of pyrogenic VOC speciation, it remains unclear how to best synthesize this information within existing regional/global model frameworks. It is not feasible to add a multitude of new species to chemical mechanisms; indeed, many global models neither explicitly account for all known VOCs (Duncan et al., 2007; Wiedinmyer et al., 2011), nor is it evident that such modifications would improve model results, as plume chemistry may be a subgrid-scale process more suited to parameterization than explicit simulation. On the other hand, reactive VOC chemistry can persist for days downwind of a fire (Mauzerall et al., 1998; Alvarado et al., 2020; Forrister et al., 2015), and an improved representation of such processes may alter regional budgets of ozone, CO, oxidized VOC, reactive nitrogen, and organic aerosol.
Oxidant sources also remain poorly understood in this environment. Smoke plumes are photochemically complex due to spatial and temporal variability in radical precursors, radiation, and other factors (Wang et al., 2021). Recent work has highlighted the importance of emitted nitrous acid (HONO) as a radical source in nascent smoke plumes (Peng et al., 2020; Theys et al., 2020; Robinson et al., 2021). Secondary HONO production via heterogeneous processes may sustain downwind radical production in some, but not all, smoke plumes (Alvarado and Prinn, 2009; Alvarado et al., 2015). Multiple mechanisms have been proposed to explain observed HONO in other environments (Zhang et al., 2019), but their controlling factors and potential impacts are not well characterized.
Here, we utilize a case study of the 2013 California Rim Fire to examine the impacts of newly identified reactive VOC and HONO on gas-phase chemistry. Airborne in situ observations from the NASA Studies of Emissions, Atmospheric Composition, Clouds and Climate Coupling by Regional Surveys (SEAC4RS) mission constrain the evolution of emitted gases, oxidants, and oxidation products over ∼ 12 h of atmospheric aging. We combine these observations with air mass trajectories to drive a 0-D puff model that approximates plume aging. With this framework, we illustrate how an extended VOC pool and various HONO sources alter the chemistry of oxidants, oxidized VOC, reactive nitrogen, and ozone. We evaluate model results through comparison with observations and use the model to quantify age- and mechanism-dependent changes in OH reactivity, radical production/termination, and ozone production sensitivity to VOC and NOx.
2.1 Rim Fire and SEAC4RS observations
The Rim Fire was an extreme wildfire in the central Sierra Nevada Mountains of California (37.85∘ N, 120.08∘ W). Ignited by an illegal campfire on 17 August 2013, the fire was not fully contained until 24 October 2013 and consumed a total area exceeding 1000 km2. At the time of the SEAC4RS flights, the fire front spanned a width of ∼ 40 km in both the N–S and E–W directions. Fuels consisted mostly of mixed conifer forest (Lydersen et al., 2014). Previous Rim Fire studies have investigated fire meteorology (Peterson et al., 2015), emissions (Liu et al., 2017; Yates et al., 2016; Saide et al., 2015), aerosol properties (Forrister et al., 2015; Adler et al., 2019; Perring et al., 2017), radiative effects (Yu et al., 2016), and regional chemistry model performance (Baker et al., 2018). We focus here on downwind gas-phase photochemistry.
SEAC4RS was a NASA-funded effort to characterize the processes controlling atmospheric properties in the summertime in the USA (Toon et al., 2016). We utilize in situ observations acquired from the NASA DC-8 aircraft, which sampled Rim Fire outflow on 26 and 27 August 2013. Analysis focuses on the long axis portion of the 26 August flight, which extends from directly over the fire to 470 km downwind (Fig. 1). The actual sample time window for this leg is 23:06 to 23:57 UTC, and the physical smoke age ranges from 0 to ∼ 12 h (Sect. 2.2). The aircraft maintained a pressure altitude of 4.3 km until 23:32 UTC (smoke age ∼ 5 h), when it descended to 3.6 km (see Fig. S1 in the Supplement). The terrain was mountainous, and the corresponding altitude above ground level ranged from 1.3 to 3.2 km. Sampling was predominantly in the upper edge of the smoke plume and in the lower free troposphere, according to the boundary layer depth derived from trajectory meteorological fields (Fig. S1c). The modified combustion efficiency (MCE) near the source ranged from 0.91 to 0.94, indicating a mix of flaming and smoldering combustion. The DC-8 also sampled Rim Fire smoke as old as 2–3 d, but influence from other fires, surface–atmosphere exchange, and changing background concentrations complicate the analysis of that data. SEAC4RS also investigated several other wild- and agricultural fire plumes (Liu et al., 2016; Toon et al., 2016).

Figure 1Map of the study region. The background shows visible imagery and fire counts (red dots) from Terra/MODIS (https://worldview.earthdata.nasa.gov/, last access: 23 January 2020). The white line is the DC-8 flight track. The aircraft entered from the south, flew over the fire, proceeded NE to do a missed approach at Fallon Municipal Airport (near orange star), executed a wall pattern of perpendicular transects at several altitudes, and returned to the fire before proceeding NE along the long axis leg. Colored circles denote the Whole Air Sampler (WAS) sample locations, and colored lines are the corresponding median trajectories. Yellow-to-blue shading indicates Lagrangian plume age at the time of sampling (see color bar in the inset). The orange star is the location of the background sample. The red box is the Rim Fire box used for trajectory filtering. The inset shows the time series of the median trajectory altitudes with respect to ground level. Colored circles denote the observation time. The gray shaded area indicates night time.
Table S1 lists the instruments and measurement accuracy for observations used in this study; the payload is further described in Toon et al. (2016). Here we provide a brief summary of the key measurements. Most speciated VOC observations (alkanes, alkenes, aromatics, terpenes, and alkyl nitrates) derive from the Whole Air Sampler (WAS), with a sample collection time of 40 s and a sampling interval of 2–10 min. We also use VOC and oxygenated VOC (oVOC) observations from the proton transfer quadrupole mass spectrometer (PTR-MS), including acetaldehyde, the sum of methyl vinyl ketone and methacrolein (MVK + MACR), and the sum of isoprene and furan. Furan is calculated as the difference between the PTR-MS sum and WAS isoprene. Formaldehyde (HCHO) is measured via both laser-induced fluorescence and infrared absorption spectroscopy. Peroxides, nitric acid, and hydroxynitrates are measured via CF3O− chemical ionization mass spectrometry (CIMS). Other oxidized nitrogen measurements include NO and NO2 via chemiluminescence, NO2, total peroxy nitrates, and total alkyl nitrates via thermal dissociation (i.e., laser-induced fluorescence) and speciated peroxyacyl nitrates via thermal dissociation iodide CIMS. Ozone is measured via chemiluminescence. Carbon monoxide (CO) is measured via differential absorption. Photolysis frequencies are calculated from observed up- and down-welling actinic flux combined with the literature-recommended cross sections and quantum yields. Other observations used primarily for model inputs include pressure, temperature, water vapor (open-path absorption), particulate nitrate (aerosol mass spectrometer), aerosol surface area (laser aerosol spectrometer), and total solar irradiance. Aside from WAS data, observations are nominally reported at 1 Hz but may contain gaps due to normal instrument operation. For this analysis, all 1 Hz data are averaged to WAS collection windows. The dataset does not include observation of total oxidized nitrogen (NOy), nitrous acid (HONO), or ammonia (NH3).
Normalized excess mixing ratios (NEMRs) are calculated using CO as the dilution tracer.
Here, X is the observed mixing ratio and Xb is the background mixing ratio. Fast observations fluctuate rapidly in fire plumes and can sometimes contain gaps over a portion of a WAS sampling interval. We adopt a custom averaging procedure to ensure rigorous NEMR calculation for such data. First, each 1 Hz variable X is time-aligned to CO by applying a time lag based on the maximum cross-correlation. Second, CO is filtered to exclude points where X is missing. Finally, X and the filtered CO are averaged to the WAS time base. Executing this procedure over all data effectively creates a unique, gap-filtered, WAS-averaged CO for each variable. Figure S2 shows the dilution factors for each sample, which range from 1 to 24.
Background mixing ratios are averaged over a single WAS sample collected east of the plume (orange star in Fig. 1). We also explored using observations upwind, downwind, or west of the plume for background estimation, but these samples contain stronger fire influence than the eastern sample based on the conserved fire tracers HCN and CH3CN. These alternative background samples also contain higher O3 (60–80 ppbv vs. 50 ppbv), leading to smaller or negative O3 NEMRs and significantly poorer agreement with the model. The influence of background selection on NEMRs depends on the relative magnitude of background and in-plume mixing ratios, which varies with chemical species and age. Employing a constant background introduces additional uncertainty in observed NEMRs. Use of the same backgrounds in model simulations, however, reduces the impact of such uncertainties with regard to model–measurement comparisons.
2.2 Trajectory analysis
Air mass trajectories provide an estimate of smoke age and inputs for the puff model described below. Trajectories are computed with the Hybrid Single-Particle Lagrangian Integrated Trajectory (HYSPLIT) model (Stein et al., 2015) interfaced with custom MATLAB software for input and output handling (https://github.com/AirChem/HYSPLITcontrol, last access: 1 November 2021). Trajectories are initialized at the midpoint of each WAS sample and run backward in time for 48 h. Outputs include both position and meteorology (temperature, pressure, relative humidity, solar zenith angle (SZA), and boundary layer depth). To build statistics, we utilize archive meteorological fields from the North American Mesoscale forecast system (NAM; 12 km; 1 h) and North American Regional Reanalysis (NARR; 32 km, 3 h) datasets (https://ready.arl.noaa.gov/archives.php, last access: 24 March 2020). Trajectories are executed as meteorological ensembles with the HYSPLIT default settings (27 members; 1 grid point horizontal shift; 0.01σ unit vertical shift), giving 54 trajectories per initialization. Next, we define a geographic box for the Rim Fire based on satellite imagery and fire counts (Fig. 1). Trajectories are filtered to exclude those not passing through this box. Filtered trajectories are spatially averaged using a geometric median (Zhong, 2021), resulting in one median trajectory for each observation (Fig. 1; inset). Meteorological quantities are averaged via the arithmetic mean.
We define Lagrangian smoke age from the time when an averaged trajectory last intersected the Rim Fire box out to the downwind time of sampling. The standard deviation of smoke age from individual trajectories is typically ∼ 9 % of the mean for each ensemble, and we take this as a 1σ precision estimate. Smoke at our nominal starting point (the northern end of the box) is actually a mixture of ages. Based on observed wind speed and modeled trajectories near the fire, we estimate a transit time of ∼ 1 h for emissions from the southernmost fire front to reach the northern end of the box. We take half of this value as an approximation for variability in actual smoke age. The total estimated uncertainty in average smoke age is then 9 % + 0.5 h.
2.3 Puff model
The simulation of any fire plume is challenging due to high concentrations, strong dilution, aerosol radiative perturbations, and other factors. SEAC4RS did not sample the core of the Rim Fire plume, and smoke ages of 0–12 h were probed over a single hour of flight. Thus, if we wish to compare with observations, it is not adequate to represent the Rim Fire as a single Lagrangian plume. Detailed fire plume models have improved in recent years (Lonsdale et al., 2020), but observational constraints are limited compared to the complexity of such a model. The goal of our simulation is to obtain a meaningful comparison against observations without over-elaboration (Box, 1976).
In our model framework, the plume is approximated as a series of 0-D puffs. The puff model is developed within the Framework for 0-D Atmospheric Modeling (F0AMv4.2.1; available at https://github.com/AirChem/F0AM/, last access: 23 January 2020; Wolfe et al., 2016). One puff is simulated for each WAS sample/trajectory pair shown in Fig. 1. Each puff evolves in real time along the average trajectory, with meteorological constraints updated every 10 min. For each puff, along-trajectory pressure, temperature, relative humidity, and solar zenith angle are constrained with averaged trajectory output. Trajectory meteorology is rescaled by multiplicative factors (typically within a few percent of unity) based on the ratio of observed-to-trajectory values at trajectory endpoints. Photolysis frequencies are semi-constrained to observations using a two-part scaling that helps account for smoke radiative perturbations (Appendix A). Variations in scaling factors suggest stronger attenuation in the UV than the visible (compare J(O1D) and J(NO2) in Fig. A1b), consistent with other reports (Baylon et al., 2018). Chemical concentrations from the endpoint of each puff are extracted for comparison with observations.
Initial concentrations are the same for all puffs. These are estimated by combining Rim Fire emission ratios (ERs) from Liu et al. (2017), with the excess CO mixing ratio from the first sample of the long axis leg. Normalized excess mixing ratios for the near-source sample are generally within ± 50 % of the ERs reported by Liu et al. (2017) for the Rim Fire (Fig. S3). The Liu et al. (2017) ERs incorporate multiple near-source intercepts and are more representative of average fire conditions. Actual ERs likely vary among the plume samples. Older samples represent fire emissions from earlier in the day, and we might expect these samples to show an increased signature of smoldering relative to flaming due to typical wildfire diurnal progression (Wiggins et al., 2020). Observations, however, do not conclusively indicate a time-dependent trend in ERs. MCE generally declines with age (Fig. S4a), consistent with a shift from smoldering to flaming over time, but frequent deviation from the expected wildfire value range of 0.8–1.0 (Akagi et al., 2011) suggests non-emission influence (e.g., background CO2 variability) that degrades this metric as a combustion phase tracer at later ages. NEMRs for the conserved fire tracers HCN and CH3CN exhibit some variability (standard deviationmean = 10–15 %) but no trend (Fig. S4b), suggesting no systematic change in fire-averaged ERs (Roberts et al., 2020). Conversely, the trend in total observed NOy may indicate time-varying emissions (Sects. 3.1.4 and 4.2). Given these ambiguities, constant initial concentrations are a reasonable assumption.
Dilution is treated in analogy with Gaussian plume dispersion as follows (Alvarado et al., 2015):
Background concentrations (Xb) are the same as those used for dilution normalization in Eq. (1). The Gaussian timescale, τg, is constant for each puff and calculated using the analytical solution of the integral of Eq. (2) with CO concentrations at start and end points. The Gaussian timescale varies from 28 to 760 s for individual puffs (Fig. S5). Such variability is not surprising given the horizontal extent of the fire and differences among trajectories for each puff.
Model chemistry utilizes the Master Chemical Mechanism (MCMv3.3.1; Jenkin et al., 2015, 1997; Saunders et al., 2003) with modifications. Additional reactions include the photolysis of pernitric acid (Atkinson et al., 2004), reaction of methyl peroxy radical with OH (Assaf et al., 2016; Caravan et al., 2018), reaction of hydroxymethyl hydrogen peroxide (HMHP) with OH (Allen et al., 2018), and oxidation of propadiene (C3H4). For the latter, we use the OH reaction rate coefficient of Atkinson and Arey (2003) rather than the 1.8 times slower rate coefficient of Daranlot et al. (2012), owing to the similar observed decay rates of propadiene and ethene. Subsequent propadiene chemistry follows the mechanisms of Daranlot et al. (2012) and Xu et al. (2019). We also update rate coefficients for reaction of peroxyacetic acid with OH (Berasategui et al., 2020) and peroxyacyl radicals with HO2 (Jenkin et al., 2019), which are slower/faster than MCM default values by factors of , respectively. The oxidation of some additional biomass burning VOC (furans, syringol, and guaiacol) is incorporated using an MCM extension developed following recent laboratory and field studies (Coggon et al., 2019; Decker et al., 2019, 2021a; Robinson et al., 2021).
There are multiple potential error sources in the puff model, and many are not easily quantified. We assume constant initial concentrations, but the smoke is a heterogeneous mixture of multiple ages and burning phases. Parameterizations for photolysis and dilution make assumptions about the history of each puff based on the observed evolution along the flight path. Heterogeneous chemistry is not explicitly included. Despite all these issues, results will illustrate that the puff model is a reasonable approximation and a useful test bed for probing plume chemistry. Measurement accuracy (Table S1) is typically the dominant uncertainty in observations at high signal-to-noise ratios (rather than precision); thus, we use this to define the uncertainty for model–measurement comparisons.
2.4 Model scenarios
Simulations systematically characterize the effects of varying emissions and chemistry (Table 1). In the base simulation (M0), initial species are limited to observations. This includes three species that are not in the MCM, namely furan, HMHP, and propadiene. Additional simulations incorporate unmeasured reactive VOC and HONO sources, as detailed below.
Table 1Summary of model simulations. Note: ppbv is parts per billion by volume.

2.4.1 Addition of unmeasured VOC
Simulation M1 incorporates unmeasured VOC using the fire laboratory emissions data of Koss et al. (2018), which includes over 500 compounds and 20 western USA fuel types. We restrict this dataset to 152 compounds with specific molecular assignments and estimated OH reaction rate coefficients (Table S5 of Koss et al., 2018). Incorporating these data require (1) estimation of initial VOC concentrations and (2) allocation of these VOCs to model species. For the first step, we create a composite ER profile for the Rim Fire by comparing the ERs of the following 11 species reported by both Liu et al. (2017) and Koss et al. (2018): acetylene, ethene, propene, methanol, formaldehyde, acetaldehyde, furan, benzene, toluene, HCN, and CH3CN. Specifically, we optimize fractional fuel contributions by minimizing the sum square relative error of log-transformed ERs between Liu et al. (2017) and the composite profile. Estimated fuel composition is sensitive to which VOCs are included in the optimization, as ER profiles are highly correlated among different fuels. For the same reason, model results are not especially sensitive to the choice of fuel composition. Combining composite ERs with observed CO in the first plume sample gives initial mixing ratios. We assume zero background for all unmeasured VOCs. ERs for acrolein and biacetyl are reduced by factors of 2.3 and 10, respectively, due to known calibration issues (Sect. S1).
Unmeasured VOCs are assigned to model species via one of two methods. A total of 51 species appear in the MCM or the extended NOAA biomass burning mechanism and are thus accounted for explicitly. The remaining 101 compounds lack direct MCM analogues. These VOCs are allocated to MCM proxies based on OH reaction rate coefficients (kOH) and molecular formulae. For each VOC, we first identify MCM species that are within some threshold (nominally 20 %) of the VOCs estimated kOH. We then attempt to filter the MCM species list to include only those containing a similar number of carbon and oxygen atoms (within ± 1 the number of each atom). Specific functional groups are not considered. If the molecular formulae criterion is too restrictive (i.e., no species are identified), we only use the kOH criterion. Table S2 lists the MCM assignments and ERs for all unmeasured VOCs. Figure S6 compares bulk chemical metrics between the non-MCM species of Koss et al. (2018) and assigned MCM proxies. Overall, proxies reproduce the distribution of OH reactivity (total 47 s−1) and carbon content (390 ppbv C) and are biased high with respect to oxygen content and molecular weight. This is not surprising, as most VOCs contained in the MCM are multi-generation oxidation products.
2.4.2 Addition of HONO
HONO was not measured during SEAC4RS. Several sets of sensitivity simulations explore the impacts of primary (emitted) and secondary HONO. All of these simulations include the same initial unmeasured VOC as simulation M1. Simulations M2a, b, and c incorporate primary HONO at initial mixing ratios of 5, 15, and 25 ppbv, respectively. The upper end of this range is based on recent work reporting an average ΔHONO ΔNOx emission ratio of 0.7 ± 0.3 ppbv ppbv−1 and an average ΔHONO ΔCO emission ratio of 5.3 ± 5.2 pptv ppbv−1 (where pptv is parts per trillion by volume) for western USA wildfires (Peng et al., 2020).
Simulations M3a, b, and c incorporate photolysis of particulate nitrate (pNO) as follows:
The photolysis frequency for reaction R1 is calculated as 286⋅J(HNO3), following Ye et al. (2017, 2018). The mechanism for this reaction is not well understood (Baergen and Donaldson, 2013), and the efficacy of pNO photolysis likely depends on aerosol composition (Ma et al., 2021). Other studies have estimated photolysis frequencies an order of magnitude or more lower in non-biomass burning environments (Romer et al., 2018; Shi et al., 2021). Particulate nitrate concentrations are constrained by aerosol mass spectrometer (AMS) observations (Fig. S7a). Comparison with other aerosol composition observations suggests minor pNO contained in coarse-mode aerosol, which is excluded by the AMS (Fig. S8). It is not possible to partition AMS pNO between organic and inorganic forms for SEAC4RS (Ulbrich et al., 2009; Day et al., 2022); however, the nature of particulate nitrate participating in Reaction (R1) is also unclear. For all puffs, pNO is initialized with the observed concentration in the near-source sample. The model treats pNO as non-reactive (no chemical production or loss), but it dilutes with a puff-dependent background concentration, chosen such that concentrations match observations at the start and end of each puff. This is a workaround to ensure the model carries reasonable pNO concentrations throughout the simulation in the absence of explicit model aerosol chemistry. Simulations M3a, b, and c scale the nominal rate of Reaction (R1) by factors of 0.5, 1, and 2, respectively.
Simulations M4a and b incorporate reaction of NO2 on aerosol surfaces as follows:
Here, ka is the first-order rate coefficient, is the mean molecular speed of NO2, Sa is particle surface area density, and γ is the reactive uptake coefficient. We assume that gas diffusion is not a limiting factor for small values of γ (10−3 to 10−6). For Sa, we use laser aerosol spectrometer observations (Yu et al., 2016) scaled up by a factor of 1.7 to account for calibration bias (Fig. S8) and linearly interpolated over plume age. Values of Sa range from 800 to 6600 µm2 cm−3 (Fig. S7b). In the following, the parameterization of γ follows a laboratory-derived relationship with solar radiation (Stemmler et al., 2006; Zhang et al., 2019):
Here, is the NO2 photolysis frequency derived from the model, is a scaling factor, and Rad is total solar irradiance. The latter is estimated using trajectory-dependent SZA and the linear relationship between SZA and observed solar irradiance (Fig. S9). Some minor systematic bias in Rad may result from extrapolation of this relationship. The minimum value of γ follows Aumont et al. (2003). Figure S7c–d show calculated γ and ka at the end point of each puff. The uptake coefficient ranges from 4–, while ka ranges from 0.3– s−1. Note that ka varies along the trajectory for each puff due to changes in radiation and Sa. Simulation M4a uses this default parameterization, while, in simulation M4b, ka is multiplied by a factor of 1000. This range spans observed NO2 uptake on humic acid (γ=2–; Stemmler et al., 2006) and soot (γ=3.7–; Ammann et al., 1998) surfaces. We do not consider ground surface HONO sources (Chai et al., 2021), as observations are limited to the free troposphere and uppermost mixed layer.
3.1 Observations and base simulation
We first examine the evolution of observed trace gases in the Rim Fire plume. Observations illustrate several general features, including (1) rapid oxidation of primary emissions and production of secondary species in the first 2 h of aging, (2) mixing with biogenic emissions around an age of 2–3 h, and (3) a transition in some species associated with a decrease in sampling altitude around an age of 6 h (Fig. S1). The following sections survey age-dependent trends in primary VOC, peroxides, oxygenated VOC, reactive nitrogen, and ozone. We compare the representation of this chemistry with MCMv3.3.1 and available constraints to base simulation output (M0) benchmarks.
3.1.1 VOC
The downwind evolution of primary VOC illustrates the differing effects of emissions, dilution, and oxidation. We group VOC into the following four categories: long-lived alkanes, aromatics/intermediate-lived alkenes, short-lived alkenes, and biogenic terpenes. Groups reflect photochemical lifetimes and similarities in model normalized mean bias (NMB). Figure 2a–d show an example from each category, Fig. S10 shows the time series of all observed VOC, and Fig. S11 shows the NMB for each VOC calculated over the full simulation.
Long-lived alkanes such as ethane, propane, and butanes do not decay monotonically with plume age (Figs. 2a and S10a–d). NEMRs for these gases peak downwind of the Rim Fire; for example, the highest propane NEMR occurs at an age of 4 h and is 50 % higher than the initial value. All model simulations exhibit negative NMB of −26 % or less for these gases (Fig. S11). With lifetimes of days or more against OH oxidation, these gases are relatively sensitive to variability in background levels and regional emissions (e.g., urban and oil/natural gas activities). For example, at an age of 4 h the ethane enhancement is four times its background value, whereas the ethene enhancement is a factor of 70. Variability in fire emissions is a less likely explanation for model–measurement mismatch. Reconciliation with the observed increase in NEMRs at an age of 2 h would require VOC-to-CO emission ratio increases of 50 %–100 %, and we would expect similar changes in other VOC emission ratios (Liu et al., 2017; Permar et al., 2021) that are not observed. These VOCs are minor contributors to plume photochemistry; however, this comparison underscores the challenge of accounting for background variability in Lagrangian or pseudo-Lagrangian simulations.
The second group, including most aromatics (benzene, toluene, ethyl benzene, and xylenes) and several alkenes (ethene and propadiene), exhibits stronger NEMR decays with age (Figs. 2b and S10e–k). Photochemical lifetimes for these gases range from 11–48 h (except for benzene, with a lifetime of 4–10 d); thus, we expect both emissions and chemistry to influence NEMR variability. Similar to alkanes, longer-lived aromatic NEMRs peak at 2–6 h of age. Xylenes, ethene and propadiene exhibit a more monotonic decay. The base model NMB is below 8 % for the latter three compounds.
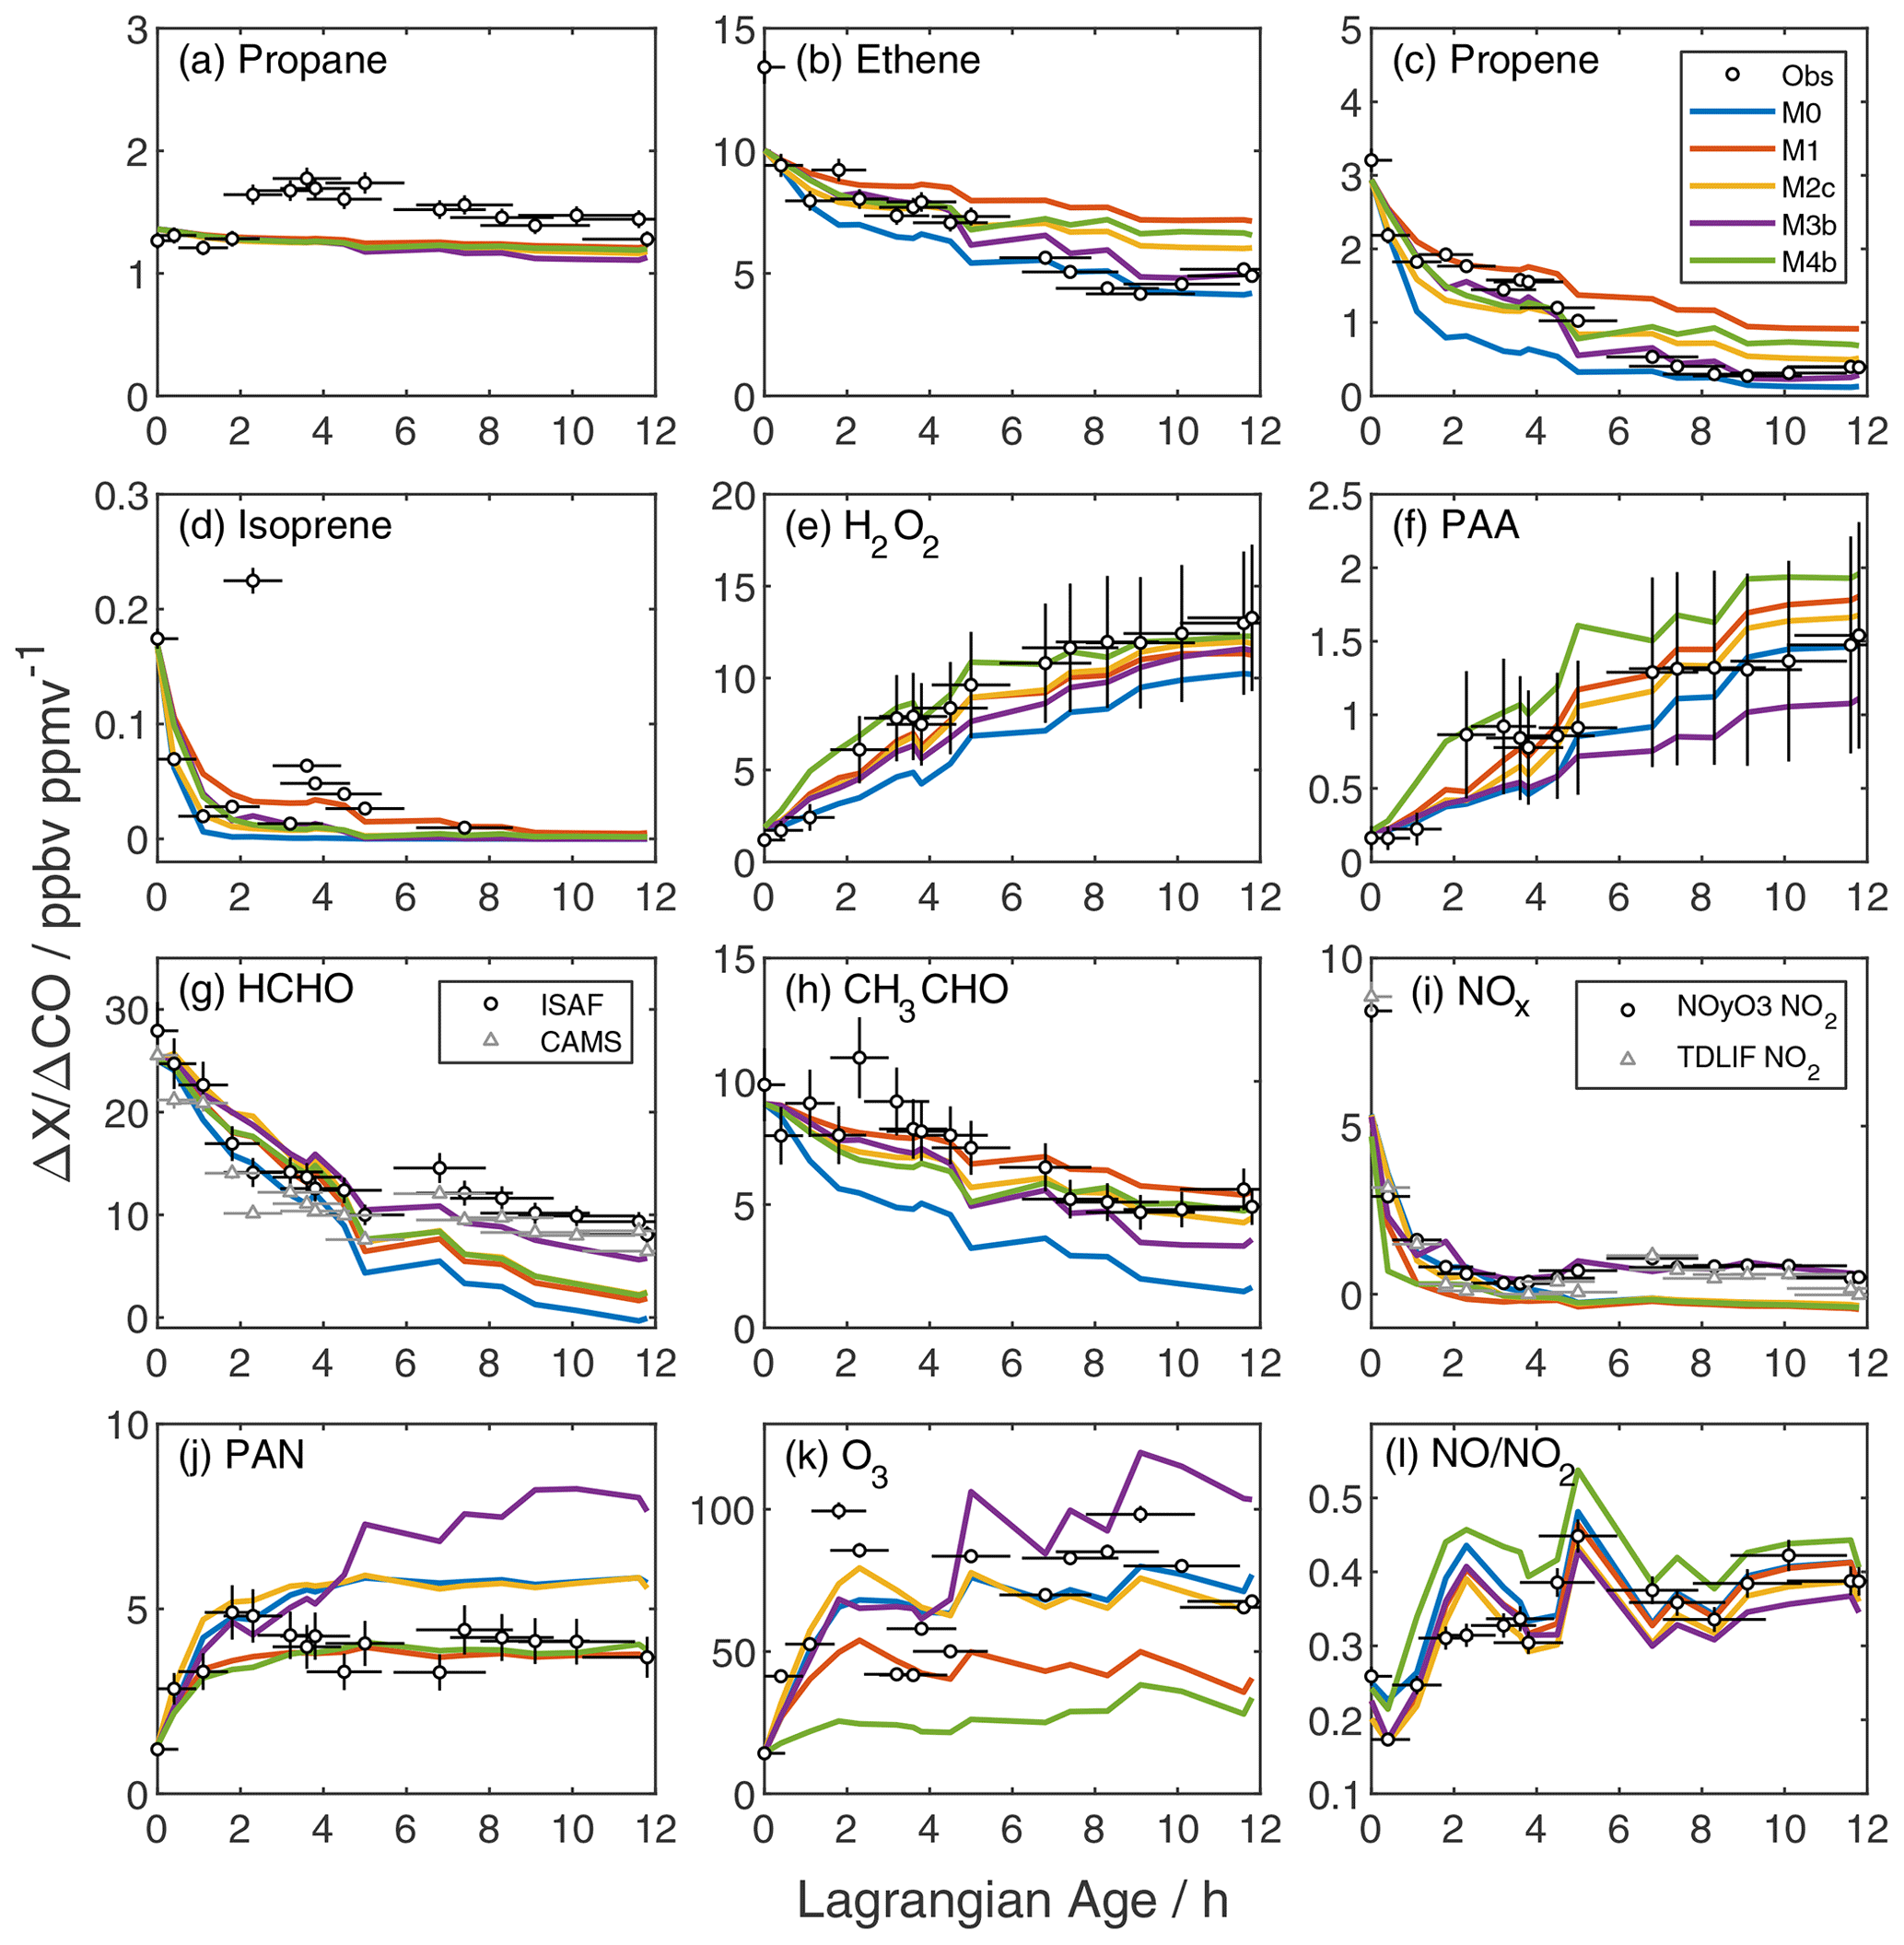
Figure 2Age evolution of NEMRs for reactive gases (a–k) and the NO NO2 ratio (l). Black circles are observations with their corresponding uncertainty due to measurement accuracy and age. Colored lines are the model output from the base simulation (M0; blue), addition of unmeasured VOC (M1; red), and addition of unmeasured VOC plus initial HONO (M2c; yellow), pNO photolysis (M3b; purple), or NO2 heterogeneous uptake (M4b; green). In panels (g) and (i), circles and triangles represent two independent measurements of HCHO and NO2, respectively (Table S1). NO and NO2 observations in panel (l) are from the NOyO3 instrument.
Oxidation controls the trend of short-lived alkenes, including propene, butenes, butadiene, pent-1-ene, and furan (Figs. 2c and S10l–s). These gases have near-zero background mixing ratios and react primarily with OH. Loss via O3 reaction is <15 % of the total loss rate, and nitrate radical reaction is negligible within sampled air masses. NEMRs decay rapidly, and the most reactive gases fall below measurement detection limits at later ages. The base model simulation exaggerates this decay, resulting in negative NMB as large as −233 % for furan.
Terpenes (isoprene and -pinene) are also highly reactive, and NEMRs generally decay rapidly (Figs. 2d and S10t, u). Around an age of 2 h, however, NEMRs increase beyond those in the near-source sample. A similar pattern appears in the isoprene oxidation products methyl vinyl ketone (MVK) and methacrolein (MACR; Fig. S12d). Furthermore, this particular sample is uncharacteristically dilute relative to the Lagrangian age (Fig. S2). This evidence suggests that local biogenic emissions mixed with the Rim Fire smoke samples at Lagrangian ages of 2–4 h.
3.1.2 HOx and peroxides
The SEAC4RS DC-8 payload did not include observations of HOx (= OH + HO2). The loss and production of other compounds, however, indirectly constrains HOx abundance. The decay rate of short-lived alkenes provides a benchmark for OH, while peroxide production is an indicator for HO2 and, to some extent, organic peroxy radicals (RO2).
As discussed above, short-lived alkene NEMRs decay faster than observed NEMRs in the base simulation, especially in the first few hours. The discrepancy between modeled and observed short-lived alkenes suggests an over-prediction of OH in the young plume. Base simulation OH starts at 4.9×106 cm−3 and declines to ∼ 1.2×106 cm−3 after ∼ 4 h (Fig. S13a).
Self-reaction of HO2 produces hydrogen peroxide (H2O2), and reaction of HO2 with peroxyacetyl radical (PA) produces peroxyacetic acid (PAA). NEMRs for both peroxides start low and increase with plume age (Fig. 2e, f). Initial mixing ratios are near background levels, which is at odds with a previous study suggesting significant primary emissions (Lee et al., 1997). The base simulation exhibits an upward trend but with a slower growth rate, especially over the first 4 h. Model H2O2 NEMRs skirt the lower edge of measurement accuracy, while PAA agreement generally improves with age. This comparison suggests under-prediction of HO2 and possibly RO2 at early ages. Base model HO2 peaks at ∼ 85 pptv and declines to values as low at 23 pptv (Fig. S13b).
3.1.3 Oxygenated VOC
Formaldehyde (HCHO), an oxidation product of numerous VOC, serves as a top-down constraint on in-plume VOC processing. The observed HCHO NEMR decreases by a factor of 3 in the first 5 h before leveling out at later ages (Fig. 2g). This behavior is consistent with loss of primary emissions alongside secondary production (Liao et al., 2021). The HCHO lifetime due to photolysis and OH oxidation is ∼ 3.5 h at the time of sampling, but accumulation of multi-generation oxidation products may sustain downwind HCHO production (Alvarado et al., 2020). The rise in the HCHO NEMR between 5 and 7 h coincides with descent to a lower sampling altitude (Fig. S1). The base simulation follows observations early on but underestimates NEMRs later.
The acetaldehyde (CH3CHO) NEMR decay exhibits a more constant slope (Fig. 2h). The small post-emission peak in the acetaldehyde NEMR at an age of 2 h coincides with the aforementioned sharper peaks in biogenic markers and enhancements in long-lived alkanes, which may indicate influence from non-fire surface emissions. Base model NEMRs initially decay more rapidly than observed, but the slope matches observations after the first few hours. This discrepancy is consistent with over-prediction of OH in the young plume, as OH oxidation accounts for 80 % of acetaldehyde loss. Conversely, OH only accounts for 15 %–50 % of HCHO loss (photolysis is the remainder). Thus, as will be evident in sensitivity simulations discussed later, HCHO and CH3CHO exhibit opposite responses to varying OH.
Section S2 and Fig. S12 present several other oxygenated VOC (oVOC) observations, including methanol, acetone + propanal, hydroxyacetone, and MVK + MACR.
3.1.4 Reactive nitrogen
Major wildfire reactive nitrogen emissions include NOx, HONO, and NH3 (Lindaas et al., 2020; Roberts et al., 2020). Observations of HONO and NH3 are not available for SEAC4RS, so here we focus on NOx and observed reservoir species including peroxyacyl nitrates, alkyl nitrates, and nitric acid.
The base simulation reasonably reproduces the initial loss of NOx but does not capture later behavior (Fig. 2i). In the first few hours, the NOx NEMR decays with an e-folding timescale of 20–40 min. After reaching a minimum at ∼ 3.6 h, the NOx NEMR rises to a sustained enhancement at ∼ 10 % of the initial value. An additional NOx source of 200 pptv h−1 is required to close the NOx budget in the period between 6 and 12 h. This discrepancy is explored further in Sect. 3.3.
Peroxyacetyl nitrate (PAN) typically comprises the majority of total peroxy nitrates (Wooldridge et al., 2010) and is produced via the reversible reaction of NO2 with PA. The PAN NEMR rises rapidly in the first 2 h before stabilizing (Fig. 2j), comparable to previous observations (Alvarado et al., 2010, 2015). The base simulation captures the early rise in PAN but overshoots the asymptote by ∼ 20 %. Section S3 and Figs. S14–S15 compare the model output to measurements of other speciated peroxy nitrates, total peroxy nitrates, and alkyl nitrates, which show varying levels of model–measurement agreement.
Reaction of OH with NO2 primarily forms nitric acid (HNO3). The observed HNO3 NEMR is negative and trends downward with age, indicating that in-plume HNO3 is below background levels (Fig. S15c). Excess ammonia ammonium (Perring et al., 2017) likely drives rapid formation of particulate ammonium nitrate (Lindaas et al., 2021). The puff model lacks aerosol chemistry and thus predicts net growth of the HNO3 NEMR. The difference between the base model and observed HNO3 NEMR implies an effective HNO3 lifetime of less than 1 h within the plume.
Figure 3 shows the evolution of the sum of observed NOy. We refer to this quantity as ΣNOy,obs to acknowledge missing observations of some NOy species such as HONO, HO2NO2, nitroaromatics, and possibly other organonitrates. Peroxyacyl nitrates (PNs) comprise 20 % of NOy,obs within the first sample, consistent with a mixture of smoke ages. After the first hour, PNs comprise more than half of ΣNOy,obs, pNO comprises another 20 %–30 %, and NOx and alkyl nitrates contribute 10 %–15 % each. The ΣNOy,obs NEMR decreases from as high as 19.9 ppbv ppmv−1 (where ppmv is parts per million by volume) to as little as 6 ppbv ppmv−1 over 12 h of aging. Underlying this trend is a rapid NOx decay, a step change in pNO at an age of 2 h, and a gradual decline in ΣPNs (Fig. S16). Figure S17 compares observed gas-phase NOy (ΣNOy,gas, which excludes pNO) with the model-equivalent sum. The observed gas-phase sum decreases with age from 12.5 to 4.4 ppbv ppmv−1 and is ∼ 7 ppbv ppmv−1 throughout simulation M0. The causes and consequences of this discrepancy are further discussed in Sect. 4.1.

Figure 3Age evolution of observed NOy speciation (solid colors; left axis) and the ΣNOy,obs NEMR (white circles/line; right axis). ΣNOy,obs is the bottom-up sum of observed NOy. ΣPN represents tunable diode laser-induced fluorescence (TDLIF) observations.
3.1.5 Ozone
The observed O3 NEMR grows rapidly within the first few hours before slowing down (Fig. 2k). The peak value at 2 h coincides with the aforementioned peak in biogenic VOC. The base simulation reproduces the general trend of the observed O3 NEMR time profile but misses the maximum and under-predicts after 5 h. Significant point-to-point variability in the observed O3 NEMR mostly reflects variability in the CO excess mixing ratio rather than O3 itself, as O3 is relatively close to its background value. Absolute O3 reaches a peak of 130 ppbv within the first hour before diluting rapidly to 65–75 ppbv, remaining above the background estimate of 50 ppbv (Fig. S18). Mean absolute bias for base simulation O3 is −3.2 ppbv averaged over all observations and +0.5 ppbv for ages greater than 2 h.
The ratio of NO to NO2 relates closely to radical turnover and O3 production. In the absence of strong NOx sources or sinks, photolysis of NO2 and oxidation of NO establishes a photostationary state that controls this ratio, as follows:
Here, is the NO2 photolysis frequency, and kx+y are reaction rate coefficients. The observed NO NO2 ratio doubles over the course of 12 h (Fig. 2l), consistent with the decline of peroxy radicals and ozone mixing ratios. J(NO2) does not exhibit a clear trend over this period (Fig. A1). The base simulation over-predicts this ratio in the first few hours and agrees within uncertainties afterward. Disagreement at young ages is consistent with insufficient conversion of NO to NO2, possibly due to insufficient ozone and/or peroxy radicals.
3.2 Accounting for unmeasured VOC
Differences between observations and the base simulation are consistent with missing reactive VOC in the model. The decay of reactive alkenes is faster than observed, suggesting that model OH is too high. Production of peroxides and HCHO is too slow, indicating missing sources of peroxy radicals and organic carbon. Simulation M1 approximates the effects of unmeasured VOC, which is incorporated following the procedures outlined in Sect. 2.4.1.
Total OH reactivity – the inverse of the OH lifetime – increases significantly upon addition of unmeasured VOC (Fig. 4a). Initial OH reactivity grows from 77 to 182 s−1. The top five components of OH reactivity in the observations and simulation M0 are HCHO, CO, CH3CHO, furan, and propene (Fig. 4c). Species included in simulation M0 comprise ∼ 45 % of the OH reactivity in simulation M1. The top five additional contributors in simulation M1 are aromatics, consistent with Coggon et al. (2019). Enhancements persist as the plume ages, with OH reactivities of 7 s−1 (M1) versus 3 s−1 (M0) at an age of 12 h. After 12 h, 32 % of the M1-simulated OH reactivity is comprised of over 2100 species that are, individually, not very abundant (Fig. 4c; gray area). Comparing M0 and M1 suggests that 85 % of this secondary reactivity (1.8 s−1) is due to the oxidation of unmeasured VOC.
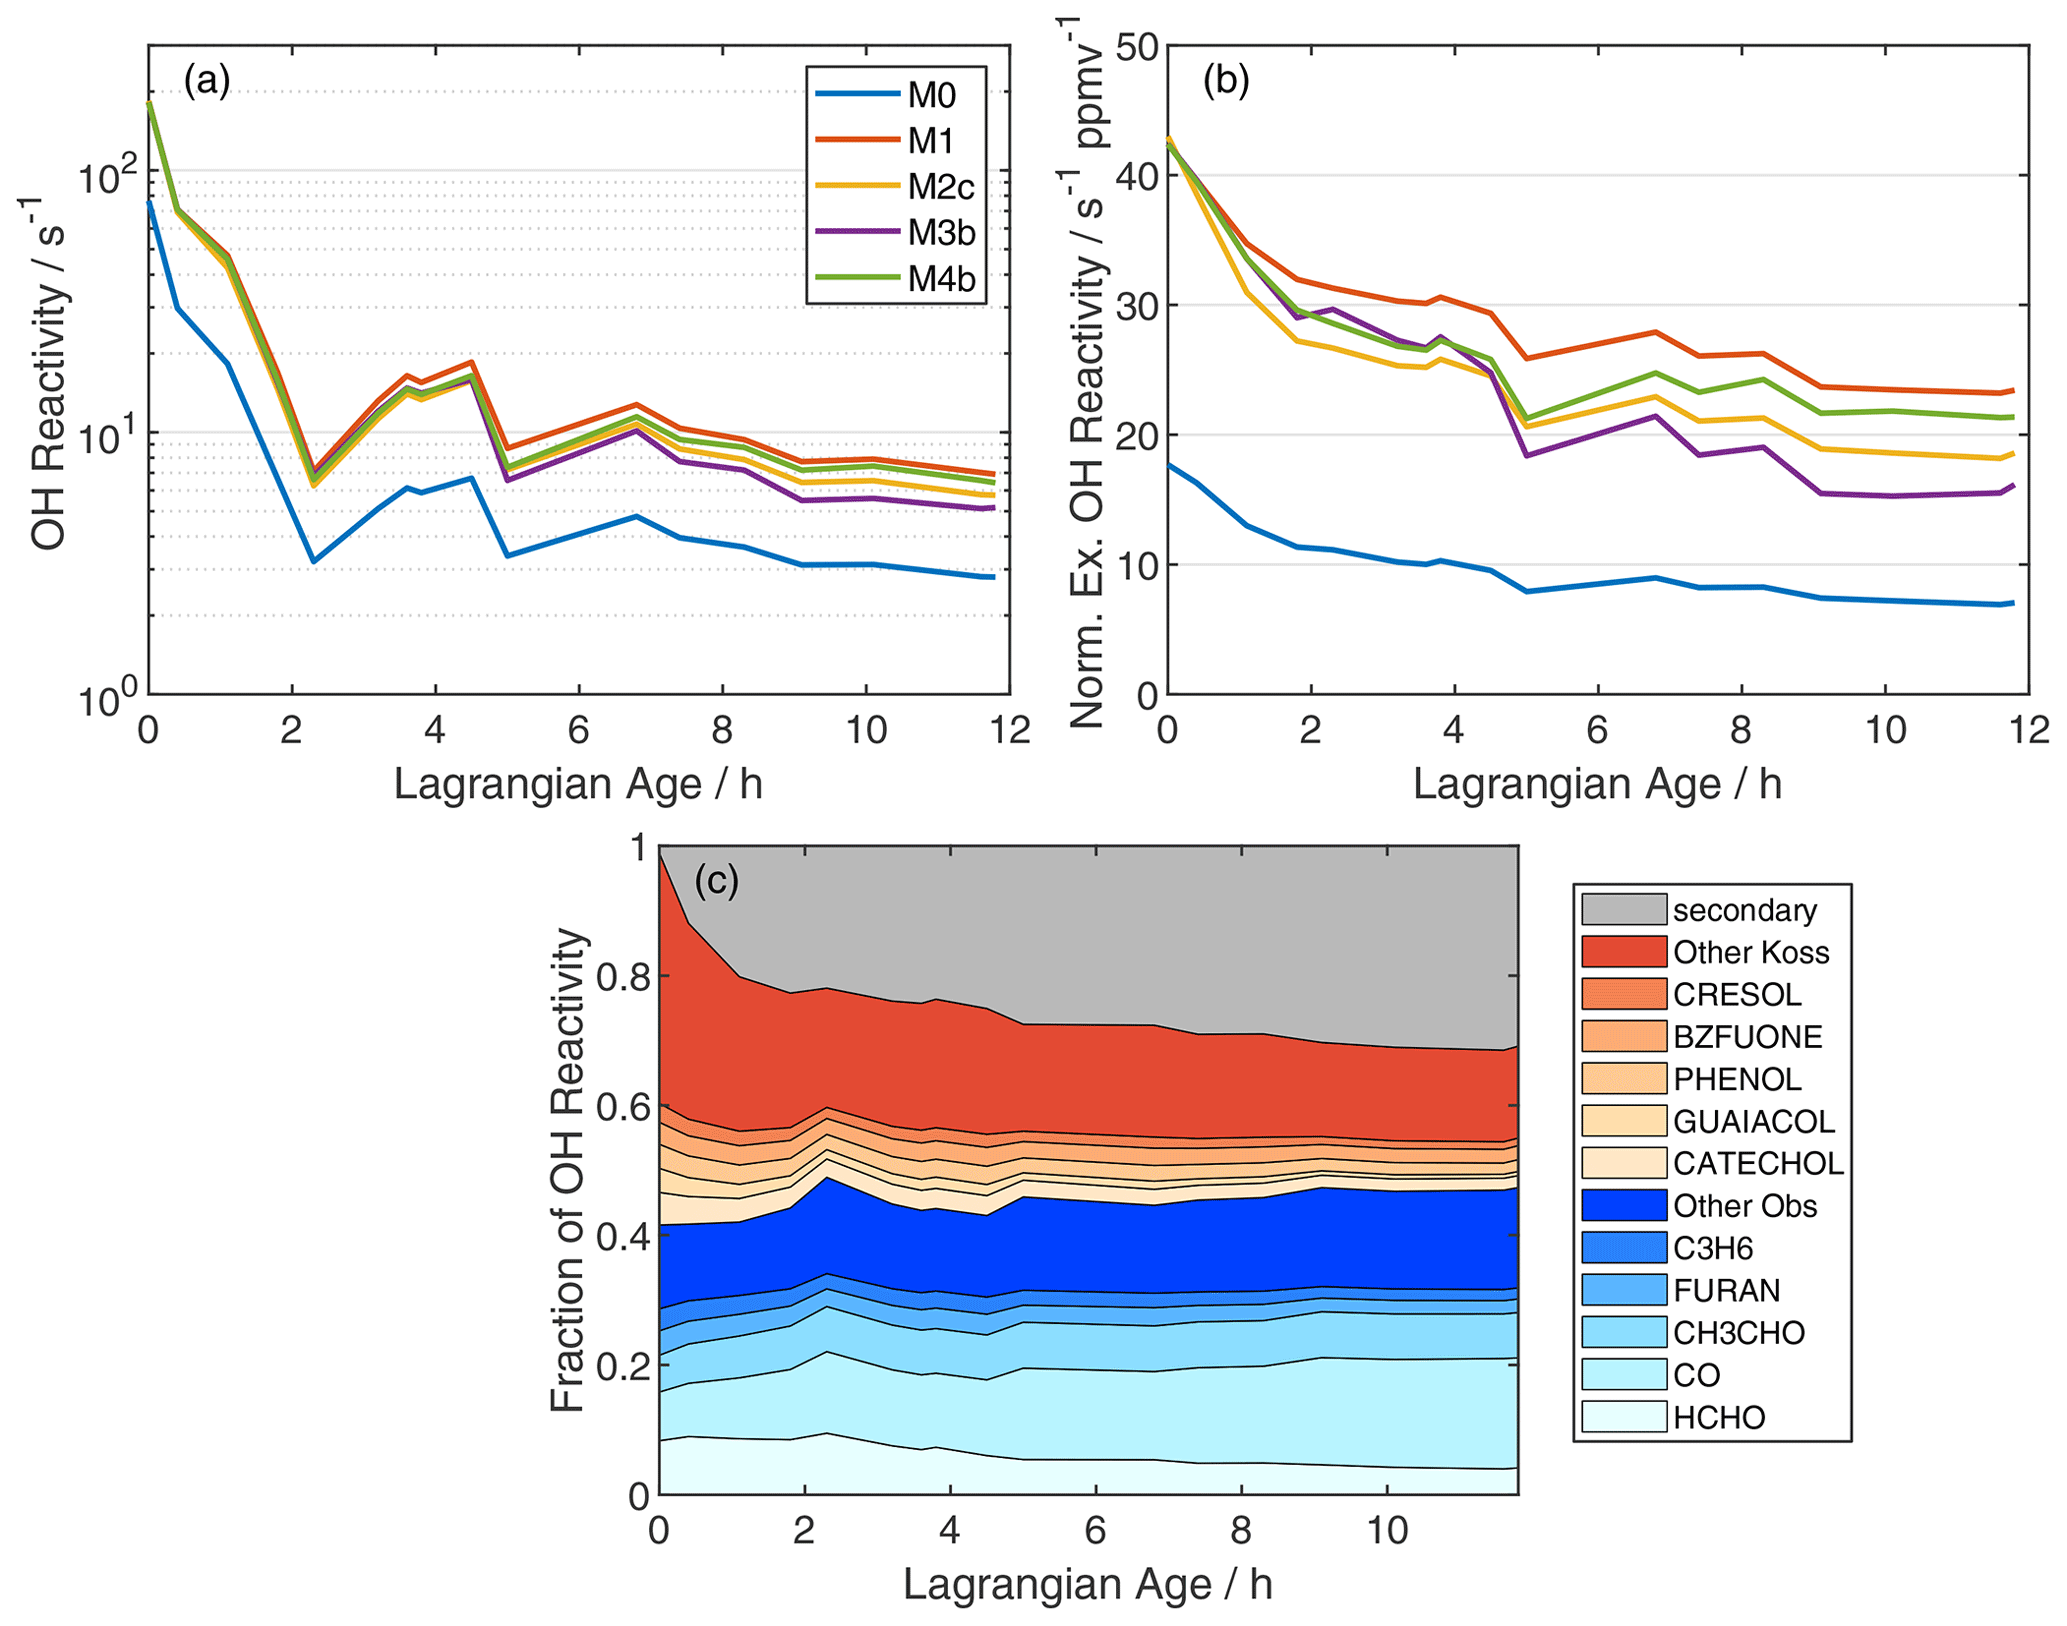
Figure 4(a) Age evolution of total model OH reactivity, (b) normalized excess OH reactivity, and (c) fractional contributions of individual reactants to total OH reactivity in simulation M1. In panel (b), normalization is analogous to NEMR calculation (Eq. 1), and the OH reactivity background is 1.1 s−1, based on summation over observed OH reactants in the background sample. In panel (c), blue shades denote measured compounds, red shades are species added from the Koss et al. (2018) inventory, and gray includes 2116 other MCM species reacting with OH.
Normalizing for dilution reveals a more modest decline in OH reactivity due to photochemistry alone (Fig. 4b). Normalized excess OH reactivity declines by 61 % and 45 % for M0 and M1, respectively. The relatively slower decline in M1 reflects less OH in this simulation. Modeled declines in OH reactivity over 12 h of aging imply pseudo-first-order lifetimes of 12.7 and 21.4 h for OH reactivity in simulations M0 and M1, respectively. OH reactivity estimates from the model may be an upper limit, as some reactive carbon will partition to the aerosol phase (Palm et al., 2020).
Additional VOC reactivity markedly alters downwind chemistry. OH decreases to 5×105 cm−3 for most of the simulation (Fig. S13a), reducing the decay of reactive alkenes to a shallower slope than observed (Fig. 2b–d). Maximum HO2 increases by 35 % (Fig. S13b), and H2O2 agrees better with observations (Fig. 2e). PAA increases due to the enhanced production of HO2 and PA (Fig. 2f). The peroxyacetyl radical is also a PAN precursor, but PAN actually decreases in simulation M1 due to lower NO2 (Fig. 2j) and competing formation of larger peroxy nitrates (Figs. S14, S15). Rapid sequestration of NOx also suppresses ozone formation in the young plume (Fig. 2k). HCHO and CH3CHO increase (Fig. 2g–h), but the model still under-predicts HCHO at later ages.
3.3 Accounting for primary and secondary HONO
The contrast of observations and simulation M1 in Fig. 2 implies insufficient OH and NOx. The decay of short-lived alkenes is now slower than observed owing to the large increase in OH reactivity, while the decay of NOx is faster than observed due to rapid peroxy nitrate formation. Faster NOx sequestration also reduces O3 production.
Potential explanations for model–measurement discrepancies in NOx include NO2 measurement artifacts, emissions variability, unaccounted-for recycling via NOx reservoirs, and missing NOx sources. NO2 measurement artifacts are unlikely to play a significant role, given the excellent correlation between two independent NO2 measurements and the magnitude of model–measurement disagreement (Sect. S3). Doubling initial NOx has a minor effect on the simulated NOx NEMR after ∼ 5 h (Fig. S19), and total observed NOy decreases with Lagrangian age (Fig. 3); thus, NOx emissions variability also cannot explain this difference. Recycling via decomposition or oxidation of NOx reservoirs, such as organic nitrates, should be adequately captured by simulation M1 as the NEMRs of total peroxy nitrates, and alkyl nitrates are simulated well (Figs. S14 and S15). We lack observations of HO2NO2 or CH3O2NO2, but lifetimes for these gases are a few minutes for model conditions and modeled mixing ratios are less than 10 pptv after 5 h. Nitroaromatic photolysis may generate HONO (Sangwan and Zhu, 2016), but these compounds do not build up to sufficient levels to act as a major NOx source in the model. Therefore, a missing NOx source is the most likely explanation.
Previous work has demonstrated the important role of HONO in smoke plume chemistry (Alvarado et al., 2015; Alvarado and Prinn, 2009; Peng et al., 2020; Theys et al., 2020). Direct HONO emissions amplify radical production in the nascent plume, while secondary HONO formation may sustain oxidation as the plume ages. As discussed in Sect. 2.4.1 and summarized in Table 1, we implemented both primary emissions (simulations M2a, b, c) and secondary production via pNO photolysis (M3a, b, c) or a heterogeneous NO2 reaction (M4a, b). Figure S20 shows the absolute HONO mixing ratio, HONO NEMR, and HONO NO2 ratio for several representative simulations. The HONO photolysis lifetime, based on observed photolysis frequencies, is 10–20 min. HONO mixing ratios in simulations with secondary production (M3b and M4b) are tens of pptv after a few hours. Initial HONO NEMRs and HONO NO2 ratios fall within the range observed in other fire plumes (Peng et al., 2020; Theys et al., 2020). Most figures in the main text and the Supplement display results from simulations with high primary HONO (M2c), moderate pNO photolysis (M3b), and fast NO2 heterogeneous uptake (M4b), while Figs. S21–S23 show the full results for each sensitivity series.
Initial HONO stimulates chemistry in the first several hours. Simulation M2c starts with 25 ppbv of HONO, comparable to maximum levels observed in other western USA wildfires (Peng et al., 2020). The photolysis of HONO increases OH and NO production, leading to faster VOC decay and product formation (Figs. 2 and S11). Intensification is limited to the first few hours, and the decay of short-lived alkenes, like propene and butenes, is too slow at later ages (Fig. 2c). NOx agreement also improves at early times, but under-prediction persists after 3 h of aging (Fig. 2i). PAN and O3 profiles are close to those in the base simulation (Fig. 2j–k). Observed NOy NEMRs are over-predicted (Fig. S17).
Photolysis of pNO leads to more sustained impacts. Simulation M3b uses the literature-derived rate for reaction R1 (Ye et al., 2017). For this case, median OH increases by a factor of 3.5 relative to simulation M1 (Fig. S11), improving model agreement with short-lived VOC (Fig. 2b–c). HO2 is mostly unchanged, reflecting a counterbalance of faster production via VOC oxidation and faster loss via reaction with NO. Unique to the mechanisms tested in this study, pNO photolysis reproduces the enhancements in HCHO and NOx NEMRs observed at later ages (Fig. 2g, i). The HONO NEMR at ages beyond 2 h also aligns with values observed in other wildfires (Fig. S20b). On the other hand, PAN and ozone are now over-predicted (Fig. 2j–k), as are ΣPN, some speciated PNs, and ΣNOy,obs (Figs. S14, S15, S17). Halving the pNO photolysis rate improves the agreement with PAN and O3 at the expense of NOx and HCHO (Fig. S22; compare simulations M3a and M3b). Over-prediction of PAN and its analogues in these simulations may reflect errors in the VOC distribution and/or chemical kinetics (Sect. 4.3). These simplified simulations also do not consider age-dependent variability in aerosol composition (e.g., organic versus inorganic pNO), which could influence the effective pNO photolysis rate and product yields.
The supply of pNO imposes a practical limit on the rate of HONO and NO2 production via this process. Particulate nitrate production and loss is not rigorously modeled in our simulations, but we can estimate the magnitude of this limitation. A linear fit to the observed pNO NEMR yields an e-folding timescale of 9.6 h, whereas the effective lifetime of pNO with respect to photolysis in simulation M3b is 3.4 ± 0.6 h (mean and standard deviation, averaged over the endpoints of all puffs). Nitric acid and organic nitrate partitioning to particles may resupply some pNO downwind; observations in other wildfire plumes show pNO NEMRs increasing with age (Juncosa Calahorrano et al., 2020). Given the uncertainties regarding the fate of NOy (Sect. 4.1), the observed pNO lifetime is not a strong constraint on the potential chemical loss; however, pNO photolysis rates are unlikely to be larger than those used in our study, and the comparison with observed gas-phase NOy (Fig. S17) suggests they may be substantially slower.
HONO production via heterogeneous reaction of NO2 generally degrades agreement with observations (Fig. S23). Results from simulation M4a are nearly identical to those from M1, while in simulation M4b (γ × 1000) ozone and NOx under-prediction worsens. Coupled with rapid HONO photolysis, this process effectively converts NO2 to NO while generating OH. This acts as a non-photolytic NO2 sink and increases the loss of O3 to reaction with NO (reflected in the NO NO2 ratio), reducing net O3 production. NO2 conversion to HONO is nearly NOx neutral, whereas pNO photolysis is effectively a NOx source (Fig. S17). This is also evident in the HONO NO2 ratio, which ranges from 0.2 to 3.9 and exceeds the ratio for simulation M3b by a factor of 4 or more (Fig. S20c).
Additional reactive VOC and HONO chemistry can collectively improve the model–measurement agreement for most observed species, but the implementation of each process is not quantitatively independent. Model performance relative to observations inherently relies on a balance between oxidant sinks (VOC) and sources (HONO), both of which are uncertain. Section S4 describes extended simulations with the simultaneous tuning of initial unmeasured VOC mixing ratios, initial HONO mixing ratios, and pNO photolysis rates. Results demonstrate that multiple combinations of these processes can reasonably reproduce the age evolution of ozone and some other species. No combination of scaling factors, however, optimizes agreement among all observations.
4.1 NOy conservation
As noted in Sect. 3.1.4, the ΣNOy,obs NEMR declines by a factor of 3 over 12 h of aging. For a well-defined plume, total NOy should be conserved (Juncosa Calahorrano et al., 2020). The Rim Fire plume is larger and more disperse than most previously studied wildfires, and SEAC4RS observations provide limited information regarding variability in emissions or background concentrations. Potential explanations for the apparent decline of the ΣNOy,obs NEMR in the Rim Fire plume include (1) conversion to unmeasured NOy, (2) changing NOx emission ratios, (3) unmeasured background variability, and (4) deposition. The last of these is unlikely, given that sampling occurred in the uppermost boundary layer and lower free troposphere.
Conversion of measured to unmeasured long-lived NOy may provide a partial explanation. The SEAC4RS measurement suite includes many, but not all, classes of NOy. More recent observations of smaller USA wildfires, using new measurement techniques that better speciate organic nitrogen, have shown conservation of the ΣNOy NEMR at physical ages up to 5 h (Juncosa Calahorrano et al., 2020). Comparison to this more recent dataset suggests that unmeasured NOy (such as complex organic nitrates) might account for 10 %–20 % of the ΣNOy,obs NEMR decrease in the Rim Fire plume. Photolysis of unmeasured HONO emissions could buffer this loss by generating NOx on short timescales (Fig. S17).
Changing NOx emission ratios are another possible explanation. As discussed in Sect. 2.3, older samples represent emissions from earlier in the day, when we might expect more smoldering combustion (Wiggins et al., 2020). Other evidence for the changing fire phase, including MCE and nitrile NEMRs (Fig. S4), is inconclusive. NOx emission factors (g kg−1 of fuel burned) can increase by a factor of 2 or more over the range of typical MCE values (Lindaas et al., 2020), and we might expect a similar trend in NOx ERs. To illustrate potential impacts, we performed sensitivity tests on simulation M1 with initial NOx multiplied by a factor of 0.5 or 2 (Fig. S24). This nearly spans the range of observed ΣNOy. We have relatively more confidence in the NOx ER at early ages (Liu et al., 2017), so we focus on the half-NOx case that approaches ΣNOy,obs at later ages. Halving initial NOx reduces model O3 and PAN, increases VOC lifetimes (less OH), and increases peroxide production. Accounting for potential emission changes rigorously in the model would complicate analysis of HONO mechanisms. For example, adding HONO via initial conditions or pNO photolysis to increase radical production increases model NOy, necessitating further initial NOx reduction to maintain agreement with observed NOy. Heterogeneous conversion of NO2 does not alter total NOy, but it also does not amplify ozone. Because of these uncertainties, ΣNOy is a weak constraint on HONO chemistry in this case study. Regional and global model simulations also utilize time-invariant emission factors, which likely impacts their representation of diurnal variability of biomass burning chemistry.
Variable background mixing ratios may also impact calculated NEMRs, especially at later ages. For reasons detailed in Sect. 2.1, we assume constant backgrounds. The ΣNOy,obs background is 0.7 ppbv. Assuming instead a background of 0 ppbv increases the ΣNOy,obs NEMR by a factor of 1.45 at the oldest ages, but this is an extreme lower limit and assumes constant background CO. We have more confidence in the background estimation at early ages, when dilution is strongest. Furthermore, the same background is used for both the modeled and observed NEMRs. Thus, variable backgrounds may have some influence on observed NOy NEMRs but a lesser impact on model–measurement comparisons.
In summary, declining NOx emission ratios are the most likely explanation for the age dependence of the ΣNOy,obs NEMR, but we cannot exclude the potential influence from unmeasured NOy and changing backgrounds. These uncertainties were acknowledged at the outset of the model analysis, and this reinforces the need for caution when interpreting model–measurement agreement at later ages. Nonetheless, the comparison of different simulations can yield insight into the consequences of augmenting canonical chemistry with new species and reactions.
4.2 Radical production and fate
The inclusion of additional reactive VOC and HONO significantly accelerates radical throughput. Figure 5a–b summarize rates of key ROx (OH + HO2+ RO2+ RO) production and loss pathways integrated over the first 2.3 h of plume aging, where NEMRs change most rapidly. Compared to the base simulation, total ROx initiation and termination doubles in simulation M1 (VOC addition) and more than triples in M2c (initial HONO). As illustrated in Sect. 3, these changes influence the lifetime of reactive gases and the production of secondary compounds such as ozone, peroxides, organic nitrates, and oVOC. Comparison of O3 NEMRs in Fig. 2k, however, also demonstrates simulation of an ozone profile that reasonably matches observations even with missing processes. Constraints on other aspects of the chemical system facilitate a holistic evaluation of additional chemistry.
Photolysis sources dominate radical initiation (Fig. 5a). Photolysis of O3 to O1D and H2O2 are each less than 2 % of total production in all simulations. In the base simulation, photolysis of HCHO and other oVOC comprises 75 % of the radical source. Enhanced reactive VOC in simulation M1 doubles the initiation rate, mainly via further oVOC photolysis and alkene ozonolysis. The largest contributors in the former category are glyoxal (19 %) and methyl glyoxal (15 %). HONO photolysis in simulations M2–M4 further accelerates initiation. Simulation M2c (initial HONO) exhibits the most substantial increase in the plotted simulations, with HONO photolysis comprising 33 % of initiation.
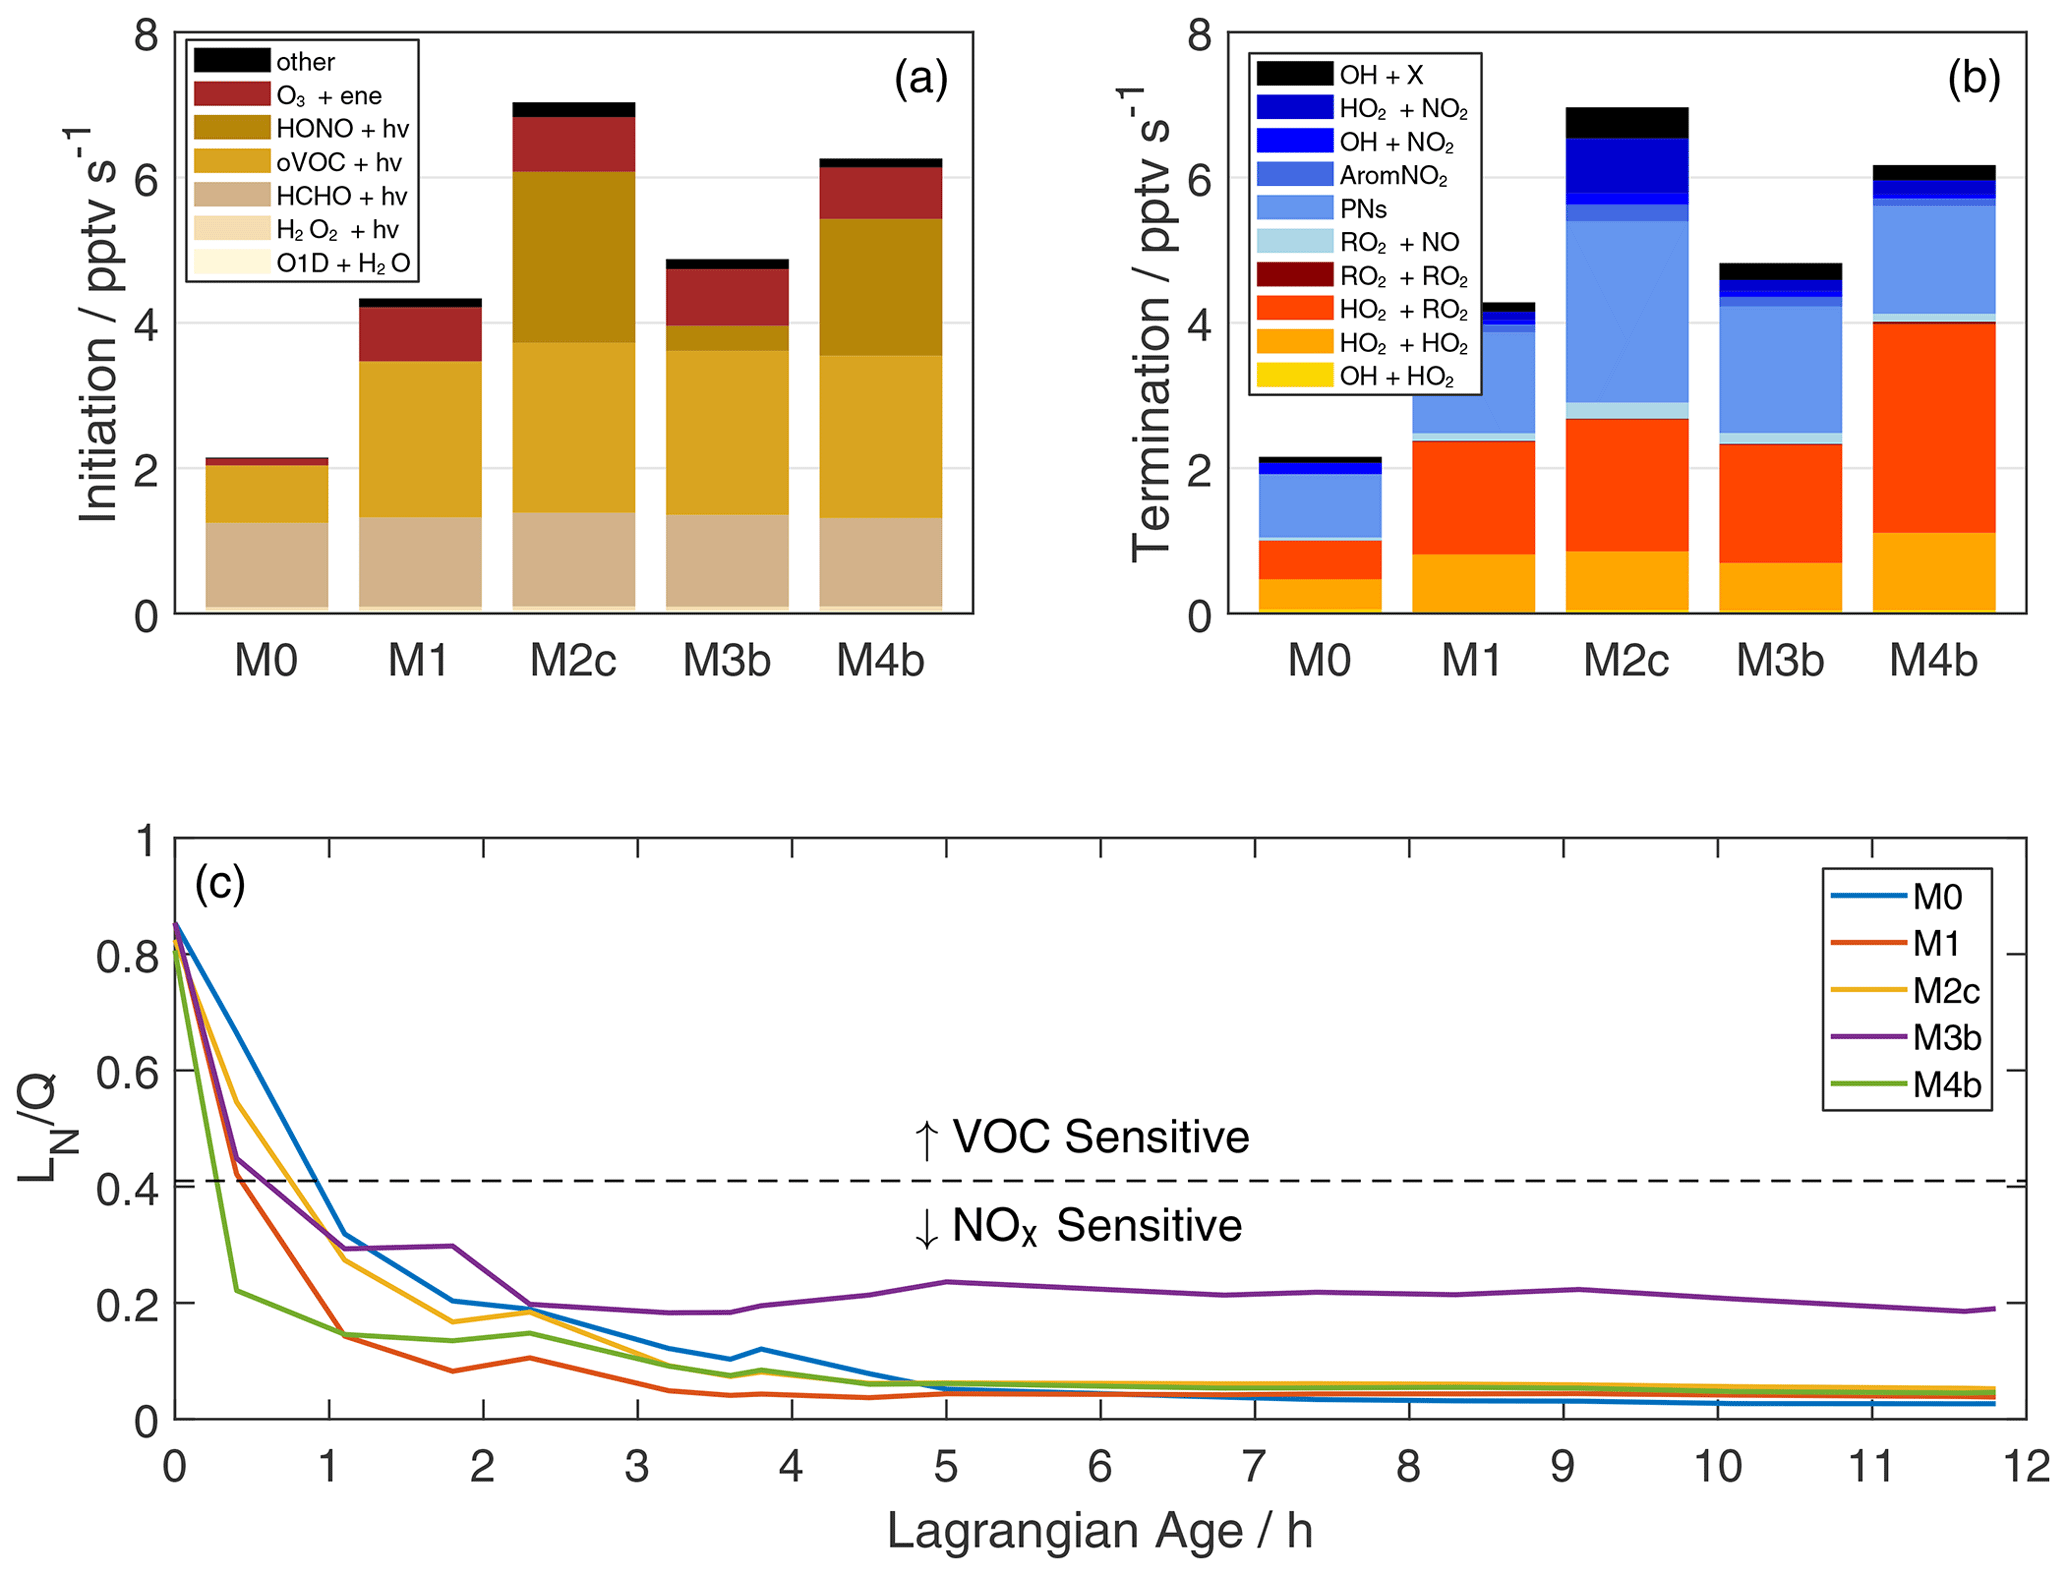
Figure 5Rates of ROx initiation (a) and termination (b) integrated over the first five data points (Lagrangian age 0–2.3 h) via trapezoidal integration. In panel (a), oVOC + hν includes all oVOC photolysis reactions other than HCHO, and “other” includes NO3+ VOC and other minor reactions. In panel (b), yellow–red and blue shades represent ROx-ROx and ROx-NOx reactions, respectively. AromNO2 represents the formation of nitroaromatics, and PNs are the net formation of peroxy nitrates. OH + X (purple) represents reactions of OH with organic compounds (typically PNs), which result in formation of NO2 and other non-ROx products. The fraction of ROx radicals lost via reactions with NOx is shown in panel (c). Model simulations are as described in Fig. 2 and Table 1. The dashed line denotes the approximate transition between NOx-sensitive and VOC-sensitive ozone production for biomass burning chemistry, as suggested by Robinson et al. (2021).
The relative contribution of HONO is smaller here than in other recent studies (Peng et al., 2020; Robinson et al., 2021; Theys et al., 2020) for at least two reasons. First, we average over the first 2.3 h of aging based on observed rapid ozone production, while other studies may integrate over a shorter timescale when HONO is relatively more important. Second, incorporation of an extended VOC pool greatly enhances oVOC photolysis in our study. oVOC photolysis may be underestimated in previous radical production estimates. Peng et al. (2020) only account for HCHO and CH3CHO, Theys et al. (2020) account for photolysis of 16 oVOC, and Robinson et al. (2021) do not incorporate VOC beyond those appearing in the MCM or the extended biomass burning mechanism. There is uncertainty in this contribution due to MCM mapping of VOC (Table S2; Fig. S6). Nonetheless, studies failing to account for all oVOC may under-predict radical initiation and over-estimate the relative importance of other radical sources. This may also be the case for urban environments (Qu et al., 2021).
Radical termination includes significant contributions from both ROx-ROx and ROx-NOx reactions (Fig. 5b). Formation of peroxides comprises most of the former group, with equal contributions from HO2+ HO2 and RO2+ HO2 in simulation M0. The addition of reactive VOC in M1 doubles the rate of HO2+ HO2 and triples the rate of RO2+ HO2. PN formation comprises 65 %–86 % of ROx-NOx termination, with larger contributions at higher VOC and higher initial HONO. Pernitric acid formation (HO2+ NO2) is 18 % of ROx-NOx termination in simulation S2c, reflecting fast formation in the concentrated plume followed by rapid dilution that outpaces thermal decomposition. Contributions of nitric acid (OH + NO2) and nitroaromatic (AromNO2) formation are 3 %–15 % and 0.1 %–6 % of ROx-NOx termination, respectively. The OH + X group includes reaction of OH with HONO and PNs to form NO2 and other products. These reactions remove ROx, but they are not strictly radical termination.
The balance of ROx loss via NOx and ROx sinks, typically represented as the ratio of NOx-related loss (LN) to total radical loss or production (Q), quantifies the sensitivity of ozone production to VOC and NOx availability (Kleinman et al., 1997; Kleinman, 2005). Here we define LN as the sum of losses via formation of ANs, PNs, nitroaromatics, nitric acid, and pernitric acid (blue-shaded reactions in Fig. 5b). Traditionally, the assumption that HNO3 formation is the dominant NOx sink implies a transition from VOC to NOx-sensitive O3 production at (Kleinman et al., 1997). Non-negligible organic nitrate formation alters this threshold (Robinson et al., 2021; Schroeder et al., 2017). We adopt a threshold of based on a recent study of western USA wildfires (Robinson et al., 2021).
Ozone production in the young plume is sensitive to both VOC and NOx (Fig. 5c). All plotted simulations start with a ratio around 0.8 (VOC sensitive) and transition to NOx sensitive within the first hour. This rapid shift is consistent with afternoon aging in other western USA wildfires (Robinson et al., 2021) and reflects sequestration of NOx within PNs and other organic nitrates. The addition of VOC in simulation M1 accelerates this transition (more ROx), while HONO slows the transition in M2c and M3b. Simulation M4b exhibits the fastest transition, where the NO2 conversion to HONO amplifies ROx and mitigates PAN formation.
The consequences of secondary chemistry assumptions become more apparent at later ages. Most simulations decay to steady values of 0.03–0.06 after 5 h of aging. Simulation M3b is the exception, maintaining around 0.2 due to a sustained NOx source via pNO photolysis. The accuracy of this simulation is dubious due to a lack of HONO observations; however, the contrast between M3b and M4b illustrates the divergent effects of HONO production mechanisms on radical chemistry. Such differences can affect sensitivity to downwind perturbations, such as when mixing with urban (high NOx) or biogenic (high VOC) air.
4.3 Implications for modeling biomass burning chemistry
Box model deficiencies temper the above results and underscore the challenges of simulating smoke plume chemistry. Simulations including both unmeasured reactive VOC and initial HONO or pNO photolysis (M2c or M3b) reasonably match observed NEMRs in the first 2 h of aging (Fig. 2); however, none of the scenarios explored here simultaneously reconcile O3, NOx, and PAN throughout the whole sample period. Errors due to assumptions about emissions and air mass history may become more significant further downwind; for example, the model does not capture the large decline in total observed NOy (Fig. S17). Better observations of emission and background variability would reduce uncertainty, although this can be logistically challenging for large smoke plumes like the Rim Fire.
Errors in kinetics or VOC speciation may also contribute to model uncertainties. For example, our mechanism includes updated reaction rate coefficients for PA + HO2 (faster by a factor of 1.33) and PAA + OH (slower by a factor of 123), based on recent laboratory results (Berasategui et al., 2020; Jenkin et al., 2019). Using MCM default values instead reduces model PAA NEMRs by half (results not shown). Analogous changes to other aspects of the mechanism, due to yet-unrecognized systematic errors, could influence other species. Over-prediction of PAN in simulations M2c and M3b may reflect errors in the thermal equilibrium, the NO NO2 ratio (under-predicted at later ages in simulation M3b), and/or VOC speciation. Regarding the last issue, acetaldehyde oxidation comprises half of PA production in our simulations, while the other half stems from mostly unmeasured precursors like methyl glyoxal (24 % of production; Fig. S25). Observations of major PAN precursors are necessary to close the PAN budget. Observations of PNs with specific precursors also afford complementary information; for example, over-prediction of acryloyl peroxynitrate (APAN) in most scenarios (Fig. S14) may imply that initial acrolein is too high. Observations of HONO, HO2NO2, and total NOy would also help to fully constrain radical sources, cycling, and fate.
For regional and global models, whether and how to account for the full VOC distribution remains an open challenge. Advances in instrumentation have facilitated the quantification of myriad reactive gases (Heald and Kroll, 2020). Cumulatively, individually minor species can comprise a significant fraction of OH reactivity (Fig. 4) and potential organic aerosol mass (Gilman et al., 2015). Condensed mechanisms cannot represent this level of speciation. One option to reduce this complexity, similar to our methodology, is to identify proxy or surrogate species within a given mechanism based on mass, molecular formula, reactivity, volatility, or other metrics. Given the complexity of smoke plume chemistry, machine learning techniques may also prove useful for condensing VOC into a manageable framework (Kelp et al., 2020). Multifaceted observations of emissions, oxidation products, and reaction intermediates can constrain representation of key chemical processes that influence the spatial and temporal extent of air quality and climate impacts.
Many atmospheric chemistry models do not incorporate primary emissions or the heterogeneous production of HONO in standard simulations. Primary HONO is a key oxidant source in young fire plumes (Peng et al., 2020). The HONO photolysis lifetime of 10–20 min can be of the order of, or much shorter than, an advection timescale for a single grid cell (e.g., a 12 km grid cell at a wind speed of 10 m s−1 has an advection timescale of 20 min). Thus, instantaneous dilution may be a major hurdle to simulating this fast chemistry. Plume heterogeneity (e.g., a darker core) also confounds efforts to simulate chemistry in an average sense (Wang et al., 2021; Palm et al., 2021; Decker et al., 2021b). Putative secondary HONO sources are manifold (Zhang et al., 2019), as are associated uncertainties. A recent lab study of pNO photolysis on inorganic aerosol suggests a 10 times slower photolysis rate than assumed in simulation M3b (Shi et al., 2021), and a similar reduction was derived from an analysis of NOy partitioning in polluted marine air (Romer et al., 2018). Other lab work has shown that the rate and product yield of this reaction is sensitive to aerosol surface composition (Ma et al., 2021). Robust parameterizations will require continued systematic study of controlling factors, preferably under environmentally relevant and near-ambient conditions.
Wildfire emissions may have a more sustained influence on regional background chemistry than is currently appreciated. Synergistic increases in OH reactivity and oxidants in our sensitivity simulations stimulate production of multi-generation oVOC and organic NOx reservoirs like PAN, which may alter the spatiotemporal scale of ozone and organic aerosol production. The modest decline of normalized excess OH reactivity (Fig. 4b) further implies that active chemistry persists far downwind. For example, the 62 % decrease in normalized excess OH reactivity in simulation M3b implies an effective pseudo-first-order photochemical lifetime of 12.2 h for the total OH sink. This aligns with a recent analysis of satellite observations suggesting an effective lifetime of 20 h or more for formaldehyde and glyoxal in aging smoke plumes (Alvarado et al., 2020). Space-based remote sensing of atmospheric composition may aid evaluation of model biomass burning emissions and chemistry on these scales.
Using a 0-D puff model constrained with SEAC4RS in situ observations, we have examined the gas-phase chemical evolution of the 2013 California Rim Fire plume and illustrated the sensitivity of chemistry to unmeasured reactive VOC and HONO. The rich measurement suite permits a holistic evaluation of the various components of the chemical system, including VOC, HOx, NOy, and O3. Initializing with observed gases only, the model reasonably reproduces the evolution of O3 over 12 h of aging but fails in other key aspects, including over-prediction of reactive VOC decay rates and under-prediction of NOx and HCHO. Accounting for additional VOC identified by recent laboratory studies increases OH reactivity more than twofold throughout the simulation, drawing down model OH and generally degrading performance. Subsequent addition of HONO amplifies radical production and cycling. The addition of initial HONO (assumed to be primary emissions) or secondary production via pNO photolysis improves predictions of ozone, oVOC, and NOx, while HONO production via NO2 heterogeneous conversion generally degrades model performance. Further optimization simulations demonstrate that multiple combinations of enhanced VOC and primary/secondary HONO can minimize model–measurement bias with respect to O3 and NOx, although we cannot reconcile the model with all observations simultaneously. A decline in total observed NOy with age may be due to unmeasured NOy, changing NOx emission ratios, or unmeasured background variability; the exact cause for this behavior remains unresolved. An examination of model reaction rates over the first 2.3 h of aging demonstrates the potentially dominant contribution of oVOC photolysis to radical initiation, the importance of PN formation as a NOx sink and the competitive roles of ROx-ROx and ROx-NOx reactions in radical termination. Ozone production is sensitive to both VOC and NOx in the young plume for all sensitivity simulations. Ozone production transitions from VOC sensitive to NOx sensitive after ∼ 1 h of aging. The timing of this transition depends on VOC and HONO. Downwind NOx sensitivity depends on the nature and efficacy of assumed secondary HONO NOx sources.
A primary finding of this study is that reactive VOC and oxidant sources are complementary in the wildfire-influenced atmosphere, and consideration of both is necessary for accurate simulation of near- and far-field impacts on atmospheric composition and air quality. Future efforts must focus on an efficient solution for incorporating this somewhat novel chemistry in regional and global models or else quantify the uncertainty associated with neglecting it.
This work also demonstrates the value of a near-comprehensive payload afforded by a heavy-lift aircraft like the NASA DC-8. The breadth of information in the SEAC4RS dataset enables a holistic examination of individual aspects of the chemical system within the context of the whole. Ongoing analysis of data from missions focused on biomass burning will illuminate the factors driving variability in reactive VOC, HONO, and other key aspects of fire plume chemistry. This same approach is beneficial for investigation of other complex environments (urban, biogenic, etc.) that comprise the lower troposphere.
For each puff, photolysis frequency J at solar time t (and a corresponding Lagrangian plume age) is calculated as follows:
Here, Jcs(t) is the clear-sky photolysis frequency and s and r(age) are observation-based scaling factors. Clear-sky photolysis frequencies stem from F0AM's hybrid parameterization, which combines solar spectra from the tropospheric ultraviolet and visible radiative transfer model (TUVv5.2, available at https://www2.acom.ucar.edu/modeling/tropospheric-ultraviolet-and-visible-tuv-radiation-model, last access: 22 February 2022) with the literature-recommended cross sections and quantum yields. This calculation uses actual SZA and measurement altitude. We assume an overhead ozone column of 290 DU and a surface albedo of 0.01. The age-dependent scaling factor r (age) is determined by fitting the ratio of clear sky to observed photolysis frequencies as a function of Lagrangian age, using a modified exponential as follows:
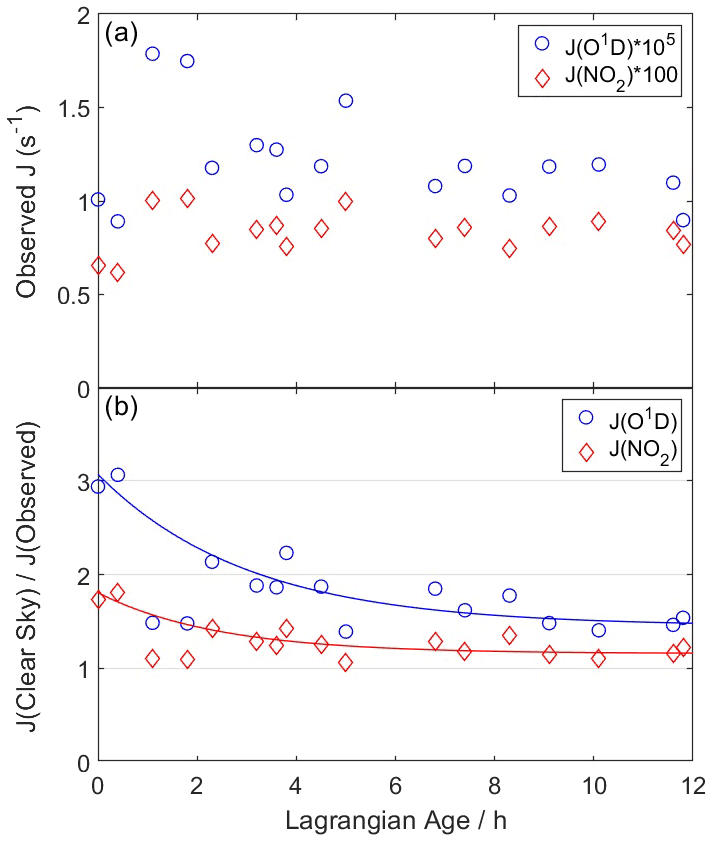
Figure A1(a) Average observed photolysis frequencies for each WAS sample for O3→ O(1D) + O2 (blue circles) and NO2→ NO + O(3P) (red diamonds). (b) Ratio of clear-sky to observed photolysis frequencies. Clear-sky values are calculated using tropospheric ultraviolet and visible radiative transfer model (TUV) solar spectra and F0AM parameterizations. Lines represent least squares fits to Eq. (A2). The two points between ages of 1–2 h are excluded from the fit.
Here, r0, r∞, and τ are fitting coefficients that vary for each J. Figure A1 illustrates this fit for ozone and NO2 photolysis frequencies, which are suppressed by factors of 3.2 and 1.9, respectively, in the fresh plume. Fits capture 83 %–92 % of the variability in the clear-sky to observed ratio for all J values, with the exception of two points with ages of 1–2 h. These points are not included in the fit as they appear to be outliers, especially for J(O1D), and their inclusion would significantly degrade the overall fit quality. It is unclear why these points differ from the overall trend, as no other dilution or chemical markers show exceptional behavior at these times. The age correction is the same for all puffs. The other parameter, s, is a scalar multiplicative factor that adjusts model J values to agree with observations at trajectory endpoints (analogous to the scaling applied for trajectory meteorology) and is different for each puff.
Data used in this study are archived at https://doi.org/10.5067/Aircraft/SEAC4RS/Aerosol-TraceGas-Cloud (SEAC4RS Science Team, 2013). The F0AM box model is available at https://github.com/AirChem/F0AM (last access: 18 May 2021) and https://doi.org/10.5281/zenodo.5752566 (Wolfe, 2021). The model setup code is available from the contact author upon request.
The supplement related to this article is available online at: https://doi.org/10.5194/acp-22-4253-2022-supplement.
GMW conceptualized the study, conducted the modeling and analysis, and wrote the paper. All authors contributed to the collection of SEAC4RS observations used to constrain and evaluate the model.
At least one of the (co-)authors is a member of the editorial board of Atmospheric Chemistry and Physics. The peer-review process was guided by an independent editor, and the authors also have no other competing interests to declare.
Publisher’s note: Copernicus Publications remains neutral with regard to jurisdictional claims in published maps and institutional affiliations.
The SEAC4RS mission was supported by the NASA Tropospheric Composition program and grants from the NASA ROSES SEAC4RS program (grant nos. NNH10ZDA001N, NNX12AC03G, and NNX12AB82G). We thank the DC-8 pilots, crew, payload operators, and mission scientists, for their hard work and dedication. We thank Luke Ziemba, Lee Thornhill, and the LARGE team, for the LAS data. We thank Anthony Bucholtz, for the BBR data. We are also grateful to NASA ESPO, for the mission logistics. Analysis and modeling were supported by NOAA Climate Program Office's Atmospheric Chemistry, Carbon Cycle, and Climate program (grant no. NA17OAR4310004). The Jimenez group acknowledges support from NASA (grant nos. 80NSSC19k0124 and 80NSSC18K0630). The PTR-MS measurements during SEAC4RS were supported by the Austrian Federal Ministry for Transport, Innovation, and Technology (bmvit) through the Austrian Space Applications Programme (ASAP) of the Austrian Research Promotion Agency (FFG). Armin Wisthaler and Tomas Mikoviny received support from the Visiting Scientist Program at the National Institute of Aerospace (NIA). We thank many colleagues for their assistance, insight, and feedback, including Steve Brown, Christine Wiedinmyer, Sarah Strode, Ann Marie Carlton, Matt Coggon, Jim Roberts, Joel Thornton, and Qiaoyun Peng.
This research has been supported by the NASA Earth Sciences Division (grant nos. NNH10ZDA001N, NNX12AC03G, NNX12AB82G, 80NSSC19K0124, and 80NSSC18K0630) and the NASA Climate Program Office (grant no. NA17OAR4310004).
This paper was edited by Andreas Hofzumahaus and reviewed by D. A. J. Jaffe and one anonymous referee.
Adler, G., Wagner, N. L., Lamb, K. D., Manfred, K. M., Schwarz, J. P., Franchin, A., Middlebrook, A. M., Washenfelder, R. A., Womack, C. C., Yokelson, R. J., and Murphy, D. M.: Evidence in biomass burning smoke for a light-absorbing aerosol with properties intermediate between brown and black carbon, AEROSOL Sci. Technol., 53, 976–989, https://doi.org/10.1080/02786826.2019.1617832, 2019.
Akagi, S. K., Yokelson, R. J., Wiedinmyer, C., Alvarado, M. J., Reid, J. S., Karl, T., Crounse, J. D., and Wennberg, P. O.: Emission factors for open and domestic biomass burning for use in atmospheric models, Atmos. Chem. Phys., 11, 4039–4072, https://doi.org/10.5194/acp-11-4039-2011, 2011.
Akagi, S. K., Craven, J. S., Taylor, J. W., Mcmeeking, G. R., Yokelson, R. J., Burling, I. R., Urbanski, S. P., Wold, C. E., Seinfeld, J. H., Coe, H., Alvarado, M. J., and Weise, D. R.: Evolution of trace gases and particles emitted by a chaparral fire in California, Atmos. Chem. Phys., 12, 1397–1421, https://doi.org/10.5194/acp-12-1397-2012, 2012.
Akagi, S. K., Yokelson, R. J., Burling, I. R., Meinardi, S., Simpson, I., Blake, D. R., McMeeking, G. R., Sullivan, A., Lee, T., Kreidenweis, S., Urbanski, S., Reardon, J., Griffith, D. W. T., Johnson, T. J., and Weise, D. R.: Measurements of reactive trace gases and variable O3 formation rates in some South Carolina biomass burning plumes, Atmos. Chem. Phys., 13, 1141–1165, https://doi.org/10.5194/acp-13-1141-2013, 2013.
Allen, H. M., Crounse, J. D., Bates, K. H., Teng, A. P., Krawiec-thayer, M. P., Rivera-rios, J. C., Keutsch, F. N., Clair, J. M. S., Hanisco, T. F., Møller, K. H., Kjaergaard, H. G., and Wennberg, P. O.: Kinetics and Product Yields of the OH Initiated Oxidation of Hydroxymethyl Hydroperoxide, J. Phys. Chem. A, 122, 6292–6302, https://doi.org/10.1021/acs.jpca.8b04577, 2018.
Alvarado, L. M. A., Richter, A., Vrekoussis, M., Hilboll, A., Kalisz Hedegaard, A. B., Schneising, O., and Burrows, J. P.: Unexpected long-range transport of glyoxal and formaldehyde observed from the Copernicus Sentinel-5 Precursor satellite during the 2018 Canadian wildfires, Atmos. Chem. Phys., 20, 2057–2072, https://doi.org/10.5194/acp-20-2057-2020, 2020.
Alvarado, M. J. and Prinn, R. G.: Formation of ozone and growth of aerosols in young smoke plumes from biomass burning: 1. Lagrangian parcel studies, J. Geophys. Res.-Atmos., 114, D09306, https://doi.org/10.1029/2008jd011144, 2009.
Alvarado, M. J., Logan, J. A., Mao, J., Apel, E., Riemer, D., Blake, D., Cohen, R. C., Min, K. E., Perring, A. E., Browne, E. C., Wooldridge, P. J., Diskin, G. S., Sachse, G. W., Fuelberg, H., Sessions, W. R., Harrigan, D. L., Huey, G., Liao, J., Case-Hanks, A., Jimenez, J. L., Cubison, M. J., Vay, S. A., Weinheimer, A. J., Knapp, D. J., Montzka, D. D., Flocke, F. M., Pollack, I. B., Wennberg, P. O., Kurten, A., Crounse, J., Clair, J. M. S., Wisthaler, A., Mikoviny, T., Yantosca, R. M., Carouge, C. C., and Le Sager, P.: Nitrogen oxides and PAN in plumes from boreal fires during ARCTAS-B and their impact on ozone: an integrated analysis of aircraft and satellite observations, Atmos. Chem. Phys., 10, 9739–9760, https://doi.org/10.5194/acp-10-9739-2010, 2010.
Alvarado, M. J., Lonsdale, C. R., Yokelson, R. J., Akagi, S. K., Coe, H., Craven, J. S., Fischer, E. V, McMeeking, G. R., Seinfeld, J. H., Soni, T., Taylor, J. W., Weise, D. R., and Wold, C. E.: Investigating the links between ozone and organic aerosol chemistry in a biomass burning plume from a prescribed fire in California chaparral, Atmos. Chem. Phys., 15, 6667–6688, https://doi.org/10.5194/acp-15-6667-2015, 2015.
Ammann, M., Kalberer, M., Jost, D. T., Tobler, L., Rössler, E., Piguet, D., Gäggeler, H. W., and Baltensperger, U.: Heterogeneous production of nitrous acid on soot in polluted air masses, Nature, 395, 157–160, https://doi.org/10.1038/25965, 1998.
Andreae, M. O.: Emission of trace gases and aerosols from biomass burning – An updated assessment, Atmos. Chem. Phys., 19, 8523–8546, https://doi.org/10.5194/acp-19-8523-2019, 2019.
Assaf, E., Song, B., Tomas, A., Schoemaecker, C., and Fittschen, C.: Rate Constant of the Reaction between CH3O2 Radicals and OH Radicals Revisited, J. Phys. Chem. A, 120, 8923–8932, https://doi.org/10.1021/acs.jpca.6b07704, 2016.
Atkinson, R. and Arey, J.: Atmospheric degradation of volatile organic compounds, Chem. Rev., 103, 4605–4638, 2003.
Atkinson, R., Baulch, D. L., Cox, R. A., Crowley, J. N., Hampson, R. F., Hynes, R. G., Jenkin, M. E., Rossi, M. J., and Troe, J.: Evaluated kinetic and photochemical data for atmospheric chemistry: Volume I – gas phase reactions of Ox, HOx, NOx and SOx species, Atmos. Chem. Phys., 4, 1461–1738, https://doi.org/10.5194/acp-4-1461-2004, 2004.
Aumont, B., Chervier, F., and Laval, S.: Contribution of HONO sources to the NOx HOx O3 chemistry in the polluted boundary layer, Atmos. Environ., 37, 487–498, https://doi.org/10.1016/S1352-2310(02)00920-2, 2003.
Baergen, A. M. and Donaldson, D. J.: Photochemical Renoxification of Nitric Acid on Real Urban Grime, Environ. Sci. Technol., 47, 815–820, https://doi.org/10.1021/es3037862, 2013.
Baker, K. R., Woody, M. C., Valin, L., Szykman, J., Yates, E. L., Iraci, L. T., Choi, H. D., Soja, A. J., Koplitz, S. N., Zhou, L., Campuzano-Jost, P., Jimenez, J. L., and Hair, J. W.: Photochemical model evaluation of 2013 California wild fire air quality impacts using surface, aircraft, and satellite data, Sci. Total Environ., 637/638, 1137–1149, https://doi.org/10.1016/j.scitotenv.2018.05.048, 2018.
Baylon, P., Jaffe, D. A., Hall, S. R., Ullmann, K., Alvarado, M. J., and Lefer, B. L.: Impact of Biomass Burning Plumes on Photolysis Rates and Ozone Formation at the Mount Bachelor Observatory, J. Geophys. Res.-Atmos., 123, 2272–2284, https://doi.org/10.1002/2017JD027341, 2018.
Berasategui, M., Amedro, D., Vereecken, L., Lelieveld, J., and Crowley, J. N.: Reaction between CH3C(O)OOH (peracetic acid) and OH in the gas phase: a combined experimental and theoretical study of the kinetics and mechanism, Atmos. Chem. Phys., 20, 13541–13555, https://doi.org/10.5194/acp-20-13541-2020, 2020.
Box, G. E. P.: Science and Statistics, J. Am. Stat. Assoc., 71, 791–799, https://doi.org/10.2307/2286841, 1976.
Buysse, C. E., Kaulfus, A., Nair, U., and Jaffe, D. A.: Relationships between Particulate Matter, Ozone, and Nitrogen Oxides during Urban Smoke Events in the Western US, Environ. Sci. Technol., 53, 12519–12528, https://doi.org/10.1021/acs.est.9b05241, 2019.
Caravan, R. L., Khan, M. A. H., Zádor, J., Sheps, L., Antonov, I. O., Rotavera, B., Ramasesha, K., Au, K., Chen, M., Rösch, D., Osborn, D. L., Fittschen, C., Schoemaecker, C., Duncianu, M., Grira, A., Dusanter, S., Tomas, A., Percival, C. J., Shallcross, D. E., and Taatjes, C. A.: The reaction of hydroxyl and methylperoxy radicals is not a major source of atmospheric methanol, Nat. Commun., 9, 4343, https://doi.org/10.1038/s41467-018-06716-x, 2018.
Chai, J., Dibb, J. E., Anderson, B. E., Bekker, C., Blum, D. E., Heim, E., Jordan, C. E., Joyce, E. E., Kaspari, J. H., Munro, H., Walters, W. W., and Hastings, M. G.: Isotopic evidence for dominant secondary production of HONO in near-ground wildfire plumes, Atmos. Chem. Phys., 21, 13077–13098, https://doi.org/10.5194/acp-21-13077-2021, 2021.
Coggon, M. M., Lim, C. Y., Koss, A. R., Sekimoto, K., Yuan, B., Gilman, J. B., Hagan, D. H., Selimovic, V., Zarzana, K. J., Brown, S. S., M Roberts, J., Müller, M., Yokelson, R., Wisthaler, A., Krechmer, J. E., Jimenez, J. L., Cappa, C., Kroll, J. H., De Gouw, J., and Warneke, C.: OH chemistry of non-methane organic gases (NMOGs) emitted from laboratory and ambient biomass burning smoke: Evaluating the influence of furans and oxygenated aromatics on ozone and secondary NMOG formation, Atmos. Chem. Phys., 19, 14875–14899, https://doi.org/10.5194/acp-19-14875-2019, 2019.
Daranlot, J., Hickson, K. M., Loison, J.-C., Méreau, R., Caralp, F., Forst, W., and Bergeat, A.: Gas-Phase Kinetics of the Hydroxyl Radical Reaction with Allene: Absolute Rate Measurements at Low Temperature, Product Determinations, and Calculations, J. Phys. Chem. A, 116, 10871–10881, https://doi.org/10.1021/jp304831x, 2012.
Day, D. A., Campuzano-Jost, P., Nault, B. A., Palm, B. B., Hu, W., Guo, H., Wooldridge, P. J., Cohen, R. C., Docherty, K. S., Huffman, J. A., de Sá, S. S., Martin, S. T., and Jimenez, J. L.: A systematic re-evaluation of methods for quantification of bulk particle-phase organic nitrates using real-time aerosol mass spectrometry, Atmos. Meas. Tech., 15, 459–483, https://doi.org/10.5194/amt-15-459-2022, 2022.
Decker, Z. C. J., Zarzana, K. J., Coggon, M., Min, K.-E., Pollack, I., Ryerson, T. B., Peischl, J., Edwards, P., Dubé, W. P., Markovic, M. Z., Roberts, J. M., Veres, P. R., Graus, M., Warneke, C., de Gouw, J., Hatch, L. E., Barsanti, K. C., and Brown, S. S.: Nighttime Chemical Transformation in Biomass Burning Plumes: A Box Model Analysis Initialized with Aircraft Observations, Environ. Sci. Technol., 53, 2529–2538, https://doi.org/10.1021/acs.est.8b05359, 2019.
Decker, Z. C. J., Robinson, M. A., Barsanti, K. C., Bourgeois, I., Coggon, M. M., DiGangi, J. P., Diskin, G. S., Flocke, F. M., Franchin, A., Fredrickson, C. D., Gkatzelis, G. I., Hall, S. R., Halliday, H., Holmes, C. D., Huey, L. G., Lee, Y. R., Lindaas, J., Middlebrook, A. M., Montzka, D. D., Moore, R., Neuman, J. A., Nowak, J. B., Palm, B. B., Peischl, J., Piel, F., Rickly, P. S., Rollins, A. W., Ryerson, T. B., Schwantes, R. H., Sekimoto, K., Thornhill, L., Thornton, J. A., Tyndall, G. S., Ullmann, K., Van Rooy, P., Veres, P. R., Warneke, C., Washenfelder, R. A., Weinheimer, A. J., Wiggins, E., Winstead, E., Wisthaler, A., Womack, C., and Brown, S. S.: Nighttime and daytime dark oxidation chemistry in wildfire plumes: an observation and model analysis of FIREX-AQ aircraft data, Atmos. Chem. Phys., 21, 16293–16317, https://doi.org/10.5194/acp-21-16293-2021, 2021a.
Decker, Z. C. J., Wang, S., Bourgeois, I., Campuzano Jost, P., Coggon, M. M., DiGangi, J. P., Diskin, G. S., Flocke, F. M., Franchin, A., Fredrickson, C. D., Gkatzelis, G. I., Hall, S. R., Halliday, H., Hayden, K., Holmes, C. D., Huey, L. G., Jimenez, J. L., Lee, Y. R., Lindaas, J., Middlebrook, A. M., Montzka, D. D., Neuman, J. A., Nowak, J. B., Pagonis, D., Palm, B. B., Peischl, J., Piel, F., Rickly, P. S., Robinson, M. A., Rollins, A. W., Ryerson, T. B., Sekimoto, K., Thornton, J. A., Tyndall, G. S., Ullmann, K., Veres, P. R., Warneke, C., Washenfelder, R. A., Weinheimer, A. J., Wisthaler, A., Womack, C., and Brown, S. S.: Novel Analysis to Quantify Plume Crosswind Heterogeneity Applied to Biomass Burning Smoke, Environ. Sci. Technol., 55, 15646–15657, https://doi.org/10.1021/acs.est.1c03803, 2021b.
Duncan, B. N., Logan, J. A., Bey, I., Megretskaia, I. A., Yantosca, R. M., Novelli, P. C., Jones, N. B., and Rinsland, C. P.: Global budget of CO, 1988–1997: Source estimates and validation with a global model, J. Geophys. Res.-Atmos., 112, D22301, https://doi.org/10.1029/2007JD008459, 2007.
Forrister, H., Liu, J., Scheuer, E., Dibb, J., Ziemba, L., Thornhill, K. L., Anderson, B., Diskin, G., Perring, A. E., Schwarz, J. P., Campuzano-Jost, P., Day, D. A., Palm, B. B., Jimenez, J. L., Nenes, A., and Weber, R. J.: Evolution of brown carbon in wildfire plumes, Geophys. Res. Lett., 42, 4623–4630, https://doi.org/10.1002/2015GL063897, 2015.
Gilman, J. B., Lerner, B. M., Kuster, W. C., Goldan, P. D., Warneke, C., Veres, P. R., Roberts, J. M., de Gouw, J. A., Burling, I. R., and Yokelson, R. J.: Biomass burning emissions and potential air quality impacts of volatile organic compounds and other trace gases from temperate fuels common in the US, Atmos. Chem. Phys., 15, 13915–13938, https://doi.org/10.5194/acp-15-13915-2015, 2015.
Hatch, L. E., Yokelson, R. J., Stockwell, C. E., Veres, P. R., Simpson, I. J., Blake, D. R., Orlando, J. J., and Barsanti, K. C.: Multi-instrument comparison and compilation of non-methane organic gas emissions from biomass burning and implications for smoke-derived secondary organic aerosol precursors, Atmos. Chem. Phys., 17, 1471–1489, https://doi.org/10.5194/acp-17-1471-2017, 2017.
Hatch, L. E., Jen, C. N., Kreisberg, N. M., Selimovic, V., Yokelson, R. J., Stamatis, C., York, R. A., Foster, D., Stephens, S. L., Goldstein, A. H., and Barsanti, K. C.: Highly Speciated Measurements of Terpenoids Emitted from Laboratory and Mixed-Conifer Forest Prescribed Fires, Environ. Sci. Technol., 53, 9418–9428, https://doi.org/10.1021/acs.est.9b02612, 2019.
Heald, C. L. and Kroll, J. H.: The fuel of atmospheric chemistry: Toward a complete description of reactive organic carbon, Sci. Adv., 6, eaay8967, https://doi.org/10.1126/sciadv.aay8967, 2020.
Hodshire, A. L., Akherati, A., Alvarado, M. J., Brown-Steiner, B., Jathar, S. H., Jimenez, J. L., Kreidenweis, S. M., Lonsdale, C. R., Onasch, T. B., Ortega, A. M., and Pierce, J. R.: Aging Effects on Biomass Burning Aerosol Mass and Composition: A Critical Review of Field and Laboratory Studies, Environ. Sci. Technol., 53, 10007–10022, https://doi.org/10.1021/acs.est.9b02588, 2019.
Jaffe, D. A. and Wigder, N. L.: Ozone production from wildfires: A critical review, Atmos. Environ., 51, 1–10, https://doi.org/10.1016/j.atmosenv.2011.11.063, 2012.
Jenkin, M. E., Saunders, S. M., and Pilling, M. J.: The tropospheric degradation of volatile organic compounds: A protocol for mechanism development, Atmos. Environ., 31, 81–104, 1997.
Jenkin, M. E., Young, J. C., and Rickard, A. R.: The MCM v3.3.1 degradation scheme for isoprene, Atmospheric Chem. Phys., 15, 11433–11459, https://doi.org/10.5194/acp-15-11433-2015, 2015.
Jenkin, M. E., Valorso, R., Aumont, B., and Rickard, A. R.: Estimation of rate coefficients and branching ratios for reactions of organic peroxy radicals for use in automated mechanism construction, Atmos.Chem. Phys., 19, 7691–7717, https://doi.org/10.5194/acp-19-7691-2019, 2019.
Juncosa Calahorrano, J. F. J., Lindaas, J., O'Dell, K., Palm, B. B., Peng, Q., Flocke, F., Pollack, I. B., Garofalo, L. A., Farmer, D. K., Pierce, J. R., Collett, J. L., Weinheimer, A., Campos, T., Hornbrook, R. S., Hall, S. R., Ullmann, K., Pothier, M. A., Apel, E. C., Permar, W., Hu, L., Hills, A. J., Montzka, D., Tyndall, G., Thornton, J. A., and Fischer, E. V.: Daytime Oxidized Reactive Nitrogen Partitioning in Western U.S. Wildfire Smoke Plumes, J. Geophys. Res.-Atmos., 126, e2020JD033484, https://doi.org/10.1029/2020JD033484, 2020.
Kelp, M. M., Jacob, D. J., Kutz, J. N., Marshall, J. D., and Tessum, C. W.: Toward Stable, General Machine-Learned Models of the Atmospheric Chemical System, J. Geophys. Res.-Atmos., 125, e2020JD032759, https://doi.org/10.1029/2020JD032759, 2020.
Kleinman, L. I.: The dependence of tropospheric ozone production rate on ozone precursors, Atmos. Environ., 39, 575–586, https://doi.org/10.1016/j.atmosenv.2004.08.047, 2005.
Kleinman, L. I., Daum, P. H., Lee, J. H., Lee, Y.-N., Nunnermacker, L. J., Springston, S. R., Newman, L., Weinstein-Lloyd, J., and Sillman, S.: Dependence of ozone production on NO and hydrocarbons in the troposphere, Geophys. Res. Lett., 24, 2299–2302, https://doi.org/10.1029/97GL02279, 1997.
Koss, A. R., Sekimoto, K., Gilman, J. B., Selimovic, V., Coggon, M. M., Zarzana, K. J., Yuan, B., Lerner, B. M., Brown, S. S., Jimenez, J. L., Krechmer, J., Roberts, J. M., Warneke, C., Yokelson, R. J., and de Gouw, J.: Non-methane organic gas emissions from biomass burning: identification, quantification, and emission factors from PTR-ToF during the FIREX 2016 laboratory experiment, Atmos. Chem. Phys., 18, 3299–3319, https://doi.org/10.5194/acp-18-3299-2018, 2018.
Lee, M., Heikes, B. G., Jacob, D. J., Sachse, G., and Anderson, B.: Hydrogen peroxide, organic hydroperoxide, and formaldehyde as primary pollutants from biomass burning, J. Geophys. Res.-Atmos., 102, 1301–1309, https://doi.org/10.1029/96JD01709, 1997.
Liao, J., Wolfe, G. M., Hannun, R. A., St. Clair, J. M., Hanisco, T. F., Gilman, J. B., Lamplugh, A., Selimovic, V., Diskin, G. S., Nowak, J. B., Halliday, H. S., DiGangi, J. P., Hall, S. R., Ullmann, K., Holmes, C. D., Fite, C. H., Agastra, A., Ryerson, T. B., Peischl, J., Bourgeois, I., Warneke, C., Coggon, M. M., Gkatzelis, G. I., Sekimoto, K., Fried, A., Richter, D., Weibring, P., Apel, E. C., Hornbrook, R. S., Brown, S. S., Womack, C. C., Robinson, M. A., Washenfelder, R. A., Veres, P. R., and Neuman, J. A.: Formaldehyde evolution in U.S. wildfire plumes during the Fire Influence on Regional to Global Environments and Air Quality experiment (FIREX-AQ), Atmos. Chem. Phys., 21, 18319–18331, https://doi.org/10.5194/acp-21-18319-2021, 2021.
Lindaas, J., Pollack, I. B., Garofalo, L. A., Pothier, M. A., Farmer, D. K., Kreidenweis, S. M., Campos, T. L., Flocke, F., Weinheimer, A. J., Montzka, D. D., Tyndall, G. S., Palm, B. B., Peng, Q., Thornton, J. A., Permar, W., Wielgasz, C., Hu, L., Ottmar, R. D., Restaino, J. C., Hudak, A. T., Ku, I.-T., Zhou, Y., Sive, B. C., Sullivan, A., Collett, J. L., and Fischer, E. V.: Emissions of Reactive Nitrogen from Western U.S. Wildfires during Summer 2018, J. Geophys. Res.-Atmos., 125, e2020JD032657, https://doi.org/10.1029/2020JD032657, 2020.
Lindaas, J., Pollack, I. B., Calahorrano, J. J., O'Dell, K., Garofalo, L. A., Pothier, M. A., Farmer, D. K., Kreidenweis, S. M., Campos, T., Flocke, F., Weinheimer, A. J., Montzka, D. D., Tyndall, G. S., Apel, E. C., Hills, A. J., Hornbrook, R. S., Palm, B. B., Peng, Q., Thornton, J. A., Permar, W., Wielgasz, C., Hu, L., Pierce, J. R., Collett, J. L., Sullivan, A. P., and Fischer, E. V.: Empirical Insights Into the Fate of Ammonia in Western U.S. Wildfire Smoke Plumes, J. Geophys. Res.-Atmos., 126, e2020JD033730, https://doi.org/10.1029/2020JD033730, 2021.
Liu, X., Zhang, Y., Huey, L. G., Yokelson, R. J., Wang, Y., Jimenez, J. L., Campuzano-Jost, P., Beyersdorf, A. J., Blake, D. R., Choi, Y., St. Clair, J. M., Crounse, J. D., Day, D. A., Diskin, G. S., ried, A., Hall, S. R., Hanisco, T. F., King, L. E., Meinardi, S., Mikoviny, T., Palm, B. B., Peischl, J., Perring, A. E., Pollack, I. B., Ryerson, T. B., Sachse, G., Schwarz, J. P., Simpson, I. J., Tanner, D. J., Thornhil, K. L., Ullmann, K., Weber, R. J., Wennberg, P. O., Wisthaler, A., Wolfe, G. M., and Ziemba, L. D.: Agricultural fires in the southeastern U.S. during SEAC4RS: Emissions of trace gases and particles and evolution of ozone, reactive nitrogen, and organic aerosol, J. Geophys. Res., 121, 7383–7414, https://doi.org/10.1002/2016JD025040, 2016.
Liu, X., Huey, L. G., Yokelson, R. J., Selimovic, V., Simpson, I. J., Müller, M., Jimenez, J. L., Campuzano-Jost, P., Beyersdorf, A. J., Blake, D. R., Butterfield, Z., Choi, Y., Crounse, J. D., Day, D. A., Diskin, G. S., Dubey, M. K., Fortner, E., Hanisco, T. F., Hu, W., King, L. E., Kleinman, L., Meinardi, S., Mikoviny, T., Onasch, T. B., Palm, B. B., Peischl, J., Pollack, I. B., Ryerson, T. B., Sachse, G. W., Sedlacek, A. J., Shilling, J. E., Springston, S., St. Clair, J. M., Tanner, D. J., Teng, A. P., Wennberg, P. O., Wisthaler, A., and Wolfe, G. M.: Airborne measurements of western U.S. wildfire emissions: Comparison with prescribed burning and air quality implications, J. Geophys. Res.-Atmos., 122, 6108–6129, https://doi.org/10.1002/2016JD026315, 2017.
Lonsdale, C. R., Alvarado, M. J., Hodshire, A. L., Ramnarine, E., and Pierce, J. R.: Simulating the forest fire plume dispersion, chemistry, and aerosol formation using SAM-ASP version 1.0, Geosci. Model Dev., 13, 4579–4593, https://doi.org/10.5194/gmd-13-4579-2020, 2020.
Lydersen, J. M., North, M. P., and Collins, B. M.: Severity of an uncharacteristically large wildfire, the Rim Fire, in forests with relatively restored frequent fire regimes, For. Ecol. Manag., 328, 326–334, https://doi.org/10.1016/j.foreco.2014.06.005, 2014.
Ma, Q., Zhong, C., Ma, J., Ye, C., Zhao, Y., Liu, Y., Zhang, P., Chen, T., Liu, C., Chu, B., and He, H.: Comprehensive Study about the Photolysis of Nitrates on Mineral Oxides, Environ. Sci. Technol., 55, 8604–8612, https://doi.org/10.1021/acs.est.1c02182, 2021.
Mason, S. A., Field, R. J., Yokelson, R. J., Kochivar, M. A., Tinsley, M. R., Ward, D. E., and Hao, W. M.: Complex effects arising in smoke plume simulations due to inclusion of direct emissions of oxygenated organic species from biomass combustion, J. Geophys. Res.-Atmos., 106, 12527–12539, https://doi.org/10.1029/2001jd900003, 2001.
Mauzerall, D. L., Logan, J. A., Jacob, D. J., Anderson, B. E., Blake, D. R., Bradshaw, J. D., Heikes, B., Sachse, G. W., Singh, H., Talbot, B., Mauzerall, L., Logan, A., Jacob, J., Blake, R., Bradshaw, D., and Sachse, W.: Photochemistry in biomass burning plumes and implications for tropospheric ozone over the tropical South Atlantic, J. Geophys. Res.-Atmos., 103, 8401–8423, https://doi.org/10.1029/97jd02612, 1998.
McClure, C. D. and Jaffe, D. A.: US particulate matter air quality improves except in wildfire-prone areas, P. Natl. Acad. Sci. USA, 115, 7901–7906, https://doi.org/10.1073/pnas.1804353115, 2018.
Müller, M., Anderson, B. E., Beyersdorf, A. J., Crawford, J. H., Diskin, G. S., Eichler, P., Fried, A., Keutsch, F. N., Mikoviny, T., Thornhill, K. L., Walega, J. G., Weinheimer, A. J., Yang, M., Yokelson, R. J., and Wisthaler, A.: In situ measurements and modeling of reactive trace gases in a small biomass burning plume, Atmos. Chem. Phys., 16, 3813–3824, https://doi.org/10.5194/acp-16-3813-2016, 2016.
Palm, B. B., Peng, Q., Fredrickson, C. D., Lee, B. H., Garofalo, L. A., Pothier, M. A., Kreidenweis, S. M., Farmer, D. K., Pokhrel, R. P., Shen, Y., Murphy, S. M., Permar, W., Hu, L., Campos, T. L., Hall, S. R., Ullmann, K., Zhang, X., Flocke, F., Fischer, E. V., and Thornton, J. A.: Quantification of organic aerosol and brown carbon evolution in fresh wildfire plumes, P. Natl. Acad. Sci. USA, 117, 29469–29477, https://doi.org/10.1073/pnas.2012218117, 2020.
Palm, B. B., Peng, Q., Hall, S. R., Ullmann, K., Campos, T. L., Weinheimer, A., Montzka, D., Tyndall, G., Permar, W., Hu, L., Flocke, F., Fischer, E. V., and Thornton, J. A.: Spatially Resolved Photochemistry Impacts Emissions Estimates in Fresh Wildfire Plumes, Geophys. Res. Lett., 48, e2021GL095443, https://doi.org/10.1029/2021GL095443, 2021.
Peng, Q., Palm, B. B., Melander, K. E., Lee, B. H., Hall, S. R., Ullmann, K., Campos, T., Weinheimer, A. J., Apel, E. C., Hornbrook, R. S., Hills, A. J., Montzka, D. D., Flocke, F., Hu, L., Permar, W., Wielgasz, C., Lindaas, J., Pollack, I. B., Fischer, E. V., Bertram, T. H., and Thornton, J. A.: HONO Emissions from Western U.S. Wildfires Provide Dominant Radical Source in Fresh Wildfire Smoke, Environ. Sci. Technol., 54, 5954–5963, https://doi.org/10.1021/acs.est.0c00126, 2020.
Permar, W., Wang, Q., Selimovic, V., Wielgasz, C., Yokelson, R. J., Hornbrook, R. S., Hills, A. J., Apel, E. C., Ku, I.-T., Zhou, Y., Sive, B. C., Sullivan, A. P., Collett, J. L., Campos, T. L., Palm, B. B., Peng, Q., Thornton, J. A., Garofalo, L. A., Farmer, D. K., Kreidenweis, S. M., Levin, E. J. T., DeMott, P. J., Flocke, F., Fischer, E. V., and Hu, L.: Emissions of trace organic gases from western U.S. wildfires based on WE-CAN aircraft measurements, J. Geophys. Res.-Atmos., e2020JD033838, https://doi.org/10.1029/2020JD033838, 2021.
Perring, A. E., Schwarz, J. P., Markovic, M. Z., Fahey, D. W., Jimenez, J. L., Campuzano-Jost, P., Palm, B. D., Wisthaler, A., Mikoviny, T., Diskin, G., Sachse, G., Ziemba, L., Anderson, B., Shingler, T., Crosbie, E., Sorooshian, A., Yokelson, R., and Gao, R.-S.: In situ measurements of water uptake by black carbon-containing aerosol in wildfire plumes, J. Geophys. Res.-Atmos., 122, 1086–1097, https://doi.org/10.1002/2016JD025688, 2017.
Peterson, D. A., Hyer, E. J., Campbell, J. R., Fromm, M. D., Hair, J. W., Butler, C. F., and Fenn, M. A.: The 2013 Rim Fire: Implications for Predicting Extreme Fire Spread, Pyroconvection, and Smoke Emissions, Bull. Am. Meteorol. Soc., 96, 229–247, https://doi.org/10.1175/bams-d-14-00060.1, 2015.
Qu, H., Wang, Y., Zhang, R., Liu, X., Huey, L. G., Sjostedt, S., Zeng, L., Lu, K., Wu, Y., Shao, M., Hu, M., Tan, Z., Fuchs, H., Broch, S., Wahner, A., Zhu, T., and Zhang, Y.: Chemical Production of Oxygenated Volatile Organic Compounds Strongly Enhances Boundary-Layer Oxidation Chemistry and Ozone Production, Environ. Sci. Technol., 55, 13718–13727, https://doi.org/10.1021/acs.est.1c04489, 2021.
Roberts, J. M., Stockwell, C. E., Yokelson, R. J., de Gouw, J., Liu, Y., Selimovic, V., Koss, A. R., Sekimoto, K., Coggon, M. M., Yuan, B., Zarzana, K. J., Brown, S. S., Santin, C., Doerr, S. H., and Warneke, C.: The nitrogen budget of laboratory-simulated western US wildfires during the FIREX 2016 Fire Lab study, Atmos. Chem. Phys., 20, 8807–8826, https://doi.org/10.5194/acp-20-8807-2020, 2020.
Robinson, M. A., Decker, Z. C. J., Barsanti, K. C., Coggon, M. M., Flocke, F. M., Franchin, A., Fredrickson, C. D., Gilman, J. B., Gkatzelis, G. I., Holmes, C. D., Lamplugh, A., Lavi, A., Middlebrook, A. M., Montzka, D. M., Palm, B. B., Peischl, J., Pierce, B., Schwantes, R. H., Sekimoto, K., Selimovic, V., Tyndall, G. S., Thornton, J. A., Van Rooy, P., Warneke, C., Weinheimer, A. J., and Brown, S. S.: Variability and Time of Day Dependence of Ozone Photochemistry in Western Wildfire Plumes, Environ. Sci. Technol., 55, 10280–10290, https://doi.org/10.1021/acs.est.1c01963, 2021.
Romer, P. S., Wooldridge, P. J., Crounse, J. D., Kim, M. J., Wennberg, P. O., Dibb, J. E., Scheuer, E., Blake, D. R., Meinardi, S., Brosius, A. L., Thames, A. B., Miller, D. O., Brune, W. H., Hall, S. R., Ryerson, T. B., and Cohen, R. C.: Constraints on Aerosol Nitrate Photolysis as a Potential Source of HONO and NOx, Environ. Sci. Technol., 52, 13738–13746, https://doi.org/10.1021/acs.est.8b03861, 2018.
Saide, P. E., Peterson, D. A., da Silva, A., Anderson, B., Ziemba, L. D., Diskin, G., Sachse, G., Hair, J., Butler, C., Fenn, M., Jimenez, J. L., Campuzano-Jost, P., Perring, A. E., Schwarz, J. P., Markovic, M. Z., Russell, P., Redemann, J., Shinozuka, Y., Streets, D. G., Yan, F., Dibb, J., Yokelson, R., Toon, O. B., Hyer, E., and Carmichael, G. R.: Revealing important nocturnal and day-to-day variations in fire smoke emissions through a multiplatform inversion, Geophys. Res. Lett., 42, 3609–3618, https://doi.org/10.1002/2015gl063737, 2015.
Sangwan, M. and Zhu, L.: Absorption Cross Sections of 2-Nitrophenol in the 295–400 nm Region and Photolysis of 2-Nitrophenol at 308 and 351 nm, J. Phys. Chem. A, 120, 9958–9967, https://doi.org/10.1021/acs.jpca.6b08961, 2016.
Saunders, S. M., Jenkin, M. E., Derwent, R. G., and Pilling, M. J.: Protocol for the development of the Master Chemical Mechanism, MCM v3 (Part A): tropospheric degradation of non-aromatic volatile organic compounds, Atmos. Chem. Phys., 3, 161–180, https://doi.org/10.5194/acp-3-161-2003, 2003.
Schroeder, J. R., Crawford, J. H., Fried, A., Walega, J., Weinheimer, A., Wisthaler, A., Müller, M., Mikoviny, T., Chen, G., Shook, M., Blake, D. R., and Tonnesen, G. S.: New insights into the column CH2O NO2 ratio as an indicator of near-surface ozone sensitivity, J. Geophys. Res.-Atmos., 122, 8885–8907, https://doi.org/10.1002/2017JD026781, 2017.
SEAC4RS Science Team: Studies of Emissions and Atmospheric Composition, Clouds and Climate Coupling by Regional Surveys Dataset, NASA [data set], https://doi.org/10.5067/Aircraft/SEAC4RS/Aerosol-TraceGas-Cloud, 2013.
Sekimoto, K., Koss, A. R., Gilman, J. B., Selimovic, V., Coggon, M. M., Zarzana, K. J., Yuan, B., Lerner, B. M., Brown, S. S., Warneke, C., Yokelson, R. J., Roberts, J. M., and de Gouw, J.: High- and low-temperature pyrolysis profiles describe volatile organic compound emissions from western US wildfire fuels, Atmos. Chem. Phys., 18, 9263–9281, https://doi.org/10.5194/acp-18-9263-2018, 2018.
Shi, Q., Tao, Y., Krechmer, J. E., Heald, C. L., Murphy, J. G., Kroll, J. H., and Ye, Q.: Laboratory Investigation of Renoxification from the Photolysis of Inorganic Particulate Nitrate, Environ. Sci. Technol., 55, 854–861, https://doi.org/10.1021/acs.est.0c06049, 2021.
Stein, A. F., Draxler, R. R., Rolph, G. D., Stunder, B. J. B., Cohen, M. D., and Ngan, F.: NOAA's HYSPLIT Atmospheric Transport and Dispersion Modeling System, Bull. Am. Meteorol. Soc., 96, 2059–2077, https://doi.org/10.1175/BAMS-D-14-00110.1, 2015.
Stemmler, K., Ammann, M., Donders, C., Kleffmann, J., and George, C.: Photosensitized reduction of nitrogen dioxide on humic acid as a source of nitrous acid, Nature, 440, 195–198, https://doi.org/10.1038/nature04603, 2006.
Theys, N., Volkamer, R., Müller, J.-F., Zarzana, K. J., Kille, N., Clarisse, L., De Smedt, I., Lerot, C., Finkenzeller, H., Hendrick, F., Koenig, T. K., Lee, C. F., Knote, C., Yu, H., and Van Roozendael, M.: Global nitrous acid emissions and levels of regional oxidants enhanced by wildfires, Nat. Geosci., 13, 681–686, https://doi.org/10.1038/s41561-020-0637-7, 2020.
Toon, O. B., Maring, H., Dibb, J., Ferrare, R., Jacob, D. J., Jensen, E. J., Luo, Z. J., Mace, G. G., Pan, L. L., Pfister, L., Rosenlof, K. H., Redemann, J., Reid, J. S., Singh, H. B., Thompson, A. M., Yokelson, R., Minnis, P., Chen, G., Jucks, K. W., and Pszenny, A.: Planning, implementation, and scientific goals of the Studies of Emissions and Atmospheric Composition, Clouds and Climate Coupling by Regional Surveys (SEAC(4)RS) field mission, J. Geophys. Res.-Atmos., 121, 4967–5009, https://doi.org/10.1002/2015JD024297, 2016.
Ulbrich, I. M., Canagaratna, M. R., Zhang, Q., Worsnop, D. R., and Jimenez, J. L.: Interpretation of organic components from Positive Matrix Factorization of aerosol mass spectrometric data, Atmos. Chem. Phys., 9, 2891–2918, https://doi.org/10.5194/acp-9-2891-2009, 2009.
Val Martin, M., Heald, C. L., Lamarque, J. F., Tilmes, S., Emmons, L. K., and Schichtel, B. A.: How emissions, climate, and land use change will impact mid-century air quality over the United States: A focus on effects at national parks, Atmos. Chem. Phys., 15, 2805–2823, https://doi.org/10.5194/acp-15-2805-2015, 2015.
Wang, S., Coggon, M. M., Gkatzelis, G. I., Warneke, C., Bourgeois, I., Ryerson, T., Peischl, J., Veres, P. R., Neuman, J. A., Hair, J., Shingler, T., Fenn, M., Diskin, G., Huey, L. G., Lee, Y. R., Apel, E. C., Hornbrook, R. S., Hills, A. J., Hall, S. R., Ullmann, K., Bela, M. M., Trainer, M. K., Kumar, R., Orlando, J. J., Flocke, F. M., and Emmons, L. K.: Chemical Tomography in a Fresh Wildland Fire Plume: A Large Eddy Simulation (LES) Study, J. Geophys. Res.-Atmos., 126, e2021JD035203, https://doi.org/10.1029/2021JD035203, 2021.
Wiedinmyer, C., Akagi, S. K., Yokelson, R. J., Emmons, L. K., Al-Saadi, J. A., Orlando, J. J., and Soja, A. J.: The Fire INventory from NCAR (FINN): a high resolution global model to estimate the emissions from open burning, Geosci. Model Dev., 4, 625–641, https://doi.org/10.5194/gmd-4-625-2011, 2011.
Wiggins, E. B., Soja, A. J., Gargulinski, E., Halliday, H. S., Pierce, R. B., Schmidt, C. C., Nowak, J. B., DiGangi, J. P., Diskin, G. S., Katich, J. M., Perring, A. E., Schwarz, J. P., Anderson, B. E., Chen, G., Crosbie, E. C., Jordan, C., Robinson, C. E., Sanchez, K. J., Shingler, T. J., Shook, M., Thornhill, K. L., Winstead, E. L., Ziemba, L. D., and Moore, R. H.: High Temporal Resolution Satellite Observations of Fire Radiative Power Reveal Link Between Fire Behavior and Aerosol and Gas Emissions, Geophys. Res. Lett., 47, e2020GL090707, https://doi.org/10.1029/2020GL090707, 2020.
Wolfe, G. M.: Framework for 0-D Atmospheric Modeling v4.2.1, Zenodo [code], https://doi.org/10.5281/zenodo.5752566, 2021.
Wolfe, G. M., Marvin, M. R., Roberts, S. J., Travis, K. R., and Liao, J.: The Framework for 0-D Atmospheric Modeling (F0AM) v3.1, Geosci. Model Dev., 9, 3309–3319, https://doi.org/10.5194/gmd-9-3309-2016, 2016.
Wooldridge, P. J., Perring, A. E., Bertram, T. H., Flocke, F. M., Roberts, J. M., Singh, H. B., Huey, L. G., Thornton, J. A., Wolfe, G. M., Murphy, J. G., Fry, J. L., Rollins, A. W., LaFranchi, B. W., and Cohen, R. C.: Total peroxy nitrates (SPNs) in the atmosphere: the thermal dissociation-laser induced fluorescence (TD-LIF) technique and comparisons to speciated PAN measurements, Atmos. Meas. Tech., 3, 593–607, https://doi.org/10.5194/amt-3-593-2010, 2010.
Xu, B., Garrec, J., Nicolle, A., Matrat, M., and Catoire, L.: Temperature and Pressure Dependent Rate Coefficients for the Reaction of Ketene with Hydroxyl Radical, J. Phys. Chem. A, 123, 2483–2496, https://doi.org/10.1021/acs.jpca.8b11273, 2019.
Yates, E. L., Iraci, L. T., Singh, H. B., Tanaka, T., Roby, M. C., Hamill, P., Clements, C. B., Lareau, N., Contezac, J., Blake, D. R., Simpson, I. J., Wisthaler, A., Mikoviny, T., Diskin, G. S., Beyersdorf, A. J., Choi, Y., Ryerson, T. B., Jimenez, J. L., Campuzano-Jost, P., Loewenstein, M., and Gore, W.: Airborne measurements and emission estimates of greenhouse gases and other trace constituents from the 2013 California Yosemite Rim wildfire, Atmos. Environ., 127, 293–302, https://doi.org/10.1016/j.atmosenv.2015.12.038, 2016.
Ye, C., Zhang, N., Gao, H., and Zhou, X.: Photolysis of Particulate Nitrate as a Source of HONO and NOx, Environ. Sci. Technol., 51, 6849–6856, https://doi.org/10.1021/acs.est.7b00387, 2017.
Ye, C., Zhou, X., Pu, D., Stutz, J., Festa, J., Spolaor, M., Tsai, C., Cantrell, C., Mauldin III, R. L., Weinheimer, A., Hornbrook, R. S., Apel, E. C., Guenther, A., Kaser, L., Yuan, B., Karl, T., Haggerty, J., Hall, S., Ullmann, K., Smith, J., and Ortega, J.: Tropospheric HONO distribution and chemistry in the southeastern US, Atmos. Chem. Phys., 18, 9107–9120, https://doi.org/10.5194/acp-18-9107-2018, 2018.
Yokelson, R. J., Christian, T. J., Karl, T. G., and Guenther, A.: The tropical forest and fire emissions experiment: laboratory fire measurements and synthesis of campaign data, Atmos. Chem. Phys., 8, 3509–3527, 2008.
Yokelson, R. J., Burling, I. R., Gilman, J. B., Warneke, C., Stockwell, C. E., de Gouw, J., Akagi, S. K., Urbanski, S. P., Veres, P., Roberts, J. M., Kuster, W. C., Reardon, J., Griffith, D. W. T., Johnson, T. J., Hosseini, S., Miller, J. W., Cocker III, D. R., Jung, H., and Weise, D. R.: Coupling field and laboratory measurements to estimate the emission factors of identified and unidentified trace gases for prescribed fires, Atmos. Chem. Phys., 13, 89–116, https://doi.org/10.5194/acp-13-89-2013, 2013.
Yu, P., Toon, O. B., Bardeen, C. G., Bucholtz, A., Rosenlof, K. H., Saide, P. E., Da Silva, A., Ziemba, L. D., Thornhill, K. L., Jimenez, J.-L., Campuzano-Jost, P., Schwarz, J. P., Perring, A. E., Froyd, K. D., Wagner, N. L., Mills, M. J., and Reid, J. S.: Surface dimming by the 2013 Rim Fire simulated by a sectional aerosol model, J. Geophys. Res.-Atmos., 121, 7079–7087, https://doi.org/10.1002/2015JD024702, 2016.
Zhang, J., An, J., Qu, Y., Liu, X., and Chen, Y.: Impacts of potential HONO sources on the concentrations of oxidants and secondary organic aerosols in the Beijing-Tianjin-Hebei region of China, Sci. Total Environ., 647, 836–852, https://doi.org/10.1016/j.scitotenv.2018.08.030, 2019.
Zhong, D.: medoid and geometric median, MATLAB Cent, File Exch. [code], https://www.mathworks.com/matlabcentral/fileexchange/70145-medoid-and-geometric-median (last access: 24 March 2022), 2021.