the Creative Commons Attribution 4.0 License.
the Creative Commons Attribution 4.0 License.
 | 31 Mar 2022
Evolution of the intensity and duration of the Southern Hemisphere stratospheric polar vortex edge for the period 1979–2020
Audrey Lecouffe
Sophie Godin-Beekmann
Andrea Pazmiño
Alain Hauchecorne
The intensity and position of the Southern Hemisphere stratospheric polar vortex edge is evaluated as a function of equivalent latitude over the period 1979–2020 on three isentropic levels (475, 550, and 675 K) from ECMWF ERA-Interim reanalysis. The study also includes an analysis of the onset and breakup dates of the polar vortex, which are determined from wind thresholds (e.g., 15.2, 20, and 25 m s−1) along the vortex edge. The vortex edge is stronger in late winter, during September–October–November, with the period of strongest intensity occurring later at the lowermost level. During the same period, we observe a lower variability of the edge position. A long-term increase in the vortex edge intensity and break-up date is observed during 1979–1999, linked to the increase in the ozone hole. A long-term decrease in the vortex onset date related to the 25 m s−1 wind threshold is also observed at 475 K during this period. The solar cycle and to a lower extent the quasi-biennial oscillation (QBO) and El Niño–Southern Oscillation (ENSO) modulate the interannual evolution of the strength of the vortex edge and the vortex breakup dates. A stronger vortex edge and longer vortex duration are observed in solar minimum (minSC) years, with the QBO and ENSO further modulating the solar cycle influence, especially at 475 and 550 K: during west QBO (wQBO) phases, the difference between vortex edge intensity for minSC and maxSC years is smaller than during east QBO (eQBO) phases. The polar vortex edge is stronger and lasts longer for maxSC/wQBO years than for maxSC/eQBO years. ENSO has a weaker impact but the vortex edge is somewhat stronger during cold ENSO phases for both minSC and maxSC years.
- Article
(5616 KB) - Full-text XML
- BibTeX
- EndNote


The stratospheric polar vortex is a seasonal low-pressure system characterized by a strong wind belt that isolates polar air from lower latitudes. It appears due to the seasonal cooling associated with the decrease of solar radiation above the pole (Randel and Newman, 1998). As the incident solar energy decreases, and the temperature gradient between the pole and the tropics becomes stronger, the strength of the stratospheric westerly winds increases. When the winds reach a critical value, a large-scale vortex is formed, which extends from the lowermost stratosphere to the stratopause. Depending on the altitude, the maximum area encompassed by the polar vortex exceeds millions of square kilometers (NOAA, 2021). Above an altitude of about 14 km, the vortex edge region is stable and constitutes a powerful barrier, preventing mixing of cold polar air with warmer air masses from lower latitudes. Over Antarctica, the polar vortex is generally present from April until December with a large variability in the breakup dates resulting from the year-to-year variability of dynamical processes in the stratosphere (Waugh and Randel, 1999; Rao and Garfinkel, 2021). Conversely, the less stable Arctic polar vortex has more year-to-year variability (e.g., Andrews et al., 1987; Hu et al., 2014; Butler et al., 2019). It forms in November and lasts until the end of February or early April, depending on the year. The stratospheric polar vortex has been the subject of studies linked to the ozone layer depletion, which started in the late 1970 (Farman et al., 1985; Solomon, 1999). Ozone loss occurs in both hemispheres. This loss is variable in the Northern Hemisphere, as many studies have shown (Solomon, 1999; Goutail et al., 2005; Pommereau et al., 2018; WMO, 2018; Grooß and Müller, 2020). In the Southern Hemisphere, the ozone hole, defined as an area with total ozone values less than 220 DU, has become a recurring seasonal phenomenon. Ozone destruction begins in late winter, close to the edge region of the polar vortex, as solar radiation increases over the Pole. The destruction of ozone inside the southern vortex accelerates from late August until late September or early October, reaching an almost complete destruction of ozone in the lower stratosphere. The depletion of the ozone layer is caused by anthropogenic emission of ozone-depleting substances (ODS, mainly chlorofluorocarbons and halons and their industrial substitutes), which enhances ozone destruction cycles by halogen compounds. This depletion is largest in the polar vortex due to the activation of chlorine species through heterogeneous reactions that take place at the surface of polar stratospheric clouds (PSCs) which form in the cold polar vortex (Solomon, 1999). The increase in solar radiation over the Pole at the end of winter triggers rapid chemical cycles which quickly destroy ozone, leading to the appearance of the well-known ozone hole over Antarctica (e.g., WMO, 2018). By the end of spring, stratospheric temperatures increase, the polar vortex breaks up, and ozone-depleted air masses dilute into the Southern Hemisphere. From one year to the next, the severity of the ozone hole depends on the strength of the polar vortex, its minimum temperatures, and its duration. The future recovery of the ozone layer and disappearance of the ozone hole depend on the evolution of the polar vortex under the influence of both the decrease in ODS abundance in the stratosphere and the increase in greenhouse gases (GHG) as both phenomena impact radiative, dynamical, and chemical processes in the stratosphere. Many studies document this phenomenon (e.g., WMO, 2018 and references therein). The polar vortex also has an impact on the climate surface in both hemispheres. Indeed, studies have shown an effect of the stratospheric polar vortex displacements on cold spells in the Northern Hemisphere, in North America (Tripathi et al., 2015). In the Southern Hemisphere, other studies have shown that a weak vortex can have an influence on the surface climate in Australia. Lim et al. (2019) highlighted that selected years of lower vortex intensity result in higher temperatures and less precipitation over eastern Australia. The dramatic weakening of the Antarctic vortex in 2019 had a large impact on meteorological conditions over the country that resulted in the severe Australian fires at the turn of the year 2019/2020.
The inner vortex is characterized by high absolute values of potential vorticity (PV). As this parameter is conserved on isentropic surfaces for weeks, PV maps on such surfaces represent one of the primary diagnostic tools for analysis of the dynamical processes in the stratosphere and inside the polar vortex. McIntyre and Palmer (1983) first represented daily PV global maps of isentropic surfaces, demonstrating a material separation in the stratosphere between the main vortex, characterized by high absolute PV values, the surf zone, characterized by weak absolute PV values, and a zone of strong meridional PV gradient in between: the so-called vortex boundary or vortex edge, which is an area of low mixing representing a dynamical barrier to air mass exchanges. Numerous studies on the vortex boundary definition have been conducted. Nash et al. (1996) defined the vortex edge as the location of the maximum PV gradient as a function of equivalent latitude (EL), weighted by the mean wind speed. EL defines the latitude limit of the polar area which exceeds a certain PV value (maximum PV is then given at EL = 90∘, e.g., Butchart and Remsberg, 1986). The mean wind speed is the mean of the wind values around an equivalent latitude contour. A PV field sorted by EL will then make the polar vortex concentric around the pole. This is the method used in this study. Nakamura (1996) has developed the effective diffusivity diagnostic, which is applied on tracers to identify transport barriers and mixing regions. Hauchecorne et al. (2002) used this method to quantify the transport of polar vortex air to mid-latitudes, as well as to evaluate the polar vortex barrier intensity. The method of elliptical diagnostics of a contour used by Waugh (1997) consists in fitting an ellipse to the contour of a parameter. It subsequently determines several variables of this ellipse, for example, latitude and longitude of the center, the equivalent latitude, or its orientation. It is possible to calculate the elliptical diagnostics of a contour of conservative tracers such as PV or long-lived chemical species around the polar vortex edge region (Waugh and Randel, 1999). The vortex forms in autumn, intensifies throughout the winter, and disappears in spring/summer. Its overall strength is variable from one year to the next. Different studies have analyzed the interannual variability of the polar vortex induced by forcings such as the solar flux (SF), quasi-biennial oscillation (QBO) and El Niño–Southern Oscillation (ENSO), particularly in the Northern Hemisphere. QBO is a quasi-periodic oscillation of the equatorial zonal wind between easterlies and westerlies. Holton and Tan (1980) made a composite study of zonal wind in the Northern Hemisphere at 50 hPa from 1962 to 1977 based on the different QBO phases. They showed that the vortex is less disturbed during the west phase of the QBO (wQBO) at 50 hPa than during the east phase (eQBO). Labitzke and Van Loon (1988) evaluated the temperature and strength of the Arctic polar vortex according to the solar cycle and the QBO. They found that the vortex is warm and weak during solar maxima/eQBO phases, and cold and strong during solar minima/wQBO phases at 50 hPa. Camp and Tung (2007) support this finding that the state of the Northern Hemisphere polar stratosphere is less perturbed during solar cycle minimum and westerly QBO phases. Then, Baldwin and Dunkerton (1998) showed, over a period of 18 years, that the Antarctic polar vortex at 10 hPa is slightly colder during wQBO. ENSO is an irregular oscillation in winds and sea surface temperatures over the tropical eastern Pacific Ocean, affecting the climate of the tropics and subtropics. It also influences other climatic parameters such as precipitations worldwide and ozone levels in the lower stratosphere (WMO, 2018). Domeisen et al. (2019) indicated that the El Niño events are associated with a warming and weakening of the polar vortex in the polar stratosphere in both hemispheres, and Li et al. (2016) showed that early breakup of the southern polar vortex occurs during El Niño events. By contrast, Rao and Ren (2020) did not find a significant impact of the canonical ENSO index on the Southern Hemisphere polar vortex both in observations and in modeling studies. With indices of Niño-3 and Niño-4 regions, Hurwitz et al. (2011) reported that during a “warm pool event” (positive SST in Niño-4 regions) the heat flux is higher and the Antarctic vortex breaks up earlier. Several methods have been suggested in order to determine the onset and breakup dates of the polar vortex. They are based on a minimum area computed from equivalent latitudes (Manney et al., 1994; Zhou et al., 2000) or mean wind speed thresholds along the edge (e.g., Nash et al., 1996). The latter is used in WMO (2018) to calculate the dates on which the Arctic and Antarctic polar vortex breaks each spring.
The objective of this paper is to analyze the long-term evolution of the intensity, position, and duration of the southern polar vortex edge as a function of equivalent latitude over several decades (1979–2020). ERA-Interim reanalyses and operational data from the European Centre for Medium-Range Weather Forecast (ECMWF) are used for the study, which includes an evaluation of the onset and breakup dates of the polar vortex during this period. At an interannual scale, the signature of the 11-year solar cycle, QBO and ENSO, is evaluated on the vortex edge evolution. This is the first study of the variability of the Antarctic stratospheric polar vortex edge and its persistence over a long period (42 years).
The paper is organized as follows. Section 2 presents the ECMWF dataset and the data sources of the forcings (SF, QBO, and ENSO) used for the analysis of interannual variability of the polar vortex edge. Section 3 describes the methods used in the study, such as the MIMOSA (Modélisation Isentrope du transport Méso-échelle de l’Ozone Stratosphérique par Advection) model (Hauchecorne et al., 2002), which is used to construct the PV maps as a function of potential temperature and equivalent latitude. The methods used for the vortex edge characterization and for determining the onset and breakup dates of the polar vortex are also discussed in this section. Section 4 presents the statistical analysis of the annual evolution of the vortex edge over the study period as well as its interannual evolution, related to the SF, QBO, and ENSO forcings, while results on the interannual evolution of the vortex onset and breakup dates are given in Sect. 5. A further discussion of the results and perspectives of the study are presented in Sect. 6.
2.1 Potential vorticity fields
PV fields are calculated from ECMWF ERA-Interim reanalyses [1] (Dee et al., 2011). As these reanalyses end in August 2019, we used the operational data from ECMWF from September 2019 to December 2020. Recently, Millan et al. (2021) compared the polar vortex evolution with different reanalyses, including ERA-Interim. Their results showed that all reanalyses where in agreement with the reanalysis ensemble mean (REM), which shows that we can be confident with the ERA-Interim reanalyses for our study. ERA-Interim temperature, geopotential, and wind data with a resolution of 1.125∘ latitude × 1.125∘ longitude are inputs for the MIMOSA model, which is a three-dimensional high-resolution PV advection model (Hauchecorne et al., 2002). From MIMOSA high-resolution PV fields it is possible to follow the evolution of polar air masses and filamentation processes of the polar vortex. Sampled every 6 h, ERA-Interim reanalyses are interpolated on selected isentropic surfaces. The model computes PV and EL fields on the isentropic surfaces with a resolution of 0.3∘ latitude × 0.3∘ longitude, using a polar projection centered on the south from 90∘ S to 10∘ N. The advection method is applied to this orthographic grid. After some time, the MIMOSA grid is distorted by the horizontal gradients of the wind fields. A re-interpolation of the PV fields on the original grid every 6 h is then performed. Finally, in order to take into account diabatic processes, a relaxation of the MIMOSA advected PV (APV) toward the ECMWF PV is made every 12 h with a 10 d time constant. This model has been used to analyze, among other studies, the permeability of the southern polar vortex to volcanic aerosols from Cerro Hudson and Mount Pinatubo eruptions in 1991 (Godin et al., 2001), and to predict the extension in the lower mid-latitude stratosphere of polar and subtropical air masses (Heese et al., 2001). In Pazmiño et al. (2018), PV fields simulated by the model are used to evaluate the average total ozone evolution within the Antarctic vortex. For this study, PV fields are computed at 675, 550, and 475 K isentropic levels.
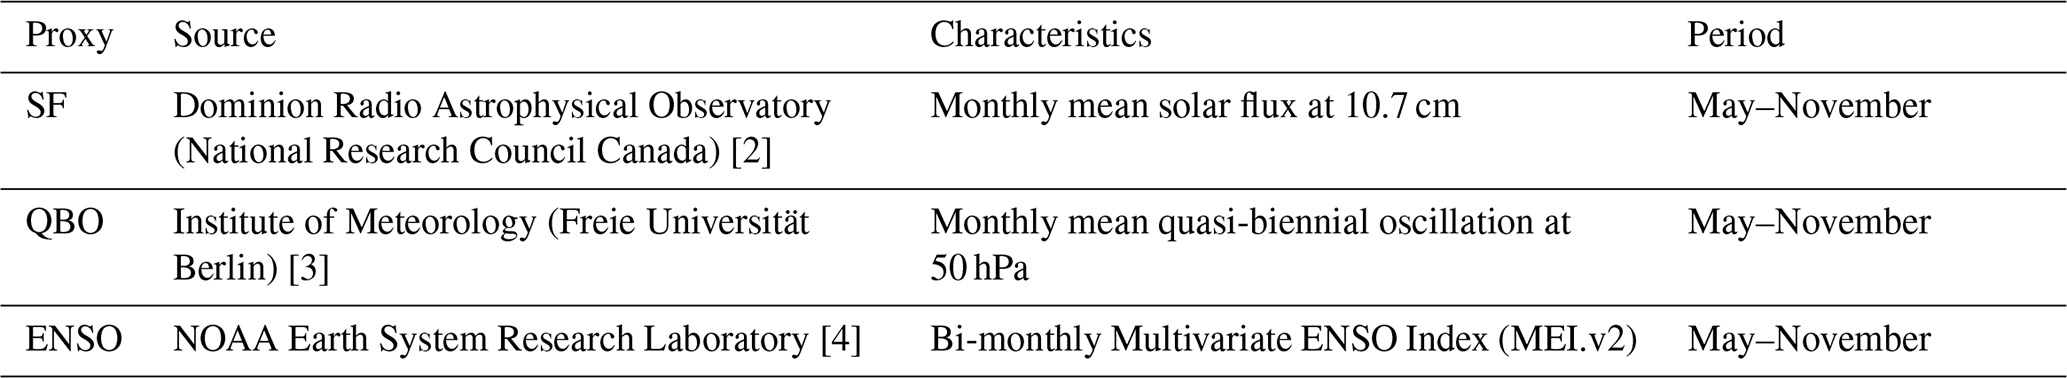
2.2 Forcings of interannual variability
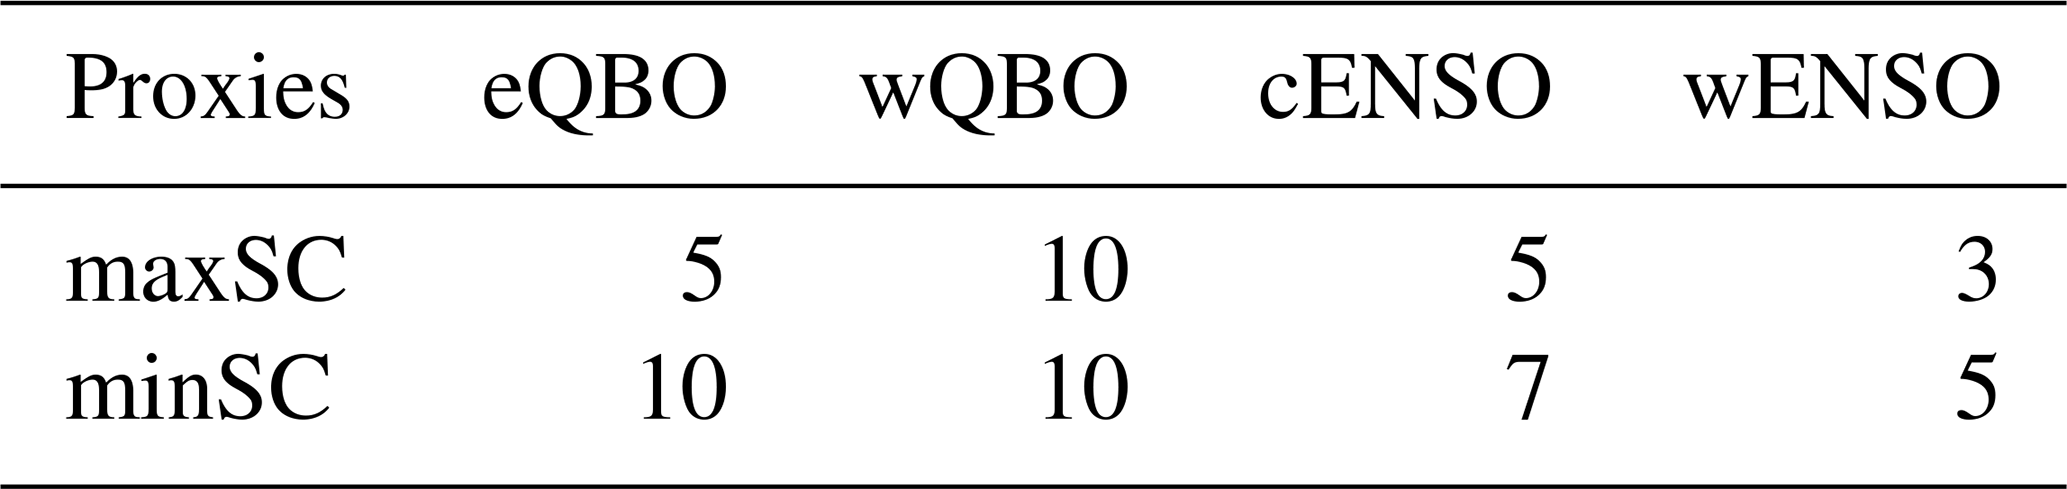
Forcings considered for the analyses of the interannual variability of the vortex edge are described in Table 1. For the solar flux, we are mainly interested in the variability induced by the 11-year solar cycle. The F10.7 solar flux data cover six solar cycles, including those covering our study period, the last four. The F10.7 solar flux correlates well with the 11-year sunspot cycle (Mishra et al., 2005; Tiwari and Kumar, 2018) and has been used frequently as a proxy for solar activity (e.g., Solomon, 1999; Gray, 2003; Pazmiño et al., 2018). It is defined in solar flux units (1 sfu = 10−22 W m−2 Hz−1). For our study, we averaged the 10.7 cm solar flux and other proxies over the May–November period, which corresponds to the period when the southern polar vortex is well formed. Data were obtained for solar cycles 21–24 (1976–2020). Years characterized by minimum and maximum solar intensity were selected from the difference of maximum and minimum intensity of each cycle (a methodology also considered in Rao et al., 2019). The minimum (maximum) intensity threshold was defined as the lower (upper) third of this difference, so that the minimum and maximum thresholds are different for each cycle. The selection results in 15 maximum solar (maxSC) years and 20 minimum solar (minSC) years over the whole study period. In order to investigate the influence of QBO on the polar vortex, we used Singapore monthly mean zonal wind at the 50 hPa level, and averaged this parameter each year during the same period as for the solar cycle. QBO is sorted by a negative phase for eQBO with 19 years and a positive phase for wQBO with 23 years. In the case of ENSO, the Multivariate ENSO Index (MEI) version 2 was used in this study. It corresponds to the combination of empirical orthogonal function (EOF) of sea level pressure (SLP), sea surface temperature (SST), zonal and meridional components of surface wind, and outgoing longwave radiation in the tropical Pacific basin. Referring to the NOAA description of the MEI.v2 index (see data availability [4]): “The EOF are calculated for 12 overlapping bi-monthly `seasons' in order to take into account ENSO’s seasonality, and reduce effects of higher frequency intra-seasonal variability.” Then mean ENSO over the period is sorted to distinguish La Niña, characterized by negative values smaller than −0.5 MEI.v2 (cold ENSO), and El Niño by positive values higher than +0.5 MEI.v2 (warm ENSO). Thus 10 wENSO and 14 cENSO years are considered in this study.
3.1 Vortex edge characterization
As mentioned in the Introduction, the vortex edge is characterized by a strong PV gradient. To represent the vortex edge position, the method described in Nash et al. (1996) is used, which consists in determining the position of the edge from the maximum PV gradient weighted by the mean wind speed as a function of EL. The maximum gradient is evaluated in the [−85∘, −50∘ EL] range in order to avoid high PV values at the pole and disturbances by the subtropical jet. The position of the edge is defined by the EL of the ), where W is the mean wind speed.
3.2 Determination of polar vortex onset and breakup dates
Several methods have been used to determine the onset and breakup dates of the polar vortex in the Northern Hemisphere (NH), as mentioned previously. Manney et al. (1994) first determined that the breakup date corresponds to the date when the EL of a chosen PV contour at the 465 K level is greater than 80∘, using PV data computed from the National Centers for Environmental Prediction and the National Center for Atmospheric Research (NCEP/NCAR) reanalyses. From a given PV contour, the authors determined that if the corresponding EL position is poleward of 80∘ LE, then the vortex is not well formed. This defines the duration of the polar vortex. Subsequently, using wind fields in addition to the PV gradient as a function of EL, Nash et al. (1996) considered that the vortex is well formed at 450 K when the mean wind speed along the vortex edge is equal to or greater than 15.2 m s−1. They also used the 3.2 m s−1 standard deviation interval to provide a range of dates during which the vortex forms and breaks. Then Waugh et al. (1999) analyzed the breakup date of the Arctic and Antarctic polar vortex using NCEP data for the 1958–1999 period. They showed a tendency of extension of the breakup date after 1979 in the Antarctic that could be due to radiative processes induced by the lower ozone levels within the vortex. Zhou et al. (2000) used the same method as Manney et al. (1994) and compared the vortex breakup dates in the 1990s with those of the 1980s based on NCEP data, considering that the vortex breaks up and disappears when its size falls below 1 % of the earth’s surface. The authors demonstrated that the Antarctic vortex lasted 2 weeks longer in the 1991–1998 period than in the 1979–1984 period. The authors joined other studies (Atkinson et al., 1989; Müller et al., 2008; Zhang et al., 2017) in concluding that the vortex lifetime is influenced by the ozone depletion during spring. Akiyoshi et al. (2009) used the same method as Nash et al. (1996) and added threshold values of 20 and 25 m s−1 to compare variations of breakup dates in models and observations over the 1980–2004 period. In this study, we use the Nash et al. (1996) method to determine the vortex onset and breakup dates, also used in WMO (2018). Two threshold values (20 and 25 m s−1) following Akiyoshi et al. (2009) are added to this method, in order to evaluate the sensitivity of the onset and breakup dates to the chosen threshold values (see Sect. 5).
4.1 Intensity of the vortex edge
The statistical analysis of the evolution of the vortex edge intensity throughout the winter from 1979 to 2020 at the 675, 550, and 475 K isentropic surfaces is shown in Fig. 1, which displays the maximum PV gradient smoothed by a 5 d running mean, in EL from May to December. In each panel, the black bold curve represents the median values and blue filled areas indicate values between the 20th and 80th percentiles. Thin dark lines are the overall maximum and minimum during the period 1979–2020. Data are considered every year between the onset and the breakup dates of the vortex (see Sect. 5) and the percentiles, medians, and overall extrema are plotted for days with 3 years or more of data. The statistical parameters with at least 3 years of data are obtained until day 343, 354, and 361 at 675, 550, and 475 K, respectively. Results show that the vortex is systematically present on 1 May, and reaches its maximum intensity during different periods of the winter depending on the level, e.g., later at the lower levels. It is reached from September to late October at 675 K with a median peak value of 20.8 PV units per ∘ EL in October, from September to early November at 550 K with a peak value of 7.8 PV units per ∘ EL at the beginning of October, and later for 475 K during the first half of November with a peak value of 3.9 PV units per ∘ EL. This period of maximum intensity is also characterized by a larger variability (as seen from the maximum and minimum curves, especially for the lower isentropic levels). Depending on the year and the level, the vortex breaks up between mid-October and the end of December at the latest.
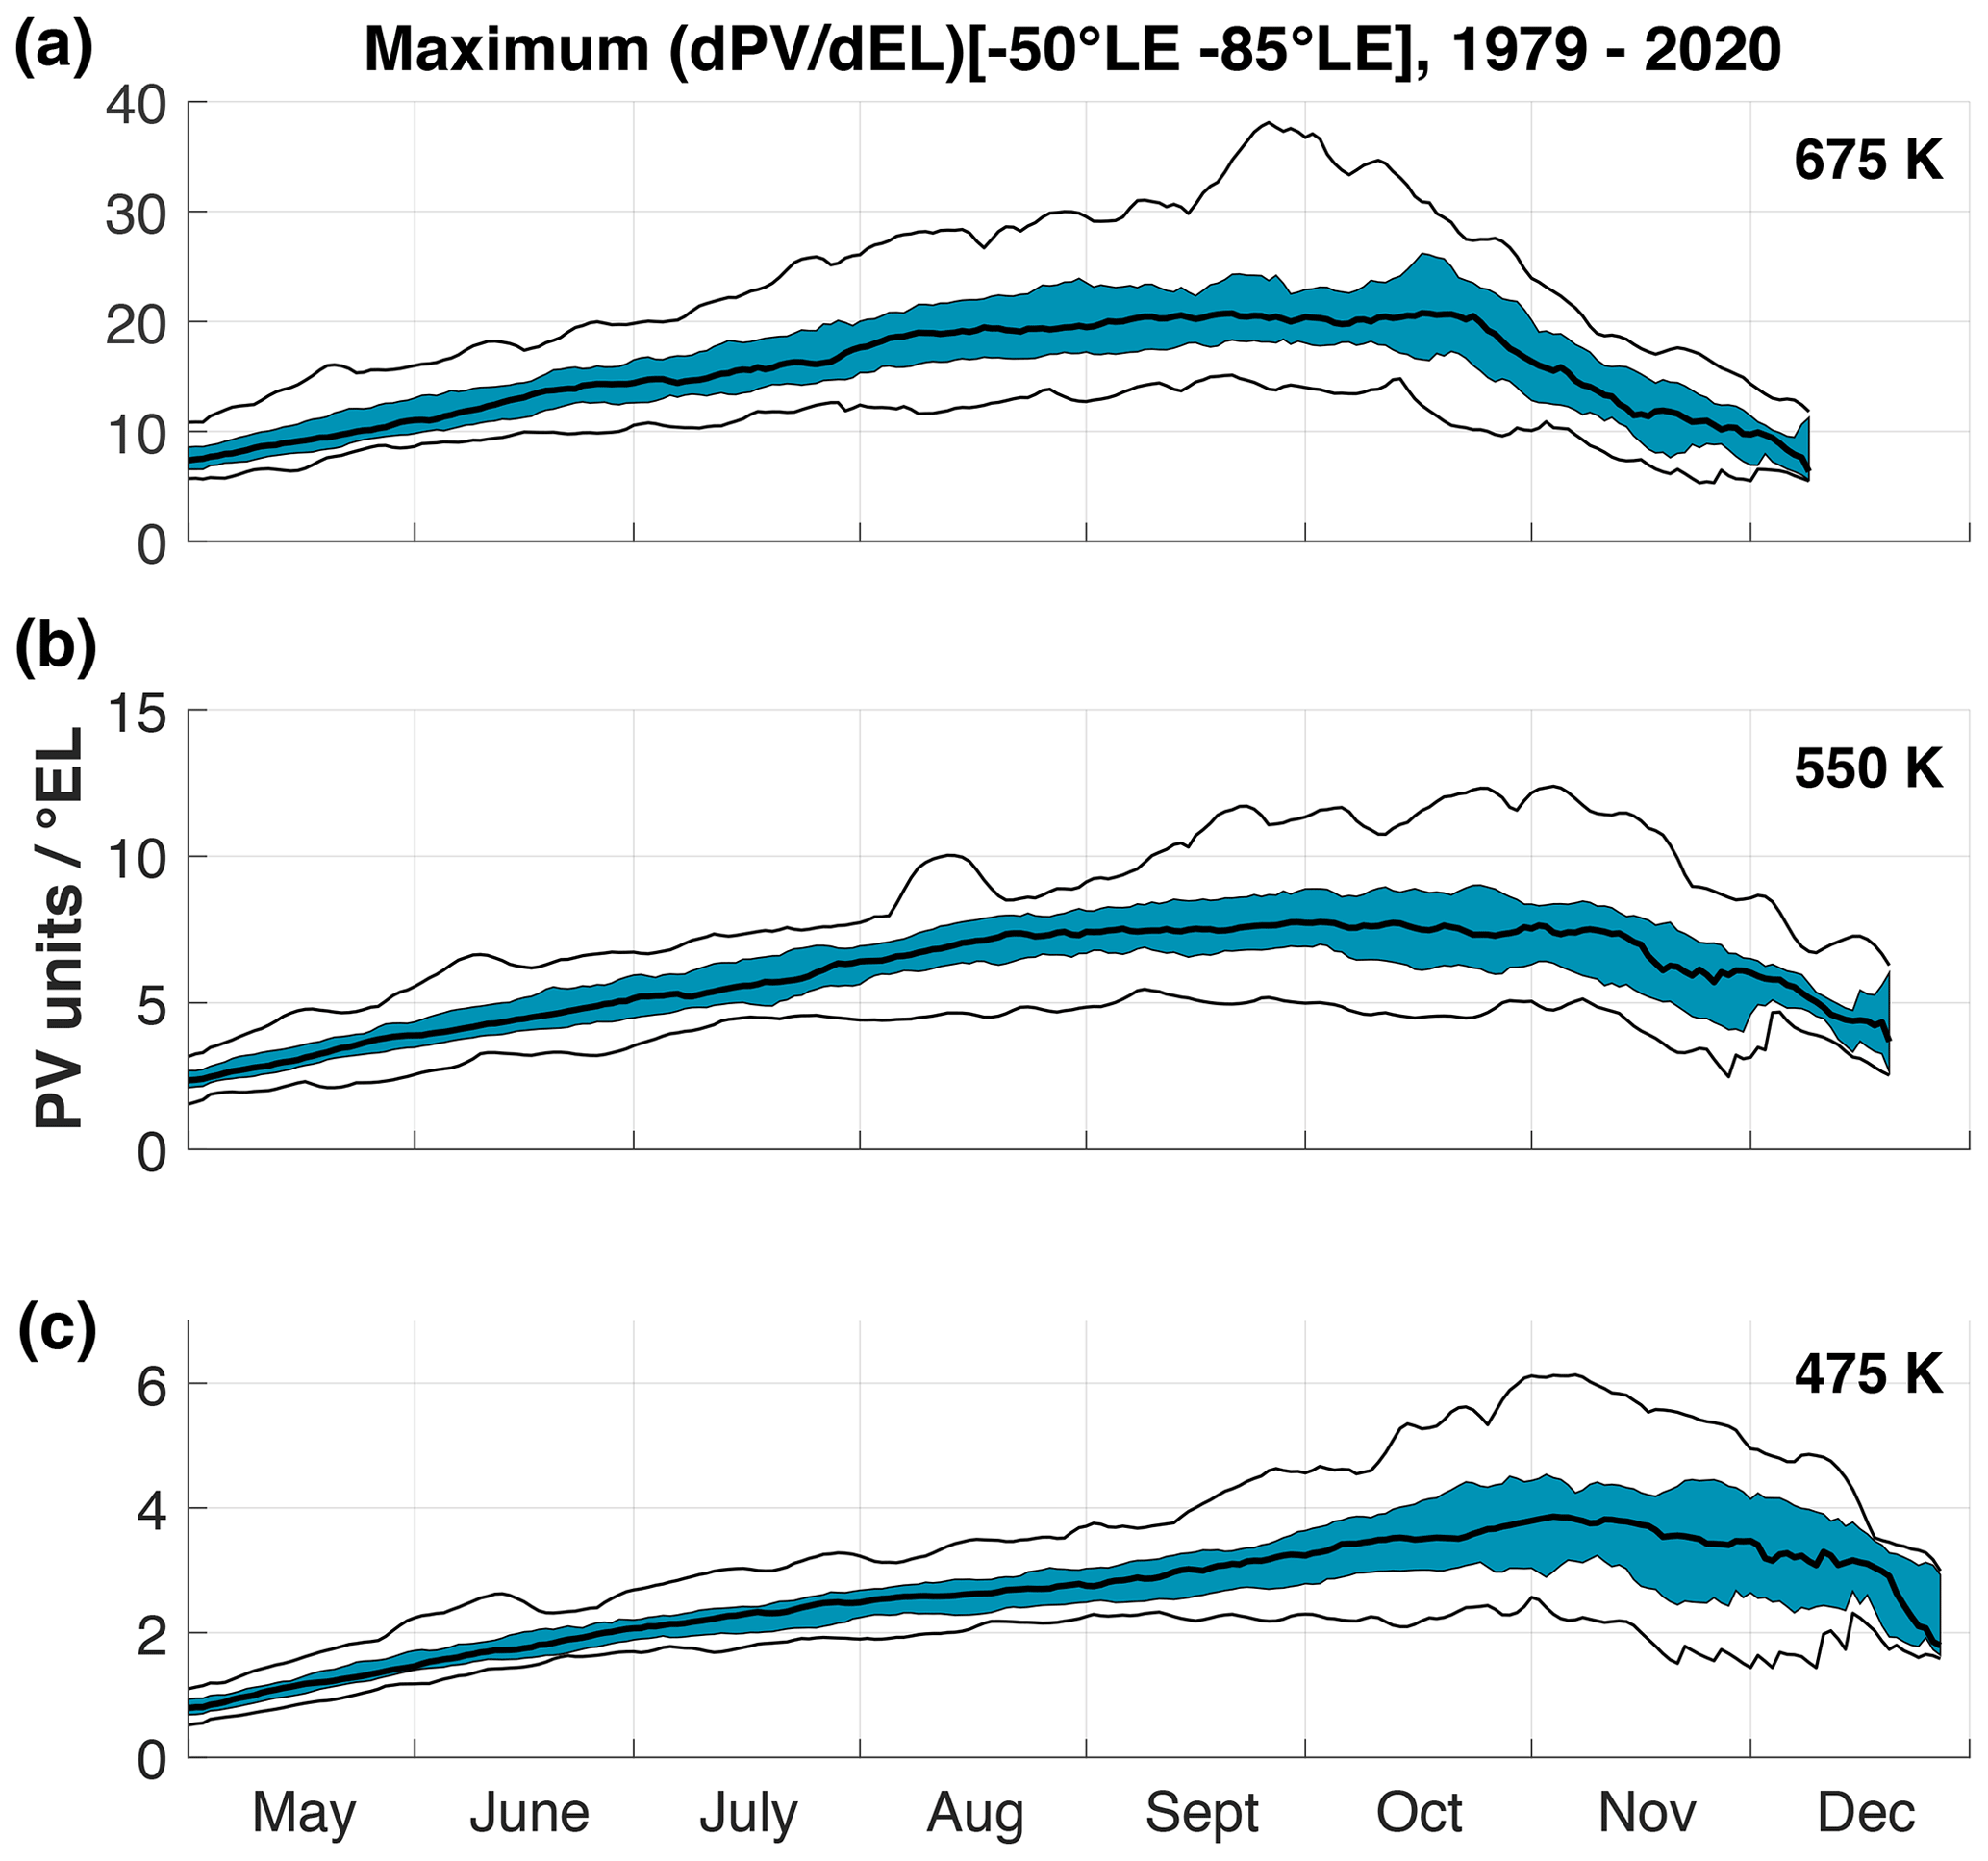
Figure 1Evolution of daily maximum PV gradient in the period 1979–2020, from (a) to (c): 675, 550, and 475 K. Median values are represented by the bold black curves. Blue areas show values between the 20th and 80th percentiles, while thin black curves represent the maximum and minimum during the period.
Figure 2 represents the evolution of the vortex edge position in EL. For this parameter, medians and percentiles curves show a similar behavior for the various levels from May to late September for all levels. The polar vortex edge position is reached between mid-July and late August at 675 K, between mid-July and mid-August at 550 K, and between mid-August and September at 475 K, with respective median average values of −57.3, −57.8, and −58.4∘ EL. The minima show clearly the large reduction in the vortex area due to the major warming in 2002 during October. It is less pronounced at 475 K where the edge position decreased to a minimum of −67.8∘ EL, compared to −76.3 and −71∘ EL at 675 and 550 K, respectively (e.g., Hoppel et al., 2003). The winter of 2019 impacts the minimum curve during the last 2 weeks of September at 675 K and is located between the minimum curve and the 20th percentiles from September to the beginning of November for each level. During this year, a minor SSW occurred at the end of August, which displaced and weakened the polar vortex. The stratospheric polar vortex abruptly weakened and warmed on 25 August (Lim et al., 2021). MERRA2 analyses showed a rapid 50 K increase in polar temperature at 10 hPa between 5 and 11 September (Yamazaki et al., 2020). Minimum values of winds at 10 hPa and 60∘ S were found on 18 September (Rao et al., 2020). This event induced the smallest Antarctic ozone hole on record. Although it appeared earlier than usual in August, the ozone hole reached an area of 15 million km2 by 1 September, but decreased to an area of 8 million km2 by 17 September (Lim et al., 2021). The variability in the vortex area decreases for all levels during the period of maximum edge intensity: the EL difference between the 20th and 80th percentiles decreases to 3.7∘ EL in October at 675 K, and 3.1∘ EL at the 550 and 475 K levels compared to 4.6, 5.4, and 5.2∘ EL in August, respectively.

Figure 2Evolution of daily position of the vortex edge in equivalent latitude as a function of time over the period 1979–2020, from (a) to (c): 675, 550, and 475 K. Median values are represented by the bold black curves. Blue areas show values between the 20th and 80th percentiles, while thin black curves represent the maximum and minimum values during the period.
4.2 Influence of solar cycle, quasi-biennial oscillation, and El Niño–Southern Oscillation on the polar vortex edge
Factors such as the solar cycle, QBO, and ENSO are used to describe the interannual variability in the temporal evolution of the polar vortex edge over the period 1979–2020. As mentioned in the Introduction, these variables were largely used in various studies of the stratospheric polar vortex.
4.2.1 The solar cycle
The intensity of the vortex edge has been sorted according to the maximum (maxSC) and minimum (minSC) solar activity years (see Sect. 2). Figure 3 displays the composite analysis of the temporal evolution of the polar vortex edge intensity throughout the winter from 1979 to 2020 at the three isentropic levels. In each panel, the dark gray area represents values between the 20th and 80th percentiles of maxSC years with the median in red, and the light gray area represents the 20th and 80th percentiles of minSC years with the median in blue. The various panels of the figure show that minSC years are generally characterized by a stronger vortex edge. Also, in maxSC years the vortex breakup is earlier than during minSC years, e.g., 6 d earlier at 675 K, 4 d at 550 K, and 3 d at 475 K. The relative difference between the maxSC and minSC medians in the periods of maximum intensity is larger at 550 K (16.4 % relative difference) than at 475 K (13 %), and 675 K (11.2 %) levels. A Mann–Whitney test was performed to characterize the significance of these differences. The Mann–Whitney test results indicate that differences are significant from 27 September to 26 October at 675 K, from 9 to 24 September and from 3 October to 21 November at 550 K, and from 19 September to 15 October and from 11 to 26 November at 475 K. For the three levels, there is a jump in the vortex edge intensity for the maxSC years during November, which is not observed for minSC years. These jumps in the medians are related to a smaller number of years included in the statistical parameters due to earlier vortex breakup dates for maxSC years.
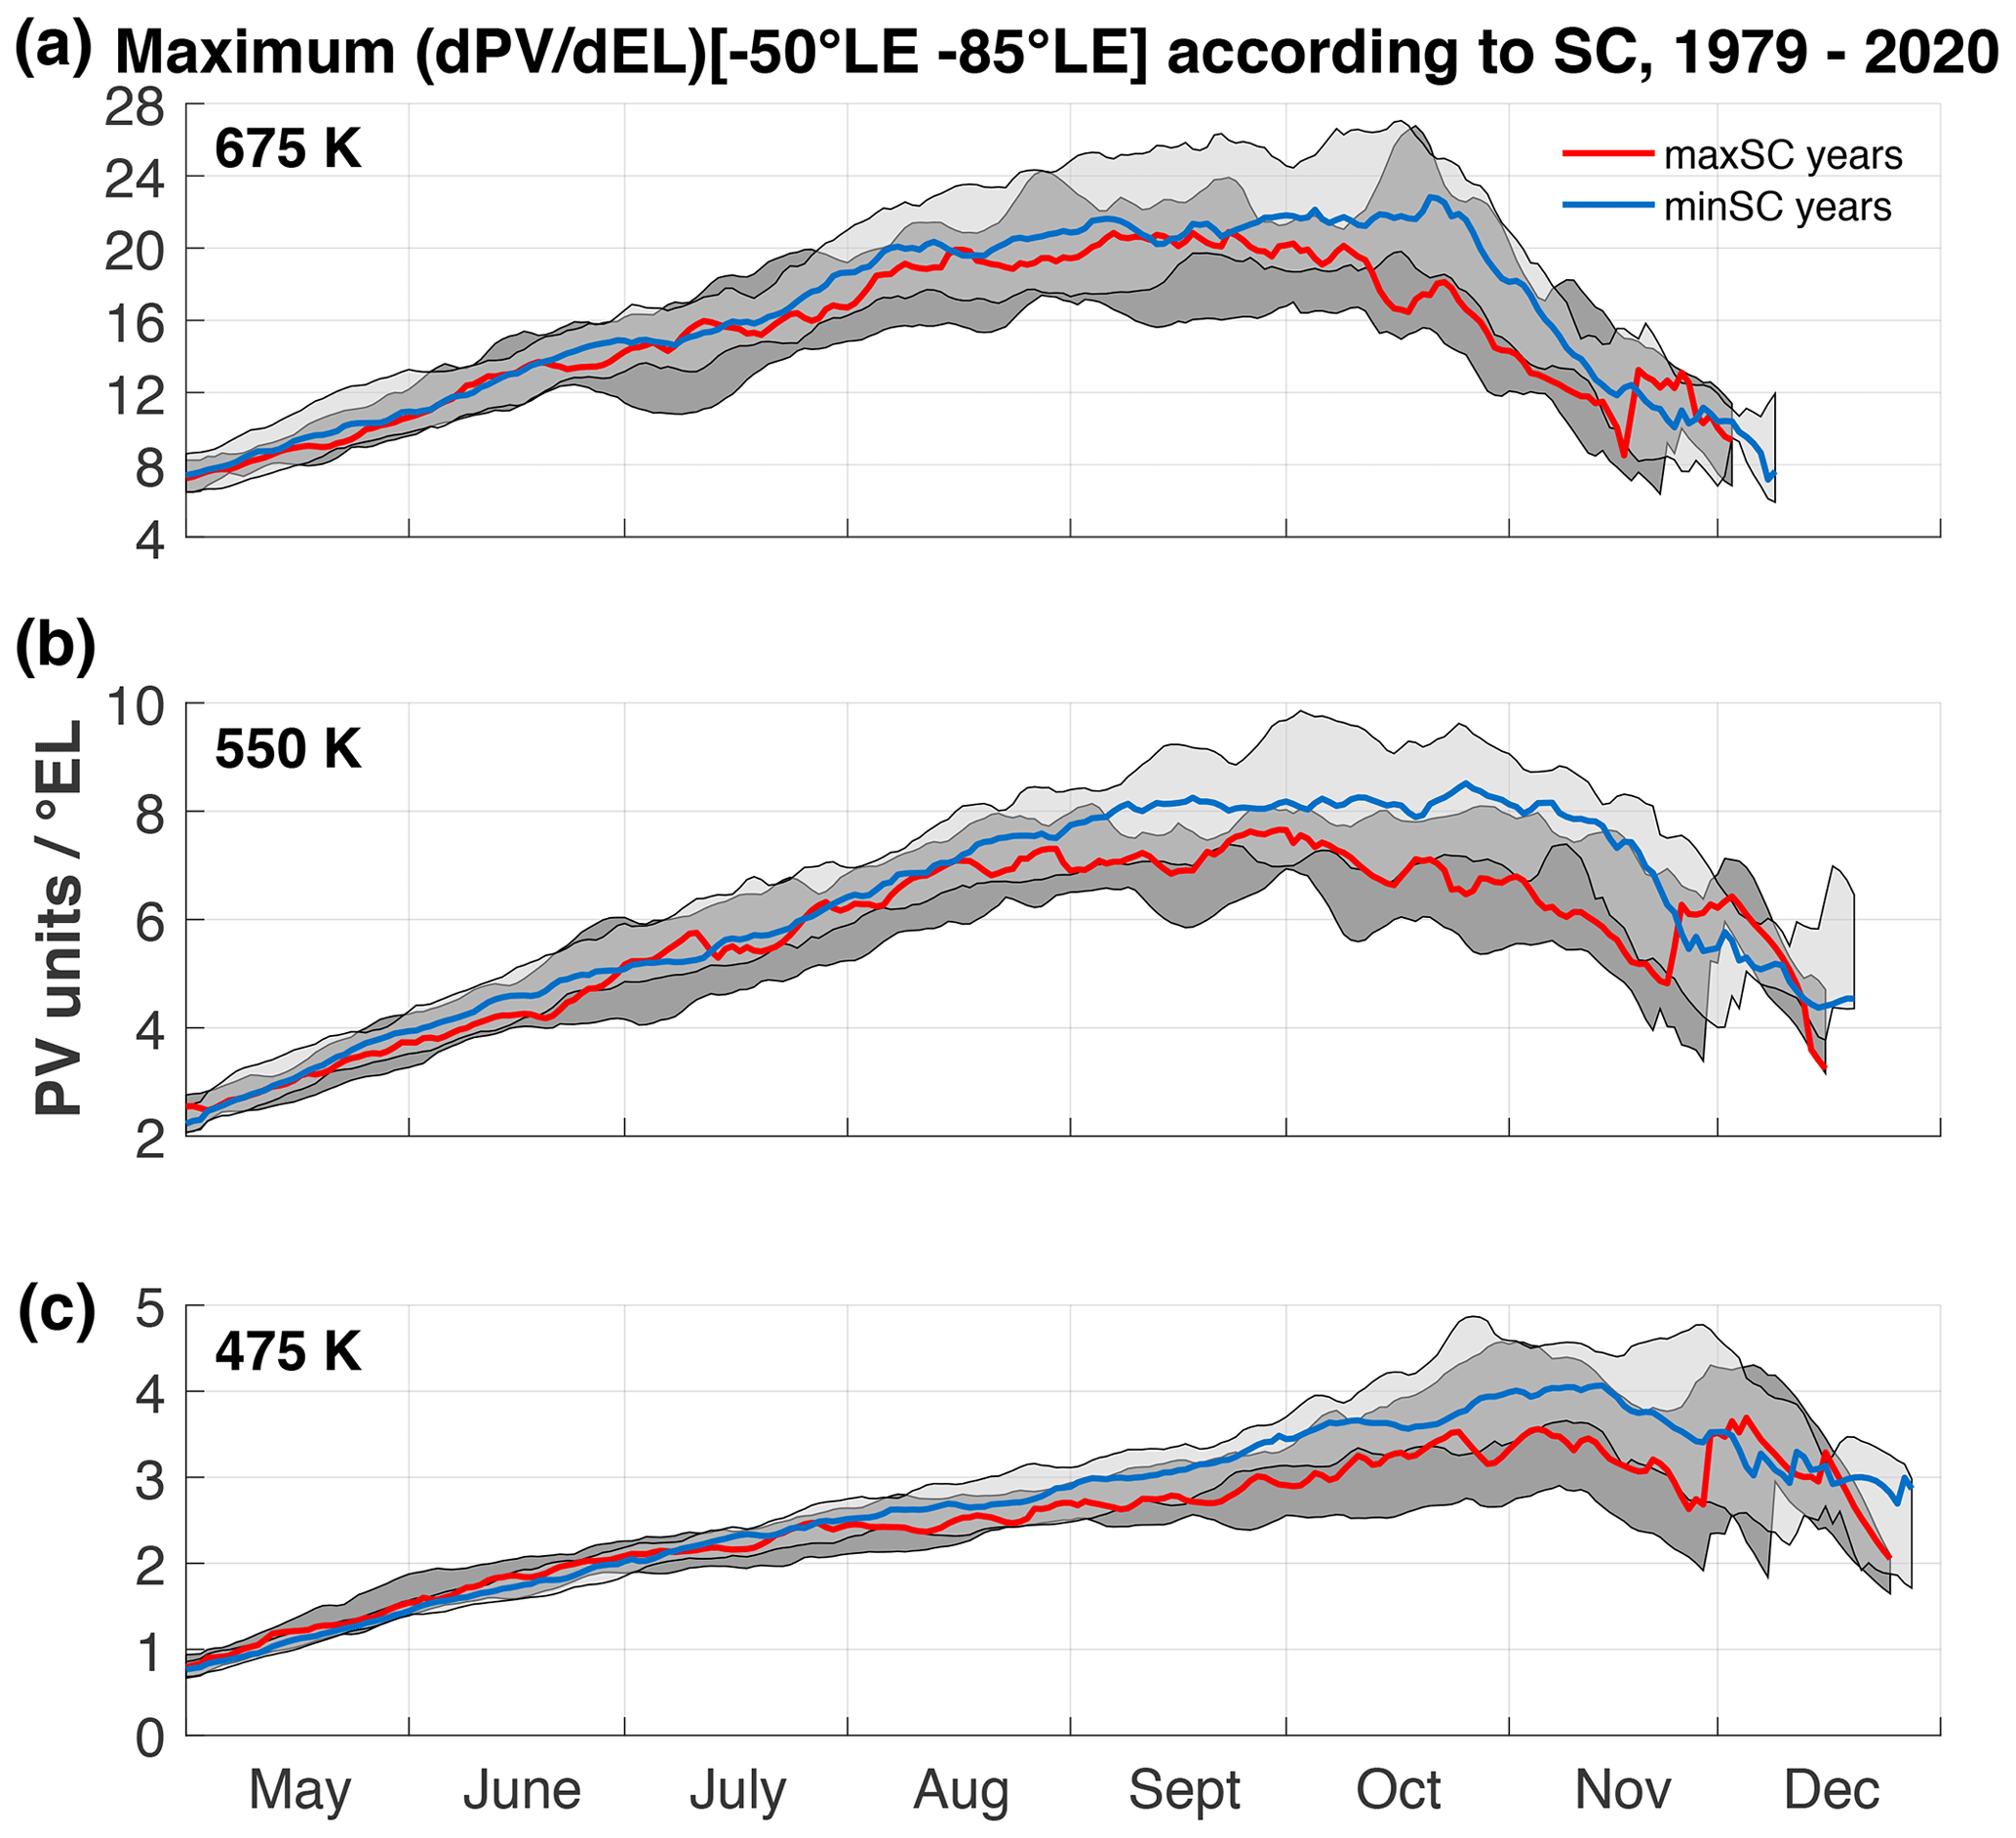
Figure 3SC composites of the seasonal evolution of vortex edge intensity for the period 1979–2020, from (a) to (c): 675, 550, and 475 K. Red curves represent median values for maxSC years and blue curves for minSC years. Dark gray areas indicate values between the 20th and 80th percentiles for maxSC years and light gray areas for minSC years.
Figure 4 represents the composite analysis of the evolution of the vortex edge position according to SC in a similar way as in Fig. 3 for the vortex edge intensity. The results do not show a large impact of the SC on the vortex edge position, although the vortex appears to be somewhat larger during maxSC periods, with also a larger variability. In the beginning of May, the vortex edge extends to −68∘ EL, then reaches a maximum at −56.1∘ EL (−57.4∘ EL) during the maxSC (minSC) between late August and mid-September at 675 K. At 550 and 475 K, the maximum equivalent latitude positions reached according to the maxSC (minSC) years are −55.2∘ EL (−58.7∘ EL) between mid-July and August and −56.4∘ EL (−58.6∘ EL) between mid-August and September. There is less variability and fewer differences between maxSC and minSC years during the period of maximum intensity of the edge (see Sect. 4.1). The difference between the medians was assessed by a Mann–Whitney test and differences are significant from 9 to 18 September at 675 K, from 18 July to 11 August and from 27 August to 7 September at 550 K, and from 15 to 20 June at 475 K.
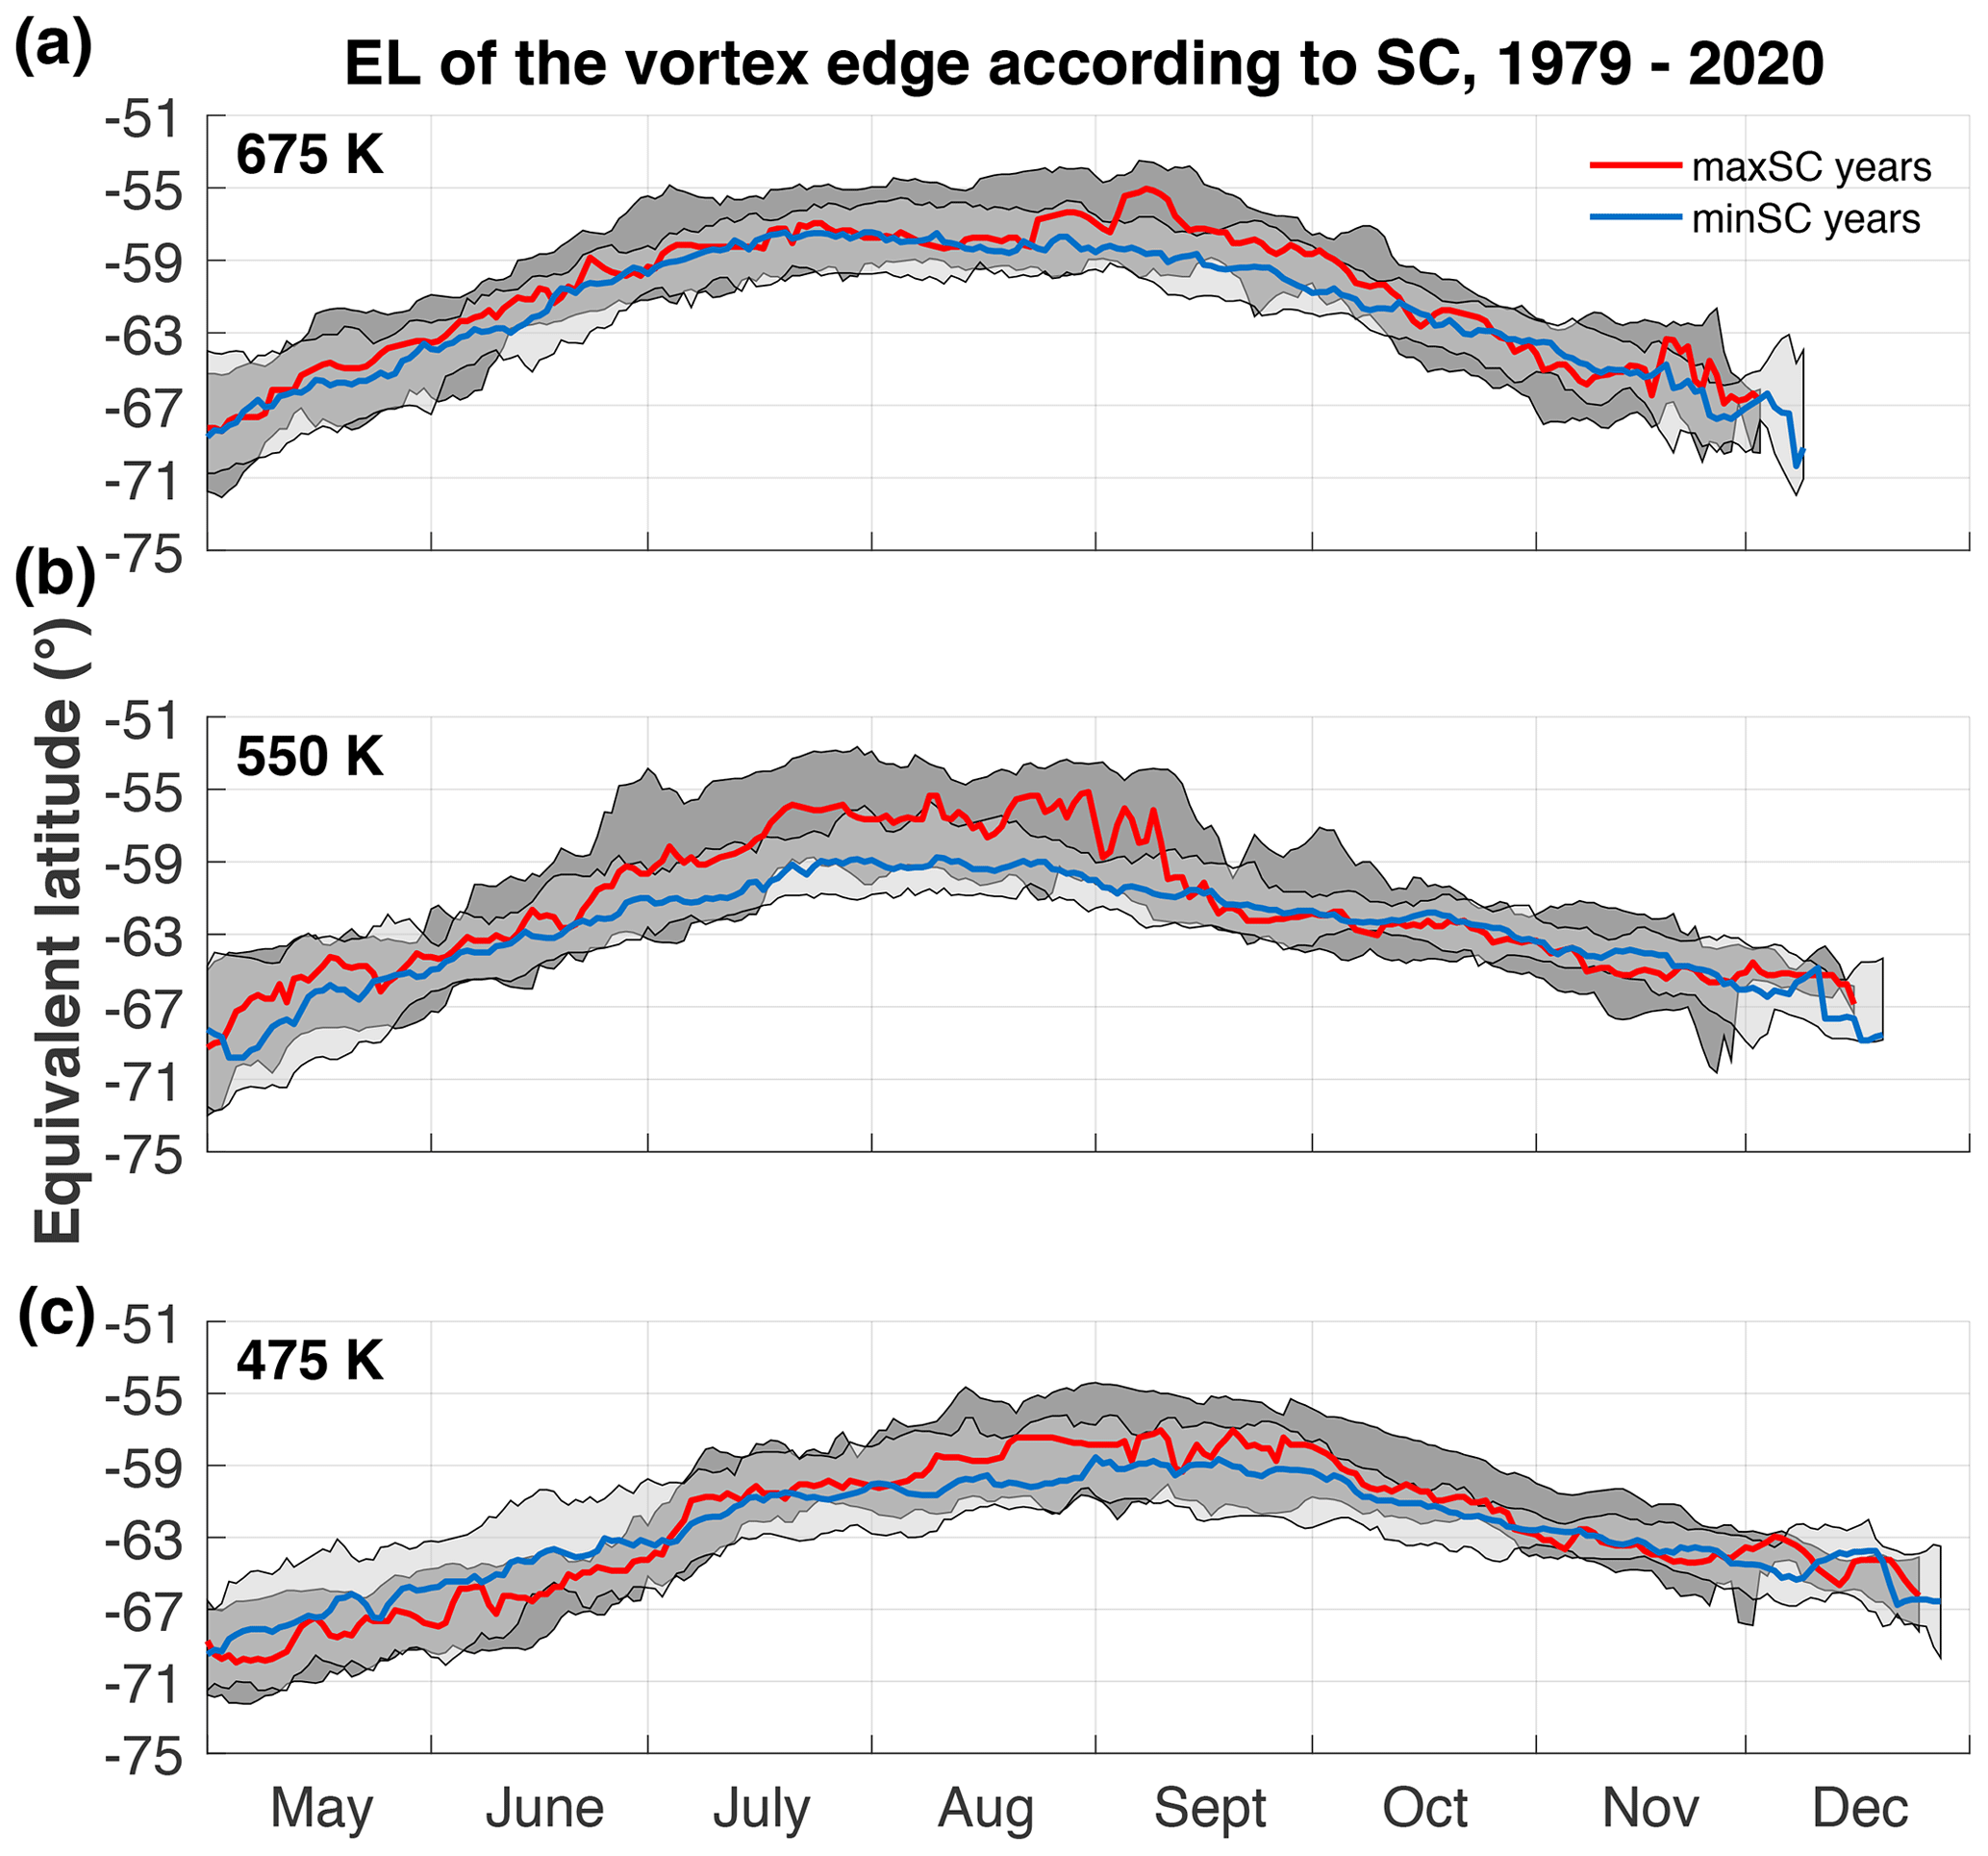
Figure 4SC composites of the seasonal evolution of the vortex edge position according to SC for the period 1979–2020, from (a) to (c): 675, 550, and 475 K. Red curves represent median values for maxSC years and blue curves for minSC years. Dark gray areas indicate values between the 20th and 80th percentiles for maxSC years and light gray areas for minSC years.
4.2.2 Quasi-biennial oscillation
We then studied the modulation of the SC influence on the vortex edge by the QBO. Figure 5 represents the composite analysis of the polar vortex edge intensity throughout the winter for the period 1979–2020 at 550 and 475 K, with maxSC and minSC years sorted according to the phase of the QBO: eQBO and wQBO are in the left and right panels, respectively. Only results for the lower levels are shown, as the differences are less clear at 675 K. In each panel, the dark gray area indicates the 20th and 80th percentiles of maxSC years with the median in red, and the light gray area indicates the 20th and 80th percentiles of minSC years with the median in blue. Note that during the study period there are only 5 years for maxSC/eQBO versus 10 years for minSC/eQBO, and 10 years for both maxSC/wQBO and minSC/wQBO (see Table 2).
At 550 K, both QBO phases are characterized by a stronger vortex edge during minSC years but the differences between minSC and maxSC medians are largest during eQBO years. The largest variability in vortex edge intensity for minSC years (with the largest observed values) is also seen for eQBO years. During the wQBO phase, minSC years show a longer duration of the period of maximum intensity (from September to November) and maxSC years are characterized by a stronger vortex edge and a longer vortex duration, compared to their equivalent during eQBO phases. A similar behavior of the vortex edge intensity is observed at 475 K. The minSC and maxSC years show, respectively, stronger vortex edge intensity during the wQBO phase than during the eQBO phase. The maxSC years are characterized by a longer vortex duration during the wQBO phase than during the eQBO phase. As a conclusion, the QBO further modulates the intensity of the vortex edge, especially for maxSC years, which are generally characterized by a stronger vortex edge and longer vortex duration during the wQBO phase than during the eQBO phase. MinSC years also show a slightly stronger vortex edge during the wQBO phase.
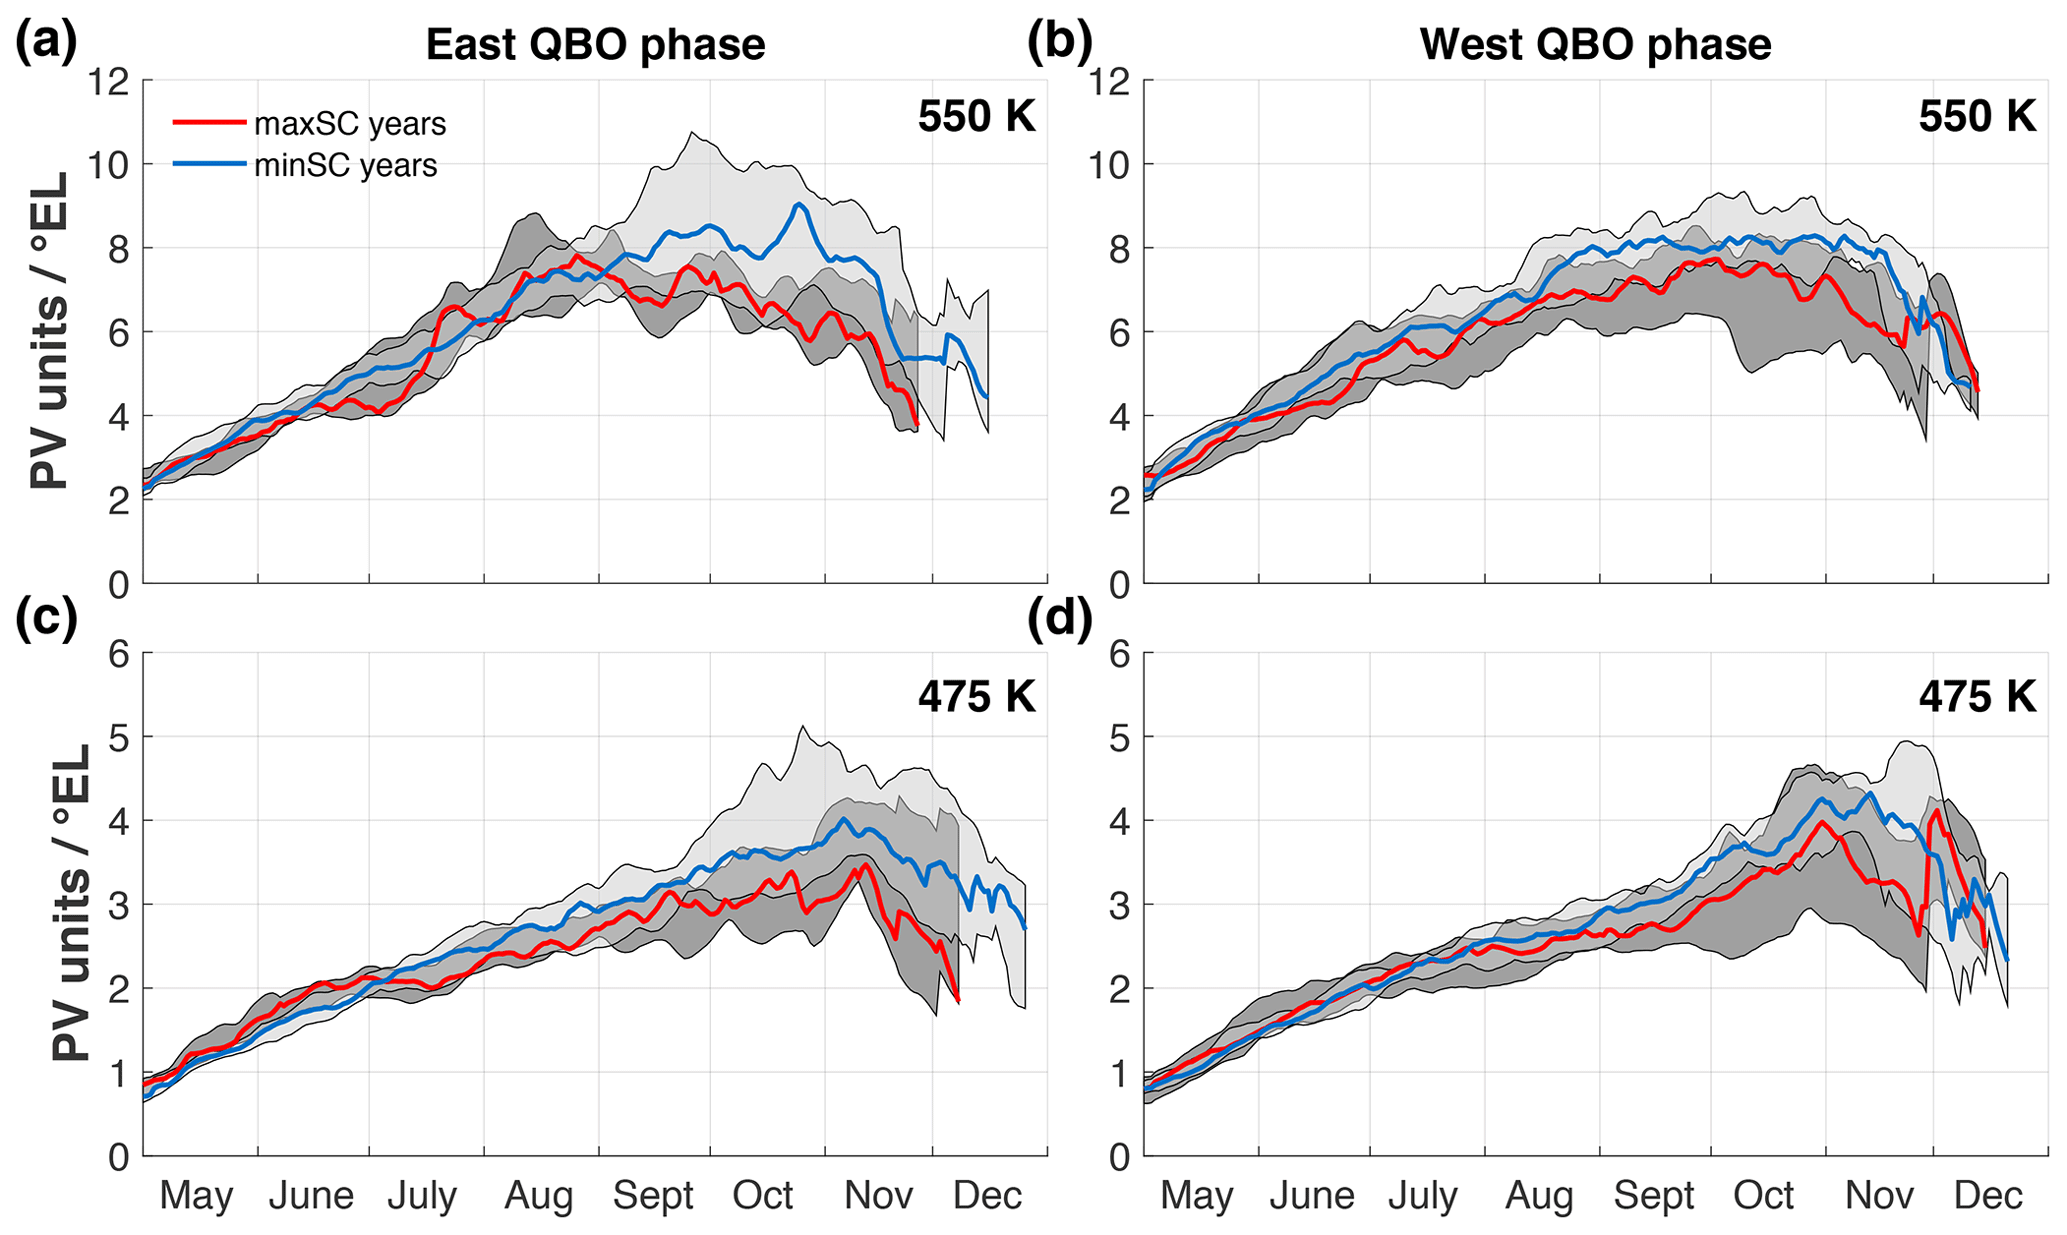
Figure 5Composites of the seasonal evolution of vortex edge intensity according to SC and QBO for the period 1979–2020, from (a) to (d): 550 and 475 K. Panels (a) and (c) represent eQBO phases and panels (b) and (d) represent wQBO phases (Sect. 2.2). Red curves represent median values for maxSC years and blue curves for minSC years. Dark gray areas indicate values between the 20th and 80th percentiles for maxSC years and light gray areas for minSC years.
4.2.3 El Niño–Southern Oscillation
We also studied the combined modulation of the polar vortex edge by both the SC and ENSO. Figure 6 displays similar composites as in Fig. 5 but selecting warm (wENSO) and cold (cENSO) ENSO phases (see Sect. 2).
At both 550 and 475 K, the largest difference between minSC and maxSC median vortex edge intensity is observed for cENSO years, with minSC years still characterized by the largest intensity. The vortex duration for the maxSC year duration is also larger during cENSO than wENSO years. At both levels, the difference between maxSC and minSC vortex edge intensity is small and insignificant during wENSO years, while cENSO are generally characterized by a stronger vortex edge for both minSC and maxSC years. The polar vortex breaks earlier during the warm phase of ENSO, and especially during the maxSC years with a breakup in November. These results are in agreement with the literature (Li et al., 2016; Domeisen et al., 2019).
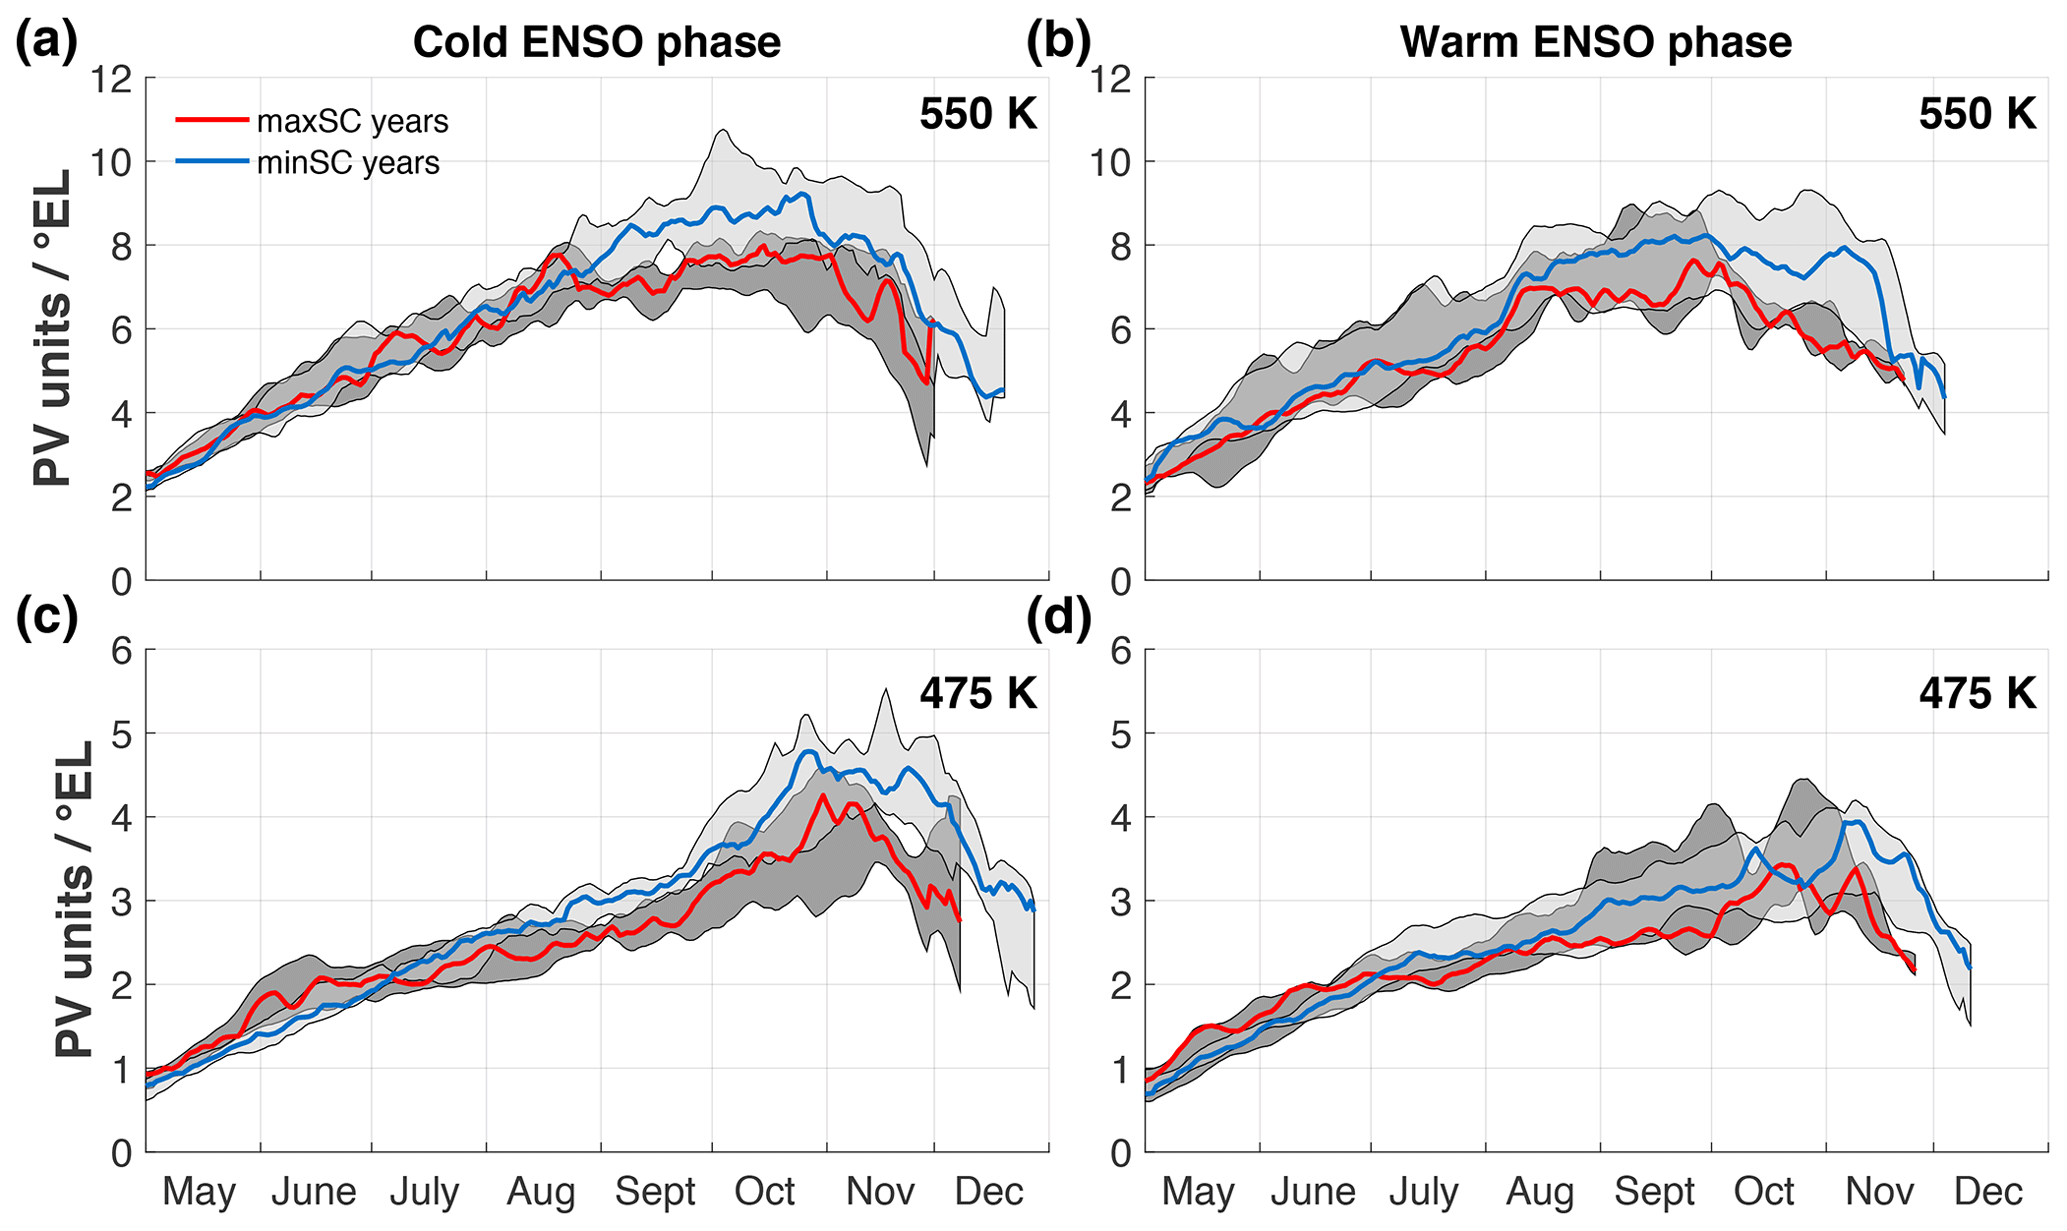
Figure 6Composites of the seasonal evolution of vortex edge intensity according to SC and ENSO for the period 1979–2020, from (a) to (d): 550 and 475 K. Panels (a) and (c) represent cENSO phases and panels (b) and (d) represent wENSO phases (see Sect. 2.2). Red curves represent median values for maxSC years and blue curves for minSC years. Dark gray areas indicate values between the 20th and 80th percentiles for maxSC years and light gray areas for minSC years.
Table 2Summary of the number of years considered in the composite analyses with SC, QBO, and ENSO.
4.3 Interannual evolution of the polar vortex edge
As seen in Sect. 4.1, the maximum median intensity is reached during the September–November period depending on the isentropic level. In order to study the interannual evolution of the intensity and position of the vortex edge during these periods, we identified the day when the maximum was reached at each level and averaged the parameters over ±15 d around this date. Figure 7 represents the interannual evolution of the maximum intensity of the polar vortex edge at each isentropic level over the period 1979–2020, averaged over 15 September–15 October, 1–31 October and 15 October–15 November at 675, 550, and 475 K, respectively. Red circles indicate maxSC years and blue squares indicate minSC years. Symbol-free years are years with 10.7 cm SF values in between minSC or maxSC years.
At 550 and 475 K, an increase of the vortex edge intensity from the beginning of the period to the end of the 1990s is visible while this increase is not observed at 675 K. It is about 121 % and 136 % at 550 and 475 K, respectively, between 1980 and 1996, and about 61 % and 86 % between 1980 and 2000 at the same levels. This increase can be attributed to the intensification of the ozone hole during the 1980s and 1990s, as mentioned in other studies (Bodeker et al., 2002). From 2000, the intensity remains at a high level due to the continuing appearance of the ozone hole. Superimposed is the medium-term variability linked to the SC and interannual variability linked to the QBO and ENSO. In agreement with results in Sect. 4.1 and 4.2, peaks observed around 1986, 1996, 2005, and 2016 are the signature of the 11-year solar cycle corresponding to minSC years. We note, however, that some maxSC years show high values of vortex edge intensity, e.g., 2014 at both 550 and 475 K levels. This year is in wQBO phase, which confirms the previous conclusion that the vortex edge intensity of maxSC years is stronger during wQBO phases. However, it is in a wENSO phase, when the median vortex edge intensity is lower than during cENSO under maxSC conditions. It should be noted that the latest solar cycle (cycle number 24) was less intense than the previous ones (Jiang et al., 2015) and the maxSC years of the last cycle correspond to intermediate years between minimum and maximum years of the previous cycles, and thus the modulation of the vortex edge intensity by the latest solar cycle is potentially weaker than by the earlier cycles. Similarly, while years with low edge intensity generally correspond to maxSC years, minSC years also show low intensity of the vortex edge especially at the end of the period (2016–2020), which corresponds to the end of the last weaker solar cycle.
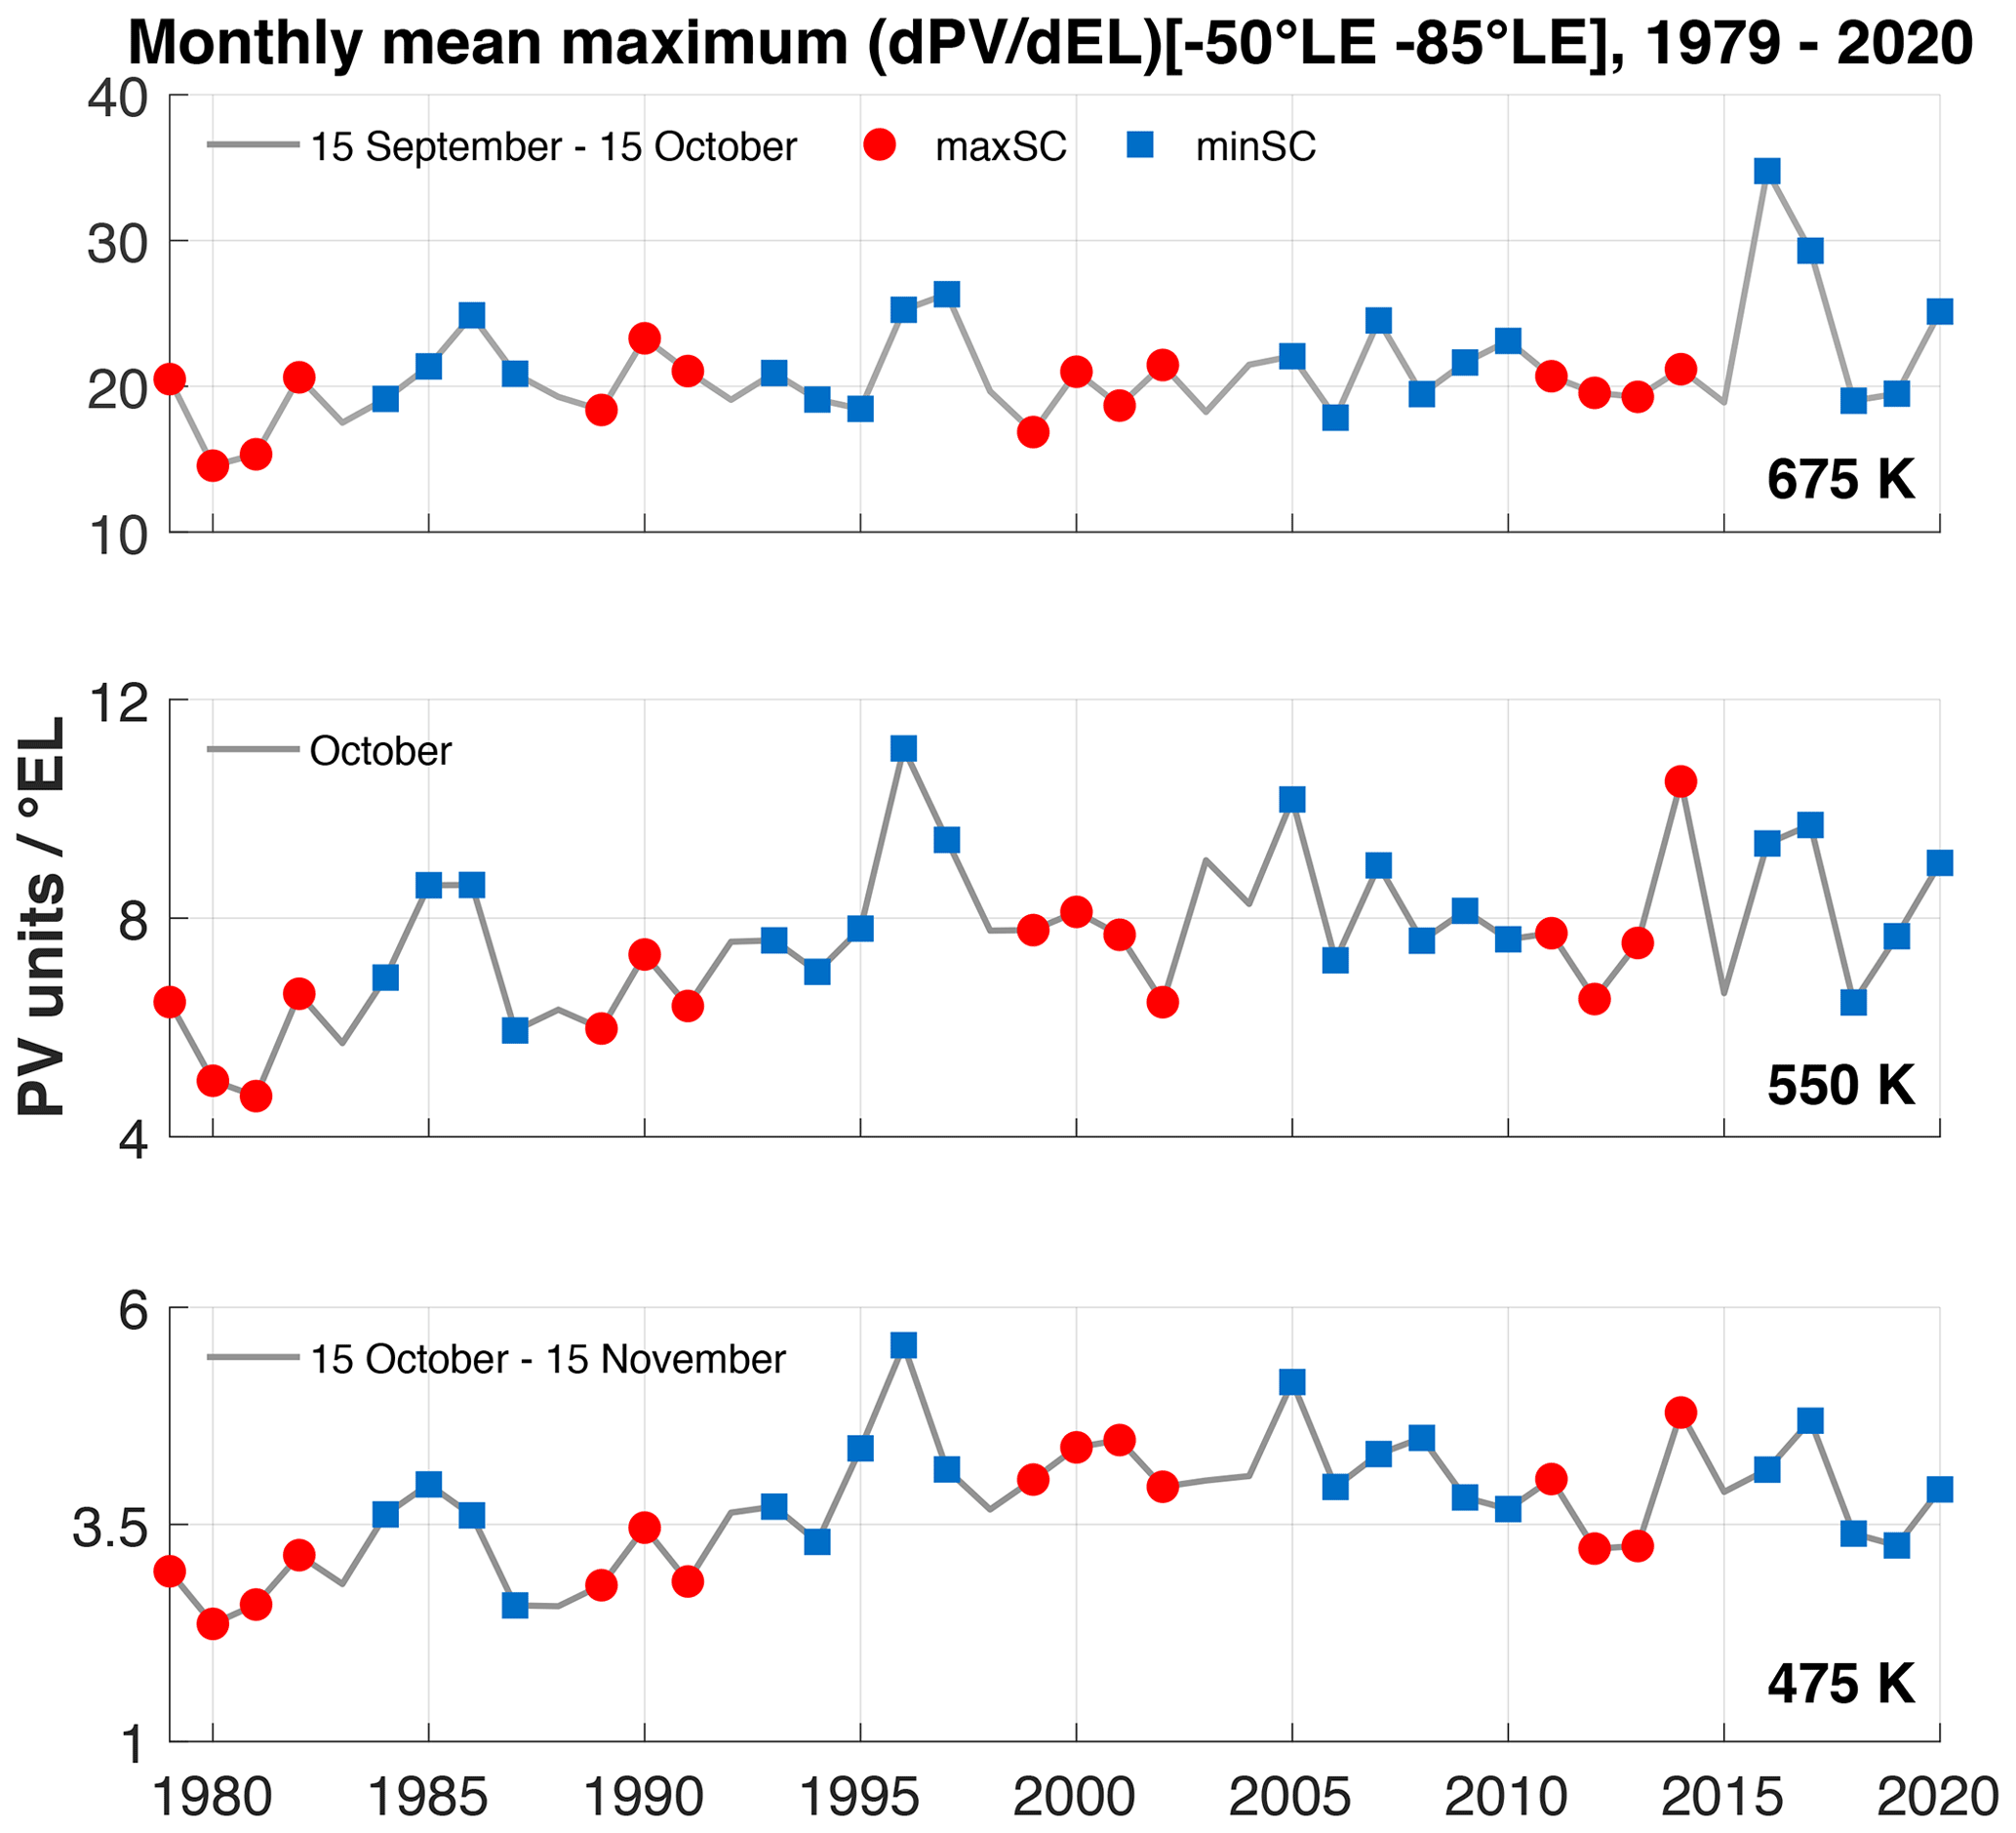
Figure 7Interannual evolution of the maximum vortex edge intensity for the period 1979–2020, averaged over 15 September–15 October for 675 K, October for 550 K, and 15 October–15 November for 475 K. The maxSC years are represented by red circles and the minSC years by blue squares.
Figure 8 represents the interannual evolution of the polar vortex edge position with years sorted according to the SC as described in Fig. 7. The position of the vortex edge is quite similar for 550 and 475 K levels. Between 1979 and 2001, the edge position is larger at 675 K. The most noticeable feature is the small edge position in 2002 due to the major warming and the vortex split which occurred during that year. It was shown that the major warming in 2002, the first one observed over Antarctica, was mainly due to increased planetary wave activities in the southern stratosphere (Hoppel et al., 2003). With the exception of this year, the maximum edge position fluctuates between −65.7 and −55.3∘ EL, at all levels. At 550 and 475 K levels, the edge position decreases from 1981 to 1994, with values varying from −56.6 and −58.6 to −63.4∘ EL and −63.7∘ EL, respectively, at both levels (average decrease of 7 to 5∘ EL in 14 years). It can be noted that these years correspond to the period when the intensity of the vortex edge increases. At 675 K, the downward trend is less visible. At all levels, particularly at 675 and 475 K, there is a decrease in the edge position of the 2019 polar vortex, due to the minor SSW mentioned in Sect. 4.1. Contrary to the 2002 SSW, the 2019 SSW occurred during a period of solar minimum. By contrast, the year 2020, which was characterized by a strong ozone hole with a very long duration (see Sect. 5), does not show a particularly strong maximum vortex edge intensity value or an atypical value of the edge position during the respective periods of maximum intensity. Later in the winter, it impacts the maximum intensity curve for a few days at the three isentropic levels.
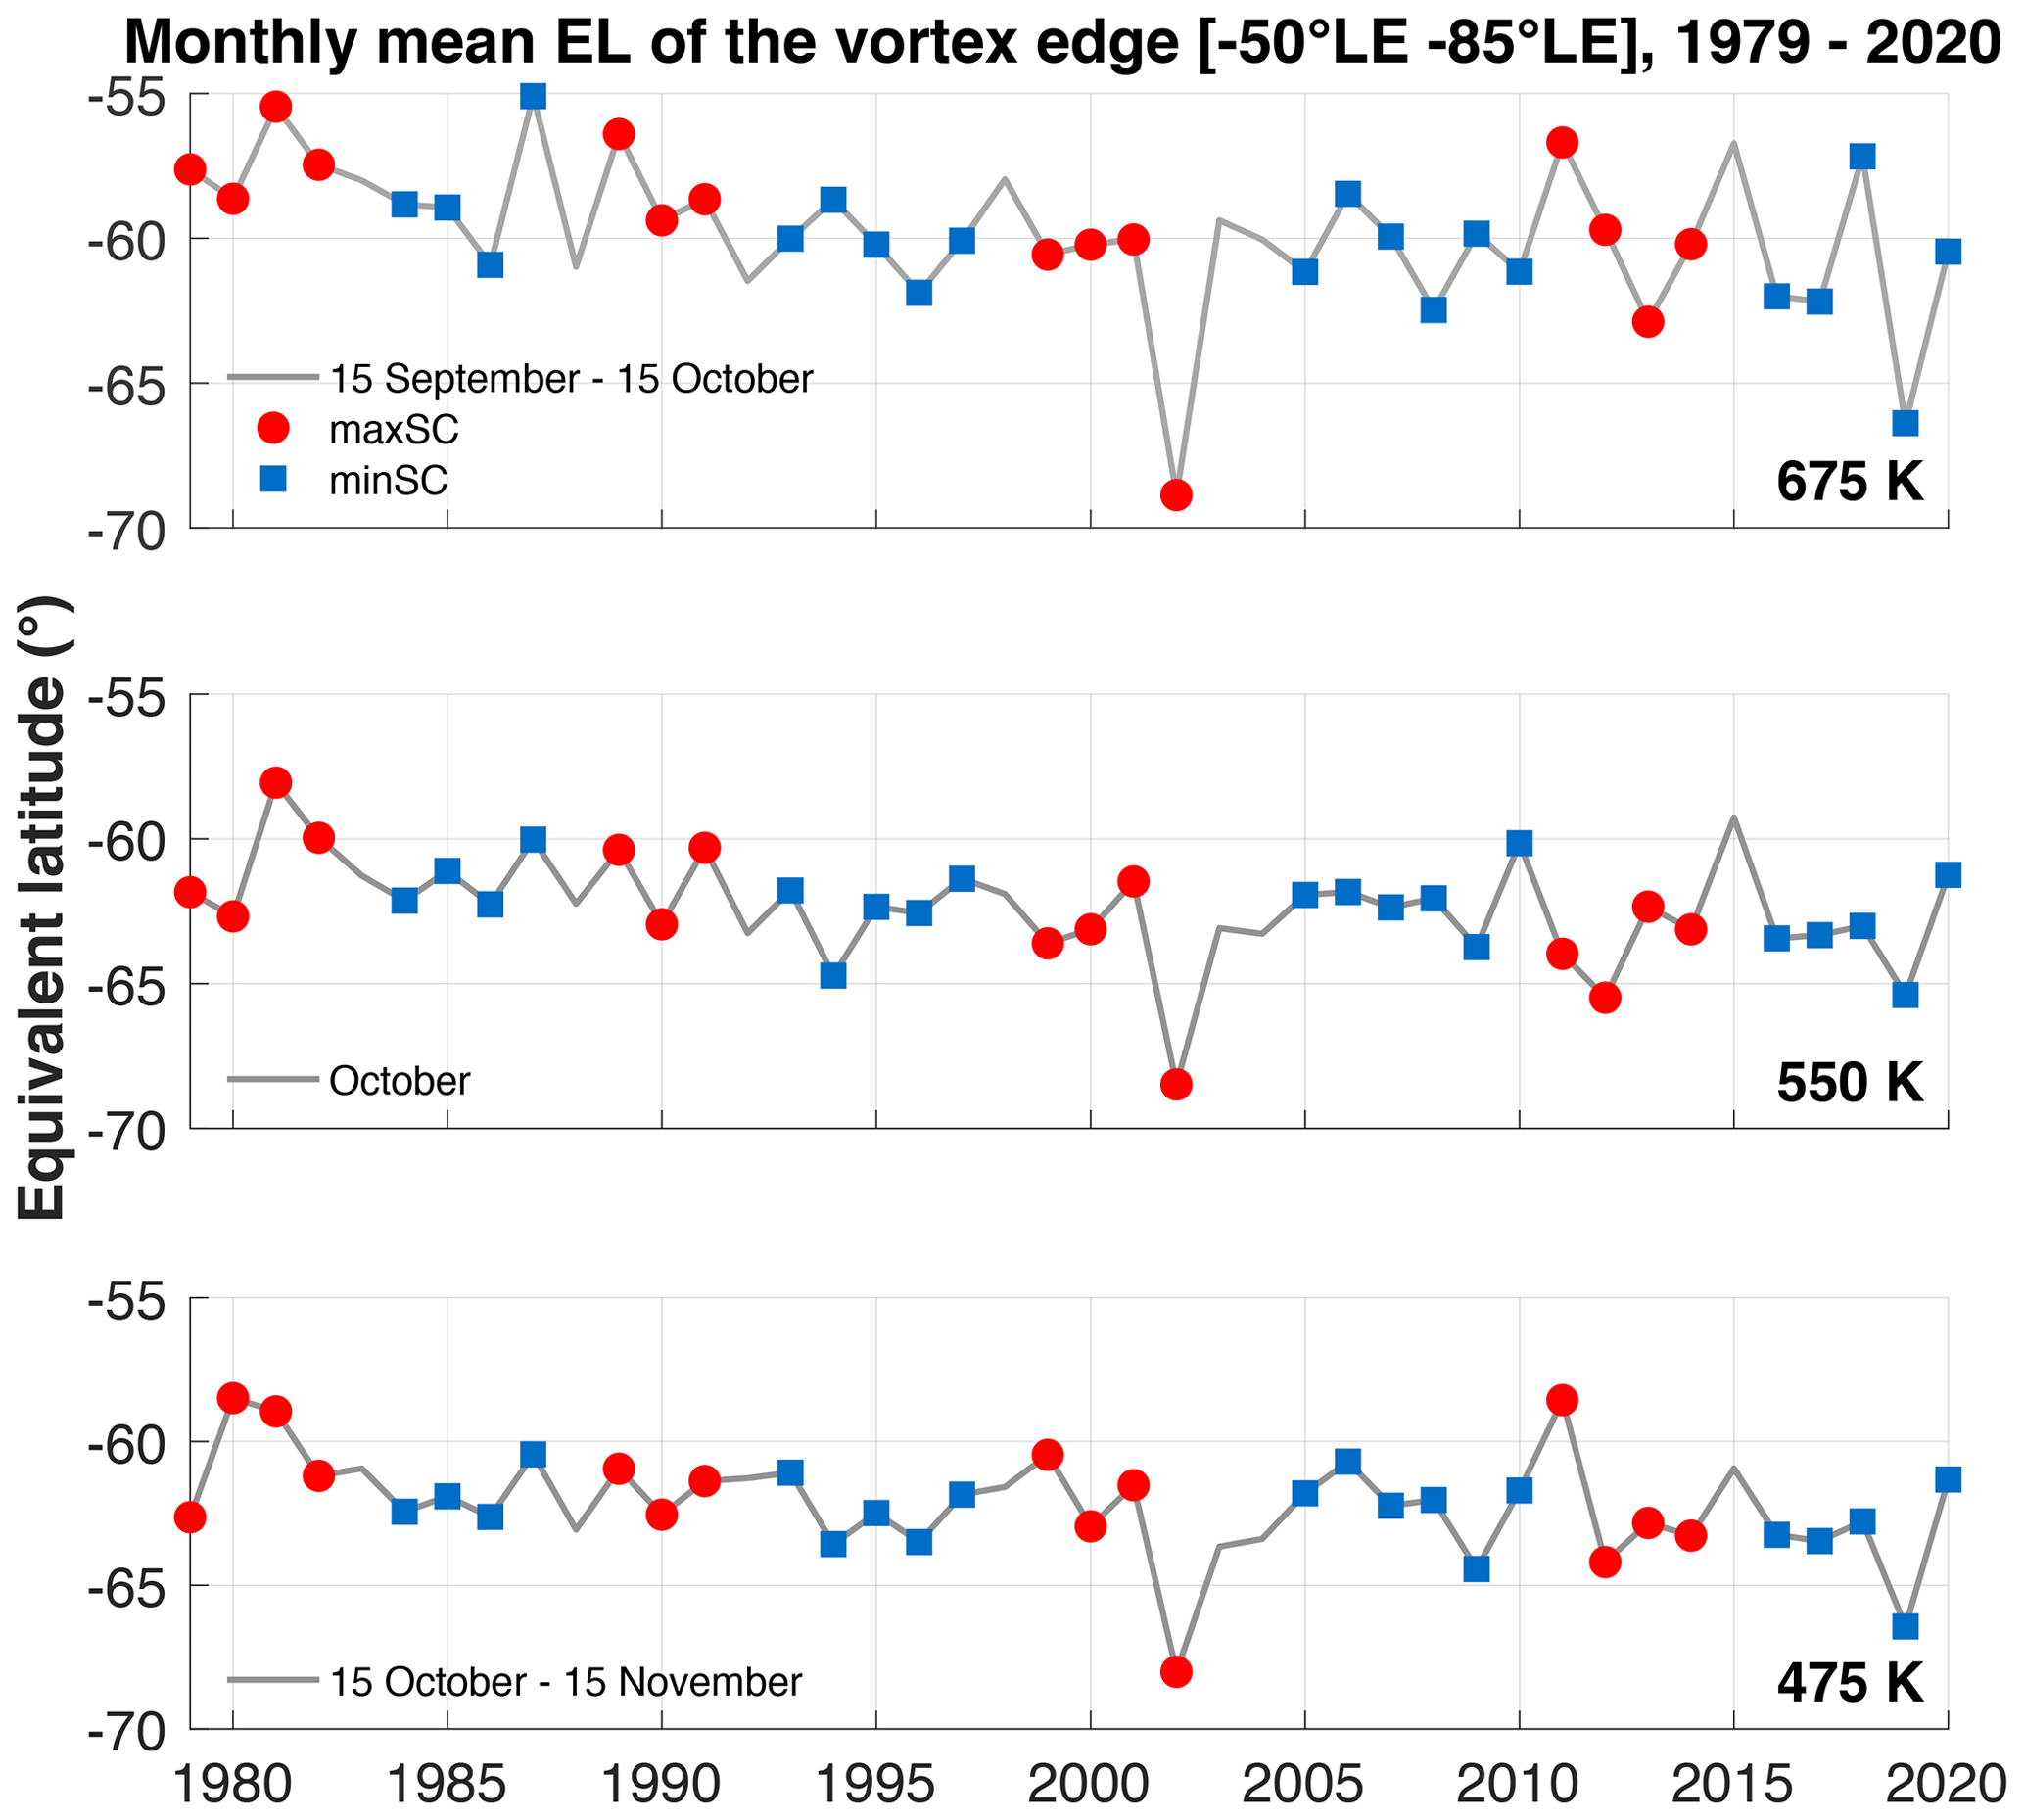
Figure 8Interannual evolution of the vortex edge position for the period 1979–2020, averaged over 15 September–15 October for 675 K, 1–31 October for 550 K, and 15 October–15 November for 475 K. The maxSC years are represented by red circles and the minSC years by blue squares.
The evolution of the onset dates of the polar vortex during winter from 1979 to 2020 at 675, 550, and 475 K isentropic levels is displayed in Fig. 9. It represents the day of the year when the polar vortex is well formed, e.g., when the horizontal mean wind speed at the vortex edge is above the threshold values of 15.2, 20, and 25 m s−1, as suggested by Akiyoshi et al. (2009).
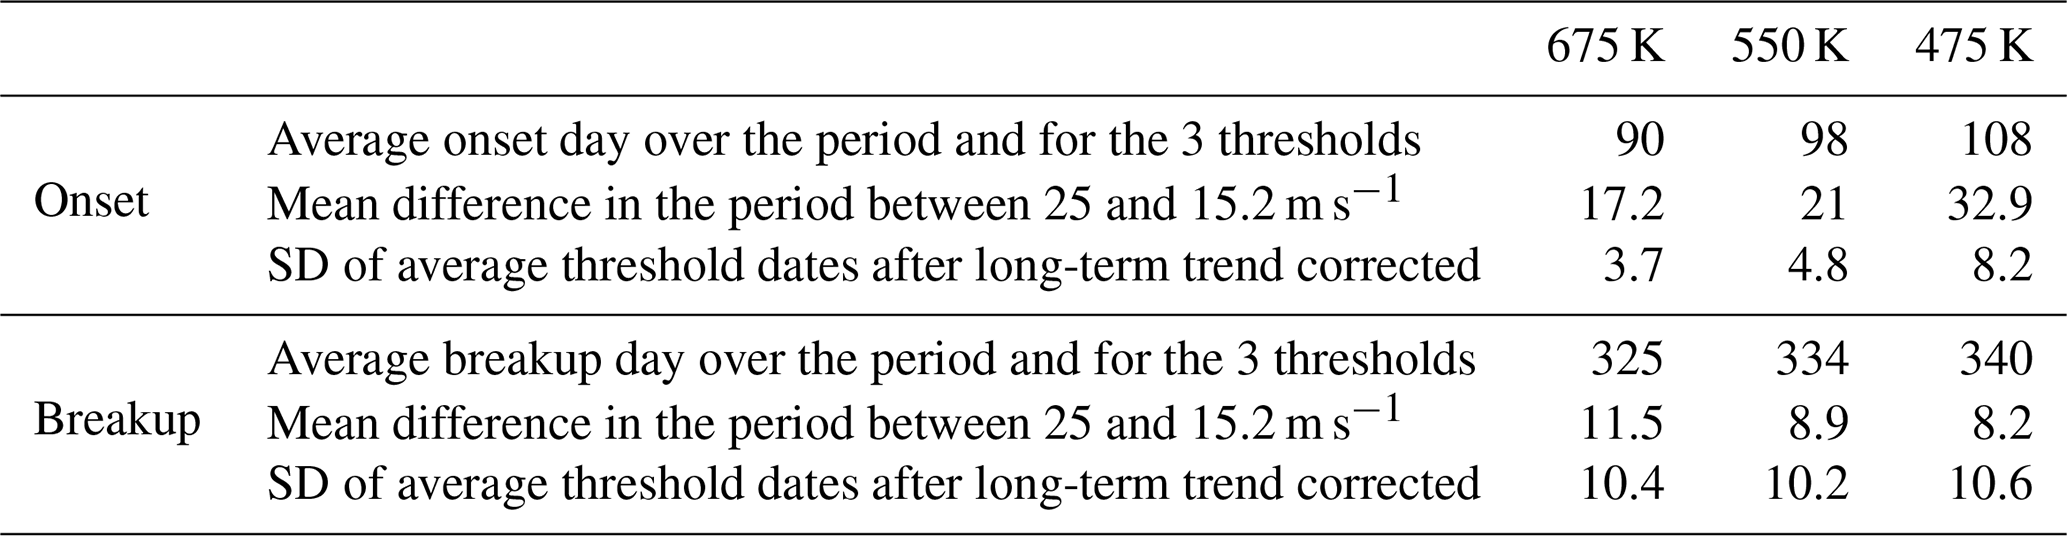
Due to the stronger radiative processes in the upper stratosphere, the temperature contrast between the polar region and mid-latitudes is stronger and the polar vortex forms more rapidly with a faster wind. Thus the vortex forms earlier at the highest levels: the average day of the year the onset date occurs for all thresholds combined is on days 90, 98, and 108 at 675, 550, and 475 K, respectively. Also, the onset date occurs later for the larger threshold values as the wind strength increases in autumn in the polar stratosphere. The differences between onset dates according to the different threshold values decreases with altitude. At 475 K, the mean values of the onset dates are days 93, 109, and 125 for the 15.2, 20, and 25 m s−1 thresholds, respectively. However, some years show a large difference between the onset dates according to the different threshold values, which can exceed 1 month (e.g., in 2002, 1.5 months between 15.2 and 25 m s−1). For example, the winter of 2002 was characterized by a difference of 1.5 months between the two extreme threshold values, as the wind at the beginning of the winter was weaker compared to other winters. This is actually the first winter in which an SSW was observed, as mentioned previously. Due to the slower and less stable wind at 475 K, the vortex forms slowly and there is an important interannual variability of onset dates with an average difference of 32.9 d between 15.2 and 25 m s−1 during the whole period. There are some outstanding late onset dates at 475 K, particularly for the 25 m s−1 threshold, e.g., on day 152 in 2002 and day 149 in 2014. By contrast, the year 1992 was characterized by an early onset on day 73 for the 15.2 m s−1 threshold. The 550 and 675 K levels show comparatively less variability in the onset dates for the various threshold values and the difference between the onset dates for the largest and lowest threshold values is of the order of 10 d on average (21 and 17.2 d at 550 and 675 K, respectively, between the 25 and 15.2 m s−1 threshold values). This difference in interannual variability in the onset dates among the levels is further confirmed from the average standard deviation of the three thresholds curves after subtracting a 3∘ polynomial. This standard deviation amounts to ±8.2 d at 475 K, which is almost 2 times larger than the values of the 675 and 550 K levels (±4.8 and ±3.7 d, respectively).
Some long-term variability in the evolution of the onset dates is also observed at the different levels. At 675 K, a decreasing trend is visible between 2010 and 2018 for the 15.2 m s−1 threshold, with a slightly higher interannual variability during this last decade. At 550 K, a similar decrease in the onset date from 2011 is observed, most pronounced for the 15.2 m s−1 threshold. At 475 K, the most prominent feature is a significant decline of the onset dates between 1980 and 1999 for the 25 m s−1 threshold value of about 29 d in 19 years, corresponding to a decline of 1.5 d yr−1. It is also noteworthy that later onset days in 2002, 2012, and 2014, correspond to years with smaller ozone holes (e.g., Pazmiño et al., 2018).
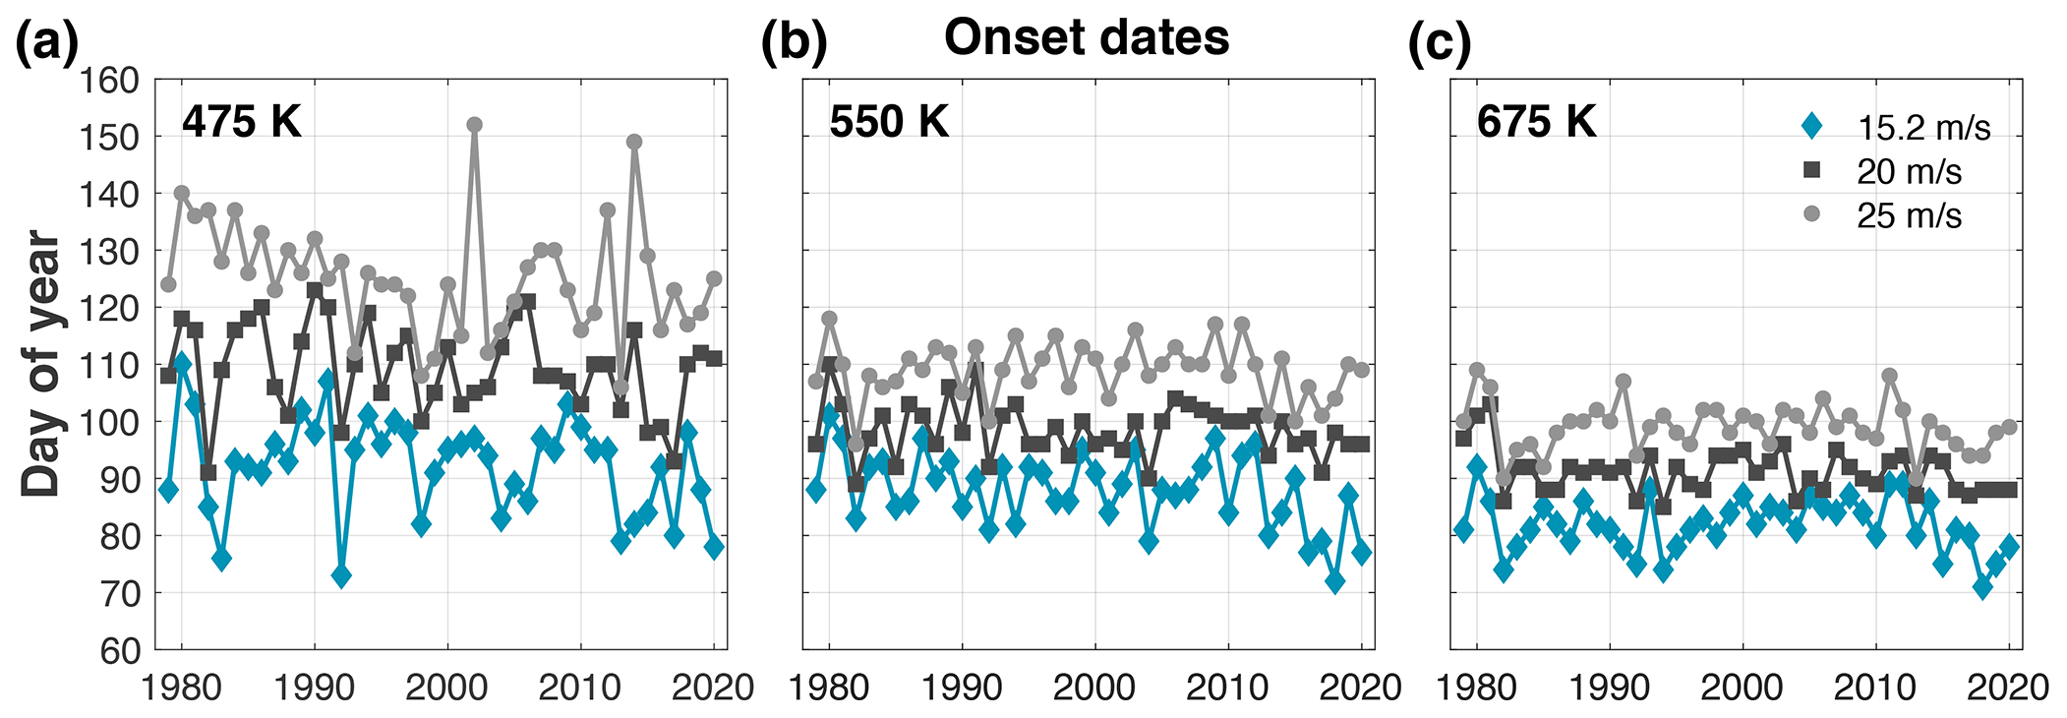
Figure 9Interannual evolution of Antarctic polar vortex onset dates over the period 1979–2020. Panels from (a) to (c) show onset dates at 475, 550, and 675 K. Light gray, dark gray, and blue curves represent onset dates for the 15.2, 20, and 25 m s−1 wind threshold values, respectively (see text).
Figure 10 shows the day when the polar vortex breaks up in spring at 475, 550, and 675 K isentropic levels. As mentioned in Nash et al. (1996), when the vortex is weakening between early and late spring, the winds at the vortex edge also weaken, leading to the final vortex breakup. The vortex breakup is given when the horizontal mean wind speed along the vortex edge falls below the 15.2, 20, or 25 m s−1 threshold values.
The vortex forms earlier at the highest levels and it also breaks earlier: the average breakup dates for the different threshold values are days 340, 334, and 325 at 475, 550, and 675 K, respectively. Rao and Garfinkel (2021) found that the average Southern Hemisphere stratospheric final warming at 50 hPa occurs around 2 December with JRA-55 reanalyses, which is consistent with our results at 475 K (on 5 December). We notice some early breakup of the polar vortex: for example, in 1988 (the vortex broke up 13 d before the mean breakup date at 675 K, 20 d at 550 K, and 21 d at 475 K). In 2002, the breakup occurred 18, 9, and 8 d before the mean breakup date at 475, 550, and 675 K, respectively. Some late breakups are observed during the last two decades particularly at 15.2 m s−1. The year 1999 is clearly distinguishable at 475 and 550 K with 21 and 27 d, respectively, after the mean breakup date. The years 2007, 2008, 2010 and 2015 also stand out for the three levels: around 14, 15, and 14 d after the mean breakup date at 475, 550, and 675 K, respectively. Finally, the year 2020 is noteworthy for its exceptionally late breakup date, with a breakup date occurring 20, 21, and 29 d after the mean threshold dates at 475, 550, and 675 K, respectively. The value at 675 K sets a record over the whole study period.
Figure 10 shows that the difference between the breakup dates for the various threshold values is much smaller than for the onset dates. The average difference between breakup dates for 15.2 and 25 m s−1 is equal to 11.5, 8.9, and 8.2 d at 475, 550, and 675 K, respectively, compared to ±32.9, ±21, and ±17.2 d, respectively, for the onset dates. The smaller differences can be explained by the important role of dynamical processes in the vortex breakup while the vortex formation is mainly controlled by radiative processes that are less variable from one year to the next. A larger interannual variability is observed for the breakup dates at the various levels and threshold values. Similarly, as for the onset dates, we calculated the standard deviation over the period after averaging the different curves of the different threshold means and after removing the long-term trend by a 3∘ polynomial. The standard deviation is equal to 10.6, 10.2, and 10.4 d at 475, 550, and 675 K, respectively, compared to 8.2, 4.8, and 3.7 d for onset dates.
An increasing trend of the breakup dates between 1979 and 1999 is seen at all levels, which is more pronounced at 475 K. It corresponds to 35, 30, and 15 d over 21 years at 475, 550, and 675 K, respectively, if we average the different threshold values at the various levels. Just after 1999 the vortex breaks up earlier. Then we observe again a later breakup of the vortex between the mid-2000s and 2010. Finally, we observe again that the vortex breaks up earlier, ending with the very long duration of the 2020 vortex. For all levels, a decrease in the breakup dates after 2000 is observed (apart from the extreme years like 2020).
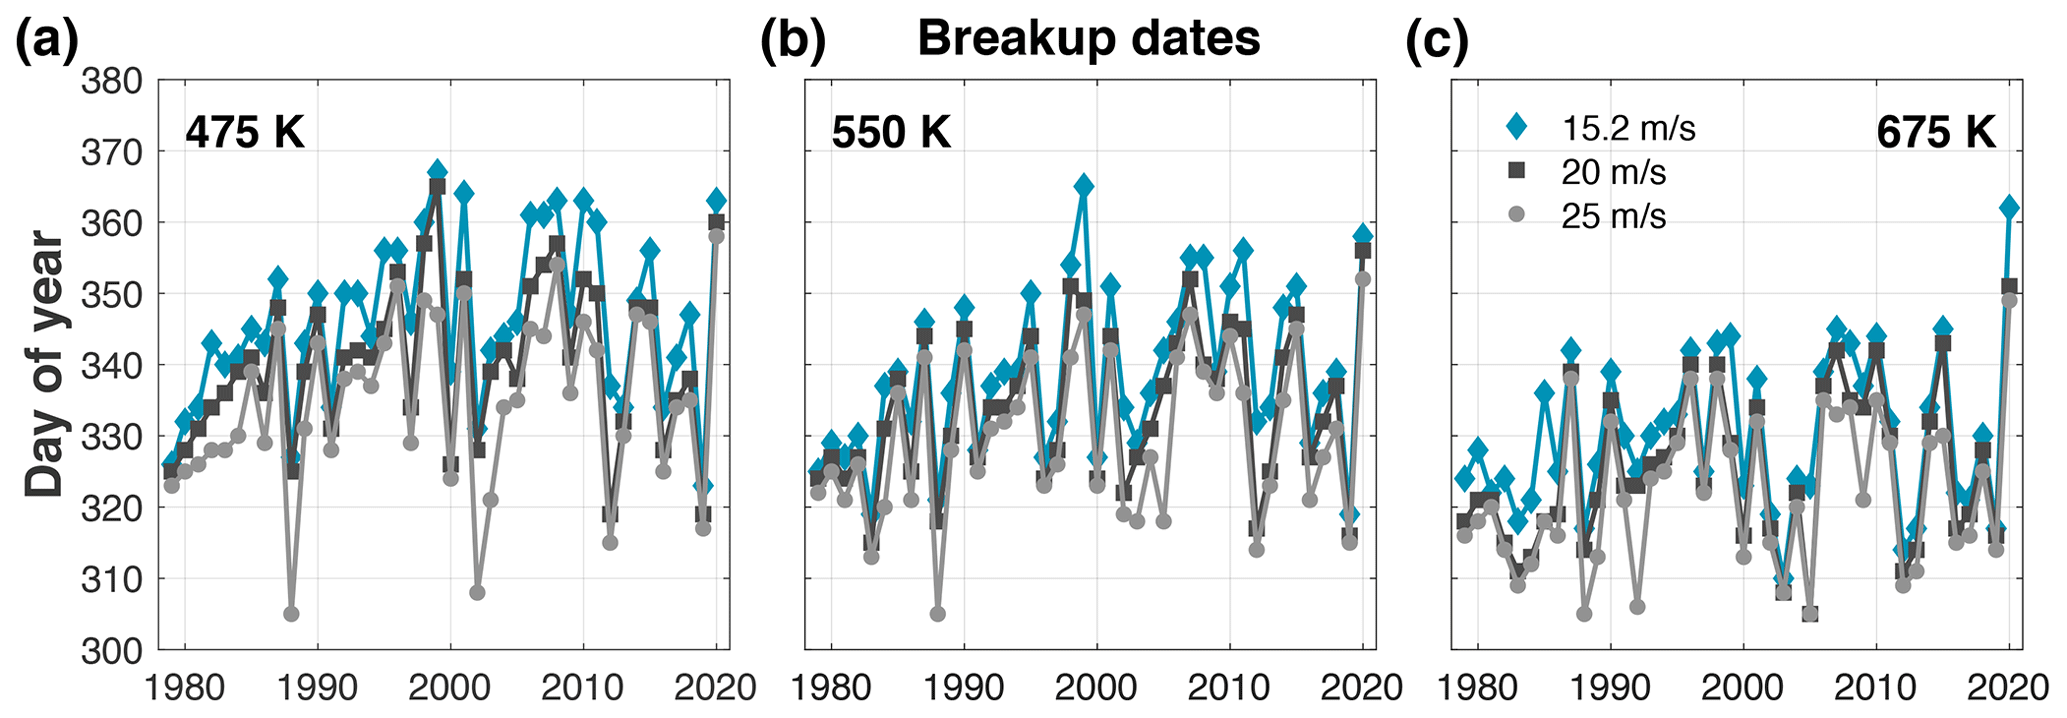
Figure 10Interannual evolution of Antarctic polar vortex breakup dates over the period 1979–2020. Panels from (a) to (c) show onset dates at 475, 550, and 675 K. Light gray, dark gray, and blue curves represent onset dates for the 15.2, 20, and 25 m s−1 wind threshold values, respectively.
We analyzed the seasonal evolution of the stratospheric polar vortex edge intensity and position in equivalent latitude in the Southern Hemisphere at three isentropic levels, using ECMWF ERA-Interim data over the period 1979–2020. The interannual evolution of the vortex edge intensity and position, as well as the onset and breakup dates at these three isentropic levels, was evaluated. The parameters studied here display long-term and short-term variations over the period that were analyzed using well-known proxies of atmospheric variability in the stratosphere such as the solar cycle, the QBO, and ENSO. Among the main results of our study, the influence of the increasing ozone hole during the 1980s and 1990s on the studied parameters was clearly noticeable, confirming the results of Bodeker et al. (2002). This influence is mostly pronounced on the maximum intensity of the vortex edge, with an increase of 0.38 PV units per ∘ EL yr−1 at 550 K and 0.30 PV units per ∘ EL yr−1 at 475 K between 1980 and 1996. The vortex breakup dates show an increasing trend of 1.75, 1.5, and 0.75 d yr−1 at 475, 550, and 675 K levels, respectively, over the 1979–1999 period. We also find a decreasing trend during the same period for the onset dates but in this case only at 475 K and for the 25 m s−1 threshold value (1.5 d yr−1 between 1980 and 1999). We see a decreasing trend in the breakup dates after 2010 but this decrease was halted by the very long vortex duration in 2020, which set a record at the 675 K level, and also by the late breakup in 2021.
The solar cycle and to a lower extent the QBO and ENSO modulate the interannual evolution of the maximum intensity of the vortex edge and the breakup dates. Stronger vortex edge intensity is observed in years of solar minimum. QBO and ENSO further modulate the influence of the solar cycle on the vortex edge, especially at 475 and 550 K. During wQBO phases, the difference between vortex edge intensity for minSC and maxSC years is smaller than during eQBO phases. The polar vortex edge is stronger and lasts longer for maxSC/wQBO than for maxSC/eQBO. Regarding ENSO, which has a lower impact than the QBO, the vortex edge intensity is somewhat stronger during cENSO phases for both minSC and maxSC. During this phase, the difference between minSC and maxSC medians is larger.
These results are mainly in agreement with the literature. Baldwin and Dunkerton (1998) found that the strongest influence of the QBO on the southern polar vortex occurs in late spring (November) when the final warming happens. From temperature composites at 10 hPa, they found that the vortex is slightly colder during the western phase of the QBO throughout the winter. Later, Haigh and Roscoe (2009) found that the southern stratospheric polar vortex breaks down later for combined maxSC/wQBO and minSC/eQBO years. The last 2 years of the study (2019 and 2020) stand out in our analysis. In 2019, the vortex maximum area was particularly small, especially at 475 and 675 K and the vortex broke up quite early. The breakup date at 475 and 550 K for the 15.2 m s−1 threshold is the lowest on record (day 323 at 475 K and 319 at 550 K). In 2020, the vortex area was not particularly large and the vortex edge not particularly strong but its duration set a record at 675 K. This very long-lasting vortex was also characterized by a strong ozone destruction (Stone et al., 2021). It will be interesting to see how the southern polar vortex evolves in the coming years.
A major perspective of our study is to extend the period analysis, using ERA5 reanalyses which cover a longer period (from 1950) and with a higher resolution (https://www.ecmwf.int, last access: 15 January 2022) (31 km grid for ERA5 versus 79 km for ERA-Interim). The same parameters for the more widely studied Arctic polar vortex are currently being studied for comparison between the two hemispheres. Other factors, which particularly influence the Northern Hemisphere, such as the Arctic Oscillation/Northern Annular Mode, will be included in the future study.
The data that support the findings of this study are openly available in [1] ECMWF ERA-Interim https://www.ecmwf.int/en/forecasts/datasets/reanalysis-datasets/era-interim (ECMWF, 2022) [2] Solar flux at 10.7 cm ftp://ftp.seismo.nrcan.gc.ca/spaceweather/solar_flux/monthly_averages/solflux_monthly_average.txt (National Research Council Canada, 2022) [3] Monthly mean zonal wind components https://www.geo.fu-berlin.de/met/ag/strat/produkte/qbo/qbo.dat (Institute of Meteorology, Freie Unversistät Berlin, 2022) [4] Multivariate ENSO Index Version 2 (MEI.v2) https://www.esrl.noaa.gov/psd/enso/mei (NOAA, 2022). The code for the determination of the vortex edge intensity and position is available upon request to Audrey Lecouffe (audrey.lecouffe@latmos.ipsl.fr).
AL, SGB and AP planned the study. AL provided the results. AL, SGB, AP and AH discussed the results.
The contact author has declared that neither they nor their co-authors have any competing interests.
Publisher’s note: Copernicus Publications remains neutral with regard to jurisdictional claims in published maps and institutional affiliations.
The authors wish to thank Cathy Boone of Institut Pierre Simone Laplace (IPSL) for providing ERA-Interim data, and ECMWF for the availability of these data.
This research has been supported by a doctoral fellowship of the French ministry and by a contract with the CNRS/INSU. The LEFE BASICC project funded the publication of this article.
This paper was edited by Peter Haynes and reviewed by two anonymous referees.
Akiyoshi, H., Zhou, L., Yamashita, Y., Sakamoto, K., Yoshiki, M., Nagashima, T., Takahashi, M., Kurokawa, J., Takigawa, M., and Imamura, T.: A CCM simulation of the breakup of the Antarctic polar vortex in the years 1980–2004 under the CCMVal scenarios, J. Geophys. Res.-Atmos., 114, D03103, https://doi.org/10.1029/2007JD009261, 2009. a, b, c
Andrews, D. G., Holton, J. R., and Leovy, C. B.: Middle atmosphere dynamics, 40, Academic Press, 489 pp., ISBN 0080511678, 9780080511672, 1987. a
Atkinson, R. J., Matthews, W. A., Newman, P. A., and Plumb, R. A.: Evidence of the mid-latitude impact of Antarctic ozone depletion, Nature, 340, 290–294, https://doi.org/10.1038/340290a0, 1989. a
Baldwin, M. P. and Dunkerton, T. J.: Quasi-biennial modulation of the southern hemisphere stratospheric polar vortex, Geophys. Res. Lett., 25, 3343–3346, https://doi.org/10.1029/98GL02445, 1998. a, b
Bodeker, G., Struthers, H., and Connor, B.: Dynamical containment of Antarctic ozone depletion, Geophys. Res. Lett., 29, 1098, https://doi.org/10.1029/2001GL014206, 2002. a, b
Butchart, N. and Remsberg, E. E.: The area of the stratospheric polar vortex as a diagnostic for tracer transport on an isentropic surface, J. Atmos. Sci., 43, 1319–1339, https://doi.org/10.1175/1520-0469(1986)043<1319:TAOTSP>2.0.CO;2, 1986. a
Butler, A. H., Charlton-Perez, A., Domeisen, D. I., Simpson, I. R., and Sjoberg, J.: Predictability of Northern Hemisphere final stratospheric warmings and their surface impacts, Geophys. Res. Lett., 46, 10578–10588, https://doi.org/10.1029/2019GL083346, 2019. a
Camp, C. D. and Tung, K.-K.: The influence of the solar cycle and QBO on the late-winter stratospheric polar vortex, J. Atmos. Sci., 64, 1267–1283, https://doi.org/10.1175/JAS3883.1, 2007. a
Dee, D. P., Uppala, S. M., Simmons, A. J., Berrisford, P., Poli, P., Kobayashi, S., Andrae, U., Balmaseda, M. A., Balsamo, G., Bauer, P., Bechtold, P., Beljaars, A. C. M., van de Berg, L., Bidlot, J., Bormann, N., Delsol, C., Dragani, R., Fuentes, M., Geer, A. J., Haimberger, L., Healy, S. B., Hersbach, H., Hólm, E. V., Isaksen, L., Kållberg, P., Köhler, M., Matricardi, M., McNally, A. P., Monge-Sanz, B. M., Morcrette, J.-J., Park, B.-K., Peubey, C., de Rosnay, P., Tavolato, C., Thépaut, J.-N., and Vitart, F.: The ERA-Interim reanalysis: Configuration and performance of the data assimilation system, Q. J. Roy. Meteor. Soc., 137, 553–597, https://doi.org/10.1002/qj.828, 2011. a
Domeisen, D. I., Garfinkel, C. I., and Butler, A. H.: The teleconnection of El Niño Southern Oscillation to the stratosphere, Rev. Geophys., 57, 5–47, https://doi.org/10.1029/2018RG000596, 2019. a, b
ECMWF: ERA-Interim, ECMWF [data set], https://www.ecmwf.int/en/forecasts/datasets/reanalysis-datasets/era-interim, last access: 15 January 2022.
Farman, J. C., Gardiner, B. G., and Shanklin, J. D.: Large losses of total ozone in Antarctica reveal seasonal ClONOx interaction, Nature, 315, 207–210, https://doi.org/10.1038/315207a0, 1985. a
Godin, S., Bergeret, V., Bekki, S., David, C., and Mégie, G.: Study of the interannual ozone loss and the permeability of the Antarctic polar vortex from aerosol and ozone lidar measurements in Dumont d'Urville (66.4∘ S, 140∘ E), J. Geophys. Res.-Atmos., 106, 1311–1330, https://doi.org/10.1029/2000JD900459, 2001. a
Goutail, F., Pommereau, J.-P., Lefèvre, F., van Roozendael, M., Andersen, S. B., Kåstad Høiskar, B.-A., Dorokhov, V., Kyrö, E., Chipperfield, M. P., and Feng, W.: Early unusual ozone loss during the Arctic winter 2002/2003 compared to other winters, Atmos. Chem. Phys., 5, 665–677, https://doi.org/10.5194/acp-5-665-2005, 2005. a
Gray, L. J.: The influence of the equatorial upper stratosphere on stratospheric sudden warmings, Geophys. Res. Lett., 30, 1166, https://doi.org/10.1029/2002GL016430, 2003. a
Grooß, J.-U. and Müller, R.: Simulation of record Arctic stratospheric ozone depletion in 2020, J. Geophys. Res.-Atmos., 126, e2020JD033339, https://doi.org/10.1029/2020JD033339, 2020. a
Haigh, J. D. and Roscoe, H. K.: The final warming date of the Antarctic polar vortex and influences on its interannual variability, J. Climate, 22, 5809–5819, https://doi.org/10.1175/2009JCLI2865.1, 2009. a
Hauchecorne, A., Godin, S., Marchand, M., Heese, B., and Souprayen, C.: Quantification of the transport of chemical constituents from the polar vortex to midlatitudes in the lower stratosphere using the high-resolution advection model MIMOSA and effective diffusivity, J. Geophys. Res.-Atmos., 107, 8289, https://doi.org/10.1029/2001JD000491, 2002. a, b, c
Heese, B., Godin, S., and Hauchecorne, A.: Forecast and simulation of stratospheric ozone filaments: A validation of a high-resolution potential vorticity advection model by airborne ozone lidar measurements in winter 1998/1999, J. Geophys. Res.-Atmos., 106, 20011–20024, https://doi.org/10.1029/2000JD900818, 2001. a
Holton, J. R. and Tan, H.-C.: The influence of the equatorial quasi-biennial oscillation on the global circulation at 50 mb, J. Atmos. Sci., 37, 2200–2208, https://doi.org/10.1175/1520-0469(1980)037<2200:TIOTEQ>2.0.CO;2, 1980. a
Hoppel, K., Bevilacqua, R., Allen, D., Nedoluha, G., and Randall, C.: POAM III observations of the anomalous 2002 Antarctic ozone hole, Geophys. Res. Lett., 30, 1394, https://doi.org/10.1029/2003GL016899, 2003. a, b
Hu, J., Ren, R., and Xu, H.: Occurrence of winter stratospheric sudden warming events and the seasonal timing of spring stratospheric final warming, J. Atmos. Sci., 71, 2319–2334, https://doi.org/10.1175/JAS-D-13-0349.1, 2014. a
Hurwitz, M., Newman, P., Oman, L., and Molod, A.: Response of the Antarctic stratosphere to two types of El Niño events, J. Atmos. Sci., 68, 812–822, https://doi.org/10.1175/2011JAS3606.1, 2011. a
Institute of Meteorology, Freie Unversistät Berlin: Monthly mean zonal wind components [data set], https://www.geo.fu-berlin.de/met/ag/strat/produkte/qbo/qbo.dat, last access: 15 January 2022.
Jiang, J., Cameron, R. H., and Schuessler, M.: The cause of the weak solar cycle 24, Astrophys. J. Lett., 808, L28, https://doi.org/10.1088/2041-8205/808/1/L28, 2015. a
Labitzke, K. and Van Loon, H.: Associations between the 11-year solar cycle, the QBO and the atmosphere. Part I: the troposphere and stratosphere in the northern hemisphere in winter, J. Atmos. Terr. Phys., 50, 197–206, https://doi.org/10.1016/0021-9169(88)90068-2, 1988. a
Li, T., Calvo, N., Yue, J., Russell, J. M., Smith, A. K., Mlynczak, M. G., Chandran, A., Dou, X., and Liu, A. Z.: Southern hemisphere summer mesopause responses to El Niño–Southern Oscillation, J. Climate, 29, 6319–6328, https://doi.org/10.1175/JCLI-D-15-0816.1, 2016. a, b
Lim, E.-P., Hendon, H. H., Boschat, G., Hudson, D., Thompson, D. W., Dowdy, A. J., and Arblaster, J. M.: Australian hot and dry extremes induced by weakenings of the stratospheric polar vortex, Nat. Geosci., 12, 896–901, https://doi.org/10.1038/s41561-019-0456-x, 2019. a
Lim, E.-P., Hendon, H. H., Butler, A. H., Thompson, D. W., Lawrence, Z. D., Scaife, A. A., Shepherd, T. G., Polichtchouk, I., Nakamura, H., Kobayashi, C., Comer, R., Coy, L., Dowdy, A., Garreaud, R. D., Newman, P. A., and Wang, G.: The 2019 Southern Hemisphere stratospheric polar vortex weakening and its impacts, B. Am. Meteorol. Soc., 102, E1150–E1171, https://doi.org/10.1175/BAMS-D-20-0112.1, 2021. a, b
Manney, G., Zurek, R., Gelman, M., Miller, A., and Nagatani, R.: The anomalous Arctic lower stratospheric polar vortex of 1992–1993, Geophys. Res. Lett., 21, 2405–2408, https://doi.org/10.1029/94GL02368, 1994. a, b, c
McIntyre, M. E. and Palmer, T.: Breaking planetary waves in the stratosphere, Nature, 305, 593–600, https://doi.org/10.1038/305593a0, 1983. a
Millán, L. F., Manney, G. L., and Lawrence, Z. D.: Reanalysis intercomparison of potential vorticity and potential-vorticity-based diagnostics, Atmos. Chem. Phys., 21, 5355–5376, https://doi.org/10.5194/acp-21-5355-2021, 2021. a
Mishra, V., Tiwari, D. P., Tiwari, C. M., and Agrawal, S. P.: Comparative study of different solar parameters with sunspot numbers, Indian Journal of Radio & Space Physics, 34, 13–16, http://nopr.niscair.res.in/handle/123456789/25632 (last access: 15 January 2022), 2005. a
Müller, R., Grooß, J.-U., Lemmen, C., Heinze, D., Dameris, M., and Bodeker, G.: Simple measures of ozone depletion in the polar stratosphere, Atmos. Chem. Phys., 8, 251–264, https://doi.org/10.5194/acp-8-251-2008, 2008. a
Nakamura, N.: Two-dimensional mixing, edge formation, and permeability diagnosed in an area coordinate, J. Atmos. Sci., 53, 1524–1537, https://doi.org/10.1175/1520-0469(1996)053<1524:TDMEFA>2.0.CO;2, 1996. a
Nash, E. R., Newman, P. A., Rosenfield, J. E., and Schoeberl, M. R.: An objective determination of the polar vortex using Ertel's potential vorticity, J. Geophys. Res.-Atmos., 101, 9471–9478, https://doi.org/10.1029/96JD00066, 1996. a, b, c, d, e, f, g
National Research Council Canada (Dominion Radio Astrophysical Observatory): Monthly averages of Solar 10.7 cm flux [data set], ftp://ftp.seismo.nrcan.gc.ca/spaceweather/solar_flux/monthly_averages/solflux_monthly_average.txt, last access: 15 January 2022.
NOAA: NASA Ozone Watch, NASA [data set], https://ozonewatch.gsfc.nasa.gov (last access: 15 January 2022), 2021. a
NOAA: Multivariate ENSO Index Version 2 (MEI.v2), NOAA [data set], https://www.esrl.noaa.gov/psd/enso/mei, last access: 15 January 2022.
Pazmiño, A., Godin-Beekmann, S., Hauchecorne, A., Claud, C., Khaykin, S., Goutail, F., Wolfram, E., Salvador, J., and Quel, E.: Multiple symptoms of total ozone recovery inside the Antarctic vortex during austral spring, Atmos. Chem. Phys., 18, 7557–7572, https://doi.org/10.5194/acp-18-7557-2018, 2018. a, b, c
Pommereau, J.-P., Goutail, F., Pazmino, A., Lefèvre, F., Chipperfield, M. P., Feng, W., Van Roozendael, M., Jepsen, N., Hansen, G., Kivi, R., Bognar, K., Strong, K., Walker, K., Kuzmichev, A., Khattatov, S., and Sitnikova, V.: Recent Arctic ozone depletion: Is there an impact of climate change?, C. R. Geosci., 350, 347–353, https://doi.org/10.1016/j.crte.2018.07.009, 2018. a
Randel, W. J. and Newman, P. A.: The stratosphere in the Southern Hemisphere, in: Meteorology of the Southern Hemisphere, edited by: Karoly, D. J. and Vincent, D. G., American Meteorological Society, Boston, MA, pp. 243–282, ISBN 978-1-935704-10-2, https://doi.org/10.1007/978-1-935704-10-2_9, 1998. a
Rao, J. and Garfinkel, C. I.: Projected changes of stratospheric final warmings in the Northern and Southern Hemispheres by CMIP5/6 models, Clim. Dynam., 56, 3353–3371, https://doi.org/10.1007/s00382-021-05647-6, 2021. a, b
Rao, J. and Ren, R.: Modeling study of the destructive interference between the tropical Indian Ocean and eastern Pacific in their forcing in the southern winter extratropical stratosphere during ENSO, Clim. Dynam., 54, 2249–2266, https://doi.org/10.1007/s00382-019-05111-6, 2020. a
Rao, J., Garfinkel, C. I., Chen, H., and White, I. P.: The 2019 new year stratospheric sudden warming and its real-time predictions in multiple S2S models, J. Geophys. Res.-Atmos., 124, 11155–11174, https://doi.org/10.1029/2019JD030826, 2019. a
Rao, J., Garfinkel, C. I., White, I. P., and Schwartz, C.: The Southern Hemisphere minor sudden stratospheric warming in September 2019 and its predictions in S2S models, J. Geophys. Res.-Atmos., 125, e2020JD032723, https://doi.org/10.1029/2020JD032723, 2020. a
Solomon, S.: Stratospheric ozone depletion: A review of concepts and history, Rev. Geophys., 37, 275–316, https://doi.org/10.1029/1999RG900008, 1999. a, b, c, d
Stone, K., Solomon, S., Kinnison, D., and Mills, M. J.: On Recent Large Antarctic Ozone Holes and Ozone Recovery Metrics, Geophys. Res. Lett., 48, e2021GL095232, https://doi.org/10.1029/2021GL095232, 2021. a
Tiwari, B. R. and Kumar, M.: The Solar Flux and Sunspot Number; A Long-Trend Analysis, International Annals of Science, 5, 47–51, https://doi.org/10.21467/ias.5.1.47-51, 2018. a
Tripathi, O. P., Baldwin, M., Charlton-Perez, A., Charron, M., Eckermann, S. D., Gerber, E., Harrison, R. G., Jackson, D. R., Kim, B.-M., Kuroda, Y., Lang, A., Mahmood, S., Mizuta, R., Roff, G., Sigmond, M., and Son, S.-W.: The predictability of the extratropical stratosphere on monthly time-scales and its impact on the skill of tropospheric forecasts, Q. J. Roy. Meteor. Soc., 141, 987–1003, https://doi.org/10.1002/qj.2432, 2015. a
Waugh, D. N.: Elliptical diagnostics of stratospheric polar vortices, Q. J. Roy. Meteor. Soc., 123, 1725–1748, https://doi.org/10.1002/qj.49712354213, 1997. a
Waugh, D. W. and Randel, W. J.: Climatology of Arctic and Antarctic polar vortices using elliptical diagnostics, J. Atmos. Sci., 56, 1594–1613, https://doi.org/10.1175/1520-0469(1999)056<1594:COAAAP>2.0.CO;2, 1999. a, b
Waugh, D. W., Randel, W. J., Pawson, S., Newman, P. A., and Nash, E. R.: Persistence of the lower stratospheric polar vortices, J. Geophys. Res.-Atmos., 104, 27191–27201, https://doi.org/10.1029/1999JD900795, 1999. a
World Meteorological Organization (WMO): Scientific Assessment of Ozone Depletion: 2018, Global Ozone Research and Monitoring Project – Report No. 58, Geneva, Switzerland, Tech. rep., 588 pp., https://csl.noaa.gov/assessments/ozone/2018/downloads/ (last access: 15 January 2022), 2018. a, b, c, d, e, f
Yamazaki, Y., Matthias, V., Miyoshi, Y., Stolle, C., Siddiqui, T., Kervalishvili, G., Laštovička, J., Kozubek, M., Ward, W., Themens, D. R., David, R., Kristoffersen, S., and Alken, P.: September 2019 Antarctic sudden stratospheric warming: Quasi-6-day wave burst and ionospheric effects, Geophys. Res. Lett., 47, e2019GL086577, https://doi.org/10.1029/2019GL086577, 2020. a
Zhang, Y., Li, J., and Zhou, L.: The Relationship between Polar Vortex and Ozone Depletion in the Antarctic Stratosphere during the Period 1979–2016, Adv. Meteorol., 2017, 3078079, https://doi.org/10.1155/2017/3078079, 2017. a
Zhou, S., Gelman, M. E., Miller, A. J., and McCormack, J. P.: An inter-hemisphere comparison of the persistent stratospheric polar vortex, Geophys. Res. Lett., 27, 1123–1126, https://doi.org/10.1029/1999GL011018, 2000. a, b