the Creative Commons Attribution 4.0 License.
the Creative Commons Attribution 4.0 License.
 | 31 Mar 2022
Spaceborne tropospheric nitrogen dioxide (NO2) observations from 2005–2020 over the Yangtze River Delta (YRD), China: variabilities, implications, and drivers
Hao Yin
Justus Notholt
Mathias Palm
Nitrogen dioxide (NO2) is mainly affected by local emission and meteorology rather than long-range transport. Accurate knowledge of its long-term variabilities and drivers is significant for understanding the evolution of economic and social development, anthropogenic emission, and the effectiveness of pollution control measures on a regional scale. In this study, we quantity the long-term variabilities and the underlying drivers of NO2 from 2005–2020 over the Yangtze River Delta (YRD), one of the most densely populated and highly industrialized city clusters in China, using OMI spaceborne observations and the multiple linear regression (MLR) model. We have compared the spaceborne tropospheric results to surface in situ data, yielding correlation coefficients of 0.8 to 0.9 over all megacities within the YRD. As a result, the tropospheric NO2 column measurements can be taken as representative of near-surface conditions, and we thus only use ground-level meteorological data for MLR. The inter-annual variabilities of tropospheric NO2 vertical column density (NO2 VCDtrop) from 2005–2020 over the YRD can be divided into two stages. The first stage was from 2005–2011, which showed overall increasing trends with a wide range of (1.91 ± 1.50) to (6.70 ± 0.10) × 1014 molec. cm−2 yr−1 (p<0.01) over the YRD. The second stage was from 2011–2020, which showed overall decreasing trends of (−6.31 ± 0.71) to (−11.01 ± 0.90) × 1014 molec. cm−2 yr−1 (p<0.01) over each of the megacities. The seasonal cycles of NO2 VCDtrop over the YRD are mainly driven by meteorology (81.01 %–83.91 %), except during winter when anthropogenic emission contributions are pronounced (16.09 %–18.99 %). The inter-annual variabilities of NO2 VCDtrop are mainly driven by anthropogenic emission (69.18 %–81.34 %), except for a few years such as 2018 which are partly attributed to meteorology anomalies (39.07 %–91.51 %). The increasing trends in NO2 VCDtrop from 2005–2011 over the YRD are mainly attributed to high energy consumption associated with rapid economic growth, which causes significant increases in anthropogenic NO2 emission. The decreasing trends in NO2 VCDtrop from 2011–2020 over the YRD are mainly attributed to the stringent clean air measures which either adjust high-energy industrial structure toward low-energy industrial structure or directly reduce pollutant emissions from different industrial sectors.
- Article
(4022 KB) - Full-text XML
-
Supplement
(2778 KB) - BibTeX
- EndNote


As a major tropospheric pollutant, nitrogen dioxide (NO2) not only threatens human health and crop growth but is also involved in a series of atmospheric photochemical reactions (Yin et al., 2019; Wang et al., 2011; Geddes et al., 2012). NO2 is a crucial precursor in the formation of ozone (O3), particulate matter (PM), acid rain, and photochemical smog in the troposphere (Yin et al., 2021a; Lu et al., 2019a, b; Sun et al., 2018c). Since severe NO2 pollution increases the risk of respiratory disease and is highly associated with mortality (Meng et al., 2021; MacIntyre et al., 2014; Tao et al., 2012), many countries take the NO2 level as an important pollution indicator of air quality (Xue et al., 2020). The sources of tropospheric NO2 are mainly from anthropogenic emissions through high temperature combustion, like transportation (vehicles, ships, and airplanes) and industrial facilities (petrochemicals and power plants) (Zheng et al., 2018b; Chi et al., 2021; van Geffen et al., 2015). Additional minor sources of NO2 are attributed to natural emissions from the biogeochemical reactions in soil, volcanic eruption, and lightning (Bond et al., 2001; Zhang et al., 2003; Lu et al., 2021). The dominant sink of tropospheric NO2 is attributed to a chemical destruction, which first converts NO2 into nitric acid (HNO3) and peroxyacetyl nitrate (PAN), which then are removed by dry or wet deposition (Browne et al., 2013). Due to a short lifetime of a few hours, tropospheric NO2 is heavily affected by local emission and meteorology rather than long-range transport (Kim et al., 2015; Cheng et al., 2012; Ji et al., 2019, 2021).
Many scientists have used a suite of active and passive observation technologies on board ground-based, vehicle-based, ship-based, airborne, or spaceborne platforms to assess the temporal–spatial variabilities of NO2 and identify their driving forces in different regions around the globe (Richter et al., 2005; Jiang et al., 2018; Liu et al., 2018; Zhang et al., 2021; Schreier et al., 2015; Shaiganfar et al., 2017). Among all observation technologies and platforms, spaceborne remote sensing observations have their unique features. By validation using ground-based remote sensing or balloon observations, spaceborne observations can provide a global NO2 dataset with reasonable accuracy. Typical spaceborne instruments include SCIAMACHY, GOME, OMI, and TROPOMI, which have been widely used in scientific investigations of the global nitrogen cycle, O3 formation regime, and regional pollution and transport, the quantification of NO2 emissions from biomass burning regions, megacities, and industrial facilities, and the validation of shipborne observations and atmospheric chemical transport models (CTMs) (Richter et al., 2005; Bechle et al., 2013; Boersma et al., 2011; Ghude et al., 2009; Lamsal et al., 2008). Using spaceborne observations to derive long-term trends of NO2 and their drivers not only provides valuable information for evaluation of regional emissions, but also improves our understanding of atmospheric evolution. Richter et al. (2005) first investigated the inter-annual variabilities of tropospheric NO2 vertical column density (NO2 VCDtrop) from space with GOME and SCIAMACHY observations during 1996–2004. Richter et al. (2005) found substantial reductions in NO2 VCDs over some areas of Europe and the United States but a highly significant increase of about 50 % – with an accelerating trend in annual growth rate – over the industrial areas of China. In a subsequent study, Ghude et al. (2009) found the same phenomena as Richter et al. (2005) with GOME and SCIAMACHY observations from 1996–2006, which disclosed that NO2 VCDtrop showed increasing trends over the rapidly developing regions (China: 11 ± 2.6 % yr−1, South Asia: 1.76 ± 1.1 % yr−1, Central East Africa: 2.3 ± 1 % yr−1) and decreasing or leveling off trends over the developed regions (United States: −2 ± 1.5 % yr−1, Europe: 0.9 ± 2.1 % yr−1). With multiple satellite platforms including GOME, SCIAMACHY, OMI, and GOME-2, Hilboll et al. (2013) also found 5 %–10 % yr−1 of increasing trends for NO2 VCDtrop over eastern Asia during 1996–2011. With OMI observations, Lamsal et al. (2015) quantified the NO2 trend from 2005 to 2013 over the United States, and Krotkov et al. (2016) investigated the NO2 trends over different countries for the period of 2005–2014.
Along with the great advances in social and economic development in recent decades, air quality in China has changed dramatically (Sun et al., 2018a, b, 2017, 2020, 2021c, 2022; Yin et al., 2020, 2021c, d; Liu et al., 2022). China has implemented a series of clean air measures in different stages to tackle air pollution across China. One of the landmark clean air measures could be the Action Plan on the Prevention and Control of Air Pollution implemented in 2013, which launched many stringent measures to improve air quality across China. These measures include the reduction of air pollutant emissions, the adjustment of industrial structure and energy mix, the establishment of early-warning systems and monitoring for air pollution, and other compulsive policies (China State Council, 2013). Both spaceborne and ground-based observations have witnessed the effectiveness of these successful policies. The OMI NO2 VCDtrop decreased by 21 % from 2011–2015 over 48 cities of China (Liu et al., 2017). The national averaged surface NO2 recorded by the China National Environmental Monitoring Center (CNEMC) network significantly decreased from (16.68 ± 4.82) ppbv in 2013 to (11.29 ± 3.25) ppbv in 2020 (Lin et al., 2021).
In this study, we use NO2 VCDtrop from 2005–2020 provided by OMI to comprehensively evaluate the long-term trends, implications, and underlying drivers of NO2 over the Yangtze River Delta (YRD; including Anhui, Jiangsu, Shanghai, and Zhejiang provinces; Table S1). In addition to anthropogenic emission, meteorology also drives NO2 variability by affecting emissions, transport, chemical production, and scavenging. The relationships of NO2 against meteorological variables are complex and are region- and time-dependent. In the present work, we separate the contributions of meteorology and anthropogenic emission to the NO2 variability using the multiple linear regression (MLR) model over the major cities (Hefei, Nanjing, Suzhou, Shanghai, Hangzhou, Ningbo) within the YRD. As one of the three most densely populated and highly industrialized city clusters in China, the YRD has long been identified as a key region for air pollution mitigation. This study can not only improve our understanding of temporal–spatial NO2 evolution in the atmosphere, but it also provides valuable information for future clean air policy. We introduce detailed descriptions of OMI and ground-level NO2 products in Sect. 2.1, and meteorological fields in Sect. 2.2. The method for separating contributions of meteorology and anthropogenic emission is presented in Sect. 2.3. Section 3.1 and 3.2 analyze the temporal–spatial variabilities of tropospheric NO2 from 2005–2020 over the YRD on provincial and megacity levels, respectively. A comparison between the OMI NO2 product and the ground-level measurements is performed in Sect. 3.3. We discuss the implications and underlying drivers of the variabilities of tropospheric NO2 from 2005–2020 over the YRD in Sect. 4. We conclude this study in Sect. 5.
2.1 Observation data
2.1.1 OMI NO2 product
OMI is a hyperspectral atmospheric composition detection instrument on board the National Aeronautics and Space Administration (NASA) Aura Earth Observing System (EOS) satellite, launched in July 2004 (Boersma et al., 2007). The EOS satellite flies over a low-Earth orbit at an altitude of about 710 km. The local overpass time (LT) of OMI satellite is about 13:30 in the early afternoon. The retrieval micro-window for NO2 VCDs lies between 405 and 465 nm, with a spectral resolution of about 0.5nm (Marchenko et al., 2015). The spatial resolution of OMI measurements is 13 × 24 km2 at nadir. OMI provides observations of O3, NO2, SO2, aerosol, cloud, HCHO, BrO, and OClO, with nearly daily global coverage (Levelt et al., 2006). The daily LV3 NO2 VCDtrop data product (GES DISC; http://disc.sci.gsfc.nasa.gov, last access: 1 September 2021), which is a gridded dataset with a 0.25∘ × 0.25∘ spatial resolution, is used in this study. The NO2 VCDtrop values are calculated by the stratosphere–troposphere separation (STS) scheme proposed by numerous previous studies (Bucsela et al., 2013; Lamsal et al., 2014; Goldberg et al., 2017). The STS scheme first subtracts the stratospheric NO2 slant column densities (SCDs) from the total NO2 SCDs, and then it divides the resulting tropospheric NO2 SCDs by the tropospheric air mass factor (AMF). The formulation for calculating NO2 VCDtrop is as follows:
where AMF is defined as the ratio of the SCD to the VCD (Solomon et al., 1987),
The tropospheric AMF is calculated by NO2 profiles simulated by the Global Modeling Initiative (GMI) chemistry transport model with a horizontal resolution of 1∘ × 1.25∘ (Rotman et al., 2001). Separation of stratospheric and tropospheric columns is achieved by the local analysis of the stratospheric field over unpolluted areas (Bucsela et al., 2013). The OMI NO2 VCDtrop dataset has been used in many studies to investigate the O3 formation regime and regional pollution and transport (Lin et al., 2010; Zhang et al., 2017; Duncan et al., 2013; Liu et al., 2016). In this study, only the LV3 data product collected with cloud radiance fractions of less than 30 % is used (Streets et al., 2013).
2.1.2 Ground-level NO2 data
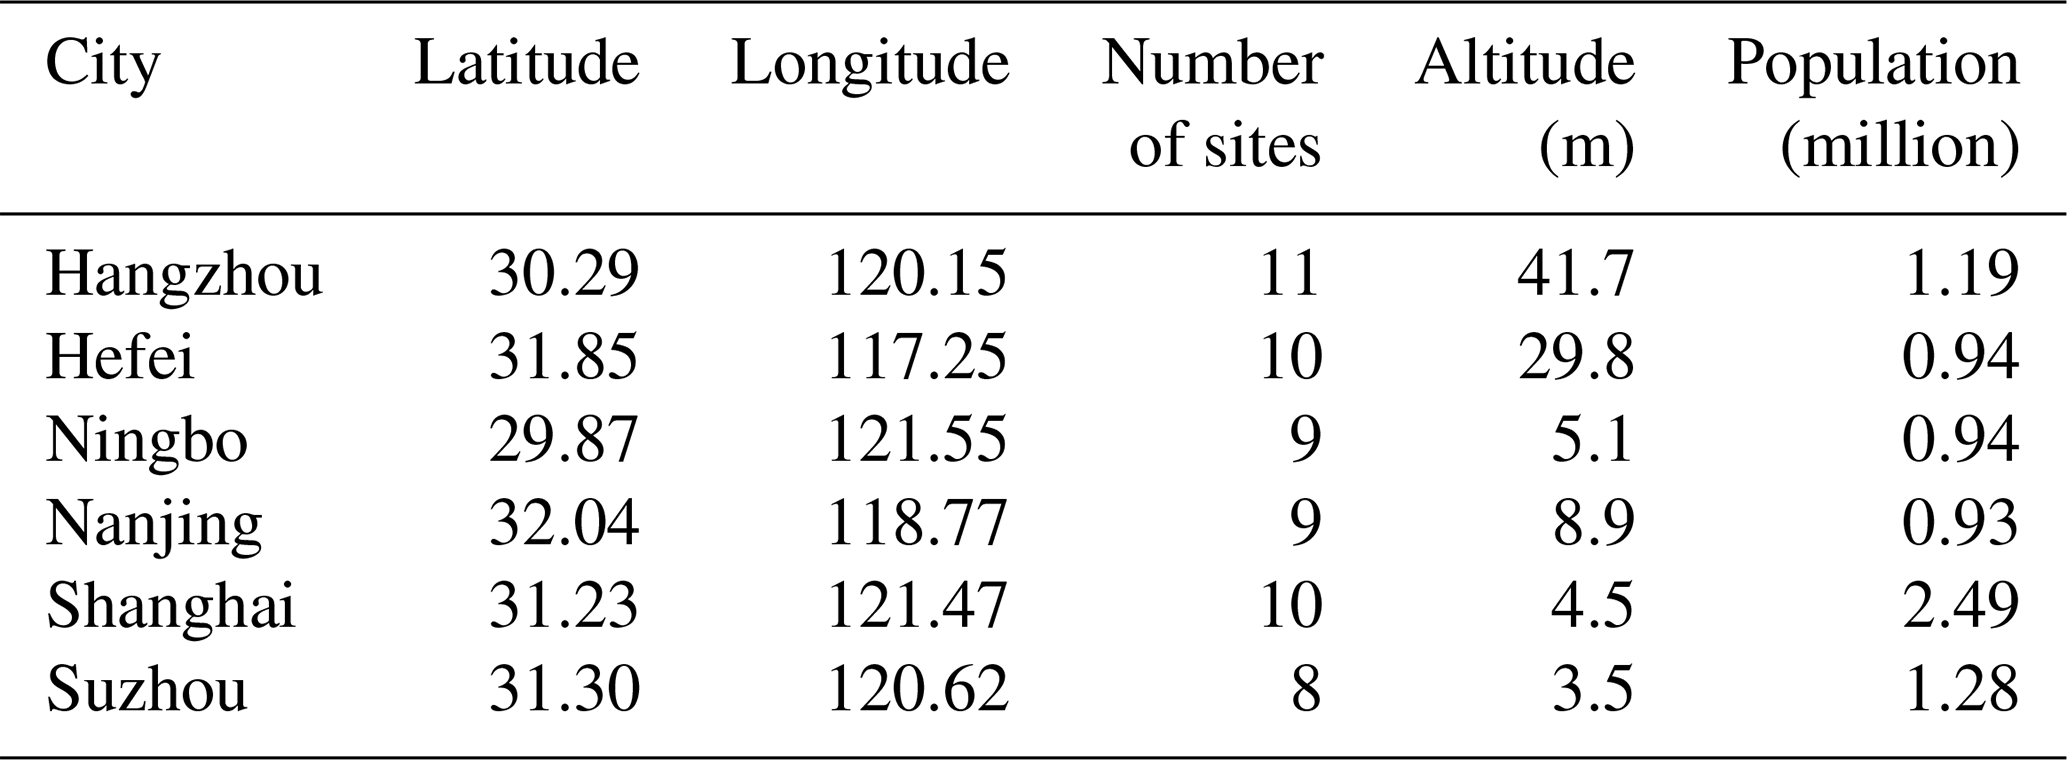
We extract ground-level NO2 data over the YRD from the China National Environmental Monitoring Center (CNEMC) network (http://www.cnemc.cn/en/, last access: 26 November 2021). The CNEMC network has operated more than 3000 monitoring sites that covered almost all major cities over China by 2020. The CNEMC datasets have been used in many studies for the evaluation of regional atmospheric pollution and transport (Li et al., 2019, 2021; Lu et al., 2019a, 2020; Sun et al., 2021a; Yin et al., 2021a; Zhao et al., 2016; He et al., 2017). As one of the six key atmospheric pollutants (CO, SO2, NO2, PM10, O3, and PM2.5) routinely measured by the CNEMC network, ground-level NO2 measurements at 188 sites in 40 cities over the YRD have been available since 2014. In this study, comparisons between the OMI NO2 data product and the ground-level NO2 measurements are only performed over six key megacities, i.e., Shanghai, Nanjing, Hangzhou, Suzhou, Ningbo, and Hefei, within the YRD. The population, geolocation, number of measurement sites, and data range of each city are summarized in Table 1. The number of measurement sites in each city ranges from 8 to 11, the altitude ranges from 3 to 50 m (above sea level, a.s.l.), and the population ranges from 0.9 to 2.5 million. All ground-level NO2 data at each station are measured by active differential absorption ultraviolet (UV) analyzers. We use a data quality control method following previous studies to remove unreliable NO2 data (Lu et al., 2019a, 2020; Sun et al., 2021a; Yin et al., 2021a). Specifically, we first convert all hourly measurements into Z scores, and we then remove the measurement if its Z score meets one of the following rules: (1) Zi is larger or smaller than the previous value Zi−1 by 9 (|Zi-); (2) the absolute value of Zi is greater than 4 (); or (3) the ratio of the Z value to the third-order center moving average is greater than 2 (), where i represents the ith hourly measurement data. After removing outliers with the above filter criteria, we finally average NO2 data at all measurement sites in each city to form a city-representative NO2 dataset.
Table 1Geolocation, the number of measurement sites, and population for the six megacities within the YRD. Population statistics are based on the seventh nationwide population census in 2020 provided by the National Bureau of Statistics of China.
2.2 Meteorological fields
We obtain meteorological fields during 2005–2020 from the second Modern-Era Retrospective analysis for Research and Applications (MERRA-2) (Gelaro et al., 2017). This dataset is produced by the NASA Global Modeling and Assimilation Office (https://gmao.gsfc.nasa.gov/reanalysis/MERRA-2/, last access: 1 August 2021) with a spatial resolution of 0.5∘ × 0.625∘ and temporal resolutions of 1 h for boundary layer height and surface meteorological variables and 3 h for other variables. Previous studies have verified that meteorological fields provided by MERRA-2 match well with the meteorological parameters observed by Chinese weather stations (Song et al., 2018; Carvalho, 2019; Wang et al., 2017; Kishore Kumar et al., 2015; Zhou et al., 2017). In order to match OMI observations which are available at about 13:30 LT, the average for meteorological data is only performed between 13:00 and 14:00 LT.
2.3 Multiple linear regression (MLR) model
We establish a multiple linear regression (MLR) model to quantify the contributions of meteorology and anthropogenic emission to the long-term variabilities of NO2 VCDtrop during 2005–2020 over the YRD. Similar MLR methodologies have been used in previous studies to estimate the contributions of meteorology and emission to the variabilities of O3 and PM2.5 in North America, Europe, and China (Li et al., 2019, 2020; Xu et al., 2011; Zhai et al., 2019; Zhao and Wang, 2017). The meteorological parameters used in our MLR model are elaborated in Table 2.

In order to highlight the variabilities of NO2 VCDtrop, we follow the method of previous studies and calculate NO2 VCDtrop anomalies (yanomaly) by subtracting a reference value (yreference) from all tropospheric NO2 observations (yindividual) (Hakkarainen et al., 2016, 2019; Mustafa et al., 2021). The formulation of this method is expressed as
In this study, we take the average of all NO2 VCDtrop values from 2005–2020 (i.e., the 16-year mean) as the reference value. The MLR model for each city is explained as
where y is the regression result for monthly OMI NO2 VCDtrop anomalies, β0 is the intercept, and xk (k∈[1, 11]) is the meteorological variables. The regression coefficients βk are calculated by nonlinear least squares fitting. This MLR model finds the optimal regression result by minimizing the sum of squares of the fitting residual and then solves regression coefficients βk by the following equation:
The regression results y represent the meteorology-induced contributions to the variabilities of NO2 VCDtrop. Since both soil and lighting NOx are meteorology-dependent, the effects of soil and lighting NOx on NO2 variability are also attributed to meteorology contribution. The difference y′ between the monthly OMI NO2 VCDtrop anomalies yanomaly and y calculated as Eq. (6) represents the portion that cannot be explicitly explained by the meteorological influence.
By subtracting the meteorological influence from the total NO2 amounts, the y′ is referred to as the aggregate contribution of anthropogenic emission. Positive y and y′ indicate that meteorology and anthropogenic emission cause NO2 VCDtrop above the reference value (i.e., the 16-year mean), respectively. In contrast, negative y and y′ indicate that meteorology and anthropogenic emission cause NO2 VCDtrop below the reference value, respectively.
Since the meteorological parameters listed in Table 2 differ in their units and magnitudes, which could lead to unstable performance of the model, we normalized all meteorological parameters via Eq. (7) before using them in regression. This normalization preprocessing procedure can also speed up the convergence of the MLR model.
where uk and σk are the average and 1σ standard deviation (SD) of xk, and zk is the normalized value for parameter xk.
3.1 Variabilities at provincial level
We present the temporal–spatial distribution of the annual averaged NO2 VCDtrop over the YRD from 2005–2020 in Fig. 1. The major pollution areas for NO2 VCDtrop over the YRD are located in the south of Jiangsu Province and the north of Zhejiang Province. In addition, NO2 pollution in the eastern Anhui Province showed an increasing trend during 2005–2013 and became one of the major pollution areas within the YRD during 2010–2013. The amplitudes of NO2 VCDtrop over the YRD showed large year-to-year variabilities from 2005–2020, but spatial extensions of the major pollution areas are almost constant over years. Among all the pollution areas, the heaviest pollution regions are uniformly located in the densely populated and highly industrialized megacities, such as Shanghai, Nanjing, Suzhou, Hangzhou, Ningbo, and Hefei.
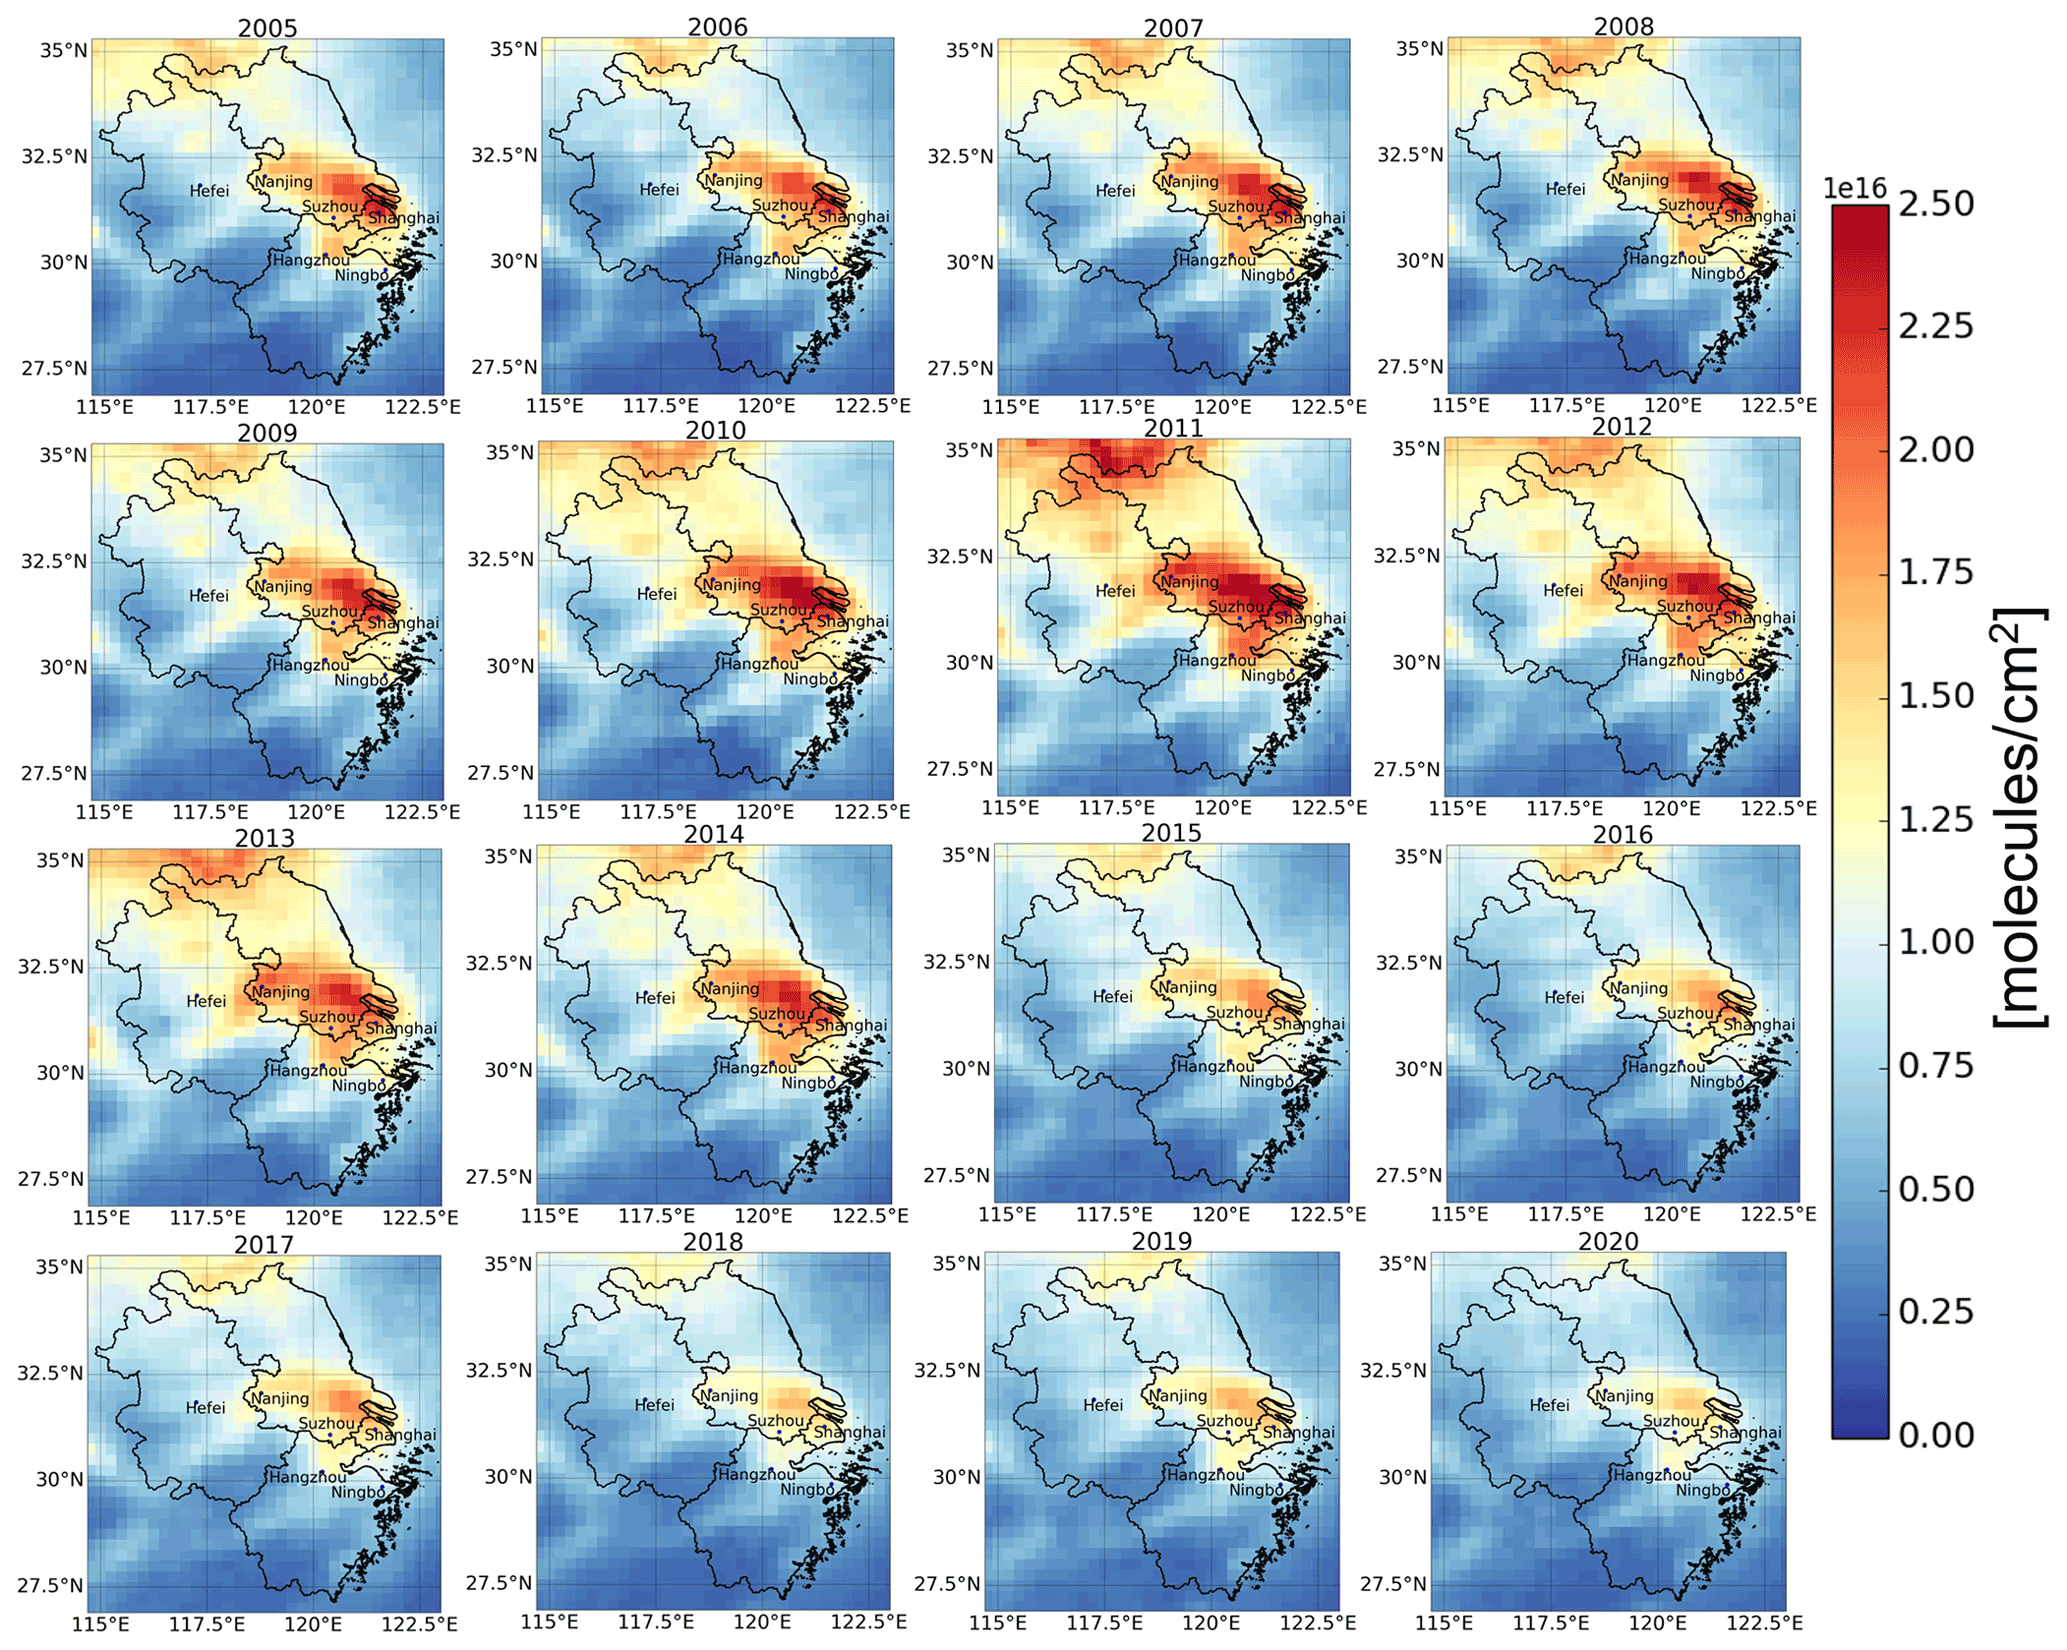
Figure 1Temporal–spatial variabilities of NO2 VCDtrop provided by the OMI satellite over the YRD from 2005–2020. The three provinces (Anhui, Jiangsu, and Zhejiang) and six key megacities (Hefei, Nanjing, Suzhou, Shanghai, Hangzhou, and Ningbo) are marked.
The annual means and seasonal cycles of NO2 VCDtrop over the YRD during 2005–2020 at Province or municipality level, i.e., Anhui Province, Jiangsu Province, Zhejiang Province, and Shanghai municipality, are presented in Fig. 2. The NO2 VCDtrop over each province is calculated by averaging all observations within the boundary of each province. For seasonal variability, clear seasonal features over the whole YRD region and each province are observed (Fig. 2a): (1) high levels of NO2 VCDtrop occur in late winter to spring, and low levels of NO2 VCDtrop occur in later summer to autumn; (2) the 1σ SDs in late winter to spring are larger than those in later summer to autumn; and (3) seasonal cycles of NO2 VCDtrop over Jiangsu, Zhejiang, and the whole YRD region show bimodal patterns; i.e., two seasonal peaks occur around March and December or January, and one seasonal trough occurs around September. However, over Anhui these cycles show a unimodal pattern and do not have a peak around March. The NO2 VCDtrop has a maximum monthly mean value of (1.93 ± 0.21), (2.40 ± 0.25), (1.61 ± 0.16), and (1.91 ± 0.16) × 1016 molec. cm−2 in January or December over Anhui, Jiangsu, Zhejiang, and the whole YRD region, respectively. The minimum monthly mean values over Anhui, Jiangsu, Zhejiang, and the whole YRD region occur in July, with values of (0.35 ± 0.05), (0.83 ± 0.07), (0.57 ± 0.06), and (0.39 ± 0.01) × 1016 molec. cm−2, respectively.

Figure 2(a) Monthly averaged NO2 VCDtrop over the whole YRD region (green dots and lines), Anhui Province (black dots and lines), Zhejiang Province (blue dots and lines), and Jiangsu Province (yellow dots and lines). (b) Same as (a) but for annual average. The vertical error bar is 1σ standard deviation (SD) within that month or year.
Except for a few anomalies such as the year-to-year decrease in 2005–2006, and the increases in 2016–2017 and 2018–2019, the overall inter-annual variabilities of NO2 VCDtrop over the YRD can be divided into two stages (Fig. 2b). The first stage was from 2005–2011, which showed overall increasing trends in NO2 VCDtrop over the YRD. During 2005–2009 of this stage, change rates of NO2 VCDtrop were less pronounced, where the 2009 levels relative to 2005 only increased by (0.33 ± 0.02) × 1015 (3.96 ± 0.25) %, (1.05 ± 0.11) × 1015 (8.55 ± 0.08) %, and (0.46 ± 0.03) × 1015 molec. m−2 (5.05 ± 0.32) % over Anhui, Jiangsu, and the whole YRD region, respectively, and thy leveled off over Zhejiang. However, NO2 VCDtrop in 2011 relative to 2009 showed significantly increments of (2.88 ± 0.23) × 1015 (33.78 ± 2.70) %, (3.81 ± 0.32) × 1015 (29.01 ± 2.45) %, (2.08 ± 0.18) × 1015 (27.97 ± 2.43) %, and (2.10 ± 0.19) × 1015 molec. m−2 (21.59 ± 1.95) % over Anhui, Jiangsu, Zhejiang, and the whole YRD region, respectively. The second stage was from 2011–2020, which showed overall decreasing trends in NO2 VCDtrop over the YRD. The total decrements over Anhui, Jiangsu, Zhejiang, and the whole YRD region in 2020 relative to 2011 are (4.91 ± 0.39) × 1015 (41.48 ± 3.30) %, (4.82 ± 0.31) × 1015 (43.25 ± 2.72) %, (3.78 ± 0.36) × 1015 (40.47 ± 4.12) %, and (4.82 ± 0.35) × 1015 molecule m−2 (43.26 ± 3.07) %, respectively.
We have followed the methodology of Li et al. (2020) and used the linear regression model to estimate the inter-annual trends of NO2 VCDtrop over the YRD (Table 3). During 2005–2011, inter-annual trends of NO2 VCDtrop over the YRD region and each province spanned a wide range of (1.74 ± 0.72) × 1014 molec. cm−2 yr−1 (p=0.02) to (5.94 ± 1.01) × 1014 molec. cm−2 yr−1 (p<0.01), indicating the regional representativity of each dataset. In contrast, inter-annual trends of NO2 VCDtrop over the YRD region and each province from 2011–2020 varied over (−4.86 ± 0.49) to (−8.16 ± 0.82) × 1014 molec. cm−2 yr−1 (p<0.01). For the aggregate trends during 2005–2020, NO2 VCDtrop values over the whole YRD region and each province are negative. The largest and lowest decreasing trends are observed in Jiangsu and Anhui, with values of (−1.92 ± 0.30) × 1014 molec. cm−2 yr−1 (p<0.01) and (−0.92 ± 0.26) × 1014 molec. cm−2 yr−1 (p<0.01), respectively.
Table 3Inter-annual trends of NO2 VCDtrop over each province within the YRD and the whole YRD region during 2005–2011, 2011–2020, and 2005–2020.

3.2 Variabilities at megacity level
The annual means and seasonal cycles of NO2 VCDtrop over the major megacities within the YRD during 2005–2020 are presented in Fig. 3. Similar to the derivation of provincial level NO2, NO2 VCDtrop over each megacity is calculated by averaging all observations within the boundary of each megacity. The results show that the amplitudes and variabilities of NO2 VCDtrop at megacity level are basically coincident with those at the corresponding provincial levels. Overall, the amplitudes and 1σ SDs of NO2 seasonal cycles in cold seasons are larger than those in warm seasons, and the inter-annual NO2 variabilities at megacity level can also be divided into two stages, i.e., an overall increasing stage during 2005–2011 and a decreasing stage during 2011–2020. As a result, it is feasible to select these major megacities as representatives for mapping the drivers of NO2 variabilities over the YRD.
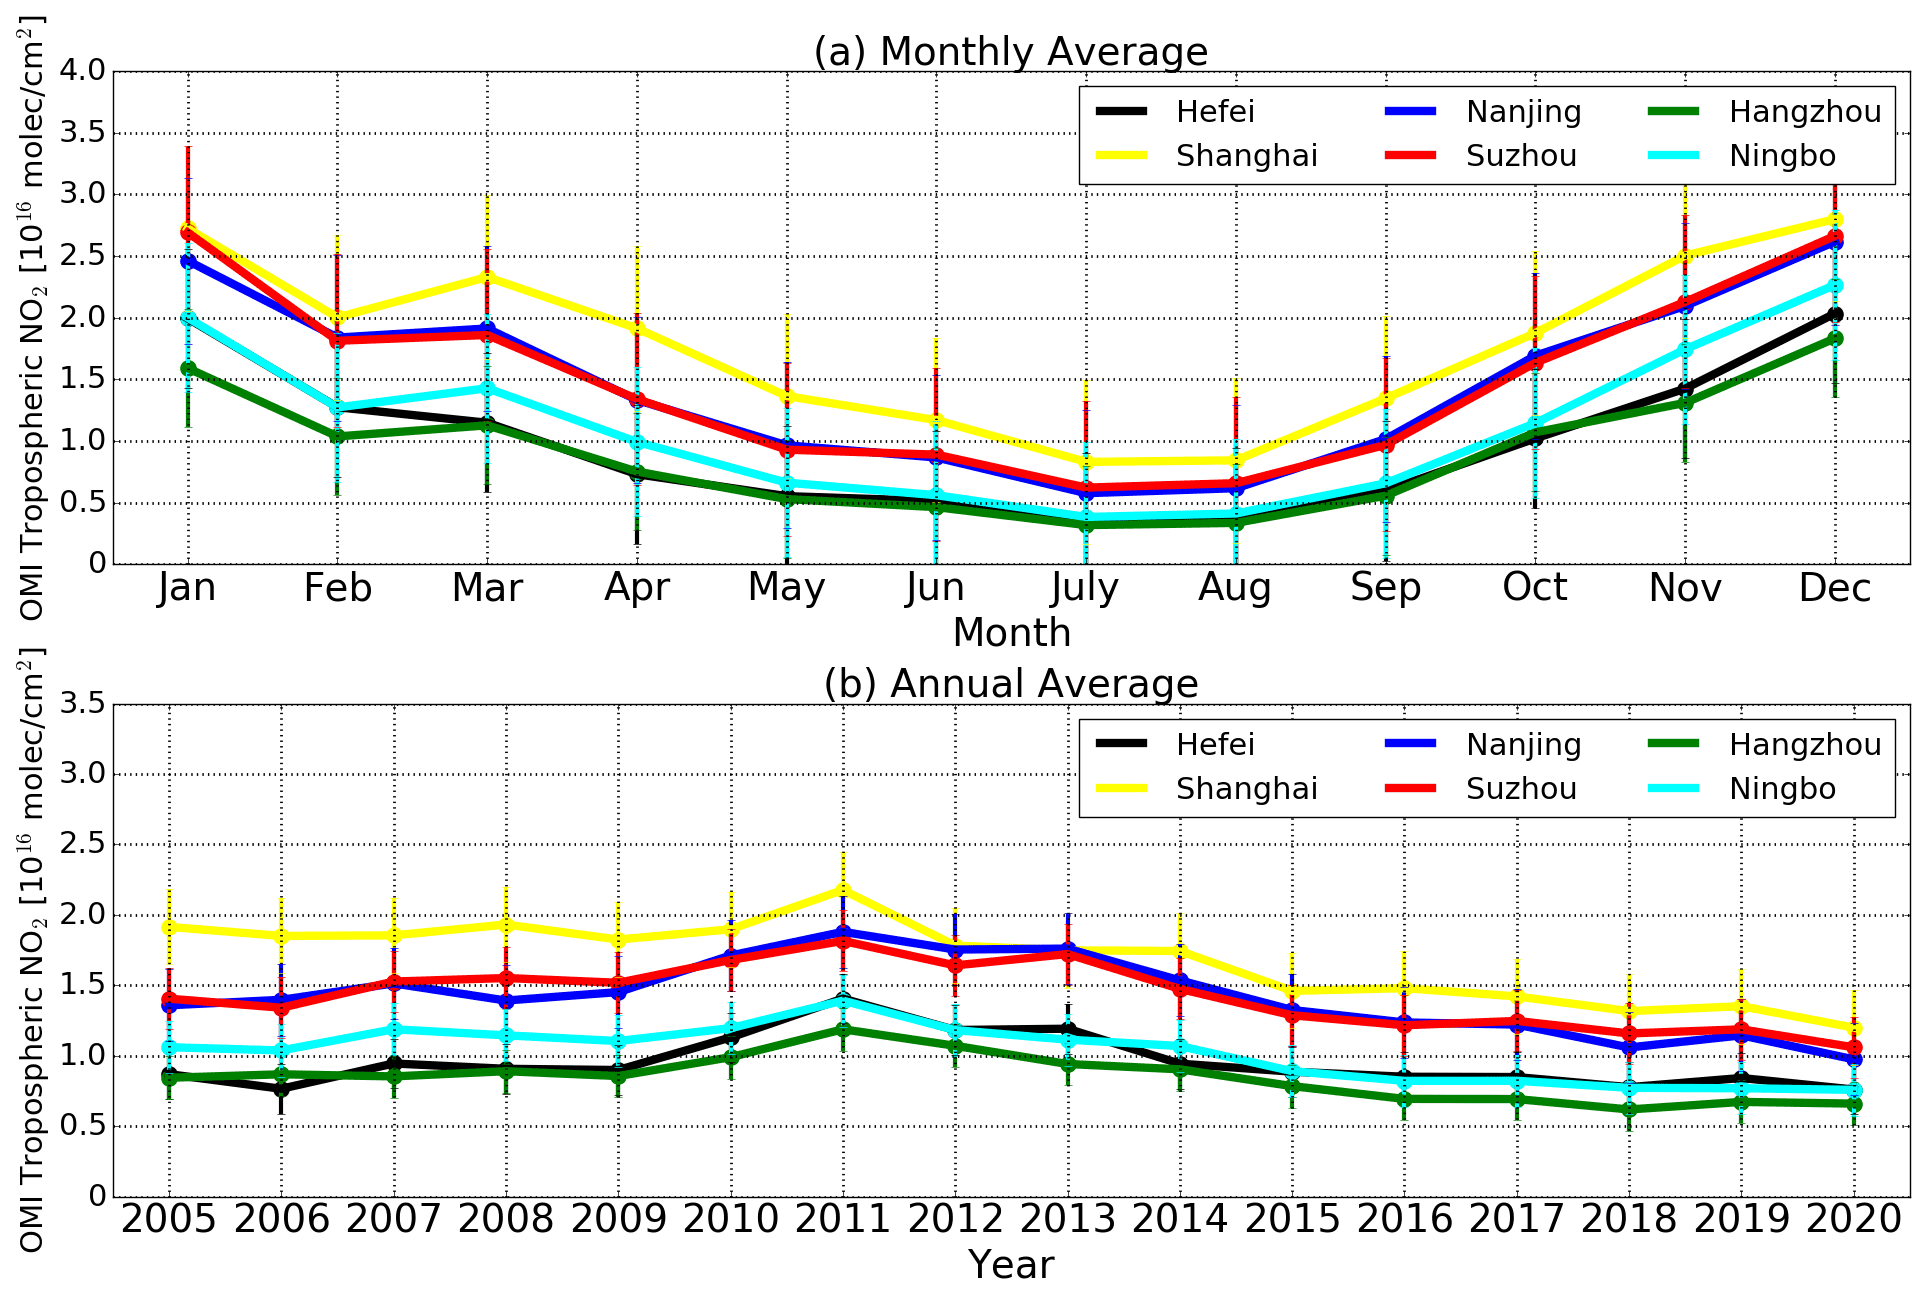
Figure 3(a) Monthly averaged NO2 VCDtrop over Hefei (black dots and lines), Nanjing (blue dots and lines), Shanghai (yellow dots and lines), Suzhou (red dots and lines), Hangzhou (green dots and lines), and Ningbo (cyan dots and lines). (b) Same as (a) but for annual average. The vertical error bar is 1σ standard variation within that month or year.
Specifically, megacity levels of NO2 VCDtrop show seasonal maxima in December and seasonal minima in July. Seasonal maxima over Hefei, Shanghai, Nanjing, Suzhou, Hangzhou, and Ningbo are (2.03 ± 0.15), (2.80 ± 0.23), (2.62 ± 0.25), (2.66 ± 0.16), (1.83 ± 0.18), and (2.27 ± 0.21) × 1016 molec. cm−2, and seasonal minima are (0.34 ± 0.04), (0.83 ± 0.11), (0.58 ± 0.06), (0.62 ± 0.05), (0.32 ± 0.02), and (0.38 ± 0.03) × 1016 molec. cm−2, respectively. The seasonal maxima are on average (82.27 ± 2.34) %, (67.19 ± 1.56) %, (71.06 ± 2.32) %, (83.33 ± 3.05) %, (77.62 ± 2.89) %, and (70.84 ± 2.76) % higher than the seasonal minima over respective megacities. As commonly observed, the seasonal variability of NO2 VCDtrop with respect to their annual means spanned a wide range of −55.1 % to 103.5 %, depending on season and measurement time (Fig. 3a).
The NO2 VCDtrop in all megacities shows maximum values in 2011, where the maximum values over Hefei, Shanghai, Suzhou, Ningbo, Nanjing, and Hangzhou are (1.41 ± 0.25), (2.18 ± 0.23), (1.81 ± 0.17), (1.39 ± 0.12), (1.88 ± 0.18), and (1.19 ± 0.14) × 1016 molec. cm−2, respectively (Fig. 3b). In terms of the increments relative to the 2005 levels, Hefei and Shanghai from 2005 to 2011 have the largest and lowest increments of (5.37 ± 0.51) × 1015 molec. cm−2 (61.77 ± 5.87) % and (2.62 ± 0.27) × 1015 molec. cm−2 (14.68 ± 1.51) %, respectively. The increments over other cities varied over (3.31 ± 0.32) × 1015 molec. cm−2 (31.20 ± 3.02) % to (5.21 ± 0.41) × 1015 molec. cm−2 (38.40 ± 3.02) %. In terms of the decrements relative to the 2011 levels, Shanghai and Hangzhou from 2011 to 2020 have the largest and lowest decrements of (9.77 ± 0.82) × 1015 molec. cm−2 (46.89 ± 3.94) and (5.28 ± 0.45) × 1015 molec. cm−2 (45.43 ± 3.87) %, respectively. The decrements over other cities are also evident and varied over (6.33 ± 0.58) × 1015 molec. cm−2 (45.53 ± 4.18) % to (9.05 ± 0.98) × 1015 molec. cm−2 (48.12 ± 5.21) %. A few anomalies are also observed in some megacities and are in good agreement with the corresponding provincial levels. For example, NO2 VCDtrop over Hefei and Suzhou had increased by (0.09 ± 0.01) × 1015 molec. cm−2 (0.77 ± 0.09) % and (0.80 ± 0.07) × 1015 molec. cm−2 (4.90 ± 0.43) % in 2013 relative to 2012 levels, respectively. In addition, NO2 VCDtrop over Hefei, Shanghai, Nanjing, Hangzhou, and Suzhou had increased by (0.65 ± 0.12) × 1015 (8.41 ± 1.55) %, (0.35 ± 0.02) × 1015 (2.66 ± 0.15) %, (0.86 ± 0.18) × 1015 (8.16 ± 1.71) %, (0.55 ± 0.08) × 1015 (8.68 ± 1.26) %, and (0.29 ± 0.05) × 1015 molec. cm−2 (2.52 ± 0.43) % in 2019 relative to 2018 levels, respectively.
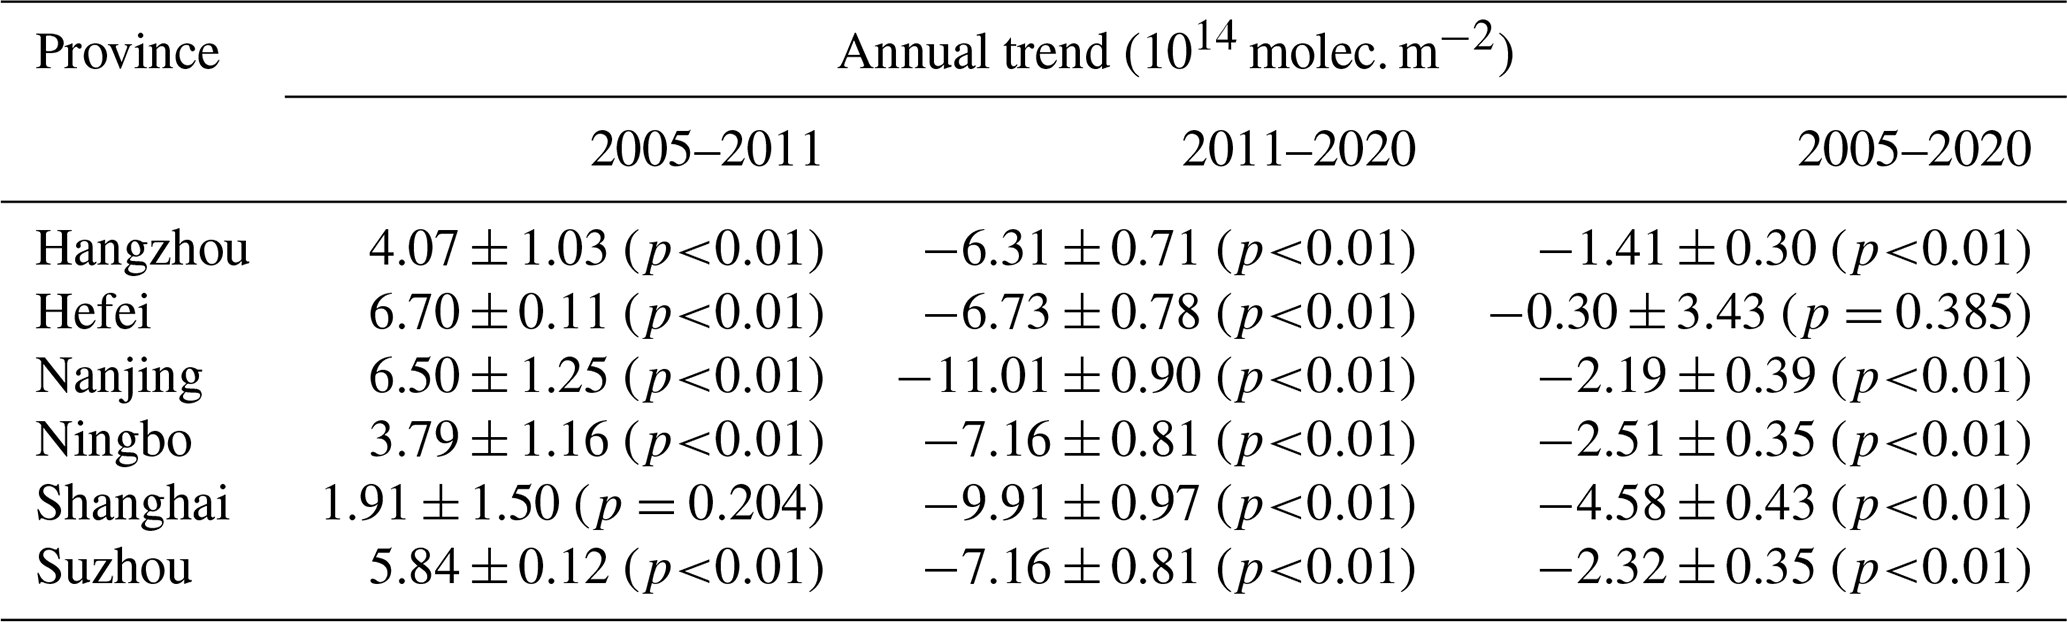
The inter-annual trends of NO2 VCDtrop during 2005–2011 over all cities are positive and span a wide range of (1.91 ± 1.50) to (6.70 ± 0.10) × 1014 molec. cm−2 yr−1 (p<0.01) (Table 4). In contrast, the inter-annual trends of NO2 VCDtrop during 2011–2020 over all cities are negative. The largest and lowest decreasing trends are observed in Nanjing and Hangzhou, with values of (−11.01 ± 0.90) and (−6.31 ± 0.71) × 1014 molec. cm−2 yr−1 (p<0.01), respectively. For the aggregate trends during 2005–2020, NO2 VCDtrop over all cities is negative. The largest and lowest decreasing trends are observed in Shanghai and Hefei, with values of (−4.58 ± 0.43) × 1014 molec. cm−2 yr−1 (p<0.01) and (−0.30 ± 3.43) × 1014 molec. cm−2 yr−1 (p=0.385), respectively.
Table 4Inter-annual trends of NO2 VCDtrop over each city within the YRD during 2005–2011, 2011–2020, and 2005–2020.
3.3 Comparisons with the CNEMC data
In order to investigate if satellite column measurements can represent the near-surface variabilities, we have compared the OMI NO2 VCDtrop data over the six megacities within the YRD with the ground-level NO2 data provided by the CNMEC (Fig. 4). The comparisons over all megacities were performed on a monthly basis between June 2014 and December 2020. Ground-level NO2 concentrations were taken as the average of all CNMEC stations in each city. The NO2 VCDtrop values were taken as the average of all OMI observed grids within the scope of each city. Considering the overpass time of OMI is at about 13:30 LT, we only average the ground-level NO2 data between 13:00 and 14:00 LT for comparison, which ensures that the temporal differences between the CNMEC and OMI dataset are all within ± 30 min. With these rules, there are over 700 matching samples in each city available for comparison.
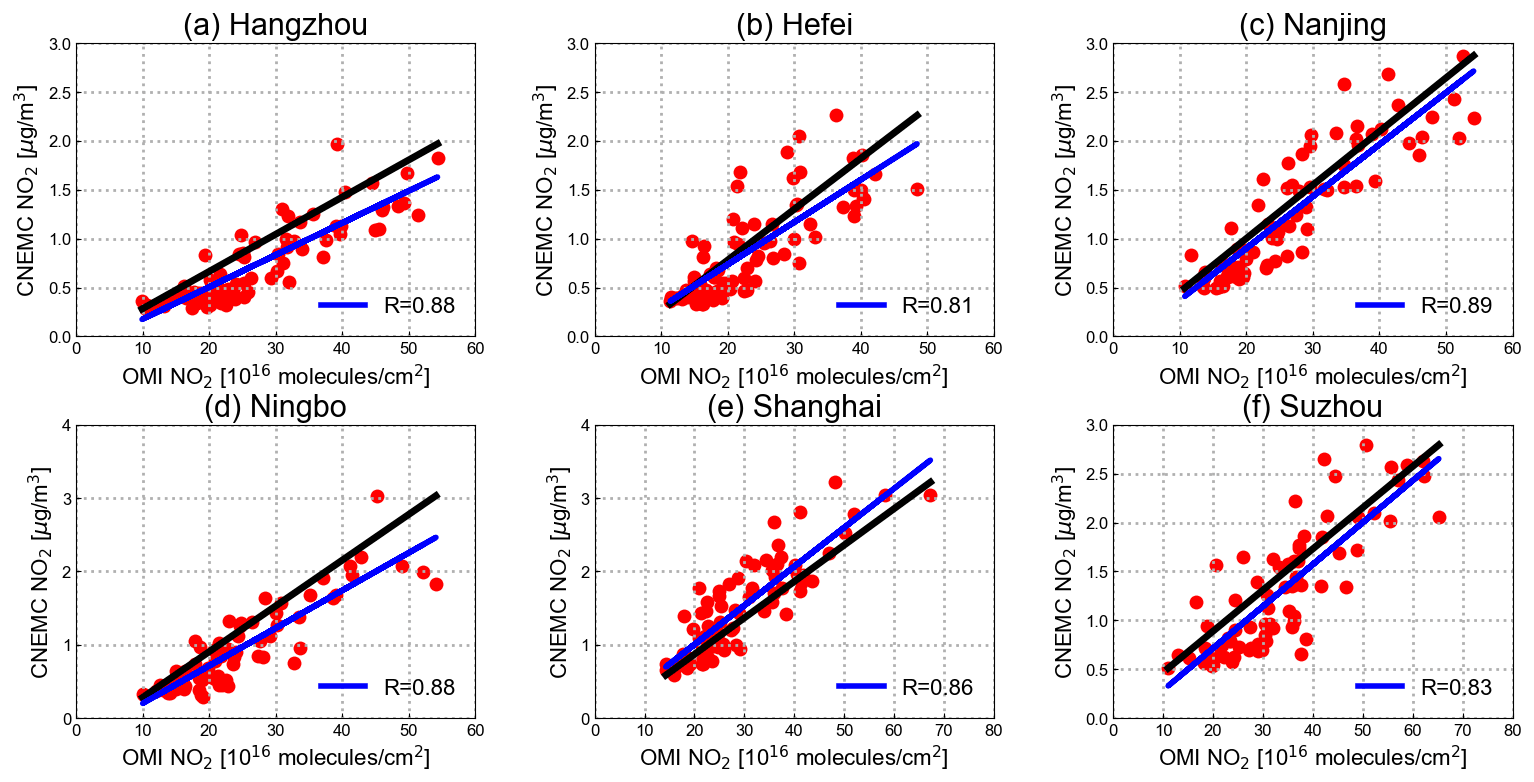
Figure 4Correlation of OMI NO2 VCDtrop against ground-level observations data over Hefei, Nanjing, Shanghai, Suzhou, Hangzhou, and Ningbo. We fitted both datasets directly without unifying their units, which does not affect the investigation with respect to the agreement of the two datasets in terms of variabilities. Blue lines are linear fitted lines, and black lines are the 1 : 1 line.
Correlation plots of OMI NO2 VCDtrop data against the CNMEC ground-level NO2 measurements are shown in Fig. 4. The results show that the NO2 variabilities observed by OMI and the CNMEC are in good agreement over all megacities, with correlation coefficients (r2) of 0.88, 0.81, 0.89, 0.88, 0.86, and 0.83 for Hangzhou, Hefei, Nanjing, Ningbo, Shanghai, and Suzhou, respectively. The discrepancies between OMI and CNMEC data can be mainly attributed to their differences in temporal–spatial resolutions. OMI averages NO2 concentration at about 13:30 LT over a large coverage due to its relatively coarse spatial resolution (Wallace and Kanaroglou, 2009; Zheng et al., 2014). The CNMEC data represent the averaged point concentrations between 13:00 and 14:00 LT around the measurement site. NO2 is a short-lifetime species and is characterized by large temporal–spatial variabilities. Any temporal–spatial inhomogeneity in NO2 concentration could affect the comparison (Meng et al., 2010; Wallace and Kanaroglou, 2009). Considering the above differences, the correlations of the two datasets over all megacities are satisfactory. The tropospheric NO2 column measurements can be used as representatives of near-surface conditions. As a result, to simplify calculations, we only use ground-level meteorological data for MLR.
Over a polluted atmosphere, the NO2 column measurements can be taken as representative of near-surface conditions because tropospheric NO2 has a vertical distribution that is heavily weighted toward the surface (Kharol et al., 2015; Zhang et al., 2017; Duncan et al., 2013, 2016; Kramer et al., 2008). Many studies have taken advantage of this favorable vertical distribution of NO2 to derive surface emissions of NO2 from space (Silvern et al., 2019; Boersma et al., 2009; Streets et al., 2013; Anand and Monks, 2017; Lu et al., 2015; Ghude et al., 2013; Cooper et al., 2020). Meanwhile, the use of NO2 column measurements to explore tropospheric O3 sensitivities has been the subject of several past studies, which disclosed that this diagnosis of O3 production rate (PO3) is consistent with the findings of surface photochemistry (Baruah et al., 2021; Choi and Souri, 2015; Jin et al., 2017, 2020; Jin and Holloway, 2015; Schroeder et al., 2017; Souri et al., 2017; Sun et al., 2021b, 2018c; Yin et al., 2021b).
We incorporate the 11 meteorological parameters listed in Table 2 into the MLR model to fit the time series of monthly averaged NO2 VCDtrop from 2005–2020 over the six megacities within the YRD (Fig. S1). Correlation plots of the MLR results and the satellite tropospheric NO2 data are shown in Fig. 5. The results show that the MLR model can reproduce the seasonal variabilities of tropospheric NO2 VCDs over each city well, with correlation coefficients of 0.85 to 0.90. We separate the contributions of meteorology and anthropogenic emission to the NO2 variability over the six megacities with the methodology described in Sect. 2.3. Figure 6 shows monthly averaged tropospheric NO2 VCDs along with the meteorological-driven contributions and the anthropogenic-driven contributions in each city. Figure 7 is the same as Fig. 6, but the statistics are based on annual average.
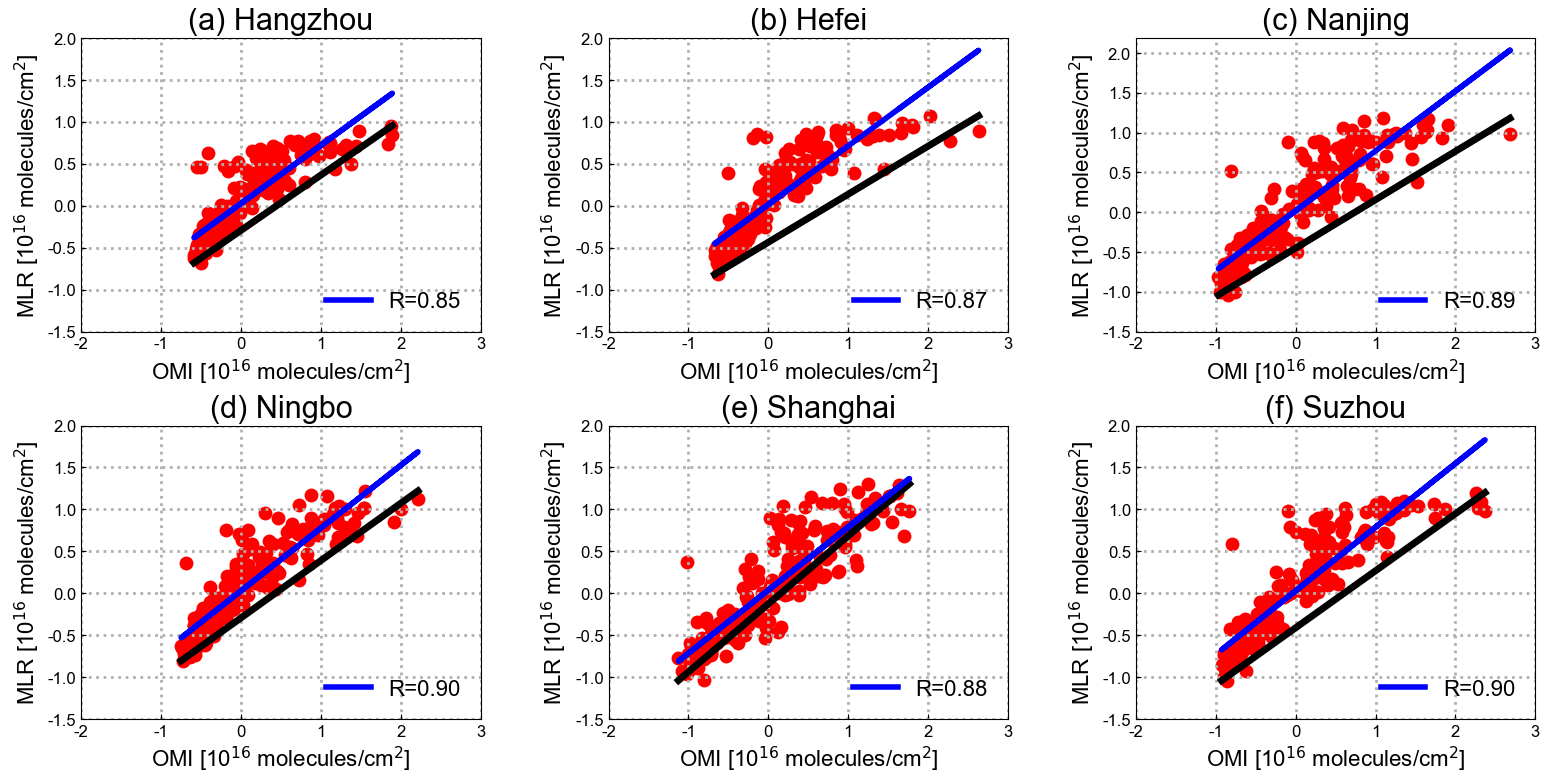
Figure 5Correlations of OMI NO2 VCDtrop against the MLR model results over Hefei, Nanjing, Shanghai, Suzhou, Hangzhou, and Ningbo. Blue lines are linear fitted lines, and black lines are the 1 : 1 line.
4.1 Drivers of seasonal cycles of NO2 VCDtrop
As shown in Fig. 6 for all megacities, the seasonal variabilities of meteorological contributions are consistent with those of NO2 VCDtrop except the period from February to March, and the anthropogenic contributions varied around zero throughout the year except in December and February. This means that the seasonal variabilities of tropospheric NO2 over the YRD are mainly determined by meteorology (81.01 %–83.91 %) and also influenced by anthropogenic emission in December and February. Meteorological contributions are larger than zero in winter and lower than zero in summer, indicating that meteorology increases the NO2 level in winter and decreases the NO2 level in summer. This contrast in meteorological contribution is associated with the seasonal cycle of temperature. Similarly, anthropogenic contributions are larger than zero in December and lower than zero in February, representing anthropogenic emission increases NO2 level in December and decreases NO2 level in February. The enhanced anthropogenic contributions in December are mainly attributed to more extensive anthropogenic activities such as residential heating in megacities in this period, which usually results in more anthropogenic NO2 emission due to the increase in energy and fuel consumption. The decreased anthropogenic contributions in February are attributed to the Spring Festival. We elaborate the analysis below.
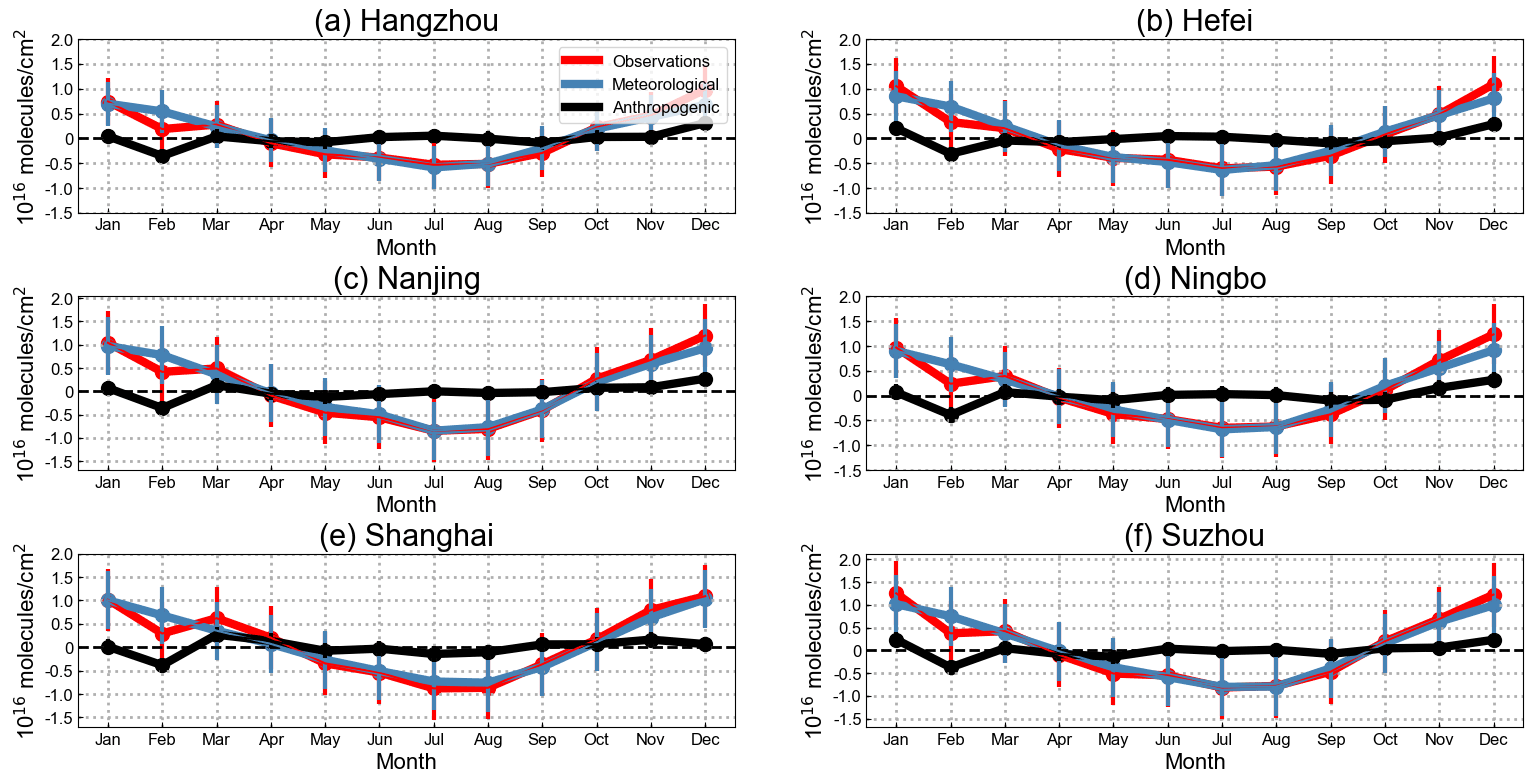
Figure 6Monthly averaged NO2 VCDtrop (red dots and lines) along with the meteorological-driven portions (blue dots and lines) and the anthropogenic-driven portions (black dots and lines) over each city within the YRD. The vertical error bar is 1σ standard deviation (SD) within that month.
As shown in Fig. S2, the vast majorities of meteorological contributions over all megacities are from temperature, and additional minor contributions over some cities such as Nanjing, Shanghai, and Suzhou are attributed to relative humidity, pressure, or surface incoming shortwave flux (SWGDN) (Agudelo–Castaneda et al., 2014; Parra et al., 2009). Significant negative correlations between temperature and NO2 VCDtrop are observed in all megacities (Fig. S3, Table 5). Higher temperature tends to decrease NO2 VCDtrop and vice versa. This is because higher temperature conditions could accelerate the chemical reaction that destructs NO2 in the troposphere (Pearce et al., 2011; Yin et al., 2021a). In addition, surface pressure shows high positive correlation, and both surface relative humidity and SWGDN show negative correlations with NO2 VCDtrop, but their contribution levels are much lower than the temperature. All other meteorological variables only have weak correlations with NO2 VCDtrop (Table 5).
Table 5Correlations of monthly averaged observations against each meteorological parameter from 2005–2020.

In all cities except Hefei, there is a significant increase in NO2 level from February to March. The maximum and minimum increments occur in Shanghai and Nanjing, with values of (3.28 ± 0.29) × 1015 molec. cm−2 (16.37 ± 1.45) % and (0.47 ± 0.05) × 1015 molec. cm−2 (2.60 ± 0.28) %, respectively. In contrast, the meteorological contributions show decreased change rates in the same period. As a result, this increase in NO2 level from February to March could be attributed to anthropogenic emission rather than meteorology. Indeed, anthropogenic contributions show significant increases of (3.95 ± 0.32) to (6.53 ± 0.55) × 1015 molec. cm−2 over all megacities from February to March. The most important festival in China – the Spring Festival – typically occurs in February, when a large number of migrants in megacities return to their hometowns for holiday, and most industrial production is shut down, which could cause significant reductions in anthropogenic emission. In March, these migrants get back to work, and all industrial enterprises resumed production, which could cause a rebound in anthropogenic emission. The seasonal maxima of NO2 in March are not observed in Hefei because the anthropogenic-emission-induced increases are offset by meteorology-induced decreases.
The year 2020 is a special year compared to all other years, when a large-scale lockdown occurred in February, and some regional travel restrictions occasionally occurred in other seasons across China due to the COVID-19 pandemic. In the comparison, we removed all NO2 measurements in 2020 to eliminate the influence of COVID-19. The monthly averaged NO2 VCDtrop values from 2005–2019 along with the meteorological contributions and the anthropogenic contributions in each city are shown in Fig. S4. Figures S5 and S6 are the same as Figs. 2 and 3, respectively, but for 2011–2019. We obtained the same conclusion as that from Fig. 6, indicating that the drivers of seasonal cycles of NO2 VCDtrop deduced above are consistent over the years.
4.2 Drivers of inter-annual variabilities of NO2 VCDtrop
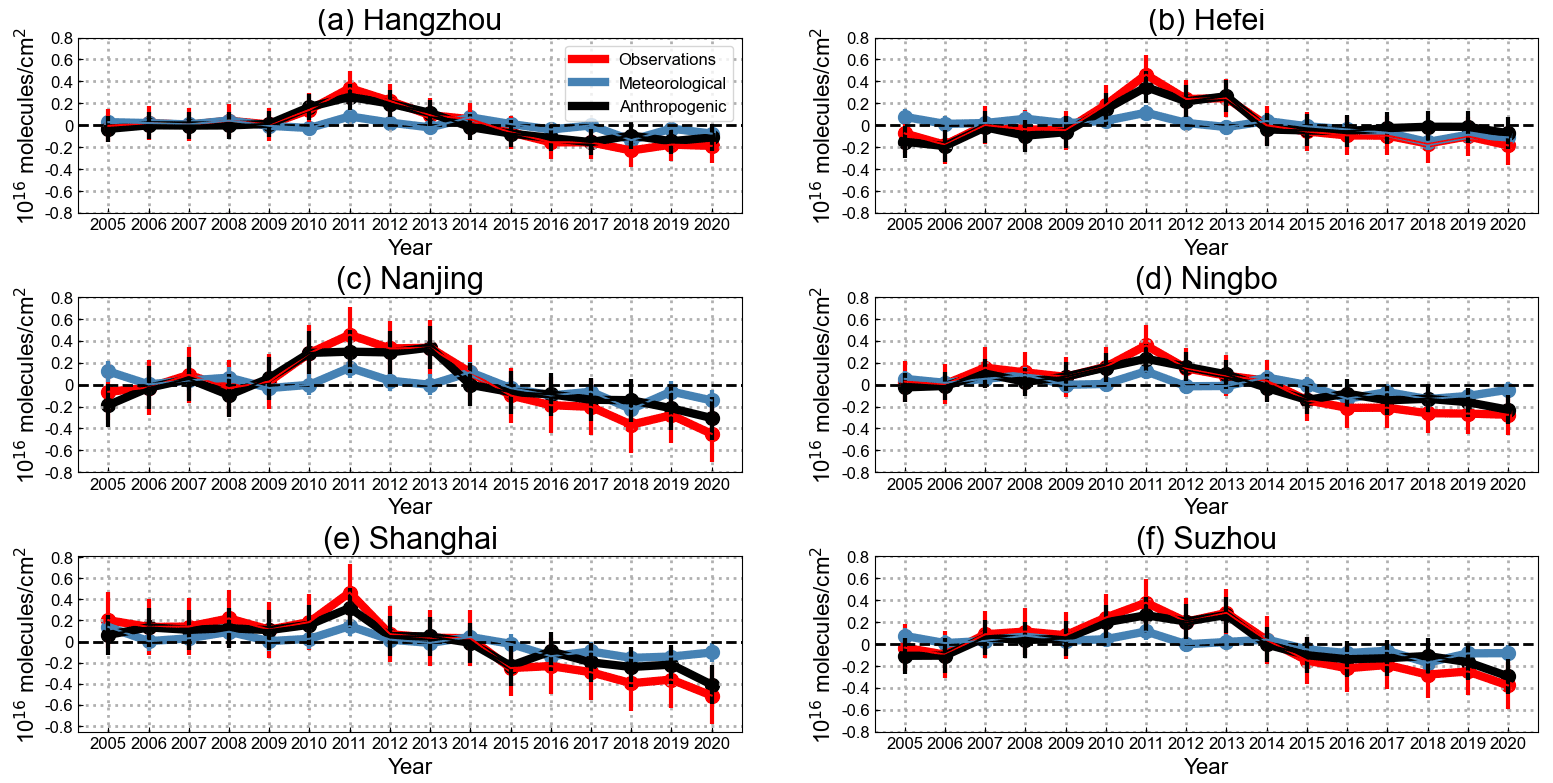
As shown in Fig. 7 for all megacities, the inter-annual variabilities of anthropogenic contributions are in good agreement with those of NO2 VCDtrop, indicating that inter-annual variabilities of NO2 VCDtrop are mainly driven by anthropogenic emission. The same as those of NO2 VCDtrop, the inter-annual anthropogenic contributions over each city can also be divided into two stages, i.e., an overall increasing stage during 2005–2011 and a decreasing stage during 2011–2020. For the first stage (2005–2011), anthropogenic contributions account for 84.72 %, 92.96 %, 93.52 %, 79.06 %, 97.12 %, and 90.21 % of the increases in NO2 VCDtrop, while meteorological contributions account for 15.28 %, 7.04 %, 6.48 %, 20.94 %, 2.88 %, and 9.79 % over Hangzhou, Hefei, Nanjing, Ningbo, Shanghai, and Suzhou, respectively. The annual averaged meteorological contributions over each city varied around zero in all years, except for a few anomalies in some years. For example, meteorological contributions over all cities are larger than zero in 2005 and 2011 but lower than zero after 2014. Pronounced anomalies include the enhancements that occurred in 2011 in all cities and the decrements in 2015 over Suzhou, in 2018 over Hangzhou, and in 2016 over other cities. All these anomalies in meteorological contributions are highly correlated with temperature anomalies (Fig. S7). As shown in Figs. S8 and S9, the temperature in all cities is lower than the reference value (i.e., the 16-year mean) in 2005 and 2011 and larger than the reference value after 2014. As a result, in addition to anthropogenic emission, the NO2 enhancements in 2011 are partly attributed to the lower temperature in this year. Meanwhile, higher temperature in the YRD region in recent years favors the decrease in NO2 VCDtrop. For the second stage (2011–2020), anthropogenic contributions account for 70.15 %, 65.22 %, 66.97 %, 73.45 %, 74.43 %, and 73.84 % of the decreases in NO2 VCDtrop, while meteorological contributions account for 29.85 %, 34.78 %, 33.03 %, 26.55 %, 25.57 %, and 26.16 % over Hangzhou, Hefei, Nanjing, Ningbo, Shanghai, and Suzhou, respectively.
Since anthropogenic NO2 emissions are highly related to economic and industrial activities (Lin and McElroy, 2011; Russell et al., 2012; Vrekoussis et al., 2013; Guerriero et al., 2016), to understand the inter-annual variabilities of NO2 VCDtrop, we have investigated the inter-annual variabilities of gross domestic product (GDP) over the YRD from the primary sector, secondary sector, and tertiary sector (http://www.stats.gov.cn/, last access: 1 August 2021) from 2005–2020. The primary sector includes agriculture, forestry, animal husbandry, and fishery. The secondary industry includes mining, manufacturing, power, heat, gas and water production and supply, and construction. The tertiary industry, namely the service industry, refers to all industries excluding the primary industry and the secondary industry. The secondary industry is more related to energy and fuel consumption, and it thus dominates the anthropogenic NO2 emission. Figure S10 shows the time series of GDP over the YRD from 2005–2020, and Fig. S11 is the same as Fig. S10 but for a year-to-year increment, i.e., the increase in GDP for a given year relative to its previous year. The results show that the GDP of each province within the YRD increased over time starting from 2005, but the relative contribution of each industry sector is different from year to year. The primary-sector-related GDP is relatively constant, but both the secondary-sector- and tertiary-sector-related GDPs show significant increasing trends from 2005–2020.
During 2009–2011, the GDPs increased significantly by CNY 198.45, CNY 483.86, CNY 656.40, and CNY 327.05 billion over Shanghai, Zhejiang, Jiangsu, and Anhui, where the secondary sector contributions account for 46.50 %, 53.64 %, 48.99 %, and 60.34 % respectively. Before 2011, much of China's economic growth still relied on the high-carbon fossil energy system, and efforts to control atmospheric pollution were relatively small. These significant increases in GDP could cause significant increases in anthropogenic NO2 emission. After 2011, China implemented a series of clean air measures to tackle air pollution across China. These measures include the reduction of industrial pollutant emissions, the adjustment of industrial structure and energy mix, and other compulsory policies (China State Council, 2013). Zheng et al. (2018a) estimated China's anthropogenic emission trends from 2010–2017 with the bottom-up emission inventory and found that, as a consequence of the clean air measures, anthropogenic NOx emission across China during 2010–2017 decreased by 17 %. In Fig. S12, we further analyzed the variabilities of NOx emissions over the YRD region from 2008–2017 using the categories provided by the Multi-resolution Emission Inventory for China (MEIC) inventory, including motor vehicle emissions, major industrial emissions, resident emissions, and power emissions (http://meicmodel.org, last access: 25 February 2022) (Li et al., 2017; Zheng et al., 2018a). The results show that the decreases in Tro_NO2 over the YRD during 2011–2013 are attributed to the reductions of industrial and power emissions, during 2013–2014 are mainly attributed to the reductions of motor vehicle emissions and power emissions, and after 2014 are attributed to the reductions of motor vehicle emissions, power emissions, and industrial emissions.
Although the total GDPs over all megacities still increased over time after 2011, most of these increases are from the tertiary sector, indicating the effectiveness of the adjustment of industrial structure and energy mix. The largest anthropogenic NO2 producer from the tertiary sector is attributed to the transportation industry, such as traffic and cargo transport. The Chinese government implemented stringent restrictions on vehicle exhaust emissions after 2011 (Ministry of Ecology and Environment of the People's Republic of China, 2011, 2016). For example, they implemented the fourth and the fifth national motor vehicle pollutant emissions standards in 2011 and 2018, respectively, which mandate 30 % and 60 % reductions in vehicle NOx emissions relative to the third national standard (Ministry of Ecology and Environment of the People's Republic of China, 2007, 2018). These stringent measures could significantly reduce anthropogenic NO2 emissions from the tertiary sector. Overall, the decreasing trends in NO2 VCDtrop from 2011–2020 over all megacities within the YRD are mainly attributed to the stringent clean air measures in this period, which either adjust high-energy industrial structure toward low-energy industrial structure or directly reduce pollutant emissions from different industrial sectors.
In this study, we quantified the long-term variabilities and the underlying drivers of NO2 VCDtrop from 2005–2020 over the Yangtze River Delta (YRD) using the OMI LV3 NO2 data product and MLR. The major pollution areas for NO2 VCDtrop over the YRD are located in the south of Jiangsu Province and north of Zhejiang Province. In addition, NO2 pollution in the eastern Anhui Province showed an increasing trend during 2005–2013 and became one of the major pollution areas within the YRD during 2010–2013. The amplitudes of NO2 VCDtrop over the YRD showed large year-to-year variabilities from 2005–2020, but spatial extensions of the major pollution areas are almost constant over the years. Among all the pollution areas, the heaviest pollution regions are uniformly located in the densely populated and highly industrialized megacities such as Shanghai, Nanjing, Suzhou, Hangzhou, Ningbo, and Hefei. For six megacities, the spaceborne tropospheric results have been compared to surface in situ data, yielding correlation coefficients between 0.8 and 0.9.
Clear seasonal features and inter-annual variabilities of NO2 VCDtrop over the YRD region are observed. Overall, the amplitudes and 1σ SDs of NO2 seasonal cycles in cold seasons are larger than those in warm seasons, and the inter-annual NO2 variabilities at megacity level can be divided into two stages, i.e., an overall increasing stage during 2005–2011 and a decreasing stage during 2011–2020. We have used the MLR to quantify the drivers of NO2 VCDtrop from 2005–2020 over all megacities within the YRD. The seasonal cycles of NO2 VCDtrop over the YRD are mainly driven by meteorology (81.01 %–83.91 %), except in winter when anthropogenic emission contributions are also pronounced (16.09 %–18.99 %). The inter-annual variabilities of NO2 VCDtrop are mainly driven by anthropogenic emission (69.18 %–81.34 %), except in a few years, such as 2018, which are partly attributed to meteorology anomalies (39.07 %–91.51 %).
The increasing trends in NO2 VCDtrop from 2005–2011 over the YRD are mainly attributed to high energy consumption associated with rapid economic growth, which causes significant increases in anthropogenic NO2 emission. The decreasing trends in NO2 VCDtrop from 2011–2020 over the YRD are mainly attributed to the stringent clean air measures in this period, which either adjust high-energy industrial structure toward low-energy industrial structure or directly reduce pollutant emissions from different industrial sectors. This study does not only improve our knowledge with respect to long-term evolution of economic and social development, anthropogenic emission, and the effectiveness of pollution control measures over the YRD, but it also has positive implications for forming future clean air policies in this key region.
All data are available on request from the corresponding author (Youwen Sun, ywsun@aiofm.ac.cn).
The supplement related to this article is available online at: https://doi.org/10.5194/acp-22-4167-2022-supplement.
HY designed the study and wrote the paper. YS supervised and revised this paper. JN, MP, and CL provided constructive comments.
The contact author has declared that neither they nor their co-authors have any competing interests.
Publisher's note: Copernicus Publications remains neutral with regard to jurisdictional claims in published maps and institutional affiliations.
The authors would like to thank the editor, Bryan N. Duncan, and two anonymous referees. We also would like to thank NASA and the China National Environmental Monitoring Center (CNEMC) network for providing OMI satellite data and ground monitoring data, respectively.
This research has been supported by the National Key Research and Development Program of China (grant no. 2019YFC0214802), the Youth Innovation Promotion Association, CAS (grant no. 2019434), and the Sino-German Mobility Programme (grant no. M-0036).
This paper was edited by Bryan N. Duncan and reviewed by two anonymous referees.
Agudelo–Castaneda, D. M., Calesso Teixeira, E., and Norte Pereira, F.: Time–series analysis of surface ozone and nitrogen oxides concentrations in an urban area at Brazil, Atmos. Pollut. Res., 5, 411–420, https://doi.org/10.5094/APR.2014.048, 2014.
Anand, J. S. and Monks, P. S.: Estimating daily surface NO2 concentrations from satellite data – a case study over Hong Kong using land use regression models, Atmos. Chem. Phys., 17, 8211–8230, https://doi.org/10.5194/acp-17-8211-2017, 2017.
Baruah, U. D., Robeson, S. M., Saikia, A., Mili, N., Sung, K., and Chand, P.: Spatio-temporal characterization of tropospheric ozone and its precursor pollutants NO2 and HCHO over South Asia, Sci. Total Environ., 809, 151135, https://doi.org/10.1016/j.scitotenv.2021.151135, 2021.
Bechle, M. J., Millet, D. B., and Marshall, J. D.: Remote sensing of exposure to NO2: Satellite versus ground-based measurement in a large urban area, Atmos. Environ., 69, 345–353, https://doi.org/10.1016/j.atmosenv.2012.11.046, 2013.
Boersma, K. F., Eskes, H. J., Veefkind, J. P., Brinksma, E. J., van der A, R. J., Sneep, M., van den Oord, G. H. J., Levelt, P. F., Stammes, P., Gleason, J. F., and Bucsela, E. J.: Near-real time retrieval of tropospheric NO2 from OMI, Atmos. Chem. Phys., 7, 2103–2118, https://doi.org/10.5194/acp-7-2103-2007, 2007.
Boersma, K. F., Jacob, D. J., Trainic, M., Rudich, Y., DeSmedt, I., Dirksen, R., and Eskes, H. J.: Validation of urban NO2 concentrations and their diurnal and seasonal variations observed from the SCIAMACHY and OMI sensors using in situ surface measurements in Israeli cities, Atmos. Chem. Phys., 9, 3867–3879, https://doi.org/10.5194/acp-9-3867-2009, 2009.
Boersma, K. F., Eskes, H. J., Dirksen, R. J., van der A, R. J., Veefkind, J. P., Stammes, P., Huijnen, V., Kleipool, Q. L., Sneep, M., Claas, J., Leitão, J., Richter, A., Zhou, Y., and Brunner, D.: An improved tropospheric NO2 column retrieval algorithm for the Ozone Monitoring Instrument, Atmos. Meas. Tech., 4, 1905–1928, https://doi.org/10.5194/amt-4-1905-2011, 2011.
Bond, D. W., Zhang, R., Tie, X., Brasseur, G., Huffines, G., Orville, R. E., and Boccippio, D. J.: NOx production by lightning over the continental United States, J. Geophys. Res.-Atmos., 106, 27701–27710, https://doi.org/10.1029/2000JD000191, 2001.
Browne, E. C., Min, K.-E., Wooldridge, P. J., Apel, E., Blake, D. R., Brune, W. H., Cantrell, C. A., Cubison, M. J., Diskin, G. S., Jimenez, J. L., Weinheimer, A. J., Wennberg, P. O., Wisthaler, A., and Cohen, R. C.: Observations of total RONO2 over the boreal forest: NOx sinks and HNO3 sources, Atmos. Chem. Phys., 13, 4543–4562, https://doi.org/10.5194/acp-13-4543-2013, 2013.
Bucsela, E. J., Krotkov, N. A., Celarier, E. A., Lamsal, L. N., Swartz, W. H., Bhartia, P. K., Boersma, K. F., Veefkind, J. P., Gleason, J. F., and Pickering, K. E.: A new stratospheric and tropospheric NO2 retrieval algorithm for nadir-viewing satellite instruments: applications to OMI, Atmos. Meas. Tech., 6, 2607–2626, https://doi.org/10.5194/amt-6-2607-2013, 2013.
Carvalho, D.: An Assessment of NASA's GMAO MERRA-2 Reanalysis Surface Winds, J. Clim., 32, 8261–8281, https://doi.org/10.1175/JCLI-D-19-0199.1, 2019.
Cheng, M. M., Jiang, H., and Guo, Z.: Evaluation of long-term tropospheric NO2 columns and the effect of different ecosystem in Yangtze River Delta, Procedia Environ. Sci., 13, 1045–1056, https://doi.org/10.1016/j.proenv.2012.01.098, 2012.
Chi, Y., Fan, M., Zhao, C., Sun, L., Yang, Y., Yang, X., and Tao, J.: Ground-level NO2 concentration estimation based on OMI tropospheric NO2 and its spatiotemporal characteristics in typical regions of China, Atmos. Res., 264, 105821, https://doi.org/10.1016/j.atmosres.2021.105821, 2021.
China State Council: the Air Pollution Prevention and Control Action Plan, http://www.gov.cn/zhengce/content/2013-09/13/content_4561.htm (last access: 12 December 2021.), 2013.
Choi, Y., and Souri, A. H.: Chemical condition and surface ozone in large cities of Texas during the last decade: Observational evidence from OMI, CAMS, and model analysis, Remote Sens. Environ., 168, 90–101, 2015.
Cooper, M. J., Martin, R. V., McLinden, C. A., and Brook, J. R.: Inferring ground-level nitrogen dioxide concentrations at fine spatial resolution applied to the TROPOMI satellite instrument, Environ. Res. Lett., 15, 104013, https://doi.org/10.1088/1748-9326/aba3a5, 2020.
Duncan, B. N., Yoshida, Y., de Foy, B., Lamsal, L. N., Streets, D. G., Lu, Z., Pickering, K. E., and Krotkov, N. A.: The observed response of Ozone Monitoring Instrument (OMI) NO2 columns to NOx emission controls on power plants in the United States: 2005–2011, Atmos. Environ., 81, 102–111, https://doi.org/10.1016/j.atmosenv.2013.08.068, 2013.
Duncan, B. N., Lamsal, L. N., Thompson, A. M., Yoshida, Y., Lu, Z., Streets, D. G., Hurwitz, M. M., and Pickering, K. E.: A space-based, high-resolution view of notable changes in urban NOx pollution around the world (2005–2014), J. Geophys. Res.-Atmos., 121, 976–996, https://doi.org/10.1002/2015JD024121, 2016.
Geddes, J. A., Murphy, J. G., O'Brien, J. M., and Celarier, E. A.: Biases in long-term NO2 averages inferred from satellite observations due to cloud selection criteria, Remote Sens. Environ., 124, 210–216, https://doi.org/10.1016/j.rse.2012.05.008, 2012.
Gelaro, R., McCarty, W., Suárez, M. J., Todling, R., Molod, A., Takacs, L., Randles, C. A., Darmenov, A., Bosilovich, M. G., Reichle, R., Wargan, K., Coy, L., Cullather, R., Draper, C., Akella, S., Buchard, V., Conaty, A., da Silva, A. M., Gu, W., Gi-Kong, K., Koster, R., Lucchesi, R., Merkova, D., Nielsen, J. E., Partyka, G., Pawson, S., Putman, W., Rienecker, M., Schubert, S. D., Sienkiewicz, M., and Zhao, B.: The Modern-Era Retrospective Analysis for Research and Applications, Version 2 (MERRA-2), J. Clim., 30, 5419–5454, https://doi.org/10.1175/JCLI-D-16-0758.1, 2017.
Ghude, S. D., Van der A, R. J., Beig, G., Fadnavis, S., and Polade, S. D.: Satellite derived trends in NO2 over the major global hotspot regions during the past decade and their inter-comparison, Environ. Pollut., 157, 1873–1878, https://doi.org/10.1016/j.envpol.2009.01.013, 2009.
Ghude, S. D., Pfister, G. G., Jena, C., van der A, R. J., Emmons, L. K., and Kumar, R.: Satellite constraints of nitrogen oxide (NOx) emissions from India based on OMI observations and WRF-Chem simulations, Geophys. Res. Lett., 40, 423–428, https://doi.org/10.1002/grl.50065, 2013.
Goldberg, D. L., Lamsal, L. N., Loughner, C. P., Swartz, W. H., Lu, Z., and Streets, D. G.: A high-resolution and observationally constrained OMI NO2 satellite retrieval, Atmos. Chem. Phys., 17, 11403–11421, https://doi.org/10.5194/acp-17-11403-2017, 2017.
Guerriero, C., Chatzidiakou, L., Cairns, J., and Mumovic, D.: The economic benefits of reducing the levels of nitrogen dioxide (NO2) near primary schools: The case of London, J. Environ. Manag., 181, 615–622, https://doi.org/10.1016/j.jenvman.2016.06.039, 2016.
Hakkarainen, J., Ialongo, I., and Tamminen, J.: Direct space-based observations of anthropogenic CO2 emission areas from OCO-2, Geophys. Res. Lett., 43, 11400–411406, https://doi.org/10.1002/2016GL070885, 2016.
Hakkarainen, J., Ialongo, I., Maksyutov, S., and Crisp, D.: Analysis of Four Years of Global XCO2 Anomalies as Seen by Orbiting Carbon Observatory-2, Remote Sens.-Basel, 11, 850, https://doi.org/10.3390/rs11070850, 2019.
He, J., Gong, S., Yu, Y., Yu, L., Wu, L., Mao, H., Song, C., Zhao, S., Liu, H., Li, X., and Li, R.: Air pollution characteristics and their relation to meteorological conditions during 2014–2015 in major Chinese cities, Environ. Pollut., 223, 484–496, https://doi.org/10.1016/j.envpol.2017.01.050, 2017.
Hilboll, A., Richter, A., and Burrows, J. P.: Long-term changes of tropospheric NO2 over megacities derived from multiple satellite instruments, Atmos. Chem. Phys., 13, 4145–4169, https://doi.org/10.5194/acp-13-4145-2013, 2013.
Ji, X., Liu, C., Xie, Z., Hu, Q., Dong, Y., Fan, G., Zhang, T., Xing, C., Wang, Z., Javed, Z., and Liu, J.: Comparison of mixing layer height inversion algorithms using lidar and a pollution case study in Baoding, China, J. Environ. Sci., 79, 81–90, https://doi.org/10.1016/j.jes.2018.11.003, 2019.
Ji, X., Hu, Q., Hu, B., Wang, S., Liu, H., Xing, C., Lin, H., and Lin, J.: Vertical Structure of Air Pollutant Transport Flux as Determined by Ground-Based Remote Sensing Observations in Fen-Wei Plain, China, Remote Sens.-Basel, 13, 3664, https://doi.org/10.3390/rs13183664, 2021.
Jiang, Z., McDonald, B. C., Worden, H., Worden, J. R., Miyazaki, K., Qu, Z., Henze, D. K., Jones, D. B. A., Arellano, A. F., Fischer, E. V., Zhu, L. Y., and Boersma, K. F.: Unexpected slowdown of US pollutant emission reduction in the past decade, P. Natl. Acad. Sci. USA, 115, 5099–5104, 2018.
Jin, X., Fiore, A. M., Murray, L. T., Valin, L. C., Lamsal, L. N., Duncan, B., Folkert Boersma, K., De Smedt, I., Abad, G. G., Chance, K., and Tonnesen, G. S.: Evaluating a Space-Based Indicator of Surface Ozone-NOx-VOC Sensitivity Over Midlatitude Source Regions and Application to Decadal Trends, J. Geophys. Res.-Atmos., 122, 10439–10461, https://doi.org/10.1002/2017JD026720, 2017.
Jin, X., Fiore, A., Boersma, K. F., Smedt, I. D., and Valin, L.: Inferring Changes in Summertime Surface Ozone–NOx–VOC Chemistry over U.S. Urban Areas from Two Decades of Satellite and Ground-Based Observations, Environ. Sci. Technol., 54, 6518–6529, https://doi.org/10.1021/acs.est.9b07785, 2020.
Jin, X. M. and Holloway, T.: Spatial and temporal variability of ozone sensitivity over China observed from the Ozone Monitoring Instrument, J. Geophys. Res.-Atmos., 120, 7229–7246, 2015.
Kharol, S. K., Martin, R. V., Philip, S., Boys, B., Lamsal, L. N., Jerrett, M., Brauer, M., Crouse, D. L., McLinden, C., and Burnett, R. T.: Assessment of the magnitude and recent trends in satellite-derived ground-level nitrogen dioxide over North America, Atmos. Environ., 118, 236–245, https://doi.org/10.1016/j.atmosenv.2015.08.011, 2015.
Kim, D.-R., Lee, J.-B., Keun Song, C., Kim, S.-Y., Ma, Y.-l., Lee, K.-M., Cha, J.-S., and Lee, S.-D.: Temporal and spatial distribution of tropospheric NO2 over Northeast Asia using OMI data during the years 2005–2010, Atmos. Pollut. Res., 6, 768–776, https://doi.org/10.5094/APR.2015.085, 2015.
Kishore Kumar, G., Kishore Kumar, K., Baumgarten, G., and Ramkumar, G.: Validation of MERRA reanalysis upper-level winds over low latitudes with independent rocket sounding data, J. Atmos. Sol.-Terr. Phys., 123, 48–54, https://doi.org/10.1016/j.jastp.2014.12.001, 2015.
Kramer, L. J., Leigh, R. J., Remedios, J. J., and Monks, P. S.: Comparison of OMI and ground-based in situ and MAX-DOAS measurements of tropospheric nitrogen dioxide in an urban area, J. Geophys. Res.-Atmos., 113, D16S39, https://doi.org/10.1029/2007JD009168, 2008.
Krotkov, N. A., McLinden, C. A., Li, C., Lamsal, L. N., Celarier, E. A., Marchenko, S. V., Swartz, W. H., Bucsela, E. J., Joiner, J., Duncan, B. N., Boersma, K. F., Veefkind, J. P., Levelt, P. F., Fioletov, V. E., Dickerson, R. R., He, H., Lu, Z., and Streets, D. G.: Aura OMI observations of regional SO2 and NO2 pollution changes from 2005 to 2015, Atmos. Chem. Phys., 16, 4605–4629, https://doi.org/10.5194/acp-16-4605-2016, 2016.
Lamsal, L. N., Martin, R. V., van Donkelaar, A., Steinbacher, M., Celarier, E. A., Bucsela, E., Dunlea, E. J., and Pinto, J. P.: Ground-level nitrogen dioxide concentrations inferred from the satellite-borne Ozone Monitoring Instrument, J. Geophys. Res.-Atmos., 113, D16308, https://doi.org/10.1029/2007JD009235, 2008.
Lamsal, L. N., Krotkov, N. A., Celarier, E. A., Swartz, W. H., Pickering, K. E., Bucsela, E. J., Gleason, J. F., Martin, R. V., Philip, S., Irie, H., Cede, A., Herman, J., Weinheimer, A., Szykman, J. J., and Knepp, T. N.: Evaluation of OMI operational standard NO2 column retrievals using in situ and surface-based NO2 observations, Atmos. Chem. Phys., 14, 11587–11609, https://doi.org/10.5194/acp-14-11587-2014, 2014.
Lamsal, L. N., Duncan, B. N., Yoshida, Y., Krotkov, N. A., Pickering, K. E., Streets, D. G., and Lu, Z.: U.S. NO2 trends (2005–2013): EPA Air Quality System (AQS) data versus improved observations from the Ozone Monitoring Instrument (OMI), Atmos. Environ., 110, 130–143, https://doi.org/10.1016/j.atmosenv.2015.03.055, 2015.
Levelt, P. F., Oord, G. H. J. v. d., Dobber, M. R., Malkki, A., Huib, V., Johan de, V., Stammes, P., Lundell, J. O. V., and Saari, H.: The ozone monitoring instrument, IEEE T. Geosci. Remote Sens., 44, 1093–1101, https://doi.org/10.1109/TGRS.2006.872333, 2006.
Li, K., Jacob, D. J., Liao, H., Shen, L., Zhang, Q., and Bates, K. H.: Anthropogenic drivers of 2013–2017 trends in summer surface ozone in China, P. Natl. Acad. Sci., 116, 422–427, https://doi.org/10.1073/pnas.1812168116, 2019.
Li, K., Jacob, D. J., Shen, L., Lu, X., De Smedt, I., and Liao, H.: Increases in surface ozone pollution in China from 2013 to 2019: anthropogenic and meteorological influences, Atmos. Chem. Phys., 20, 11423–11433, https://doi.org/10.5194/acp-20-11423-2020, 2020.
Li, M., Liu, H., Geng, G., Hong, C., Liu, F., Song, Y., Tong, D., Zheng, B., Cui, H., Man, H., Zhang, Q., and He, K.: Anthropogenic emission inventories in China: a review, Natl. Sci. Rev., 4, 834–866, https://doi.org/10.1093/nsr/nwx150, 2017.
Li, R., Xu, M., Li, M., Chen, Z., Zhao, N., Gao, B., and Yao, Q.: Identifying the spatiotemporal variations in ozone formation regimes across China from 2005 to 2019 based on polynomial simulation and causality analysis, Atmos. Chem. Phys., 21, 15631–15646, https://doi.org/10.5194/acp-21-15631-2021, 2021.
Lin, C., Lau, A. K. H., Fung, J. C. H., Song, Y., Li, Y., Tao, M., Lu, X., Ma, J., and Lao, X. Q.: Removing the effects of meteorological factors on changes in nitrogen dioxide and ozone concentrations in China from 2013 to 2020, Sci. Total Environ., 793, 148575, https://doi.org/10.1016/j.scitotenv.2021.148575, 2021.
Lin, J., Nielsen, C. P., Zhao, Y., Lei, Y., Liu, Y., and McElroy, M. B.: Recent Changes in Particulate Air Pollution over China Observed from Space and the Ground: Effectiveness of Emission Control, Environ. Sci. Technol., 44, 7771–7776, https://doi.org/10.1021/es101094t, 2010.
Lin, J.-T. and McElroy, M. B.: Detection from space of a reduction in anthropogenic emissions of nitrogen oxides during the Chinese economic downturn, Atmos. Chem. Phys., 11, 8171–8188, https://doi.org/10.5194/acp-11-8171-2011, 2011.
Liu, C., Sun, Y., Shan, C., Wang, W., Notholt, J., Palm, M., Yin, H., Tian, Y., Gao, J., and Mao, H.: Long-term observations of atmospheric constituents at the first ground-based high-resolution fourier-transform spectrometry observation station in china, Engineering, in press, https://doi.org/10.1016/j.eng.2021.11.022, 2022.
Liu, F., Zhang, Q., van der A, R. J., Zheng, B., Tong, D., Yan, L., Zheng, Y., and He, K.: Recent reduction in NOx emissions over China: synthesis of satellite observations and emission inventories, Environ. Res. Lett., 11, 114002, https://doi.org/10.1088/1748-9326/11/11/114002, 2016.
Liu, F., Beirle, S., Zhang, Q., van der A, R. J., Zheng, B., Tong, D., and He, K.: NOx emission trends over Chinese cities estimated from OMI observations during 2005 to 2015, Atmos. Chem. Phys., 17, 9261–9275, https://doi.org/10.5194/acp-17-9261-2017, 2017.
Liu, F., van der A, R. J., Eskes, H., Ding, J., and Mijling, B.: Evaluation of modeling NO2 concentrations driven by satellite-derived and bottom-up emission inventories using in situ measurements over China, Atmos. Chem. Phys., 18, 4171–4186, https://doi.org/10.5194/acp-18-4171-2018, 2018.
Lu, X., Zhang, L., Chen, Y., Zhou, M., Zheng, B., Li, K., Liu, Y., Lin, J., Fu, T.-M., and Zhang, Q.: Exploring 2016–2017 surface ozone pollution over China: source contributions and meteorological influences, Atmos. Chem. Phys., 19, 8339–8361, https://doi.org/10.5194/acp-19-8339-2019, 2019a.
Lu, X., Zhang, L., and Shen, L.: Meteorology and Climate Influences on Tropospheric Ozone: a Review of Natural Sources, Chemistry, and Transport Patterns, Curr. Pollut. Rep., 5, 238–260, https://doi.org/10.1007/s40726-019-00118-3, 2019b.
Lu, X., Zhang, L., Wang, X., Gao, M., Li, K., Zhang, Y., Yue, X., and Zhang, Y.: Rapid Increases in Warm-Season Surface Ozone and Resulting Health Impact in China Since 2013, Environ. Sci. Tech. Lett., 7, 240–247, https://doi.org/10.1021/acs.estlett.0c00171, 2020.
Lu, X., Ye, X., Zhou, M., Zhao, Y., Weng, H., Kong, H., Li, K., Gao, M., Zheng, B., Lin, J., Zhou, F., Zhang, Q., Wu, D., Zhang, L., and Zhang, Y.: The underappreciated role of agricultural soil nitrogen oxide emissions in ozone pollution regulation in North China, Nat. Commun., 12, 5021, https://doi.org/10.1038/s41467-021-25147-9, 2021.
Lu, Z., Streets, D. G., de Foy, B., Lamsal, L. N., Duncan, B. N., and Xing, J.: Emissions of nitrogen oxides from US urban areas: estimation from Ozone Monitoring Instrument retrievals for 2005–2014, Atmos. Chem. Phys., 15, 10367–10383, https://doi.org/10.5194/acp-15-10367-2015, 2015.
MacIntyre, E. A., Gehring, U., Mölter, A., Fuertes, E., Klümper, C., Krämer, U., Quass, U., Hoffmann, B., Gascon, M., Brunekreef, B., Koppelman, G. H., Beelen, R., Hoek, G., Birk, M., de Jongste, J. C., Smit, H. A., Cyrys, J., Gruzieva, O., Korek, M., Bergström, A., Agius, R. M., de Vocht, F., Simpson, A., Porta, D., Forastiere, F., Badaloni, C., Cesaroni, G., Esplugues, A., Fernández-Somoano, A., Lerxundi, A., Sunyer, J., Cirach, M., Nieuwenhuijsen, M. J., Pershagen, G., and Heinrich, J.: Air pollution and respiratory infections during early childhood: An analysis of 10 European birth cohorts within the ESCAPE project, Environ. Health Perspect., 122, 107–113, https://doi.org/10.1289/ehp.1306755, 2014.
Marchenko, S., Krotkov, N. A., Lamsal, L. N., Celarier, E. A., Swartz, W. H., and Bucsela, E. J.: Revising the slant column density retrieval of nitrogen dioxide observed by the Ozone Monitoring Instrument, J. Geophys. Res.-Atmos., 120, 5670–5692, https://doi.org/10.1002/2014JD022913, 2015.
Meng, X., Liu, C., Chen, R. J., Sera, F., Vicedo-Cabrera, A. M., Milojevic, A., Guo, Y. M., Tong, S. L., Coelho, M. D. Z. S., Saldiva, P. H. N., Lavigne, E., Correa, P. M., Ortega, N. V., Garcia, S. O., Kysely, J., Urban, A., Orru, H., Maasikmets, M., Jaakkola, J. J. K., Ryti, N., Huber, V., Schneider, A., Katsouyanni, K., Analitis, A., Hashizume, M., Honda, Y., Ng, C. F. S., Nunes, B., Teixeira, J. P., Holobaca, I. H., Fratianni, S., Kim, H., Tobias, A., Iniguez, C., Forsberg, B., Astrom, C., Ragettli, M. S., Guo, Y. L. L., Pan, S. C., Li, S. S., Bell, M. L., Zanobetti, A., Schwartz, J., Wu, T. C., Gasparrini, A., and Kan, H. D.: Short term associations of ambient nitrogen dioxide with daily total, cardiovascular, and respiratory mortality: multilocation analysis in 398 cities, Bmj-Brit. Med. J., 372, 534, https://doi.org/10.1136/bmj.n534, 2021.
Meng, Z.-Y., Xu, X.-B., Wang, T., Zhang, X.-Y., Yu, X.-L., Wang, S.-F., Lin, W.-L., Chen, Y.-Z., Jiang, Y.-A., and An, X.-Q.: Ambient sulfur dioxide, nitrogen dioxide, and ammonia at ten background and rural sites in China during 2007–2008, Atmos. Environ., 44, 2625–2631, https://doi.org/10.1016/j.atmosenv.2010.04.008, 2010.
Ministry of Ecology and Environment of the People's Republic of China: Limits and measurement methods for emissions from light-duty vehicles, https://english.mee.gov.cn/Resources/standards/Air_Environment/emission_mobile/201705/t20170524_414680.shtml (last access: 12 December 2021) and http://www.mee.gov.cn/ywgz/fgbz/bz/bzwb/dqhjbh/dqydywrwpfbz/200707/t20070701_66145.shtml (last access: 12 December 2021), 2007.
Ministry of Ecology and Environment of the People's Republic of China: Announcement on the implementation of the national phase IV vehicle compression ignition engine and vehicle pollutant emission standards, https://www.mee.gov.cn/gkml/hbb/bgg/201201/t20120110_222376.htm (last access: 12 December 2021), 2011.
Ministry of Ecology and Environment of the People's Republic of China: Announcement on the implementation of phase V motor vehicle emission standards, https://www.mee.gov.cn/gkml/hbb/bgg/201601/t20160118_326596.htm (last access: 12 December 2021), 2016.
Ministry of Ecology and Environment of the People's Republic of China: Limits and measurement methods for emissions from light-duty vehicles (CHINA 5), http://www.mee.gov.cn/ywgz/fgbz/bz/bzwb/dqhjbh/dqydywrwpfbz/201309/t20130917_260352.shtml (last access: 12 December 2021), 2018.
Mustafa, F., Bu, L., Wang, Q., Yao, N., Shahzaman, M., Bilal, M., Aslam, R. W., and Iqbal, R.: Neural-network-based estimation of regional-scale anthropogenic CO2 emissions using an Orbiting Carbon Observatory-2 (OCO-2) dataset over East and West Asia, Atmos. Meas. Tech., 14, 7277–7290, https://doi.org/10.5194/amt-14-7277-2021, 2021.
Parra, M. A., Elustondo, D., Bermejo, R., and Santamaría, J. M.: Ambient air levels of volatile organic compounds (VOC) and nitrogen dioxide (NO2) in a medium size city in Northern Spain, Sci. Total Environ., 407, 999–1009, https://doi.org/10.1016/j.scitotenv.2008.10.032, 2009.
Pearce, J. L., Beringer, J., Nicholls, N., Hyndman, R. J., and Tapper, N. J.: Quantifying the influence of local meteorology on air quality using generalized additive models, Atmos. Environ., 45, 1328–1336, https://doi.org/10.1016/j.atmosenv.2010.11.051, 2011.
Richter, A., Burrows, J. P., Nüß, H., Granier, C., and Niemeier, U.: Increase in tropospheric nitrogen dioxide over China observed from space, Nature, 437, 129–132, https://doi.org/10.1038/nature04092, 2005.
Rotman, D. A., Tannahill, J. R., Kinnison, D. E., Connell, P. S., Bergmann, D., Proctor, D., Rodriguez, J. M., Lin, S. J., Rood, R. B., Prather, M. J., Rasch, P. J., Considine, D. B., Ramaroson, R., and Kawa, S. R.: Global Modeling Initiative assessment model: Model description, integration, and testing of the transport shell, J. Geophys. Res.-Atmos., 106, 1669–1691, https://doi.org/10.1029/2000JD900463, 2001.
Russell, A. R., Valin, L. C., and Cohen, R. C.: Trends in OMI NO2 observations over the United States: effects of emission control technology and the economic recession, Atmos. Chem. Phys., 12, 12197-12209, 10.5194/acp-12-12197-2012, 2012.
Schreier, S. F., Peters, E., Richter, A., Lampel, J., Wittrock, F., and Burrows, J. P.: Ship-based MAX-DOAS measurements of tropospheric NO2 and SO2 in the South China and Sulu Sea, Atmos. Environ., 102, 331–343, https://doi.org/10.1016/j.atmosenv.2014.12.015, 2015.
Schroeder, J. R., Crawford, J. H., Fried, A., Walega, J., Weinheimer, A., Wisthaler, A., Muller, M., Mikoviny, T., Chen, G., Shook, M., Blake, D. R., and Tonnesen, G. S.: New insights into the column CH2O NO2 ratio as an indicator of near-surface ozone sensitivity, J. Geophys. Res.-Atmos., 122, 8885–8907, 2017.
Shaiganfar, R., Beirle, S., Denier van der Gon, H., Jonkers, S., Kuenen, J., Petetin, H., Zhang, Q., Beekmann, M., and Wagner, T.: Estimation of the Paris NOx emissions from mobile MAX-DOAS observations and CHIMERE model simulations during the MEGAPOLI campaign using the closed integral method, Atmos. Chem. Phys., 17, 7853–7890, https://doi.org/10.5194/acp-17-7853-2017, 2017.
Silvern, R. F., Jacob, D. J., Mickley, L. J., Sulprizio, M. P., Travis, K. R., Marais, E. A., Cohen, R. C., Laughner, J. L., Choi, S., Joiner, J., and Lamsal, L. N.: Using satellite observations of tropospheric NO2 columns to infer long-term trends in US NOx emissions: the importance of accounting for the free tropospheric NO2 background, Atmos. Chem. Phys., 19, 8863–8878, https://doi.org/10.5194/acp-19-8863-2019, 2019.
Solomon, S., Schmeltekopf, A. L., and Sanders, R. W.: On the interpretation of zenith sky absorption measurements, J. Geophys. Res.-Atmos., 92, 8311–8319, https://doi.org/10.1029/JD092iD07p08311, 1987.
Song, Z., Fu, D., Zhang, X., Wu, Y., Xia, X., He, J., Han, X., Zhang, R., and Che, H.: Diurnal and seasonal variability of PM2.5 and AOD in North China plain: Comparison of MERRA-2 products and ground measurements, Atmos. Environ., 191, 70–78, https://doi.org/10.1016/j.atmosenv.2018.08.012, 2018.
Souri, A. H., Choi, Y., Jeon, W., Woo, J.-H., Zhang, Q., and Kurokawa, J.-I.: Remote sensing evidence of decadal changes in major tropospheric ozone precursors over East Asia, J. Geophys. Res.-Atmos., 122, 2474–2492, https://doi.org/10.1002/2016JD025663, 2017.
Streets, D. G., Canty, T., Carmichael, G. R., de Foy, B., Dickerson, R. R., Duncan, B. N., Edwards, D. P., Haynes, J. A., Henze, D. K., Houyoux, M. R., Jacob, D. J., Krotkov, N. A., Lamsal, L. N., Liu, Y., Lu, Z., Martin, R. V., Pfister, G. G., Pinder, R. W., Salawitch, R. J., and Wecht, K. J.: Emissions estimation from satellite retrievals: A review of current capability, Atmos. Environ., 77, 1011–1042, https://doi.org/10.1016/j.atmosenv.2013.05.051, 2013.
Sun, Y., Palm, M., Weinzierl, C., Petri, C., Notholt, J., Wang, Y., and Liu, C.: Technical note: Sensitivity of instrumental line shape monitoring for the ground-based high-resolution FTIR spectrometer with respect to different optical attenuators, Atmos. Meas. Tech., 10, 989–997, https://doi.org/10.5194/amt-10-989-2017, 2017.
Sun, Y., Liu, C., Chan, K., Wang, W., Shan, C., Hu, Q., and Liu, J.: The Influence of Instrumental Line Shape Degradation on the Partial Columns of O3, CO, CH4 and N2O Derived from High-Resolution FTIR Spectrometry, Remote Sens.-Basel, 10, 2041, https://doi.org/10.3390/rs10122041, 2018a.
Sun, Y., Palm, M., Liu, C., Hase, F., Griffith, D., Weinzierl, C., Petri, C., Wang, W., and Notholt, J.: The influence of instrumental line shape degradation on NDACC gas retrievals: total column and profile, Atmos. Meas. Tech., 11, 2879–2896, https://doi.org/10.5194/amt-11-2879-2018, 2018b.
Sun, Y., Liu, C., Palm, M., Vigouroux, C., Notholt, J., Hu, Q., Jones, N., Wang, W., Su, W., Zhang, W., Shan, C., Tian, Y., Xu, X., De Mazière, M., Zhou, M., and Liu, J.: Ozone seasonal evolution and photochemical production regime in the polluted troposphere in eastern China derived from high-resolution Fourier transform spectrometry (FTS) observations, Atmos. Chem. Phys., 18, 14569–14583, https://doi.org/10.5194/acp-18-14569-2018, 2018c.
Sun, Y., Liu, C., Zhang, L., Palm, M., Notholt, J., Yin, H., Vigouroux, C., Lutsch, E., Wang, W., Shan, C., Blumenstock, T., Nagahama, T., Morino, I., Mahieu, E., Strong, K., Langerock, B., De Mazière, M., Hu, Q., Zhang, H., Petri, C., and Liu, J.: Fourier transform infrared time series of tropospheric HCN in eastern China: seasonality, interannual variability, and source attribution, Atmos. Chem. Phys., 20, 5437–5456, https://doi.org/10.5194/acp-20-5437-2020, 2020.
Sun, Y., Yin, H., Liu, C., Zhang, L., Cheng, Y., Palm, M., Notholt, J., Lu, X., Vigouroux, C., Zheng, B., Wang, W., Jones, N., Shan, C., Qin, M., Tian, Y., Hu, Q., Meng, F., and Liu, J.: Mapping the drivers of formaldehyde (HCHO) variability from 2015 to 2019 over eastern China: insights from Fourier transform infrared observation and GEOS-Chem model simulation, Atmos. Chem. Phys., 21, 6365–6387, https://doi.org/10.5194/acp-21-6365-2021, 2021a.
Sun, Y., Yin, H., Lu, X., Notholt, J., Palm, M., Liu, C., Tian, Y., and Sun, Y., Yin, H., Lu, X., Notholt, J., Palm, M., Liu, C., Tian, Y., and Zheng, B.: The drivers and health risks of unexpected surface ozone enhancements over the Sichuan Basin, China, in 2020, Atmos. Chem. Phys., 21, 18589–18608, https://doi.org/10.5194/acp-21-18589-2021, 2021b.
Sun, Y., Yin, H., Cheng, Y., Zhang, Q., Zheng, B., Notholt, J., Lu, X., Liu, C., Tian, Y., and Liu, J.: Quantifying variability, source, and transport of CO in the urban areas over the Himalayas and Tibetan Plateau, Atmos. Chem. Phys., 21, 9201–9222, https://doi.org/10.5194/acp-21-9201-2021, 2021c.
Sun, Y., Yang, T., Gui, H., Li, X., Wang, W., Duan, J., Mao, S., Yin, H., Zhou, B., Lang, J., Zhou, H., Liu, C., and Xie, P.: Atmospheric environment monitoring technology and equipment in China: A review and outlook, J. Environ. Sci., in press, https://doi.org/10.1016/j.jes.2022.01.014, 2022.
Tao, Y., Huang, W., Huang, X., Zhong, L., Lu, S. E., Li, Y., Dai, L., Zhang, Y., and Zhu, T.: Estimated acute effects of ambient ozone and nitrogen dioxide on mortality in the Pearl River Delta of southern China, Environ. Health Perspect., 120, 393–398, https://doi.org/10.1289/ehp.1103715, 2012.
van Geffen, J. H. G. M., Boersma, K. F., Van Roozendael, M., Hendrick, F., Mahieu, E., De Smedt, I., Sneep, M., and Veefkind, J. P.: Improved spectral fitting of nitrogen dioxide from OMI in the 405–465 nm window, Atmos. Meas. Tech., 8, 1685–1699, https://doi.org/10.5194/amt-8-1685-2015, 2015.
Vrekoussis, M., Richter, A., Hilboll, A., Burrows, J. P., Gerasopoulos, E., Lelieveld, J., Barrie, L., Zerefos, C., and Mihalopoulos, N.: Economic crisis detected from space: Air quality observations over Athens/Greece, Geophys. Res. Lett., 40, 458–463, https://doi.org/10.1002/grl.50118, 2013.
Wallace, J. and Kanaroglou, P.: The sensitivity of OMI-derived nitrogen dioxide to boundary layer temperature inversions, Atmos. Environ., 43, 3596–3604, https://doi.org/10.1016/j.atmosenv.2009.03.049, 2009.
Wang, S., Xing, J., Chatani, S., Hao, J., Klimont, Z., Cofala, J., and Amann, M.: Verification of anthropogenic emissions of China by satellite and ground observations, Atmos. Environ., 45, 6347–6358, https://doi.org/10.1016/j.atmosenv.2011.08.054, 2011.
Wang, Y., Yang, K., Pan, Z., Qin, J., Chen, D., Lin, C., Chen, Y., Lazhu, Tang, W., Han, M., Lu, N., and Wu, H.: Evaluation of Precipitable Water Vapor from Four Satellite Products and Four Reanalysis Datasets against GPS Measurements on the Southern Tibetan Plateau, J. Clim., 30, 5699–5713, https://doi.org/10.1175/JCLI-D-16-0630.1, 2017.
Xu, W. Y., Zhao, C. S., Ran, L., Deng, Z. Z., Liu, P. F., Ma, N., Lin, W. L., Xu, X. B., Yan, P., He, X., Yu, J., Liang, W. D., and Chen, L. L.: Characteristics of pollutants and their correlation to meteorological conditions at a suburban site in the North China Plain, Atmos. Chem. Phys., 11, 4353–4369, https://doi.org/10.5194/acp-11-4353-2011, 2011.
Xue, R., Wang, S., Li, D., Zou, Z., Chan, K. L., Valks, P., Saiz-Lopez, A., and Zhou, B.: Spatio-temporal variations in NO2 and SO2 over Shanghai and Chongming Eco-Island measured by Ozone Monitoring Instrument (OMI) during 2008–2017, J. Clean. Prod., 258, 120563, https://doi.org/10.1016/j.jclepro.2020.120563, 2020.
Yin, H., Sun, Y., Liu, C., Zhang, L., Lu, X., Wang, W., Shan, C., Hu, Q., Tian, Y., Zhang, C., Su, W., Zhang, H., Palm, M., Notholt, J., and Liu, J.: FTIR time series of stratospheric NO2 over Hefei, China, and comparisons with OMI and GEOS-Chem model data, Opt. Express, 27, A1225–A1240, https://doi.org/10.1364/OE.27.0A1225, 2019.
Yin, H., Sun, Y., Liu, C., Lu, X., Smale, D., Blumenstock, T., Nagahama, T., Wang, W., Tian, Y., Hu, Q., Shan, C., Zhang, H., and Liu, J.: Ground-based FTIR observation of hydrogen chloride (HCl) over Hefei, China, and comparisons with GEOS-Chem model data and other ground-based FTIR stations data, Opt. Express, 28, 8041–8055, https://doi.org/10.1364/OE.384377, 2020.
Yin, H., Liu, C., Hu, Q., Liu, T., Wang, S., Gao, M., Xu, S., Zhang, C., and Su, W.: Opposite impact of emission reduction during the COVID-19 lockdown period on the surface concentrations of PM2.5 and O3 in Wuhan, China, Environ. Pollut., 289, 117899, https://doi.org/10.1016/j.envpol.2021.117899, 2021a.
Yin, H., Lu, X., Sun, Y., Li, K., Gao, M., Zheng, B., and Liu, C.: Unprecedented decline in summertime surface ozone over eastern China in 2020 comparably attributable to anthropogenic emission reductions and meteorology, Environ. Res. Lett., 16, 124069, https://doi.org/10.1088/1748-9326/ac3e22, 2021b.
Yin, H., Sun, Y., Liu, C., Wang, W., Shan, C., and Zha, L.: Remote Sensing of Atmospheric Hydrogen Fluoride (HF) over Hefei, China with Ground-Based High-Resolution Fourier Transform Infrared (FTIR) Spectrometry, Remote Sens.-Basel, 13, 791, https://doi.org/10.3390/rs13040791, 2021c.
Yin, H., Sun, Y., Wang, W., Shan, C., Tian, Y., and Liu, C.: Ground-based high-resolution remote sensing of sulphur hexafluoride (SF6) over Hefei, China: characterization, optical misalignment, influence, and variability, Opt. Express, 29, 34051–34065, https://doi.org/10.1364/OE.440193, 2021d.
Zhai, S., Jacob, D. J., Wang, X., Shen, L., Li, K., Zhang, Y., Gui, K., Zhao, T., and Liao, H.: Fine particulate matter (PM2.5) trends in China, 2013–2018: separating contributions from anthropogenic emissions and meteorology, Atmos. Chem. Phys., 19, 11031–11041, https://doi.org/10.5194/acp-19-11031-2019, 2019.
Zhang, L., Lee, C. S., Zhang, R., and Chen, L.: Spatial and temporal evaluation of long term trend (2005–2014) of OMI retrieved NO2 and SO2 concentrations in Henan Province, China, Atmos. Environ., 154, 151–166, https://doi.org/10.1016/j.atmosenv.2016.11.067, 2017.
Zhang, R., Tie, X., and Bond, D. W.: Impacts of anthropogenic and natural NOx sources over the U.S. on tropospheric chemistry, P. Natl. Acad. Sci. USA, 100, 1505, https://doi.org/10.1073/pnas.252763799, 2003.
Zhang, S., Wang, S., Zhang, R., Guo, Y., Yan, Y., Ding, Z., and Zhou, B.: Investigating the Sources of Formaldehyde and Corresponding Photochemical Indications at a Suburb Site in Shanghai From MAX-DOAS Measurements, J. Geophys. Res.-Atmos., 126, e2020JD033351, https://doi.org/10.1029/2020JD033351, 2021.
Zhao, S., Yu, Y., Yin, D., He, J., Liu, N., Qu, J., and Xiao, J.: Annual and diurnal variations of gaseous and particulate pollutants in 31 provincial capital cities based on in situ air quality monitoring data from China National Environmental Monitoring Center, Environ. Int., 86, 92–106, https://doi.org/10.1016/j.envint.2015.11.003, 2016.
Zhao, Z. and Wang, Y.: Influence of the West Pacific subtropical high on surface ozone daily variability in summertime over eastern China, Atmos. Environ., 170, 197–204, https://doi.org/10.1016/j.atmosenv.2017.09.024, 2017.
Zheng, B., Tong, D., Li, M., Liu, F., Hong, C., Geng, G., Li, H., Li, X., Peng, L., Qi, J., Yan, L., Zhang, Y., Zhao, H., Zheng, Y., He, K., and Zhang, Q.: Trends in China's anthropogenic emissions since 2010 as the consequence of clean air actions, Atmos. Chem. Phys., 18, 14095–14111, https://doi.org/10.5194/acp-18-14095-2018, 2018a.
Zheng, C., Zhao, C., Li, Y., Wu, X., Zhang, K., Gao, J., Qiao, Q., Ren, Y., Zhang, X., and Chai, F.: Spatial and temporal distribution of NO2 and SO2 in Inner Mongolia urban agglomeration obtained from satellite remote sensing and ground observations, Atmos. Environ., 188, 50–59, https://doi.org/10.1016/j.atmosenv.2018.06.029, 2018b.
Zheng, F., Yu, T., Cheng, T., Gu, X., and Guo, H.: Intercomparison of tropospheric nitrogen dioxide retrieved from Ozone Monitoring Instrument over China, Atmos. Pollut. Res., 5, 686–695, https://doi.org/10.5094/APR.2014.078, 2014.
Zhou, C., Wang, K., and Ma, Q.: Evaluation of Eight Current Reanalyses in Simulating Land Surface Temperature from 1979 to 2003 in China, J. Clim., 30, 7379–7398, https://doi.org/10.1175/JCLI-D-16-0903.1, 2017.
- Abstract
- Introduction
- Data and method
- Temporal–spatial variabilities of NO2 VCDtrop over the Yangtze River Delta
- Implications and drivers
- Conclusions
- Code and data availability
- Author contributions
- Competing interests
- Disclaimer
- Acknowledgements
- Financial support
- Review statement
- References
- Supplement