the Creative Commons Attribution 4.0 License.
the Creative Commons Attribution 4.0 License.
 | 24 Mar 2022
The impact of peripheral circulation characteristics of typhoon on sustained ozone episodes over the Pearl River Delta region, China
Xiangjun Zhao
Xuejiao Deng
Jinhui Gao
The peripheral circulation of typhoon forms sustained ozone episodes. However, how it impacts the day-to-day ozone pollution levels during the episodes has not been clearly studied, which is crucial for better prediction of the daily ozone variation. In this study, the analysis of ground observation, wind profile data, and model simulation is integrated. By analysing the wind profile radar observations, we found a weak wind deepening (WWD; vertical depth of the weak winds increased), more correlated with the ground-level ozone variation than surface weak wind. Long-term statistical analyses showed that the WWD is a common weather phenomenon in the peripheral subsidence region of typhoons and is generally accompanied by ozone pollution episodes. The Weather Research and Forecasting model coupled with Chemistry (WRF-Chem) with process analysis simulation showed that the peripheral subsidence chemical formation (CHEM) and vertical mixing (VMIX) effects are two major contributors to the enhancement of ozone levels to form the episode, while the advection (ADV) showed negative values. However, the day-to-day variation of the daytime ozone levels during the episode is not determined by the daily variation of daytime CHEM and VMIX but is dominated by the ADV terms. Therefore, the ozone and its precursors accumulation, including the enhancement during the night-time, contribute to the daytime ozone increase in the following day. A detail day-to-day process analysis showed that in additional to decrease of negative ADV values (e.g. the weakened advection outflow or dispersion) on the ground, the integrated effect of the daily variation of the accumulative CHEM and ADV above the ground throughout the planetary boundary layer (PBL) together determined the overall day-to-day daytime ozone variation on the ground through the VMIX process. The results indicate that the peripheral characteristics of approaching typhoon not only form the ozone episode by the enhanced photochemical reactions, but also could increase the day-to-day daytime ozone levels via pollution accumulation throughout the PBL due to the WWD up to 3–5 km. These results illustrate the important role of the WWD in the lower troposphere for the formation of sustained ozone episodes due to the peripheral circulation of the typhoon, which helps to better predict the daily changes of daytime ozone levels.
- Article
(6084 KB) - Full-text XML
-
Supplement
(3167 KB) - BibTeX
- EndNote


The Pearl River Delta (PRD), located in the coastal region of southern China and often affected by typhoon systems, has experienced major economic development and urbanization accompanied by a large increase in air pollution and decrease in visibility (Wang et al., 1998, 2001; Lai and Sequeira, 2001). Ozone pollution is the most significant air pollution challenge in this region and has been the “primary pollutant” since 2014 (Ministry of Ecology and Environment of China, 2016). Ozone is harmful to human health and has adverse effects on vegetation and crops, among others (Aunan et al., 2000; Felzer et al., 2007; Feng et al., 2015). Ozone concentrations are determined by the photochemical reactions of its precursors and local meteorological conditions. However, ozone pollution episodes are mainly triggered by weather conditions rather than by sudden increases from emission sources (Ziomas et al., 1995; Giorgi and Meleux, 2007; Lin et al., 2019; Li et al., 2018).
There are many studies (Gao et al., 2018) that have classified the weather patterns affecting regional pollution events into several types, such as cold fronts, cold high-pressure systems moving towards the sea, uniform pressure fields, Western Pacific subtropical high (WPSH), tropical cyclone (TC) peripheries, and weak cold high-pressure ridges. Using observational data, several studies have reported the impacts of TC activity on meteorological factors that are favourable for air pollution over the PRD region (Feng et al., 2007; Chen et al., 2008; Wu et al., 2013). TCs are typical weather systems responsible for both high ozone and PM2.5 pollution over the PRD (Chen et al., 2008; Deng et al., 2019).
Previous studies in the PRD and other coastal regions of China have illustrated the significant impact of TCs on forming ozone (TC-ozone) episodes (Zhang et al., 2012, 2013; Li et al., 2013, 2014; Jiang et al., 2015; Huang et al., 2015; Shu et al., 2016, 2019; Tan et al., 2018; Chen et al., 2018; Han et al., 2020). TC-ozone episodes generally occur when there are weather conditions such as high temperatures, radiation flux, low relative humidity, and weak wind (Cheng et al., 2016; Liu et al., 2017). Observation-based studies have reported that the TC-ozone episodes are associated with weak wind; however the mechanism underlying the effect of weak wind on ozone in TC-ozone episodes remains to be fully elucidated. In addition, previous process analysis based on numerical modelling simulations have shown that the chemical (CHEM) and vertical mixing (VMIX) effects are two major contributors to ozone episodes, whereas advective transport (ADV) is generally a consumptive process (Shu et al., 2016; Wang et al., 2010). The inconsistencies between observational and simulated results of wind contributions to ozone episodes are poorly understood, which may be attributed to the limited data on the influence of weak wind on ozone concentration enhancement.
In addition, for the air quality forecast and prevention, it is important to understand the mechanism underlying the day-to-day variation of the daytime ozone levels, since the ozone levels peak during the daytime due to photochemical effects; ozone is converted to NO2 temporarily in the absence of light (Li et al., 2012). However, though the TC-ozone episodes have been widely reported, the studies of mechanism on the daily daytime variation of during sustained TC-ozone episodes are limited.
Thus, the objective of this study is to understand the impact processes of typhoon circulation characteristics on the day-to-day variation of daytime ozone concentration in TC-ozone episode. The analysis of ground observation, wind profile data, and Weather Research and Forecasting model coupled with Chemistry (WRF-Chem) simulation with process analysis is integrated. Detailed data and model description are provided in Sect. 2, followed by the results and discussion in Sect. 3. The main conclusions are summarized in Sect. 4.
2.1 Data
In this study, hourly surface ozone concentrations from 2016 over mainland China were obtained from the Ministry of Environmental Protection of China. The 3D wind profiler data, automatic weather station data, cloud data, and solar radiation measurements were provided by the China Meteorological Administration and were used for the meteorological analyses of Typhoon Nepartak. The Final (FNL) Operational Global Analysis data used to describe the circulation of Typhoon Nepartak have a horizontal resolution of with 27 vertical levels and were obtained from the National Centers for Environmental Prediction (NCEP), USA .
The observations of a typical ozone episode that occurred in the PRD region during 7–10 July 2016 (local standard time, LST) before Typhoon Nepartak made landfall were collected and analysed. Typhoon Nepartak intensified into a supertyphoon at 20:00 LT on 5 July, then gradually moved northwest due to the forcing of the WPSH over its northeastern side (Fig. S2 in the Supplement). At 05:50 on 8 July, the typhoon made landfall in Taitung County, Taiwan, with a maximum wind speed of 60 m s−1, and again in Shishi City, Fujian, at 14:00 on 9 July, with a maximum wind speed of 23 m s−1. At 03:00 on 10 July, the typhoon weakened into a tropical depression.
2.2 Model descriptions
WRF-Chem is a widely used and fully coupled online 3D Eulerian chemical transport model (https://ruc.noaa.gov/wrf/wrf-chem/, last access: 8 March 2022) that considers both chemical and physical processes (Zhang et al., 2010; Forkel et al., 2012); version 3.9.1.1 was applied in this study. Detailed descriptions of the meteorological and chemical aspects of the WRF-Chem model have been previously reported by Grell et al. (2005) and Skamarock et al. (2008). For the simulation, two nested domains (Fig. S1 in the Supplement) were set up with horizontal resolutions of 27 and 9 km and grids of 283×184 and 223×163 for the parent domain (D1) and nested domain (D2), respectively. D1 was centred at 28.5∘ N, 114.0∘ E, covering most of China, the surrounding countries, and the ocean. Corresponding simulations provided meteorological and chemical boundary conditions for D2, which covered most of southern China.
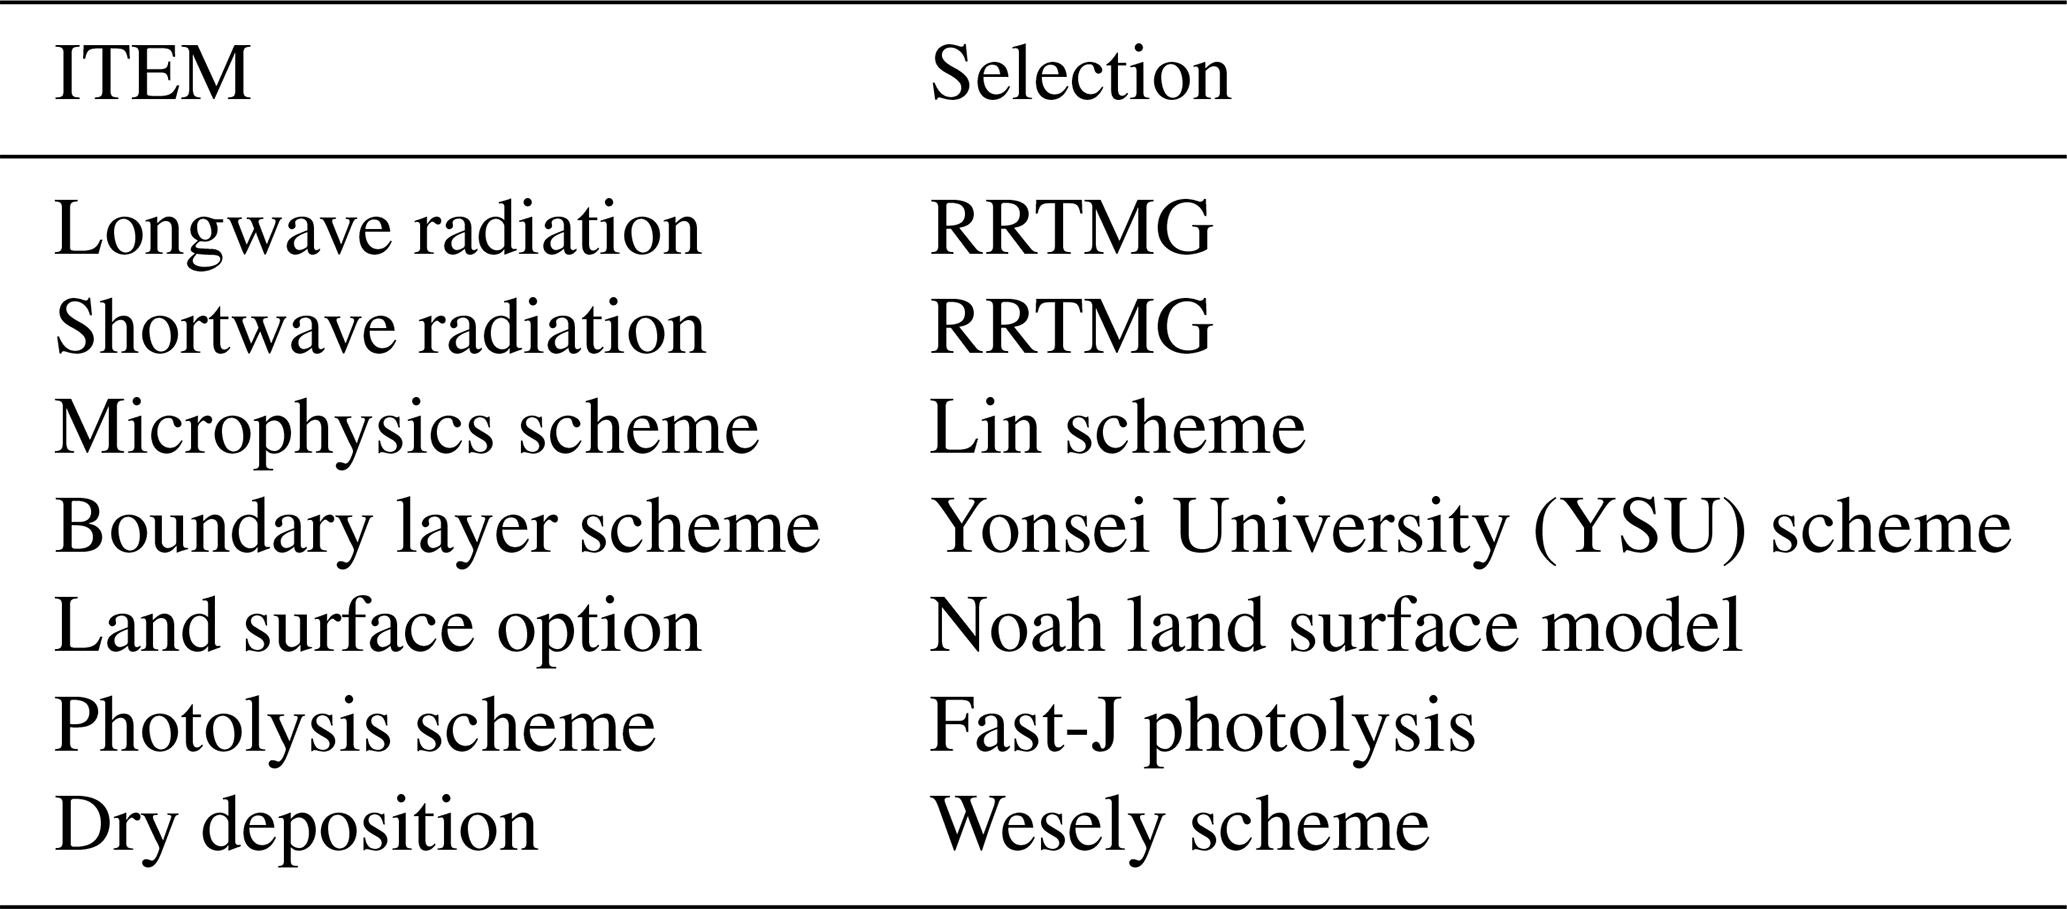
There were 39 vertical layers that extended from the surface up to a pressure maximum of 50 hPa, 12 of which were located in the lowest 2 km to fully describe the vertical structure of the planetary boundary layer (PBL). Carbon Bond Mechanism Z (CBM-Z), which includes 133 chemical reactions for 53 species and extends the model framework to function for a longer time period and at a larger spatial scale than its predecessor, was used as the gas-phase chemical mechanism (Zaveri and Peters, 1999). The corresponding aerosol chemical mechanism was the Model for Simulating Aerosol Interactions and Chemistry (MOSAIC) with eight bins (Zaveri et al., 2008), which is extremely efficient and does not compromise accuracy of the aerosol model calculations. Other major model configuration settings are listed in Table 1.
Table 1Major model configuration options used in the simulations.
3.1 Episodic data analysis
The ozone pollution level and the meteorological conditions of the typhoon Nepartak case were first analysed. As shown in Fig. 1, Guangdong Province experienced severe ozone pollution during the period 7–10 July; 28 % (7 July) to 57 % (10 July) of the air quality stations in Guangdong Province exceeded the national air quality standard level-II for ozone (200 µg m−3) at the daily peaks (16:00 LST). To show the vertical motion of the typhoon centre and peripheral region, we constructed a cross section through the typhoon system (points A and B; Fig. 2a–d) and plotted the corresponding vertical velocities (Fig. 2e–h) using the NCEP data. As shown in Fig. 2e and f, the western subsiding branches of vertical typhoon circulation were located over the PRD during 7 and 8 July, when ozone concentrations increased significantly compared to those of 6 July. After Typhoon Nepartak made landfall at Shishi City on 9 July, the peripheral subsidence had moved to the western area of the PRD region (Fig. 2g and h) and the PRD region was influenced by weak vertical motion and a weak horizontal wind field. Peak ozone levels exceeded 100 ppb at most of the monitoring stations in the PRD at this time. On 11 July, Typhoon Nepartak dissipated, and the surface ozone concentrations began to decrease (Fig. 1f).
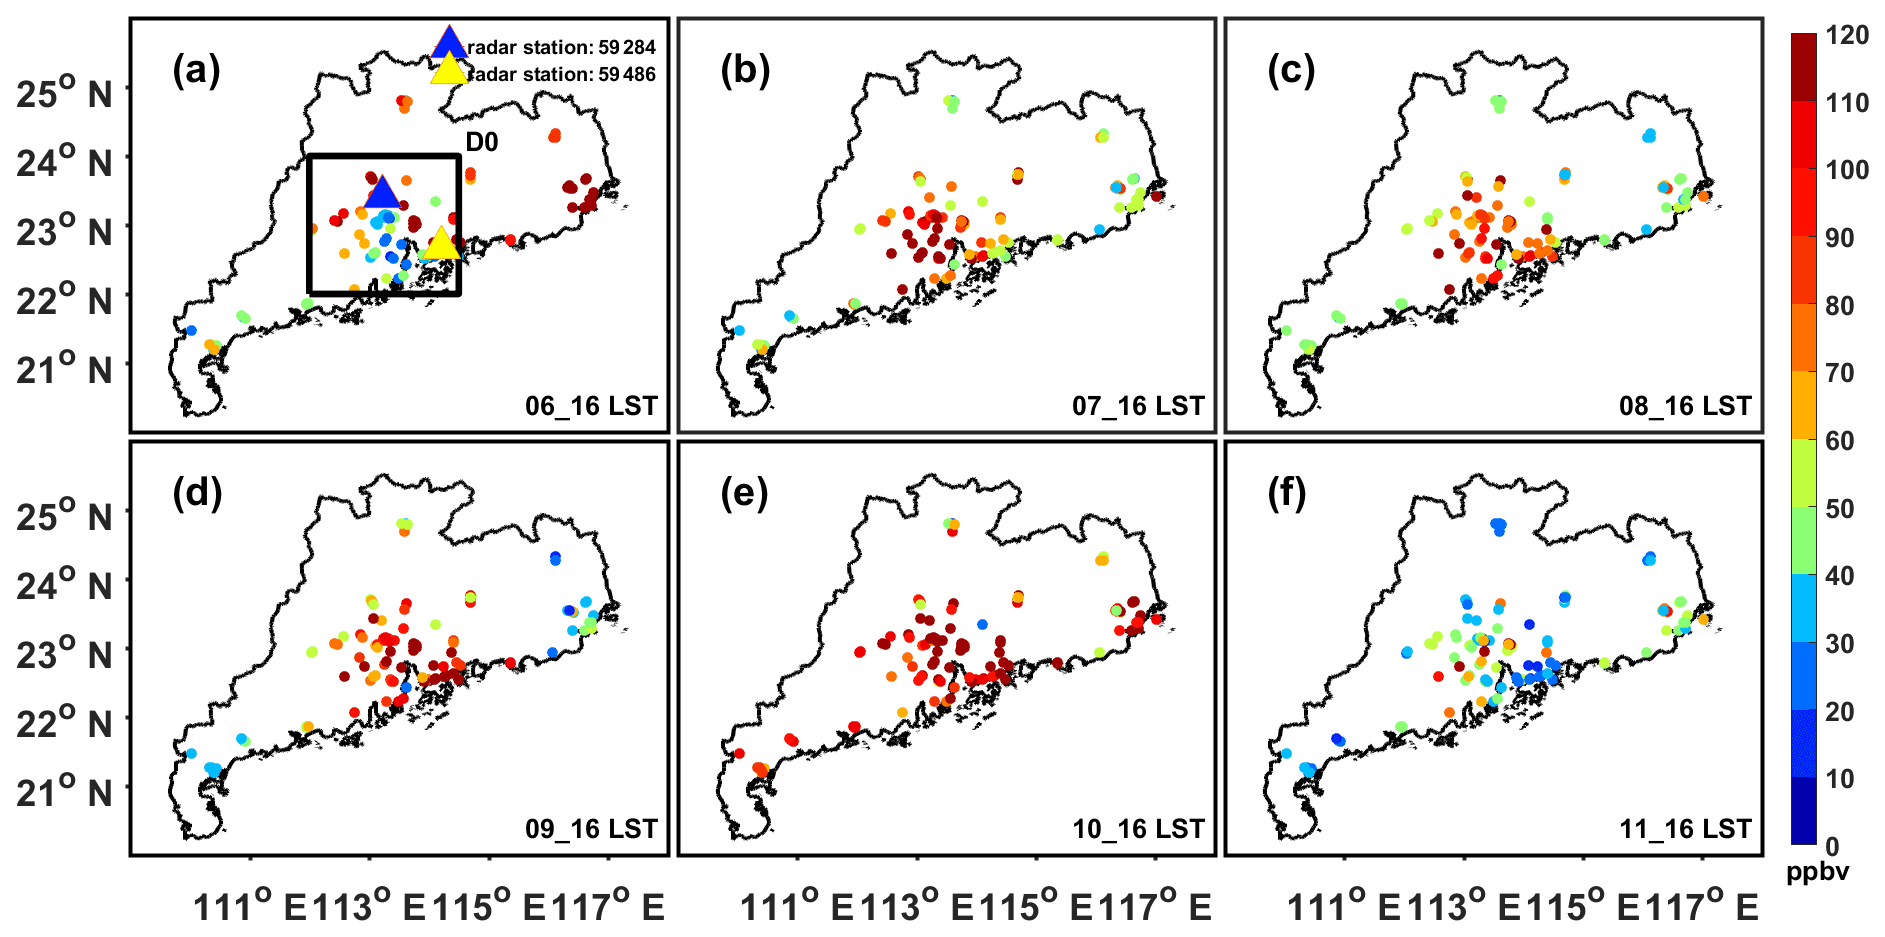
Figure 1The horizontal distribution of surface ozone concentration over PRD at 16:00 from (a) 6 July 2016 to (f) 11 July 2016. The yellow and blue triangles in (a) denote the positions of wind profiler stations 59 486 and 59 284. The black box denoted D0 indicates the area where the severe ozone pollution event occurred.
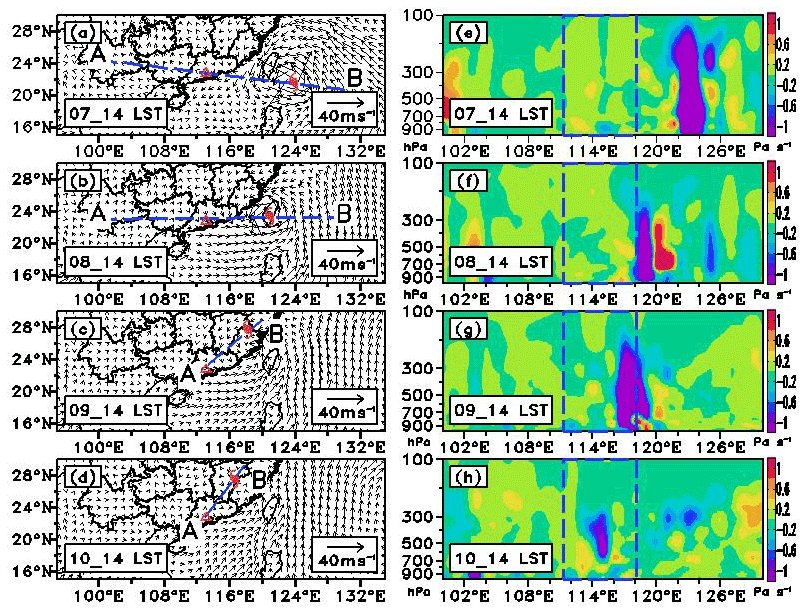
Figure 2(a–d) The 1000 hPa wind vectors of NCEP-FNL data from 14:00 (7 July) to 14:00 (10 July) with red triangle and typhoon symbols representing the locations of the PRD centre and Nepartak, respectively. (e–h) Vertical cross sections of vertical velocity along the four straight lines linking PRD and the centres of Typhoon Nepartak in (a–d) from 14:00 on 7 July to 14:00 on 10 July 2016. The four dashed blue boxes denote the longitude range of PRD in (e–h).
The weather over the PRD region was characterized as clear sky, strong solar radiation (Fig. 3a), low relative humidity (Fig. 3b), and high temperatures (Fig. 3c), when the subsiding branches of vertical typhoon circulation were located over the PRD during 7 and 8 July (Fig. 2e and f). The variations in these surface meteorological variables exhibited favourable conditions for increasing ozone concentrations (Cheng et al., 2016; Liu et al., 2017). However, the height of the PBL increased significantly on 8 and 9 July (Fig. 3c), and the atmosphere was under unstable conditions, which was indicated by the comparison between the adiabatic lapse rate (blue) and the environmental lapse rate (red) (Fig. 3d–f). This instability is also shown by the large values of convective available potential energy (CAPE; Fig. 3d–f), which is another criterion used to determine the stability of atmosphere. When the CAPE is ∼1000 J kg−1, the state of atmosphere is unstable, which is favourable for thermal convection. These results illustrate that, under the control of typhoon periphery, the PBL height can be increased in unstable atmospheric conditions, which is opposite from the observations in some TC-related haze events reported in previous studies (Wu et al., 2005; Feng et al., 2007). For example, Wu et al. (2005) reported that the TC produces a strong descending motion in the lower troposphere, a weak surface wind speeds, and a lower PBL. Our results indicated that the TC-ozone episodes are not dependent on or necessarily associated with the enhancement of atmospheric thermal–dynamical stability and/or reduction of the PBL.
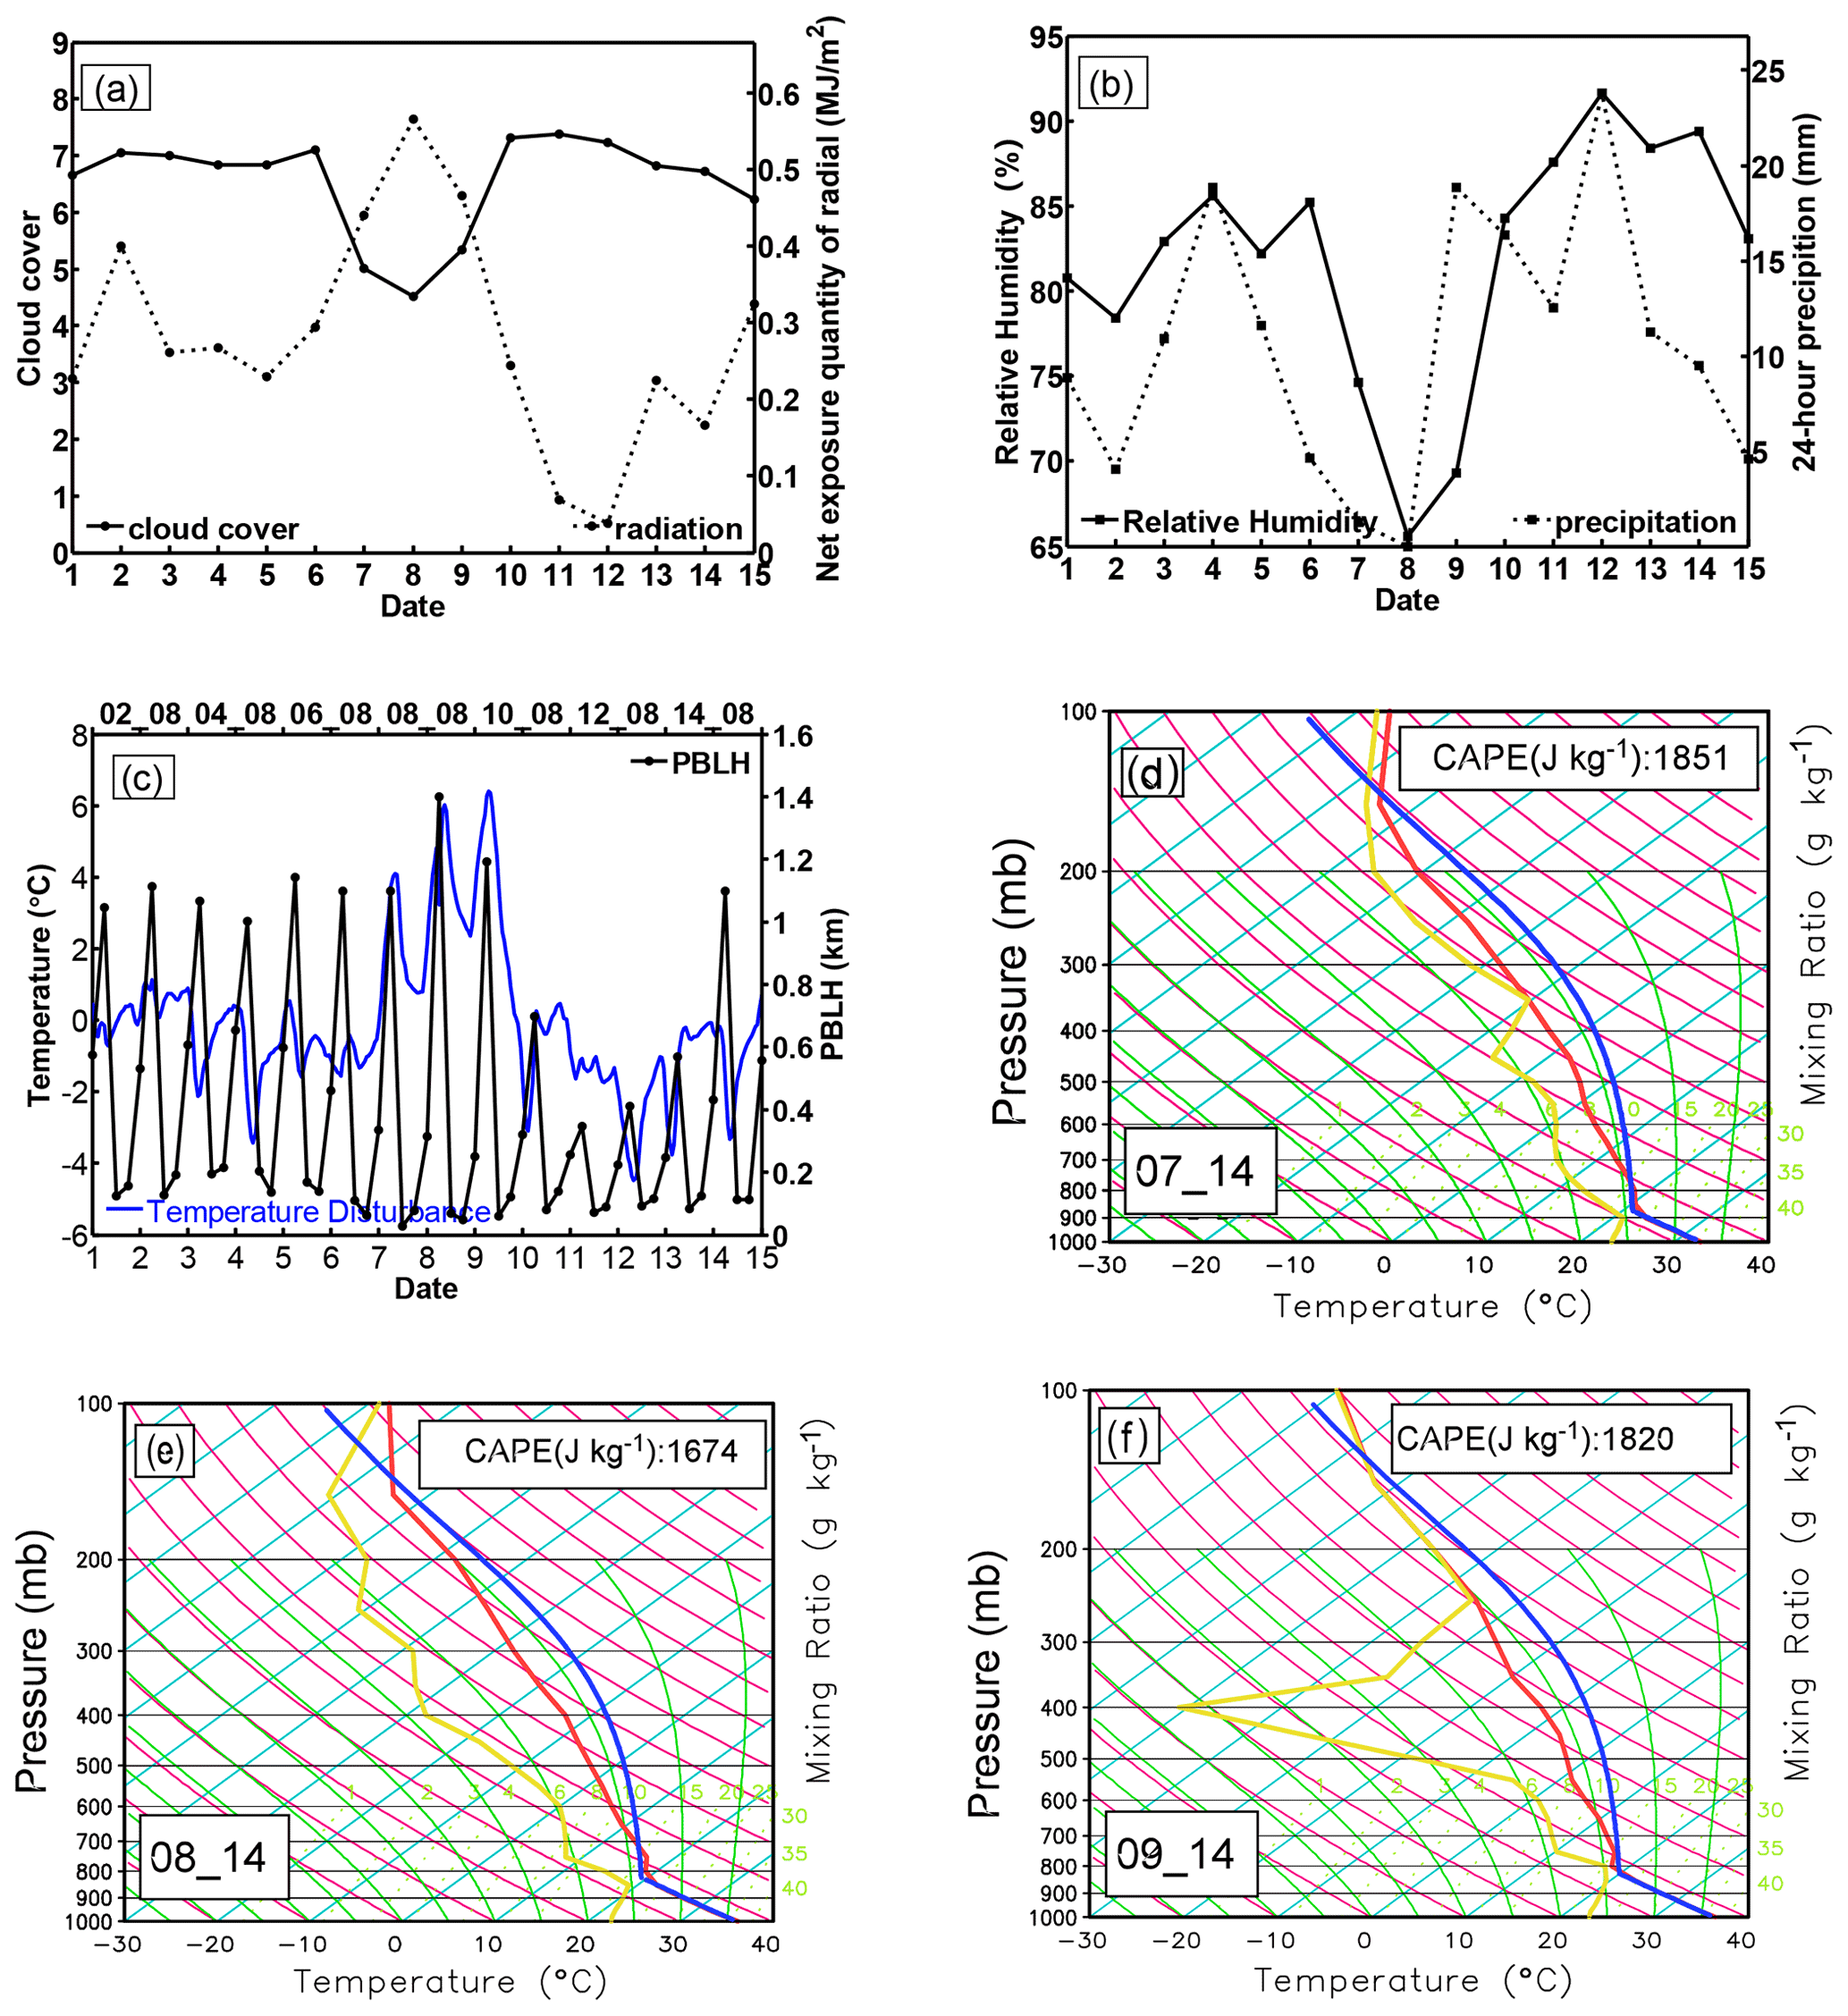
Figure 3Time series of diurnal mean (a) cloud cover, radiation at 59 287 observation station, (b) relative humidity, 24 h precipitation, and averaged (c) planetary boundary layer height (PBLH) and temperature anomaly of region D0 from 1 to 15 July. The SkewTLogP at 14:00 on 7 (d), 8 (e), and 9 July (f). The solid thick red, blue, and yellow lines in (d, e, and f) denote the temperature sounding, the parcel path from the surface upward, and the dew point sounding, respectively.
The evolution of the vertical profile of horizontal winds at representative station 59 284 is shown in Fig. 4a. Before 5 July, the wind speed increased with the vertical atmospheric layers. There were relatively larger wind speeds above the PBL and weaker wind speeds below ∼700 m, with relatively low surface ozone concentrations (<40 ppbv). On 5 July, the daily ozone concentration started to increase (>70 ppbv) as the depth of WWD increased. The depth of WWD was ∼3 km during 7–9 July, with a sustained increase in ozone peak. On the night of 11 July, the horizontal wind speed above ∼1 km significantly increased, while the ozone concentration decreased. Variations in the wind profile and surface ozone at another representative station are also shown in Fig. 4b. At this station, the depth of WWD started to increase on 7 July, with a gradual increase in ozone peak value. Co-variations of the ozone concentration and WWD at other radar stations were also observed (Figs. S3–S5 in the Supplement). This co-variation is not a local effect but a regional phenomenon.
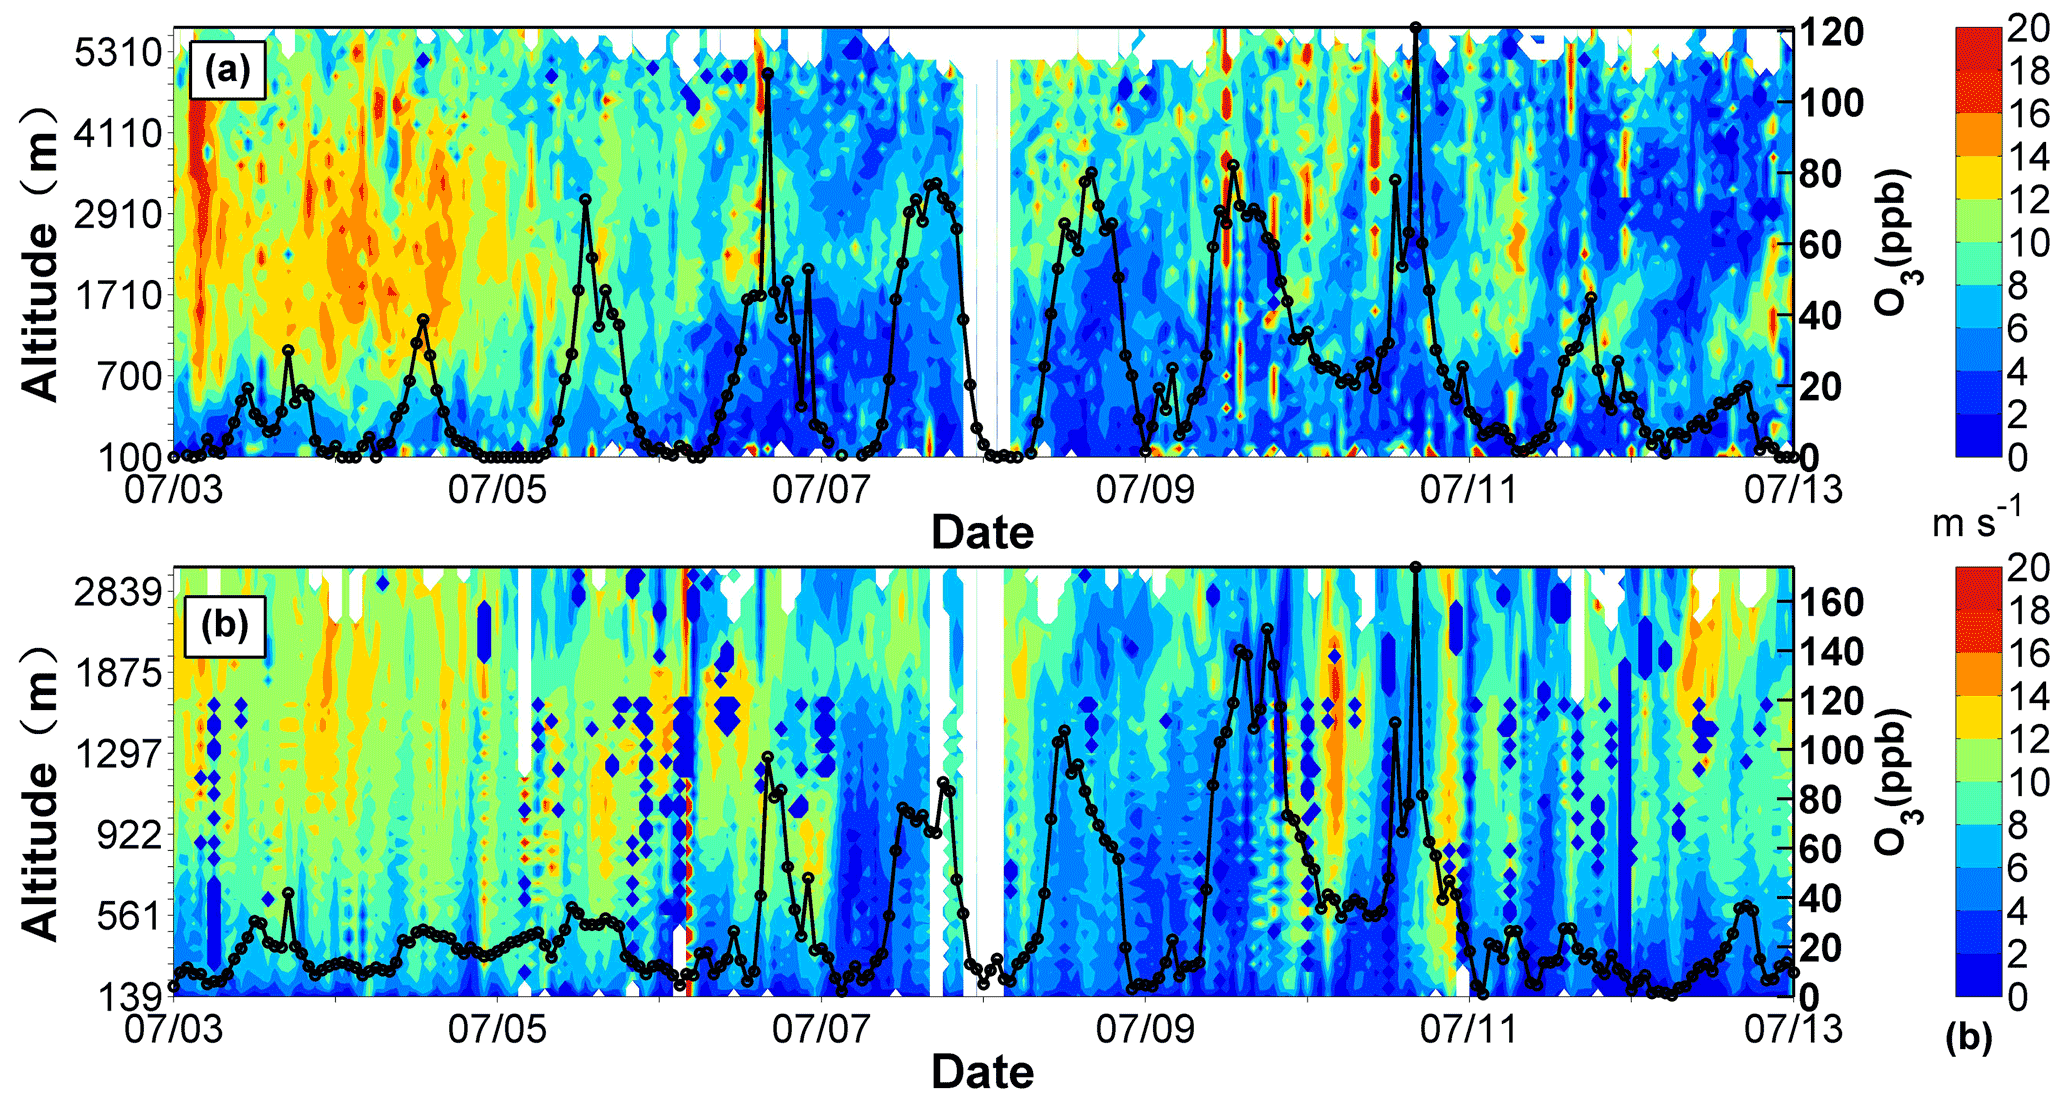
Figure 4The profile evolution of horizontal wind speed from 3 to 13 July. The solid black lines are the surface ozone concentrations at (a) 59 284 and (b) 59 486 wind profile radar stations.
By analysing the wind profile data (Fig. 4), we observed that the vertical depth of the horizontal weak wind generally increased from the surface up to the lower troposphere (∼2–3 km) and the surface ozone concentration changed with the vertical depth of the horizontal weak wind. To further illustrate the different impact of the surface weak wind and the WWD on surface ozone concentrations, the correlation coefficients between the surface ozone concentrations and the average wind speeds from the surface to different altitudes (up to 6 km) at different radar stations were calculated (Fig. 5). The correlation coefficients showed an increasing trend with altitude, reaching maximum values between 2–3 km and remaining stable above ∼2.5 km. The average correlation coefficient at the surface was 0.57 (0.41–0.67), and the average correlation coefficient above 2000 km was ∼0.75 (0.69–0.83) for seven radar stations. This indicates the potential impact of WWD on the ozone pollution episode induced by Typhoon Nepartak.
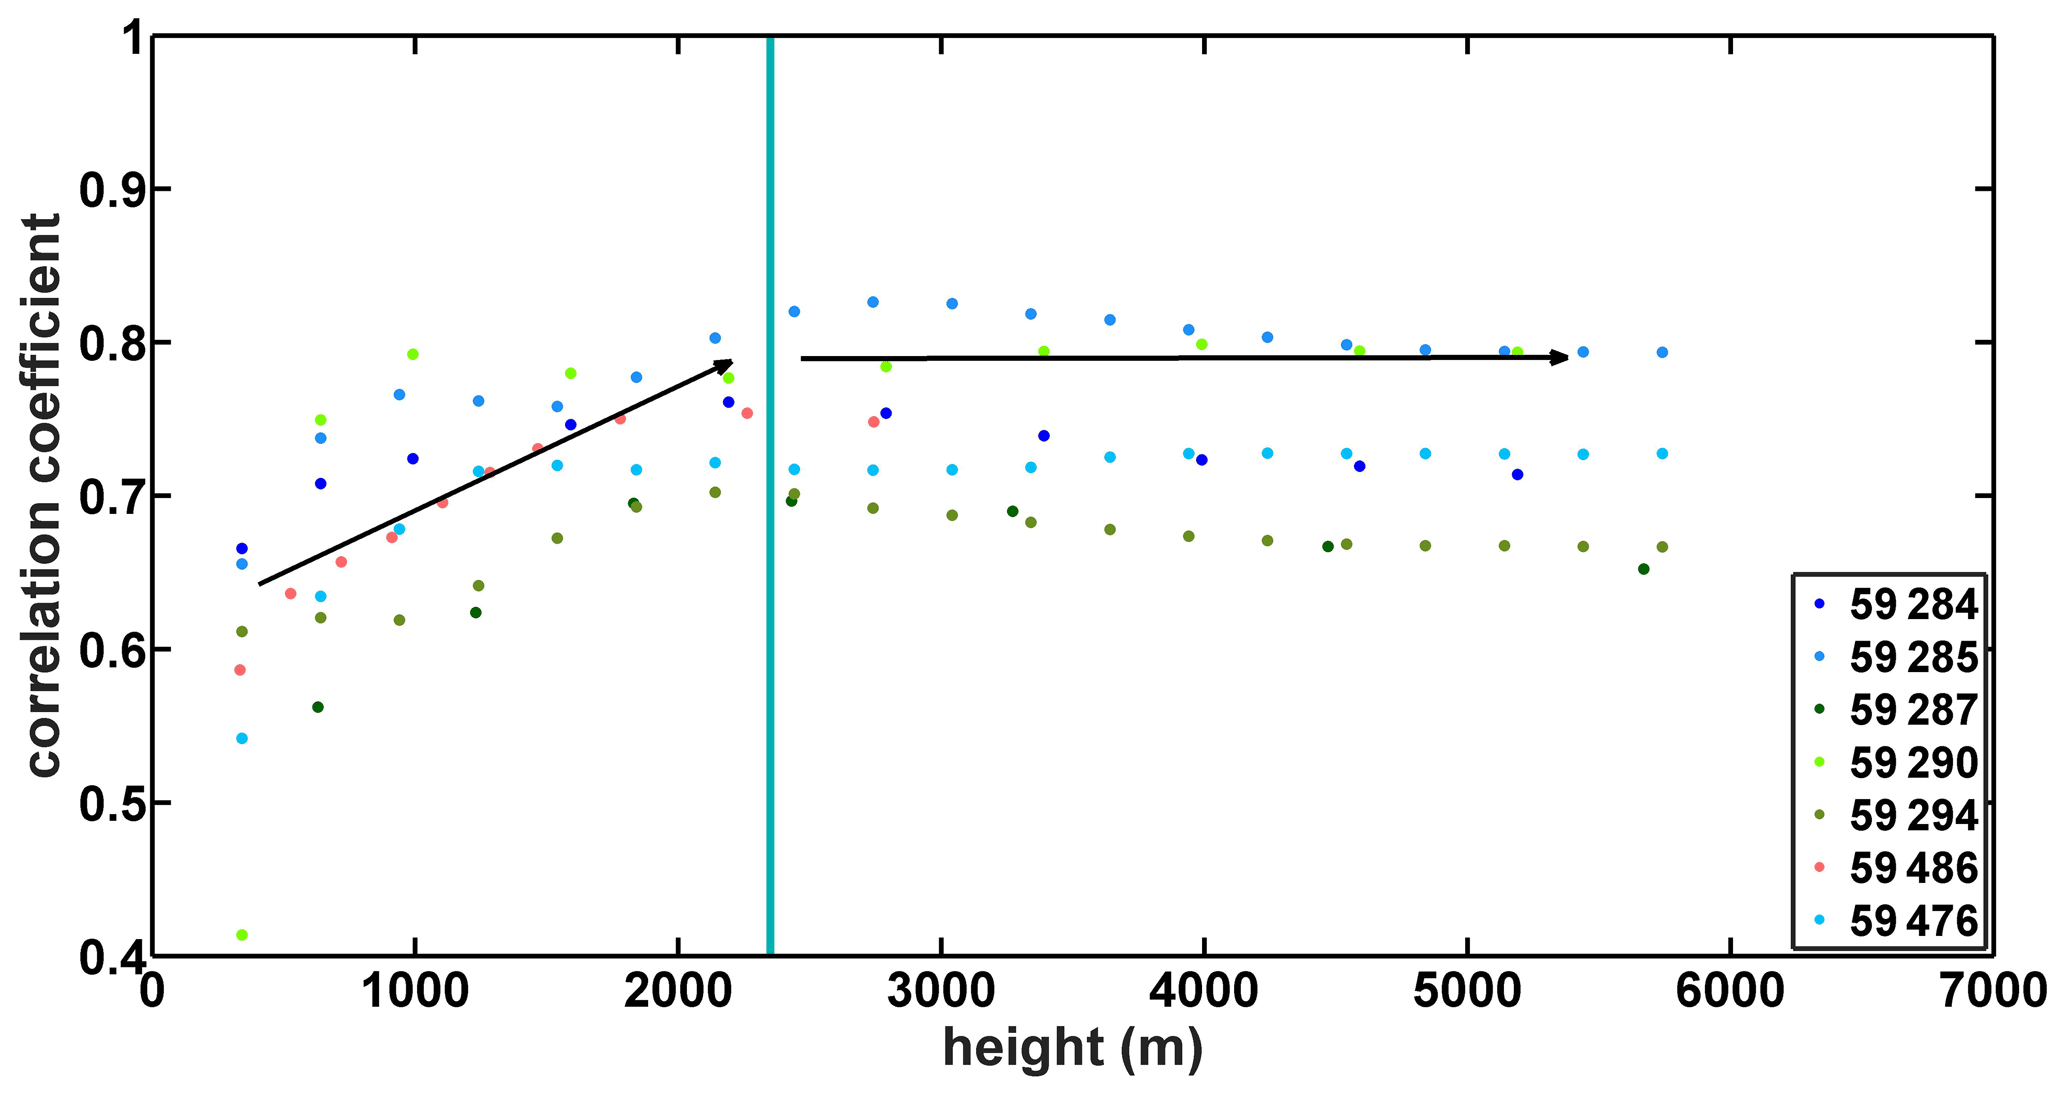
Figure 5Correlation coefficient between the evolution of average wind speed and the evolution of ground ozone concentration in different altitude ranges of each wind profile radar station.
3.2 Long-term statistical analysis of the relationship between WWD and the ozone episode
Long-term statistical analysis showed no stable atmospheric stratification and a decrease in the height of the boundary layer in this ozone pollution episode. The analysis of wind profile radar data and the correlation coefficients between the surface ozone concentrations and the average wind speeds between the surface and the altitude of each vertical layer (up to 6 km) indicated that in this episode of ozone pollution, WWD might have played an important role in the increase of ozone pollution at the surface. Guangdong Province is located on the western coast of the Pacific Ocean and is frequently affected by typhoons. To investigate whether the relationship between WWD and ground-level O3 only occurred in this case study or is a common phenomenon, a long-term statistical analysis of historical data was conducted. A statistical analysis of tropical cyclone wind fields in the Northwestern Pacific Ocean from 2014 to 2018 (based on Guangdong wind profiler data) was conducted. As not all the radar stations in Guangdong Province are available during a typhoon, the available statistics number of each radar station for the 38 typhoons were recorded as M. The number of WWD instances at each radar station was recorded as n. Ozone concentrations above 100 µg m−3 are harmful to human health (WHO, 2005).
The PRD regional background ozone concentration is generally less than 80–100 µg m−3, and the ozone concentrations at most stations can exceed 160 µg m−3 (national AQ standard level-I) during a regional ozone pollution event. Therefore, ozone concentrations of 100–160 and above 160 µg m−3 were used to denote regional light and heavy ozone pollution in the statistics. The numbers of regional light and heavy ozone pollution events at each radar station were recorded as n1 and n2, respectively. As shown in Table 2, the number of WWD occurrences (n) accounts for 87 %–97 % of the available number(M) of radar stations in the 38 typhoon statistics for the seven radar stations. The average value of for the seven radar stations is 93 %. This indicates that, when there is a tropical cyclone in the Northwestern Pacific Ocean, WWD occurs in the whole of Guangdong Province or part of it. The number of ozone pollution occurrences (n1+n2) accounts for 78 %–100 % of the number of WWD occurrences(n). The average value of for the seven radar stations is 94 %. The above statistical results show that WWD may be a common phenomenon on the periphery of typhoons and is often accompanied by significant increases in ozone concentrations.
Table 2The statistical results of the peripheral weak wind of 38 tropical cyclones for seven radar stations in Guangdong Province and ozone concentration from 2014 to 2018.
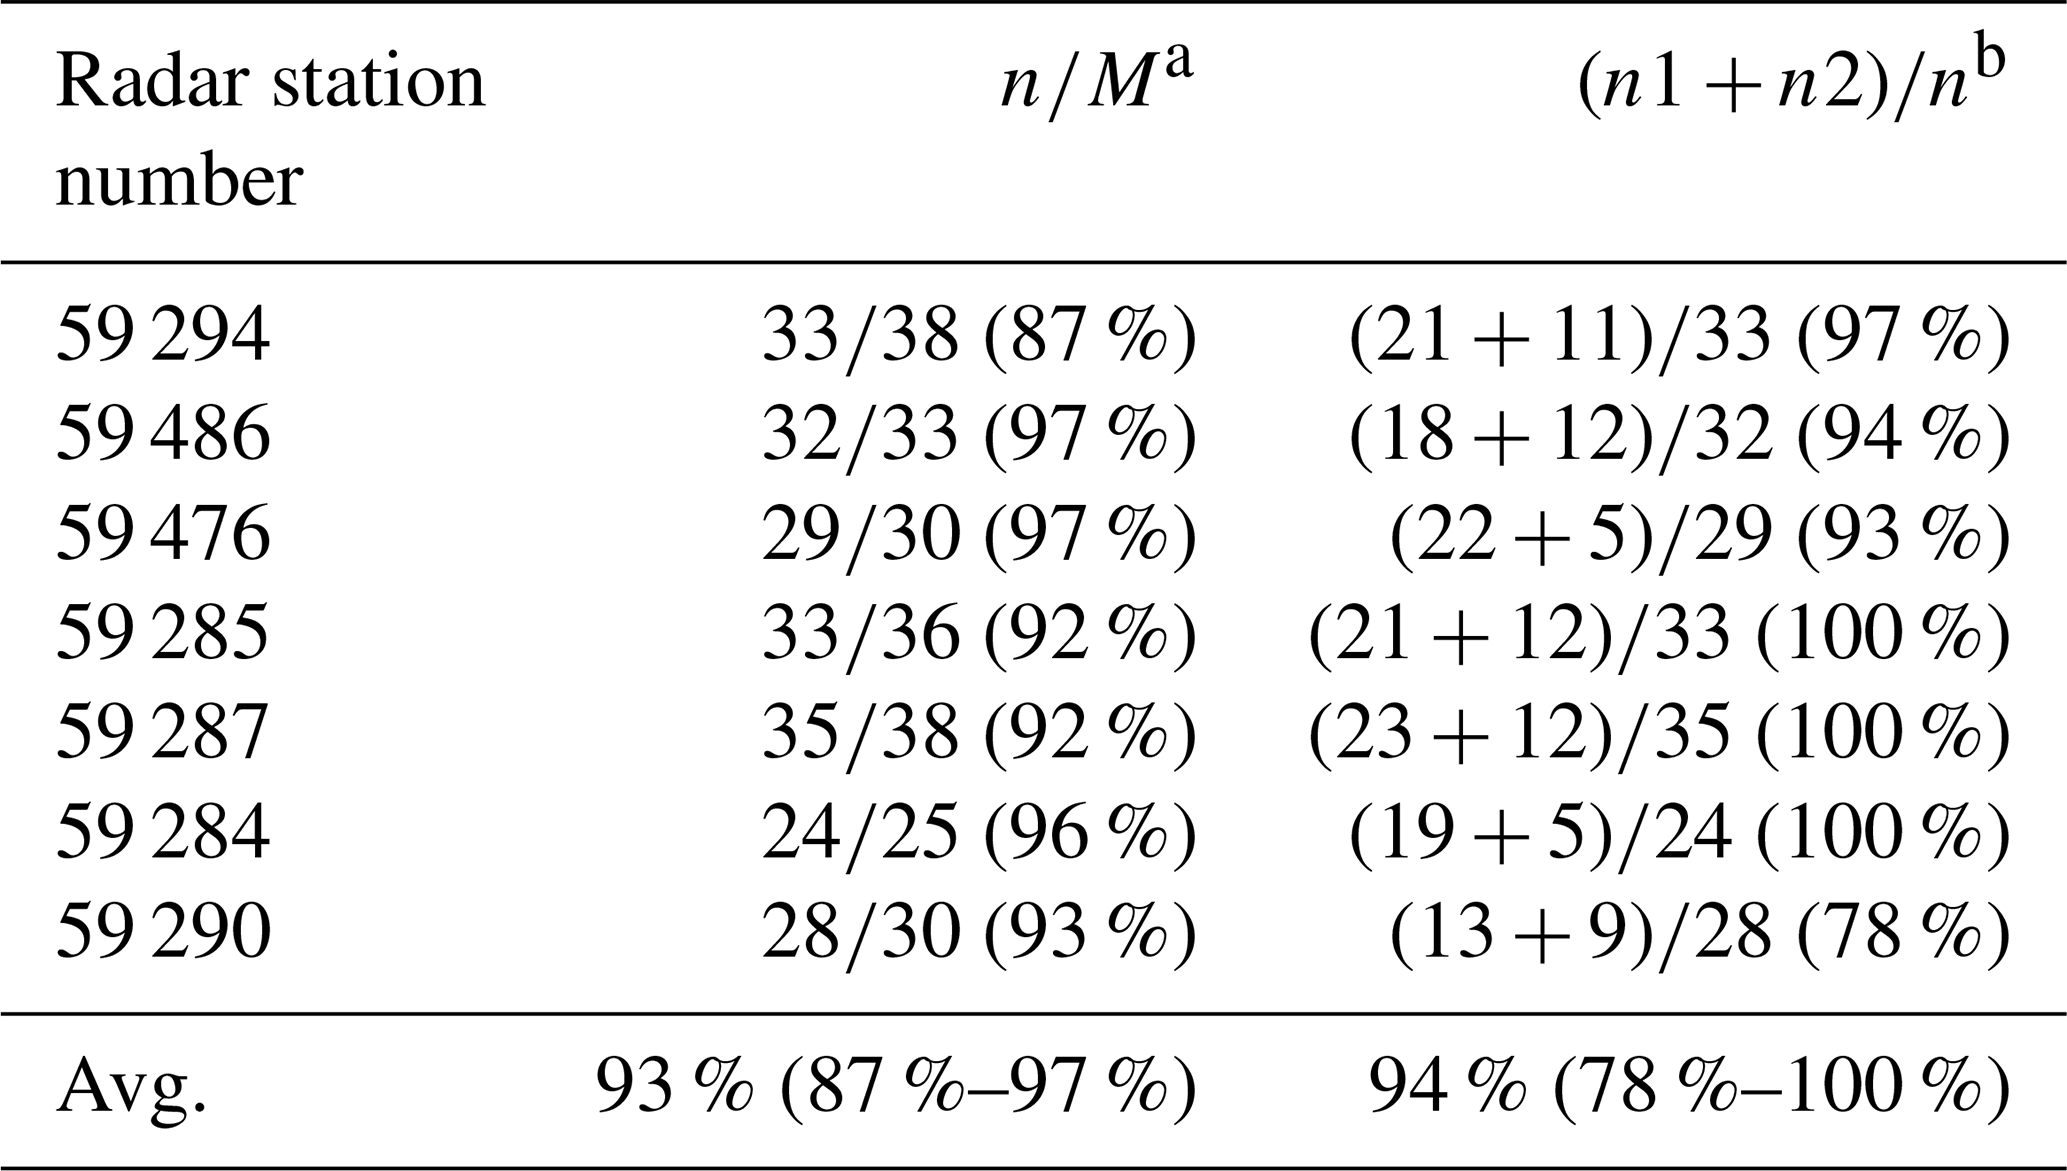
a represents the percentage of the number of WWD occurrences of the effective observation number of radar station in 38 typhoons. b represents the percentage of the number of ozone pollution occurrences of the number of WWD occurrences in 38 typhoons.
The above correlation coefficients and statistical analysis indicate that WWD may be a common weather phenomenon in the periphery of typhoon and could impact the ground-level ozone concentration. In the subsequent section, the influence of WWD on ground-level ozone pollution and the impact of typhoon peripheral circulation on sustained ozone enhancement during Typhoon Nepartak are discussed based on the WRF-Chem numerical simulation.
3.3 Model simulation and validation
To investigate the impact of typhoon periphery and WWD on formation of the sustained ozone episode, the numerical model with the process analysis was applied, prior to which the model performance was validated using the available observations. Figure S6a–d in the Supplement present the measured and simulated data for temperatures, wind speeds, wind directions, and ozone concentrations at Guangzhou from 00:00 on 3 July to 07:00 on 15 July 2016. With regards to the meteorological variables, there was good agreement between the measured and modelled results, especially the shifting wind features, implying that the model successfully captured the synoptic features. However, ozone concentrations (Fig. S6d) overestimated low values and underestimated high values. However, the simulated results and observed data agreed reasonably with each other and captured the ozone episode in the region.
Statistical metrics including the index of agreement (IOA), mean bias (MB), root mean square error (RMSE), and normalized mean bias (NMB) were used to further assess the model performance (Table 3). The IOA of the wind direction was determined according to Kwok et al. (2010), while the IOA values for the other variables were calculated as per Lu et al. (1997). Our simulation of the time series of ozone concentrations and meteorological variables was reasonable. All the meteorological parameters were close to the corresponding simulation results in the PRD region (Wang et al., 2006; Li et al., 2007; Hu et al., 2016). IOAs for temperature and wind speed (0.89 and 0.66, respectively) fulfilled the criteria (as presented in the brackets of Table 3). The model performed well at capturing the wind directions, with a small MB of 7.72∘. MBs and NMBs for temperature and wind speed exceeded the benchmarks and were comparable to the findings of Li et al. (2013), with a slight overestimation, which is probably due to the incomplete resolution of the urban morphology impact in the model (Chan et al., 2013).
Table 3Statistical comparison between the observed and simulated variables. The benchmarks are based on Emery et al. (2001) and EPA (Doll, 1991).
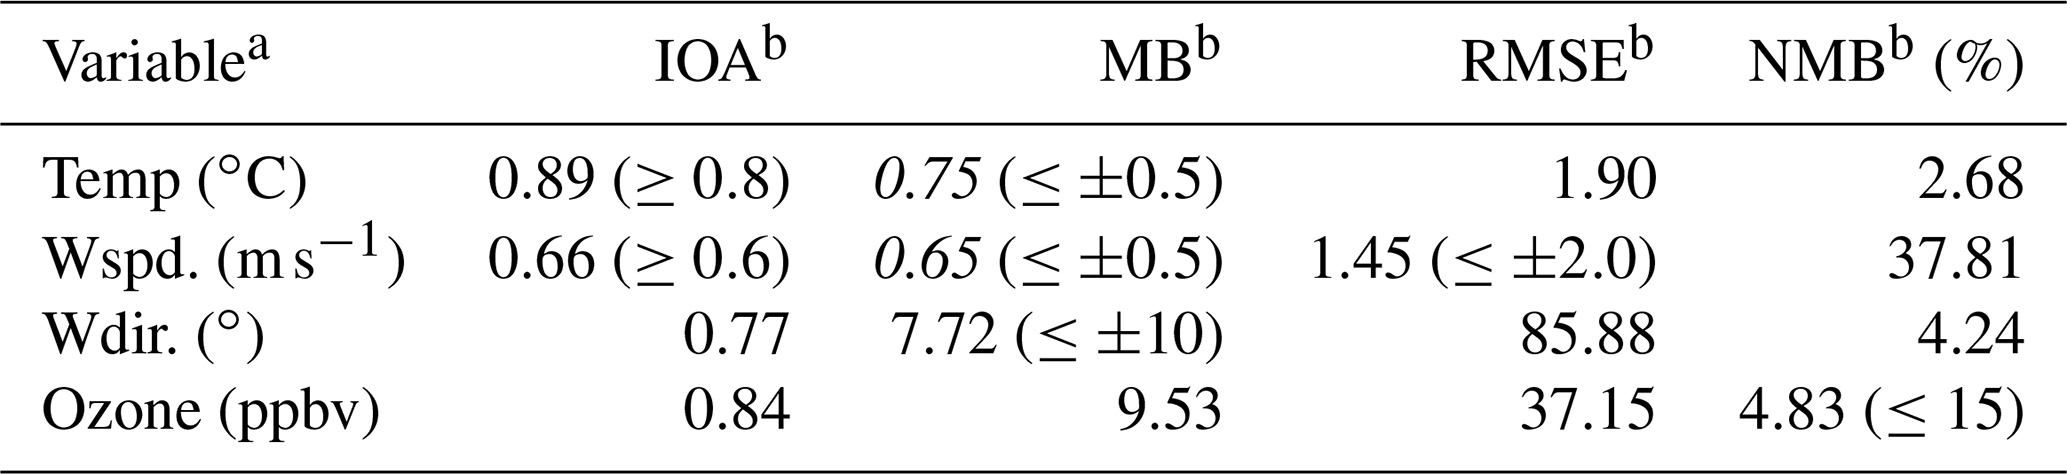
Values that did not fulfil the criteria are indicated in italics. a Temp. is temperature. Wspd. is wind speed. Wdir. is wind direction. b IOA is the index of agreement. MB is the mean bias. RMSE is the root mean square error. NMB is the normalized mean bias.
Moreover, ozone concentrations are well simulated, with an IOA of 0.84 and an NMB of 4.83. Time series comparisons of ozone concentrations and meteorological factors at Shenzhen, Zhongshan, and Zhuhai are presented in Fig. S6a1–d1, a2–d2, and a3–d3. The overall results suggest that the model could reproduce ozone concentrations and capture the transport features in southern China.
3.4 Process analysis of the impact of typhoon peripheral circulation on sustained ozone enhancement and influence mechanism of WWD on ground-level ozone
Variations in ozone concentration are directly caused by physical and chemical processes (Zhu et al., 2015); the fact that peripheral circulation of a typhoon affects ozone concentration can be discussed using an process analysis. The following processes were considered in this analysis: (1) advective transport (ADV), which is strongly related to wind and ozone concentration gradients from upwind areas to downwind areas; (2) vertical mixing (VMIX), caused by atmospheric turbulence and vertical gradients of ozone concentrations, which are related to variations in the PBL (Zhang and Rao, 1999; Gao et al., 2017); (3) chemistry (CHEM), which is the result of chemical calculations that include ozone chemical production and consumption; and (4) convective processes (CONV), i.e. the ozone contribution due to convective movements. Complete details on the analytical process of the WRF-Chem model are described in previous studies (Gao et al., 2016; Zhang et al., 2014) and in the WRF-Chem user guide.
Figure 6a shows the profile evolution of the average ozone concentrations in region D0 (black box D0 in Fig. 1) from 08:00 on 5 July to 20:00 on 10 July. The ozone concentrations gradually increased from 6–9 July throughout the PBL, with an increase in PBL height of up to ∼1.5 km. On 10 July, the PBL height decreased to less than 1 km, while the ozone concentration decreased with PBL; however, it remained high yet lower than that on 9 July. Figure 6b–e show the vertical distributions of the processes that contribute to the ozone concentrations.

Figure 6The profile evolution of averaged (a) ozone concentration and (b–e) CHEM, VMIX, CONV, and ADV of region D0 from 08:00, 5 July, to 20:00, 10 July. The black lines denote the planetary boundary layer height (PBLH).
It can be seen from Fig. 6b–e that during the period from 08:00 to 20:00 on 5–10 July, the contributions of CONV in PBL were zero; CHEM on the ground showed strong negative contributions, and VMIX on the ground showed strong positive contributions; ADV in PBL showed weak negative contributions during 6 and 7 July, and the negative contributions of ADV in PBL were strengthened on 8 and 9 July. Therefore, the contributions of ground VMIX and CHEM played a major role in the change of the PBL ozone concentrations, which is consistent with previous studies in the PRD region (Wang et al., 2010). The enhanced ozone above ground due to the CHEM effect contributed to the ground ozone enhancement through the increased VMIX effect. At the same time, changes in the strength of ADV contributions in PBL might also have a certain impact on the changes in the ozone concentrations on the ground.
In order to investigate the cause of the continued day-to-day increase of the daytime ozone concentration during the sustained ozone episode, the numerical relationship between the daytime (we used 08:00 to 20:00 in this study) average ozone concentration difference of 2 adjacent days and the various physical and chemical processes must be quantified. Based on the numerical process analysis, the difference between the daytime average ozone concentrations on two adjacent days (DDOC) can be further expressed by accumulative contribution between the periods, which can be expressed by three continuous contribution terms:
where Cd2 and Cd1 are the daytime average ozone concentrations on 2 adjacent days (see Supplement for detailed derivation). N is the total number of time slots for the daytime period between 08:00–20:00. When the right side of Eq. (1) >0, the daytime average ozone concentration will increase compared to the daytime average concentration from the previous day, and vice versa. The three terms on the right side of Eq. (1) are referred to as SUMd_d1, SUMn_d1, and SUMd_d2, respectively. SUMd_d1 and SUMd_d2 reflect the daytime contributions on 2 adjacent days. SUMn_d1 reflects the night-time contribution between the two adjacent days. Therefore, the DDOC is determined by the sum of these three terms, which we referred to as TOTAL_SUM. According to Eq. (1), TOTAL_SUM is consistent with the evolution of daytime average ozone concentration; that is, when TOTAL_SUM>0, daytime average ozone concentration increases; and when TOTAL_SUM<0, daytime average ozone concentration decreases. It can be seen from Fig. 7 that during the daytime of 6–9 July, TOTAL_SUM was positive, and the corresponding daytime average ozone concentrations gradually increased; meanwhile, on 10 July, TOTAL_SUM was negative, and daytime average ozone concentration began to decrease. The daytime SUM on 10 July remained positive. The above analyses indicate that TOTAL_SUM can well reflect the changing trend of DDOC; therefore the cause of the daily daytime ozone variation during the sustained episode can be analysed according to Eq. (1).
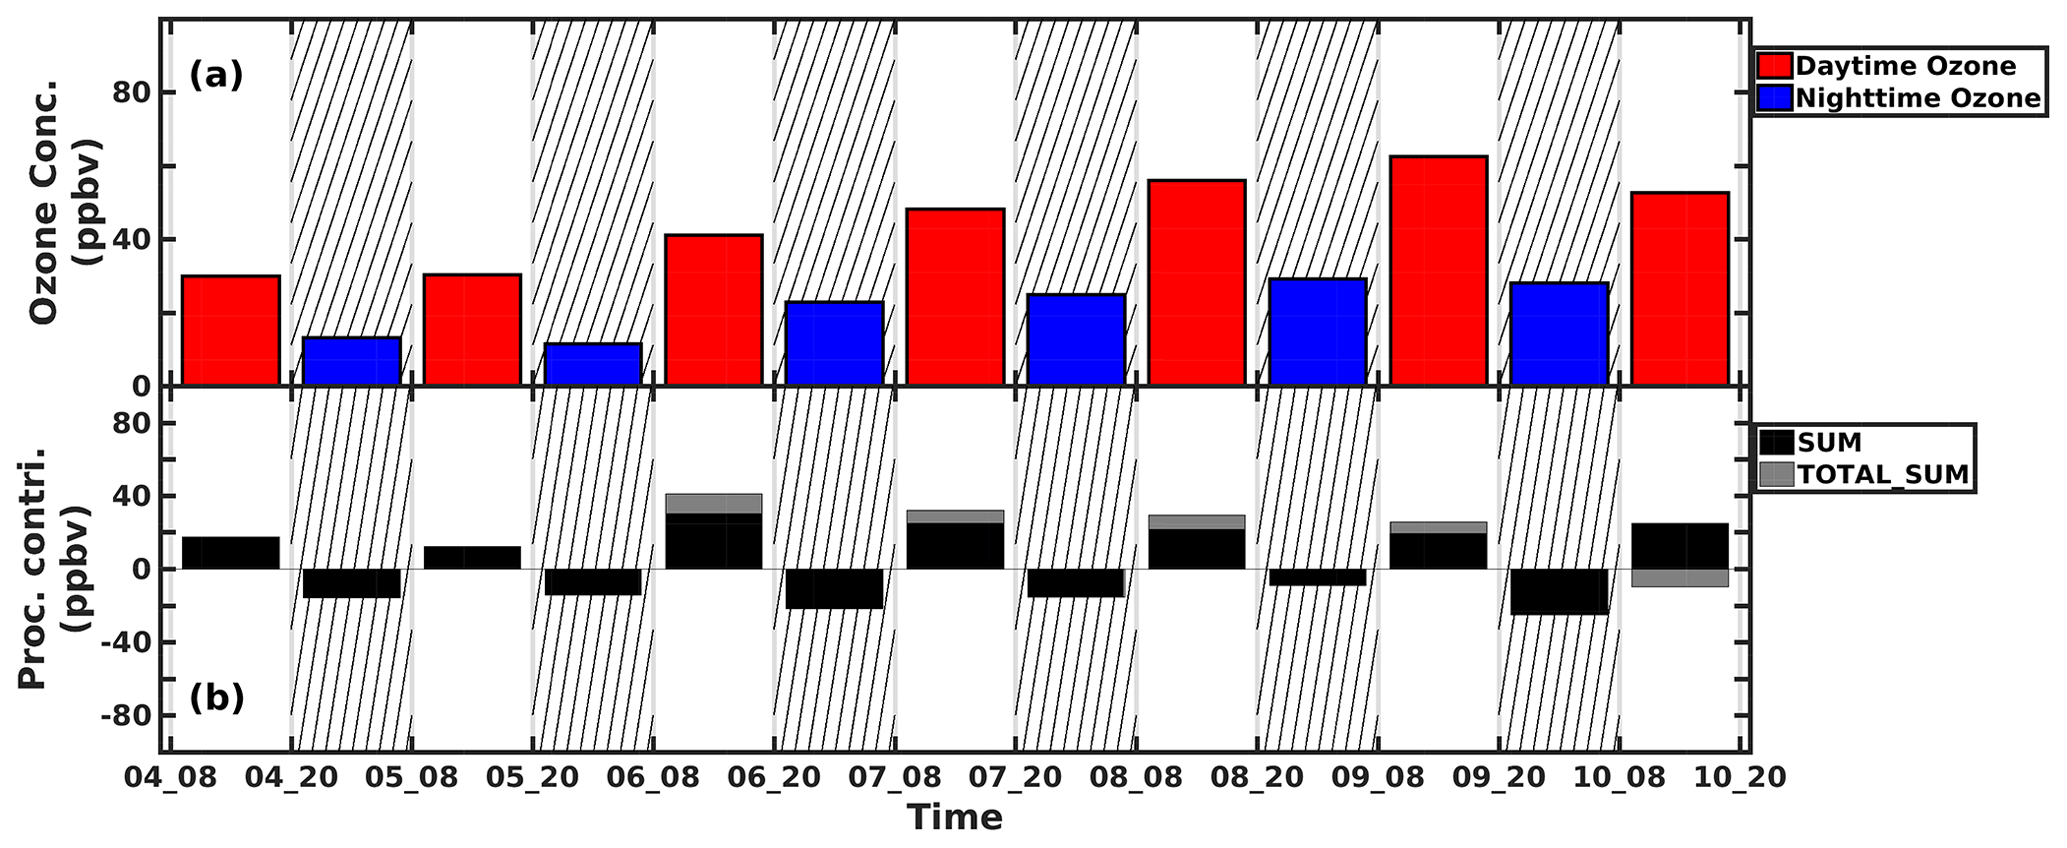
Figure 7(a) Daytime and night-time ozone concentrations and (b) SUM and TOTAL_SUM on the ground within region D0 during 08:00 on 4 July to 20:00 on 10 July.
Notably, the ozone chemistry between the daytime and night-time is different. The SUM value during daytime is always positive, while the SUM of the night-time is always negative. In terms of the daily daytime variation, the separated three terms of TOTAL_SUM reveal that the daily variation of daytime ozone level is not only determined by the daytime chemistry, but is also influenced by the night-time ozone variation between the 2 adjacent days. For example, the night-time consumption or accumulation of ozone (as well as precursors) could contribute to the daytime ozone increase of the following day; therefore, in diagnostic forecasting of daily air quality, an increase in daytime ozone level can be expected if the concentration of ozone precursors id enhanced in the previous night but the meteorological condition remains unchanged between the 2 adjacent days.
Further, DDOC or TOTAL_SUM of 2 adjacent days can be decomposed into contributions of the different processes (CHEM, VMIX, CONV, ADV). We denote the four accumulative terms as TOTAL_SUM_CHEM, TOTAL_SUM_VMIX, TOTAL_SUM_CONV and TOTAL_SUM_ADV accordingly (see Eq. 5 in the Supplement for details). The details of the budget of the TOTAL_SUM_CHEM, TOTAL_SUM_VMIX, and TOTAL_SUM_CONV during the episode between 2 adjacent days are presented in Table 4. Each column shows an accumulative contribution of different process from 08:00 to 20:00 of the next day. The results show that both the VMIX and ADV enhancement contributed to the daily increase of daytime ozone concentration from 6 to 9 July on the ground. More specifically, during the episode (columns highlighted by brown colour), the TOTAL_SUM_VMIX contributions are always positive on the ground and reach maximum from 6 to 7 July, while the TOTAL_SUM_CHEM contributions are negative, which should be the result of the surface NO-titration effect. The TOTAL_SUM_CONV contributions are relatively ignorable, while the TOTAL_SUM_ADV contributions significantly increased from negative value to positive value during the episode period. Since the CHEM and VMIX are significantly associated with each other, the combined contribution of CHEM, VMIX, and CONV to the TOTAL_SUM is shown by the TOTAL_SUM_CVC in the Table 4. The CHEM+VMIX+CONV contribution to daily daytime ozone variation changed to negative values during the episode period, which did not determine the trend of the DDOC. By comparing the accumulative effect of individual process to the combined effect of the four processes (TOTAL_SUMs), the variation of DDOC (which increased from 5 to 9 July and decreased on 10 July) was determined by the integrated effect of four processes but mainly dominated by the TOTAL_SUM_ADV (sudden change from negative values to large positive values during the episode).
Table 4The decomposed accumulative CHEM, VMIX, CONV, and ADV effects of the TOTAL_SUM on the ground.
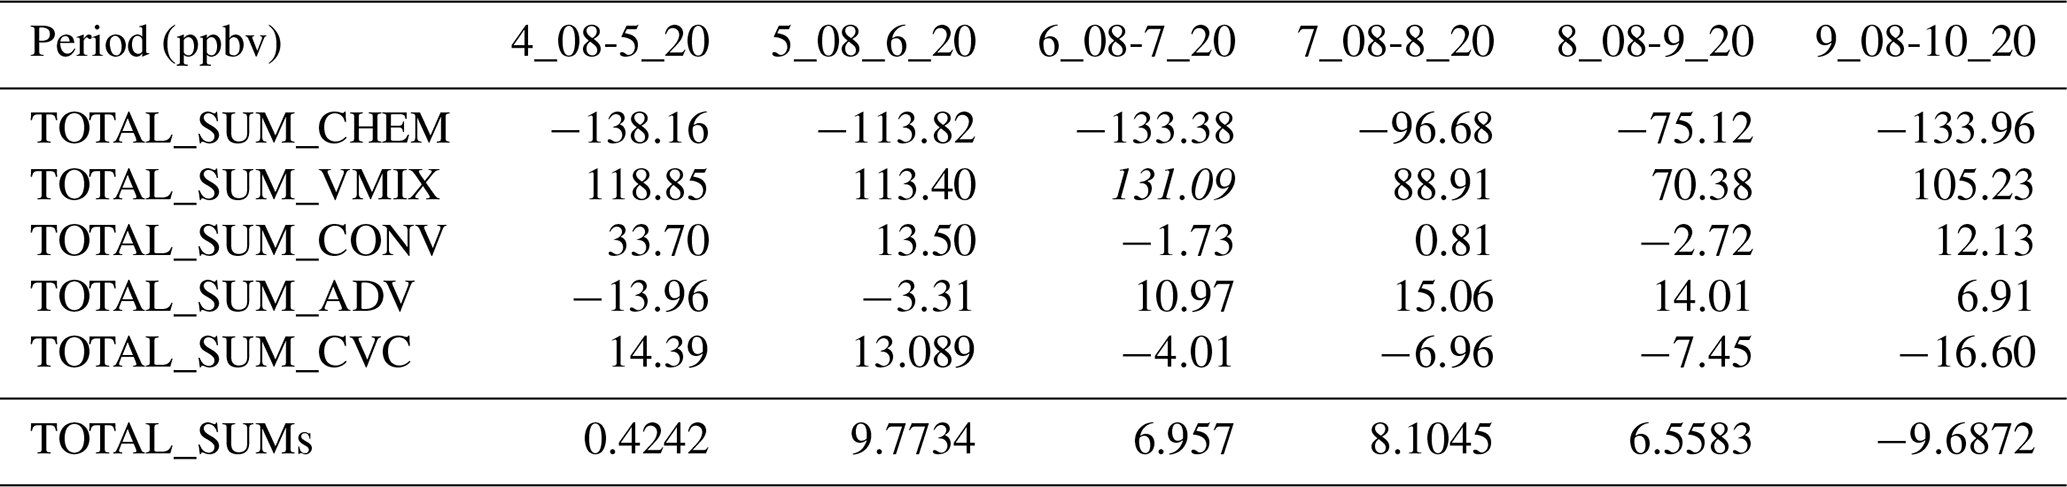
The highlighted column indicates the non-attainment (national air quality standard level-II) ozone period. TOTAL_SUM_CAC is the sum of the TOTAL_SUM_(CHEM+VMIX+CONV).
The VMIX effect links the ground ozone variation to the ozone variation in the upper PBL level, which is dependent on the vertical gradient of the concentration and the turbulence exchange coefficients (Gao et al., 2020). To understand the connection and why the VMIX contribution to the surface ozone reaches a maximum (131.0915 ppb) from 6 to 7 July, the vertical profiles of accumulative CHEM, ADV, CONV, and CAC (CHEM+ADV+CONV) to the TOTAL_SUM during the time period from 08:00 to 20:00 on 5–7 July are shown in Fig. 8. (For example, the accumulative CHEM effect from 08:00 to 20:00 on 6 July is denoted as the sum of CHEM 06_08-20.)
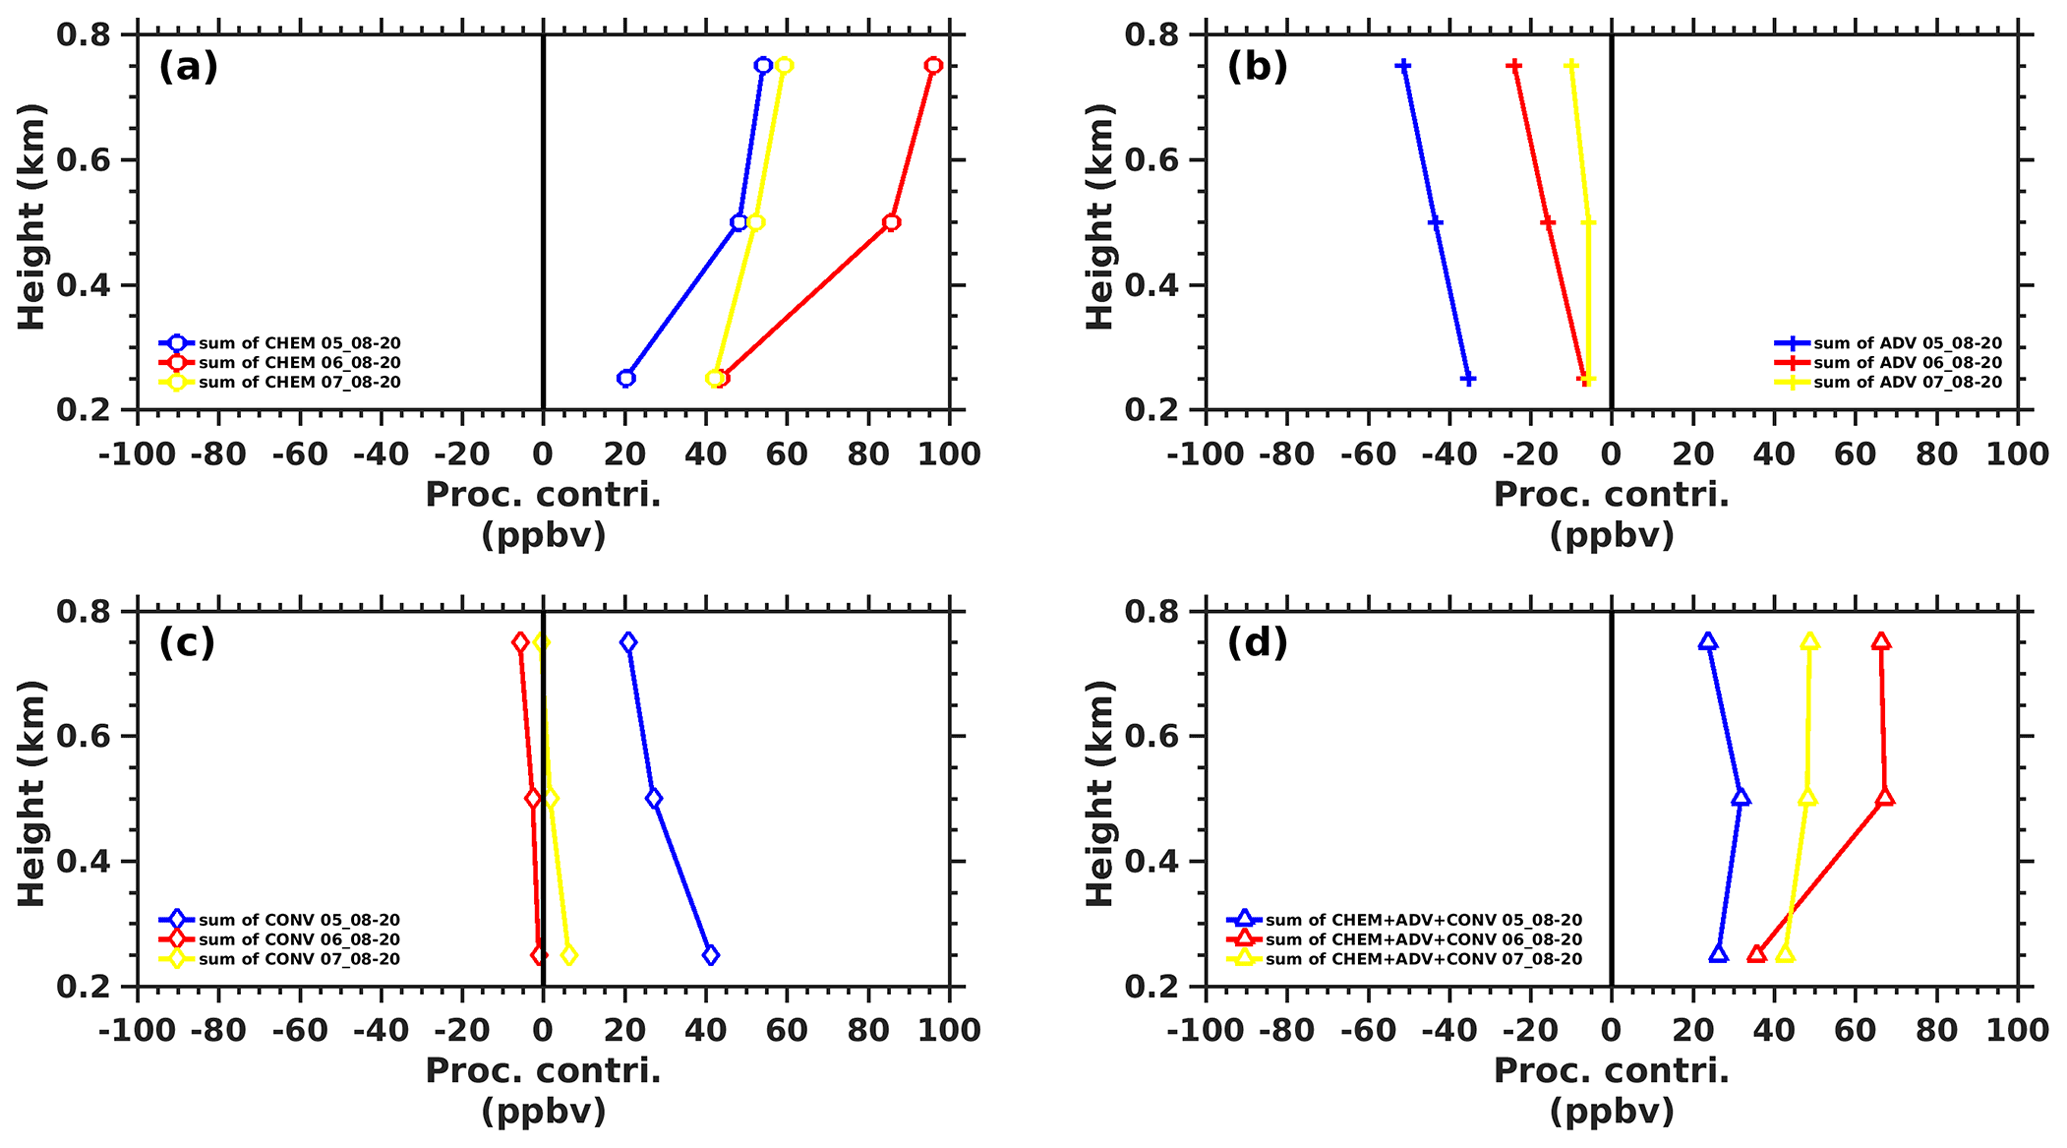
Figure 8The vertical profiles of accumulative (a) CHEM, (b) ADV, (c) CONV, and (d) CVC (CHEM+ADV+CONV) during the periods from 08:00 to 20:00 on 5–7 July.
The gradient of vertical profile of accumulative CHEM contribution on 6 July was significantly larger than that of vertical profiles of accumulative CHEM contribution on 5 and 7 July (Fig. 8a). The CHEM increase in PBL is due to the impact of the periphery of the typhoon, which would produce a field of meteorological conditions conducive to photochemical reactions. These meteorological conditions also increased the absolute contribution and gradient of accumulative ADV contribution compared to that of 5 July (Fig. 8b). Therefore, the vertical profile gradient of the sum of CVC 06_08-20 was the largest, which contributed to the enhancement of VMIX contribution to the ozone on the ground. In short, both the daytime CHEM and ADV enhancement above the ground throughout the PBL have contributed to the increase in VMIX contribution to the ground-level ozone. The CHEM enhancement above the ground throughout the PBL is due to the increase in photochemical formations of precursors, while the ADV enhancement above the ground throughout the PBL is attributed to the WWD (weak wind deepening) effect in the whole lower troposphere during the episode.
In summary, under the influence of the peripheral subsidence of typhoon, the weak subsidence associated with typhoon periphery brings clear sky and warmer air, which is conducive to the ozone photolysis formation (CHEM) above the ground in planetary boundary layer (PBL) and compensates for the ozone through the positive VMIX effects on the ground. Therefore, the chemical formation (CHEM) and vertical mixing (VMIX) effects are two major contributors to forming TC-ozone episodes, while the ADV and CONV show negative values. However, the day-to-day daytime ozone levels do not associate with daily variation of daytime CHEM and VMIX but are dominated by the daily variation of ADV (e.g. weakened advection outflow or dispersion). The daily enhanced ADV during the episode on the ground and throughout the PBL is attributable to the WWD, which is a common phenomenon induced by the peripheral circulation of the typhoon system. In addition, both the enhanced CHEM and ADV above the ground contribute to the daily daytime ozone enhancement on the ground via the VMIX process during the episode.
In this study, the analysis of ground observation, wind profile data, and model simulation was integrated. By analysing the wind profile radar observations, we found that not only surface weak winds but also WWD generally appeared in the periphery of the typhoon. The statistics of wind fields and ground-level ozone at seven wind profile radar stations in PRD during the 38 typhoons in the Northwestern Pacific Ocean from 2014–2018 showed that the number of WWD occurrences accounted for 93 % (87 %–97 %) of the available number of radar stations for the seven radar stations in average. The number of ozone pollution occurrences accounted for 94 % of the number of WWD occurrences in average. The statistical results show that WWD is a common weather phenomenon in the periphery of typhoons associated with periphery subsidence of typhoon system and is often accompanied by significant increases in ozone concentrations.
The WRF-Chem model was used to simulate the daily daytime ozone variation in a sustained ozone pollution process in PRD during Typhoon Nepartak in 2016. Validation results showed that the model could reasonably reproduce the observed temperature, wind speed, wind direction, and ozone. Process analysis results showed that under the impact of the peripheral subsidence of typhoon, the chemical formation (CHEM) and vertical mixing (VMIX) effects are two major contributors to the enhancement of ozone levels to form an episode, while the ADV and CONV always show negative or small values. However, the day-to-day variation of the daytime ozone levels is not determined by the daily variation of daytime CHEM but is dominated by the daily variation of ADV terms on the ground (e.g. the weakened advection outflow or dispersion). So, the ozone and its precursors' accumulation, including the enhancement during the night-time, contribute to the daytime ozone increase in the following day. Via a detailed day-to-day analysis, we found that the decrease of negative ADV values during the event not only occurred on the ground, but also throughout the PBL. The daily enhanced VMIX contribution to the ground-level daytime ozone during the episode is associated with the enhanced CHEM and ADV in the upper PBL. Results show that in addition to the weakened advection outflow or dispersion on the ground, the integrated effect of the day-to-day variation of the accumulative CHEM above the ground and accumulative ADV contribution throughout the PBL together determined the overall day-to-day daytime ozone variation through the VMIX process on the ground.
This study reveals that the peripheral characteristics of the approaching typhoon not only form the ozone episode by enhanced photochemical reactions, but also change the day-to-day ozone levels by pollution accumulation throughout the PBL due to the weak wind deepening up to 3–5 km. This result explains the continued increase in daytime ozone, although the photochemical contribution began to decrease during the event. It also reveals the important role of WWD in the lower troposphere for the formation of sustained ozone episodes due to the peripheral circulation of the typhoon, which helps to better predict the daily changes of daytime ozone levels.
Final Operational Global Analysis data are freely obtained from https://doi.org/10.5065/D6M043C6 (National Centers for Environmental Prediction/National Weather Service/NOAA/U.S. Department of Commerce, 2000). The hourly ambient surface O3 concentration data are released in real time by the Ministry of Environmental Protection, China, at http://www.aqistudy.cn/ (Ministry of Environmental Protection, 2022), freely downloaded from http://106.37.208.233:20035/ (last access: 8 March 2022). Meteorological data, such as wind profiler data, automatic weather station data, and cloud data, were provided by the Guangdong Meteorological Administration and can be downloaded from http://data.cma.cn/ with permission (Guangdong Meteorological Administration, 2022).
The supplement related to this article is available online at: https://doi.org/10.5194/acp-22-3861-2022-supplement.
The paper was conceptualized by YL. The methodology was designed by YL and XZ. JG performed model simulations. XZ and YL analysed data and interpreted results. XZ, YL, and XD discussed the results and commented on the paper. XZ and YL wrote the paper with input from all co-authors.
The contact author has declared that neither they nor their co-authors have any competing interests.
Publisher's note: Copernicus Publications remains neutral with regard to jurisdictional claims in published maps and institutional affiliations.
We would like to acknowledge the National Centers for Environmental Prediction (NCEP) for the Final Operational Global Analysis data, the Ministry of Environmental Protection, China, for the hourly ambient surface O3 concentration data, the Guangdong Meteorological Administration for the meteorological data, and the support from the Center for Computational Science and Engineering at the Southern University of Science and Technology.
This research has been supported by the National Natural Science Foundation of China (grant nos. 41961160728, 41575106, and 41475105), the Shenzhen Science and Technology Program (grant no. KQTD20180411143441009), the Key Area Research and Development Program of Guangdong Province (grant no. 2020B1111360001), the Guangdong Basic and Applied Basic Research Fund Committee (grant no. 2020B1515130003), the NSFC/RGC (grant no. N_HKUST638/19), the Key Special Project for Introduced Talents Team of Southern Marine Science and Engineering Guangdong Laboratory (Guangzhou) (grant no. GML2019ZD0210), the Guangdong Province Science and Technology Planning Project of China (grant no. 2017A050506003), and the Shenzhen Key Laboratory Foundation (grant no. ZDSYS20180208184349083).
This paper was edited by Xavier Querol and reviewed by two anonymous referees.
Aunan, K., Berntsen, T. K., and Seip, H. M.: Surface Ozone in China and its Possible Impact on Agricultural Crop Yields, AMBIO J. Hum. Environ., 29, 294–301, 2000.
Chan, A., Fung, J. C. H., and Lau, A. K. H.: Influence of urban morphometric modification on regional boundary-layer dynamics, J. Geophys. Res.-Atmos., 118, 2729–2747, 2013.
Chen, X. L., Fan, S. J., Jiang-Nan, L. I., Ji, L., Wang, A. Y., and Soi-Kun, F.: typical weather characteristics associated with air pollution in Hong Kong area, J. Trop. Meteorol., 14, 101–104, 2008.
Chen, Z., Zhuang, Y., Xie, X., Chen, D., Cheng, N., Yang, L., and Li, R.: Understanding long-term variations of meteorological influences on ground ozone concentrations in Beijing During 2006–2016, Environ. Pollut., 245, 29–37, 2018.
Cheng, N. L., Li, Y. T., Zhang, D. W., Chen, T., Wang, X., Huan, N., Chen, C., and Meng, F.: Characteristics of Ozone over Standard and Its Relationships with Meteorological Conditions in Beijing City in 2014, Environ. Sci., 37, 2041–2051, https://doi.org/10.13227/j.hjkx.2016.06.006, 2016.
Deng, T., Wang, T., Wang, S., Zou, Y., Yin, C., Li, F., Liu, L., Wang, N., Song, L., and Wu, C.: Impact of typhoon periphery on high ozone and high aerosol pollution in the Pearl River Delta region, Sci. Total Environ., 668, 617–630, 2019.
Doll, D. C.: Guideline for Regulatory Application of the Urban Airshed Model, 1991.
Emery, C., Tai, E., and Yarwood, G.: Enhanced meteorological modeling and performance evaluation for two texas episodes, in: Prepared for the Texas Natural Resource Conservation Commission, Environ International Corp, Novato, CA, USA, 2001.
Felzer, B. S., Cronin, T., Reilly, J. M., Melillo, J. M., and Wang, X.: Impacts of ozone on trees and crops, C. R. Géosci., 339, 784–798, 2007.
Feng, Y., Wang, A., Wu, D., and Xu, X.: The influence of tropical cyclone Melor on PM(10) concentrations during an aerosol episode over the Pearl River Delta region of China: Numerical modeling versus observational analysis, Atmos. Environ., 41, 4349–4365, 2007.
Feng, Z., Hu, E., Wang, X., Jiang, L., and Liu, X.: Ground-level O-3 pollution and its impacts on food crops in China: A review, Environ. Pollut., 199, 42–48, 2015.
Forkel, R., Werhahn, J., Hansen, A. B., Mckeen, S., Peckham, S., Grell, G., and Suppan, P.: Effect of aerosol-radiation feedback on regional air quality – A case study with WRF/Chem, Atmos. Environ., 53, 202–211, 2012.
Gao, J., Zhu, B., Xiao, H., Kang, H., Hou, X., and Shao, P.: A case study of surface ozone source apportionment during a high concentration episode, under frequent shifting wind conditions over the Yangtze River Delta, China, Sci. Total Environ., 544, 853–863, 2016.
Gao, J., Zhu, B., Xiao, H., Kang, H., Hou, X., Yin, Y., Zhang, L., and Miao, Q.: Diurnal variations and source apportionment of ozone at the summit of Mount Huang, a rural site in Eastern China, Environ. Pollut., 222, 513–522, 2017.
Gao, J., Li, Y., Zhu, B., Hu, B., Wang, L., and Bao, F.: What have we missed when studying the impact of aerosols on surface ozone via changing photolysis rates?, Atmos. Chem. Phys., 20, 10831–10844, https://doi.org/10.5194/acp-20-10831-2020, 2020.
Gao, X. R., Deng, X. J., Tan, H. B., Wang, C. L., Wang, N., and Yue, D. L.: Characteristics and anlysis on regional pollution process and circulation weather types over Guangdong Province, Acta Scientiae Circumstantiae, 40, 47–52, 2018.
Giorgi, F. and Meleux, F.: Modelling the regional effects of climate change on air quality, C. R. Geosci., 339, 721–733, 2007.
Grell, G. A., Peckham, S. E., Schmitz, R., Mckeen, S. A., Frost, G., Skamarock, W. C., and Eder, B.: Fully coupled “online” chemistry within the WRF model, Atmos. Environ., 39, 6957–6975, https://doi.org/10.1016/j.atmosenv.2005.04.027, 2005.
Guangdong Meteorological Administration: Meteorological data, http://data.cma.cn/, last access: 8 March 2022.
Han, H., Liu, J., Shu, L., Wang, T., and Yuan, H.: Local and synoptic meteorological influences on daily variability in summertime surface ozone in eastern China, Atmos. Chem. Phys., 20, 203–222, https://doi.org/10.5194/acp-20-203-2020, 2020.
Hu, J., Chen, J., Ying, Q., and Zhang, H.: One-year simulation of ozone and particulate matter in China using WRF/CMAQ modeling system, Atmos. Chem. Phys., 16, 10333–10350, https://doi.org/10.5194/acp-16-10333-2016, 2016.
Huang, J., Liu, H., Crawford, J. H., Chan, C., Considine, D. B., Zhang, Y., Zheng, X., Zhao, C., Thouret, V., Oltmans, S. J., Liu, S. C., Jones, D. B. A., Steenrod, S. D., and Damon, M. R.: Origin of springtime ozone enhancements in the lower troposphere over Beijing: in situ measurements and model analysis, Atmos. Chem. Phys., 15, 5161–5179, https://doi.org/10.5194/acp-15-5161-2015, 2015.
Jiang, Y. C., Zhao, T. L., Liu, J., Xu, X. D., Tan, C. H., Cheng, X. H., Bi, X. Y., Gan, J. B., You, J. F., and Zhao, S. Z.: Why does surface ozone peak before a typhoon landing in southeast China?, Atmos. Chem. Phys., 15, 13331–13338, https://doi.org/10.5194/acp-15-13331-2015, 2015.
Kwok, R. H. F., Fung, J. C. H., Lau, A. K. H., and Fu, J. S.: Numerical study on seasonal variations of gaseous pollutants and particulate matters in Hong Kong and Pearl River Delta Region, J. Geophys. Res.-Atmos., 115, D16308, https://doi.org/10.1029/2009JD012809, 2010.
Lai, L. Y. and Sequeira, R.: Visibility degradation across Hong Kong: its components and their relative contributions, Atmos. Environ., 35, 5861–5872, 2001.
Li, J., Wang, Z., Akimoto, H., Gao, C., Pochanart, P., and Wang, X.: Modeling study of ozone seasonal cycle in lower troposphere over east Asia, J. Geophys. Res.-Atmos., 112, D22S25, https://doi.org/10.1029/2006JD008209, 2007.
Li, T. Y., Deng, X. J., Li, Y., Song, Y. S., Li, L. Y., Tan, H. B., and Wang, C. L.: Transport paths and vertical exchange characteristics of haze pollution in Southern China, Sci. Total Environ., 625, 1074–1087, 2018.
Li, Y., Lau, A. K.-H., Fung, J. C.-H., Zheng, J. Y., Zhong, L. J., and Louie, P. K. K.: Ozone source apportionment (OSAT) to differentiate local regional and super-regional source contributions in the Pearl River Delta region, China, J. Geophys. Res.-Atmos., 117, D15305, https://doi.org/10.1029/2011JD017340, 2012.
Li, Y., Lau, A. K. H., Fung, J. C. H., Ma, H., and Tse, Y.: Systematic evaluation of ozone control policies using an Ozone Source Apportionment method, Atmos. Environ., 76, 136–146, https://doi.org/10.1016/j.atmosenv.2013.02.033, 2013.
Li, Y., Lau, A., Wong, A., and Fung, J.: Decomposition of the wind and nonwind effects on observed year-to-year air quality variation, J. Geophys. Res.-Atmos., 119, 6207–6220, 2014.
Lin, X., Yuan, Z., Yang, L., Luo, H., and Li, W.: Impact of Extreme Meteorological Events on Ozone in the Pearl River Delta, China, Aerosol Air Qual. Res., 19, 1307–1324, https://doi.org/10.4209/aaqr.2019.01.0027, 2019.
Liu, J., Wu, D., Fan, S. J., Liao, Z. H., and Deng, T.: Impacts of precursors and meteorological factors on ozone pollution in Pearl River Delta, Zhongguo Huanjing Kexuechina Environ. Sci., 37, 813–820, 2017.
Lu, R., Turco, R. P., and Jacobson, M. Z.: An integrated air pollution modeling system for urban and regional scales: 2. Simulations for SCAQS 1987, J. Geophys. Res.-Atmos., 102, 6081–6098, https://doi.org/10.1029/96JD03502, 1997.
Ministry of Ecology and Environment of China: Chinese State of the Environment Bulletin, 1–54, 2016.
Ministry of Environmental Protection: Hourly ambient surface O3 concentration data, http://www.aqistudy.cn/, last access: 8 March 2022.
National Centers for Environmental Prediction/National Weather Service/NOAA/U.S. Department of Commerce: NCEP FNL Operational Model Global Tropospheric Analyses, continuing from July 1999, updated daily, Research Data Archive at the National Center for Atmospheric Research, Computational and Information Systems Laboratory [data set], https://doi.org/10.5065/D6M043C6, 2000.
Shu, L., Xie, M., Wang, T., Gao, D., Chen, P., Han, Y., Li, S., Zhuang, B., and Li, M.: Integrated studies of a regional ozone pollution synthetically affected by subtropical high and typhoon system in the Yangtze River Delta region, China, Atmos. Chem. Phys., 16, 15801–15819, https://doi.org/10.5194/acp-16-15801-2016, 2016.
Shu, L., Wang, T., Xie, M., Li, M., Zhao, M., Zhang, M., and Zhao, X.: Episode study of fine particle and ozone during the CAPUM-YRD over Yangtze River Delta of China: Characteristics and source attribution, Atmos. Environ., 203, 87–101, https://doi.org/10.1016/j.atmosenv.2019.01.044, 2019.
Skamarock, W. C., Klemp, J. B., Dudhia, J., Gill, D. O., Barker, D. M., Duda, M. G., Huang, X.-Y., Wang, W., and Powers, J. G.: A Description of the Advanced Research WRF Version 3, 2008.
Tan, Z., Lu, K., Jiang, M., Su, R., Dong, H., Zeng, L., Xie, S., Tan, Q., and Zhang, Y.: Exploring ozone pollution in Chengdu, southwestern China: A case study from radical chemistry to O3-VOC-NOx sensitivity, Sci. Total Environ., 636, 775–786, 2018.
Wang, T., Lam, K. S., Lee, A. S. Y., Pang, S. W., and Tsui, W. S.: Meteorological and Chemical Characteristics of the Photochemical Ozone Episodes Observed at Cape D'Aguilar in Hong Kong, J. Appl. Meteorol., 37, 1167–1178, 1998.
Wang, T., Wu, Y. Y., Cheung, T. F., and Lam, K. S.: A study of surface ozone and the relation to complex wind flow in Hong Kong, Atmos. Environ., 35, 3203–3215, 2001.
Wang, X., Zhang, Y., Hu, Y., Zhou, W., Lu, K., Zhong, L., Zeng, L., Shao, M., Hu, M., and Russell, A. G.: Process analysis and sensitivity study of regional ozone formation over the Pearl River Delta, China, during the PRIDE-PRD2004 campaign using the Community Multiscale Air Quality modeling system, Atmos. Chem. Phys., 10, 4423–4437, https://doi.org/10.5194/acp-10-4423-2010, 2010.
Wang, Z., Li, J., Wang, X., Pochanart, P., and Akimoto, H.: Modeling of Regional High Ozone Episode Observed at Two Mountain Sites (Mt. Tai and Huang) in East China, J. Atmos. Chem., 55, 253–272, 2006.
WHO: WHO Air quality guidelines for particulate matter, ozone, nitrogen dioxide and sulfur dioxide – Global update 2005, 2005.
Wu, D., Tie, X., Li, C., Ying, Z., Lau, K. H., Huang, J., Deng, X., and Bi, X.: An extremely low visibility event over the Guangzhou region: A case study, Atmos. Environ., 39, 6568–6577, 2005.
Wu, M., Wu, D., Fan, Q., Wang, B. M., Li, H. W., and Fan, S. J.: Observational studies of the meteorological characteristics associated with poor air quality over the Pearl River Delta in China, Atmos. Chem. Phys., 13, 10755–10766, https://doi.org/10.5194/acp-13-10755-2013, 2013.
Zaveri, R. A. and Peters, L. K.: A new lumped structure photochemical mechanism for large-scale applications, J. Geophys. Res.-Atmos., 104, 30387–30415, 1999.
Zaveri, R. A., Easter, R. C., Fast, J. D., and Peters, L. K.: Model for Simulating Aerosol Interactions and Chemistry (MOSAIC), J. Geophys. Res.-Atmos., 113, D13204, https://doi.org/10.1029/2007JD008782, 2008.
Zhang, H., DeNero, S. P., Joe, D. K., Lee, H.-H., Chen, S.-H., Michalakes, J., and Kleeman, M. J.: Development of a source oriented version of the WRF/Chem model and its application to the California regional PM10/PM2.5 air quality study, Atmos. Chem. Phys., 14, 485–503, https://doi.org/10.5194/acp-14-485-2014, 2014.
Zhang, J. and Rao, S. T.: The Role of Vertical Mixing in the Temporal Evolution of Ground-Level Ozone Concentrations, J. Appl. Meteorol., 38, 1674–1691, 1999.
Zhang, J. P., Zhu, T., Zhang, Q. H., Li, C. C., Shu, H. L., Ying, Y., Dai, Z. P., Wang, X., Liu, X. Y., Liang, A. M., Shen, H. X., and Yi, B. Q.: The impact of circulation patterns on regional transport pathways and air quality over Beijing and its surroundings, Atmos. Chem. Phys., 12, 5031–5053, https://doi.org/10.5194/acp-12-5031-2012, 2012.
Zhang, Y., Wen, X. Y., and Jang, C. J.: Simulating chemistry-aerosol-cloud-radiation-climate feedbacks over the continental U. S. using the online-coupled Weather Research Forecasting Model with chemistry (WRF/Chem), Atmos. Environ., 44, 3568–3582, 2010.
Zhang, Y., Mao, H., Ding, A., Zhou, D., and Fu, C.: Impact of synoptic weather patterns on spatio-temporal variation in surface {O3} levels in Hong Kong during 1999–2011, Atmos. Environ., 73, 41–50, 2013.
Zhu, B., Kang, H., Zhu, T., Su, J., Hou, X., and Gao, J.: Impact of Shanghai urban land surface forcing on downstream city ozone chemistry: Urban Land-Surface Forcing on Ozone, J. Geophys. Res.-Atmospheres, 120, 4340–4351, https://doi.org/10.1002/2014JD022859, 2015.
Ziomas, I. C., Melas, D., Zerefos, C. S., Bais, A. F., and Paliatsos, A. G.: Forecasting peak pollutant levels from meteorological variables, Atmos. Environ., 29, 3703–3711, 1995.