the Creative Commons Attribution 4.0 License.
the Creative Commons Attribution 4.0 License.
 | 17 Mar 2022
Redistribution of total reactive nitrogen in the lowermost Arctic stratosphere during the cold winter 2015/2016
Peter Hoor
Jens-Uwe Grooß
Andreas Zahn
Greta Stratmann
Paul Stock
Michael Lichtenstern
Jens Krause
Vera Bense
Armin Afchine
Christian Rolf
Wolfgang Woiwode
Marleen Braun
Jörn Ungermann
Andreas Marsing
Christiane Voigt
Andreas Engel
Björn-Martin Sinnhuber
Hermann Oelhaf
During winter 2015/2016, the Arctic stratosphere was characterized by extraordinarily low temperatures in connection with a very strong polar vortex and with the occurrence of extensive polar stratospheric clouds. From mid-December 2015 until mid-March 2016, the German research aircraft HALO (High Altitude and Long-Range Research Aircraft) was deployed to probe the lowermost stratosphere in the Arctic region within the POLSTRACC (Polar Stratosphere in a Changing Climate) mission. More than 20 flights have been conducted out of Kiruna, Sweden, and Oberpfaffenhofen, Germany, covering the whole winter period. Besides total reactive nitrogen (NOy), observations of nitrous oxide, nitric acid, ozone, and water were used for this study. Total reactive nitrogen and its partitioning between the gas and particle phases are key parameters for understanding processes controlling the ozone budget in the polar winter stratosphere. The vertical redistribution of total reactive nitrogen was evaluated by using tracer–tracer correlations (NOy–N2O and NOy–O3). The trace gases are well correlated as long as the NOy distribution is controlled by its gas-phase production from N2O. Deviations of the observed NOy from this correlation indicate the influence of heterogeneous processes. In early winter no such deviations have been observed. In January, however, air masses with extensive nitrification were encountered at altitudes between 12 and 15 km. The excess NOy amounted to about 6 ppb. During several flights, along with gas-phase nitrification, indications for extensive occurrence of nitric acid containing particles at flight altitude were found. These observations support the assumption of sedimentation and subsequent evaporation of nitric acid-containing particles, leading to redistribution of total reactive nitrogen at lower altitudes. Remnants of nitrified air masses have been observed until mid-March. Between the end of February and mid-March, denitrified air masses have also been observed in connection with high potential temperatures. This indicates the downward transport of air masses that have been denitrified during the earlier winter phase. Using tracer–tracer correlations, missing total reactive nitrogen was estimated to amount to 6 ppb. Further, indications of transport and mixing of these processed air masses outside the vortex have been found, contributing to the chemical budget of the winter lowermost stratosphere. Observations within POLSTRACC, at the bottom of the vortex, reflect heterogeneous processes from the overlying Arctic winter stratosphere. The comparison of the observations with CLaMS model simulations confirm and complete the picture arising from the present measurements. The simulations confirm that the ensemble of all observations is representative of the vortex-wide vertical NOy redistribution.
- Article
(3459 KB) - Full-text XML
- BibTeX
- EndNote


Since the mid-1980s, observations in the Antarctic and later in the Arctic region have revealed unprecedented ozone loss in the polar stratosphere with the beginning of the spring season (e.g. Farman et al., 1985; Müller et al., 1996; Waibel et al., 1999; Sinnhuber et al., 2000). The discovery of the so-called ozone hole was the starting point of extensive measurement campaigns with research aircraft, balloons, satellites, and ground-based instruments to study the processes that lead to this ozone decrease. It turned out that gas-phase chemistry alone is not sufficient to explain these observations. Heterogeneous reactions on polar stratospheric clouds were identified as key processes for the reactions involved (e.g. Crutzen and Arnold, 1986; Solomon, 1999; Lowe and MacKenzie, 2008). Particle surfaces serve as a platform to convert inactive halogen compounds into halogen species that are suitable to destroy ozone in catalytic cycles. Depending on temperature, composition, and physical state, different types of polar stratospheric clouds can be distinguished: liquid supercooled droplets, binary or ternary solutions (SBSs, STSs), nitric acid hydrates (NAD, NAT), and water ice particles (e.g. Fahey et al., 2001; Hoyle et al., 2013; Khosrawi et al., 2017; Tritscher et al., 2021).
In this sense, the conversion of gas-phase nitric acid into the particle phase is of decisive importance. It not only supplies the surface for heterogeneous reactions but also removes nitric acid as reaction partner for processes deactivating chlorine compounds. Heterogeneous reactions also enable the de-noxification of the stratosphere by the conversion of NOx to nitric acid. This process also contributes to the inhibition of chlorine deactivation (e.g. Solomon, 1990; Waibel et al., 1999). Particle formation is followed by sedimentation, leading to irreversible removal of nitric acid. The removal of nitrogen compounds from the stratosphere allows for continuing ozone destruction that increases with increasing illumination of the polar vortex at the end of the polar winter. Although, temperatures in the Arctic winter stratosphere are usually higher than in the Antarctic, and polar stratospheric clouds (PSCs) regularly occur as well (e.g. Pitts et al., 2018). During several aircraft campaigns, nitrate-containing PSC particles have been observed at altitudes between 15 and 21 km (Northway et al., 2002; Voigt et al., 2005).
Denitrified regions resulting from particle sedimentation were found predominantly at elevations above 15 to 16 km (e.g. Waibel et al., 1999; Fahey et al., 2001; Popp et al., 2001; Jin et al., 2006; Woiwode et al., 2014). Observations at lower altitudes are rare. Denitrified regions are associated with regions of elevated nitrogen concentrations caused by evaporation of sedimenting particles (e.g. Fischer et al., 1997; Hintsa et al., 1998; Waibel et al., 1999). During the winter, the denitrified air masses in the polar vortex sink down. Therefore, heterogeneous processes at higher altitudes can lead to nitrification and with a time lag to a denitrification of the upper troposphere and lower stratosphere (UTLS). Reactive nitrogen species are key parameters in reaction cycles controlling ozone concentration (e.g. Hegglin et al., 2006; Stratmann et al., 2016). A redistribution of nitrogen oxides therefore affects the chemistry at the UTLS, where even small changes may have a significant impact on the radiative properties of the atmosphere (Riese et al., 2012).
In recent decades, the Arctic was the target of several intensive missions like SOLVE/THESEO in 2000 (Newman et al., 2002) or RECONCILE in 2009/2010 (von Hobe et al., 2013) just to give a few examples. During several winter seasons, substantial ozone loss was observed (e.g. Sinnhuber et al., 2000; Rex et al., 2006; Sinnhuber et al., 2011). These measurement campaigns were followed by the POLSTRACC (Polar stratosphere in a Changing Climate) mission in winter 2015/2016. POLSTRACC aimed to study the lower Arctic stratosphere over a full winter–spring period (Oelhaf et al., 2019). This winter was characterized by unusual low temperatures of the Arctic polar vortex. The analysis of different datasets showed that the early winter of this season was the coldest in the Arctic stratosphere in the last 68 years (Matthias et al., 2016). The temperatures in the lower stratosphere were close to or at record low values between late December and early February (Manney and Lawrence, 2016). In extended areas of the Arctic stratosphere, temperatures dropped below the existence temperature of ice (Voigt et al., 2018). With the spaceborne lidar CALIOP on board the CALIPSO satellite, extended regions of polar stratospheric clouds have been observed between 15 and 26 km from December until end of January (Pitts et al., 2018; Voigt et al., 2018). Extensive PSC abundance in the Arctic leads to the activation and repartitioning of chlorine species (Johansson et al., 2018, 2019; Marsing et al., 2019). Trace gas measurements performed with the Aura Microwave Limb Sounder (MLS) showed remarkable denitrification in the polar vortex (Manney and Lawrence, 2016). A finding that was also illustrated by model simulations. With the EMAC atmospheric chemistry–climate model, a strong denitrification of 4 to 8 ppb was simulated (Khosrawi et al., 2017). At the beginning of March, a major final warming began, and the full breakdown of the vortex occurred at the beginning of April (Manney and Lawrence, 2016).
POLSTRACC has been an extensive measurement campaign using the German research aircraft HALO (High Altitude and Long-Range Research Aircraft) as platform for in situ and remote sensing instruments. POLSTRACC was part of a combined mission called PGS (POLSTRACC-GW-LCYCLE-SALSA) that also includes objectives with respect to gravity waves and stratosphere–troposphere exchange. One major goal was to study the interrelationship between climate and the polar stratosphere (Oelhaf et al., 2019).
The investigation of the reactive nitrogen distribution at the bottom of the polar vortex and the search for nitrate-containing particles was a key issue of this mission, which was pursued with in situ and remote sensing instruments (Braun et al., 2019). With the AENEAS (Atmospheric Nitrogen Oxides Measuring System) in situ instrument, the total reactive nitrogen distribution was observed in the lowermost stratosphere. Observations of N2O and O3 have been used to interpret the nitrogen oxides measurements. Tracer–tracer correlations are an important tool for studying processes apart from transport and mere gas-phase chemistry.
The observation period provided a unique opportunity to study the lowermost stratosphere over an entire winter period. So, the following questions could be addressed. How does the distribution of reactive nitrogen evolve from late December to mid-March? What influence do heterogeneous processes have on the distribution of reactive nitrogen compounds at the bottom of the polar vortex? This extremely cold winter favoured the formation of PSC particles and their sedimentation. So far, PSC particles containing reactive nitrogen compounds have been found almost exclusively at altitudes above 15 km. Therefore, another goal of these measurements was the search for PSC particles at the flight altitude of HALO.
In addition, the observed reactive nitrogen was compared with CLaMS model simulations. It was investigated how the model–measurement comparison performs in the different phases of the winter and how well the model describes the different influences of heterogeneous processes on the nitrogen oxide distribution at the lowermost stratosphere.
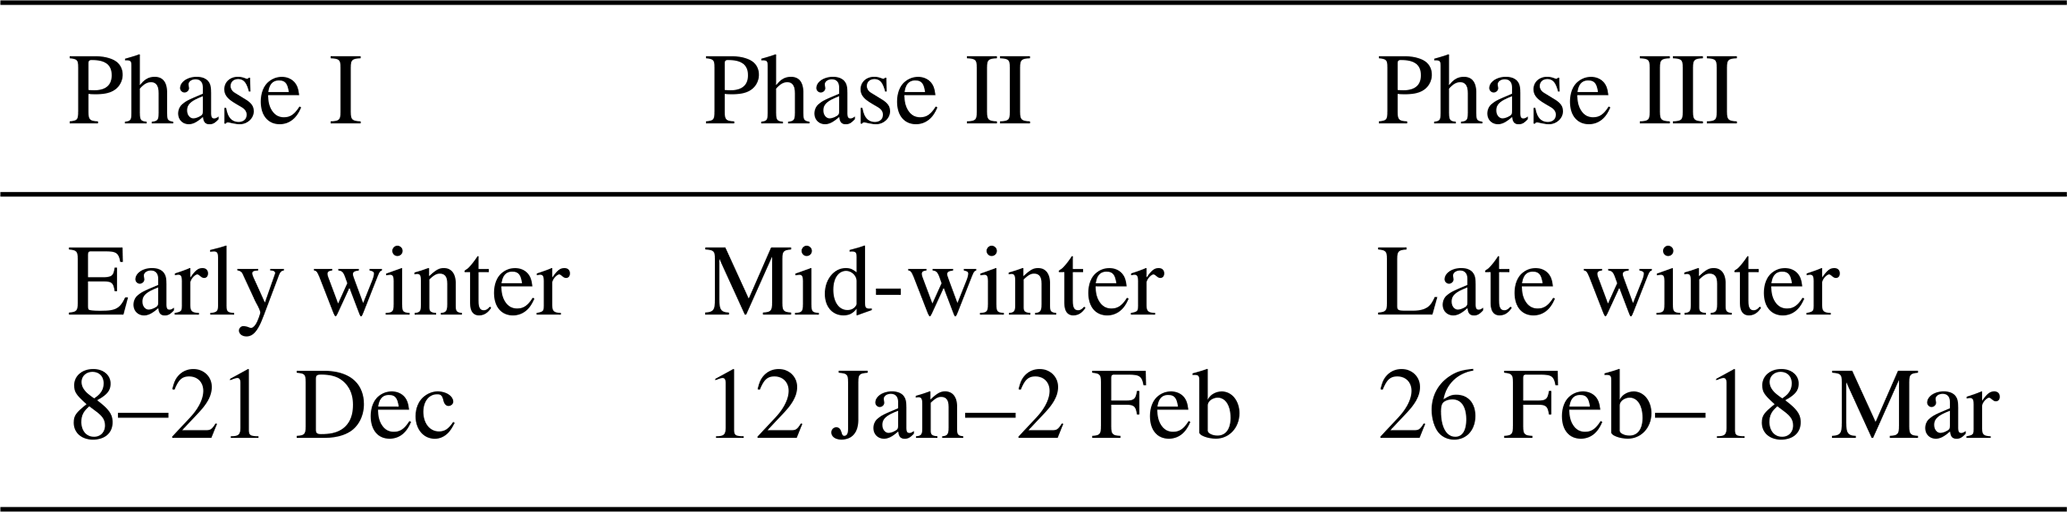
The observation period with HALO extended from end of December 2015 to mid-March 2016. The deployment of HALO was divided into three phases: early, mid, and late winter (Table 1). During the first phase in December, two flights were conducted out of Oberpfaffenhofen to probe the UTLS at mid and high latitudes. The mid-winter observation phase started on 12 January with a flight from Oberpfaffenhofen to Kiruna and ended with a flight out of Kiruna and back on 2 February. The observations were suspended until end of February. On 26 February, flights were resumed. The late-winter mission phase ended with a flight on 18 March from the HALO home base in Oberpfaffenhofen to Kiruna and back.
During the three mission phases, 21 science flights (some with intermediate landings) with more than 150 flight hours were performed. Most of the flights have been conducted out of Kiruna in northern Sweden. More than 70 % of the data have been obtained north of about 60∘ N. Typical flight altitudes ranged between about 12.5 and 14.5 km in the lower stratosphere. A detailed description of the flights and the whole mission is given in Oelhaf et al. (2019).
2.1 Measurement techniques
The research aircraft HALO (https://www.dlr.de/content/en/missions/halo.html, last access: 21 July 2021) is based on a Gulfstream G550 large business aircraft with a maximum ceiling of about 15 km and range of more than 8000 km. The payload of nearly 3 t comprised a set of remote sensing and in situ instruments complementing each other. A detailed description can be found elsewhere (Oelhaf et al., 2019). For the present analysis, experimental data from several instruments have been used.
2.1.1 Total reactive nitrogen (gas and particle phases)
Total reactive nitrogen (NOy) is the sum of all reactive nitrogen species in the atmosphere, namely NO, NO2, HNO3, PAN, HNO2, HNO4, N2O5, ClONO2, and others. During POLSTRACC, total reactive nitrogen was measured using the AENEAS (AtmosphEric Nitrogen oxides mEAsuring System) instrument. Since 2012, this measuring system has been regularly operated on HALO during several missions (Jurkat et al., 2016; Wendisch et al., 2016; Voigt et al., 2017; Lelieveld et al., 2018).
The detection of total reactive nitrogen is based on a well-established technique, comprising catalytic conversion and chemiluminescence. NOy species are reduced catalytically on the surface of a heated gold tube to NO (e.g. Bollinger et al., 1983; Fahey et al., 1985). As reducing agent, hydrogen is added. Subsequently, NO is detected by a chemiluminescence detector (e.g. Ridley et al., 1974; Kley, 1980; Drummond et al., 1985). At DLR this detector type has also been used for observations from other aircraft like the DLR Falcon (Ziereis et al., 2000b) and the DLR Dornier 228 (Reiner et al., 1999). A modified instrument was used on the Russian research aircraft Geophysica (Voigt et al., 2005, 2006; Molleker et al., 2014). For more than 15 years, a NO NOy detector identical in construction has been operated on a commercial airliner in the framework of IAGOS-CARIBIC (In-service Aircraft for a Global Observing System: https://www.iagos.org/iagos-caribic/, last access: 21 July 2021) (Stratmann et al., 2016).
During POLSTRACC, AENEAS was operated with two separate detector channels. Both channels of the instrument were equipped with gold converters, allowing for the detection of NOy. The two separate NOy channels were connected to forward- and aft-facing inlets. With the backward-facing inlet, mainly gas-phase total reactive nitrogen is measured. The sampling of particles larger than about 1 µm is discriminated (Feigl et al., 1999). The overall uncertainty of the total reactive nitrogen measurement depends on the actual ambient concentration. It is about 8 % for volume mixing ratios of 0.5 ppb and about 6.5 % for about 1 ppb (Stratmann et al., 2016; Oelhaf et al., 2019).
The forward-facing inlet oversamples particles. The oversampling is caused by the sub-isokinetic sampling of particles. Due to the high ratio between true air speed of the aircraft and the flow velocity inside the inlet line particles are sampled with enhanced efficiency relative to the gas phase. This approach has been already used during earlier observations, e.g. from NASA ER-2 (Fahey et al., 2001; Northway et al., 2002), NASA DC-8 (Weinheimer et al., 1998), or the DLR Falcon (Feigl et al., 1999; Ziereis et al., 2004). It was used to investigate the nitrate content of PSC particles as well as that of cirrus ice particles. The enhancement factor depends on the flow ratio as well as on ambient pressure, temperature, and particle size. The corresponding relation was derived by Belyaev and Levin (1974) and was adapted for aircraft observations (Fahey et al., 1989; Feigl et al., 1999). The enhancement factor strongly increases with increasing particle diameter and yields a maximum value for diameters larger than about 10 µm. For larger particles, the enhancement factor increases only slightly with diameter.
Whenever the expression “NOy” is used in this study, gas-phase NOy detected with the backward-facing inlet is meant. Total reactive nitrogen observed with the forward-facing inlet comprises gas-phase NOy and enhanced particulate NOy (NOy_P) as gas-phase equivalent. It is denoted as NOy_tot. NOy_tot is not corrected for oversampling. Apart from episodes when particles containing nitrogen oxides were sampled with the forward-facing inlet, the NOy signal detected with the two channels agreed within about 7 %.
where EF represents the enhancement factor. NOy_net is defined as the difference between total NOy and gas-phase NOy. Particulate nitrate, NOy_P, as gas-phase equivalent can be derived from the difference between the signal obtained with the forward- (NOy_tot) and aft-facing inlets (NOy) and the enhancement factor, respectively.
2.1.2 Nitrous oxide
The measurement of nitrous oxide (N2O) is based on a quantum cascade laser infrared absorption spectrometer. The TRIHOP (TRacer In-situ quantum cascade laser absorption spectrometer/ Hydrogenperoxide and Organic Peroxide monitor) instrument was operated during POLSTRACC with a precision of 1.84 ppb and total uncertainty of 2.7 ppb for the measurement of N2O (Krause et al., 2018; Oelhaf et al., 2019).
2.1.3 Ozone
Ozone was measured by the Fast and Accurate In Situ Ozone Instrument (FAIRO). It combines a UV photometer and a fast and precise chemiluminescence detector. The total uncertainty is 1.5 %, and the typical precision is 0.5 % at 10 Hz (Zahn et al., 2012; Oelhaf et al., 2019).
2.1.4 Water vapour
Water vapour was measured by the Fast In Situ Stratospheric Hygrometer (FISH) based on a Lyman Alpha Photometer fluorescence technique and achieved a precision and accuracy of 1 % and 5.6 %, respectively, during POLSTRACC (Zöger et al., 1999; Oelhaf et al., 2019). The FISH instrument was connected to a forward-facing inlet and thus can detect ice particles (evaporated at the inlet walls) in addition to the gas-phase water vapour (Afchine et al., 2018).
2.1.5 Nitric acid
A separate measurement of gas-phase nitric acid (HNO3) was performed by the Airborne chemical Ionization Mass Spectrometer (AIMS) using SF as a reagent ion via another backward-facing inlet. During POLSTRACC, the accuracy was 16 % with a precision of 10 %–15 % at a time resolution of 1.7 s (Jurkat et al., 2017; Marsing et al., 2019; Oelhaf et al., 2019).
2.1.6 GLORIA
Vertical distributions of nitric acid were retrieved from limb-imaging observations by the GLORIA instrument (Gimballed Limb Observer for Radiance Imaging of the Atmosphere; Friedl-Vallon et al., 2014; Riese et al., 2014). Characteristics of the GLORIA 2D chemistry mode and dynamics mode data presented here are discussed by Johansson et al. (2018) and Krasauskas et al. (2021). Note that GLORIA samples air volumes to the right-hand side of the aircraft and not along the vertical projection of the flight path. Furthermore, due to the limb-viewing geometry, which enables detection of minor atmospheric constituents with low abundances, the individual GLORIA profiles constitute horizontally smoothed representations of the atmospheric scenery perpendicular to the flight path. Thus, the GLORIA data at flight altitude do not exactly match the geolocations and sampling characteristics of the simultaneous in situ observations on board HALO. Therefore, in the presence of small-scale structures and horizontal trace gas gradients, differences between these different types of observations at flight altitudes are possible and are not necessarily indicative of instrument errors.
2.2 CLaMS
For the interpretation of the observations and the underlying processes, we employ simulations of the Chemical Lagrangian Model of the Stratosphere (CLaMS). The chemical transport model CLaMS is based on the Lagrangian transport concept and is described elsewhere (Grooß et al., 2014 and references therein). The Lagrangian concept is used in two ways. First the chemical composition of the air is simulated for so-called air parcels that follow the wind and are distributed irregularly in space. Second, the particles are also simulated by the Lagrangian principle. The simulations follow multiple representative NAT particle parcels, which are transported by the wind and in addition are exposed to gravitational settling. As temperatures increase above TNAT, the sedimented particle parcels evaporate and cause nitrification of the surrounding air parcels. Similarly, the vertical redistribution of water vapour by ice particles is included (Tritscher et al., 2019). This simulation setup has shown to reproduce the observed denitrification and nitrification (Grooß et al., 2014).
The CLaMS simulation is initialized on 1 November 2015 based on MLS satellite data, multiannual CLaMS simulations (Pommrich et al., 2014) and tracer–tracer correlations using a similar procedure as described by Grooß et al. (2014), and it runs until March 2016. The simulation encompasses the Northern Hemisphere from the surface to 900 K potential temperature with a vertical resolution of 100 m. Results of this simulation have also been shown elsewhere (Grooß et al., 2018; Braun et al., 2019; Johansson et al., 2019).
3.1 Tracer–tracer correlations
Tracer–tracer correlations of long-lived species are an established method to study transformation processes of trace gases in the lower stratosphere. The relation between chemical species in the stratosphere is linear and compact as long as their chemical lifetime is long compared to transport timescales (Plumb and Ko, 1992). The relation between total reactive nitrogen and nitrous oxide can be used in this sense, because their lifetime is long compared to transport timescales (Keim et al., 1997). The lifetime of nitrous oxide is more than 100 years (Prather et al., 2015). The mean age of an air parcel can be understood as average time since the last contact with the troposphere (Ploeger et al., 2015). During POLSTRACC, the mean age of the probed air masses ranged between about 1 and 5 years (Krause et al., 2018).
In the present study, the redistribution of total reactive nitrogen in the lowermost stratosphere during POLSTRACC was analysed using tracer–tracer correlations, namely the correlation between total reactive nitrogen and nitrous oxide. Photolysis and the reaction of nitrous oxide with O(1D) are the main sources of total reactive nitrogen in the stratosphere (Keim et al., 1997; Greenblatt and Ravishankara, 1990). These processes lead to the formation of nitric oxide. Subsequent reactions produce NO2 and finally nitric acid (HNO3) as well as other reactive nitrogen species. These processes are most effective in regions with high UV-radiation as in the tropical stratosphere (Murphy et al., 1993). The correlation between total reactive nitrogen and nitrous oxide is conserved during the transport of air masses from the tropics to the polar regions as long as no sinks or sources for NOy are effective (Murphy et al., 1993). The observed negative slope of the relation between NOy and N2O can be understood as a kind of conversion efficiency. It is the portion of N2O that is converted into total reactive nitrogen by photolysis and subsequent reactions and is of the order of 6 %–8 % (e.g. Fahey et al., 1990b; Loewenstein et al., 1993; Weinheimer et al., 1993; Fischer et al., 1997; Strahan, 1999). This correlation is linear over a wide range of N2O concentrations. Above about 25 to 30 km altitude, the loss reaction of NO with N becomes increasingly important, leading to a deviation from the linear relationship for N2O values below about 100 ppb (Loewenstein et al., 1993). Observations within the lowermost stratosphere of the Northern Hemisphere suggest some seasonality of this slope (Hegglin et al., 2006). A stronger seasonality was observed in the tracer–tracer correlation between O3 and N2O (Hegglin and Shepherd, 2007; Bönisch et al., 2011).
An analysis for a large number of ER-2 flights showed that the NOy–N2O correlation is linear down to about 170 ppb (Strahan, 1999). Based on these observations, a semiempirical quantity called NO can be derived, estimating the concentration of expected NOy arising from observed N2O in the stratosphere.
Strahan (1999) formulated this relationship as follows.
N2O(obs) is the observed N2O concentration, N2O(ts) is the tropospheric concentration of N2O entering the stratosphere, and f is the conversion efficiency. An additional term was added accounting for the contribution of tropospheric NOy to the observed concentrations in the stratosphere.
As long as there are no additional processes, sources or sinks, in the lower stratosphere affecting the NOy concentration, observed NOy should be very close to NO (within the uncertainty range of observations).
dNOy is defined as the difference between calculated NO and observed gas-phase NOy.
In the lower winter polar stratosphere, deviations of dNOy from zero can be indicative for processes like nitrification and denitrification, resulting from the formation of polar stratospheric cloud particles, their sedimentation and subsequent evaporation. This relationship was derived from observations in stratospheric air masses; it is not expected to hold in tropospheric air masses.
3.2 NOy–N2O observations during the POLSTRACC mission
3.2.1 Early-winter phase
During the early-winter phase of the POLSTRACC mission, two flights have been conducted out of Oberpfaffenhofen on 17 and 21 December 2015. The first flight headed from Oberpfaffenhofen to the north-west of Scotland. The flight on 21 December led to Spitzbergen with the main objective being to perform a polar vortex survey in early winter. During this flight (at 12 to 14.4 km altitude), observed NOy concentrations ranged between about 1 and 3.4 ppb (Fig. 1). The highest concentrations have been found at the northern turnaround point of the flight at about 81∘ N.
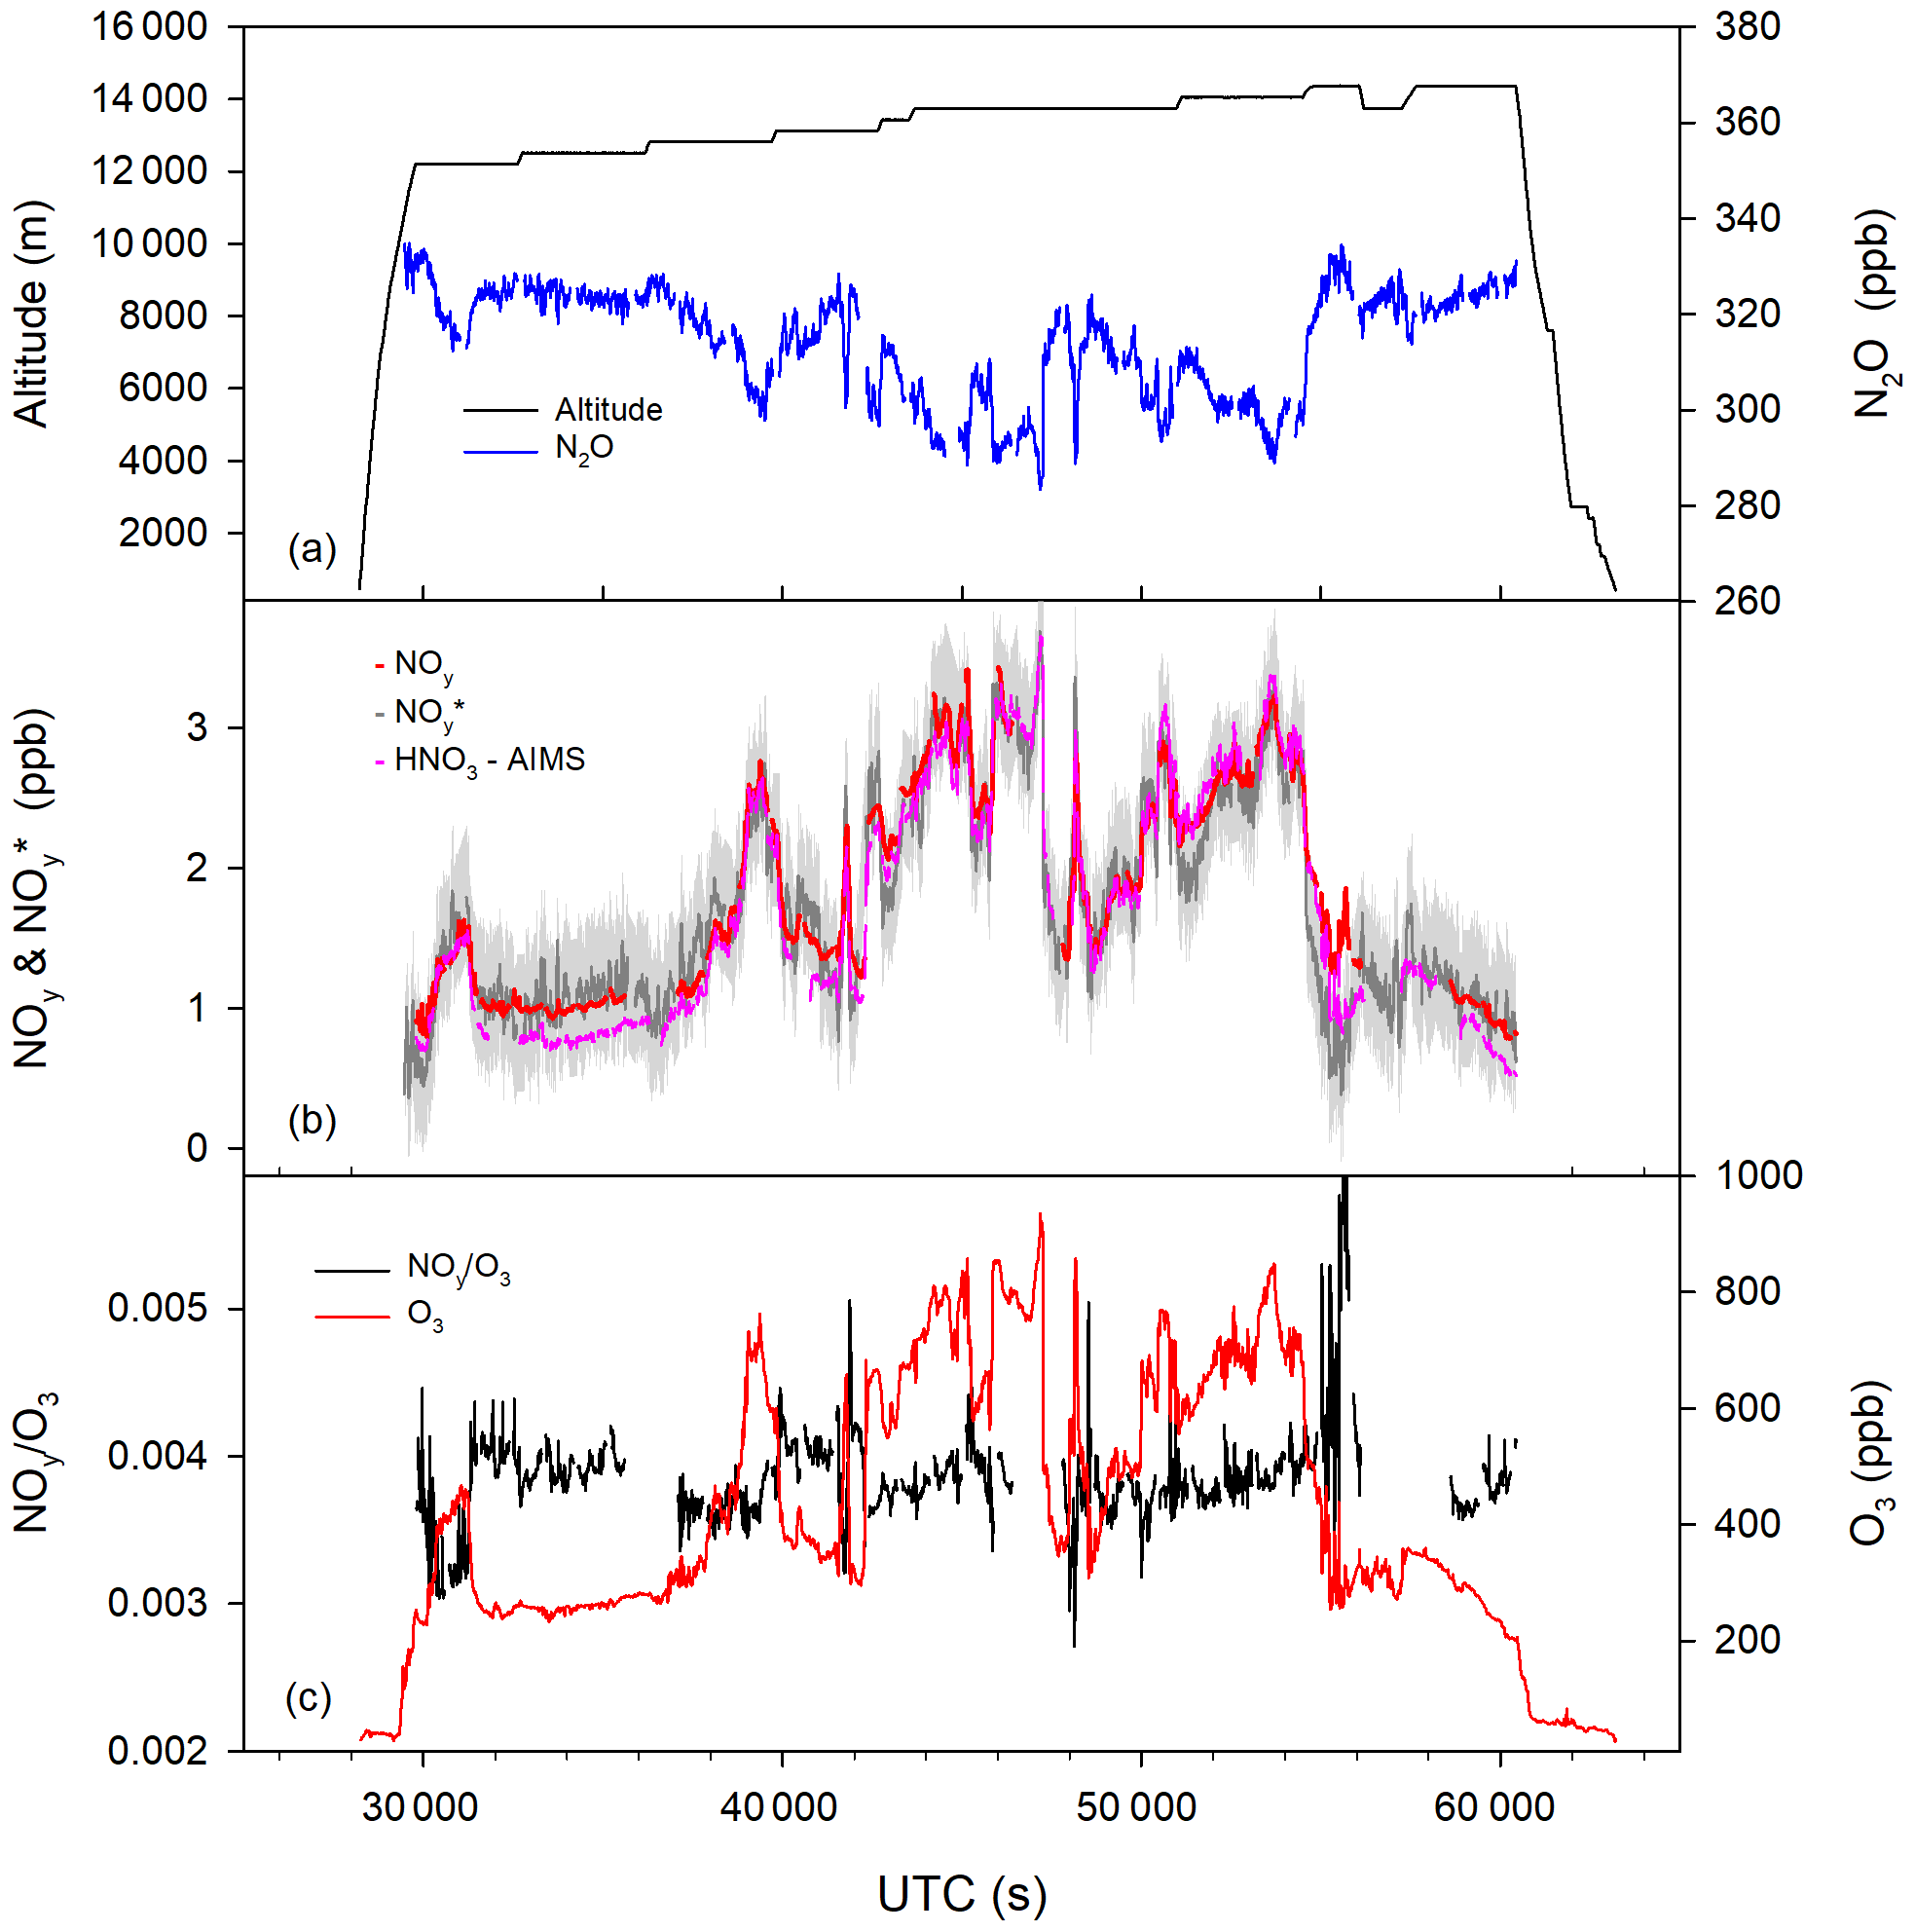
Figure 1PGS flight 5 on 21 December 2015. (a) Altitude and N2O; (b) NOy (observed), NO(calculated), and HNO3 (AIMS instrument). The uncertainty range arising from the calculation of NO is shaded in grey. (c) NOy O3 ratio and O3.
Similar NOy concentrations, with values between about 1 and 2 ppb, have also been found during earlier aircraft missions in the winter Arctic lower stratosphere (Hübler et al., 1990; Weinheimer et al., 1993; Arnold et al., 1998). During the POLSTAR I mission in January 1997, NOy values up to 4 ppb were observed (Ziereis et al., 2000a). In the winter polar stratosphere, NOy is mainly comprised (≥90 %) of nitric acid as was found by aircraft and balloon-borne observations (Wetzel et al., 2002; Schneider et al., 1999). For comparison, nitric acid observed with the AIMS instrument (Jurkat et al., 2016, 2017; Marsing et al., 2019) is also included in Fig. 1. During most parts of the flight, nitric acid and total reactive nitrogen agree with each other within the uncertainty range of both instruments, which confirms that stratospheric NOy is mainly dominated by HNO3, while other NOy components may gain importance near the tropopause.
Figure 6a shows total reactive nitrogen plotted versus N2O for the flight on 21 December. Also included in this figure is the regression line resulting from a linear least squares fit (R2=0.87). The range of its uncertainty is indicated by dashed lines. As expected for undisturbed conditions, NOy and N2O are anticorrelated. To exclude tropospheric values that would affect the correlation, only values obtained in the stratosphere have been used for this analysis. In 2016 the tropospheric N2O concentration amounted to about 329 ppb (Combined Nitrous Oxide data from the NOAA Global Monitoring Laboratory, 2021). Therefore, the analysis was performed only for N2O values smaller than 320 ppb.
The slope of the regression line, corresponding to the factor f given in Eq. (3), is about 0.064. This value agrees reasonably well with earlier observations performed with these instruments. In late summer 2012, the HALO mission TACTS (Transport and composition in the UT/LMS) (Müller et al., 2016) was performed at northern midlatitudes. Nitrification and denitrification could be excluded for this time of the year and region. A linear least squares fit between NOy and N2O for stratospheric values (N2O < 320 ppb) obtained during the TACTS mission gave a slope of about 0.067. The derived slope is also comparable to findings during earlier observations in the winter Arctic region that were not affected by nitrification or denitrification. During the AASE missions in winter 1989 and 1991/1992, slopes between 0.064 and 0.078, respectively, have been observed (Fahey et al., 1990a, b; Weinheimer et al., 1993).
The equation describing the regression can be rewritten to take the form of Eq. (3). In this formulation, the following calculations of NO were performed. The slope obtained during the midlatitude mission TACTS was chosen as conversion efficiency f. The deviation from the value determined during PGS flight 5 can serve as a measure for the uncertainty in determining this slope; it is about 4 %. A further uncertainty in the calculation of NO arises from the contribution of tropospheric NOy. For the POLSTRACC observations, NOy(ts) was estimated to be about 0.78 ppb (derived from the regression curve for tropospheric N2O values). This value lies well within the range spanned by previous observations. From the observations during the TACTS mission, a tropospheric value of 0.65 ppb was derived. Strahan (1999) derived tropospheric NOy(ts) of 0.44±0.22 ppb by averaging measurements at the tropical tropopause. During STREAM-97, the observed mean NOy mixing ratios have been about 0.7 ppb in the upper troposphere (Fischer et al., 2000). Observations with IAGOS-CARIBIC show a high variability of reactive nitrogen in the upper troposphere (Stratmann et al., 2016). Values depend on region and season and where and when the observations were performed, and they range between about 0.4 and 1.4 ppb. The uncertainty in the estimation of NO resulting from the uncertainty of the tropospheric NOy contribution is highest directly at the tropopause where the relative contribution of tropospheric NOy to NO is largest. With decreasing N2O concentration and increasing stratospheric character of the air mass, NOy arising from the photooxidation of N2O increases. At N2O values of 300 ppb and less this uncertainty amounts to about 10 % or less.
According to Eq. (3), the tropospheric concentration of N2O is included in the calculation of NO. The tropospheric N2O value is steadily increasing over the years. Therefore, different air mass ages imply different tropospheric N2O concentrations. During POLSTRACC, the age of the probed air masses ranged between about 1 and 5 years (Krause et al., 2018). Within 5 years, the tropospheric N2O concentration increased by about 1.5 % (Combined Nitrous Oxide data from the NOAA Global Monitoring Laboratory, 2021). This corresponds to a difference in tropospheric N2O of about 5 ppb and a difference in NO (assuming a conversion efficiency of 0.067) of about 0.3 ppb. Although this contribution to NO is comparatively small, the tropospheric N2O concentration in Eq. (3) was chosen according to its air mass age.
In Fig. 1b, measured NOy values are shown along with calculated NO values. Also shown is the uncertainty range of NO. During most of the time, both curves agree well within the uncertainty range. A larger deviation at around 54 000 s UTC was found at high N2O values close to the tropopause where this relation is not expected to be valid.
Another diagnostic tool for characterizing the lowermost stratosphere with respect to reactive nitrogen species is the NOy O3 ratio (Murphy et al., 1993). NOy and O3 are mainly produced in the tropical stratosphere and have comparable lifetimes in the lower stratosphere. Their ratio is more constant than the concentration of the individual species itself. This can also be seen in Fig. 1. NOy and O3 exhibit a substantial variability along the flight track while the NOy O3 ratio does not change a lot. Typical values for this ratio in the lower stratosphere at high northern latitudes are around 0.003–0.004 for undisturbed conditions (e.g. Murphy et al., 1993; Fahey et al., 1996). Values of the same magnitude were observed during the POLSTRACC flight in December (Fig. 1). Here a median NOy O3 ratio of about 0.0038 was measured. For comparison, in winter 1997 aircraft observations within the STREAM campaign in the Arctic found values between 0.003 and 0.006 for this ratio in undisturbed stratospheric air (Fischer et al., 2000).
In December 2015, the polar vortex had already reached temperatures that allowed for the formation of PSC particles (Oelhaf et al., 2019). With CALIOP, large areas covered with PSCs were observed between approximately 15 and 25 km altitude (Pitts et al., 2018). Based on the present study of the NOy–N2O correlation and NOy O3 ratio, no indications have been found that the lowermost Arctic stratosphere was already affected by redistribution of reactive nitrogen species at the beginning of winter. However, considering that only one flight has been performed to the Arctic covering only a small part of the sub-vortex region, redistribution in the lowermost stratosphere already in December cannot be ruled out by these observations.
3.2.2 Mid-winter phase
The second phase of the POLSTRACC mission started with the transfer flight of HALO from Oberpfaffenhofen to Kiruna in northern Sweden on 12 January 2016. Seven flights from Kiruna were completed by 2 February 2016. More than 90 % of these flight routes were lying north of 60∘ N, with more than 85 % of the total flight time in the lower stratosphere with potential vorticity values of more than 2 PVU. The height of the dynamical tropopause is commonly attributed to the level where the potential vorticity equals this value.
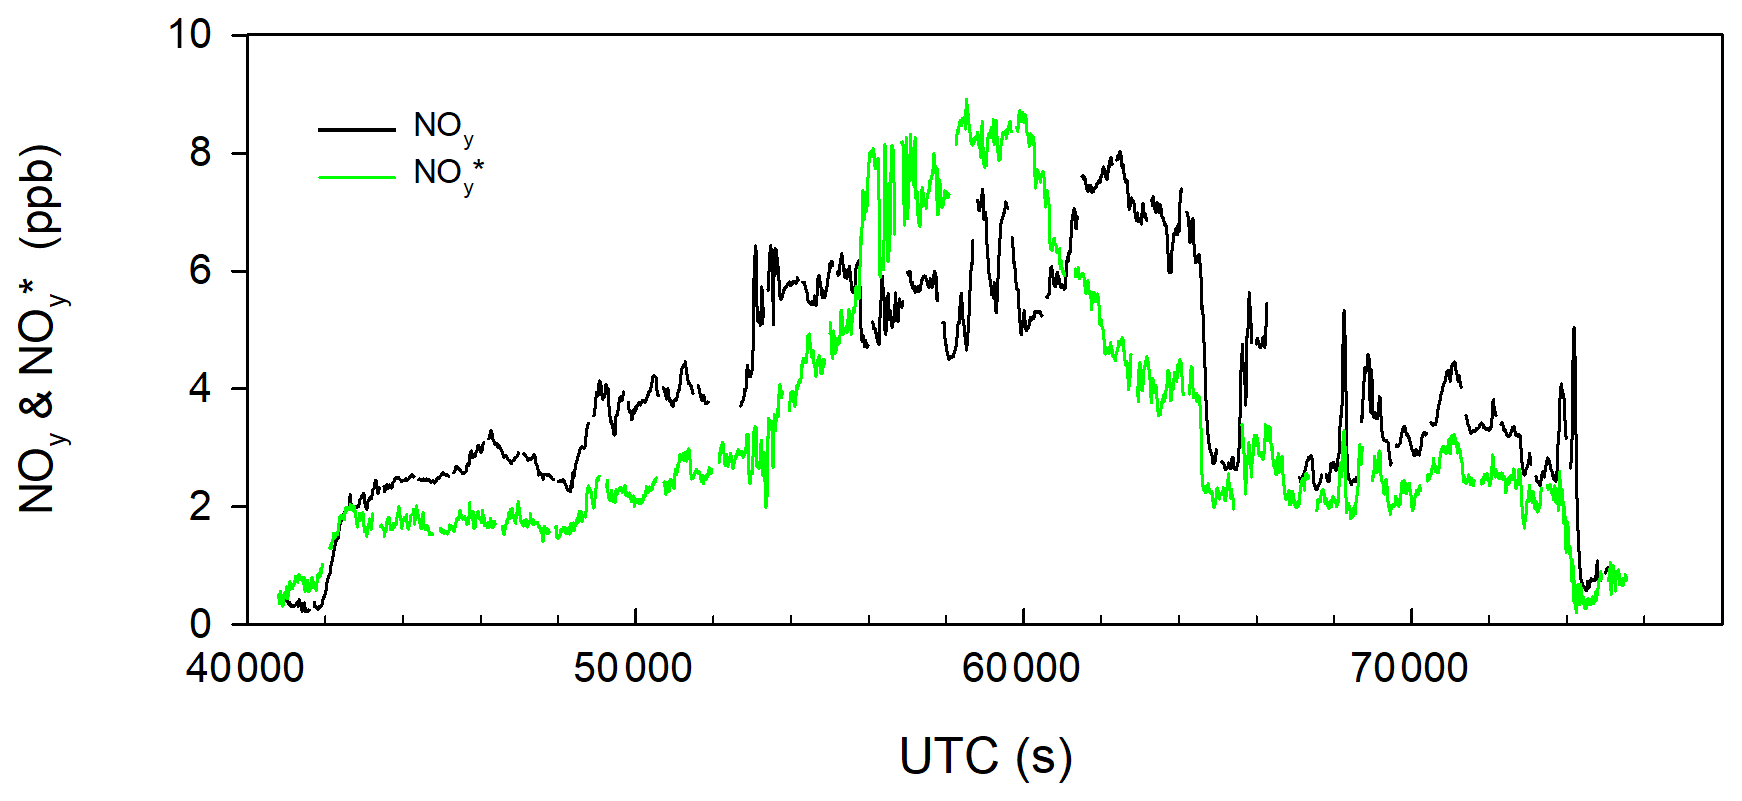
During the mid-winter phase, the observed relation between NOy and N2O differs significantly from the situation in the early-winter phase or from the observations at midlatitudes as during TACTS in 2012. This deviation was already observed during the first local flight out of Kiruna on 18 January. The flight went along the east side of Sweden and then along the coast of Norway back to Kiruna. The main scope of this mission flight was the probing of filamented stratospheric air (Oelhaf et al., 2019). At altitudes above 12 km, significantly higher NOy concentrations were measured, with values up to about 10 ppb, than during the December flight, with maximum values up to 3.4 ppb (Fig. 2). In parallel, the N2O concentration was as low as 280 ppb. At the beginning and end of the flight, NOy and NO were nearly identical. NOy and NO also agreed between about 41 600 and 44 000 s UTC when HALO flew close to the tropopause. Outside these periods, observed NOy was significantly higher than calculated NO. In Fig. 6b, NOy is shown versus N2O along with NO. For stratospheric N2O concentrations, observed NOy levels were much higher than NO by up to about 6 ppb. This excess NOy cannot be explained by any unknown additional tropospheric source as the deviation from NO increases with decreasing N2O. The excess NOy amounts to about 50 % of the whole gas-phase total reactive nitrogen and is also reflected in the highly variable NOy O3 ratio during this flight. High ratios have been found along with high values for dNOy. Values of the NOy O3 ratio changed from around 0.004 to values up to about 0.01. Observations with the GLORIA instrument on board HALO complement the in situ observations down to upper troposphere and also show nitrification of the lowermost stratosphere (Braun et al., 2019). Figure 2d shows a section through the atmosphere below HALO's flight altitude for the flight on 18 January. For this flight, typical vertical resolution of ∼ 500–1000 m was diagnosed for the chemistry mode data. A typical total uncertainty (1σ) of the order of 10 %–20 % is estimated for this particular flight. Both vertical resolution and total errors thereby depend on altitude and observed scenery.
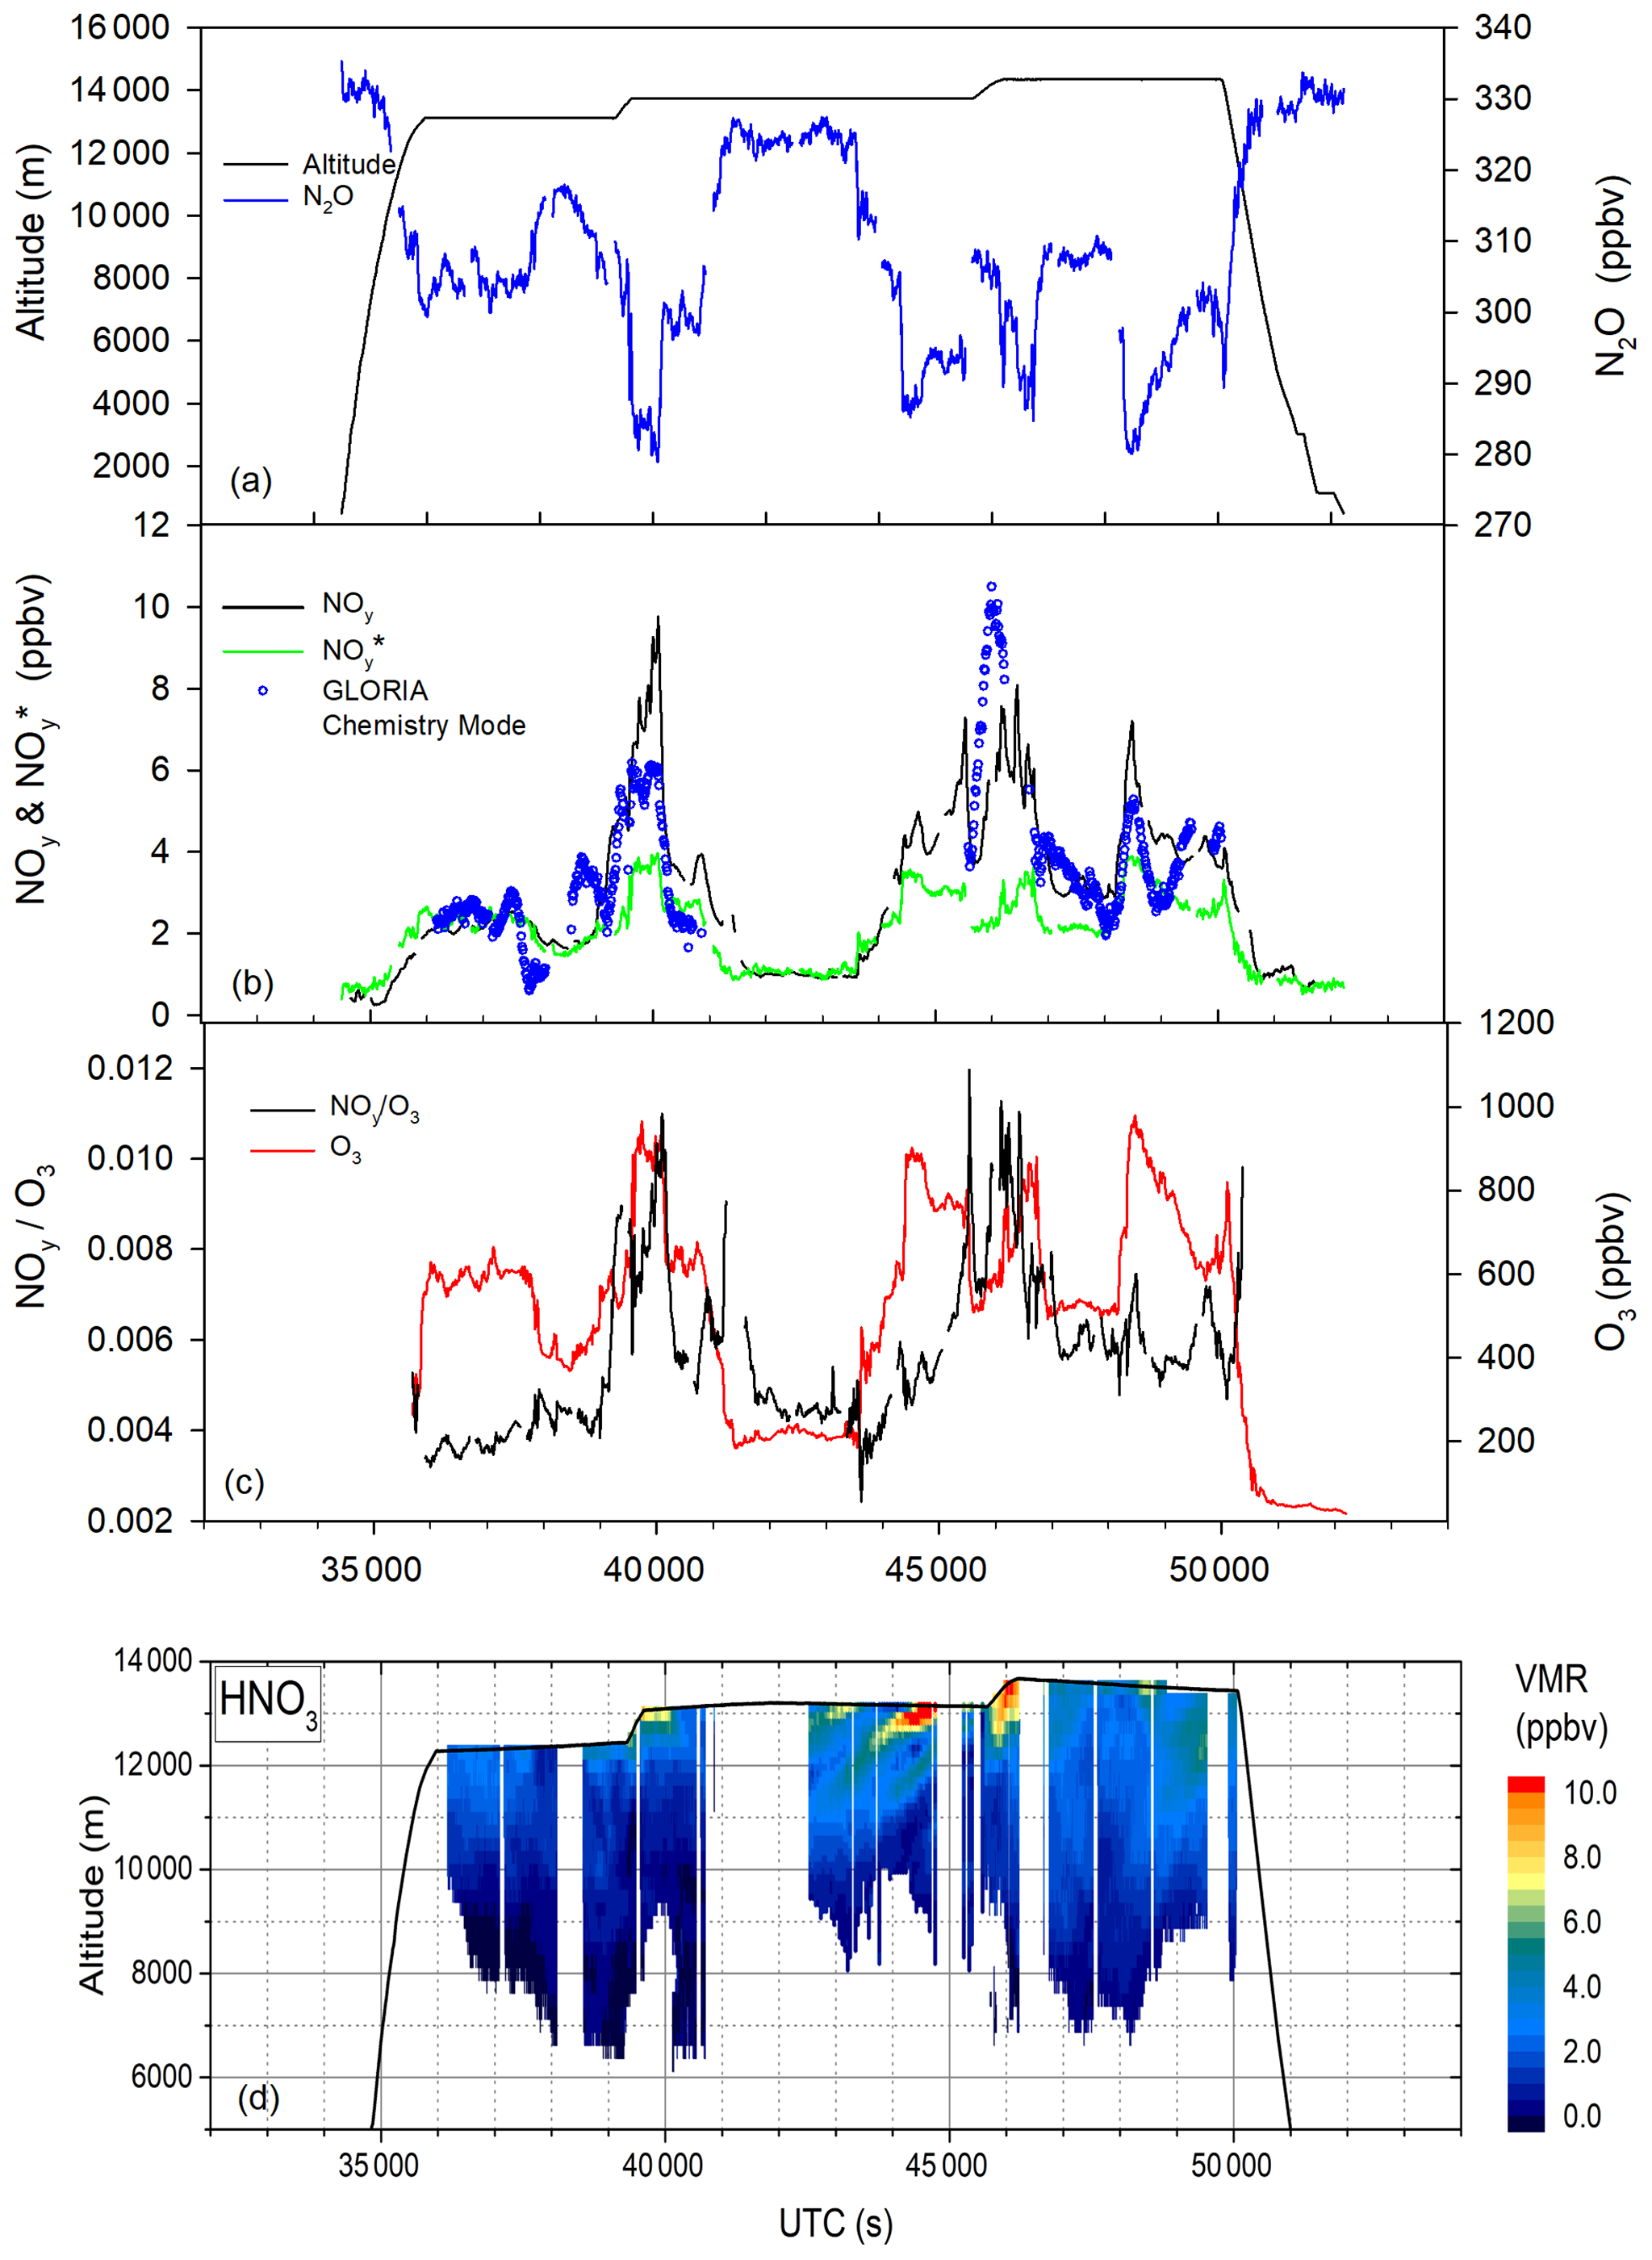
Figure 2PGS flight 7 on 18 January 2016. (a) Altitude and N2O; (b) NOy (observed), NO(calculated), and HNO3 (GLORIA instrument); (c) NOy O3 ratio and O3; and (d) HNO3 observed with GLORIA.
In Fig. 2b nitric acid obtained in the high spectral resolution “chemistry mode” of GLORIA for this flight is shown along with in situ observed total reactive nitrogen. Although air masses probed with GLORIA and AENEAS are not identical, a high agreement between both measurements was found.
Substantial deviations of observed NOy from expected NO have been observed during nearly all POLSTRACC flights of the mid-winter phase. A further example for a flight with enhanced NOy is given in Fig. 3. The flight on 31 January led towards the north of Scotland and Ireland and further north to about 76∘ N. West of Ireland and Scotland, HALO dived into the troposphere and encountered clean tropospheric air masses with NOy and O3 values down to about 0.2 and 30 ppb, respectively. For this phase of the flight, no NO was determined, because the above-given relation is only valid for stratospheric conditions. Between roughly 44 000 and 52 000 s UTC, N2O values between about 300 and 260 ppb was observed. Concurrently, ozone and total reactive nitrogen increased (not shown). During this period, observed NOy values were up to more than twice as high than estimated NO. dNOy ranged between about two and more than 6 ppb. Again, higher NOy concentrations are also reflected in a higher NOy O3 ratio. These findings suggest a substantial redistribution of total reactive nitrogen in the lower Arctic stratosphere. Particles containing total reactive nitrogen can sediment down to HALO flight altitudes within a few days. The fall speed for particles with diameter of 10 µm and above is more than 1 km d−1 (Fahey et al., 2001). Here, evaporation of the particles leads to increased NOy volume mixing ratios. The interpretation of this observation as particle-based redistribution is supported by lidar observations from space and from HALO. CALIOP detected PSCs in the Arctic stratosphere between December and late January at altitudes between 15 and 26 km (Pitts et al., 2018).
Lidar observations on board HALO also show extensive regions of polar stratospheric clouds. On 22 January, a large ice PSC was detected with a horizontal expanse of about 1400 km and thickness of up to 6 km between 18 and 24 km altitude (Voigt et al., 2018). Observations of nitrification of the lower stratosphere up to more than 10 ppb by evaporating particles have also been made during previous airborne missions to the Arctic and Antarctic (Hübler et al., 1990; Fischer et al., 1997; Arnold et al., 1998; Dibb et al., 2006; Molleker et al., 2014).
The interpretation of the elevated level of NOy as remnants of evaporated particles during POLSTRACC is also supported by the observation of particulate nitrate at flight altitude. During several flights, indications for the occurrence of particles containing nitrate have been found (see Sect. 3.3).
3.2.3 Late-winter phase
The third mission phase covered the period between 26 February and 18 March 2016. In total 13 flights were performed in late winter. Again, most of the flights led from Kiruna to regions north of 60∘ N. Late winter was characterized by descending air masses with lower N2O concentrations and higher potential temperature at HALO flight altitudes.
At the beginning of the third mission phase, the NOy distribution in the lower stratosphere was characterized by the transition of the influence of sedimentation and evaporation of particles to the influence by downward-transported air masses that have been denitrified before. The flight on 26 February (Figs. 4 and 6d) may serve as an example. One objective of this flight was observation in a stratospheric cold pool west of Greenland. On its way to Baffin Island total reactive nitrogen was generally higher than calculated NO. dNOy amounted to about 4 ppb. Over Baffin Island, N2O dropped down to values of about 205 ppb while concurrently potential temperature reached values of more than about 395 K (not shown). In these air masses descended from the stratosphere above, observed NOy was about 4 ppb below calculated NO. On the way back to Kiruna, HALO again encountered air masses with observed NOy levels exceeding NO. Thus, during this flight, signatures of both nitrification and denitrification were observed, demonstrating the filamentous structure of the lower stratosphere.
During the further course of the POLSTRACC mission, the influence of the sedimentation and evaporation of particles on the composition of the lowermost stratosphere further decreased. On 13 March, the flight led from Kiruna to Kangerlussuaq in Greenland (Fig. 5). Observed NOy was nearly identical with calculated NO during large sections of the flight. During the last quarter of the mission at altitudes above 14 km, air masses with potential temperatures between 380 and 410 K have been encountered. Concurrently, N2O dropped down to minimum values of about 180 ppb over the western part of Greenland. Calculated NO exceeds observed NOy by up to 5 ppb. During ascent and descend of HALO, air masses close to the tropopause or below were encountered, where no correlation between NOy and N2O is expected. Figure 6e shows NOy versus N2O for this flight. Down to about 260 ppb N2O, observed NOy and calculated NO agreed within a reasonable uncertainty range. On average, the difference is about 0.08 ppb with a standard deviation of about 0.48 ppb. At lower N2O concentrations, observed NOy values were significantly lower than calculated NO. At around 180 ppb N2O, about 50 % of the calculated NO was missing. During the continuation of the flight from Kangerlussuaq to Oberpfaffenhofen in Germany (not shown), the potential temperature did not exceed 380 K, and N2O values remained above 260 ppb. During this flight no deviation of NOy from NO was found. As mentioned earlier, besides the flight from Kangerlussuaq to Oberpfaffenhofen, most of the flights stayed north of about 60∘ N. One exemption was the flight on 16 March to the Canary Islands. Within the accuracy of the measurement, no significant deviation of observed NOy from NO was found (not shown). In situ observations from HALO revealing denitrified air masses fit well in the overall picture of this winter. They complete the picture arising from satellite observations and model simulations for this winter. Denitrified air masses have been observed with the Aura microwave limb sounder (MLS) (Manney and Lawrence, 2016). Simulations with the EMAC model showed both denitrified zones in the middle stratosphere and regions with enhanced total reactive nitrogen below for December to February. By mid-March, the denitrified zone stretches down to pressures higher than 100 hPa (Khosrawi et al., 2017).
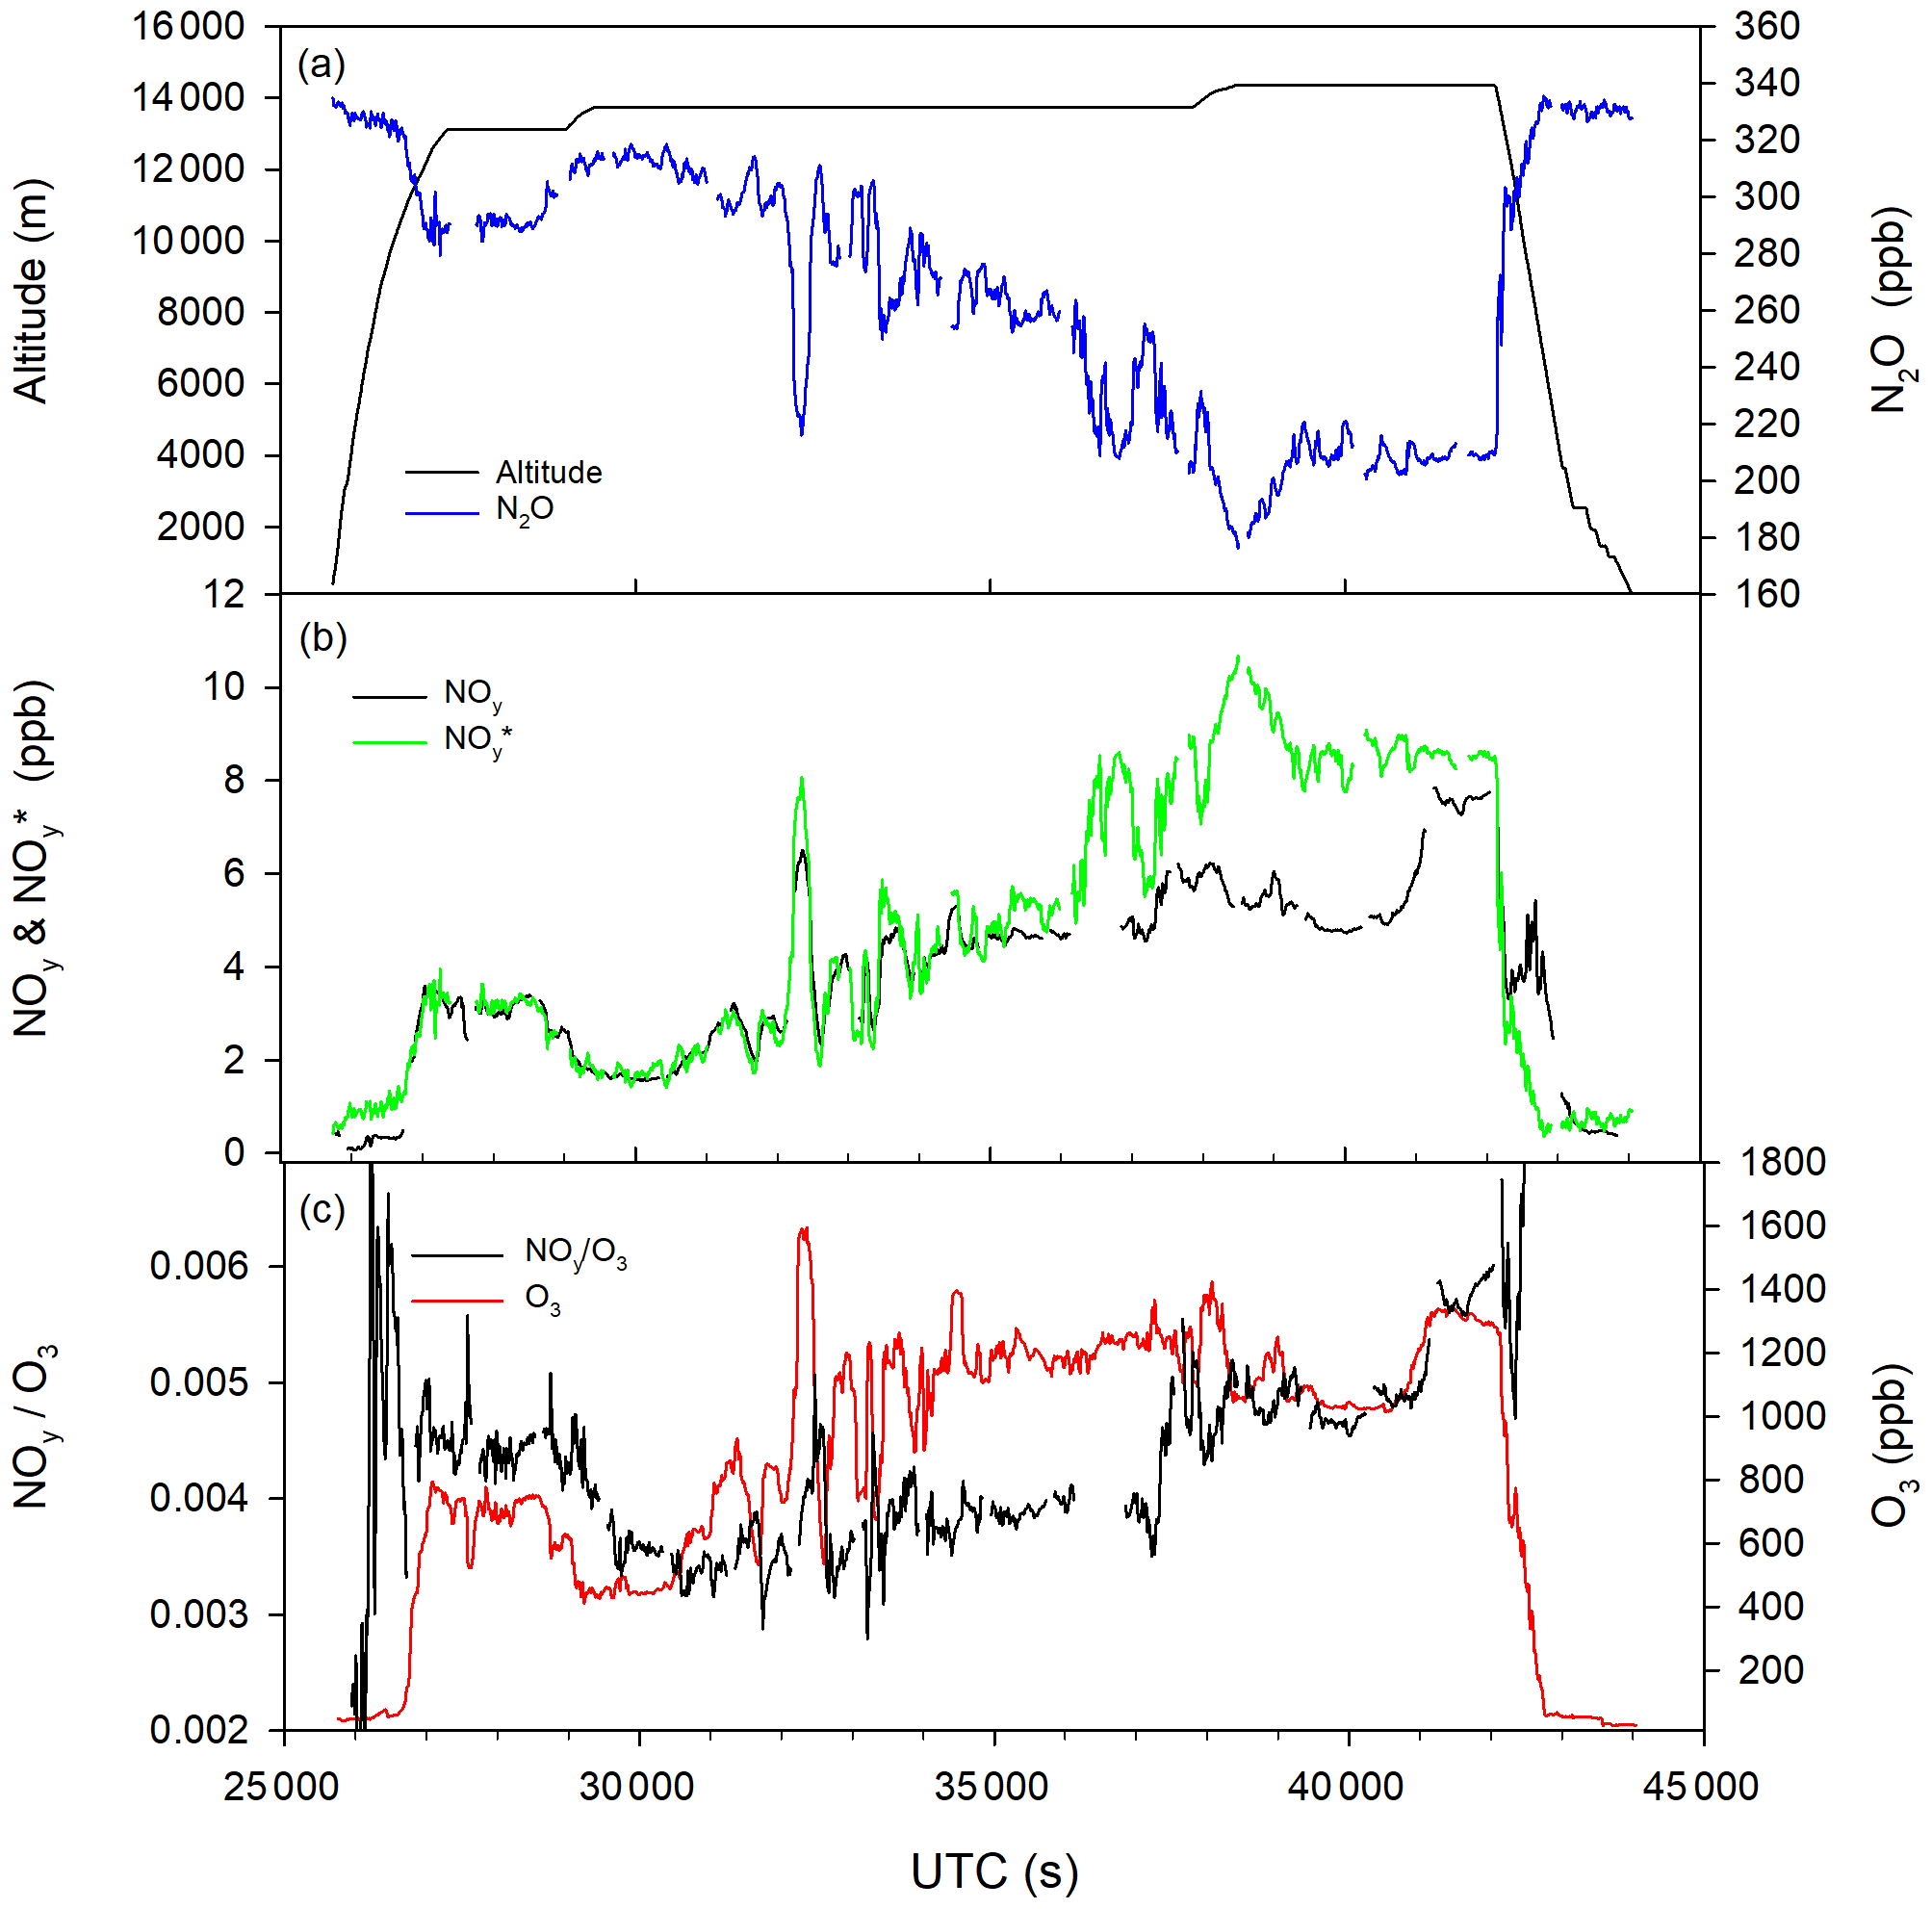
Figure 5PGS flight 19 on 13 March 2016. (a) Altitude and N2O; (b) NOy (observed) and NO(calculated); (c) NOy O3 ratio and O3.
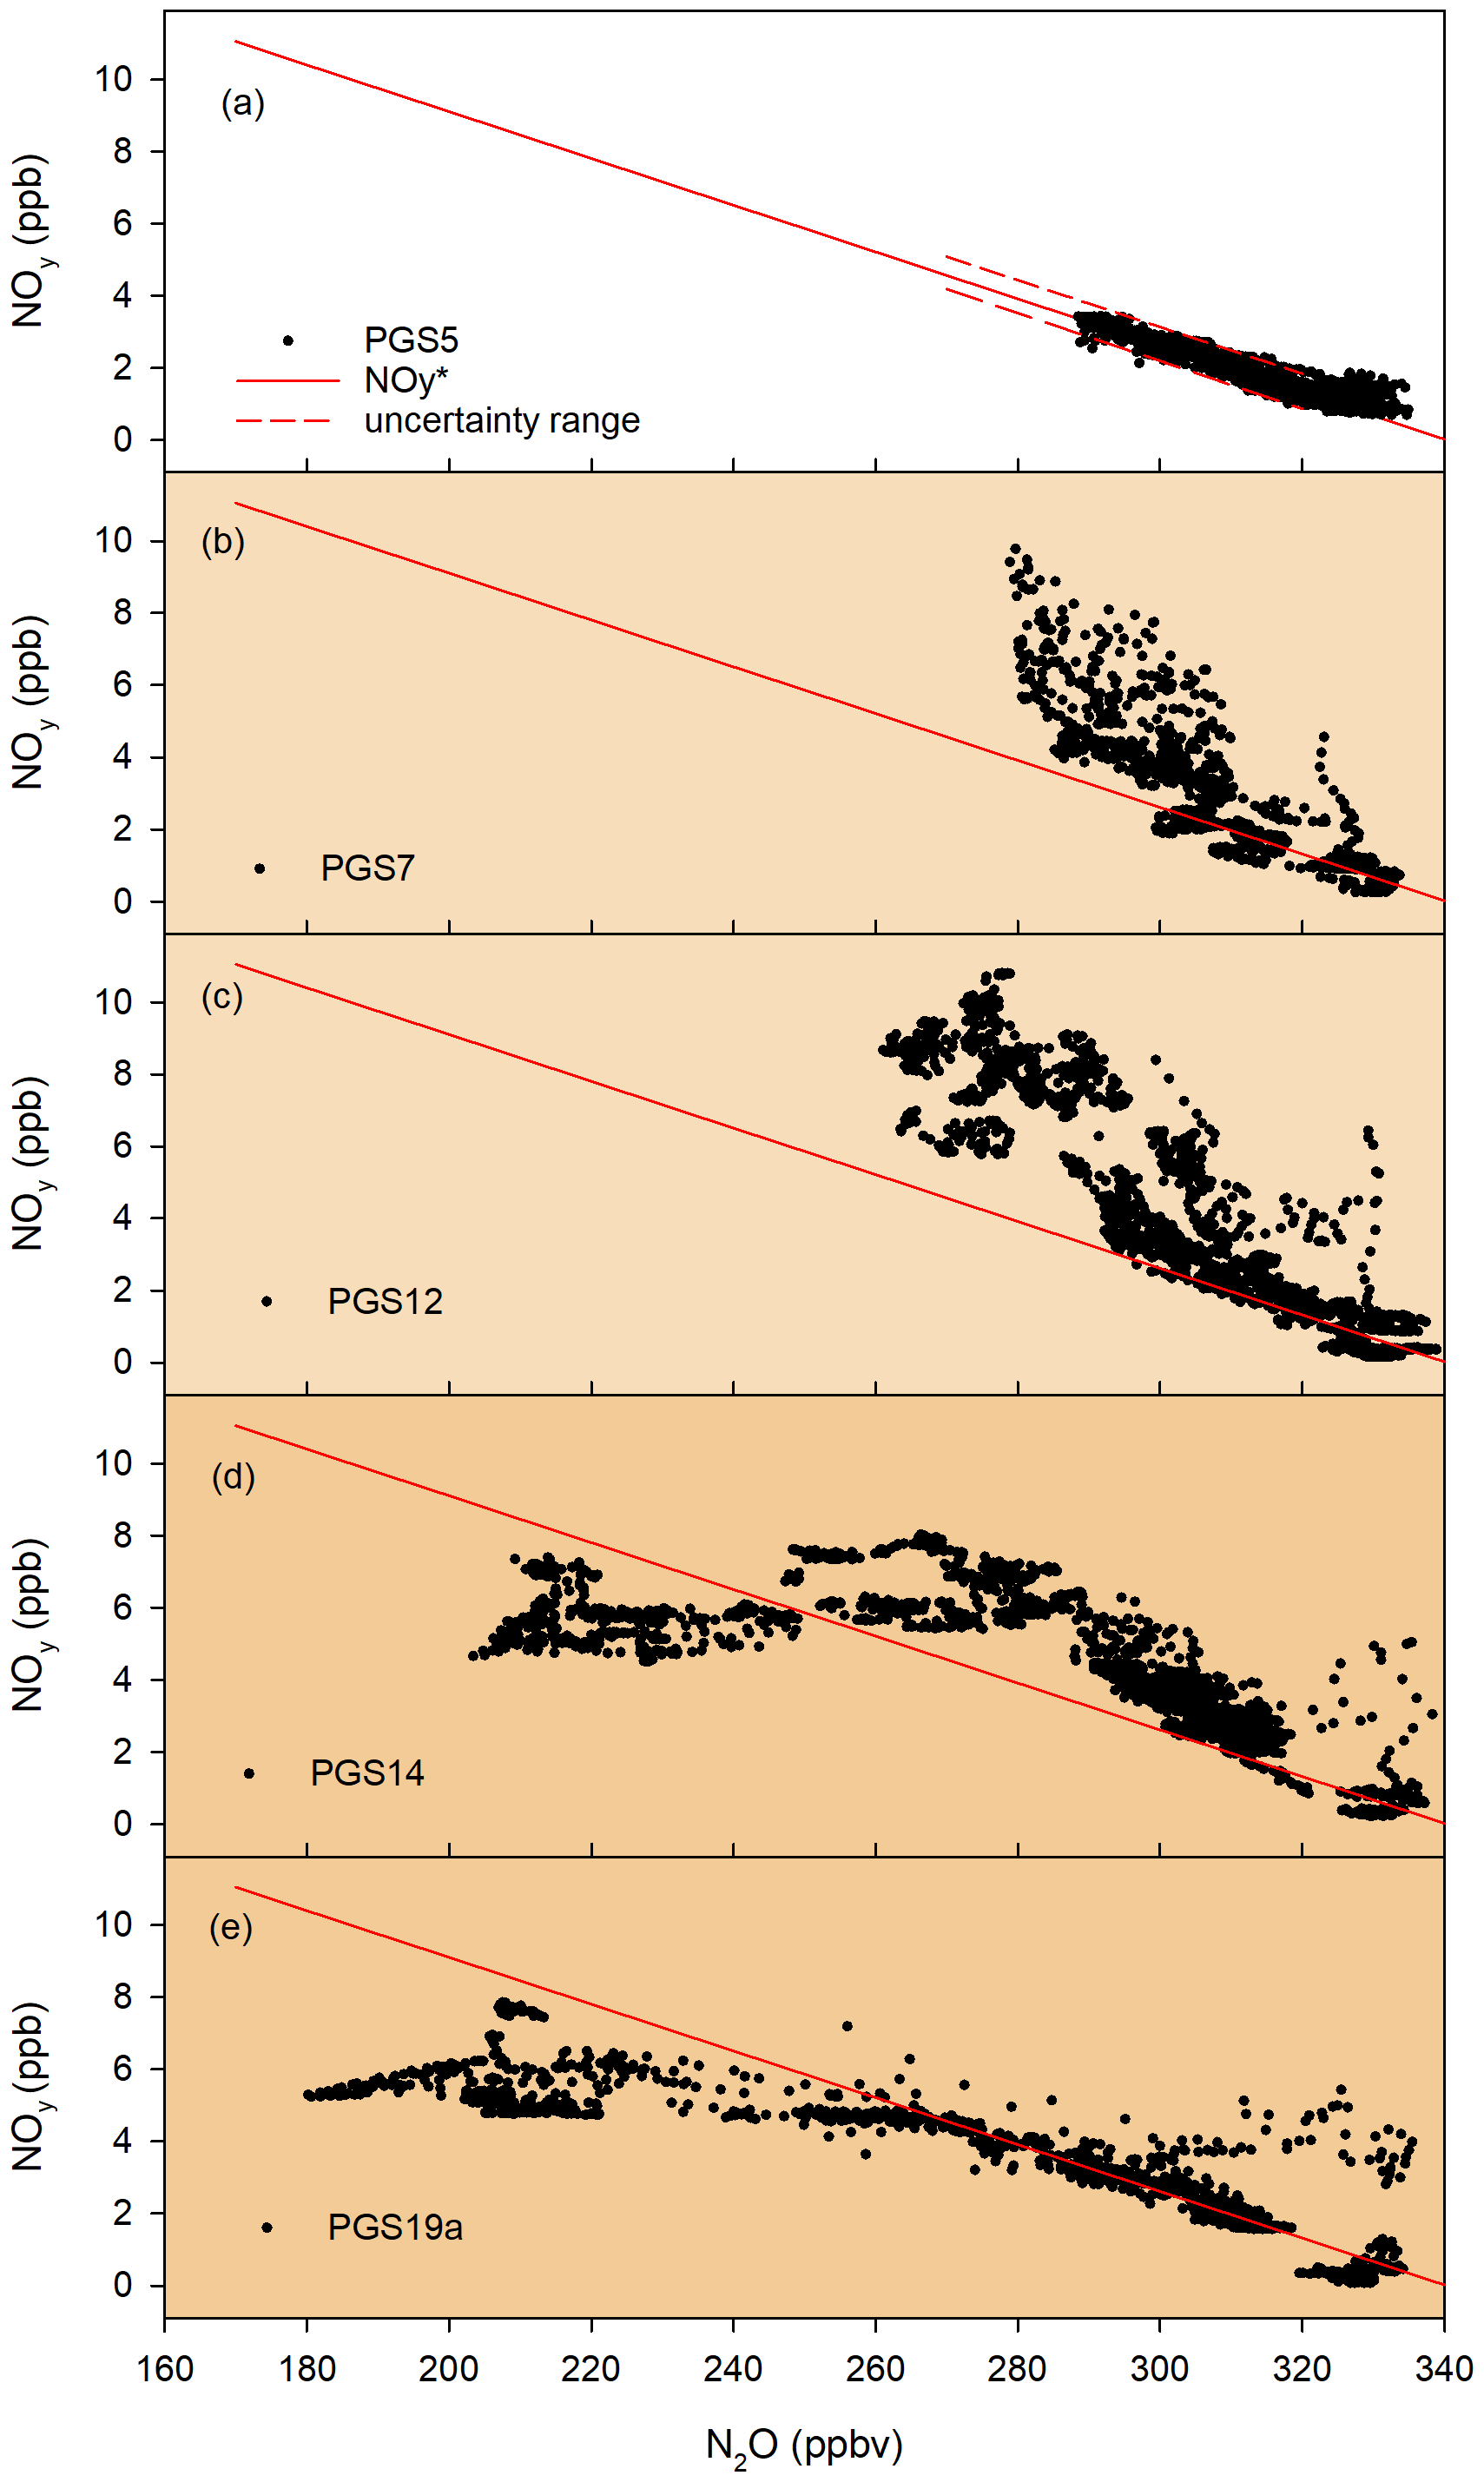
Figure 6NOy and NO versus N2O for selected flights in three observational phases. Early winter: PGS flight 5 – 21 December 2015, mid-winter: PGS flight 7 – 18 January 2016 and PGS flight 12 – 31 January 2016, late winter: PGS flight 14 – 26 February 2016 and PGS flight 19a – 13 March 2016. The uncertainty range arising from the linear least squares fit for PGS flight 5 is indicated by dashed lines.
Figure 7a summarizes all concurrent NOy–N2O observations during POLSTRACC. The data are grouped in sub-datasets according to the three mission phases. The NOy–N2O data field seems to be split into two major branches divided by the line representing NO. During the early-winter phase (points in black), the NOy–N2O data pairs are essentially grouped around the NO curve. The mid-winter period (points in red) is mostly characterized by values lying above NO, for N2O concentrations between about 250 and 300 ppb. The late winter (points in blue) shows values above NO as well as values below. Values below NO are associated with N2O values below about 250 ppb. As pointed out earlier, this cannot be attributed to the deviation of NOy from the linear correlation at low N2O concentrations which is only expected for N2O concentrations below about 100 ppb (Loewenstein et al., 1993). In Fig. 7b, dNOy versus N2O is presented for the three mission phases. The values range between about +6 and −6 ppb. In both figures, high values of NOy and dNOy for N2O values close to 320 ppb indicate tropospheric air masses where the relation between NOy and N2O is not valid.
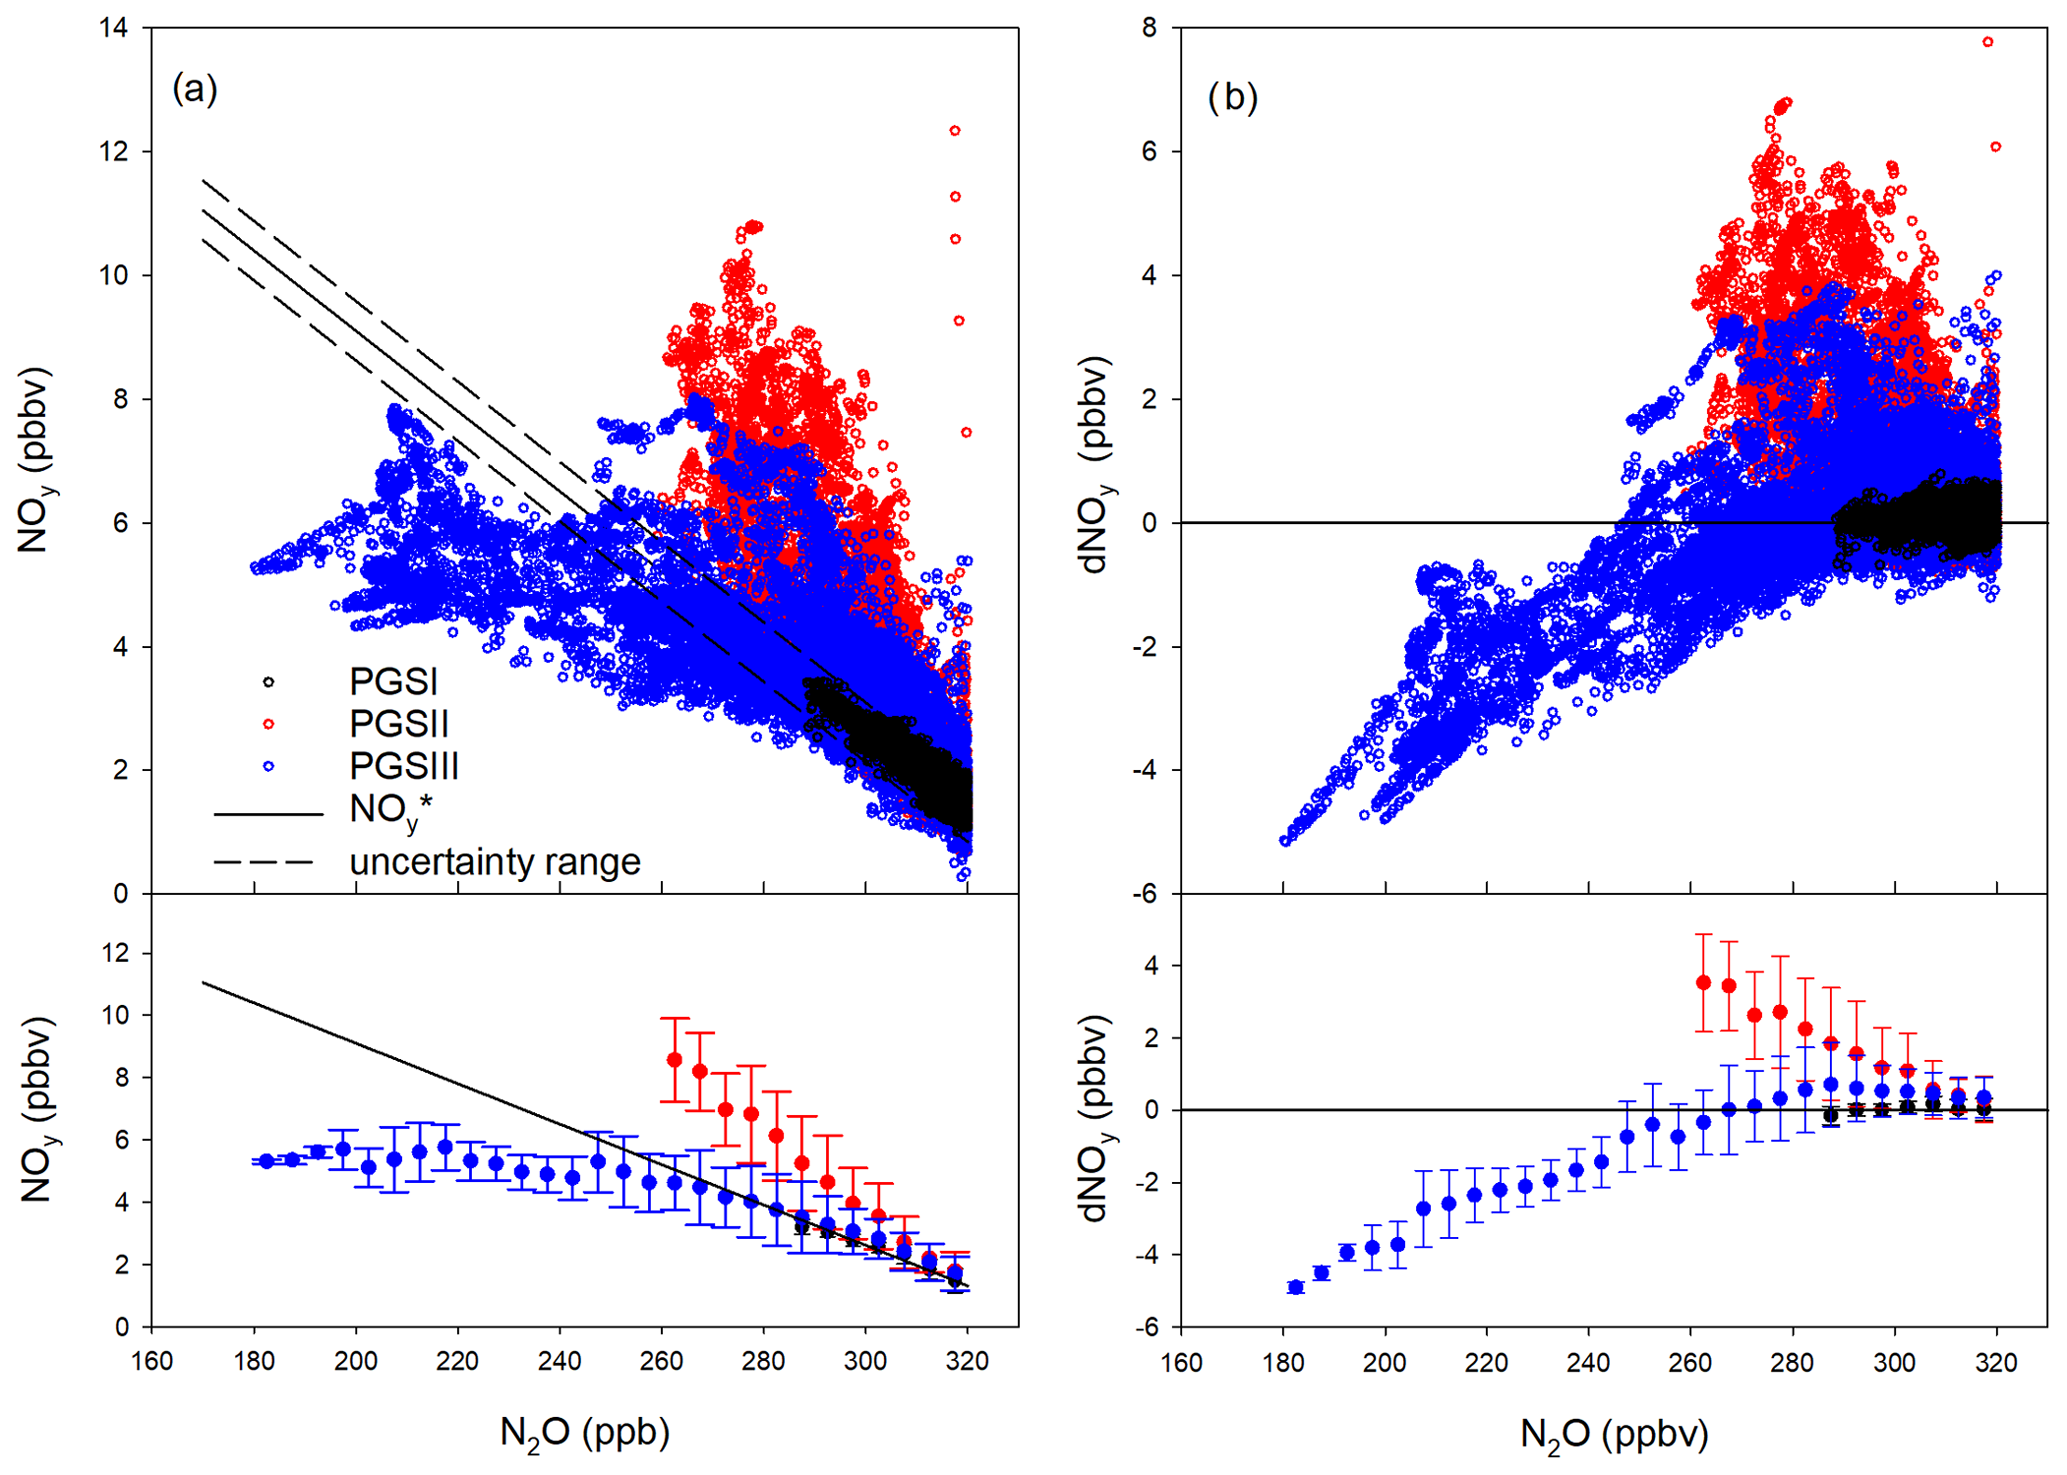
Figure 7(a) NOy and NO versus N2O for all POLSTRACC flights. The three phases of the POLSTRACC mission are colour coded. Values are additionally given as means (averaged over 5 ppb N2O intervals) along with standard deviation. Calculated NO is shown as a solid line; the uncertainty range is indicated by dashed lines. (b) Same as (a) but with dNOy versus N2O.
The influence of downward transport on nitrification or denitrification is also reflected in Fig. 8. Here dNOy is shown versus potential temperature. Positive values of dNOy are predominantly found between 340 and 370 K during the flights in January. The largest denitrification was observed in air masses with potential temperatures between 390 and 410 K in late winter. The highest values of nitrification or denitrification, respectively were each found at the highest flight altitude of approximately 14 km. During previous observations, evidence for denitrification has mainly been found at higher altitudes in the stratosphere. For example, in February 1995, measurements with the MIPAS-B balloon instrument found a 50 % reduction in NOy at altitudes between 16 and 22 km (Waibel et al., 1999). Denitrification was also detected by satellite observations in winter 2009/2010 in the Arctic between about 475 and 525 K (Khosrawi et al., 2011). With the CLaMS model, denitrification at about 500 K and nitrification at about 400 K were simulated for this winter (Grooß et al., 2014).
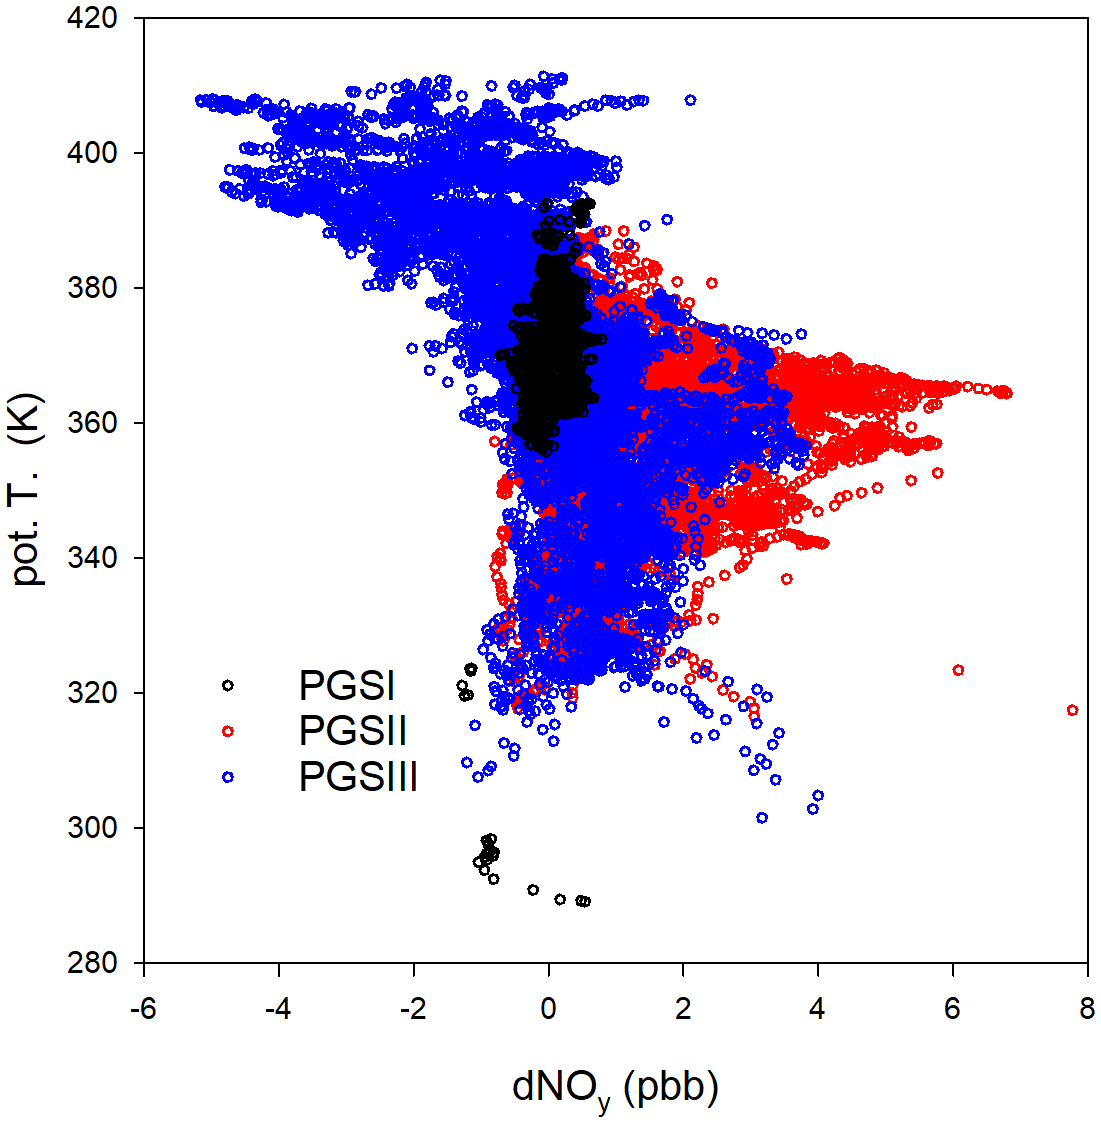
Figure 8dNOy colour-coded for the three POLSTRACC phases (early, mid, and late winter) versus potential temperature.
The POLSTRACC mission covered the whole winter season from December to mid-March, providing the unique opportunity to probe the lowermost stratosphere under different conditions. The distribution of reactive nitrogen changed from undisturbed condition in early winter to a condition with elevated concentrations (nitrification) and finally to a condition with lowered concentrations (denitrification) in late winter. This transformation of the reactive nitrogen distribution in the lower Arctic stratosphere is shown in Fig. 6. In this figure the NOy–N2O relation for five selected flights is depicted. The sequence of these figures illustrates the temporal evolution of NOy at the bottom of the vortex. In early winter (Fig. 6a) NOy and N2O are well correlated, reflecting the fact that the distribution is controlled by the gas-phase production of NOy from N2O. In mid-winter (Fig. 6b and c) the observed NOy exceeds the calculated NO by several parts per billion (ppb), indicating the influence of the evaporation of sedimenting particles containing nitric acid. In late winter the distribution of NOy is controlled by the downward transport of air masses that have undergone removal of nitric acid by heterogeneous processes (Fig. 6e). Figure 6d shows a flight typical for the transition between the mid- and late-winter distribution of NOy. The observations at HALO flight altitude reflect the processes in the stratosphere above. Denitrification in the middle stratosphere by heterogeneous processes and removal by sedimenting particles happened at nearly the same time as nitrification by evaporating was observed at the lowermost stratosphere. However, descending denitrified air masses at flight altitudes were first observed with a time lag of several weeks in late winter. In a certain way, the vertical distribution of NOy in the winter stratosphere was mapped to a temporal variation at HALO flight altitude.
Air masses processed in the polar vortex can also be transported to midlatitudes. Figure 9 shows dNOy in coordinates of equivalent latitude and theta (potential temperature). Equivalent latitude takes advantage of the adiabatically quasi-conserved nature of potential vorticity. It therefore removes the variability in trace gas distributions that originates from reversible deviations from the climatological mean due to Rossby and smaller-scale waves (see Hegglin et al., 2006). The early-winter period shows a relatively undisturbed distribution of reactive nitrogen, the dNOy values are close to zero.
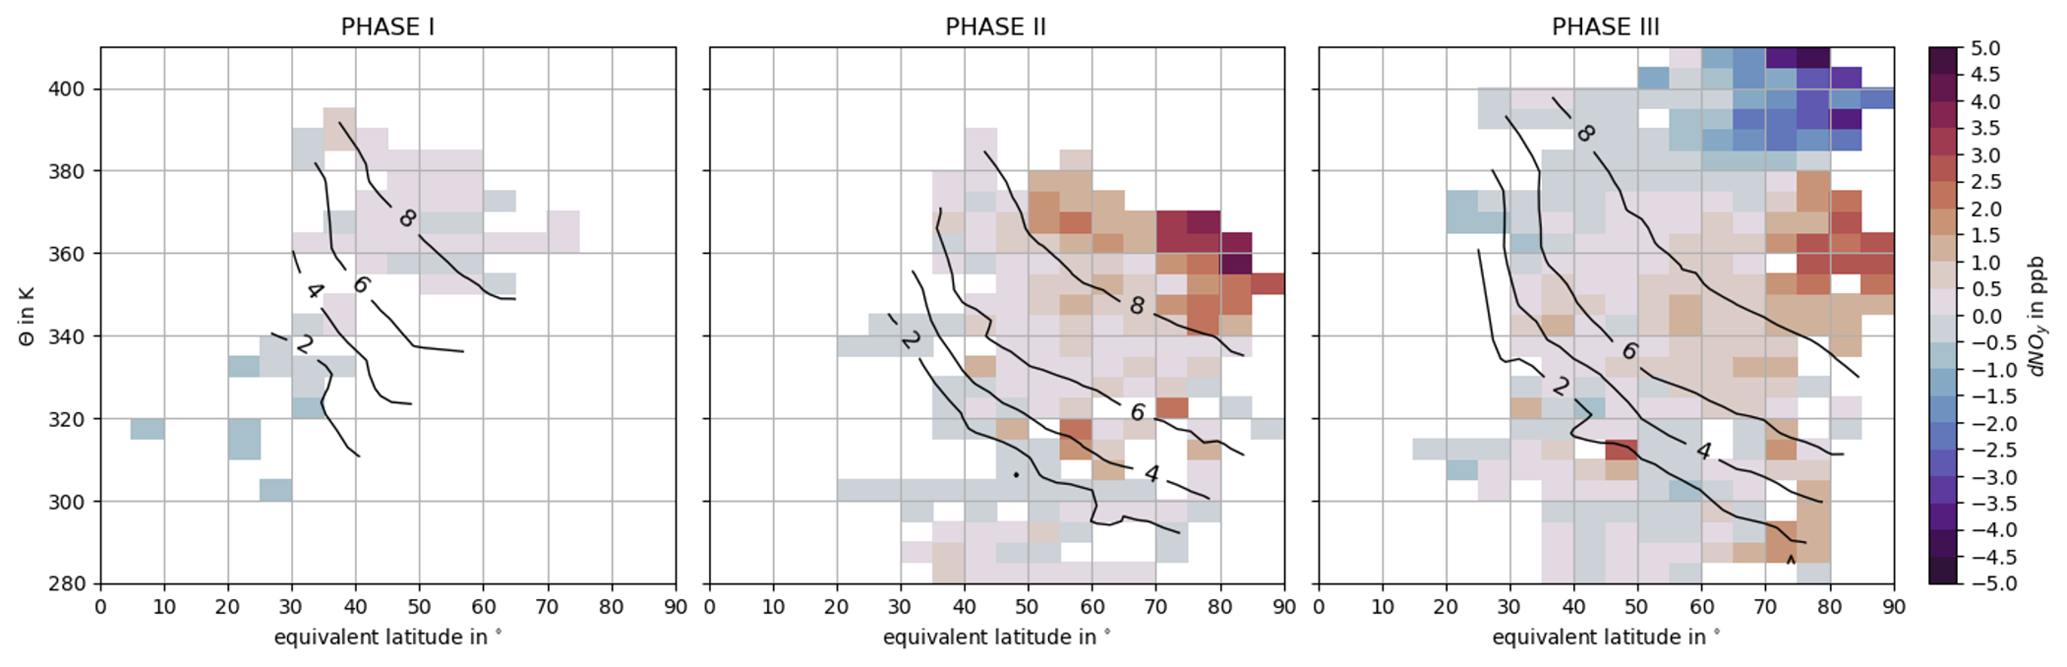
Figure 9Distribution of dNOy in coordinates of equivalent latitude and potential temperature (theta) during phase I (13 December–21 December), phase II (12 January–2 February), and phase III (26 February–18 March). The black contours show potential vorticity in PVU.
The mid-winter period is mostly characterized by positive dNOy values, particularly above 340 K and polewards of 50∘ N equivalent latitude. The late-winter period shows a nitrified region at the same location but with weaker nitrification than in phase II. A denitrified region is located above, predominantly at potential temperature over 380 K and equivalent latitudes over 50∘ N. However, weak denitrification with losses up to 1 ppb is also observed throughout the whole latitude range above 360 K, even outside the vortex. Similarly, at lower isentropes slightly positive values of dNOy at lower equivalent latitudes are consistent with export of former vortex air to lower latitudes (Hoor et al., 2004; Krause et al., 2018). These findings indicate transport and mixing of vortex processed air masses to the mid-latitude lowermost stratosphere in late winter and early spring.
As was pointed out earlier, the NOy O3 ratio is a further diagnostic tool for studying processes in the lower stratosphere. Evaporating particles lead to a nitrification of the lowermost stratosphere and this process finds its echo in the increase of the NOy O3 ratio as can be seen in Fig. 2. The influence of the denitrification in the late-winter phase does not form such an obvious signature in the NOy O3 ratio. For example, Fig. 5c shows the NOy O3 ratio versus time for the flight on 13 March. Before about 37 000 s UTC, NOy and NO agree reasonably well. There are no indications for denitrification during this part of the flight. In the further course of the flight the difference between NOy and NO increased along with decreasing N2O concentrations, a clear signature of denitrification. The NOy O3 ratio, however, does not decrease during this period as one might expect but it increased from about to about . The obvious explanation for these observations is that not only NOy was removed from the air masses but also ozone. In the sense of the NOy O3 ratio the decrease in NOy by denitrification is counterbalanced by the decrease in ozone.
As a plausibility check, with a rough back-of-the-envelope calculation, the missing ozone can be estimated for this flight. Between about 37 000 and 42 200 s UTC, the denitrification amounted to about 5 ppb, and the NOy O3 ratio increased to about 0.0048. Based on these observations and assuming an “undisturbed” NOy O3 ratio of 0.004, on average, concentrations of the order of about 1 ppm ozone were missing during this flight period. This is at least roughly in accordance with a much more detailed simulation using the CLaMS model. For this POLSTRACC flight, a chemical ozone depletion of more than 1 ppm or about 50 % was estimated (Oelhaf et al., 2019).
The temporal evolution of the sub-vortex region is also visible in an ozone–nitrous oxide coordinate system. Figure 10 shows the correlation between these two trace gases for the same flights as in Fig. 6. In addition, the regression line resulting from a linear least squares fit analysis of the December flight is plotted. Similar criteria apply to this tracer relationship as for the NOy–N2O correlation (Hegglin et al., 2006; Hegglin and Shepherd, 2007; Bönisch, 2011). A slope of −18.5 was derived from the December 2015 flight. This compares quite well with the mid-latitude slope derived from the September data during the TACTS flights (see above) of −19.2. From late January through to the end of the mission, the observed ozone concentrations deviate more and more from the regression line to lower values. The difference increases with decreasing nitrous oxide concentrations, parallel to the evolution of the NOy–N2O correlation in Fig. 6. Thus, the denitrification observed in the descending air masses is also reflected in an ozone decrease.
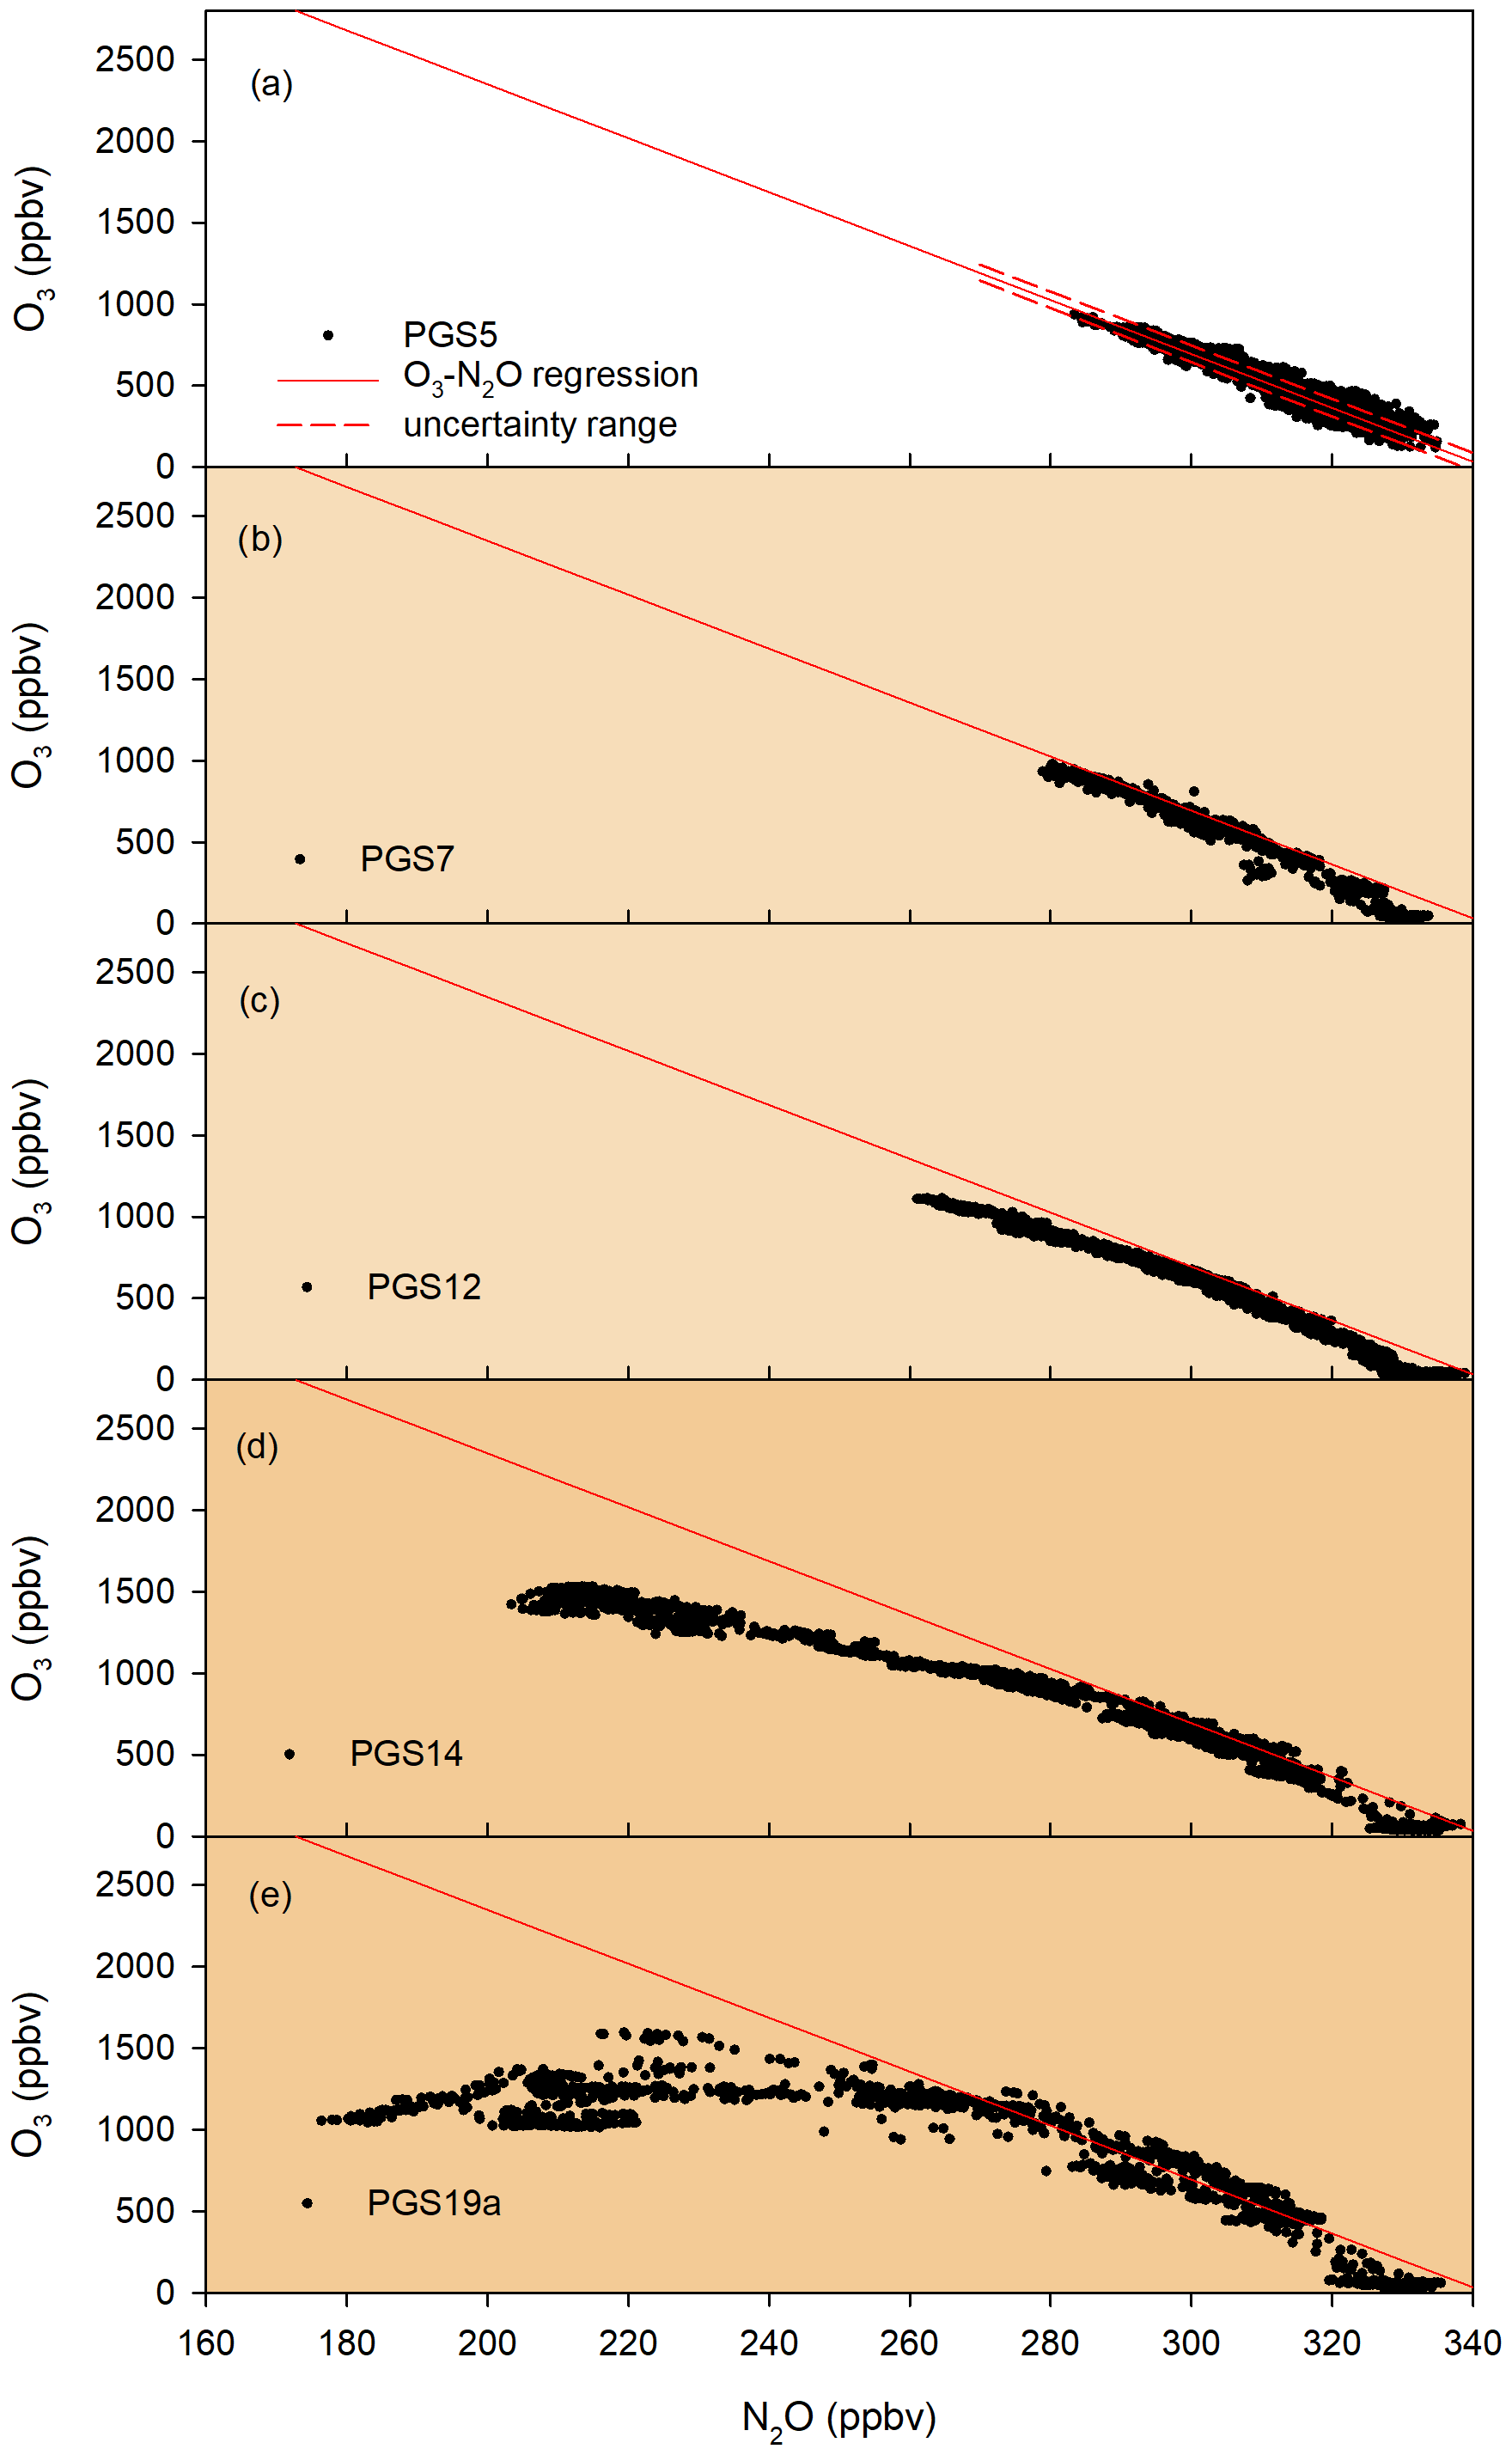
Figure 10O3 versus N2O for selected flights (same as in Fig. 6) in three observational phases. Early winter: PGS flight 5 – 21 December 2015, mid-winter: PGS flight 7 – 18 January 2016 and PGS flight 12 – 31 January 2016, late winter: PGS flight 14 – 26 February 2016 and PGS flight 19a – 13 March 2016. Additionally, the regression line resulting from the December flight is given. The uncertainty range of the regression is indicated by dashed lines.
3.3 Observations of particulate nitrate
The POLSTRACC payload mainly comprised in situ gas-phase and remote sensing instruments. It did not include instruments for specific measurements of particle parameters. However, the NOy detector offers an indirect method to observe particles containing reactive nitrogen compounds. For these measurements, the oversampling characteristic of the forward-facing inlet was used. With the backward-facing inlet, only gas-phase total reactive nitrogen is measured (see Sect. 2.1.1). Particles evaporating within the inlet system release nitrate molecules that are detected by the NOy instrument. During one episode during the flight on 18 January, the resulting chemiluminescence signal was even so high that it could not be processed by the detection electronics.
During the mid-winter phase of POLSTRACC, particulate nitrate has been observed during four flights using this measurement approach. The flight on 20 January went from Kiruna north towards Spitzbergen, then westwards towards Iceland and back to Kiruna. One mission objective was to probe forecasted nitrification of the lowermost stratosphere. Gas-phase NOy ranged between about 1 and 8 ppb at altitudes between 12.5 and 14.3 km (see Fig. 11). During four periods, the signal obtained with the forward-facing inlet was up to a factor of 50 higher than the gas-phase signal obtained with backward-facing inlet. In Fig. 11b total NOy measured with the forward-facing inlet is shown along with gas-phase NOy. NOy_tot is not corrected for enhancement and shows values up to 100 ppb. In total, the areas in which particulate NOy was observed during this flight extended over about 2000 km. Outside these episodes NOy obtained with the forward- and aft-facing inlet, respectively, agreed within about 7 % percent.
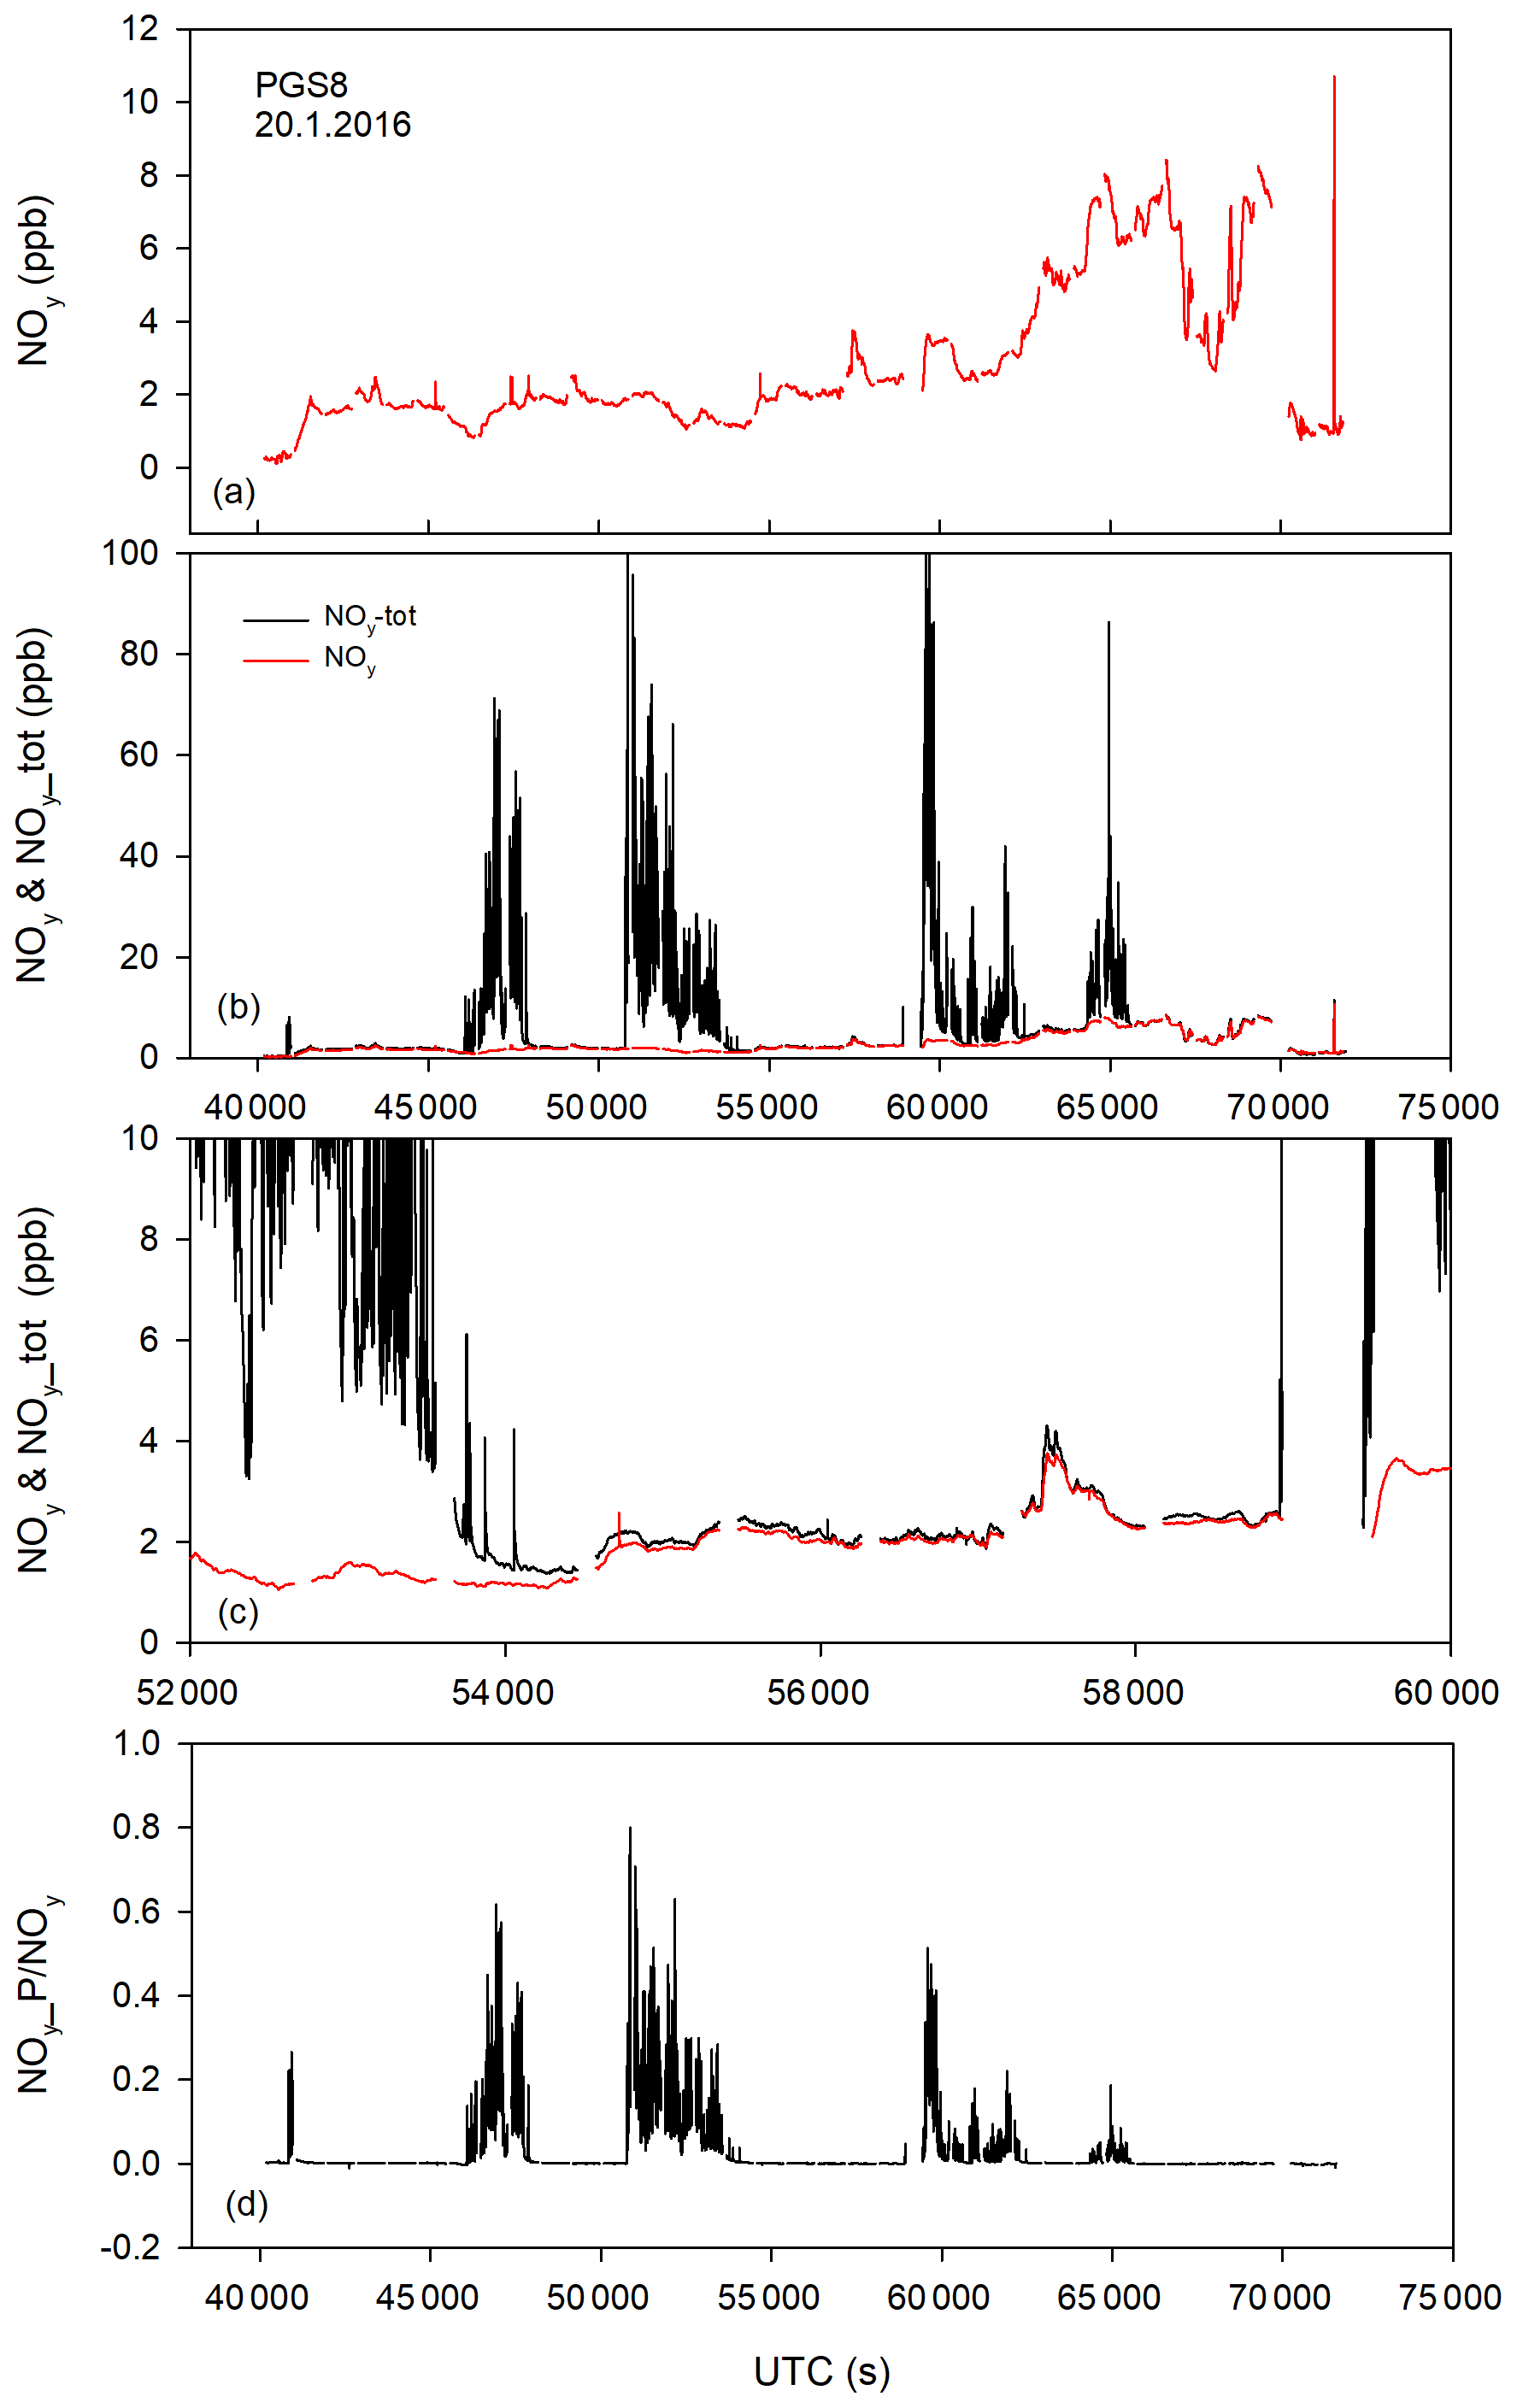
Figure 11POLSTRACC flight on 20 January 2016. During this flight, particulate nitrate was observed. (a) Gas-phase NOy, (b) total nitrate (including particulate nitrate) and gas-phase nitrate, (c) same as (b) but with a smaller time interval, and (d) ratio of particulate nitrate (corrected for enhancement) to gas-phase nitrate.
Particulate nitrate was observed in situ on HALO only during the mid-winter phase. In addition to the 20 January flight, particulate nitrate was also observed during the flights on 18, 25 and 31 January. The large-scale particulate events were observed over distances of approximately 800 to 1400 km. Widespread polar stratospheric clouds of different compositions have also been observed with the WALES lidar instrument (WAter vapour Lidar Experiment in Space – airborne demonstrator) on board HALO above flight altitude (Voigt et al., 2018). Between December and end of January, PSC particles have been detected with spaceborne lidar between 15 and 26 km (Pitts et al., 2018; Voigt et al., 2018).
The measurement approach, using the oversampling characteristic of inlets, has also been used during earlier aircraft missions in the Arctic. High NOy net values indicating particulate nitrate have been observed during the SOLVE mission in winter 1999/2000 from ER-2. Large fields of PSC particles were found between about 15 and 21 km (Northway et al., 2002). Also balloon-borne measurements confirmed the presence of NAT (Voigt et al., 2000) in that winter while liquid ternary solution particles (Schreiner et al., 1999) were observed in the THESEO winter before. During the VINTERSOL-EUPLEX mission in February 2003, single NAT particles have been observed at altitudes between about 18 and 20 km on board Geophysica (Voigt et al., 2005). Compared to previous observations, during POLSTRACC particulate nitrate was found at lower altitudes between about 10 and 14.5 km. This corresponds roughly to potential temperatures between about 310 and 370 K (Fig. 12).

Figure 12NOy_net versus altitude (a) and NOy_net versus potential temperature (b) for all flights with the occurrence of particulate nitrate (18, 20, 25, 31 January 2016).
The vapour pressure of nitric acid over NAT can be derived from measured NOy, water vapour, ambient pressure, and temperature using the expression given by Hanson and Mauersberger (1988). For estimating the saturation ratio, one can assume that observed NOy mainly consists of nitric acid in the stratosphere as confirmed by simultaneous measurements of nitric acid (Fig. 1). In Fig. 13 the saturation ratio of nitric acid is plotted along with the gas-phase equivalent of particulate nitrate. In general, a good agreement between the occurrence of particulate nitrate and high NAT saturation ratios was found. During the flight on 18 January, the saturation ratio was up to about 0.25 indicating ongoing evaporation of the particles. During the particle observations of the other flights, the air masses have been supersaturated with respect to NAT.
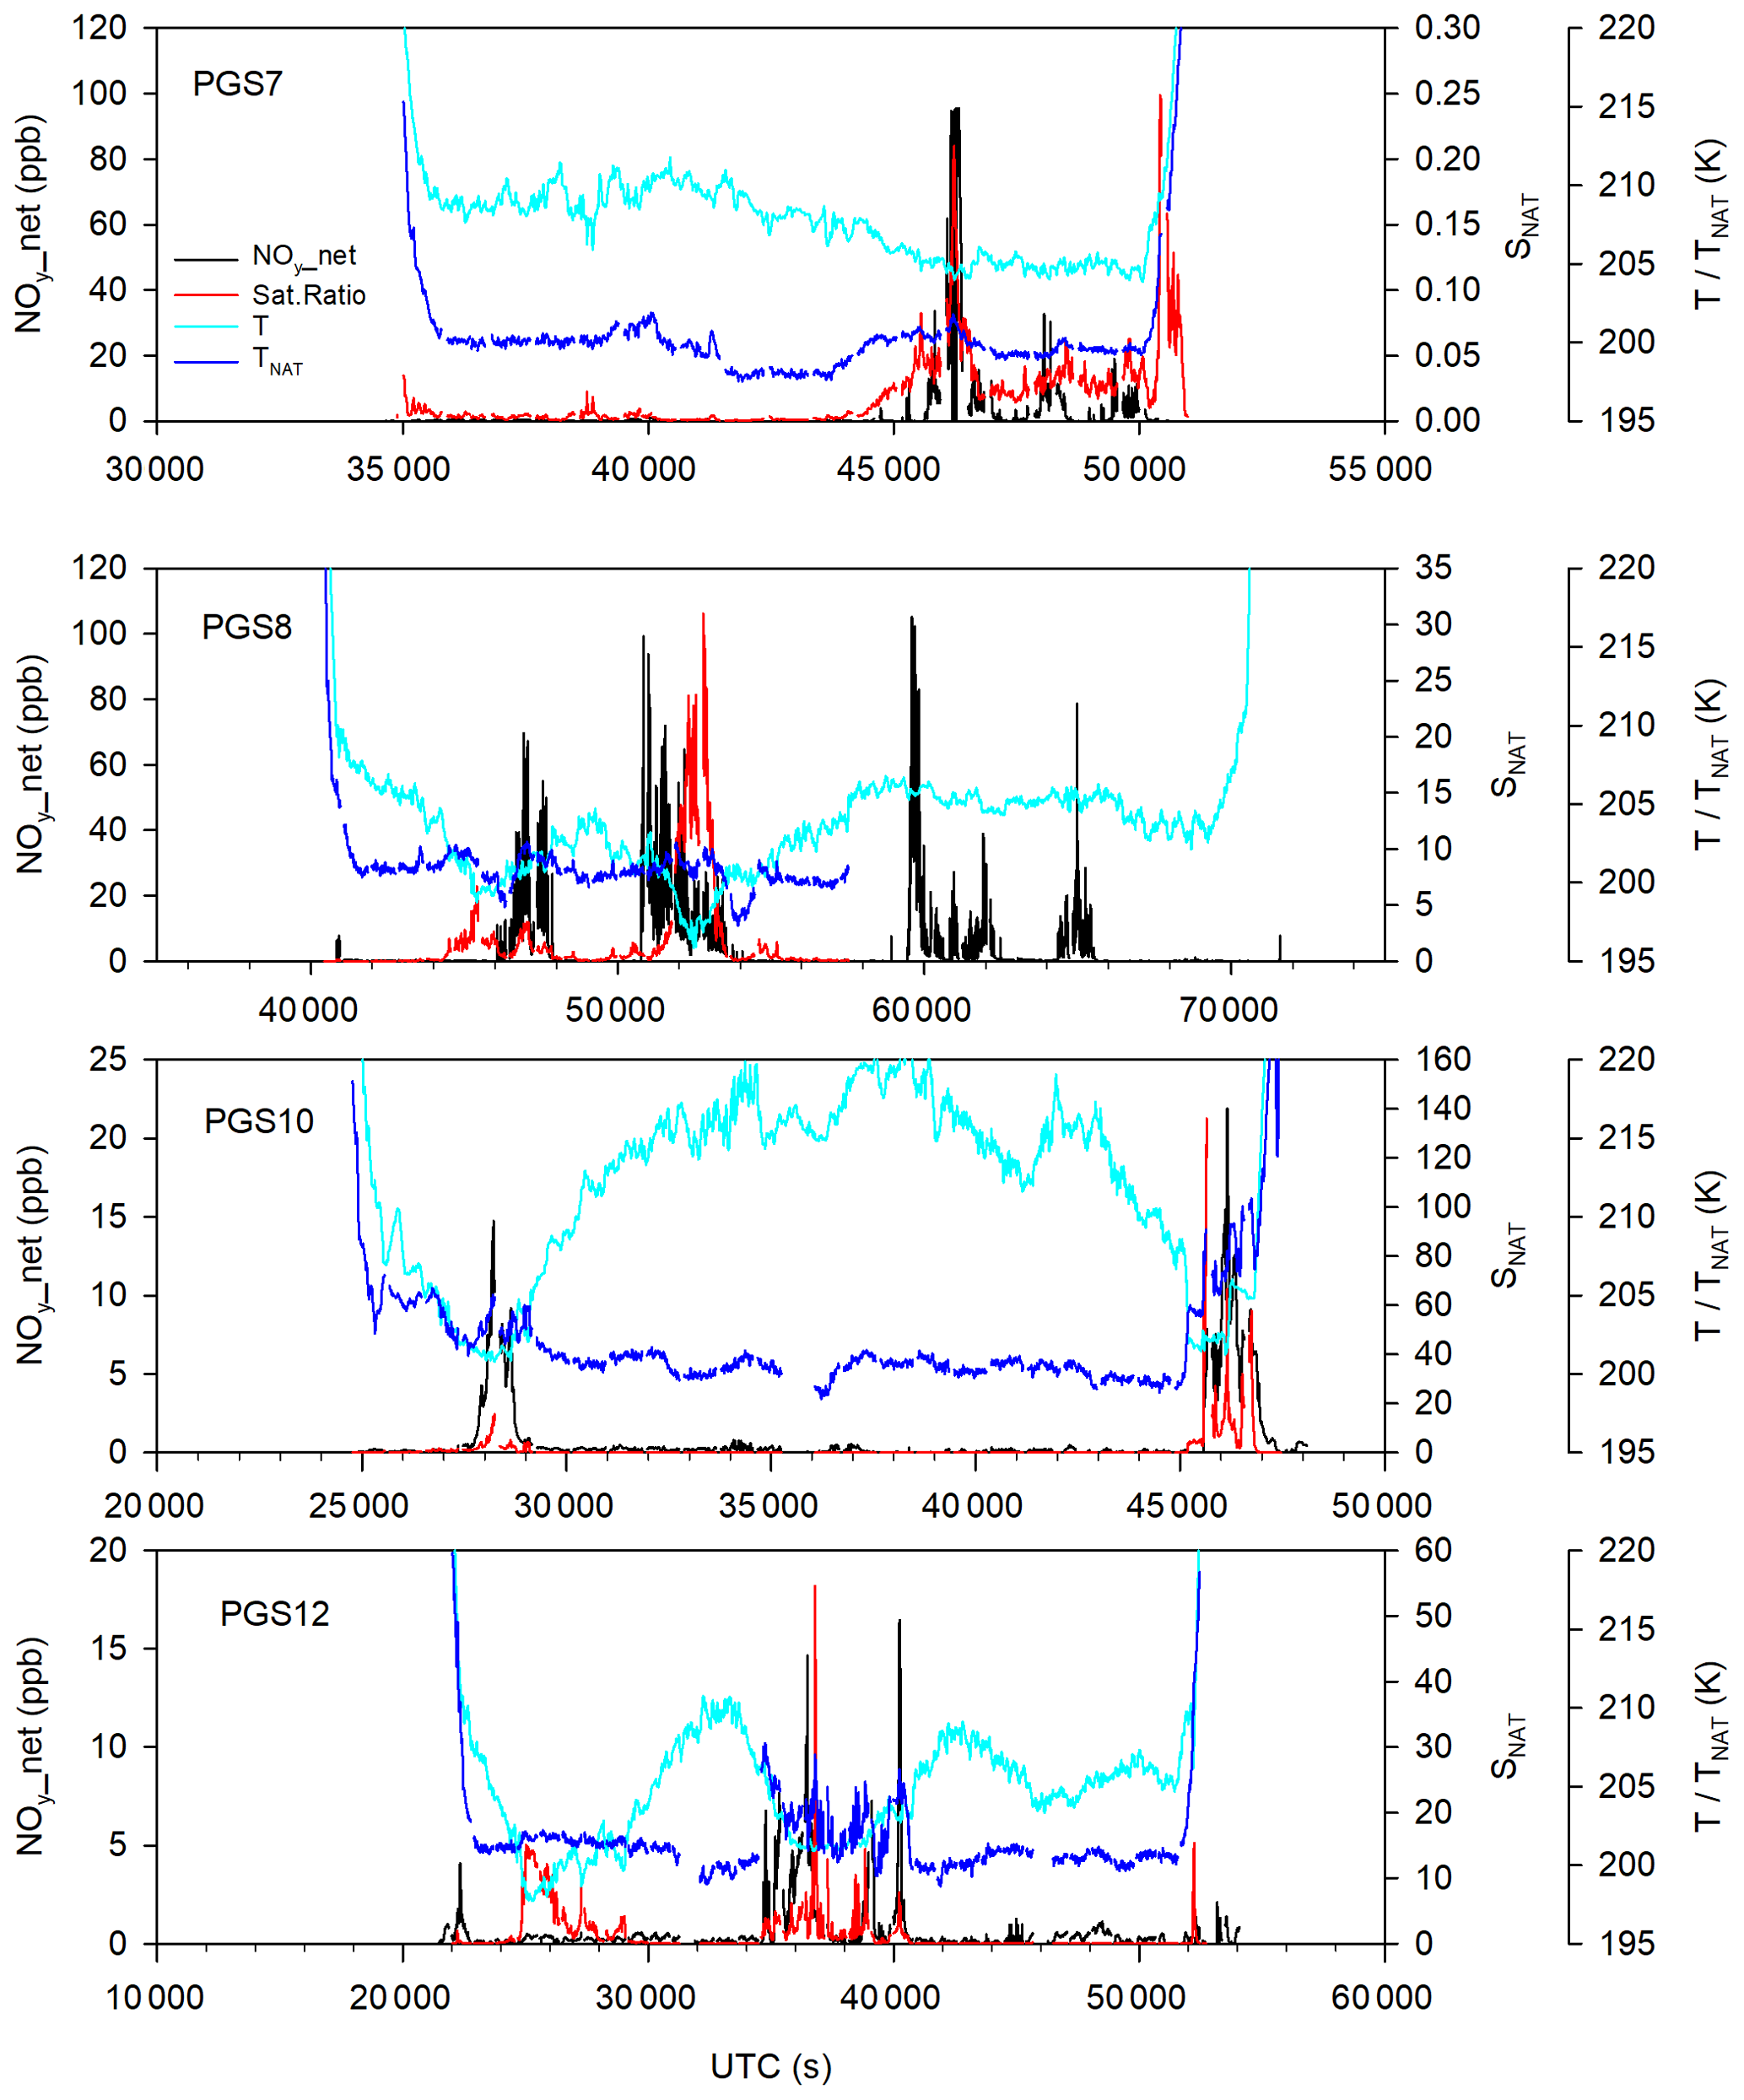
Figure 13NOy_net, ambient temperature, saturation ratio, and TNAT for all flights where particulate nitrate was observed. During the second half of the flight, PGS flight 8 the NAT saturation temperature, TNAT, could not be calculated because of missing data.
To convert total NOy to an equivalent gas-phase NOy concentration, the particle size dependent enhancement factor has to be known. As mentioned earlier, the HALO payload did not include instruments for the independent measurement of the particle size. The enhancement factor therefore can only be estimated with some uncertainty from the signal obtained with the forward-facing inlet. As pointed out earlier, nitrate containing particles evaporate completely in the inlet and converter and the released nitrate molecules are detected. From this signal, the diameter of the particles can be derived. This method was described in detail by Northway et al. (2002). Due to wall effects particles do not evaporate within the sampling frequency of the instrument (1 s). The complete evaporation takes up to 20 s. Therefore, for estimating the diameter of the particle, the signal has to be integrated over the complete time of evaporation. Assuming NAT density and for the specific parameters of the AENEAS NOy detector the particle diameter can be estimated. The prefactor of the formula combines density and specific instrument parameters. The measured concentration enters the formula with the units mol mol−1:
A similar approach was also chosen for analysing particles from observations from Geophysica (Voigt et al., 2005). As was shown by Northway et al. (2002), this method can only be applied as long as the evaporation periods of the individual particles do not overlap. During POLSTRACC, the frequency of evaporating particles was that high that for most time this approach could not be used to estimate the particle diameter. At the edge of some particle episodes, however, individual evaporation events could be identified. Using the above given formula, particle diameters between about 9 and 18 µm have been derived. The particle diameters derived from the POLSTRACC observations are roughly in the same order of magnitude as those measured during previous aircraft missions to the Arctic. Particle diameters, between 5 and 20 µm, have been derived from measurements with the ER-2 during the SOLVE mission at altitudes between 15 and 21 km (Northway et al., 2002; Fahey et al., 2001). During RECONCILE in January 2010, particle diameters between 10 and 24 µm have been concluded from observations on board of the research aircraft Geophysica (Molleker et al., 2014). Particles with diameter smaller than 6 µm have been observed from Geophysica in February 2003 (Voigt et al., 2005).
As discussed in Sect. 2.1.1, the enhancement factor reaches a maximum for particles larger than about 10 µm and is then independent of diameter (Belyaev and Levin, 1974). It also increases strongly with increasing ambient pressure. The maximum enhancement factor ranged between about 50 and 85 for the instrumental setting during this mission at the altitudes where particles were detected. For comparison, an enhancement factor between about 13 and 22 was applied for measurements on board of the ER-2 at lower ambient pressures during AAOE (Airborne Antarctic Ozone Experiment) in the Antarctic (Fahey et al., 1989). For observations during POLSTAR at altitudes up to 13 km, a maximum enhancement factor of 140 was derived for particles larger than 10–20 µm (Feigl et al., 1999).
Following the above-sketched assumptions, the gas-phase equivalent of the observed particulate nitrate can be estimated as is presented for the observations during the flight on 20 January (Fig. 14). This allows us to establish a kind of NOy partitioning. The observed total reactive nitrogen in the lower stratosphere comprises three contributions: (a) gas-phase NOy arising from the photooxidation of N2O – “undisturbed NO”, (b) NOy from already evaporated nitrate particles, and (c) particulate nitrate. For the flight on 20 January, observed NOy exceeds calculated NO by up to 6 ppb. During the last part of this flight, up to about 60 % of observed NOy can be attributed to evaporated particles. Averaging over the whole flight, the median ratio between excess dNOy and NOy was about 20 %. The highest values for particulate nitrate amounted to about 1.5 ppb. The highest peak ratio between particulate nitrate and gas-phase nitrate was up to more than 0.7. Averaged over a longer period (50 800 to 53 500 s UTC), particulate nitrate amounted to around 0.2 ppb. This corresponds to a ratio between particulate and gas-phase nitrate of about 0.14. High dNOy values were not necessarily observed at the same time as high particulate nitrate, indicating that the particles have been already completely evaporated. With the exception of the peak values, more reactive nitrogen was found in the gas-phase than in the particulate phase.
Besides the above-sketched dependences, the estimation of the enhancement factor might be hampered by the fact that the aircraft itself has an influence on the sampling characteristic of the inlets on the top of the fuselage. This was shown in a publication studying the influence of the inlet position on the quantitative determination of the ice water content (Afchine et al., 2018). Depending on size of the ice particles, overestimation as well as underestimation of the ice water content was found for the specific inlet position of the FISH instrument. Due to the different positions of the water and reactive nitrogen inlet, as well as the different particle size distributions of the NAT PSC and cirrus ice crystals, these findings cannot easily be transferred to the present measurements. However, an influence of the aircraft on the particle sampling cannot be excluded although this effect might be smaller for the smaller NAT particles compared to ice. This might affect the enhancement factor used for the estimation of the gas-phase equivalent of particulate nitrate and therefore might affect the quantitative determination of the ratio between particulate and gas-phase nitrate. However, this uncertainty does neither affect the fact that nitrate particles have been observed nor does it affect the estimate of the particle diameter. It also has no influence on the gas-phase measurements of nitrified and denitrified air masses.
The distribution of reactive nitrogen in the lowermost winter Arctic stratosphere was also simulated with the Chemical Lagrangian Model of the Stratosphere (CLaMS). CLaMS was developed at the Forschungszentrum Jülich as a modular chemistry transport model. With CLaMS, denitrification in the Arctic stratosphere in winter 2002/2003 and 2009/2010 was simulated and compared to in situ measurements from Geophysica (Grooß et al., 2005, 2014).
The simulation of the impact of vertical settling of NAT particles is challenging as it depends critically on temperature and also the heterogeneous nucleation (Tritscher et al., 2021). For example, nitrification occurs when the sedimentation of NAT particles falls into altitudes with temperatures above TNAT. This results in a horizontally and vertically filamentary small-scale structure in the NOy distribution, seen both in the observations during the campaign but also in the simulation. As time proceeds, these NOy-rich structures are diluted and mixed with ambient air. Due to the limited knowledge of NAT formation nuclei, small-scale temperature distributions and also due to the resolution of the model, an exact and detailed simulation of the nitrification filaments is not possible. In the simulation, all of the HNO3 released from NAT particle evaporation is collected in the air parcels that have about 100 km distance. In some cases, the interpolation of the resulting simulated NOy to a specific location as the flight path may result in unrealistically high values.
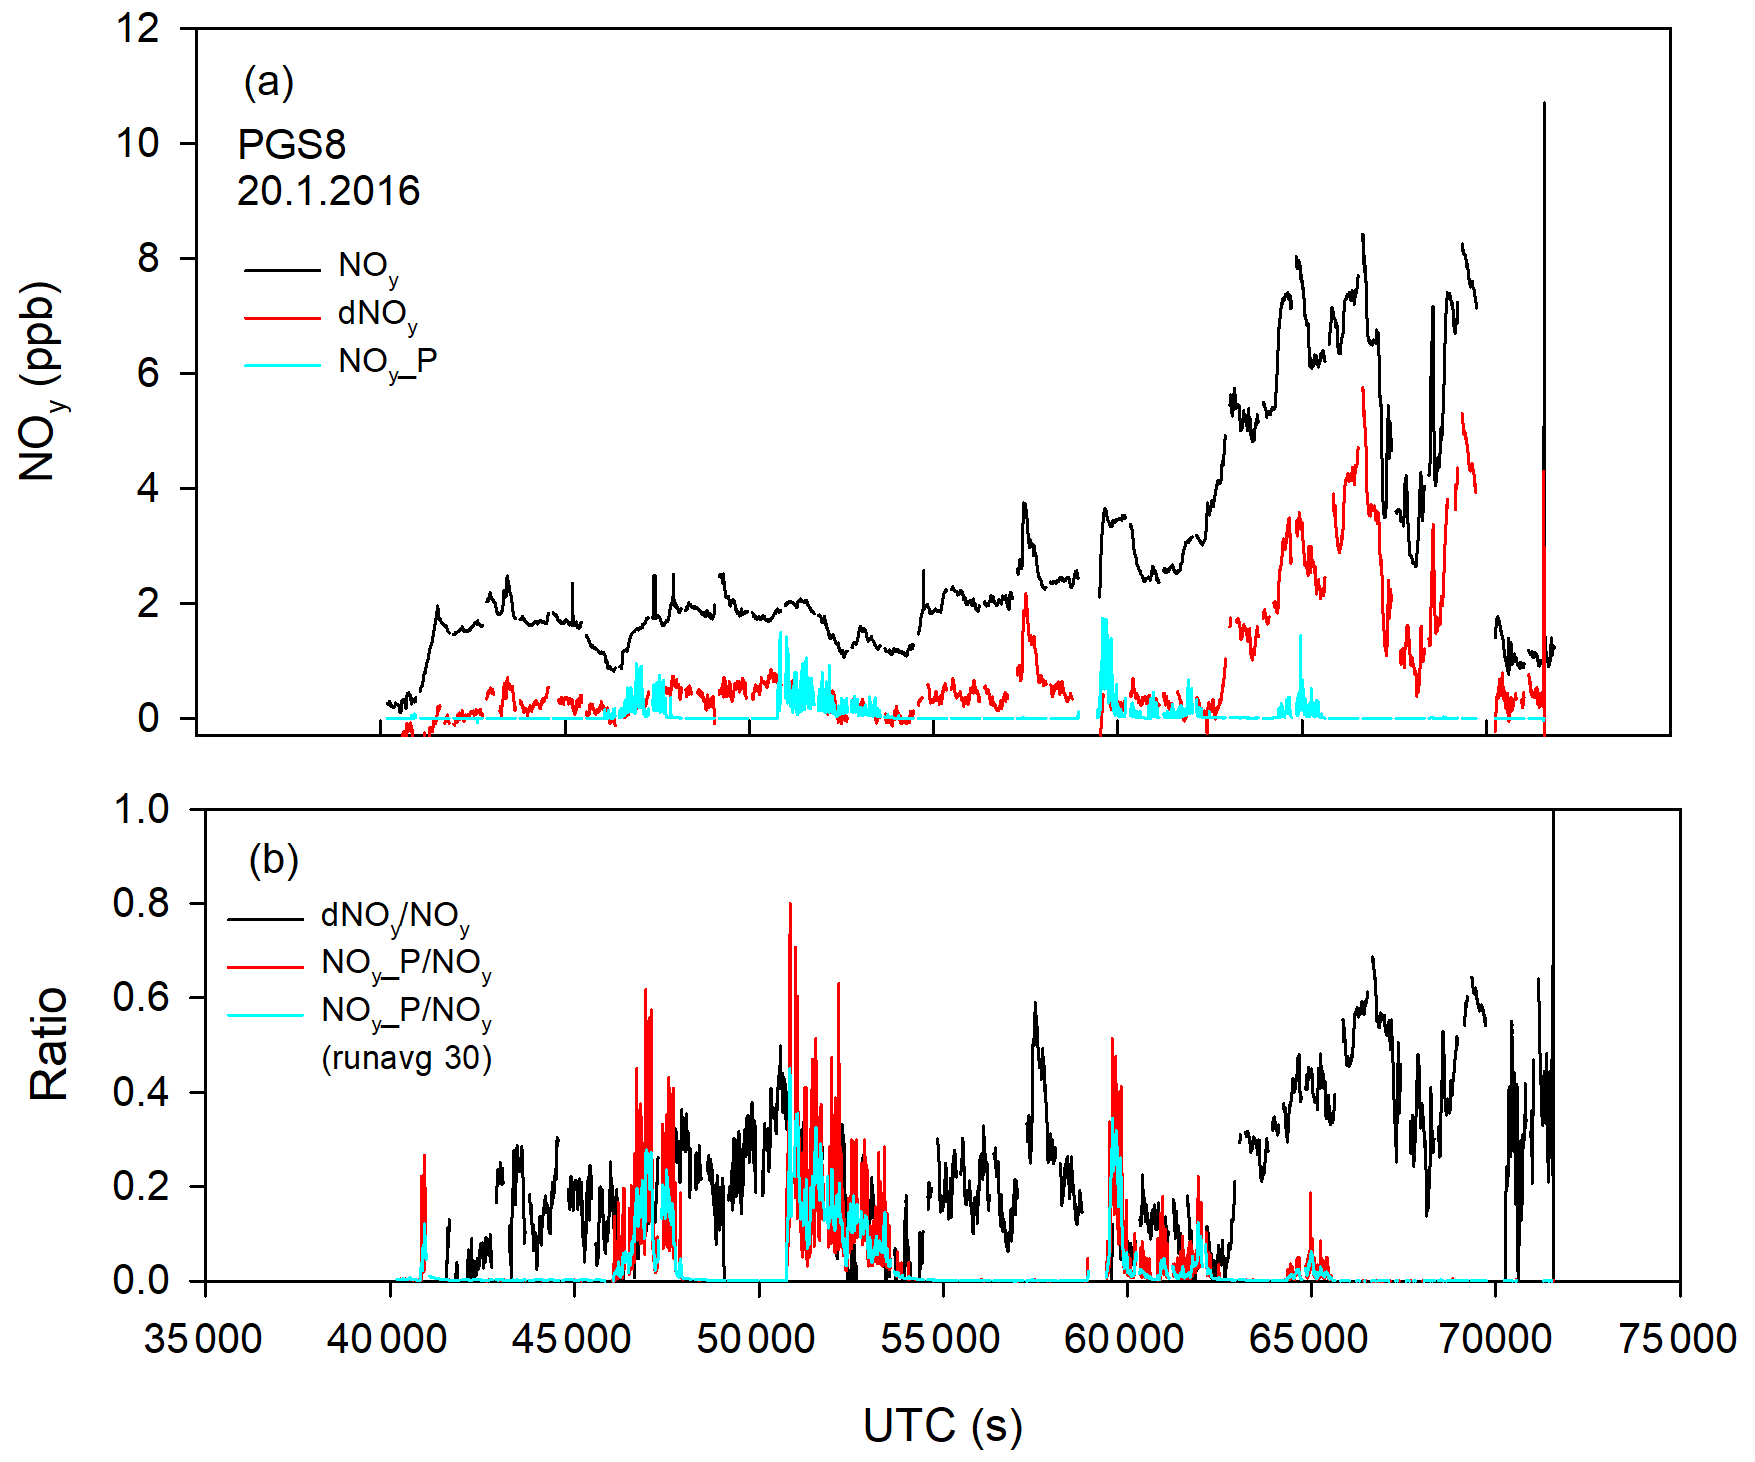
Figure 14NOy partitioning for PGS flight 8. Gas-phase NOy, dNOy= NOy − NO (calculated) and enhancement corrected particulate nitrate are shown. (a) Absolute values; (b) dNOy NOy ratio, NOy_P NOy ratio, with 1 s values and as running average (30 s).
First, we compare in situ NOy measurements with model values simulated along the flight paths. In Fig. 15 measured and simulated values are presented for selected flights for the three winter phases. During the early-winter phase, the lower stratosphere does not show any signature for nitrification or denitrification as was shown in Sect. 3.2.1. As an example, the flight from Oberpfaffenhofen to the Arctic on 21 December was chosen (Fig. 15a). Up to that time, no vertical NOy redistribution was simulated by CLaMS; therefore, NOy and NO are identical. The larger structures of the observed in situ NOy variations along the flight path have been largely reproduced by the simulations. There are a few smaller-scale variations that are not met by the model; for example, a larger deviation of about 1 ppb NOy in absolute numbers is found between about 50 000 and 55 000 s UTC.
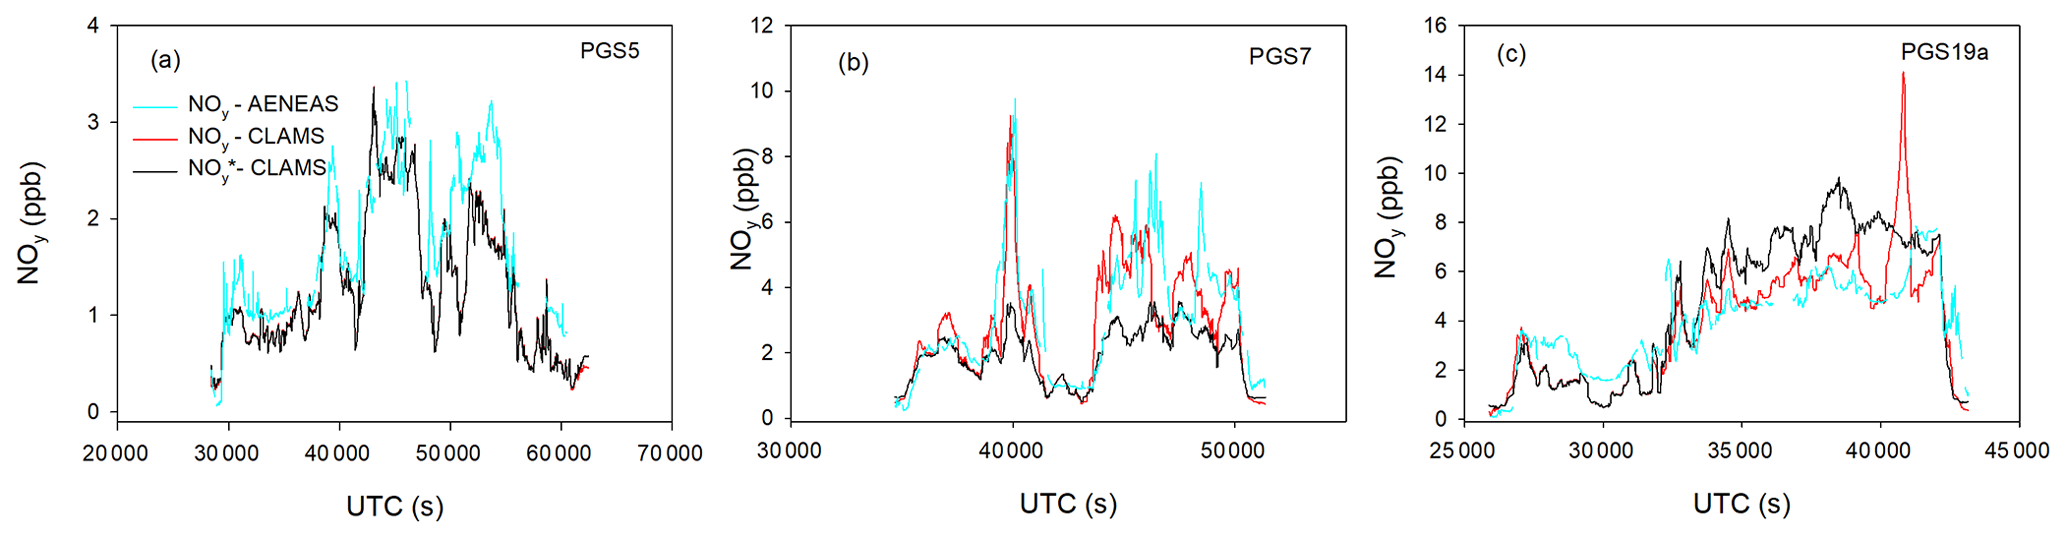
Figure 15Comparison between observed NOy and simulated NOy values with the CLaMS model. Additionally, NO calculated with CLaMS is given. Shown are examples for three POLSTRACC flights from the three observation phases. Early winter: PGS flight 5 – 21 December 2015, mid-winter: PGS flight 7 – 18 January 2016, late winter: PGS flight 19a – 13 March 2016.
For the mid-winter phase, the flight on 18 January has been chosen for comparison (Fig. 15b). During this flight, indications for particulate nitrate have been found by the AENEAS observations. Based on tracer–tracer correlation, the air masses encountered have been affected by nitrification (Sect. 3.2.2). Besides simulated NOy also NO CLaMS is shown. It corresponds to simulated NOy without considering heterogeneous reactions, and subsequent redistribution.
In general, again model and measurement capture the same large-scale features. Both observations and simulations indicate an enhancement of NOy during the same times or locations of the flight path. Typical NOy enhancements are of the order of 2–3 ppb, but also the nitrification peak of 10 ppb NOy was reproduced by the model. Deviations can be found at a smaller scale where the nitrification patterns are not congruent at all times. During episodes that are not affected by nitrification, deviations between simulation and observation are below 1 ppb.
As example for the late-winter period, the 13 March flight was chosen. The air masses probed in the March flight show indications of denitrification over longer periods. Both observations and model simulations reveal the patchy filamented structure of the lower stratosphere. The simulation indicates that denitrification reveals a NOy reduction by 2–4 ppb throughout the second half of the flight. Also, in this case, the NOy deviations between the simulation and observations are generally around 1 ppb with a few exceptions. Around 11:20 UTC (40 800 s), the simulation indicates a strong nitrification peak of about 14 ppb NOy that is not present in the observations. A detailed investigation revealed that this nitrification filament in the simulation belongs to one short episode on this flight west of the coast from Greenland (71.7∘ N, 56.6∘ W; θ = 404.1 K) where the flight path is very close to one specific air model air parcel (distance of 7 km). In this air parcel, all evaporating HNO3 is collected over the range given by the horizontal model resolution of about 100 km. Small uncertainties in the temperature of the reanalyses could cause a small displacement of such a filament. It may be that there is a similar nitrification filament close to the flight path, but this cannot be clarified here.
Besides these comparisons along individual flight paths, we used the CLaMS simulation to investigate if the vertical NOy redistribution on a vortex-wide scale can be understood. This is done by examining the correlation on NOy and dNOy with the inert tracer N2O. The simulations were used to put the observations in a broader context. Especially they can contribute to what extent the observations represent the global development within the polar vortex. To do that, the simulations were evaluated as vortex average and also interpolated to the HALO flight paths. For comparing the time development of denitrification and nitrification in the three campaign phases, we evaluated the model averages at central dates for each of the campaign phases (17 December, 22 January, and 8 March). Similar to the observations combined in Fig. 7, Fig. 16 shows the correlation of NOy and dNOy with N2O as interpolated to the flight path and time obtained with CLaMS. For the comparison, two short 10 min periods out of the over 250 flight hours were excluded (within 5 min of the times 31 January 2016 14:17 and 13 March 2016 11:20 UTC), and they were close to a single model air parcel with likely an overestimation of NOy as described above. The right panels of Fig. 16 show two kinds of averages for N2O bins: triangles show the average NOy as interpolated to the flight path position, and thick coloured lines show the average vortex NOy mixing ratios. The error bars and the thin coloured lines indicate the ± 1σ range. As these two evaluations, vortex average and average at the flight path, overlap well, we conclude that the ensemble of all observations are representative of the vortex-wide vertical NOy redistribution.
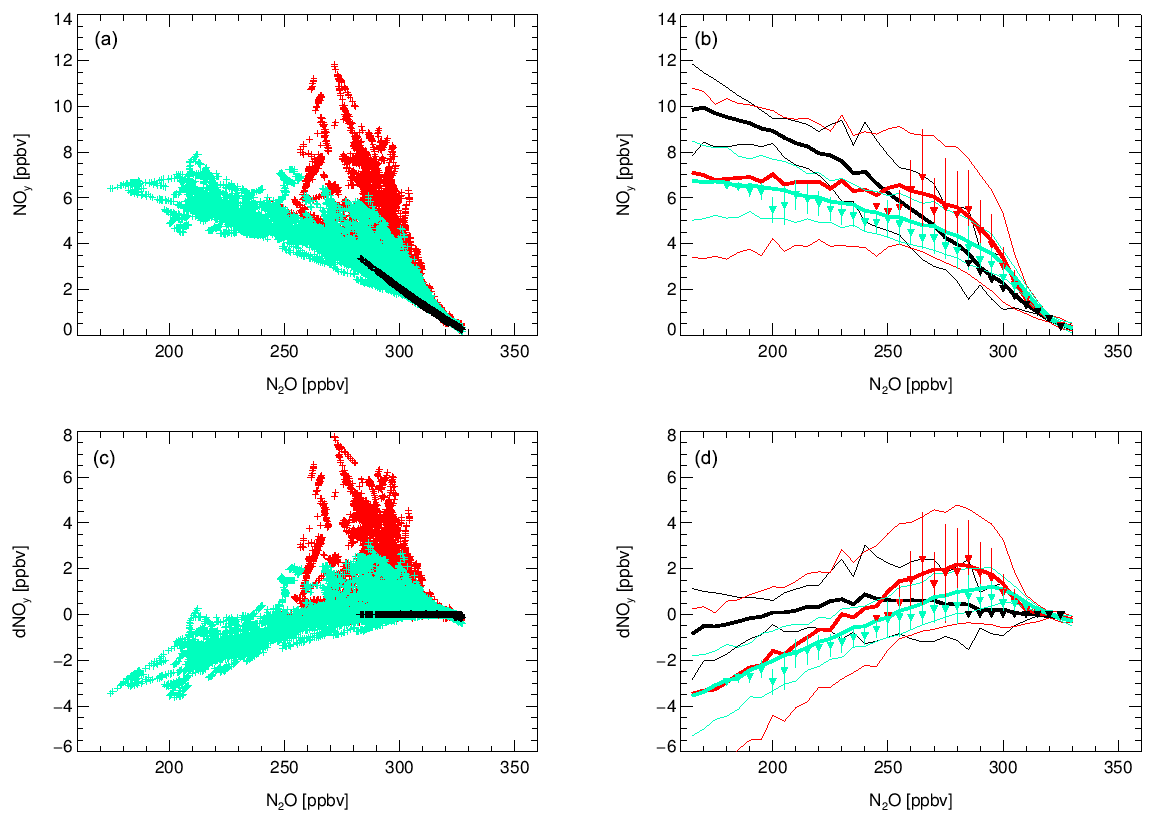
Figure 16Correlations of NOy (a, b) and dNOy (c, d) with N2O from CLaMS simulations. The left panels show all dates in different colours for the three campaign phases. Data within 5 min of the times 31 January 2016 14:17 and 13 March 2016 11:20 UTC are omitted (see text). The right panels show the averages for N2O bins ± 1σ standard deviations of these values as filled triangles with error bar signs. Also shown are the vortex average correlation for central dates of the campaign phases as thick coloured lines, ± 1σ standard deviation is indicated as thin coloured lines.
Finally, Fig. 17 combines observed and simulated (along the flight paths) NOy and dNOy correlation with N2O. In general, observations and simulations agree well with deviations below about 1 ppb. Only few measurement points were obtained below N2O values of 200 ppb, which could explain the larger discrepancy between simulated and observed values.
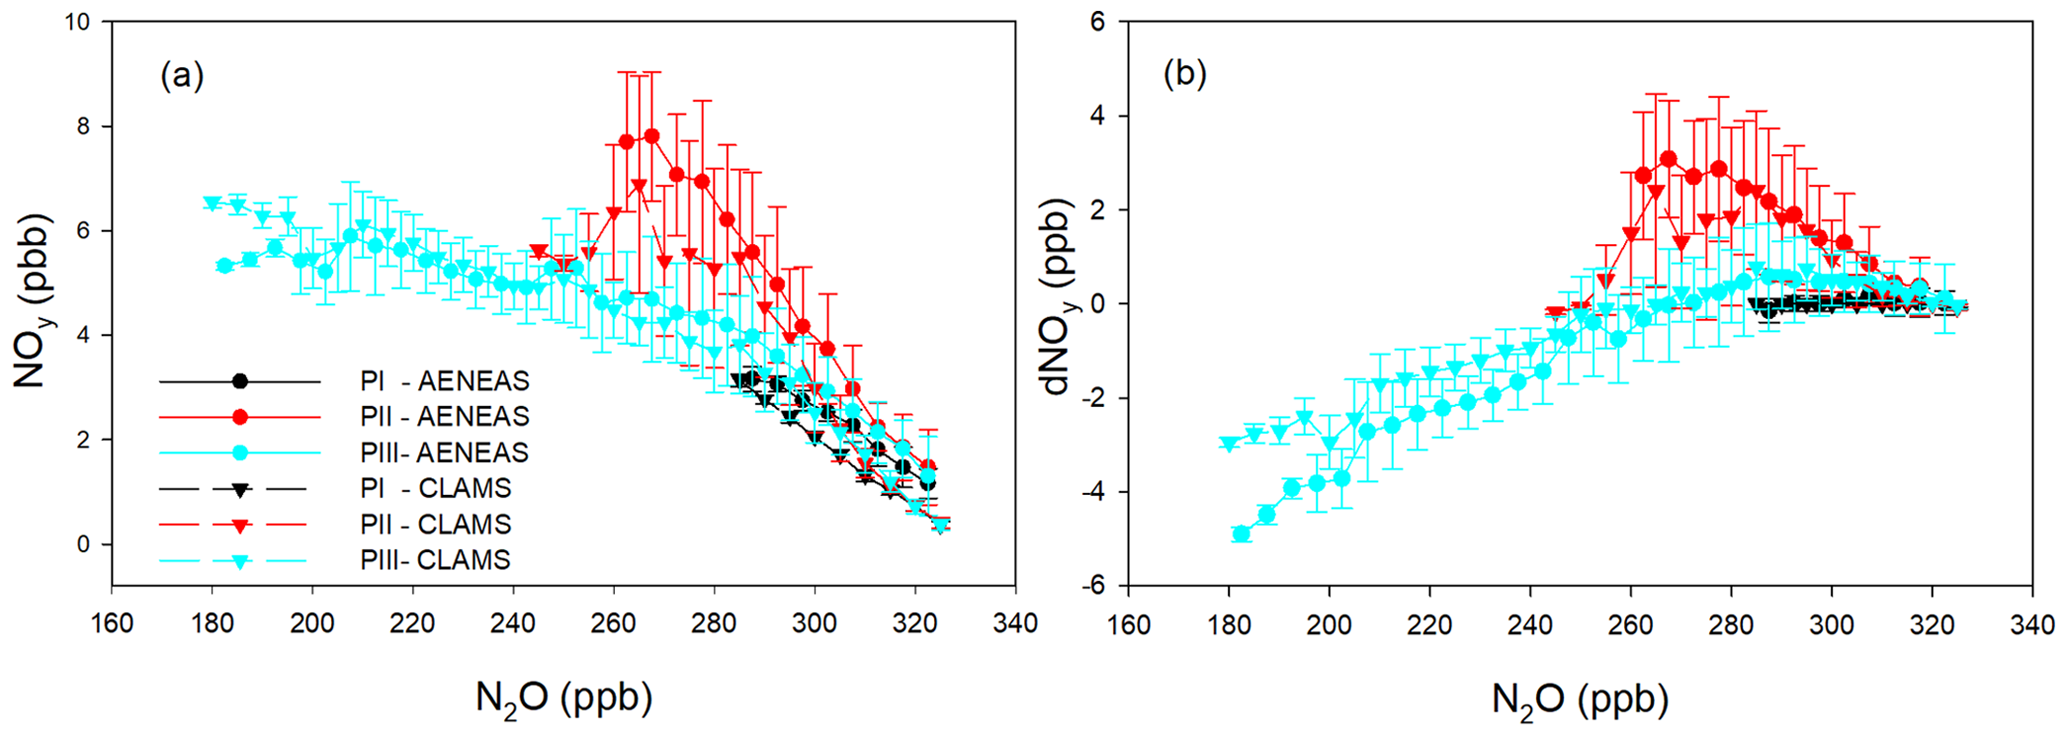
Figure 17(a) NOy and (b) dNOy averaged over 5 ppb N2O intervals along with standard deviations for the three mission phases. Observed values (circles) are shown along with values from the CLaMS model simulation (triangles).
The comparison between observations and model simulations is a multistep process. First, we were able to show, through the comparisons along the flight paths, that the processes underlying the model simulations are so well understood that the observations can be reproduced. In a second step, we showed that these simulations along the flight path are representative of the vortex-wide NOy distribution. This, in turn, suggests that the observations, although limited in time and space to individual flights, provide a good description of the distribution of nitrogen oxides in the subpolar region during this winter.
During the course of the extremely cold winter 2015/2016, aircraft-based measurements with the German research aircraft HALO have been performed in the lowermost stratosphere of the Arctic region within the POLSTRACC mission. The observation period covered the whole winter–spring season from December to March. This extended observational period offered the unique opportunity to study the changing distribution of total reactive nitrogen in the lowermost stratosphere with time.
Tracer–tracer correlations, the relation between NOy and N2O and O3, respectively, have been used as a tool to study and interpret the observed temporal evolution of the UTLS composition. In December, the distribution of reactive nitrogen did not show any indications for deviations from undisturbed conditions controlled by gas-phase chemistry and transport. This changed during the second mission phase in January and beginning of February. During several flights, enhanced NOy values have been observed. Using NOy–N2O tracer correlations, nitrification could be clearly identified. Observed NOy values have been up to 6 ppb higher than expected without redistribution of nitrogen species. This is also reflected in the NOy O3 ratio that was up to more than a factor of 2 higher in January than in December. This could be interpreted in terms that the sub-vortex region was affected by heterogeneous processes taking place in the stratosphere above. Particles falling down from the PSC regions evaporate and released gas-phase NOy, leading to a nitrification of the lowermost stratosphere. This means that during some periods more than 60 % of the observed NOy was caused by evaporating particles.
Along with enhanced gas-phase values, particulate nitrate was observed during mid-winter at flight altitudes between about 10 and 14 km. The occurrence of PSC particles at such altitudes is rare. Particulate nitrate was observed over wide regions during four flights out of Kiruna. The diameter of these PSC particles ranged between about 9 and 18 µm. The occurrence of particulate nitrate at flight altitude and the nitrification of the lowermost stratosphere fit into the picture of other observations made in this winter. Extended PSC coverage has been already observed during December by CALIOP (Pitts et al., 2018). Particulate nitrate formed in the middle stratosphere was also observed by lidar on board HALO and simulated by models (Voigt et al., 2018; Khosrawi et al., 2017). However, the uncertainty of the sampling characteristic of the inlet makes a quantitative determination of the ratio between particulate and gas-phase nitrate difficult.
Nitrified regions at the lowermost stratosphere have also been found in the late-winter phase. Along with nitrified regions, subsidence of air masses from the polar vortex controlled more and more the distribution of reactive nitrogen at flight altitudes. Using tracer–tracer correlations, substantial denitrification could be derived in subsiding air masses with minimum values of down to about −5 ppb. This means that up to about 50 % of the undisturbed NOy was missing.
Nitrification of the lowermost stratosphere in mid-winter and denitrification in late winter are linked together by heterogeneous processes in the above-lying stratosphere. While nitrification caused by sedimenting particles was already observed in mid-winter at flight altitude, the result of the denitrification at higher altitudes was not observed at the bottom of the vortex before the end of February. Concurrently with denitrification, lower ozone concentrations were observed in the sinking air masses, indicating ozone destruction at higher altitudes.
In situ observed total reactive nitrogen has been compared with the results of simulations with the Chemical Lagrangian Model of the Stratosphere (CLaMS). In general, CLaMS simulations reproduced the observed overall NOy structures and concentrations. This is true for undisturbed conditions in December as well as for nitrified conditions in January and denitrified conditions in February and March. The comparison with the model simulations suggests that the observations during POLSTRACC have been representative of the vortex-wide vertical NOy redistribution.
Thus, the present measurements provide a comprehensive picture of the temporal evolution of the reactive nitrogen distribution during a whole winter period. They allowed us to observe the transition of the lowermost sub-vortex region from the undisturbed to the nitrified and finally denitrified state.
The observational data obtained during the HALO flights and the CLaMS model results interpolated to the flight paths are available at the HALO database: https://halo-db.pa.op.dlr.de (last access: 21 July 2021; POLSTRACC mission, 2021). Global CLaMS model results are available from https://doi.org/10.26165/JUELICH-DATA/FBZRVO (Grooß, 2022). ERA-Interim reanalysis data are available at ECMWF https://www.ecmwf.int (last access: 21 July 2021; ECMWF, 2021).
HZ, GS, PS, and ML were responsible for the NOy measurements. HZ was responsible for the further data analysis and the writing of the article. PH and JK performed the N2O measurements. VB performed part of the N2O analysis. JUG performed the CLaMS model simulations. AZ was responsible for the ozone measurements. AA and CR carried out the water observations. Air mass age was provided by AE, and HNO3 measurements with the AIMS instrument were performed by AM and CV. HNO3 observations by GLORIA were provided by WW, MB, JU, and the GLORIA team. HO and BMS were responsible for the scientific flight planning and GLORIA observations. All co-authors were involved in review and editing of the paper.
At least one of the (co-)authors is a member of the editorial board of Atmospheric Chemistry and Physics. The peer-review process was guided by an independent editor, and the authors also have no other competing interests to declare.
Publisher’s note: Copernicus Publications remains neutral with regard to jurisdictional claims in published maps and institutional affiliations.
This article is part of the special issue “The Polar Stratosphere in a Changing Climate (POLSTRACC) (ACP/AMT inter-journal SI)”. It is not associated with a conference.
We would like to thank all colleagues of the DLR Flight Department for their excellent support, which made this successful flight campaign possible. We thank the entire POLSTRACC-GW-LCYCLE-SALSA team for the very productive and pleasant collaboration. We thank all colleagues who participated in the meteorological flight planning. The authors would like to thank the Earth System Modelling (ESM) project for funding the CLaMS simulations by providing computation time on the ESM partition of the JUWELS supercomputer. We thank Martin Dameris (internal review) for many helpful comments.
We gratefully acknowledge funding from the German
Research Foundation (DFG) under the priority programme “Atmospheric and Earth
System Research with the High Altitude and Long Range Research Aircraft
(HALO)” SPP 1294 through the following grants: Andreas Engel and Peter Hoor
(EN 367/13-1, EN 367/14-1, HO 4225/7-1). Jens Krause was partially funded by
grant HO4225-6/1. Andreas Marsing and Christiane Voigt were funded by the
DFG SPP HALO 1294 under contract numbers VO1504/7-1 and by DFG SFB/TR 301
TPChange and by the Helmholtz Association in the HGF-W2/W3 excellence
programme. We gratefully acknowledge support by the SFB/TR 301 (TPChange: The
Tropopause Region in a Changing Atmosphere, project no. 428312742) funded by
the Deutsche Forschungsgemeinschaft (DFG, German Research Foundation).
The article processing charges for this open-access publication were covered by the German Aerospace Center (DLR).
This paper was edited by Jianzhong Ma and reviewed by two anonymous referees.
Afchine, A., Rolf, C., Costa, A., Spelten, N., Riese, M., Buchholz, B., Ebert, V., Heller, R., Kaufmann, S., Minikin, A., Voigt, C., Zöger, M., Smith, J., Lawson, P., Lykov, A., Khaykin, S., and Krämer, M.: Ice particle sampling from aircraft – influence of the probing position on the ice water content, Atmos. Meas. Tech., 11, 4015–4031, https://doi.org/10.5194/amt-11-4015-2018, 2018.
Arnold, F., Burger, V., Gollinger, K., Roncossek, M., Schneider, J., and Spreng, S.: Observations of nitric acid perturbations in the winter Arctic stratosphere: Evidence for PSC sedimentation, J. Atmos. Chem., 30, 49–59, https://doi.org/10.1023/A:1006014003391, 1998.
Belyaev, S. P. and Levin, L. M.: Techniques for collection of representative aerosol samples, Aerosol Sci., 5, 325–338, 1974.
Bollinger, M. J., Sievers, R. E., Fahey, D. W., and Fehsenfeld, F. C.: Conversion of Nitrogen Dioxide, Nitric Acid, and n-Propyl Nitrate to Nitric Oxide by Gold-Catalyzed Reduction with Carbon Monoxide, Anal. Chem., 55, 1980–1986, https://doi.org/10.1021/Ac00262a034, 1983.
Bönisch, H., Engel, A., Birner, T., Hoor, P., Tarasick, D. W., and Ray, E. A.: On the structural changes in the Brewer-Dobson circulation after 2000, Atmos. Chem. Phys., 11, 3937–3948, https://doi.org/10.5194/acp-11-3937-2011, 2011.
Braun, M., Grooß, J. U., Woiwode, W., Johansson, S., Hopfner, M., Friedl-Vallon, F., Oelhaf, H., Preusse, P., Ungermann, J., Sinnhuber, B. M., Ziereis, H., and Braesicke, P.: Nitrification of the lowermost stratosphere during the exceptionally cold Arctic winter 2015–2016, Atmos. Chem. Phys., 19, 13681–13699, https://doi.org/10.5194/acp-19-13681-2019, 2019.
Combined Nitrous Oxide data from the NOAA Global Monitoring Laboratory [data set]: https://gml.noaa.gov/aftp/data/hats/n2o/combined/GML_global_N2O.txt, last access: 21 July 2021.
Crutzen, P. J. and Arnold, F.: Nitric acid cloud formation in the cold antarctic stratosphere: a major cause for the springtime ozone hole, Nature, 324, 651–655, https://doi.org/10.1038/324651a0, 1986.
Dibb, J. E., Scheuer, E., Avery, M., Plant, J., and Sachse, G.: In situ evidence for renitrification in the Arctic lower stratosphere during the polar aura validation experiment (PAVE), Geophys. Res. Lett., 33, L12815, https://doi.org/10.1029/2006gl026243, 2006.
Drummond, J. W., Volz, A., and Ehhalt, D. H.: An optimized chemiluminescence detector for tropospheric NO measurements, J. Atmos. Chem., 2, 287–306, https://doi.org/10.1007/Bf00051078, 1985.
ECMWF: ERA-interim reanalysis, ECMWF [data set], https://apps.ecmwf.int/datasets/data/interim-full-daily/, last access: 21 July 2021.
Fahey, D. W., Eubank, C. S., Hübler, G., and Fehsenfeld, F. C.: Evaluation of a Catalytic Reduction Technique for the Measurement of Total Reactive Odd-Nitrogen NOy in the Atmosphere, J. Atmos. Chem., 3, 435–468, https://doi.org/10.1007/Bf00053871, 1985.
Fahey, D. W., Kelly, K. K., Ferry, G. V., Poole, L. R., Wilson, J. C., Murphy, D. M., Loewenstein, M., and Chan, K. R.: Insitu Measurements of Total Reactive Nitrogen, Total Water, and Aerosol in a Polar Stratospheric Cloud in the Antarctic, J. Geophys. Res., 94, 11299–11315, https://doi.org/10.1029/JD094iD09p11299, 1989.
Fahey, D. W., Kelly, K. K., Kawa, S. R., Tuck, A. F., Loewenstein, M., Chan, K. R., and Heidt, L. E.: Observations of Denitrification and Dehydration in the Winter Polar Stratospheres, Nature, 344, 321–324, https://doi.org/10.1038/344321a0, 1990a.
Fahey, D. W., Solomon, S., Kawa, S. R., Loewenstein, M., Podolske, J. R., Strahan, S. E., and Chan, K. R.: A Diagnostic for Denitrification in the Winter Polar Stratospheres, Nature, 345, 698–702, https://doi.org/10.1038/345698a0, 1990b.
Fahey, D. W., Donnelly, S. G., Keim, E. R., Gao, R. S., Wamsley, R. C., DelNegro, L. A., Woodbridge, E. L., Proffitt, M. H., Rosenlof, K. H., Ko, M. K. W., Weisenstein, D. K., Scott, C. J., Nevison, C., Solomon, S., and Chan, K. R.: In situ observations of NOy, O3, and the NOy O3 ratio in the lower stratosphere, Geophys. Res. Lett., 23, 1653–1656, https://doi.org/10.1029/96gl01476, 1996.
Fahey, D. W., Gao, R. S., Carslaw, K. S., Kettleborough, J., Popp, P. J., Northway, M. J., Holecek, J. C., Ciciora, S. C., McLaughlin, R. J., Thompson, T. L., Winkler, R. H., Baumgardner, D. G., Gandrud, B., Wennberg, P. O., Dhaniyala, S., McKinney, K., Peter, T., Salawitch, R. J., Bui, T. P., Elkins, J. W., Webster, C. R., Atlas, E. L., Jost, H., Wilson, J. C., Herman, R. L., Kleinbohl, A., and von Konig, M.: The detection of large HNO3-containing particles in the winter arctic stratosphere, Science, 291, 1026–1031, https://doi.org/10.1126/science.1057265, 2001.
Farman, J. C., Gardiner, B. G., and Shanklin, J. D.: Large Losses of Total Ozone in Antarctica Reveal Seasonal ClOx NOx Interaction, Nature, 315, 207–210, https://doi.org/10.1038/315207a0, 1985.
Feigl, C., Schlager, H., Ziereis, H., Curtius, J., Arnold, F., and Schiller, C.: Observation of NOy uptake by particles in the Arctic tropopause region at low temperatures, Geophys. Res. Lett., 26, 2215–2218, https://doi.org/10.1029/1999gl900338,1999.
Fischer, H., Waibel, A. E., Welling, M., Wienhold, F. G., Zenker, T., Crutzen, P. J., Arnold, F., Burger, V., Schneider, J., Bregman, A., Lelieveld, J., and Siegmund, P. C.: Observations of high concentrations of total reactive nitrogen (NOy) and nitric acid (HNO3) in the lower Arctic stratosphere during the stratosphere-troposphere experiment by aircraft measurements (STREAM) II campaign in February 1995, J. Geophys. Res., 102, 23559–23571, https://doi.org/10.1029/97jd02012, 1997.
Fischer, H., Wienhold, F. G., Hoor, P., Bujok, O., Schiller, C., Siegmund, P., Ambaum, M., Scheeren, H. A., and Lelieveld, J.: Tracer correlations in the northern high latitude lowermost stratosphere: Influence of cross-tropopause mass exchange, Geophys. Res. Lett., 27, 97–100, https://doi.org/10.1029/1999gl010879, 2000.
Friedl-Vallon, F., Gulde, T., Hase, F., Kleinert, A., Kulessa, T., Maucher, G., Neubert, T., Olschewski, F., Piesch, C., Preusse, P., Rongen, H., Sartorius, C., Schneider, H., Schonfeld, A., Tan, V., Bayer, N., Blank, J., Dapp, R., Ebersoldt, A., Fischer, H., Graf, F., Guggenmoser, T., Hopfner, M., Kaufmann, M., Kretschmer, E., Latzko, T., Nordmeyer, H., Oelhaf, H., Orphal, J., Riese, M., Schardt, G., Schillings, J., Sha, M. K., Suminska-Ebersoldt, O., and Ungermann, J.: Instrument concept of the imaging Fourier transform spectrometer GLORIA, Atmos. Meas. Tech., 7, 3565–3577, https://doi.org/10.5194/amt-7-3565-2014, 2014.
Greenblatt, G. D. and Ravishankara, A. R.: Laboratory Studies on the Stratospheric NOx Production-Rate, J. Geophys. Res., 95, 3539–3547, https://doi.org/10.1029/JD095iD04p03539, 1990.
Grooß, J.-U.: Replication Data for the studies on HCl discrepancy and on total reactive nitrogen redistribution, Jülich DATA [data set], V1, https://doi.org/10.26165/JUELICH-DATA/FBZRVO, 2022.
Grooß, J. U., Gunther, G., Müller, R., Konopka, P., Bausch, S., Schlager, H., Voigt, C., Volk, C. M., and Toon, G. C.: Simulation of denitrification and ozone loss for the Arctic winter 2002/2003, Atmos. Chem. Phys., 5, 1437–1448, https://doi.org/10.5194/acp-5-1437-2005, 2005.
Grooß, J. U., Engel, I., Borrmann, S., Frey, W., Gunther, G., Hoyle, C. R., Kivi, R., Luo, B. P., Molleker, S., Peter, T., Pitts, M. C., Schlager, H., Stiller, G., Vömel, H., Walker, K. A., and Müller, R.: Nitric acid trihydrate nucleation and denitrification in the Arctic stratosphere, Atmos. Chem. Phys., 14, 1055–1073, https://doi.org/10.5194/acp-14-1055-2014, 2014.
Grooß, J. U., Müller, R., Spang, R., Tritscher, I., Wegner, T., Chipperfield, M. P., Feng, W. H., Kinnison, D. E., and Madronich, S.: On the discrepancy of HCl processing in the core of the wintertime polar vortices, Atmos. Chem. Phys., 18, 8647–8666, https://doi.org/10.5194/acp-18-8647-2018, 2018.
Hanson, D. and Mauersberger, K.: Laboratory Studies of the Nitric-Acid Trihydrate – Implications for the South Polar Stratosphere, Geophys. Res. Lett., 15, 855–858, https://doi.org/10.1029/GL015i008p00855, 1988.
Hegglin, M. I. and Shepherd, T. G.: O3–N2O correlations from the Atmospheric Chemistry Experiment: Revisiting a diagnostic of transport and chemistry in the stratosphere, J. Geophys. Res., 112, D19301, https://doi.org/10.1029/2006jd008281, 2007. d
Hegglin, M. I., Brunner, D., Peter, T., Hoor, P., Fischer, H., Staehelin, J., Krebsbach, M., Schiller, C., Parchatka, U., and Weers, U.: Measurements of NO, NOy, N2O, and O3 during SPURT: implications for transport and chemistry in the lowermost stratosphere, Atmos. Chem. Phys., 6, 1331–1350, https://doi.org/10.5194/acp-6-1331-2006, 2006.
Hintsa, E. J., Newman, P. A., Jonsson, H. H., Webster, C. R., May, R. D., Herman, R. L., Lait, L. R., Schoeberl, M. R., Elkins, J. W., Wamsley, P. R., Dutton, G. S., Bui, T. P., Kohn, D. W., and Anderson, J. G.: Dehydration and denitrification in the Arctic polar vortex during the 1995–1996 winter, Geophys. Res. Lett., 25, 501–504, https://doi.org/10.1029/98gl00115, 1998.
Hoor, P., Gurk, C., Brunner, D., Hegglin, M. I., Wernli, H., and Fischer, H.: Seasonality and extent of extratropical TST derived from in-situ CO measurements during SPURT, Atmos. Chem. Phys., 4, 1427–1442, https://doi.org/10.5194/acp-4-1427-2004, 2004.
Hoyle, C. R., Engel, I., Luo, B. P., Pitts, M. C., Poole, L. R., Grooß, J. U., and Peter, T.: Heterogeneous formation of polar stratospheric clouds – Part 1: Nucleation of nitric acid trihydrate (NAT), Atmos. Chem. Phys., 13, 9577–9595, https://doi.org/10.5194/acp-13-9577-2013, 2013.
Hübler, G., Fahey, D. W., Kelly, K. K., Montzka, D. D., Carroll, M. A., Tuck, A. F., Heidt, L. E., Pollock, W. H., Gregory, G. L., and Vedder, J. F.: Redistribution of Reactive Odd Nitrogen in the Lower Arctic Stratosphere, Geophys. Res. Lett., 17, 453–456, https://doi.org/10.1029/GL017i004p00453, 1990.
Jin, J. J., Semeniuk, K., Manney, G. L., Jonsson, A. I., Beagley, S. R., McConnell, J. C., Rinsland, C. P., Boone, C. D., Walker, K. A., and Bernath, P. F.: Denitrification in the Arctic winter 2004/2005: Observations from ACE-FTS, Geophys. Res. Lett., 33, L19814, https://doi.org/10.1029/2006gl027687, 2006.
Johansson, S., Woiwode, W., Hopfner, M., Friedl-Vallon, F., Kleinert, A., Kretschmer, E., Latzko, T., Orphal, J., Preusse, P., Ungermann, J., Santee, M. L., Jurkat-Witschas, T., Marsing, A., Voigt, C., Giez, A., Kramer, M., Rolf, C., Zahn, A., Engel, A., Sinnhuber, B. M., and Oelhaf, H.: Airborne limb-imaging measurements of temperature, HNO3, O3, ClONO2, H2O and CFC-12 during the Arctic winter 2015/2016: characterization, in situ validation and comparison to Aura/MLS, Atmos. Meas. Tech., 11, 4737–4756, https://doi.org/10.5194/amt-11-4737-2018, 2018.
Johansson, S., Santee, M. L., Grooß, J. U., Hopfner, M., Braun, M., Friedl-Vallon, F., Khosrawi, F., Kirner, O., Kretschmer, E., Oelhaf, H., Orphal, J., Sinnhuber, B. M., Tritscher, I., Ungermann, J., Walker, K. A., and Woiwode, W.: Unusual chlorine partitioning in the 2015/16 Arctic winter lowermost stratosphere: observations and simulations, Atmos. Chem. Phys., 19, 8311–8338, https://doi.org/10.5194/acp-19-8311-2019, 2019.
Jurkat, T., Kaufmann, S., Voigt, C., Schauble, D., Jessberger, P., and Ziereis, H.: The airborne mass spectrometer AIMS – Part 2: Measurements of trace gases with stratospheric or tropospheric origin in the UTLS, Atmos. Meas. Tech., 9, 1907–1923, https://doi.org/10.5194/amt-9-1907-2016, 2016.
Jurkat, T., Voigt, C., Kaufmann, S., Grooß, J. U., Ziereis, H., Dornbrack, A., Hoor, P., Bozem, H., Engel, A., Bönisch, H., Keber, T., Huneke, T., Pfeilsticker, K., Zahn, A., Walker, K. A., Boone, C. D., Bernath, P. F., and Schlager, H.: Depletion of ozone and reservoir species of chlorine and nitrogen oxide in the lower Antarctic polar vortex measured from aircraft, Geophys. Res. Lett., 44, 6440–6449, https://doi.org/10.1002/2017gl073270, 2017.
Keim, E. R., Loewenstein, M., Podolske, J. R., Fahey, D. W., Gao, R. S., Woodbridge, E. L., Wamsley, R. C., Donnelly, S. G., DelNegro, L. A., Nevison, C. D., Solomon, S., Rosenlof, K. H., Scott, C. J., Ko, M. K. W., Weisenstein, D., and Chan, K. R.: Measurements of the NOy-N2O correlation in the lower stratosphere: Latitudinal and seasonal changes and model comparisons, J. Geophys. Res., 102, 13193–13212, https://doi.org/10.1029/96jd03921, 1997.
Khosrawi, F., Urban, J., Pitts, M. C., Voelger, P., Achtert, P., Kaphlanov, M., Santee, M. L., Manney, G. L., Murtagh, D., and Fricke, K. H.: Denitrification and polar stratospheric cloud formation during the Arctic winter 2009/2010, Atmos. Chem. Phys., 11, 8471–8487, https://doi.org/10.5194/acp-11-8471-2011, 2011.
Khosrawi, F., Kirner, O., Sinnhuber, B. M., Johansson, S., Hopfner, M., Santee, M. L., Froidevaux, L., Ungermann, J., Ruhnke, R., Woiwode, W., Oelhaf, H., and Braesicke, P.: Denitrification, dehydration and ozone loss during the 2015/2016 Arctic winter, Atmos. Chem. Phys., 17, 12893–12910, https://doi.org/10.5194/acp-17-12893-2017, 2017.
Kley, D. A. M. M.: Chemiluminescence Detector for NO and NO2, Atmos. Technol., 12, 63–69, 1980.
Krasauskas, L., Ungermann, J., Preusse, P., Friedl-Vallon, F., Zahn, A., Ziereis, H., Rolf, C., Plöger, F., Konopka, P., Vogel, B., and Riese, M.: 3-D tomographic observations of Rossby wave breaking over the North Atlantic during the WISE aircraft campaign in 2017, Atmos. Chem. Phys., 21, 10249–10272, https://doi.org/10.5194/acp-21-10249-2021, 2021.
Krause, J., Hoor, P., Engel, A., Ploger, F., Grooß, J. U., Bönisch, H., Keber, T., Sinnhuber, B. M., Woiwode, W., and Oelhaf, H.: Mixing and ageing in the polar lower stratosphere in winter 2015–2016, Atmos. Chem. Phys., 18, 6057–6073, https://doi.org/10.5194/acp-18-6057-2018, 2018.
Lelieveld, J., Bourtsoukidis, E., Bruhl, C., Fischer, H., Fuchs, H., Harder, H., Hofzumahaus, A., Holland, F., Marno, D., Neumaier, M., Pozzer, A., Schlager, H., Williams, J., Zahn, A., and Ziereis, H.: The South Asian monsoon-pollution pump and purifier, Science, 361, 270-273, https://doi.org/10.1126/science.aar2501, 2018.
Loewenstein, M., Podolske, J. R., Fahey, D. W., Woodbridge, E. L., Tin, P., Weaver, A., Newman, P. A., Strahan, S. E., Kawa, S. R., Schoeberl, M. R., and Lait, L. R.: New Observations of the Noy N2O Correlation in the Lower Stratosphere, Geophys. Res. Lett., 20, 2531–2534, https://doi.org/10.1029/93gl03004, 1993.
Lowe, D. and MacKenzie, A. R.: Polar stratospheric cloud microphysics and chemistry, J. Atmos. Sol.-Terr. Phys., 70, 13–40, https://doi.org/10.1016/j.jastp.2007.09.011, 2008.
Manney, G. L. and Lawrence, Z. D.: The major stratospheric final warming in 2016: dispersal of vortex air and termination of Arctic chemical ozone loss, Atmos. Chem. Phys., 16, 15371–15396, https://doi.org/10.5194/acp-16-15371-2016, 2016.
Marsing, A., Jurkat-Witschas, T., Grooß, J. U., Kaufmann, S., Heller, R., Engel, A., Hoor, P., Krause, J., and Voigt, C.: Chlorine partitioning in the lowermost Arctic vortex during the cold winter 2015/2016, Atmos. Chem. Phys., 19, 10757–10772, https://doi.org/10.5194/acp-19-10757-2019, 2019.
Matthias, V., Dörnbrack, A., and Stober, G.: The extraordinarily strong and cold polar vortex in the early northern winter 2015/2016, Geophys. Res. Lett., 43, 12287–12294, https://doi.org/10.1002/2016gl071676, 2016.
Molleker, S., Borrmann, S., Schlager, H., Luo, B., Frey, W., Klingebiel, M., Weigel, R., Ebert, M., Mitev, V., Matthey, R., Woiwode, W., Oelhaf, H., Dörnbrack, A., Stratmann, G., Grooß, J. U., Gunther, G., Vogel, B., Müller, R., Kramer, M., Meyer, J., and Cairo, F.: Microphysical properties of synoptic-scale polar stratospheric clouds: in situ measurements of unexpectedly large HNO3-containing particles in the Arctic vortex, Atmos. Chem. Phys., 14, 10785–10801, https://doi.org/10.5194/acp-14-10785-2014, 2014.
Müller, R., Crutzen, P. J., Grooß, J. U., Bruhl, C., Russell, J. M., and Tuck, A. F.: Chlorine activation and ozone depletion in the Arctic vortex: Observations by the Halogen Occultation Experiment on the Upper Atmosphere Research Satellite, J. Geophys. Res., 101, 12531–12554, 1996.
Müller, S., Hoor, P., Bozem, H., Gute, E., Vogel, B., Zahn, A., Bönisch, H., Keber, T., Kramer, M., Rolf, C., Riese, M., Schlager, H., and Engel, A.: Impact of the Asian monsoon on the extratropical lower stratosphere: trace gas observations during TACTS over Europe 2012, Atmos. Chem. Phys., 16, 10573–10589, https://doi.org/10.5194/acp-16-10573-2016, 2016.
Murphy, D. M., Fahey, D. W., Proffitt, M. H., Liu, S. C., Chan, K. R., Eubank, C. S., Kawa, S. R., and Kelly, K. K.: Reactive Nitrogen and Its Correlation with Ozone in the Lower Stratosphere and Upper Troposphere, J. Geophys. Res., 98, 8751–8773, https://doi.org/10.1029/92jd00681, 1993.
Newman, P. A., Harris, N. R. P., Adriani, A., Amanatidis, G. T., Anderson, J. G., Braathen, G. O., Brune, W. H., Carslaw, K. S., Craig, M. S., DeCola, P. L., Guirlet, M., Hipskind, R. S., Kurylo, M. J., Kullmann, H., Larsen, N., Megie, G. J., Pommereau, J. P., Poole, L. R., Schoeberl, M. R., Stroh, F., Toon, O. B., Trepte, C. R., and Van Roozendael, M.: An overview of the SOLVE/THESEO 2000 campaign, J. Geophys. Res., 107, 8259, https://doi.org/10.1029/2001jd001303, 2002.
Northway, M. J., Gao, R. S., Popp, P. J., Holecek, J. C., Fahey, D. W., Carslaw, K. S., Tolbert, M. A., Lait, L. R., Dhaniyala, S., Flagan, R. C., Wennberg, P. O., Mahoney, M. J., Herman, R. L., Toon, G. C., and Bui, T. P.: An analysis of large HNO3-containing particles sampled in the Arctic stratosphere during the winter of 1999/2000, J. Geophys. Res., 107, 8298, https://doi.org/10.1029/2001jd001079, 2002.
Oelhaf, H., Sinnhuber, B. M., Woiwode, W., Bönisch, H., Bozem, H., Engel, A., Fix, A., Friedl-Vallon, F., Grooß, J. U., Hoor, P., Johansson, S., Jurkat-Witschas, T., Kaufmann, S., Kramer, M., Krause, J., Kretschmer, E., Lorks, D., Marsing, A., Orphal, J., Pfeilsticker, K., Pitts, M., Poole, L., Preusse, P., Rapp, M., Riese, M., Rolf, C., Ungermann, J., Voigt, C., Volk, C. M., Wirth, M., Zahn, A., and Ziereis, H.: Polstracc: Airborne Experiment for Studying the Polar Stratosphere in a Changing Climate with the High Altitude and Long Range Research Aircraft (HALO), B. Am. Meteorol. Soc., 100, 2634–2664, https://doi.org/10.1175/Bams-D-18-0181.1, 2019.
Pitts, M. C., Poole, L. R., and Gonzalez, R.: Polar stratospheric cloud climatology based on CALIPSO spaceborne lidar measurements from 2006 to 2017, Atmos. Chem. Phys., 18, 10881–10913, https://doi.org/10.5194/acp-18-10881-2018, 2018.
Ploeger, F., Riese, M., Haenel, F., Konopka, P., Müller, R., and Stiller, G.: Variability of stratospheric mean age of air and of the local effects of residual circulation and eddy mixing, J. Geophys. Res., 120, 716–733, https://doi.org/10.1002/2014jd022468, 2015.
Plumb, R. A. and Ko, M. K. W.: Interrelationships between Mixing Ratios of Long Lived Stratospheric Constituents, J. Geophys. Res., 97, 10145–10156, https://doi.org/10.1029/92jd00450, 1992.
POLSTRACC mission: POLSTRACC mission data, POLSTRACC mission [data set], https://halo-db.pa.op.dlr.de/mission/3, last access: 21 July 2021.
Pommrich, R., Müller, R., Grooß, J. U., Konopka, P., Ploeger, F., Vogel, B., Tao, M., Hoppe, C. M., Gunther, G., Spelten, N., Hoffmann, L., Pumphrey, H. C., Viciani, S., D'Amato, F., Volk, C. M., Hoor, P., Schlager, H., and Riese, M.: Tropical troposphere to stratosphere transport of carbon monoxide and long-lived trace species in the Chemical Lagrangian Model of the Stratosphere (CLaMS), Geosci. Model Dev., 7, 2895–2916, https://doi.org/10.5194/gmd-7-2895-2014, 2014.
Popp, P. J., Northway, M. J., Holecek, J. C., Gao, R. S., Fahey, D. W., Elkins, J. W., Hurst, D. F., Romashkin, P. A., Toon, G. C., Sen, B., Schauffler, S. M., Salawitch, R. J., Webster, C. R., Herman, R. L., Jost, H., Bui, T. P., Newman, P. A., and Lait, L. R.: Severe and extensive denitrification in the 1999–2000 Arctic winter stratosphere, Geophys. Res. Lett., 28, 2875–2878, https://doi.org/10.1029/2001gl013132, 2001.
Prather, M. J., Hsu, J., DeLuca, N. M., Jackman, C. H., Oman, L. D., Douglass, A. R., Fleming, E. L., Strahan, S. E., Steenrod, S. D., Sovde, O. A., Isaksen, I. S. A., Froidevaux, L., and Funke, B.: Measuring and modeling the lifetime of nitrous oxide including its variability, J. Geophys. Res., 120, 5693–5705, https://doi.org/10.1002/2015jd023267, 2015.
Reiner, T., Hanke, M., Arnold, F., Ziereis, H., Schlager, H., and Junkerman, W.: Aircraft-borne measurements of peroxy radicals by chemical conversion/ion molecule reaction mass spectrometry: Calibration, diagnostics, and results, J. Geophys. Res., 104, 18647–18659, https://doi.org/10.1029/1999jd900312, 1999.
Rex, M., Salawitch, R. J., Deckelmann, H., von der Gathen, P., Harris, N. R. P., Chipperfield, M. P., Naujokat, B., Reimer, E., Allaart, M., Andersen, S. B., Bevilacqua, R., Braathen, G. O., Claude, H., Davies, J., De Backer, H., Dier, H., Dorokhov, V., Fast, H., Gerding, M., Godin-Beekmann, S., Hoppel, K., Johnson, B., Kyro, E., Litynska, Z., Moore, D., Nakane, H., Parrondo, M. C., Risley, A. D., Skrivankova, P., Stubi, R., Viatte, P., Yushkov, V., and Zerefos, C.: Arctic winter 2005: Implications for stratospheric ozone loss and climate change, Geophys. Res. Lett., 33, L23808, https://doi.org/10.1029/2006gl026731, 2006.
Ridley, B. A., Schiff, H. I., Shaw, A. W., Megill, L. R., Bates, L., Howlett, C., Levaux, H., and Ashenfelter, T. E.: Measurement of Nitric Oxide in Stratosphere between 17.4 and 22.9 km, Planet. Space Sci., 22, 19–24, https://doi.org/10.1016/0032-0633(74)90120-2, 1974.
Riese, M., Ploeger, F., Rap, A., Vogel, B., Konopka, P., Dameris, M., and Forster, P.: Impact of uncertainties in atmospheric mixing on simulated UTLS composition and related radiative effects, J. Geophys. Res.-Atmos., 117, D16305, https://doi.org/10.1029/2012jd017751, 2012.
Riese, M., Oelhaf, H., Preusse, P., Blank, J., Ern, M., Friedl-Vallon, F., Fischer, H., Guggenmoser, T., Hopfner, M., Hoor, P., Kaufmann, M., Orphal, J., Ploger, F., Spang, R., Suminska-Ebersoldt, O., Ungermann, J., Vogel, B., and Woiwode, W.: Gimballed Limb Observer for Radiance Imaging of the Atmosphere (GLORIA) scientific objectives, Atmos. Meas. Tech., 7, 1915–1928, https://doi.org/10.5194/amt-7-1915-2014, 2014.
Schneider, J., Arnold, F., Curtius, J., Sierau, B., Fischer, H., Hoor, P., Wienhold, F. G., Parchatka, U., Zhang, Y. C., Schlager, H., Ziereis, H., Feigl, C., Lelieveld, J., Scheeren, H. A., and Bujok, O.: The temporal evolution of the ratio HNO3 NOy in the Arctic lower stratosphere from January to March 1997, Geophys. Res. Lett., 26, 1125–1128, https://doi.org/10.1029/1999gl900184, 1999.
Schreiner, J., Voigt, C., Kohlmann, A., Amold, F., Mauersberger, K., and Larsen, N.: Chemical analysis of polar stratospheric cloud particles, Science, 283, 968–970, https://doi.org/10.1126/science.283.5404.968, 1999.
Sinnhuber, B. M., Chipperfield, M. P., Davies, S., Burrows, J. P., Eichmann, K. U., Weber, M., von der Gathen, P., Guirlet, M., Cahill, G. A., Lee, A. M., and Pyle, J. A.: Large loss of total ozone during the Arctic winter of 1999/2000, Geophys. Res. Lett., 27, 3473–3476, https://doi.org/10.1029/2000gl011772, 2000.
Sinnhuber, B. M., Stiller, G., Ruhnke, R., von Clarmann, T., Kellmann, S., and Aschmann, J.: Arctic winter 2010/2011 at the brink of an ozone hole, Geophys. Res. Lett., 38, L24814, https://doi.org/10.1029/2011gl049784, 2011.
Solomon, S.: Progress Towards a Quantitative Understanding of Antarctic Ozone Depletion, Nature, 347, 347–354, https://doi.org/10.1038/347347a0, 1990.
Solomon, S.: Stratospheric ozone depletion: A review of concepts and history, Rev. Geophys., 37, 275–316, https://doi.org/10.1029/1999rg900008, 1999.
Strahan, S. E.: Climatologies of lower stratospheric NOy and O3 and correlations with N2O based on in situ observations, J. Geophys. Res., 104, 30463–30480, https://doi.org/10.1029/1999jd900775, 1999.
Stratmann, G., Ziereis, H., Stock, P., Brenninkmeijer, C. A. M., Zahn, A., Rauthe-Schöch, A., Velthoven, P. V., Schlager, H., and Volz-Thomas, A.: NO and NOy in the upper troposphere: Nine years of CARIBIC measurements onboard a passenger aircraft, Atmos. Environ., 133, 93–111, https://doi.org/10.1016/j.atmosenv.2016.02.035, 2016.
Tritscher, I., Grooß, J. U., Spang, R., Pitts, M. C., Poole, L. R., Müller, R., and Riese, M.: Lagrangian simulation of ice particles and resulting dehydration in the polar winter stratosphere, Atmos. Chem. Phys., 19, 543–563, https://doi.org/10.5194/acp-19-543-2019, 2019.
Tritscher, I., Pitts, M. C., Poole, L. R., Alexander, S. P., Cairo, F., Chipperfield, M. P., Grooß, J.-U., Höpfner, M., Lambert, A., Luo, B. P., Molleker, S., Orr, A., Salawitch, R., Snels, M., Spang, R., Woiwode, W., and Peter, T.: Polar Stratospheric Clouds Satellite Observations, Processes, and Role in Ozone Depletion, Rev. Geophys., 59, e2020RG000702, https://doi.org/10.1029/2020RG000702, 2021.
Voigt, C., Schreiner, J., Kohlmann, A., Zink, P., Mauersberger, K., Larsen, N., Deshler, T., Kroger, C., Rosen, J., Adriani, A., Cairo, F., Di Donfrancesco, G., Viterbini, M., Ovarlez, J., Ovarlez, H., David, C., and Dornbrack, A.: Nitric acid trihydrate (NAT) in polar stratospheric clouds, Science, 290, 1756–1758, https://doi.org/10.1126/science.290.5497.1756, 2000.
Voigt, C., Schlager, H., Luo, B. P., Dornbrack, A. D., Roiger, A., Stock, P., Curtius, J., Vossing, H., Borrmann, S., Davies, S., Konopka, P., Schiller, C., Shur, G., and Peter, T.: Nitric Acid Trihydrate (NAT) formation at low NAT supersaturation in Polar Stratospheric Clouds (PSCs), Atmos. Chem. Phys., 5, 1371–1380, https://doi.org/10.5194/acp-5-1371-2005, 2005.
Voigt, C., Schlager, H., Ziereis, H., Karcher, B., Luo, B. P., Schiller, C., Kramer, M., Popp, P. J., Irie, H., and Kondo, Y.: Nitric acid in cirrus clouds, Geophys. Res. Lett., 33, L05803, https://doi.org/10.1029/2005GL025159, 2006.
Voigt, C., Schumann, U., Minikin, A., Abdelmonem, A., Afchine, A., Borrmann, S., Boettcher, M., Buchholz, B., Bugliaro, L., Costa, A., Curtius, J., Dollner, M., Dornbrack, A., Dreiling, V., Ebert, V., Ehrlich, A., Fix, A., Forster, L., Frank, F., Fütterer, D., Giez, A., Graf, K., Grooß, J. U., Gross, S., Heimerl, K., Heinold, B., Huneke, T., Jarvinen, E., Jurkat, T., Kaufmann, S., Kenntner, M., Klingebiel, M., Klimach, T., Kohl, R., Krämer, M., Krisna, T. C., Luebke, A., Mayer, B., Mertes, S., Molleker, S., Petzold, A., Pfeilsticker, K., Port, M., Rapp, M., Reutter, P., Rolf, C., Rose, D., Sauer, D., Schafer, A., Schlage, R., Schnaiter, M., Schneider, J., Spelten, N., Spichtinger, P., Stock, P., Walser, A., Weigel, R., Weinzierl, B., Wendisch, M., Werner, F., Wernli, H., Wirth, M., Zahn, A., Ziereis, H., and Zöger, M.: Ml-Cirrus the Airborne Experiment on Natural Cirrus and Contrail Cirrus with the High-Altitude Long-Range Research Aircraft HALO, B. Am. Meteorol. Soc., 98, 271–288, https://doi.org/10.1175/Bams-D-15-00213.1, 2017.
Voigt, C., Dörnbrack, A., Wirth, M., Gross, S. M., Pitts, M. C., Poole, L. R., Baumann, R., Ehard, B., Sinnhuber, B. M., Woiwode, W., and Oelhaf, H.: Widespread polar stratospheric ice clouds in the 2015–2016 Arctic winter – implications for ice nucleation, Atmos. Chem. Phys., 18, 15623–15641, https://doi.org/10.5194/acp-18-15623-2018, 2018.
von Hobe, M., Bekki, S., Borrmann, S., Cairo, F., D'Amato, F., Di Donfrancesco, G., Dornbrack, A., Ebersoldt, A., Ebert, M., Emde, C., Engel, I., Ern, M., Frey, W., Genco, S., Griessbach, S., Grooß, J. U., Gulde, T., Gunther, G., Hosen, E., Hoffmann, L., Homonnai, V., Hoyle, C. R., Isaksen, I. S. A., Jackson, D. R., Janosi, I. M., Jones, R. L., Kandler, K., Kalicinsky, C., Keil, A., Khaykin, S. M., Khosrawi, F., Kivi, R., Kuttippurath, J., Laube, J. C., Lefevre, F., Lehmann, R., Ludmann, S., Luo, B. P., Marchand, M., Meyer, J., Mitev, V., Molleker, S., Müller, R., Oelhaf, H., Olschewski, F., Orsolini, Y., Peter, T., Pfeilsticker, K., Piesch, C., Pitts, M. C., Poole, L. R., Pope, F. D., Ravegnani, F., Rex, M., Riese, M., Rockmann, T., Rognerud, B., Roiger, A., Rolf, C., Santee, M. L., Scheibe, M., Schiller, C., Schlager, H., de Cumis, M. S., Sitnikov, N., Sovde, O. A., Spang, R., Spelten, N., Stordal, F., Suminska-Ebersoldt, O., Ulanovski, A., Ungermann, J., Viciani, S., Volk, C. M., Scheidt, M. V., von der Gathen, P., Walker, K., Wegner, T., Weigel, R., Weinbruch, S., Wetzel, G., Wienhold, F. G., Wohltmann, I., Woiwode, W., Young, I. A. K., Yushkov, V., Zobrist, B., and Stroh, F.: Reconciliation of essential process parameters for an enhanced predictability of Arctic stratospheric ozone loss and its climate interactions (RECONCILE): activities and results, Atmos. Chem. Phys., 13, 9233–9268, https://doi.org/10.5194/acp-13-9233-2013, 2013.
Waibel, A. E., Peter, T., Carslaw, K. S., Oelhaf, H., Wetzel, G., Crutzen, P. J., Poschl, U., Tsias, A., Reimer, E., and Fischer, H.: Arctic ozone loss due to denitrification, Science, 283, 2064–2069, https://doi.org/10.1126/science.283.5410.2064, 1999.
Weinheimer, A. J., Walega, J. G., Ridley, B. A., Sachse, G. W., Anderson, B. E., and Collins, J. E.: Stratospheric NOy Measurements on the NASA DC-8 during AASE-II, Geophys. Res. Lett., 20, 2563–2566, https://doi.org/10.1029/93gl02627, 1993.
Weinheimer, A. J., Campos, T. L., Walega, J. G., Grahek, F. E., Ridley, B. A., Baumgardner, D., Twohy, C. H., Gandrud, B., and Jensen, E. J.: Uptake of NOy on wave-cloud ice particles, Geophys. Res. Lett., 25, 1725–1728, https://doi.org/10.1029/97gl02957, 1998.
Wendisch, M., Poschl, U., Andreae, M. O., Machado, L. A. T., Albrecht, R., Schlager, H., Rosenfeld, D., Martin, S. T., Abdelmomonem, A., Afchine, A., Araujo, A. C., Artaxo, P., Aufmhoff, H., Barbosa, H. M. J., Borrmann, S., Braga, R., Buchholz, B., Cecchini, M. A., Costa, A., Curtius, J., Dollner, M., Dorf, M., Dreiling, V., Ebert, V., Ehrlich, A., Ewald, F., Fisch, G., Fix, A., Frank, F., Futterer, D., Heckl, C., Heidelberg, F., Huneke, T., Jakel, E., Jarvinen, E., Jurkat, T., Kanter, S., Kastner, U., Kenntner, M., Kesselmeier, J., Klimach, T., Knecht, M., Kohl, R., Kolling, T., Kramer, M., Kruger, M., Krisna, T. C., Lavric, J. V., Longo, K., Mahnke, C., Manzi, A. O., Mayer, B., Mertes, S., Minikin, A., Molleker, S., Munch, S., Nillius, B., Pfeilsticker, K., Pohlker, C., Roiger, A., Rose, D., Rosenowow, D., Sauer, D., Schnaiter, M., Schneider, J., Schulz, C., de Souza, R. A. F., Spanu, A., Stock, P., Vila, D., Voigt, C., Walser, A., Walter, D., Weigel, R., Weinzierl, B., Werner, F., Yamasoe, M. A., Ziereis, H., Zinner, T., and Zöger, M.: ACRIDICON-CHUVA CAMPAIGN Studying Tropical Deep Convective Clouds and Precipitation over Amazonia Using the New German Research Aircraft HALO, B. Am. Meteorol. Soc., 97, 1885–1908, https://doi.org/10.1175/Bams-D-14-00255.1, 2016.
Wetzel, G., Oelhaf, H., Ruhnke, R., Friedl-Vallon, F., Kleinert, A., Kouker, W., Maucher, G., Reddmann, T., Seefeldner, M., Stowasser, M., Trieschmann, O., von Clarmann, T., and Fischer, H.: NOy partitioning and budget and its correlation with N2O in the Arctic vortex and in summer midlatitudes in 1997, J. Geophys. Res., 107, 4280, https://doi.org/10.1029/2001jd000916, 2002.
Woiwode, W., Grooß, J. U., Oelhaf, H., Molleker, S., Borrmann, S., Ebersoldt, A., Frey, W., Gulde, T., Khaykin, S., Maucher, G., Piesch, C., and Orphal, J.: Denitrification by large NAT particles: the impact of reduced settling velocities and hints on particle characteristics, Atmos. Chem. Phys., 14, 11525–11544, https://doi.org/10.5194/acp-14-11525-2014, 2014.
Zahn, A., Weppner, J., Widmann, H., Schlote-Holubek, K., Burger, B., Kuhner, T., and Franke, H.: A fast and precise chemiluminescence ozone detector for eddy flux and airborne application, Atmos. Meas. Tech., 5, 363–375, https://doi.org/10.5194/amt-5-363-2012, 2012.
Ziereis, H., Schlager, H., Fischer, H., Feigl, C., Hoor, P., Marquardt, R., and Wagner, V.: Aircraft measurements of tracer correlations in the Arctic subvortex region during the Polar Stratospheric Aerosol Experiment (POLSTAR), J. Geophys. Res., 105, 24305–24313, https://doi.org/10.1029/2000jd900288, 2000a.
Ziereis, H., Schlager, H., Schulte, P., van Velthoven, P. F. J., and Slemr, F.: Distributions of NO, NOx, and NOy in the upper troposphere and lower stratosphere between 28∘ and 61∘ N during POLINAT 2, J. Geophys. Res., 105, 3653–3664, https://doi.org/10.1029/1999jd900870, 2000b.
Ziereis, H., Minikin, A., Schlager, H., Gayet, J. F., Auriol, F., Stock, P., Baehr, J., Petzold, A., Schumann, U., Weinheimer, A., Ridley, B., and Ström, J.: Uptake of reactive nitrogen on cirrus cloud particles during INCA, Geophys. Res. Lett., 31, L05115, https://doi.org/10.1029/2003gl018794, 2004.
Zöger, M., Afchine, A., Eicke, N., Gerhards, M. T., Klein, E., McKenna, D. S., Morschel, U., Schmidt, U., Tan, V., Tuitjer, F., Woyke, T., and Schiller, C.: Fast in situ stratospheric hygrometers: A new family of balloon-borne and airborne Lyman alpha photofragment fluorescence hygrometers, J. Geophys. Res., 104, 1807–1816, https://doi.org/10.1029/1998jd100025, 1999.