the Creative Commons Attribution 4.0 License.
the Creative Commons Attribution 4.0 License.
 | 17 Mar 2022
Observations of aerosol–vapor pressure deficit–evaporative fraction coupling over India
Chandan Sarangi
TC Chakraborty
Mithun Krishnan
Ross Morrison
Jonathan Evans
Lina M. Mercado
Northern India is a densely populated subtropical region with heavy aerosol loading (mean aerosol optical depth or AOD is ∼0.7), frequent heat waves, and strong atmosphere–biosphere coupling, making it ideal for studying the impacts of aerosols and the temperature variation in latent heat flux (LH) and evaporative fraction (EF). Here, using in situ observations during the onset of the summer monsoon over a semi-natural grassland site in this region, we confirm that strong co-variability exists among aerosols, LH, air temperature (Tair), and the vapor pressure deficit (VPD). Since the surface evapotranspiration is strongly controlled by both physical (available energy and moisture demand) and physiological (canopy and aerodynamic resistance) factors, we separately analyze our data for different combinations of aerosols and Tair/VPD changes. We find that aerosol loading and warmer conditions both reduce sensible heat (SH). Furthermore, we find that an increase in atmospheric VPD tends to decrease the gross primary production (GPP) and, thus, LH, most likely as a response to stomatal closure of the dominant grasses at this location. In contrast, under heavy aerosol loading, LH is enhanced partly due to the physiological control exerted by the diffuse radiation fertilization effect (thus increasing EF). Moreover, LH and EF increases with aerosol loading even under heat wave conditions, indicating a decoupling of the plant's response to the VPD enhancement (stomatal closure) in the presence of high aerosol conditions. Our results encourage detailed in situ experiments and mechanistic modeling of AOD–VPD–EF coupling for a better understanding of Indian monsoon dynamics and crop vulnerability in a heat stressed and heavily polluted future India.
- Article
(5286 KB) - Full-text XML
-
Supplement
(601 KB) - BibTeX
- EndNote


-
A rigorous analysis of aerosol–EF–VPD (aerosol–evaporative fraction–vapor pressure deficit) coupling using collocated direct observations is presented.
-
Increased aerosol loading enhances EF by decreasing the sensible heat and increasing latent heat.
-
Aerosols modulate the response of vegetation to changes in VPD under heat wave conditions.
The surface energy balance represents the balance between the net radiation (NR) flux at the Earth's surface and the partitioning of NR into latent heat (LH), sensible heat (SH), and ground heat (GH) fluxes (Wang and Dickinson, 2012). While the dominant partitioning of energy as SH enhances the near-surface air temperature, the LH flux cools the surface and increases the moisture content of the boundary layer. Thus, perturbations to the partitioning of the outgoing turbulent energy fluxes from the land surface modify the near-surface micrometeorology. One way of representing this partitioning is the evaporative fraction () or the proportion of the total available energy (NR-GH) available at the surface released via vegetation evapotranspiration and soil evaporation. Earlier studies have established that the evaporative fraction (EF) can be modulated by a range of factors, including vapor pressure deficit (VPD), soil moisture, canopy structure, atmospheric composition, solar radiation, and stomatal behavior (Baldocchi, 1997).
The variability in VPD, which describes the near-surface moisture deficit for a given temperature (difference between the saturated and ambient vapor pressure for atmospheric water) is arguably the dominant nonlinear forcing on EF variability (Gu et al., 2006). On the one hand, an increase in VPD leads to the partitioning of more of the available energy into LH to meet the atmospheric moisture demand, which is part of the physical control on evapotranspiration (Monteith, 1965; Penman, 1948). On the other hand, high VPD also triggers the partial closure of leaf stomata in response to increased atmospheric dryness (Damour et al., 2010; Jones and Sutherland, 2006; Medlyn et al., 2011). This is part of the physiological control on ET, causing an increase in VPD to actually decrease ET (and, thus, EF; Rigden and Salvucci, 2017). Moreover, the sign of VPD–EF association could also change due to variations in confounding factors like ambient soil moisture and diffuse/direct radiation (Gu et al., 2006). More diffused radiation enhances plant productivity (Mercado et al., 2009; Rap et al., 2018) and plant growth (Wang et al., 2020), which, in turn, can increase LH and EF (Chakraborty et al., 2021; Davin and Seneviratne, 2012; Wang et al., 2008). However, this association is also reported to have an optimum point beyond which plant productivity declines, with an increasing diffused fraction of radiation (Knohl and Baldocchi, 2008).
Small particles suspended in the atmosphere, i.e., atmospheric aerosols, can alter the amount of shortwave and longwave radiation reaching the surface through scattering and absorption, thereby altering NR (Chakraborty et al., 2021; Schwartz, 1996; Trenberth et al., 2009). This is commonly known as the aerosol direct radiative effect (ADRE) and is dependent on aerosol size, composition, and vertical distribution in the atmosphere (Forster et al., 2007; Sarangi et al., 2016). Global- and regional-scale modeling studies have reported that the ADRE can greatly alter the surface fluxes and microclimate over land (Liu et al., 2014; Mallet et al., 2009; Myhre et al., 2018; Shen et al., 2022). Generally, the ADRE reduces NR, which results in the reduction in the magnitude of SH and LH. But, the loading of scattering aerosols can also increase the diffuse fraction of solar radiation at the surface, which affects the photosynthesis and LH or EF (Chameides et al., 1999; Matsui et al., 2008; Niyogi et al., 2004; O'Sullivan et al., 2016; Wang et al., 2008, 2020). This mechanism is generally referred to as the diffuse radiation-induced aerosol fertilization effect (ADFE). But, depending on the ecosystem, the positive association of ADFE on EF also becomes saturated as ADRE becomes larger than a threshold (Yue and Unger, 2017). Furthermore, Steiner et al. (2013) reported that warmer air temperatures are consistent with high aerosol optical depth (AOD) scenarios over various in situ micrometeorological sites in the USA, which can result in no clear association between AOD and LH. Thus, how aerosol loading modulates the already complex VPD–EF association can depend on the interplay between radiation, ADFE, aerosol amount and properties, background climate, and ecosystem phenology (Steiner and Chameides, 2005).
Northern India is a global hot spot for atmospheric aerosols, with AOD varying between 0.5 and 1.5 and high aerosol radiative efficiency values (∼100 W m−2/AOD) during the pre-monsoon period (Dey and Di Girolamo, 2011; Dimitris et al., 2012; R. Kumar et al., 2018; Sarangi et al., 2016; Srivastava et al., 2011). In addition, the region also experiences frequent high temperature days and heat wave conditions, generally extending for 2–6 d during this period (Ratnam et al., 2016; Rohini et al., 2016). During heat wave conditions, the regional atmosphere is largely stagnant (Ratnam et al., 2016), which can lead to greater air temperature by 5–10 K and magnifies the water vapor demand by 2–3 times at a weekly timescale. In addition to high air temperatures (Tair), high aerosol loading during heat waves has also been reported over northern India (Dave et al., 2020; Mondal et al., 2021) at this time of year. Moreover, the value of EF is typically greater than 0.5 over northern India during the pre-monsoon period, indicating a potentially larger control of VPD–LH linkages on surface energy partitioning (Bhat et al., 2020). Steep variability in the ambient values of VPD (also AOD in some events) during heat waves over northern India provides us with ideal conditions for investigating the associations between aerosol loading and VPD–EF coupling.
Previous studies have suggested that aerosol loading can modulate the partitioning of surface fluxes over northern India (Gupta et al., 2020; Latha et al., 2018; Murthy et al., 2014; Urankar et al., 2012). However, these studies have been based on reanalysis products (Urankar et al., 2012), are very limited measurements of SH only (Murthy et al., 2014), or are estimated measurements derived from remotely sensed data (Latha et al., 2018) and, therefore, lack the fidelity that can be obtained from direct observations of key processes. A better understanding of the aerosol–VPD–EF associations using direct collocated observations is essential to understand present-day conditions and potential feedbacks that can modify future climate over this region of great hydroclimatic significance. In this study, we have used co-located observations of surface energy balance, near-surface micrometeorological variables, and soil characteristics, together with aerosol properties (both surface and columnar), at a sub-tropical site in northern India during the pre-monsoon season. Analyses of case studies with AOD varying in phase or remaining constant with high VPD (under heat wave conditions) are done to understand the underlying processes. Here, we will present compelling evidence that changes in EF are directly (indirectly) proportional to aerosol loading (VPD). More interestingly, we found that aerosol loading can decouple the observed strong VPD–LH relationship under the heat wave scenario, which can have serious implications on climate resilience of crops and vegetation. Below, the sections are organized to discuss the data used and case studies selected, and the methodology, results, discussions, and summary of this study are also given.
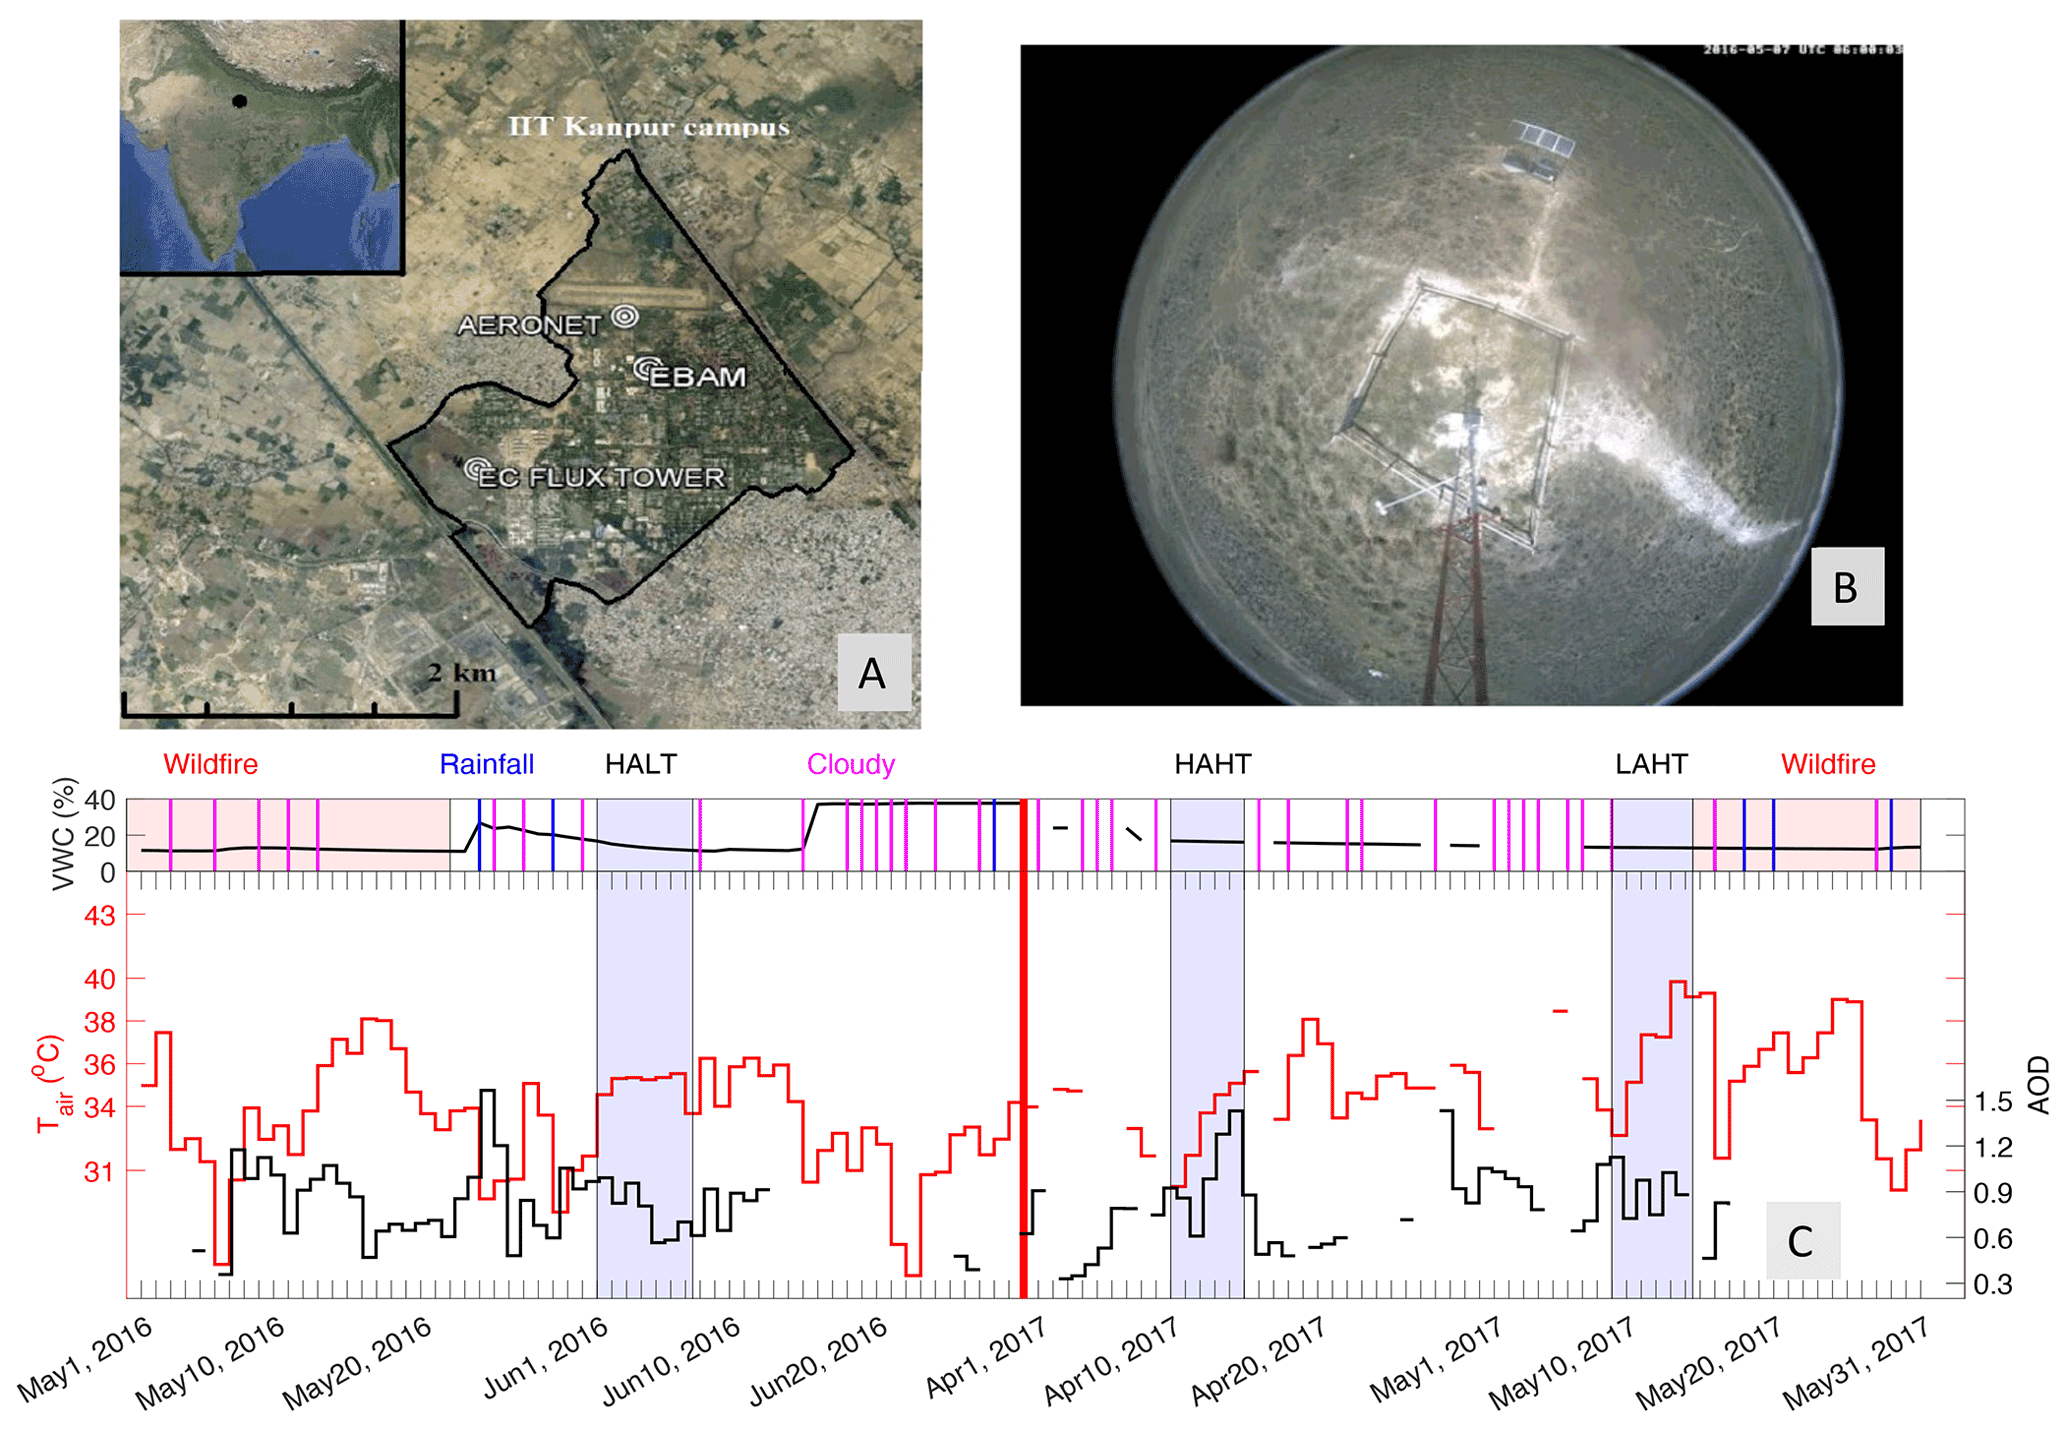
Figure 1(a) Map showing the locations of AERONET and the eddy covariance (EC) flux tower site within the campus of the Indian Institute of Technology Kanpur (IITK). The inset map shows the location of IITK (black dot) in the central Gangetic Plains. The maps are created by © Google Maps 2017. (b) Camera image of the and cover of the flux tower site during 12 May 2017. (c) The daily variation in soil moisture (VWC – volumetric water content) during our study period is shown as a black line in the upper box of the panel. The occurrences of cloudy days, rainy days, and the wildfire-affected period during April through June 2016 and 2017 is shown by magenta, blue, and pink color patches in the upper box. A cloudy day is inferred from NASA Micro-Pulse Lidar Network (MPLNET) images and AERONET observations (as defined in Sect. 2). The days bounded by straight lines depict the weekly episodes of high AOD–low Tair (HALT), high AOD–high Tair (HAHT), and low AOD–high Tair (LAHT), respectively. Daily variation in Tair and daily variation in AOD during our study period is shown as black and red lines in lower box of the panel.
Observations of SH, LH, and the net ecosystem CO2 exchange (NEE) were obtained over a semi-natural grassland site (Fig. 1a) within the campus of the Indian Institute of Technology, Kanpur (IITK; 26.5∘ N, 80.3∘ E; 132 m above mean sea level), during the pre-monsoon months (April–June) of 2016–2017. Energy flux data were collected by an eddy covariance system installed at 5.28 m above the soil surface. This flux measurement site is part of an eddy covariance network set up in India as part of the INCOMPASS project of the Indo-UK monsoon program (Bhat et al., 2020; Chakraborty et al., 2019; Turner et al., 2020). The eddy covariance system consists of a WindMaster sonic anemometer/thermometer (Gill Instruments Limited, Lymington, UK) and a LI7500 infrared gas analyzer (LI-COR Biosciences, Logan, Utah, USA). The fetch around the tower is a mixture of different C4 grasses, i.e., variants of Napier grass (∼60 %–70 %) and some common reed (scientific family – Pennisetum purpureum and Phragmites–Saccharum–Imperata). Napier grasses are invasive and a perennial species and representative of grasslands in the region (Chakraborty et al., 2019; Holm et al., 1979). More than 90 % of the fetch of the flux tower is covered by vegetation (Fig. 1b), and the canopy height varied within 1–1.5 m during our study periods. The soil is typical of the central Gangetic Plains, with silt, clay, and sand fractions of 80 %, 15 %, and 5 %, respectively (unpublished data). The site experiences a humid subtropical climate. The range in daily AOD and Tair was 0.4–1.4 and 32–45 ∘C, respectively, during the study period (Fig. 1c).
The net radiation (NR; W m−2) and its incoming and outgoing short- and longwave components were measured using an NR01 net radiometer (Hukesflux, Delft, the Netherlands) installed at 5 m above the surface. The surface temperature (Tsrf) was calculated from the measured outgoing longwave radiation following the Stefan–Boltzmann law, assuming an emissivity of 0.95 (Trenberth et al., 2009). Ground heat fluxes (GH; W m−2) were monitored at 0.03 m below the soil surface using two HFP01-SC self-calibrating soil heat flux plates (Hukesflux, Delft, the Netherlands). Near-surface air temperature (Tair; ∘C) and relative humidity (RH; percent) were measured at a height of 4.5 m. Wind speed and wind direction were measured at 10 m above the soil surface using a WindSonic anemometer (Gill Instruments Limited, Lymington, UK). Volumetric soil water content (VWC; cubic meters of water in cubic meters of soil) and surface temperature (Tsrf; ∘C) were measured using two pairs of digital TDT sensors (Acclima Inc., Meridian, Idaho, USA) installed at 0.05 and 0.15 m below the soil surface. Standard data processing and quality control routines were used to calculate surface fluxes, as described in Morrison et al. (2019). Data gap-filling and the partitioning of net ecosystem exchange into gross primary production (GPP) and total ecosystem respiration was performed using the REddyProc package (Reichstein et al., 2005; Jung et al., 2019). Negative net ecosystem exchange during the daytime period indicates that photosynthesis at our site dominates over soil and plant respiration (not shown). Since water and carbon cycles in the plants are closely coupled (Collatz et al., 1991), variations in GPP are used as a proxy for plant transpiration in this study. More details on the flux, weather, and radiation tower measurements at IIT Kanpur can be found in Table S1 and Chakraborty et al. (2019).
Instantaneous clear-sky half-hourly averages of aerosol optical depth (AOD) at 550 nm, single scattering albedo (SSA), and the ratio of scattering efficiency to total extinction efficiency at 440 nm, as obtained from the AErosol RObotic NETwork (AERONET) station deployed in the IITK campus (Fig. 1a), were used to quantify the aerosol optical properties during our study period. Low and high SSA values indicate the dominance of absorbing and scattering aerosols in the column, respectively. Clear-sky shortwave (0.25–4 µm) radiative transfer calculations, using the Santa Barbara discrete ordinates radiative transfer Atmospheric Radiative Transfer Model (SBDART; Ricchiazzi et al., 1998), are used to estimate the midday aerosol direct radiative forcing (ADRF) at the surface and diffuse radiation reaching the surface (diffusefrac). Midday mean AOD and SSA for each day are prescribed to the model. More details on radiative flux calculations using SBDART are mentioned in the Supplement. Finally, micro-pulse lidar backscatter images (level 1.5) measured at the collocated Micro-Pulse Lidar Network (MPLNET) site (Campbell et al., 2002; Welton and Campbell, 2002) are also used in this study, mainly to identify cloudy days. A day is termed as a cloudy day if cloud patches are observed in lidar profiles for more than 3 h. More details on the aerosol measurements can be found in the Supplement.
In order to examine the impact of aerosols or VPD on EF, we need to carefully identify periods where the variability in other confounding factors is negligible. As such, we identified 3 weeks (marked in Fig. 1c) for analysis, where daily variations in all these factors except, Tair/VPD and AOD, are negligible. Figure 1c illustrates the occurrences of cloudy days, rainfall, and wildfire-affected periods during pre-monsoon months of 2016 and 2017. We have avoided periods of cloud and rainfall occurrences, since that would affect the surface and energy budget much more than the ADFE. The daily mean VWC values are also shown for the period in Fig. 1c. However, as shown in Fig. 1c, it is rare to have a considerable time interval with only variations in AOD values (and negligible variations in Tair/VPD). Eventually, three 1-week periods are carefully selected with different combinations of dominant weekly gradients in Tair/VPD and AOD and are analyzed to gain insights into ambient AOD–VPD–EF association. The first week selected for analysis is between 2–9 June 2016, which had a high weekly gradient in AOD but was accompanied by low variations in Tair/VPD (hereafter referred to as the high AOD–low Tair (HALT) case). The second week is during 10–15 April 2017, which witnessed a large daily increase in aerosol loading and Tair in phase throughout the week (hereafter referred to as the high AOD–high Tair (HAHT) case). We also selected a third week, during 10–15–May 2017, when a high gradient in Tair was observed across the week, but a negligible weekly gradient in AOD was present, i.e., the AOD values had large day-to-day variability through the week (hereafter referred to as the low AOD–high Tair (LAHT) case). Interestingly, heat wave conditions were prevalent over northern India during the HAHT and LAHT weeks; therefore, a wide range of VPD–AOD–EF variation can be sampled. Moreover, since there were no rainfall events during these 3 weeks, the variation in VWC was minor compared to large daily variations in Tair and AOD during our study periods. Furthermore, the variations in the vegetation phenology, wind, and boundary layer height are found to be negligible within each of these 3 weeks. Note that no week with low AOD and low VPD variations was observed during our study period.
The simultaneous midday (10:00–15:00 LT) variability in AOD, VPD, EF, and the other components of the surface radiative balance is analyzed across the HALT and LAHT weeks to understand the impact of strong weekly gradients of AOD and VPD, respectively. Furthermore, we analyze the weekly gradients in the observations during HAHT and compare and contrast the same with the HALT and LAHT cases to understand the combined effects of AOD and VPD.
Moreover, to examine the impact of aerosol loading on VPD–EF associations under enhanced heat stress, we also calculated the daily midday bulk canopy resistances for both HAHT and LAHT cases by inverting the Penman–Monteith equation, as described below. We used observed values of available energy, VPD, Tsrf derived from observed LWout, psychrometric constant, and the slope of the vapor pressure curve derived from observed surface pressure and Tair, respectively, and aerodynamic resistance derived from the observed SH and near-surface temperature gradient.
The aerodynamic resistance to heat transfer (ra) is calculated from the near-surface temperature gradient and the sensible heat flux (SH) and given by the following:
where ρ is the air density, and Cp is the specific heat at constant pressure ( MJ kg−1 ∘C−1).
Then, the canopy resistance (rs) is calculated by inverting the Penman–Monteith approximation. Thus, in the following:
where NR is the net radiation and Δ is the slope of the water vapor saturation curve given by the following:
and γ is the psychrometric constant, calculated as follows:
where P is atmospheric pressure in kilopascal, λ is the latent heat of vaporization (2.45 MJ kg−1), and ε is the ratio of the molecular weight of water vapor to dry air (0.622).

Figure 2Distribution plots showing the variations in aerosol and radiation during the cases. Panels (a)–(c) illustrate the time series of the midday (11:00–14:00 LT) variation in AOD and SSA values during HALT, HAHT, and LAHT, respectively. The horizontal line within the box represents median of the distribution. The hollow circle within the violin distribution represents median of the distribution. Panels (d)–(f) are the same as panels (a)–(c) but show measurements of incoming shortwave radiation and net radiation at surface. Note that 5 Jun HALT means 5 June of the HALT case and so on.
During the HALT period, midday AOD values decreased monotonically across the week from ∼1.1 on 2 June 2016 to ∼0.6 on 9 June 2016 (Fig. 2a). The corresponding trend in SSA values was negligible, but SSA values are ∼0.92, indicating a predominance of scattering aerosols (Fig. 2a). Corresponding values of NR at the surface increased monotonically by ∼50 W m−2 during the same week (Fig. 2d). The enhancement in midday NR with decreasing AOD is strongly driven by the corresponding increase in midday incoming shortwave radiation (ISWR) by ∼100 W m−2 (Fig. 2d). ADRF values at the surface decreased by ∼80 W m−2, and the diffuse fraction of incoming radiation increased by ∼0.10 with decrease in scattering aerosols from 2 to 9 June 2016 (Fig. S1a and d). The daily trend in the modeled ADRF (and diffused fraction) values are consistent with the daily reduction trend of ISWR during HALT, reinforcing the expectation that the negative daily trend in ISWR and NR during HALT was primarily by aerosol-induced radiative changes.
During HAHT, the midday AOD values increased monotonically across the week from ∼0.3 on 10–11 April to ∼0.8 on 14–15 April (Fig. 2b). Corresponding values of NR and ISWR at the surface decreased monotonically by ∼ 100 and ∼200 W m−2, respectively, during the same period (Fig. 2e). Similar to HALT, no daily trend was present in SSA values during HAHT, and SSA values are ∼0.9, indicating the presence of scattering aerosols (Fig. 2b). ADRF values at the surface decreased across the week (Fig. S1b), with the highest values on high AOD days (14–15 April; ∼150 W m−2) compared to those on low AOD days (10–11 April; ∼50 W m−2). At the same time, the diffuse fraction of incoming radiation at the surface (Fig. S1e) increased substantially from ∼0.5 (on 10 April) to ∼0.7 (on 15 April) during HAHT, indicating the strong impact of aerosol loading.
In contrast, during the LAHT week, the gradient of AOD values from 10 and 15 May 2017 was relatively minor (Fig. 2c). As the increase in AOD through the week was smaller compared to other two cases, the corresponding decrease in NR and ISWR values at the surface was also smaller in magnitude (∼30 W m−2) during this period (Fig. 2f). Correspondingly, a negligible trend in ADRF (Fig. S1c) at the surface is observed, indicating the low variation in the aerosol radiative effect change during the LAHT week. Moreover, the midday SSA values during LAHT are lower (∼0.8) compared to HALT and HAHT cases, indicating the presence of highly absorbent aerosols in the column (Fig. 2c). Accordingly, the ADRF values at the surface during LAHT (Fig. S1c) were very high and more than double those of the same during HALT and HAHT (i.e., ∼350 W m−2). This can be explained by the fact that absorbing aerosols (lower SSA values) were relatively dominant during LAHT compared to the other two cases. Moreover, the dominance of absorbing aerosols also led to a minor variation in diffused radiation during the week (Fig. S1f). To sum up, the impact of aerosol variability (i.e., the gradient in direct radiative effect and diffused fraction modulation) is minor during the week compared to HAHT and HALT weeks.
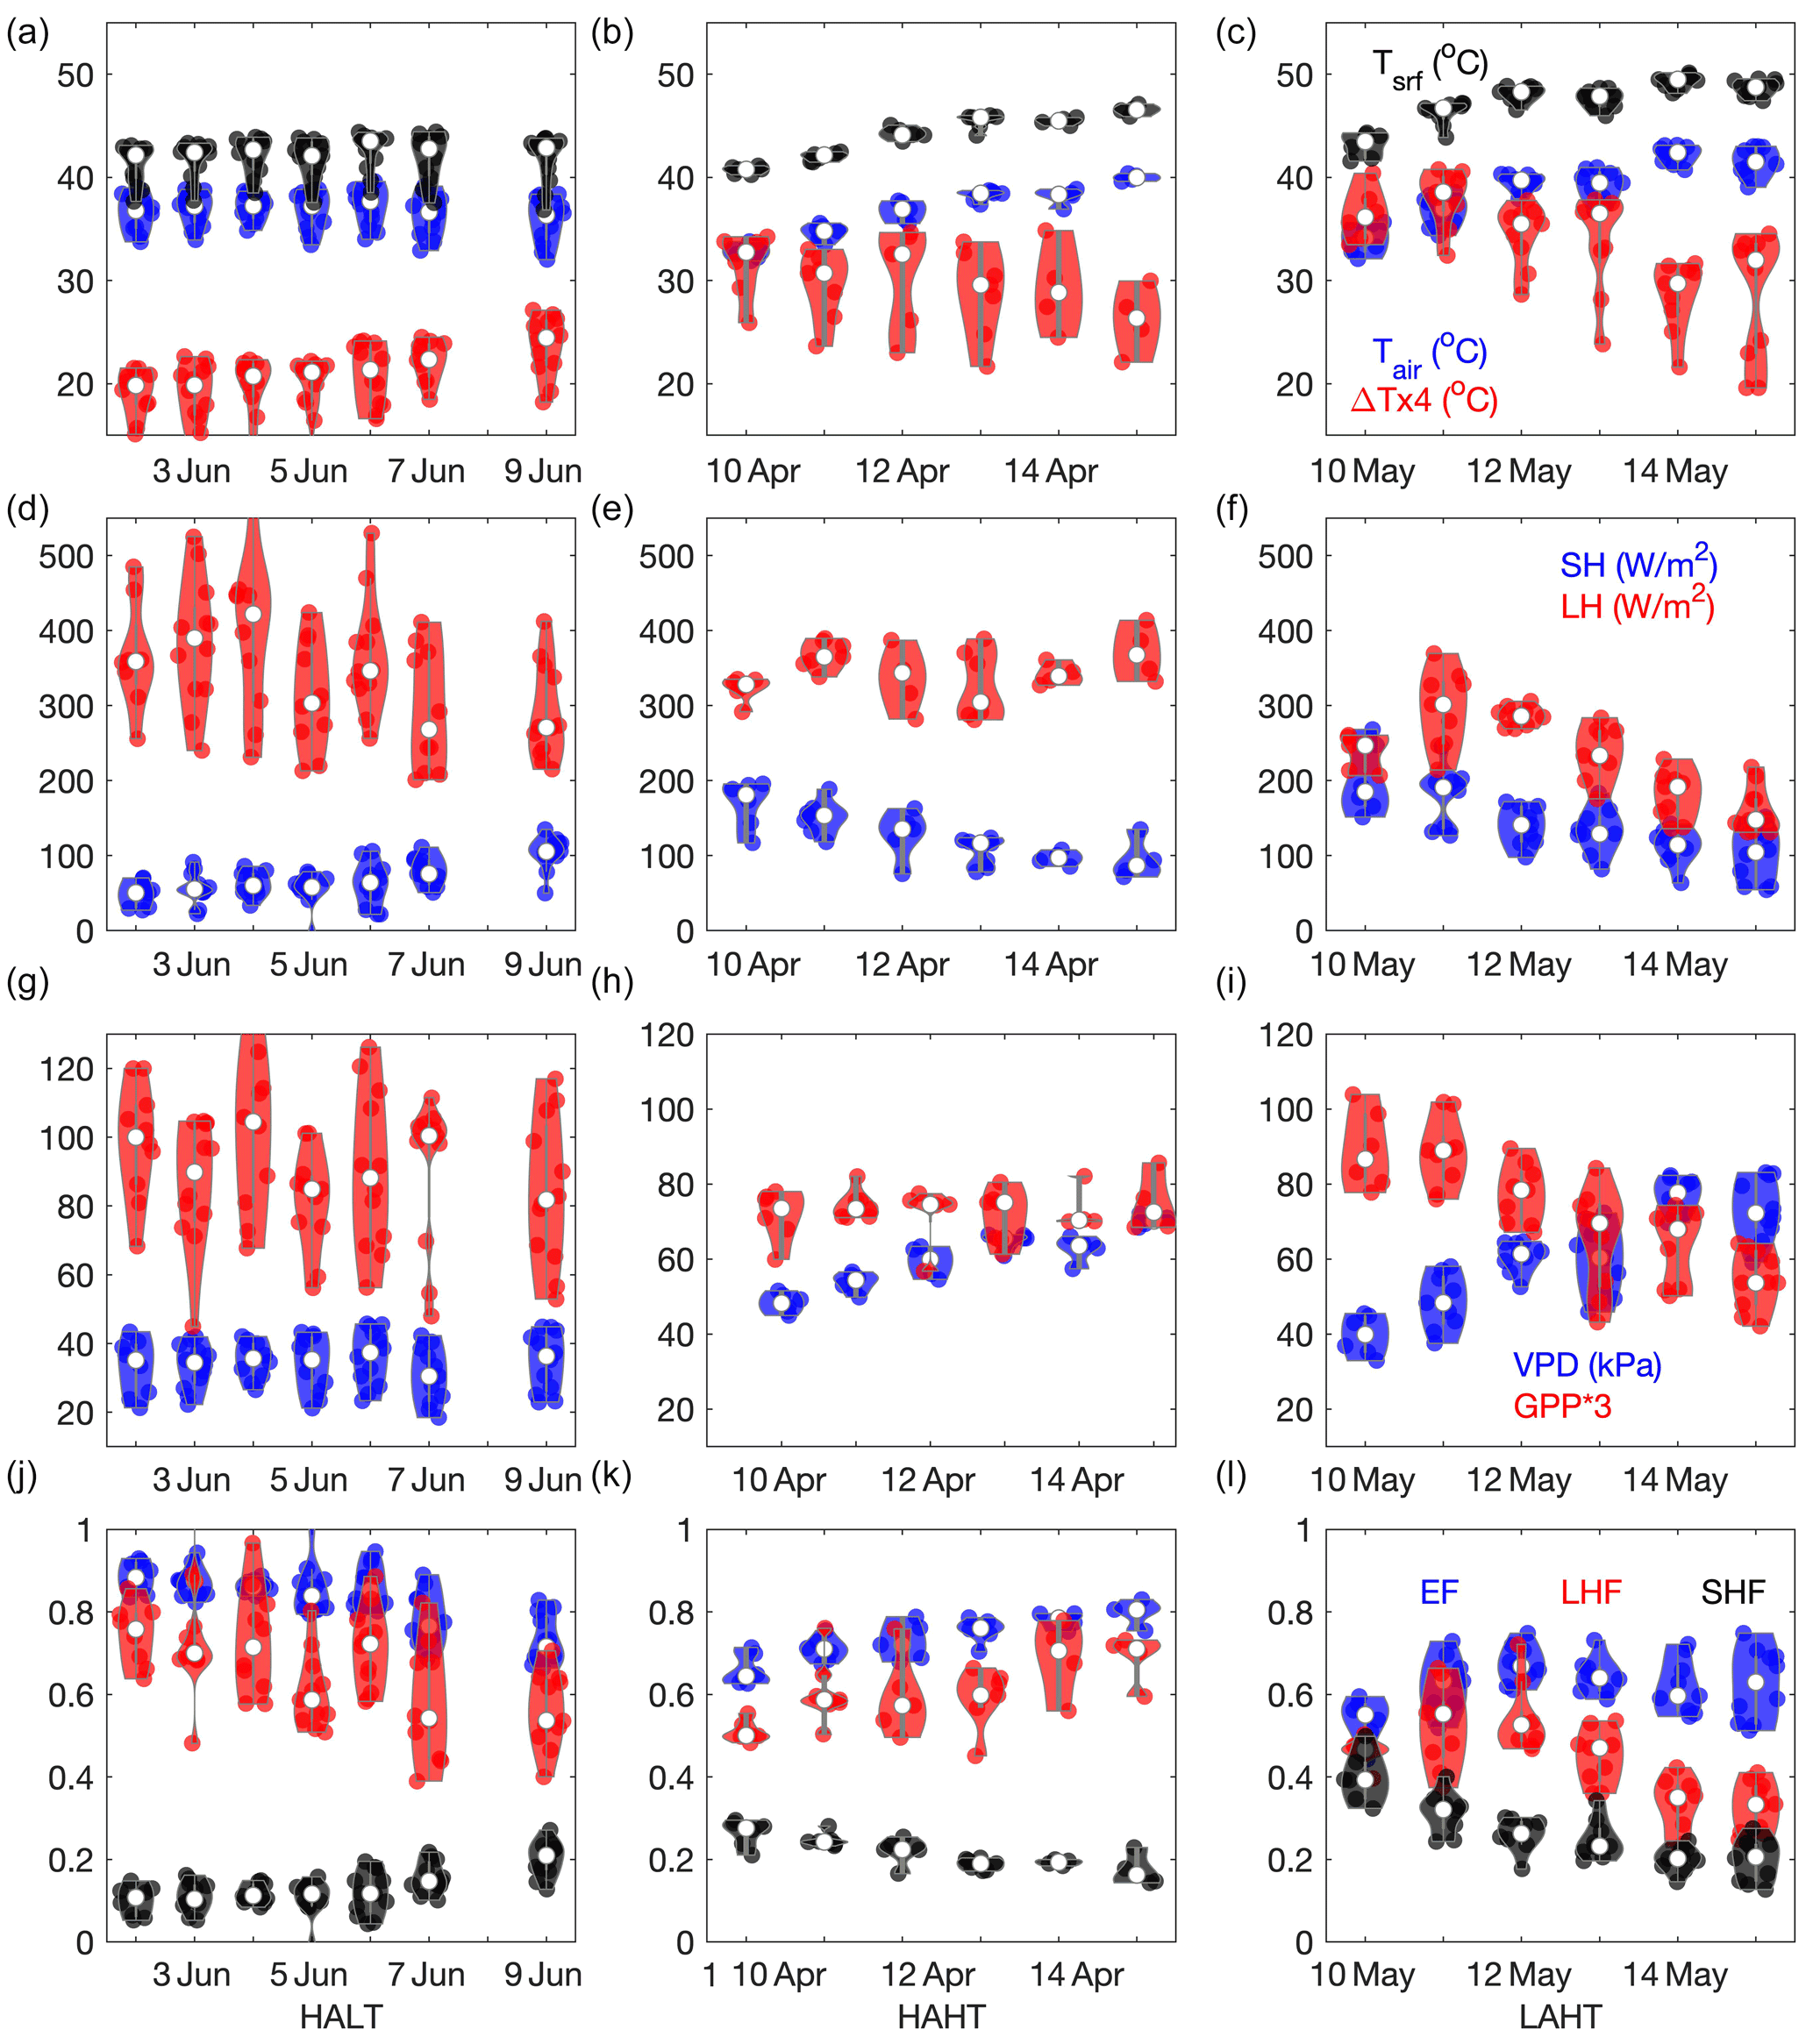
Figure 3Distribution plots showing the variations in near-surface meteorology and surface fluxes during the cases. Panels (a)–(c) illustrate the time series of the midday (11:00–14:00 LT) variation in Tsrf, Tair and (–)ΔT values during HALT, HAHT, and LAHT, respectively. Panels (d)–(f) are same as panels (a)–(c) but for SH and LH. Panels (g)–(i) are same but for VPD and GPP, and panels (j)–(l) are same but for EF, the latent heat fraction (LHF; red), and the sensible heat fraction (SHF).
As the aerosol direct radiative effect induces surface cooling, midday Tsrf values reduced from ∼35 ∘C during low AOD days to ∼30 ∘C during high AOD days across the HALT week (Fig. 3a). At the same time, the variability in Tair values remains more or less constant during HALT. Therefore, the midday variation in the temperature difference between Tsrf and Tair () is inversely proportional with the aerosol loading for HALT (Fig. 3a). The greater the value of ΔT, the greater the turbulent and convection flux and the greater the tendency of the SH flux release at the surface will be. Consequently, sensible heat fluxes are also inversely proportional to increases in AOD (and aerosol direct effect). With the increase (decrease) in ΔT (AOD) values, the corresponding SH values increased linearly from ∼60 W m−2 on 2 June to ∼120 W m−2 on 9 June 2016 during HALT week (Fig. 3d).
By contrast, a distinct and steep increase in midday Tair (∼10 ∘C) is seen during HAHT and LAHT weeks. Correspondingly, the midday Tsrf values are also seen to be increasing in close coupling with the Tair values during these 2 weeks (Fig. 3b and c). This coupling is mainly because of the coexisting stagnant scenario under heat wave periods. Nonetheless, the ΔT variation is inversely proportional to the AOD variation during both weeks (Fig. 3b and c). Because some portion of the enhancement in midday Tsrf is compensated by the aerosol-induced surface cooling, a steeper AOD trend across the week means a greater ΔT magnitude. For instance, as aerosol radiative effect is relatively smaller across the week during LAHT compared to that during HAHT, a relatively larger decrease in the daily ΔT (>2 ∘C) is observed during HAHT week (Fig. 3b). Consistently, the magnitude of SH also significantly decreased across the week in HAHT and LAHT. Specifically, the midday mean values of SH decreased linearly from ∼200 W m−2 on 10 April (low AOD) to ∼100 W m−2 on 15 April 2017 (high AOD) during HAHT (Fig. 3e). During LAHT, the midday mean SH decreased linearly from ∼200 W m−2 on 11 May to ∼125 W m−2 on 14–15 May 2017 (Fig. 3f).
The midday latent heat values decrease by ∼150 W m−2 from high AOD days to low AOD days during HALT week (Fig. 3d). In comparison, the increase in LH values with the increase in AOD across the HAHT week from 10 to 15 April 2017 is gradual, i.e., ∼25 W m−2 (Fig. 3e). Specifically, the slope of regression of the latent heat against AOD is 70 W m−2/AOD and 10 W m−2/AOD for HALT and HAHT cases, respectively (figure not shown). VPD values increase steeply in HAHT case (Fig. 3h) but no distinct variation in VPD across the week was evident for HALT case (Fig. 3g). An examination of the corresponding midday values of the gross primary production (GPP) flux (Fig. 3g and f) also illustrates gradients similar in sign to the corresponding latent heat fluxes, indicating that the daily variation in the LH flux in both the cases is mainly due to the associated variation in evapotranspiration. Keeping in mind that the magnitude of AOD variation in both of the above cases is similar, the differences in slopes of the LH–AOD regression (lower value during HAHT) could be attributed to the simultaneous suppression of evapotranspiration by the VPD rise during HAHT week.
The VPD-associated decline in GPP and, thus, LH fluxes is even more clearly observed during LAHT week. A strong negative trend in midday values of latent heat and GPP is observed as the week progresses from low to high VPD during LAHT (Fig. 3f and i). Quantitatively, the slope of regression of the (midday mean) latent heat against Tair is +4.1 W m−2 and −6.6 W m−2 ∘C−1 for HAHT and LAHT cases, respectively. Note that the magnitude of the VPD variation in both the cases is similar, so the differences in the slope of the latent heat and Tair regression can be attributed to the corresponding differences in aerosol loading. Thus, the magnitude of the latent heat or GPP is directly proportional to changes in the magnitude of AOD (as seen in HALT), but the same is inversely proportional to variations in Tair or VPD (as seen in LAHT), and the net effects can largely compensate each other (as seen in HAHT).
Moreover, the gradient in EF was substantial only in HAHT and HALT where there was substantial variation in AOD across the week. The partitioning of surface energy into latent heat or the latent heat fraction (LHF; latent heat net radiation) decreased and into the sensible heat fraction (SHF; Sensible heat Net Radiation) increased with an increase in AOD across the week during HALT (Fig. 3j). As a result, the midday EF distribution decreased, with a reduction in AOD from ∼0.8 on 2 June to ∼0.6 on 9 June during HALT (Fig. 3j). On the same line, with the increase in AOD across the week during HAHT, EF also increased from ∼0.63 on 10 April 2017 to ∼0.78 on 15 April 2017 (Fig. 3k) due to the simultaneous decrease and increase in SHF and LHF, respectively. But, in the absence of a clear aerosol gradient across the week, no substantial variation was observed in EF across the week during the LAHT case (Fig. 3l). The decrease in sensible heat with a VPD enhancement was similar in the HAHT and LAHT cases (Fig. 3k and l). But, the LH release increased (decreased) with VPD during the former (latter) case, indicating a role of the AOD change in the VPD–EF association.
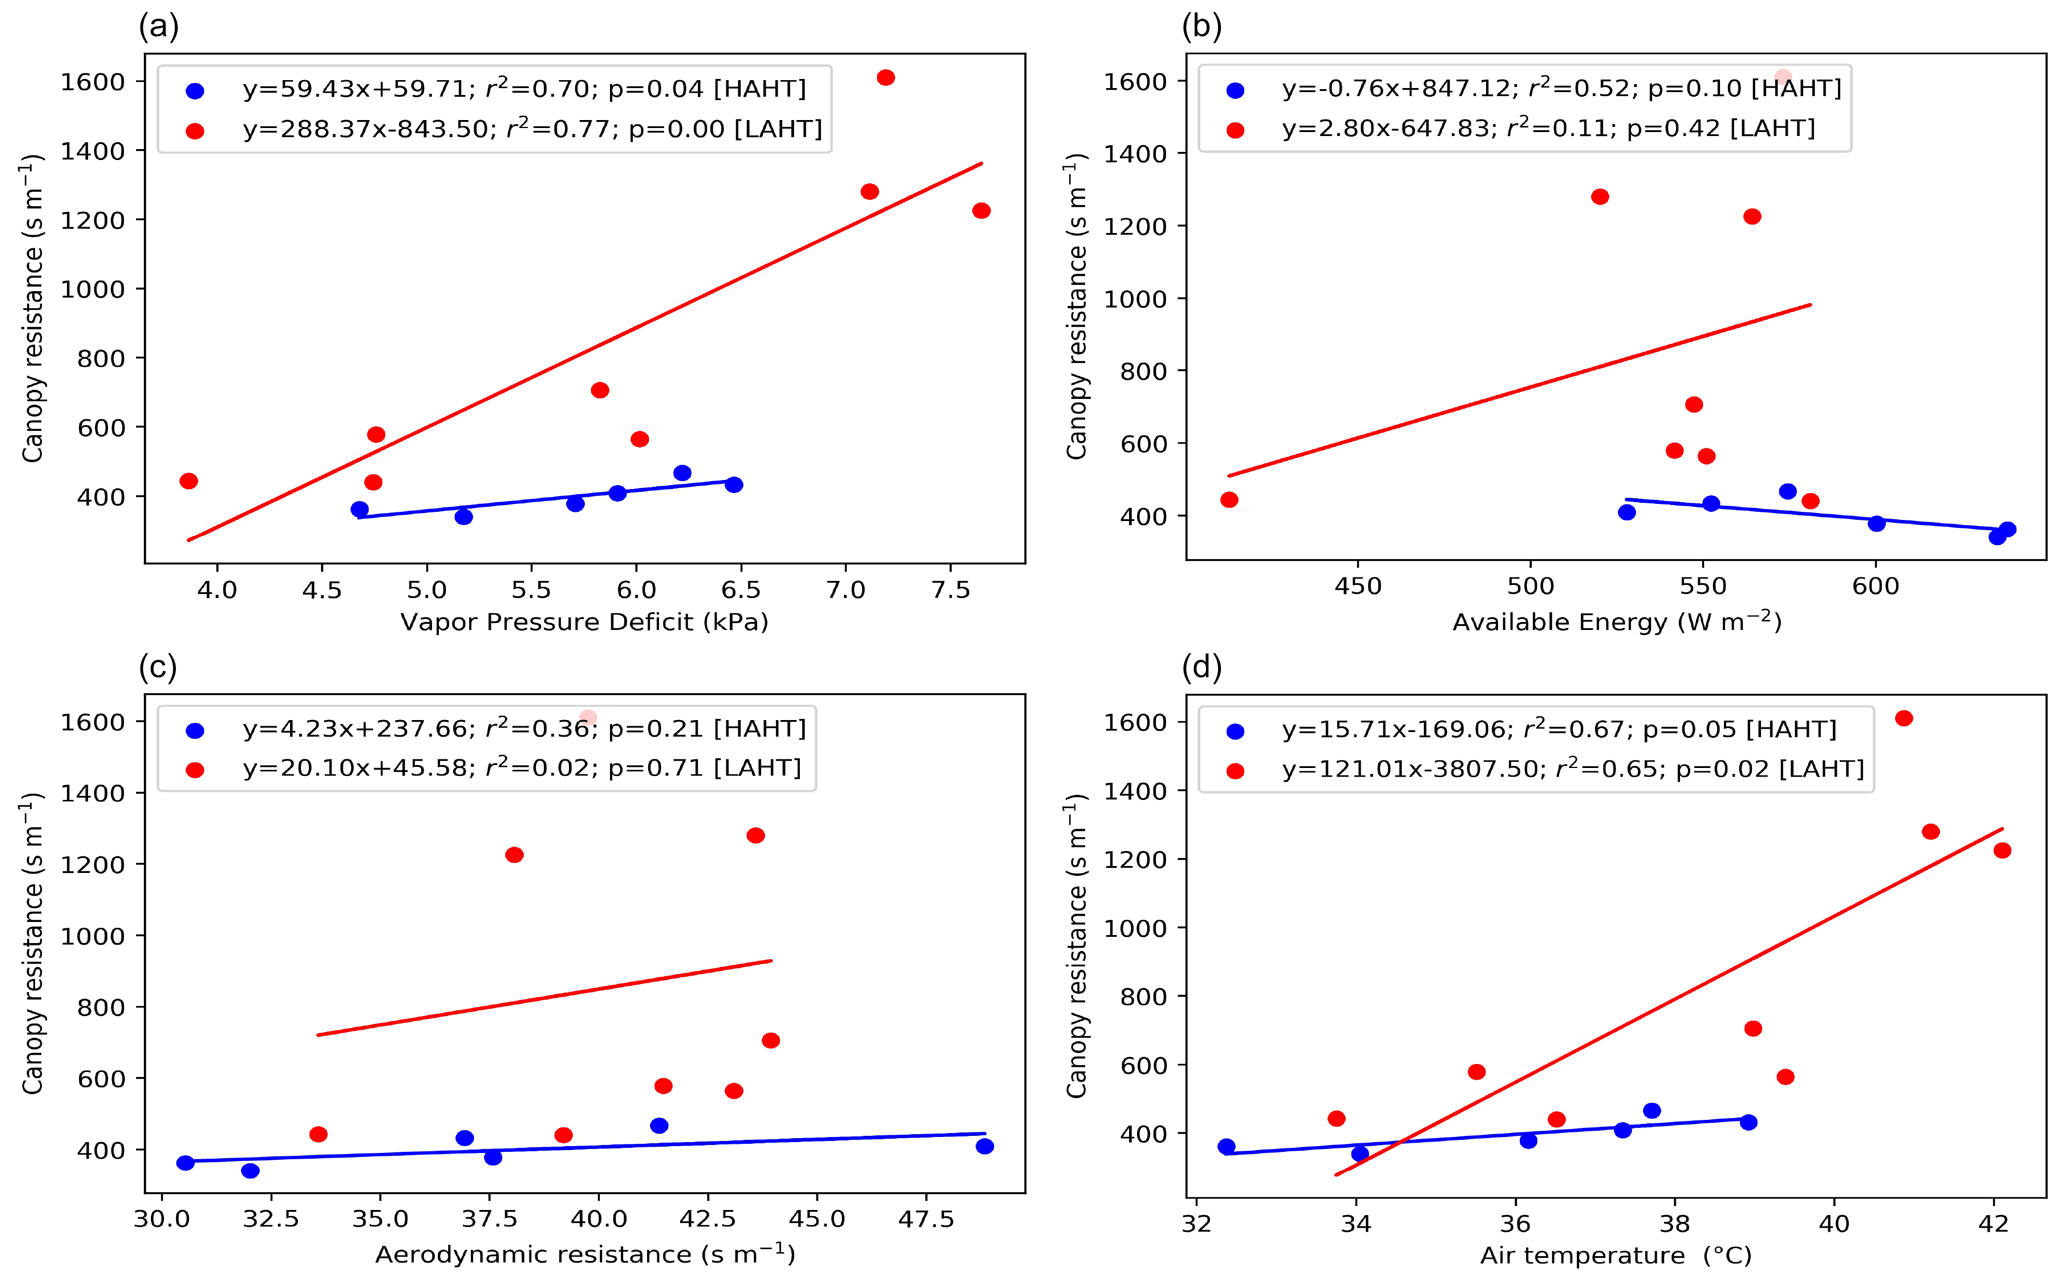
Figure 4Linear correlation between daily midday average canopy resistance derived from the Penman–Monteith equation with (a) observed vapor pressure deficit (VPD). (b) Available energy at the surface. (c) Aerodynamic resistance. (d) Air temperature for the HAHT and LAHT cases.
Figure 4 illustrates the variation in the midday mean canopy resistance during the LAHT and HAHT weeks to various physical and physiological factors that control evapotranspiration, i.e., moisture demand, available energy, air temperature, and the aerodynamic resistance. As expected, the canopy resistance is significantly (p<0.05) correlated with VPD, although clear differences in the slope are present for the two cases. Specifically, the canopy resistance increases steeply from 400 to 1400 s m−1, with an increase in VPD from 40 to 70 hPa during LAHT case (Fig. 4a). However, the canopy resistance only increases from 400 to 500, with an increase in VPD from 45 to 65 hPa during HAHT case (Fig. 4a). Similarly, air temperature during these periods also shows a statistically significant positive relationship with canopy resistance (Fig. 4d). However, during both periods, canopy resistance was found to be independent of the available energy (Fig. 4c) and the aerodynamic resistance (Fig. 4d), indicating that the sensitivity of the canopy resistance to changes in VPD (or Tair) is significantly greater than for the other variables.
The LAHT case illustrates the frequently reported behavior of the reduction in canopy conductance under increasing VPD due to partial stomata closure as a physiological stress response (Grossiord et al., 2020). Similar responses are also reported in Napier grasses, the native vegetation over our site (Mwendia et al., 2016). Napier grasses can be anisohydric, i.e., water spending under ample water availability (Cardoso et al., 2015). But their behavior becomes isohydric under high temperature and high water stress (Bhat et al., 2020; Liang et al., 2018; Mwendia et al., 2013). During both HAHT and LAHT weeks, soil moisture is very low; hence, the Napier grasses behave isohydrically under high VPD. The comparison of LAHT and HAHT scatter illustrates that canopy conductance is not strongly affected, even under severe VPD rise when aerosol loading also increases in phase. Specifically, the strong gradient of the increase in canopy resistance with VPD/air temperature becomes moderated under the high aerosol scenario. Thus, under the presence of high aerosol loading, the isohydric response of Napier grass to a temperature rise or physiological stress under high VPD is decoupled. This can partially explain the aerosol-induced increase in EF (and LH and GPP), even under a high VPD rise during HAHT.
Furthermore, meteorological co-variability or any significant differences in the weekly pattern of other micro-meteorological variables between HAHT and LAHT cases can also contribute to the corresponding differences in the AOD–VPD–EF association. A closer look illustrates that minor gradients are present in the meteorological variables (Fig. S2), which can have secondary effects on the VPD–EF associations. Nonetheless, the individual or relative contribution of the meteorological variability and aerosols on the observed coupling remains unknown and deserves further attention in future studies with in-depth mechanistic modeling.
The increase in scattering aerosols increased diffused radiation during HALT, thereby facilitating relatively more photosynthesis and, thus, more GPP and latent heat release with the increase in AOD. At the same time, increases in AOD also decreased the temperature difference between the surface and air and constrained the sensible heat release, eventually leading to an aerosol-mediated increase in EF during HALT. However, previous studies investigating the role of aerosols on surface energy fluxes over India have largely reported that aerosol loading is inversely related to latent heat (Gupta et al., 2020; Latha et al., 2018; Murthy et al., 2014). Possible explanations for this apparent contradiction are as follows. First, these studies did not explicitly account for the effect of daily meteorology/VPD/temperature variability in their analysis, which can have confounding effects (as shown here and discussed in Steiner et al., 2013). Second, these studies were not focused on grassland. Murthy et al. (2014) used micrometeorological site data with a forested footprint in Ranchi. At the same time, Latha et al. (2018) performed an analysis at 100 km spatial resolution from a reanalysis product/model, which is representative of a composite land use (including cities, forest, cropland, and grassland) and, thus, a mixture of evapotranspiration and ground evaporation. Gupta et al. (2020) used micrometeorological observations within a typical university canopy (buildings, roads, and trees) in Mumbai. Note that total LH can decrease due to aerosols, and EF can still increase if SH is decreasing more than EF due to the reduction in available energy. Nonetheless, our finding of direct proportionality between aerosol loading and latent heat (or photosynthesis) is consistent with previously reported in situ studies over grasslands sites in the USA (Gu et al., 2006; Niyogi et al., 2004; Wang et al., 2008).
In contrast, aerosol loading and heat wave conditions both suppressed the sensible heat release. Greater aerosol direct radiative effect induces more surface cooling (Chakraborty and Lee, 2019) and, hence, lower sensible heat fluxes (Steiner et al., 2013; Urankar et al., 2012; Yu et al., 2002), as seen in the HALT case. Simultaneously, sensible heat release is also directly proportional to the near-surface temperature gradient during the pre-monsoon period (Rao and Reddy, 2019), which is clearly seen in the LAHT case. In the HAHT case, both the effects work in phase to suppress the release of sensible heat. The reduction in sensible heat per unit change in Tair is 8 W m−2 ∘C−1 during LAHT compared to the same reduction of 11 W m−2 ∘C−1 in the HAHT case. At the same time, the reduction in sensible heat per unit change of AOD is 135 W m−2/AOD during LAHT compared to the same reduction of 65 W m−2/AOD in HALT case. Hence, the increase in AOD and Tair both suppresses the release of available surface energy via sensible heat, and the effect is largely additive. Moreover, the intensity of the AOD-induced sensible heat suppression will be stronger if the aerosols are composed of relatively more absorbing aerosols, specifically black carbon (Myhre et al., 2018). Because they not only cool the Tsrf (Campbell et al., 2002; Pandithurai et al., 2008; Shen et al., 2022) but can also warm Tair (especially under stagnant/heat wave conditions), thereby reducing the near-surface temperature gradient and inducing lower tropospheric stability (Dave et al., 2020; Myhre et al., 2018; Steiner et al., 2013).
However, contrary to our results, a recent modeling study over India reports that the enhancement of absorbing aerosols is positively associated with an increase in sensible heat and air temperature under the heat wave scenario (Mondal et al., 2021). The inherent model biases in the aerosol properties and concentration, as well as the absence of detailed canopy–atmosphere processes in the model simulations of Mondal et al. (2021), may cause differences in the signature of the AOD-sensible heat feedback. At the same time, the above differences can also be explained by taking into consideration the difference in the timescale of the feedback used in analysis. For example, a robust positive association between morning time black carbon concentrations and midday Tair is observed by Talukdar and Madineni (2020). Although they attributed this association primarily to the diurnal evolution of the residual layer mixing, the understanding from our study can also explain a possible pathway. High black carbon loading during morning time can suppress an instantaneous sensible heat release (via reduction in the near-surface temperature gradient), followed by the release of the additional sensible heat amount in the midday period under a relatively unstable atmosphere (and lower black carbon concentration due to dilution effect). As such, correlations between absorbing aerosols and sensible heat at the instantaneous scale can be negative (as seen in HAHT), but correlations or composite analysis at daily or monthly timescales may involve feedbacks which can result in positive associations (as also seen in Mondal et al., 2021).
In addition, our results clearly underline the complexity and nonlinearity among aerosol, VPD, and EF and provide observational evidence to the discussions reported in Steiner et al. (2013) and Steiner and Chameides (2005). Keeping all other factors relatively constant, the increase in scattering aerosols causes a positive AOD–EF association (as seen in HALT). In the case of HAHT, as both AOD and VPD increased in phase over the week, a VPD-induced reduction in evapotranspiration compensated for a major portion of the aerosol fertilization effect, resulting in a slight increase in latent heat with the increase in AOD. Also note that the combined effect of the increase in AOD and Tair caused a large suppression in sensible heat fluxes. Thus, EF also increases with AOD under heat wave conditions. However, in the absence of significant aerosol variation, the increase in VPD causes a large reduction in evapotranspiration (as seen in LAHT). First, there is a negligible aerosol fertilization effect, and second, there is an increase in canopy resistance (via stomatal aperture reduction) under a steep rise in VPD values, which caused large reduction in latent heat across the week during LAHT. High VPD is also linked with greater Tair during heat wave scenarios, thereby inducing a reduction in the near-surface temperature gradient and sensible heat during LAHT. Thus, both sensible heat and latent heat release decreased with VPD, causing a negligible change in EF with VPD. Thus, the VPD–EF coupling is very strong in the absence of aerosol loading but weakens under aerosol loading. Along with the aerosol fertilization effect, the direct deposition of aerosols as a wax layer on the leaf surface can also contribute to such an effect (Burkhardt, 2010; Burkhardt and Grantz, 2016). Recently, Grantz et al. (2018) used direct observations in glasshouses to illustrate the decoupling of stomata conductance (flux based) from its porosity (higher VPD induces reduction in pore size) under a scenario with more aerosol. India's mean temperature is constantly rising (Krishnan et al., 2020). At the same time, the global mean VPD is increasing with global warming (Yuan et al., 2022), and heat waves will be more frequent in the future in India (Mukherjee and Mishra, 2018). Moreover, anthropogenic emissions over the Indian subcontinent will ensure high AOD values in the near future (M. Kumar et al., 2018), thus manifesting a HAHT-like scenario at longer timescales over India. Although the response of plants and crops to the enhancement in VPD in a warmer future is uncertain, the aerosol-induced weakening of VPD–EF associations can contribute towards the tendency of crops and vegetation to become less drought/heat resilient in the future.
In summary, simultaneous observations from AERONET and an eddy covariance flux tower equipped with micrometeorological and soil physics sensors were employed to report possible the influence of aerosol loading on VPD–EF associations over a natural C4 grassland site under clear-sky conditions in the central Gangetic Plains. The main findings from this study are as follows:
-
An increase in aerosol loading reduces the incoming solar radiation at the surface and reduces the gradient between surface temperature and near-surface air temperature. This is associated with the decrease in energy dissipation from the surface via sensible heat. At the same time, an increase in aerosol loading increases the evapotranspiration efficiency of ecosystem by increasing the diffuse radiation. Thus, high aerosol loading favors the dissipation of the available surface energy via a latent heat flux and, therefore, increases the evaporative fraction.
-
An increase in surface temperature and VPD during heat wave conditions induces larger canopy resistance and stomata closure, thereby reducing the LH fluxes and EF. Native plants tend to store more water by transpiring less in high temperature conditions; so, the GPP (and thus LH) reduces under high temperatures. At the same time, higher air temperature also reduces the sensible heat partitioning via the reduction in the near-surface temperature gradient. Thus, as the effect of VPD involves reducing both the surface fluxes, the net effect on EF is negligible.
-
The variability in aerosol loading tends to play a significant role in modulating the VPD–EF association under varying VPD/surface temperature. When the changes in VPD and scattering aerosols are in phase, like in the case of stagnant heat wave conditions over northern India, the VPD-induced reduction in evapotranspiration may be completely compensated. This physiological changes can be due to the aerosol fertilization effect or thick aerosol deposition/coating on leaves. Besides, as both increasing AOD and Tair induces suppression in sensible heat partitioning, the changes in net EF remain largely in phase with changes in AOD and VPD.
Nonetheless, a few caveats of this study need to be kept in mind. Our analysis, although driven by the fundamental understanding of land–atmosphere interactions, is statistical in nature with a relatively small sample size. The cases we analyze here are carefully selected to represent the distinct scenarios, as far as realistically possible, in this region. Thus, minor influences of meteorological co-variability cannot be totally avoided. As such, the quantitative estimation of various associations may have inherent uncertainties, and care should be taken before generalizing. Moreover, as the literature on plant physiological responses specific to grass variants found in the Indo–Gangetic basin region are scarce, this study warrants more species-level studies to isolate the physiological and environmental responses to EF. Nevertheless, the possible AOD–VPD–EF associations discussed here can have substantial implications for the future climate of this region and similar subtropical regions. Thus, the observational associations provided in this study not only encourage more measurements, detailed in situ experiments, and mechanistic modeling of the aerosol–vegetation–atmosphere interactions but also warrants proper representations of aerosol processes and feedbacks in coupled models over India.
| LH | Latent heat flux |
| SH | Sensible heat flux |
| GH | Ground heat flux |
| EF | Evaporative fraction |
| Tair | 2 m air temperature |
| VPD | Vapor pressure deficit |
| GPP | Gross primary production |
| NR | Net radiation |
| ADRE | Aerosol direct radiative effect |
| ADFE | Aerosol diffuse radiation fertilization effect |
| diffusefrac | Diffuse radiation |
| SBDART | Santa Barbara discrete ordinates radiative transfer Atmospheric Radiative Transfer Model |
| AERONET | AErosol RObotic NETwork |
| VWC | Volumetric soil water content |
| Tsrf | Surface temperature |
| RH | Relative humidity |
| AOD | Aerosol optical depth |
| SSA | Single scattering albedo |
| HALT | High AOD–low Tair |
| HAHT | High AOD–high Tair |
| LAHT | Low AOD–high Tair |
| LWout | Outgoing longwave radiation at surface |
| rs | Canopy resistance |
| ra | Aerodynamic resistance to heat transfer |
| SHF | Sensible heat fraction |
| LHF | Latent heat fraction |
The surface data used here are available at https://doi.org/10.5285/78c64025-1f8d-431c-bdeb-e69a5877d2ed (Morrison et al., 2019). The aerosol data can available online from AERONET website https://aeronet.gsfc.nasa.gov last access: December 2018.
The supplement related to this article is available online at: https://doi.org/10.5194/acp-22-3615-2022-supplement.
CS and ST conceived the paper. CS did the formal analysis and wrote the first draft. TC did the simulations and analysis for Fig. 4. RM did the prepossessing of the flux tower data. MK and ST carried out the measurements and maintenance of the data at the IITK site. LMM helped in the interpretation of results. All co-authors provided feedback for improvement during the preparation and revision of the paper.
The contact author has declared that neither they nor their co-authors have any competing interests.
Publisher's note: Copernicus Publications remains neutral with regard to jurisdictional claims in published maps and institutional affiliations.
Sachchidanand Tripathi gratefully acknowledges the financial support given by the Earth System Science Organization, Ministry of Earth Sciences, Government of India (grant no. MM/NERC-MoES-03/2014/002), and the Newton Fund, to conduct this research under the Monsoon Mission. Chandan Sarangi acknowledges support from MHRD, India (grant no. SB20210835CEMHRD00850). Lina M. Mercado was supported by the UK Natural Environment Research Council through The UK Earth System Modeling Project (UKESM; grant no: NE/N017951/1). Chandan Sarangi also acknowledges relevant discussions with Ganapati Shankar Bhat and Dev Niyogi. The authors would like to thank Ellsworth J. Welton, Brent N. Holben, and the staff at NASA GSFC, for establishing, and the quality control of, the AERONET and MPLNET site at IIT Kanpur, which has been used in this study.
This research has been supported by the Earth System Science Organization, Ministry of Earth Sciences, Government of India (grant no. MM/NERC-MoES-03/2014/002), and Ministry of Human Resource and Development (MHRD)'s support to Laboratory of Atmospheric and Climate Sciences, IIT Madras via Institute of Eminence project (grant no. SB20210835CEMHRD00850).
This paper was edited by Rupert Holzinger and reviewed by two anonymous referees.
Baldocchi, D.: Measuring and Modelling Carbon dioxide and Water Vapour Exchange over a Temperate Broad-leaved Forest during the 1995 Summer Drought, Plant. Cell Environ., 20, 1108–1122, https://doi.org/10.1046/j.1365-3040.1997.d01-147.x, 1997.
Bhat, G. S., Morrison, R., Taylor, C. M., Bhattacharya, B. K., Paleri, S., Desai, D., Evans, J. G., Pattnaik, S., Sekhar, M., Nigam, R., Sattar, A., Angadi, S. S., Kacha, D., Patidar, A., Tripathi, S. N., Krishnan, K. V. M., and Sisodiya, A.: Spatial and temporal variability in energy and water vapour fluxes observed at seven sites on the Indian subcontinent during 2017, Q. J. Roy. Meteor. Soc., 146, 2853–2866, https://doi.org/10.1002/qj.3688, 2020.
Burkhardt, J.: Hygroscopic particles on leaves: nutrients or desiccants?, Ecol. Monogr., 80, 369–399, 2010.
Burkhardt, J. and Grantz, D.: Plants and Atmospheric Aerosols, Prog. Botany, 78, 369–406, 2016.
Campbell, J. R., Hlavka, D. L., Welton, E. J., Flynn, C. J., Turner, D. D., Spinhirne, J. D., Scott, V. S., and Hwang, I. H.: Full-Time, Eye-Safe Cloud and Aerosol Lidar Observation at Atmospheric Radiation Measurement Program Sites: Instruments and Data Processing, J. Atmos. Ocean. Technol., 19, 431–442, https://doi.org/10.1175/1520-0426(2002)019<0431:FTESCA>2.0.CO;2, 2002.
Cardoso, J. A., Pineda, M., Jiménez de la C., J., Vergara, M. F., and Rao, I. M.: Contrasting strategies to cope with drought conditions by two tropical forage C4 grasses, AoB Plants, 7, plv107, https://doi.org/10.1093/aobpla/plv107, 2015.
Chakraborty, T. and Lee, X.: Land Cover Regulates the Spatial Variability of Temperature Response to the Direct Radiative Effect of Aerosols, Geophys. Res. Lett., 46, 8995–9003, https://doi.org/10.1029/2019GL083812, 2019.
Chakraborty, T., Sarangi, C., Krishnan K V, M., Tripathi, S., Morrison, R., and Evans, J.: Biases in Model-Simulated Surface Energy Fluxes During the Indian Monsoon Onset Period, Bound.-Lay. Meteorol., 170, 323–348, https://doi.org/10.1007/s10546-018-0395-x, 2019.
Chakraborty, T., Lee, X., and Lawrence, D. M.: Strong Local Evaporative Cooling Over Land Due to Atmospheric Aerosols, J. Adv. Model. Earth Sy., 13, e2021MS002491, https://doi.org/10.1029/2021MS002491, 2021.
Chameides, W. L., Yu, H., Liu, S. C., Bergin, M., Zhou, X., Mearns, L., Wang, G., Kiang, C. S., Saylor, R. D., Luo, C., Huang, Y., Steiner, A., and Giorgi, F.: Case study of the effects of atmospheric aerosols and regional haze on agriculture: An opportunity to enhance crop yields in China through emission controls?, P. Natl. Acad. Sci. USA, 96, 13626–13633, 1999.
Collatz, G. J., Ball, J. T., Grivet, C., and Berry, J. A.: Physiological and environmental regulation of stomatal conductance, photosynthesis and transpiration: a model that includes a laminar boundary layer, Agric. For. Meteorol., 54, 107–136, https://doi.org/10.1016/0168-1923(91)90002-8, 1991.
Damour, G., Simonneau, T., Cochard, H., and Urban, L.: An overview of models of stomatal conductance at the leaf level, Plant Cell Environ., 33, 1419–1438, https://doi.org/10.1111/j.1365-3040.2010.02181.x, 2010.
Dave, P., Bhushan, M., and Venkataraman, C.: Absorbing aerosol influence on temperature maxima: An observation based study over India, Atmos. Environ., 223, 117237, https://doi.org/10.1016/j.atmosenv.2019.117237, 2020.
Davin, E. L. and Seneviratne, S. I.: Role of land surface processes and diffuse/direct radiation partitioning in simulating the European climate, Biogeosciences, 9, 1695–1707, https://doi.org/10.5194/bg-9-1695-2012, 2012.
Dey, S. and Di Girolamo, L.: A decade of change in aerosol properties over the Indian subcontinent, Geophys. Res. Lett., 38, 14, https://doi.org/10.1029/2011GL048153, 2011.
Dimitris, G. K., Singh, R. P., Gautam, R., Sharma, M., Kosmopoulos, P. G., and Tripathi, S. N.: Variability and trends of aerosol properties over Kanpur, northern India using AERONET data (2001–10), Environ. Res. Lett., 7, 24003, https://doi.org/10.1088/1748-9326/7/2/024003, 2012.
Forster, P., Ramaswamy, V., Artaxo, P., Berntsen, T., Betts, R., Fahey, D. W., Haywood, J., Lean, J., Lowe, D. C., Myhre, G., Nganga, J., Prinn, R., Raga, G., Schulz, M., and Van Dorald, R.: Changes in atmospheric constituents and in radiative forcing, in: Climate Change, The Physical Science Basis. Contribution of Working Group I to the Fourth Assessment Report of the Intergovernmental Panel on Climate Change, edited by: Solomon, S., Qin, D., Manning, M., Chen, Z., Marquis, M., Averyt, K. B., Tignor, M., and Miller, H. L., Cambridge University Press, Cambridge, UK and NewYork, USA, 2007.
Grantz, D. A., Zinsmeister, D., and Burkhardt, J.: Ambient aerosol increases minimum leaf conductance and alters the aperture–flux relationship as stomata respond to vapor pressure deficit (VPD), New Phytol., 219, 275–286, https://doi.org/10.1111/nph.15102, 2018.
Grossiord, C., Buckley, T., Cernusak, L., Novick, K., Poulter, B., Siegwolf, R., Sperry, J., and McDowell, N.: Plant responses to rising vapor pressure deficit, New Phytol., 226, 1550-1566, https://doi.org/10.1111/nph.16485, 2020.
Gu, L., Meyers, T., Pallardy, S. G., Hanson, P. J., Yang, B., Heuer, M., Hosman, K. P., Riggs, J. S., Sluss, D., and Wullschleger, S. D.: Direct and indirect effects of atmospheric conditions and soil moisture on surface energy partitioning revealed by a prolonged drought at a temperate forest site, J. Geophys. Res.-Atmos., 111, D16, https://doi.org/10.1029/2006JD007161, 2006.
Gupta, M., Chauhan, T., Murtugudde, R., and Ghosh, S.: Pollutants control the process networks of urban environmental-meteorology, Environ. Res. Lett., 16, D16, https://doi.org/10.1088/1748-9326/abce28, 2020.
Holm, L., Pancho, J., Herberger, J., and Plunkett, D. L.: A Geographic Atlas of World Weeds, John Wiley Sons Inc, xlix + 39 pp., 1979.
Jones, H. and Sutherland, R.: Stomatal control of xylem embolism, Plant. Cell Environ., 14, 607–612, https://doi.org/10.1111/j.1365-3040.1991.tb01532.x, 2006.
Jung, M., Koirala, S., Weber, U., Ichii, K., Gans, F., Camps-Valls, G.,Papale, D., Schwalm, C., Tramontana, G., and Reichstein, M.: The FLUXCOM ensemble of global land-atmosphere energy fluxes, Sci. Data, 6, 74, https://doi.org/10.1038/s41597-019-0076-8, 2019.
Knohl, A. and Baldocchi, D.: Effects of diffuse radiation on canopy gas exchange processes in a forest ecosystem, J. Geophys. Res.-Biogeo., 113, G02023, https://doi.org/10.1029/2007JG000663, 2008.
Krishnan, R., Sanjay, J., Gnanaseelan, C., Mujumdar, M., Kulkarni, A., and Chakraboty, S.: Assessment of climate change over the Indian region: a report of the Ministry of Earth Sciences (MoES), Governament of India, Springer, Nature, 226 pp., 2020.
Kumar, M., Parmar, K. S., Kumar, D. B., Mhawish, A., Broday, D. M., Mall, R. K., and Banerjee, T.: Long-term aerosol climatology over Indo-Gangetic Plain: Trend, prediction and potential source fields, Atmos. Environ., 180, 37–50, https://doi.org/10.1016/j.atmosenv.2018.02.027, 2018.
Kumar, R., Barth, M. C., Pfister, G. G., Delle Monache, L., Lamarque, J. F., Archer-Nicholls, S., Tilmes, S., Ghude, S. D., Wiedinmyer, C., Naja, M., and Walters, S.: How Will Air Quality Change in South Asia by 2050?, J. Geophys. Res.-Atmos., 123, 1840–1864, https://doi.org/10.1002/2017JD027357, 2018.
Latha, R., Murthy, B., and Bhanage, V.: Aerosol-induced perturbation of surface fluxes over different landscapes in a tropical region, Int. J. Remote Sens., 40, 1–19, https://doi.org/10.1080/01431161.2018.1523586, 2018.
Liang, X., Erickson, J., Sollenberger, L., Rowland, D., Silveira, M., and Vermerris, W.: Growth and Transpiration Responses of Elephantgrass and Energycane to Soil Drying, Crop Sci., 58, 354–363, https://doi.org/10.2135/cropsci2017.01.0019, 2018.
Liu, S., Chen, M., and Zhuang, Q.: Aerosol effects on global land surface energy fluxes during 2003–2010, Geophys. Res. Lett., 41, 7875–7881, https://doi.org/10.1002/2014GL061640, 2014.
Mallet, M., Tulet, P., Serça, D., Solmon, F., Dubovik, O., Pelon, J., Pont, V., and Thouron, O.: Impact of dust aerosols on the radiative budget, surface heat fluxes, heating rate profiles and convective activity over West Africa during March 2006, Atmos. Chem. Phys., 9, 7143–7160, https://doi.org/10.5194/acp-9-7143-2009, 2009.
Matsui, T., Beltrán-Przekurat, A., Niyogi, D., Pielke Sr., R. A., and Coughenour, M.: Aerosol light scattering effect on terrestrial plant productivity and energy fluxes over the eastern United States, J. Geophys. Res.-Atmos., 113, D14, https://doi.org/10.1029/2007JD009658, 2008.
Medlyn, B. E., Duursma, R. A., Eamus, D., Ellsworth, D. S., Prentice, I. C., Barton, C. V. M., Crous, K. Y., de Angelis, P., Freeman, M., and Wingate, L.: Reconciling the optimal and empirical approaches to modelling stomatal conductance, Glob. Change Biol., 17, 2134–2144, https://doi.org/10.1111/j.1365-2486.2010.02375.x, 2011.
Mercado, L. M., Bellouin, N., Sitch, S., Boucher, O., Huntingford, C., Wild, M., and Cox, P. M.: Impact of changes in diffuse radiation on the global land carbon sink, Nature, 458, 1014–1017, https://doi.org/10.1038/nature07949, 2009.
Mondal, A., Sah, N., Sharma, A., Venkataraman, C., and Patil, N.: Absorbing aerosols and high-temperature extremes in India: A general circulation modelling study, Int. J. Climatol., 41, E1498–E1517, https://doi.org/10.1002/joc.6783, 2021.
Monteith, J.: Evaporation and environment. Symposia of the Society for Experimental Biology., Symp. Soc. Exp. Biol., 19, 205–234, 1965.
Morrison, R., Angadi, S. S., Cooper, H. M., Evans, J. G., Rees, G., Sekhar, M., Taylor, C., Tripathi, S. N., and Turner, A. G.: Energy and carbon dioxide fluxes, meteorology and soil physics observed at INCOMPASS land surface stations in India, 2016 to 2017, NERC Environmental Information Data Centre [data set], https://doi.org/10.5285/78c64025-1f8d-431c-bdeb-e69a5877d2ed, 2019.
Mukherjee, S. and Mishra, V.: A sixfold rise in concurrent day and night-time heatwaves in India under 2 ∘C warming, Sci. Rep.-UK, 8, 1–10, https://doi.org/10.1038/s41598-018-35348-w, 2018.
Murthy, B. S., Latha, R., Kumar, M., and Mahanti, N. C.: Effect of aerosols on evapo-transpiration, Atmos. Environ., 89, 109–118, https://doi.org/10.1016/j.atmosenv.2014.02.029, 2014.
Mwendia, S. W., Yunusa, I., Whalley, R. D. B., Sindel, B., Kenney, D., and Kariuki, I. W.: Use of plant water relations to assess forage quality and growth of two cultivars of Napier Grass (Pennisetum purpureum) subjected to different levels of soil water supply and temperature regimes, Crop Pasture Sci., 64, 1008–1019, https://doi.org/10.1071/CP13254, 2013.
Mwendia, S. W., Yunusa, I., Sindel, B., Whalley, R. D. B., and Kariuki, I.: Assessment of Napier grass accessions in lowland and highland tropical environments of East Africa: Water stress indices, water use and water use efficiency, J. Sci. Food Agric., 97, 1953–1961, https://doi.org/10.1002/jsfa.8004, 2016.
Myhre, G., Samset, B. H., Hodnebrog, Ø., Andrews, T., Boucher, O., Faluvegi, G., Fläschner, D., Forster, P. M., Kasoar, M., Kharin, V., Kirkevåg, A., Lamarque, J.-F., Olivié, D., Richardson, T. B., Shawki, D., Shindell, D., Shine, K. P., Stjern, C. W., Takemura, T., and Voulgarakis, A.: Sensible heat has significantly affected the global hydrological cycle over the historical period, Nat. Commun., 9, 1922, https://doi.org/10.1038/s41467-018-04307-4, 2018.
Niyogi, D., Chang, H.-I., Saxena, V. K., Holt, T., Alapaty, K., Booker, F., Davis, K., Holben, B., Matsui, T., Meyers, T., Oechel, W., Pielke Sr., R., Wells, R., Wilson, K., and Xue, Y.: Direct observations of the effects of aerosol loading on net ecosystem CO2 exchanges over different landscapes, Geophys. Res. Lett., 31, 20, https://doi.org/10.1029/2004GL020915, 2004.
O'Sullivan, M., Rap, A., Reddington, C., Spracklen, D., Gloor, M., and Buermann, W.: Small global effect on terrestrial net primary production due to increased fossil fuel aerosol emissions from East Asia since the turn of the century, Geophys. Res. Lett., 43, 15, https://doi.org/10.1002/2016GL068965, 2016.
Pandithurai, G., Chellappan, S., Murthy, B., and Devara, P.: Investigation of atmospheric boundary layer characteristics for different aerosol absorptions: Case studies using CAPS model, Atmos. Environ., 42, 4755–4768, https://doi.org/10.1016/j.atmosenv.2008.01.038, 2008.
Penman, H. L.: Natural Evaporation from open water, bare soil and grass, Proc. R. Soc. A, 193, 120–145, https://doi.org/10.1098/rspa.1948.0037, 1948.
Rao, K. G. and Reddy, N. N.: On Moisture Flux of the Indian Summer Monsoon: A New Perspective, Geophys. Res. Lett., 46, 1794–1804, https://doi.org/10.1029/2018GL080392, 2019.
Rap, A., Scott, C. E., Reddington, C. L., Mercado, L., Ellis, R. J., Garraway, S., Evans, M. J., Beerling, D. J., MacKenzie, A. R., Hewitt, C. N., and Spracklen, D. V: Enhanced global primary production by biogenic aerosol via diffuse radiation fertilization, Nat. Geosci., 11, 640–644, https://doi.org/10.1038/s41561-018-0208-3, 2018.
Ratnam, J. V, Behera, S. K., Ratna, S. B., Rajeevan, M., and Yamagata, T.: Anatomy of Indian heatwaves, Sci. Rep.-UK, 6, 24395, https://doi.org/10.1038/srep24395, 2016.
Reichstein, M., Falge, E., Baldocchi, D., Papale, D., Aubinet, M., Berbigier, P., Bernhofer, C., Buchmann, N., Gilmanov, T., Granier, A., Grünwald, T., Havránková, K., Ilvesniemi, H., Janous, D., Knohl, A., Laurila, T., Lohila, A., Loustau, D., Matteucci, G., and Valentini, R.: On the Separation of Net Ecosystem Exchange into Assimilation and Ecosystem Respiration: Review and Improved Algorithm, Glob. Change Biol., 11, 1424–1439, https://doi.org/10.1111/j.1365-2486.2005.001002.x, 2005.
Ricchiazzi, P., Yang, S., Gautier, C., and Sowle, D.: SBDART: A Research and Teaching Software Tool for Plane-Parallel Radiative Transfer in the Earth's Atmosphere, B. Am. Meteorol. Soc., 79, 2101–2114, https://doi.org/10.1175/1520-0477(1998)079<2101:SARATS>2.0.CO;2, 1998.
Rigden, A. J. and Salvucci, G. D.: Stomatal response to humidity and CO2 implicated in recent decline in US evaporation, Glob. Chang. Biol., 23, 1140–1151, https://doi.org/10.1111/gcb.13439, 2017.
Rohini, P., Rajeevan, M., and Srivastava, A.: On the Variability and Increasing Trends of Heat Waves over India, Sci. Rep.-UK, 6, 26153, https://doi.org/10.1038/srep26153, 2016.
Sarangi, C., Tripathi, S. N., Mishra, A. K., Goel, A., and Welton, E. J.: Elevated aerosol layers and their radiative impact over Kanpur during monsoon onset period, J. Geophys. Res.-Atmos., 121, 7936–7957, https://doi.org/10.1002/2015JD024711, 2016.
Schwartz, S. E.: The whitehouse effect – Shortwave radiative forcing of climate by anthropogenic aerosols: an overview, J. Aerosol Sci., 27, 359–382, https://doi.org/10.1016/0021-8502(95)00533-1, 1996.
Shen, Z., Yi, M., and Held, M. I.: Using the fast impact of anthropogenic aerosols on regional land temperature to constrain aerosol forcing, Sci. Adv., 6, eabb5297, https://doi.org/10.1126/sciadv.abb5297, 2022.
Srivastava, A. K., Tiwari, S., Devara, P. C. S., Bisht, D. S., Srivastava, M. K., Tripathi, S. N., Goloub, P., and Holben, B. N.: Pre-monsoon aerosol characteristics over the Indo-Gangetic Basin: implications to climatic impact, Ann. Geophys., 29, 789–804, https://doi.org/10.5194/angeo-29-789-2011, 2011.
Steiner, A. L. and Chameides, W. L.: Aerosol-induced thermal effects increase modelled terrestrial photosynthesis and transpiration, Tellus B, 57, 404–411, https://doi.org/10.3402/tellusb.v57i5.16559, 2005.
Steiner, A. L., Mermelstein, D., Cheng, S. J., Twine, T. E., and Oliphant, A.: Observed Impact of Atmospheric Aerosols on the Surface Energy Budget, Earth Interact., 17, 1–22, https://doi.org/10.1175/2013EI000523.1, 2013.
Talukdar, S. and Madineni, V. R.: A mutual response between surface temperature and black carbon mass concentration during the daytime, Sci. Total Environ., 759, 143477, https://doi.org/10.1016/j.scitotenv.2020.143477, 2020.
Trenberth, K. E., Fasullo, J. T., and Kiehl, J.: Earth's Global Energy Budget, B. Am. Meteorol. Soc., 90, 311–324, https://doi.org/10.1175/2008BAMS2634.1, 2009.
Turner, A. G., Bhat, G. S., Martin, G. M., Parker, D. J., Taylor, C. M., Mitra, A. K., Tripathi, S. N., Milton, S., Rajagopal, E. N., Evans, J. G., Morrison, R., Pattnaik, S., Sekhar, M., Bhattacharya, B. K., Madan, R., Govindankutty, M., Fletcher, J. K., Willetts, P. D., Menon, A., Marsham, J. H., team, and the I., Hunt, K. M. R., Chakraborty, T., George, G., Krishnan, M., Sarangi, C., Belušić, D., Garcia-Carreras, L., Brooks, M., Webster, S., Brooke, J. K., Fox, C., Harlow, R. C., Langridge, J. M., Jayakumar, A., Böing, S. J., Halliday, O., Bowles, J., Kent, J., O'Sullivan, D., Wilson, A., Woods, C., Rogers, S., Smout-Day, R., Tiddeman, D., Desai, D., Nigam, R., Paleri, S., Sattar, A., Smith, M., Anderson, D., Bauguitte, S., Carling, R., Chan, C., Devereau, S., Gratton, G., MacLeod, D., Nott, G., Pickering, M., Price, H., Rastall, S., Reed, C., Trembath, J., Woolley, A., Volonté, A., and New, B.: Interaction of convective organization with monsoon precipitation, atmosphere, surface and sea: The 2016 INCOMPASS field campaign in India, Q. J. Roy. Meteor. Soc., 146, 2828–2852, https://doi.org/10.1002/qj.3633, 2020.
Urankar, G., Prabha, T. V, Pandithurai, G., Pallavi, P., Achuthavarier, D., and Goswami, B. N.: Aerosol and cloud feedbacks on surface energy balance over selected regions of the Indian subcontinent, J. Geophys. Res.-Atmos., 117, D4, https://doi.org/10.1029/2011JD016363, 2012.
Wang, K. and Dickinson, R. E.: A review of global terrestrial evapotranspiration: Observation, modeling, climatology, and climatic variability, Rev. Geophys., 50, 2, https://doi.org/10.1029/2011RG000373, 2012.
Wang, K., Dickinson, R., and Liang, S.: Observational evidence on the effects of clouds and aerosols on net ecosystem exchange and evapotranspiration, Geophys. Res. Lett., 35, L10401, https://doi.org/10.1029/2008GL034167, 2008.
Wang, Z., Wang, C., Wang, B., Wang, X., Li, J., Wu, J., and Liu, L.: Interactive effects of air pollutants and atmospheric moisture stress on aspen growth and photosynthesis along an urban-rural gradient, Environ. Pollut., 260, 114076, https://doi.org/10.1016/j.envpol.2020.114076, 2020.
Welton, E. J. and Campbell, J. R.: Micropulse Lidar Signals: Uncertainty Analysis, J. Atmos. Ocean. Tech., 19, 2089–2094, https://doi.org/10.1175/1520-0426(2002)019<2089:MLSUA>2.0.CO;2, 2002.
Yu, H., Liu, S. C., and Dickinson, R. E.: Radiative effects of aerosols on the evolution of the atmospheric boundary layer, J. Geophys. Res.-Atmos., 107, AAC 3-1–AAC 3-14, https://doi.org/10.1029/2001JD000754, 2002.
Yuan, W., Yi, Z., Shilong, P., Philippe, C., Danica, L., Yingping, W., Youngryel, R., Guixing, C., Wenjie, D., Zhongming, H., K., J. A., Chongya, J., Etsushi, K., Shihua, L., Sebastian, L., Shuguang, L., Nabel, J. E. M. S., Zhangcai, Q., Timothy, Q., Stephen, S., K., S. W., Fan, W., Chaoyang, W., Zhiqiang, X., and Song, Y.: Increased atmospheric vapor pressure deficit reduces global vegetation growth, Sci. Adv., 5, eaax1396, https://doi.org/10.1126/sciadv.aax1396, 2022.
Yue, X. and Unger, N.: Aerosol optical depth thresholds as a tool to assess diffuse radiation fertilization of the land carbon uptake in China, Atmos. Chem. Phys., 17, 1329–1342, https://doi.org/10.5194/acp-17-1329-2017, 2017.