the Creative Commons Attribution 4.0 License.
the Creative Commons Attribution 4.0 License.
 | 16 Mar 2022
Interpretation of NO3–N2O5 observation via steady state in high-aerosol air mass: the impact of equilibrium coefficient in ambient conditions
Xiaorui Chen
Steady-state approximation for interpreting NO3 and N2O5 has large uncertainty under complicated ambient conditions and could even produce incorrect results unconsciously. To provide an assessment and solution to the dilemma, we formulate datasets based on in situ observations to reassess the applicability of the method. In most of steady-state cases, we find a prominent discrepancy between Keq (equilibrium coefficient for reversible reactions of NO3 and N2O5) and correspondingly simulated , especially under high-aerosol conditions in winter. This gap reveals that the accuracy of Keq has a critical impact on the steady-state analysis in polluted regions. In addition, the accuracy of γ (N2O5) derived by steady-state fit depends closely on the reactivity of NO3 (kNO3) and N2O5(kN2O5). Based on a complete set of simulations, air mass of kNO3 less than 0.01 s−1 with high aerosol and temperature higher than 10 ∘C is suggested to be the best suited for steady-state analysis of NO3–N2O5 chemistry. Instead of confirming the validity of steady state by numerical modeling for every case, this work directly provides appropriate concentration ranges for accurate steady-state approximation, with implications for choosing suited methods to interpret nighttime chemistry in high-aerosol air mass.
- Article
(3873 KB) - Full-text XML
-
Supplement
(2077 KB) - BibTeX
- EndNote


The nitrate radical (NO3), an extremely reactive species prone to buildup at night, is an ideal candidate for steady-state analysis in combination with dinitrogen pentoxide (N2O5) due to fast equilibrium reactions between them (Reaction R1).
Under the steady-state condition, the lifetime of NO3 (denoted as τss(NO3)) can be calculated as the ratio of NO3 concentration over the production rate ( or over the removal rate of both NO3 and N2O5, as indicated in Eq. (1). A similar representation of N2O5 steady-state lifetime is also shown in Eq. (2). The loss frequencies of various sink pathways of NO3 and N2O5 are integrated as total first order in the following equations, represented by the kNO3 and kN2O5 terms. Briefly, kNO3 is contributed by the reaction of the NO3 radical with NO and hydrocarbons and uptake on particles at night, ranging from hundredths of reciprocal seconds to several reciprocal seconds depending on the air mass. Due to its large rate constant with NO, the concentration usually dominates the lifetime of the NO3 radical in urban areas with fresh NO emission. Otherwise, the reactions with hydrocarbons, especially unsaturated hydrocarbons, are preferential for NO3 in rural areas. The Keq denotes the equilibrium coefficient for Reactions (R1a) and (R1b), derived by Eq. (3).
Numerous works have taken advantage of the steady-state calculation to quantify the total first-order loss rate for NO3 or N2O5 such that they drew conclusions about the oxidation capacity and reactive nitrogen budgets contributed by this chemical system (Allan et al., 1999, 2000; Carslaw et al., 1997; Platt et al., 1984; Vrekoussis et al., 2007; Wang et al., 2013). Since the steady-state approximation was used to interpret atmospheric observation of NO3–N2O5 (Brown et al., 2003; Platt et al., 1981), this method was also widely implemented to quantify the N2O5 uptake coefficient (γ (N2O5)) (Brown et al., 2009, 2003; Li et al., 2020; McDuffie et al., 2019; Phillips et al., 2016; Wang et al., 2017a, c, 2020a).
However, with the influence induced by complicated atmospheric conditions and emission, steady state in ambient air mass will not always be the case (as illustrated in Sect. S1 and Fig. S1 in the Supplement). These situations are prevalent in nocturnal boundary layer (Phillips et al., 2016; Stutz et al., 2004; Wang et al., 2017a, c) and therefore increase the difficulty of applying steady state directly to NO3–N2O5 observation data, whereas few studies have systematically characterized the error source and application conditions of this method (Brown et al., 2009).
Due to a faster approach to equilibrium than steady state, the application of Keq in the calculation of steady-state equations seems to be reasonable (Brown et al., 2003). For example, the ambient NO3 concentration was usually calculated based on ambient N2O5 concentration with Keq×[NO2] when determining their budgets or characterizing the lifetime or sink attribution of these two reactive nitrogen compounds (Brown et al., 2011; Osthoff et al., 2006; Wang et al., 2018, 2017c, d; Yan et al., 2019). In addition, the mathematical conversion between NO3 and N2O5 concentration via Keq coefficient can simplify the calculation in the iterative box model, which derives γ(N2O5) by iterating its value in the model until the predicted N2O5 concentration matches the observation (Wagner et al., 2013; Wang et al., 2020b). However, considerable uncertainty could be associated with the quantification of Keq and its different parameterizations (Cantrell et al., 1988; Pritchard, 1994). The impact of Keq value on steady-state fit or concentration conversion has not been explored to date in the analysis of NO3–N2O5 steady state.
In this study, we formulate a half artificial dataset with expected properties based on field campaigns. Specifically, most of the species contained in the dataset are observed values while only NO3 and N2O5 were calculated by the steady-state model (illustrated in the Sect. 2.2). With the dataset, we illustrate the reasons for deviation of parameterized Keq from in ambient conditions, the possible uncertainties of linear fit based on steady-state Eqs. (4) and (5) (the related variables are explained in Sect. 2.1) that resulted from different Keq values, and the influence of relevant atmospheric variables on γ (N2O5) derivation via the steady-state method. Furthermore, a series of ambient condition tests specify the exact ranges suited for steady-state analysis according to not only the validity of steady state but also Keq values, which optimize the validity check by numerical modeling in previous research (Brown et al., 2009, 2003) and develop complete standard for data filtering.
2.1 γ (N2O5) derivation by steady-state approximation
The framework of steady-state approximation for the NO3–N2O5 system is basically built on its chemical production and removal pathways, in case of extremely weak physical processes (e.g., transport, dilution, and deposition) relative to its chemical processes. With simultaneous measurements of NO3, N2O5, and relevant precursor concentrations, the steady-state lifetime τss(NO3) and τss(N2O5) can be quantified for a targeted period as shown in Eqs. (1) and (2). By substituting the kN2O5 with (N2O5), the γ(N2O5) and the reactivity of NO3 (kNO3, including the reactions of NO3 with NO and hydrocarbons) can therefore be determined by Eqs. (4) and (5).
Here c represents the mean molecular velocity of N2O5, Sa represents the aerosol surface area, and Keq is calculated from the rate constant of reversible Reactions (R1a) (kR1a) and (R1b) (kR1b), which is a temperature-dependent parameter. It should be noted that the photolysis of NO3 is not considered in the kNO3 due to weak radiation at night, and the homogeneous hydrolysis was also ignored due to its small contribution in comparison to the heterogeneous pathway. A similar presumption was also implemented in previous studies (Brown et al., 2009; Mentel et al., 1996; Wahner et al., 1998). In the form of these two equations, the potential covariance between Sa and NO2 concentration can be avoided to decrease the uncertainty (Brown et al., 2009). By being fit to these two equations, γ (N2O5) can be directly derived from slope of the plot of against 0.25c SaKeq[NO2] or from the intercept of the plot of against respectively. In the following analysis, the linear fit based on Eq. (5) is preferred in steady-state approximation.
2.2 Steady-state model and half-artificial datasets
The steady-state model is reformed from a zero-dimensional box model to produce NO3 and N2O5, which are in steady state as far as possible. It is constrained by measurements of NO, NO2, O3, CO, CH4, VOCs, HCHO, Sa, relative humidity (RH), temperature (T), and pressure, coupled with the Regional Atmospheric Chemistry Mechanism, version 2 (RACM2). Each data point is treated as an independent air mass, aging 10 h and keeping input constraint unchanged. As NO3–N2O5 chemistry, the interest of this work, usually shows marked impacts during the night, only the time periods with negligible photolysis frequency are under consideration. In the standard simulation (herein referred to as Mod0), the uptake coefficient of N2O5 is set to 0.02, as a reasonable value of literature (Brown et al., 2006; Chen et al., 2020; McDuffie et al., 2018; Morgan et al., 2015; Phillips et al., 2016; Wagner et al., 2013; Wang et al., 2017c; Yu et al., 2020).
Two half-artificial datasets are derived from PKU2017 and TZ2018 field campaigns (see Sect. S2) based on the steady-state model for analysis in the following sections. The simulated NO3 and N2O5 and other observed values used for the constraints of the steady-state model jointly formulate these half-artificial datasets. Specifically, the NO3 and N2O5 concentrations in this dataset are the output of the steady-state model simulation and guaranteed to be in steady state with respect to other observed precursors. To verify the steady state of NO3 and N2O5 for each data point, we filtered the dataset according to the deviation between the steady-state lifetime of N2O5 ( and calculated lifetime of N2O5 (. If the deviation exceeds 10 % for a data point, it will be excluded from the following analysis. We presume that if any data point output from the model is still out of steady state in terms of NO3 and N2O5, the sink rate constant of air mass represented by this data point should be too weak for steady-state analysis within a reasonable timescale. In addition, the data higher than 5 ppbv NO are filtered out in the following calculation, since the resulting large variation in kNO3 can bias the linear fit even though NO3 and N2O5 approach steady state rapidly under high NO (discussed in Sect. 3.2). The fraction of excluded data is less than 8 %, and they are expected to have little influence on our results. The calculated nighttime loss fraction accounted for by NO3 and N2O5 show large discrepancy (see Sect. S3 and Fig. S2) between these two half-artificial datasets, which provide us a good opportunity to investigate the factors impacting steady-state approximation across different conditions.
Rather than using observation data directly, a half-artificial dataset can provide a larger amount of valid data for steady-state analysis with a known γ (N2O5) value. In addition, this method avoids the impacts from steady-state deviation, which helps to analyze the factors influencing γ (N2O5) quantification via steady-state approximation backwards from a known steady-state condition.
3.1 Varying equilibrium coefficient under steady state
The rates of NO3–N2O5 reversible reactions are expected to be equal for the steady-state case, so that the equilibrium coefficient Keq can be determined from either the rate constant ratio of Reactions (R1a) and (R1b) or the ratio of . Although this approach is reasonable under ideal conditions, the exact same rates between reversible reactions and the following calculation based on Keq scaling are not so appropriate for ambient atmosphere where the removal pathway for NO3–N2O5 is not negligible, especially under the high-aerosol-loading condition. NO3 and N2O5 achieve steady state after 1.5 h evolution, when concentration and rates remain constant (Fig. 1). In this simulation, the starting mixing ratios of NO2 and O3 are 10 and 23 ppbv, respectively, which is the average level for the nighttime conditions in PKU2017. The concentrations of these two precursors are held constant in the simulation to better illustrate the influence of removal rates. This result will stay almost the same no matter whether these starting values are initialized to be constant or allowed to vary. Under steady state, the net equilibrium reaction rate in Fig. 1b and c stays negative and positive for NO3 and N2O5, respectively. In addition, the absolute values and difference of the forward and backward reaction rates remain unchanged after achieving steady state. This result is similar to a previous numerical calculation study (Brown et al., 2003), while the deviation between reversible reaction rates becomes larger in our case.
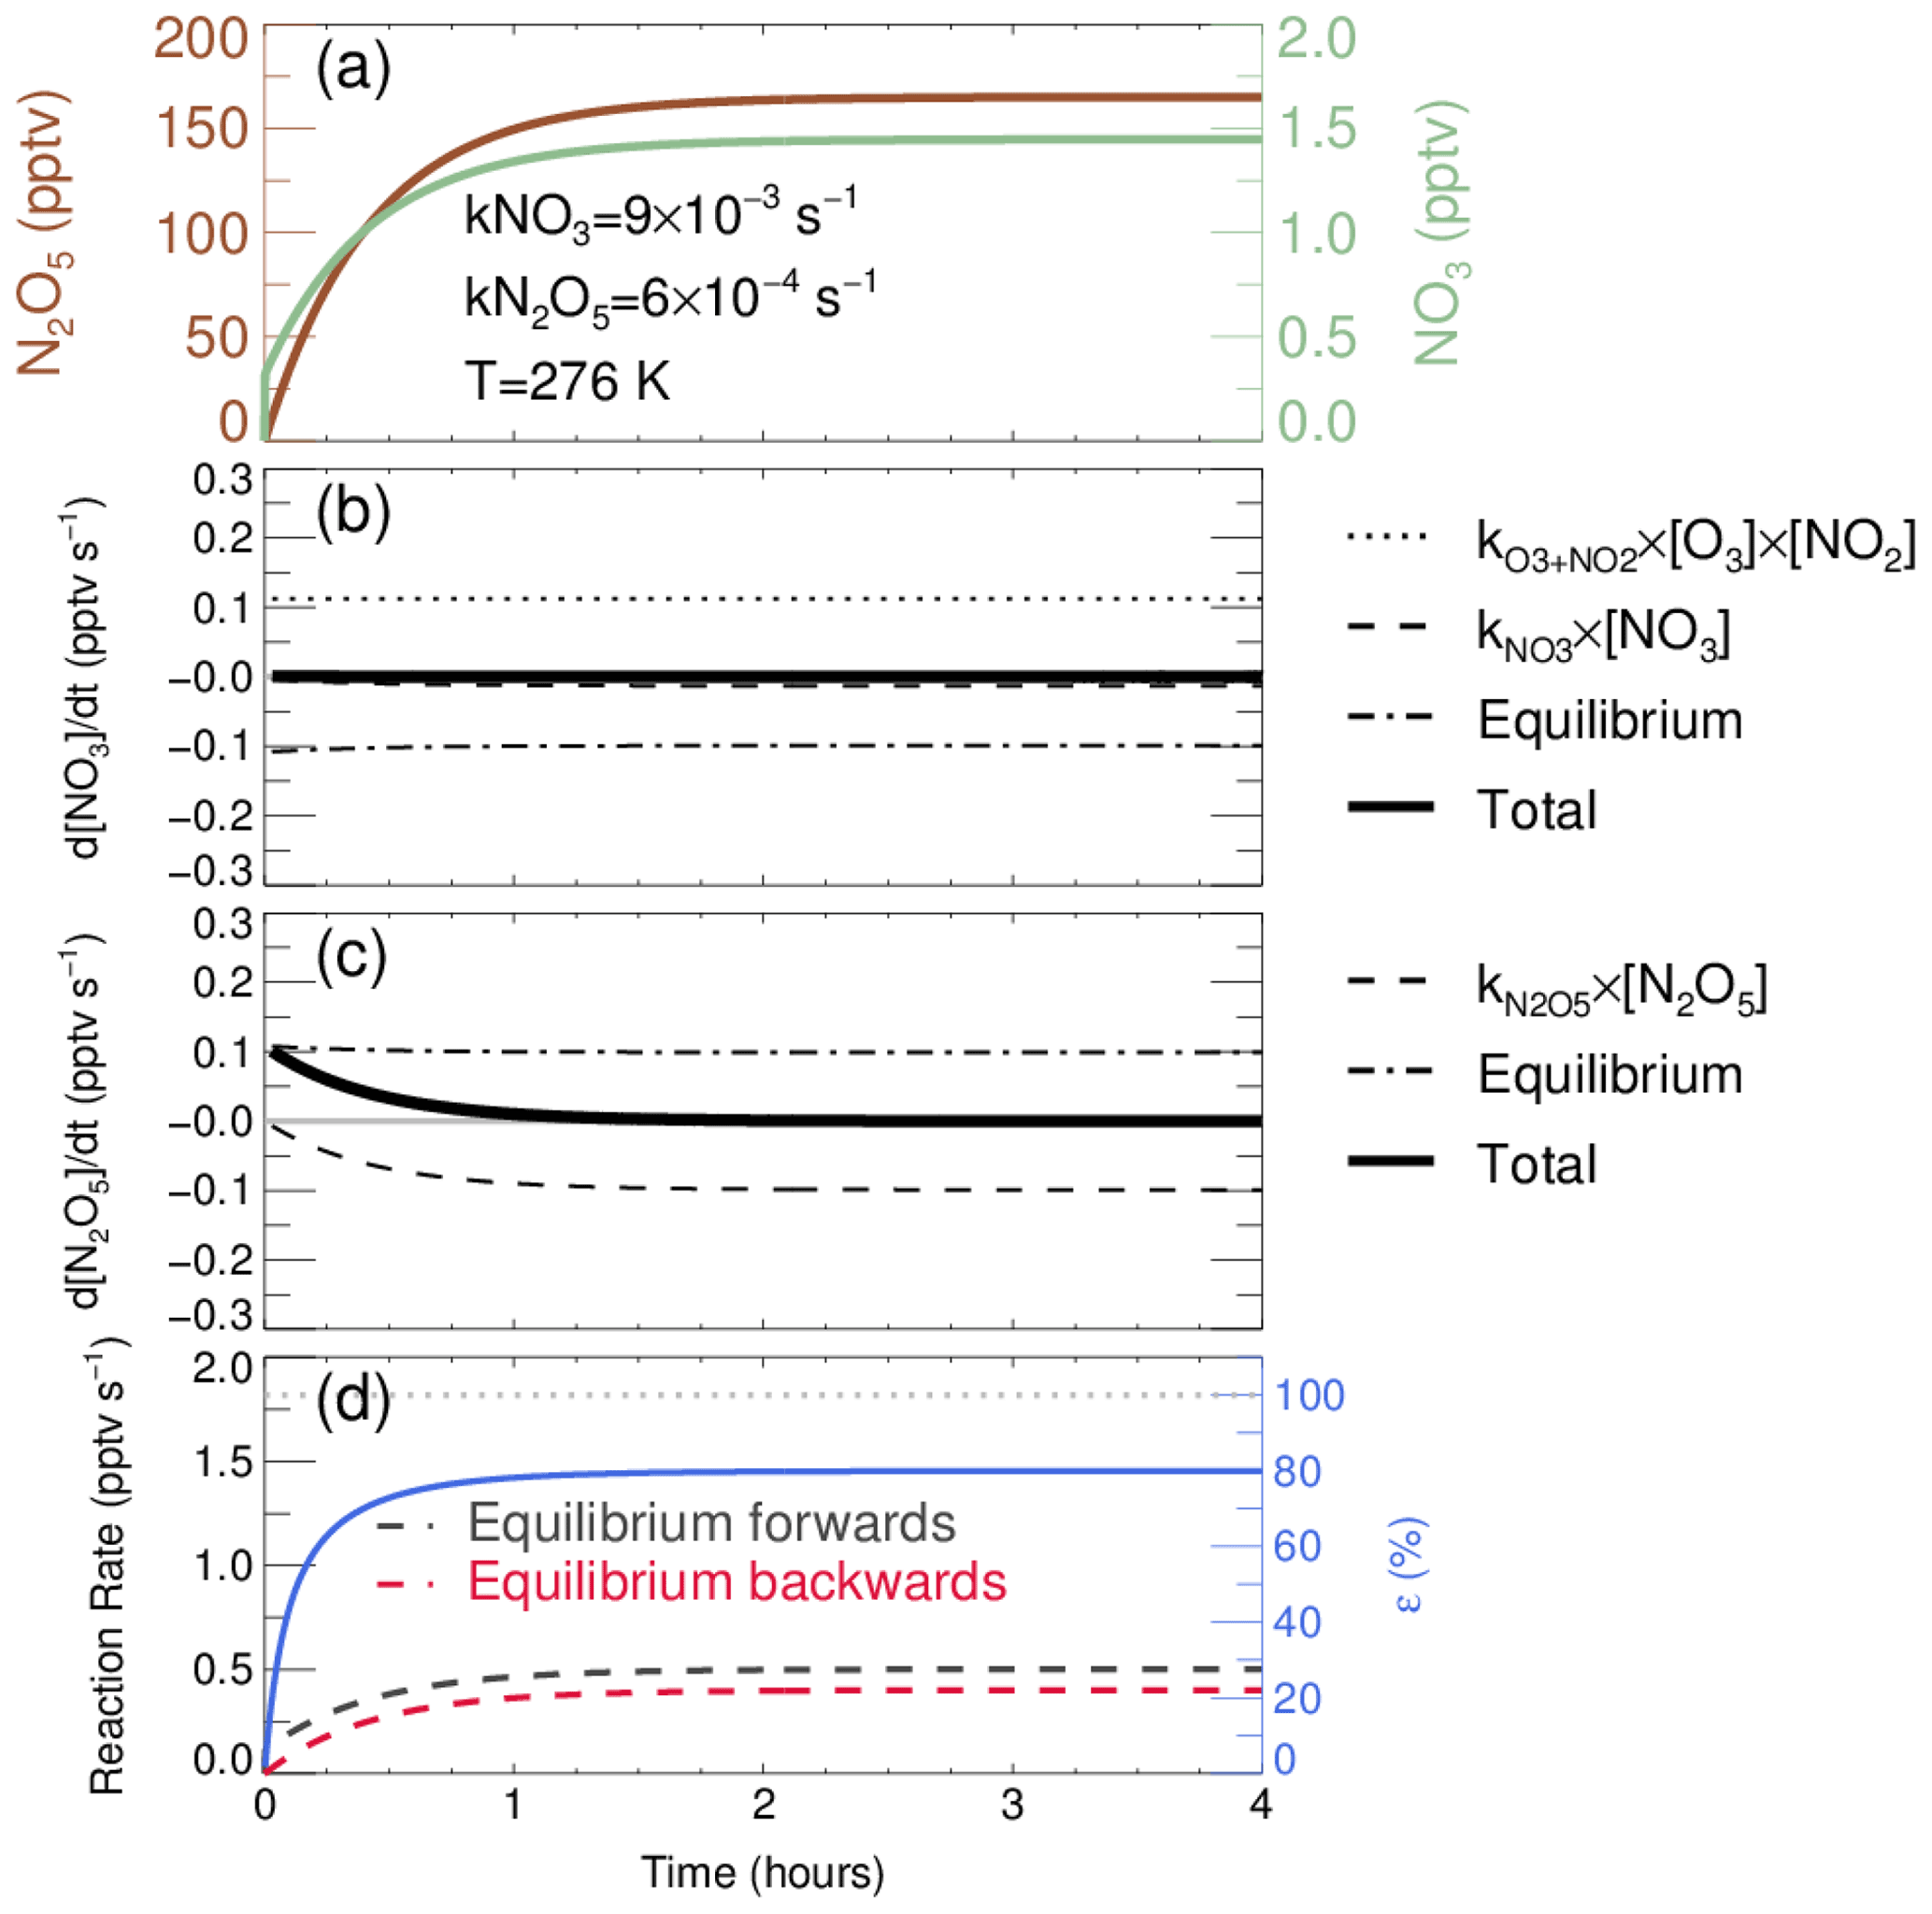
Figure 1Evolution of the NO3–N2O5 system simulated by the steady-state model for an average case. (a) Temporal profiles of N2O5 and NO3; the constraint of simulation is displayed as the text. (b) Evolution of d[NO3]dt calculated from the source of , sink of kNO3× [NO3], and equilibrium terms, detailed in the text. (c) Evolution of d[N2O5]dt calculated from equilibrium terms, sink of kN2O5× [N2O5]. (d) Forward (N2O5 formation) and backward (N2O5 decomposition) equilibrium rates are represented as black and red dashed lines, and the equilibrium completeness ε is calculated by the ratio of backward rate over forward rate, shown as blue full line.
In this case, the original equilibrium is imperfectly realized (a perfect realization of the original equilibrium condition is that Keq and the ratio of are equivalent as in Eq. 6), leading to errors on the projection of NO3 and N2O5 concentration via Keq×[NO2]. In fact, we note that a new equilibrium between NO3 and N2O5 is developed with constant but unequal rates. Under this new equilibrium condition, the ratio of (R1b) reaction rate (the red dashed line in Fig. 1d) over (R1a) reaction rate (the black dashed line in Fig. 1d) can be regarded as the degree of approaching original equilibrium (the blue line in Fig. 1d). In addition, this value is also the ratio of against original Keq; therefore we defined this ratio as a correction factor ε, implemented to calculate accurate with significant N2O5 removal pathways. The value of Keq after scaled by ε can be used for converting the concentration of NO3 and N2O5 via Eq. (6):
Sensitivity tests are conducted to demonstrate the dependence of ε on relevant variables based on the steady-state model. The averages ambient conditions observed at the wintertime Peking University (PKU) site and summertime Tai Zhou (TZ) site are taken as two basic constraints for sensitivity tests (Table S2 in the Supplement). By separately altering variables, such as NO2, O3, kN2O5, kNO3, and T, the sensitivity of the ε value can be obtained as shown in Figs. 2 and S4. The ε value depends primarily on kN2O5 and T in both scenarios, where ε increases with T (approaching 1 under relatively high T) and decreases with kN2O5. In comparison, the ε value behaves insensitively to kNO3 as well as NO2 and O3 concentration, at least within the range of reasonable ambient conditions. High kN2O5 results from high-aerosol events, usually occurring in winter accompanied by low temperature and high relative humidity in some populated areas (Baasandorj et al., 2017; Huang et al., 2014; Wang et al., 2017b, 2014), further decreasing the accuracy of original Keq values. It can be inferred that in order to accurately interpret the relationship of NO3 and N2O5, calculation relying on the equilibrium equation and steady-state approximation should consider the dependence of ε on ambient conditions.
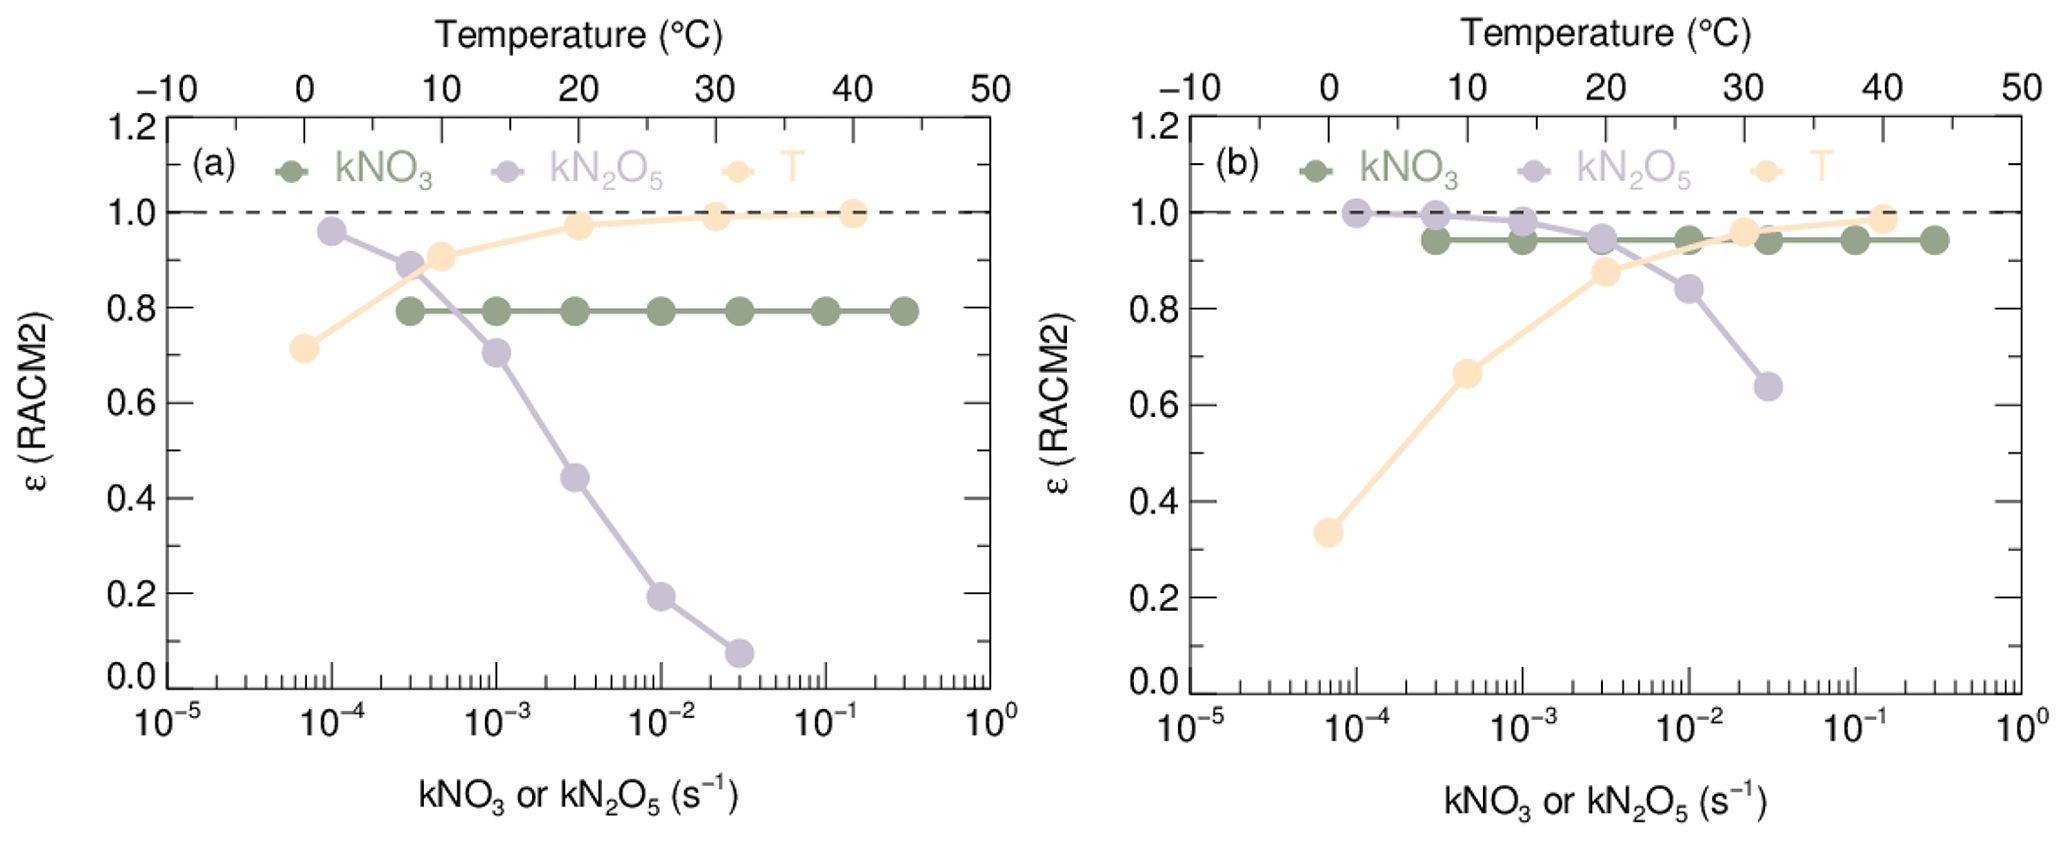
Figure 2Sensitivity plot of kNO3, kN2O5, and temperature (T) against coefficient ε. The trace of T is plotted against the upper horizontal axis, and the traces of the other two parameters are plotted against the lower horizontal axis. (a) The basic model condition is according to typical winter conditions of PKU2017. (b) The basic model condition is according to typical summer conditions of TZ2018. Basic model conditions including kNO3, kN2O5, and temperature (T) are shown in Table S2. It should be noted that the provided ranges of each factor do not exactly equal but encompass the ambient conditions encountered during the two campaigns.
Even if the Keq value serves as a good representation of the ratio of or ε can be readily quantified in the field, the discrepancy among different databases in calculating Keq still increases the uncertainties of NO3–N2O5 calculation through steady-state approximation or equilibrium, which has not been carefully considered. Here, we apply a set of uniform formulas to describe kR1a and kR1b (see Sect. S4) from preferred values of several popular atmospheric chemistry mechanisms (Mozart, CB05, Saprc07, RACM2 and kinetic databases JPL2015 as well as IUPAC2017) and finally calculating Keq. As is shown in Figs. S5 and S6, Keq variations derived from these six different databases reflect considerable discrepancy from each other, especially in colder conditions. Because parameterized Keq values are only dependent on ambient temperature, they continuously increase with time due to the decrease in temperature. In addition to the discrepancy between different Keq parameterizations, the ε value varies dissimilarly with each Keq, ranging from 70 % to 90 %. All these results demonstrate that, in most cases, Keq values simply derived from an existing database would fail to reproduce an accurate relationship between NO3 and N2O5.
To further elucidate the impact of Keq on deriving γ (N2O5) via steady-state approximation (hereafter defined as γss (N2O5)), Fig. S6 shows the steady-state fit based on all six database-derived Keq values and in the same time periods as Fig. S5 through Eqs. (4) and (5), respectively (both equations can derive a pair of γss (N2O5) and kNO3). Keq (corrected with ε) is calculated with NO3 and N2O5 concentration simulated based on RACM2. Fits based on Eq. (4) could lead to 11 %–46 % underestimation of γss (N2O5), as indicated by varying slopes in Fig. S7b and d, when using the database-derived Keq. Conversely, fit by Eq. (5) (shown in Fig. S7a and c) biases the result of kNO3 as the slopes without much influence on γss(N2O5) as the intercept. Previous research ascribed inconsistent fit results between two equations to measurement uncertainty (Brown et al., 2009, 2006). However, fit with the original Keq might be the primary reason for such inconsistent results and even differentiates the derived γss (N2O5) and kNO3 from true values. Therefore, steady-state fit based on Eq. (5) might be the best choice for γ (N2O5) derivation via steady-state approximation. Similarly, Eq. (4) is preferred to be applied when kNO3 is the final objective.
3.2 Impacts of NO3–N2O5 reactivity on steady state
In order to further explore the impacting factors on the steady-state fit method, γss (N2O5) results are derived for each 2 h time period of the PKU2017 and TZ2018 datasets based on output from the steady-state model. Since the pre-set γ (N2O5) in this model is 0.02, the degree of deviation from this value is supposed to reflect the accuracy of the fitted result.
It can be noticed from Eq. (5) that the variability of kNO3 during the same time period leads data points to scatter on lines with different slopes, which could bias the resulted γss (N2O5) from the model pre-set value. As is shown in Fig. 3, the absolute percentages of γss (N2O5) deviation grow dramatically with the increase in relative standard deviation of kNO3 (kNO3 RSD) in both winter and summer datasets. The positive correlation even gives rise to extreme deviation in the summer dataset, with up to almost 10 times of model setting γ (N2O5). In fact, there remain accurate γss(N2O5) values derived in each range of kNO3 RSD, indicating a not strictly positive correlation between γss (N2O5) deviation and kNO3 RSD. This implies that large variation in kNO3 only enhances the possibilities of inaccurate results from steady-state fit rather than hinder the γss (N2O5) quantification all the time.
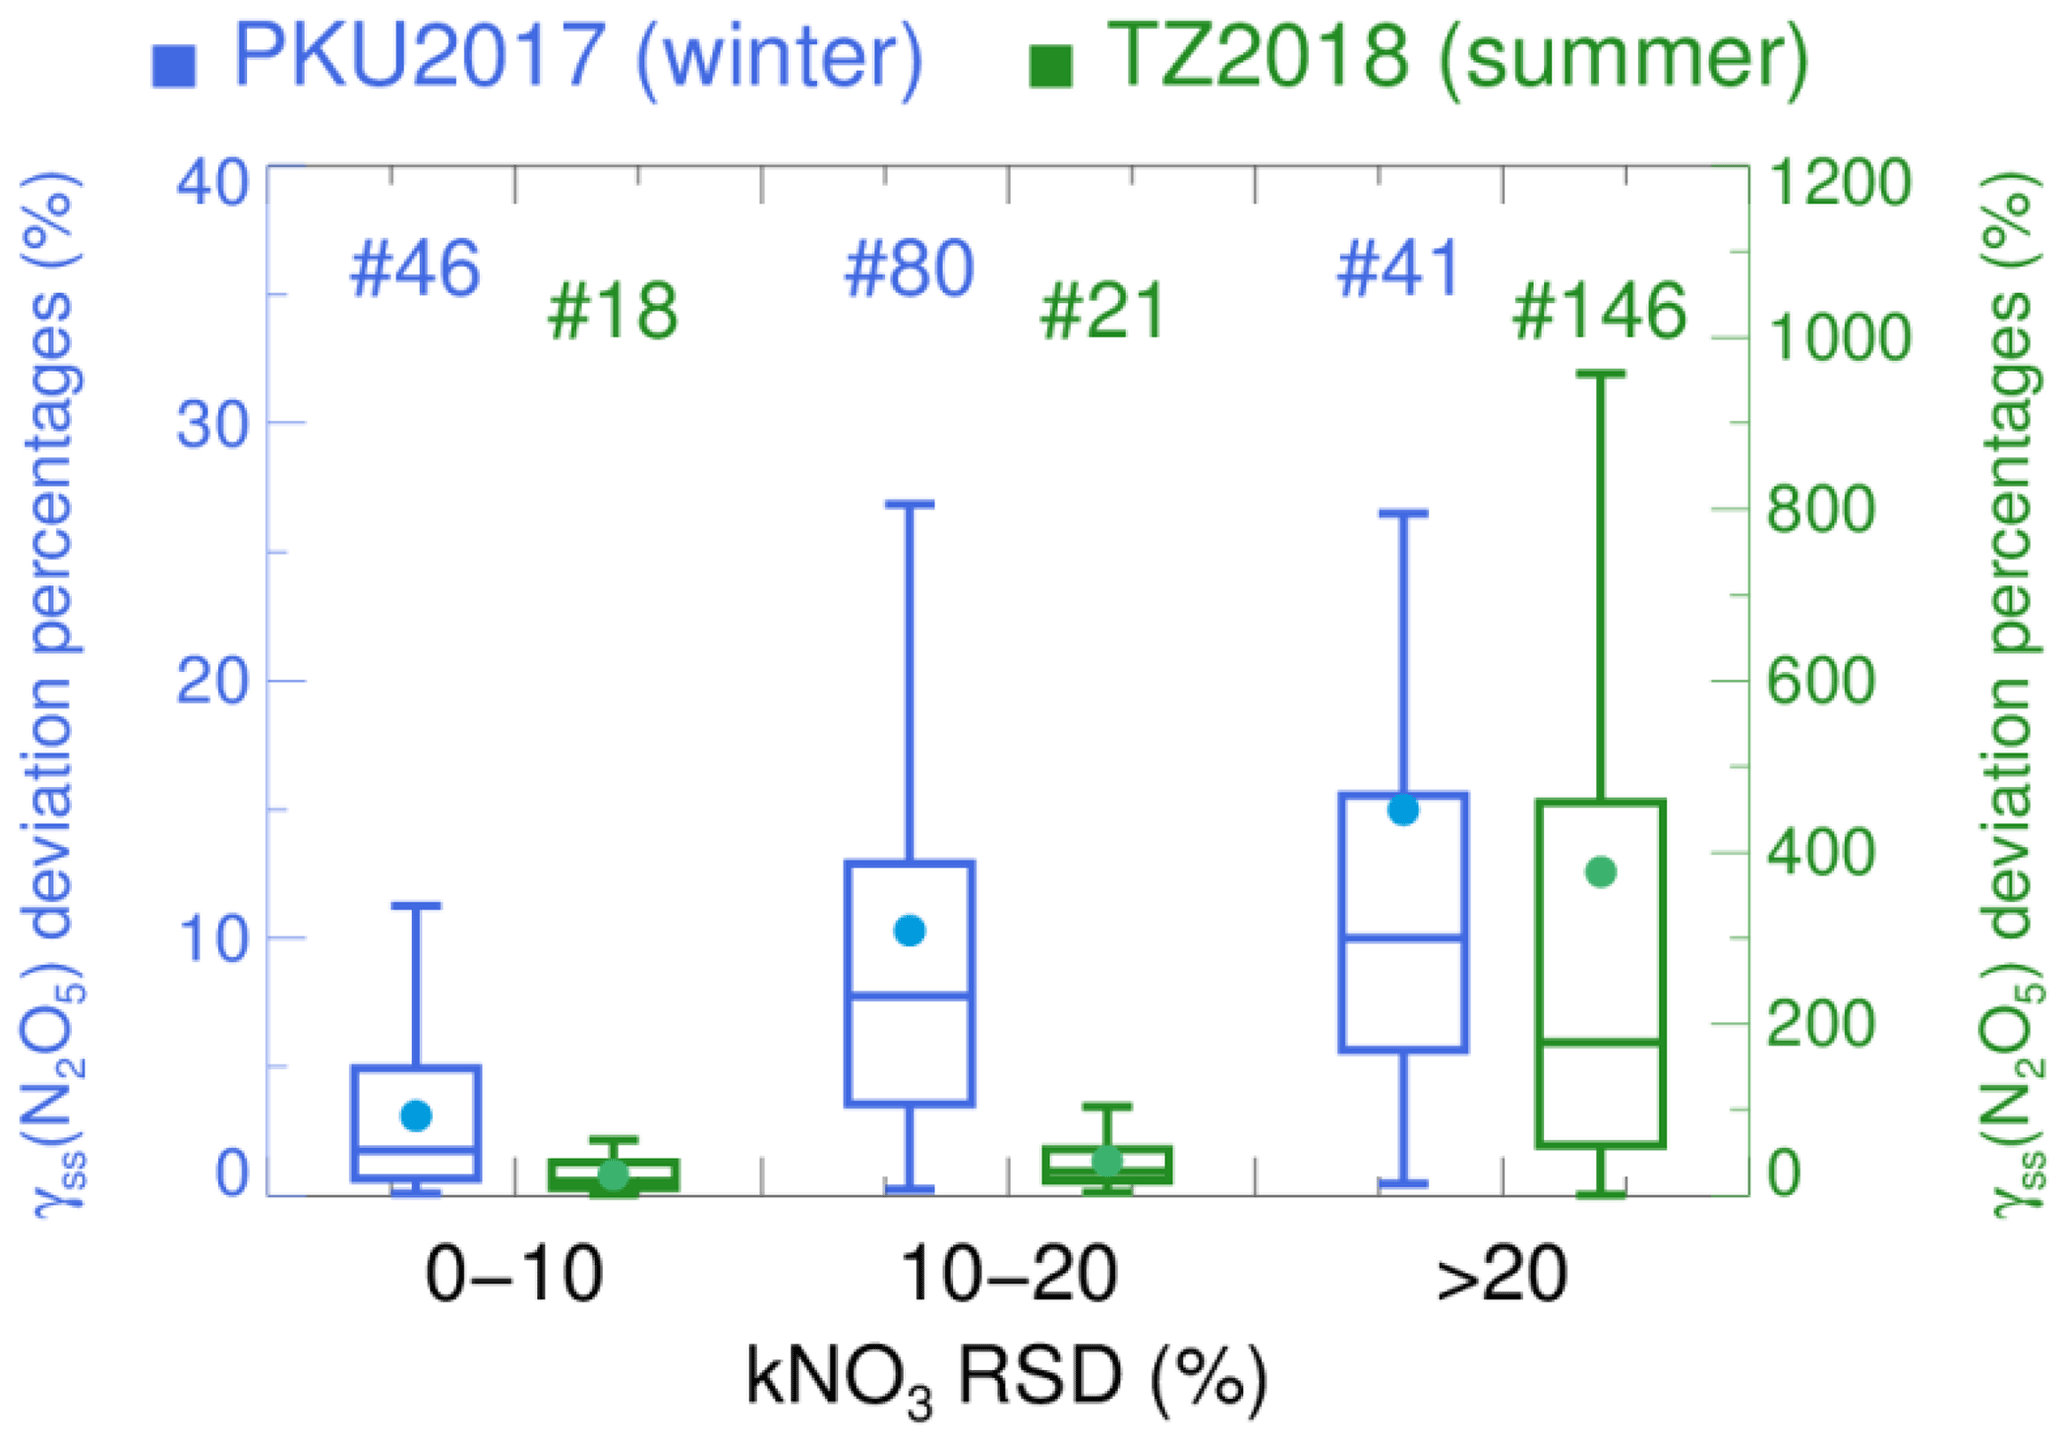
Figure 3Relationship between γ (N2O5) derivation through steady-state approximation and kNO3 relative standard deviation (RSD) in box–whisker plot. The blue and green colors represent datasets from PKU2017 and TZ2018 respectively, binned according to kNO3 RSD. The dots are the mean deviation of γss (N2O5). The number above the box–whisker plot represents the valid data points in each bin.
In addition to the large variation in kNO3 in a short time period, the absolute level of kNO3 and kN2O5 could influence the possibilities of inaccurate γss (N2O5) from different aspects. Although the enhancement of kNO3 and kN2O5 boosts the approach to steady state (Sect. S5 and Fig. S8), higher levels of kNO3 amplify the bias of γss (N2O5), contrary to kN2O5, with the same relative variation in kNO3 (Sect. S6 and Fig. S10). This indicates that the region with plural emissions (e.g., strong biogenic or vehicular emission) might not be suited for steady-state fit due to the high kNO3. Therefore, a trade-off between the variation in kNO3 and the high level of kNO3 (fast approach to steady state) should be made when deriving γss (N2O5).

Figure 4Numerical simulations for determining conditions available for the steady-state approximation method in a parallel-axis plot. Each line simply represents a simulation associated with different parameters in different vertical axes. The first five axes from the left represent initial variables used for constraining the simulations. The last two axes represent the time required for achieving steady state and the ε value calculated from the simulated results. The gray lines show cases approaching steady state for longer than 600 s (less valid). The blue lines show cases approaching steady-state cases within 600 s with ε less than 0.9, which is also inappropriate for steady-state analysis. The pink lines show cases approaching steady-state cases within 600 s with ε higher than 0.9, which is suited for steady-state analysis.
3.3 Implication for accurate steady-state analysis of NO3–N2O5
While a few studies have examined the validity of steady state under certain conditions via numerical modeling when interpreting the ambient data (Brown et al., 2009, 2003), a clear range well suited to steady-state analysis of NO3–N2O5, taking both Keq and validity of steady state into consideration, has not been determined to date.
Here almost 20 000 simulations are displayed in the parallel plot of Fig. 4, where each line connects five constraint parameters to the calculated steady-state time and ε (the correction factor for Keq parameterization to match the exact ratio of , detailed in Eq. 6). The gray traces represent the simulations that could not match steady state within 600 s and were defined as less valid cases here. By this definition, we intend to indicate that it is also viable to apply steady-state approximation on air mass, which requires more than 600 s to match steady state, whereas the uncertainty caused therefrom could increase to some extent. The pink and blue traces together represent the simulations that could match valid steady state within 600 s without consideration of Keq deviation (in other words the value of ε). Furthermore, the criteria to apply steady-state approximation appropriately is approach to steady state within 600 s and ε larger than 0.9, which are indicated as pink traces. While the levels of T, NO2, and O3 have a minor effect on the approach to steady state, simultaneous low kN2O5 (indicated as low Sa in the plot) and kNO3 prevent the NO3–N2O5 system from developing steady state. For example, when kNO3 is lower than 0.01 s−1, the air mass will be valid only if Sa increases to at least 3000 µm2 cm−3 with γ (N2O5) of 0.02. This implies that clean air mass is not suited for steady state in any cases, whereas the high-aerosol condition provides more possibilities to approach steady state even with low kNO3. However, in order to interpret NO3–N2O5 chemistry with an accurate Keq coefficient, the ε larger than 0.9 is additionally taken into consideration, which excludes 50 % of valid steady-state cases mainly with high aerosol and lower than 10 ∘C. These cases could bias from original Keq (also indicated in Fig. 2), leading to inaccurate results of calculation based on Keq.
In this study, we found that the parameterized Keq coefficient deviates much from the ratio of in some cases where steady state is valid. The indicator of the deviation, ε, is relatively sensitive to N2O5 reactivity and ambient temperature. It implies that conditions suited for steady-state analysis should be determined according to not only the validity of steady state but also Keq, especially under high-aerosol conditions, like some regions in India, China, Europe, and the US (Baasandorj et al., 2017; Cesari et al., 2018; Huang et al., 2014; Mogno et al., 2021; Petit et al., 2017; Wang et al., 2017b). Considering that a high level of kNO3 might amplify the bias of γss (N2O5) yield from steady-state fit and appears to be accompanied by fast variations, air mass of kNO3 less than 0.01 s−1 with high aerosol and T higher than 10 ∘C are therefore the best suited for steady-state analysis of NO3–N2O5 chemistry, which indicates that this method would be more applicable in polluted regions with high aerosol loading during summertime. If the restriction of ε is relaxed to 30 %, some winter conditions will also be applicable. Our results provide an insight into improving the accuracy of the steady-state approximation method and finding suited areas to interpret nighttime chemistry. Further improvement of in situ NO3–N2O5 budget quantification might rely on the direct measurements via flow tube system or machine learning prediction based on ancillary parameters.
The datasets used in this study are available from the corresponding author upon request (wanghch27@mail.sysu.edu.cn; k.lu@pku.edu.cn).
The supplement related to this article is available online at: https://doi.org/10.5194/acp-22-3525-2022-supplement.
KL and HW designed the study. XC and HW analyzed the data and wrote the paper with input from KL.
The contact author has declared that neither they nor their co-authors have any competing interests.
Publisher's note: Copernicus Publications remains neutral with regard to jurisdictional claims in published maps and institutional affiliations.
Thanks for the data contributed by field campaign team.
This research has been supported by the National Natural Science Foundation of China (grant nos. 21976006 and 42175111), the Beijing Municipal Natural Science Foundation (grant no. JQ19031), the State Key Joint Laboratory of Environmental Simulation and Pollution Control (grant no. 21K02ESPCP), the National Key Basic Research Program For Youth (grant nos. DQGG0103-01 and 2019YFC0214800), and the National State Environmental Protection Key Laboratory of Formation and Prevention of Urban Air Pollution Complex (grant no. CX2020080578).
This paper was edited by Qiang Zhang and reviewed by two anonymous referees.
Allan, B. J., Carslaw, N., Coe, H., Burgess, R. A., and Plane, J. M. C.: Observations of the nitrate radical in the marine boundary layer, J. Atmos. Chem., 33, 129–154, https://doi.org/10.1023/A:1005917203307, 1999.
Allan, B. J., McFiggans, G., Plane, J. M. C., Coe, H., and McFadyen, G. G.: The nitrate radical in the remote marine boundary layer, J. Geophys. Res.-Atmos., 105, 24191–24204, https://doi.org/10.1029/2000JD900314, 2000.
Baasandorj, M., Hoch, S. W., Bares, R., Lin, J. C., Brown, S. S., Millet, D. B., Martin, R., Kelly, K., Zarzana, K. J., Whiteman, C. D., Dube, W. P., Tonnesen, G., Jaramillo, I. C., and Sohl, J.: Coupling between Chemical and Meteorological Processes under Persistent Cold-Air Pool Conditions: Evolution of Wintertime PM2.5 Pollution Events and N2O5 Observations in Utah's Salt Lake Valley, Environ. Sci. Technol., 51, 5941–5950, https://doi.org/10.1021/acs.est.6b06603, 2017.
Brown, S. S., Stark, H., and Ravishankara, A. R.: Applicability of the steady state approximation to the interpretation of atmospheric observations of NO3 and N2O5, J. Geophys. Res.-Atmos., 108, 4539, https://doi.org/10.1029/2003jd003407, 2003.
Brown, S. S., Ryerson, T. B., Wollny, A. G., Brock, C. A., Peltier, R., Sullivan, A. P., Weber, R. J., Dube, W. P., Trainer, M., Meagher, J. F., Fehsenfeld, F. C., and Ravishankara, A. R.: Variability in nocturnal nitrogen oxide processing and its role in regional air quality, Science, 311, 67–70, https://doi.org/10.1126/science.1120120, 2006.
Brown, S. S., Dube, W. P., Fuchs, H., Ryerson, T. B., Wollny, A. G., Brock, C. A., Bahreini, R., Middlebrook, A. M., Neuman, J. A., Atlas, E., Roberts, J. M., Osthoff, H. D., Trainer, M., Fehsenfeld, F. C., and Ravishankara, A. R.: Reactive uptake coefficients for N2O5 determined from aircraft measurements during the Second Texas Air Quality Study: Comparison to current model parameterizations, J. Geophys. Res.-Atmos., 114, D00f10, https://doi.org/10.1029/2008jd011679, 2009.
Brown, S. S., Dubé, W. P., Peischl, J., Ryerson, T. B., Atlas, E., Warneke, C., de Gouw, J. A., te Lintel Hekkert, S., Brock, C. A., Flocke, F., Trainer, M., Parrish, D. D., Feshenfeld, F. C., and Ravishankara, A. R.: Budgets for nocturnal VOC oxidation by nitrate radicals aloft during the 2006 Texas Air Quality Study, J. Geophys. Res.-Atmos., 116, D24305, https://doi.org/10.1029/2011jd016544, 2011.
Cantrell, C., Davidson, J., McDaniel, A., Shetter, R., and Calvert, J.: The equilibrium constant for N2O5 = NO2 + NO3 – Absolute determination by direct measurement from 243 to 397 K, J. Chem. Phys., 88, 4997, https://doi.org/10.1063/1.454679, 1988.
Carslaw, N., Plane, J. M. C., Coe, H., and Cuevas, E.: Observations of the nitrate radical in the free troposphere at Izana de Tenerife, J. Geophys. Res.-Atmos., 102, 10613–10622, https://doi.org/10.1029/96jd03512, 1997.
Cesari, D., De Benedetto, G. E., Bonasoni, P., Busetto, M., Dinoi, A., Merico, E., Chirizzi, D., Cristofanelli, P., Donateo, A., Grasso, F. M., Marinoni, A., Pennetta, A., and Contini, D.: Seasonal variability of PM2.5 and PM10 composition and sources in an urban background site in Southern Italy, Sci. Total Environ., 612, 202–213, https://doi.org/10.1016/j.scitotenv.2017.08.230, 2018.
Chen, X., Wang, H., Lu, K., Li, C., Zhai, T., Tan, Z., Ma, X., Yang, X., Liu, Y., Chen, S., Dong, H., Li, X., Wu, Z., Hu, M., Zeng, L., and Zhang, Y.: Field Determination of Nitrate Formation Pathway in Winter Beijing, Environ. Sci. Technol., 54, 9243–9253, https://doi.org/10.1021/acs.est.0c00972, 2020.
Huang, R.-J., Zhang, Y., Bozzetti, C., Ho, K.-F., Cao, J.-J., Han, Y., Daellenbach, K. R., Slowik, J. G., Platt, S. M., Canonaco, F., Zotter, P., Wolf, R., Pieber, S. M., Bruns, E. A., Crippa, M., Ciarelli, G., Piazzalunga, A., Schwikowski, M., Abbaszade, G., Schnelle-Kreis, J., Zimmermann, R., An, Z., Szidat, S., Baltensperger, U., Haddad, I. E., and Prévôt, A. S. H.: High secondary aerosol contribution to particulate pollution during haze events in China, Nature, 514, 218–222, https://doi.org/10.1038/nature13774, 2014.
Li, Z. Y., Xie, P. H., Hu, R. Z., Wang, D., Jin, H. W., Chen, H., Lin, C., and Liu, W. Q.: Observations of N2O5 and NO3 at a suburban environment in Yangtze river delta in China: Estimating heterogeneous N2O5 uptake coefficients, J. Environ. Sci., 95, 248–255, https://doi.org/10.1016/j.jes.2020.04.041, 2020.
McDuffie, E. E., Fibiger, D. L., Dubé, W. P., Lopez-Hilfiker, F., Lee, B. H., Thornton, J. A., Shah, V., Jaeglé, L., Guo, H., Weber, R. J., Michael Reeves, J., Weinheimer, A. J., Schroder, J. C., Campuzano-Jost, P., Jimenez, J. L., Dibb, J. E., Veres, P., Ebben, C., Sparks, T. L., Wooldridge, P. J., Cohen, R. C., Hornbrook, R. S., Apel, E. C., Campos, T., Hall, S. R., Ullmann, K., and Brown, S. S.: Heterogeneous N2O5 Uptake During Winter: Aircraft Measurements During the 2015 WINTER Campaign and Critical Evaluation of Current Parameterizations, J. Geophys. Res.-Atmos., 123, 4345–4372, https://doi.org/10.1002/2018jd028336, 2018.
McDuffie, E. E., Womack, C. C., Fibiger, D. L., Dube, W. P., Franchin, A., Middlebrook, A. M., Goldberger, L., Lee, B. H., Thornton, J. A., Moravek, A., Murphy, J. G., Baasandorj, M., and Brown, S. S.: On the contribution of nocturnal heterogeneous reactive nitrogen chemistry to particulate matter formation during wintertime pollution events in Northern Utah, Atmos. Chem. Phys., 19, 9287–9308, https://doi.org/10.5194/acp-19-9287-2019, 2019.
Mentel, T. F., Bleilebens, D., and Wahner, A.: A study of nighttime nitrogen oxide oxidation in a large reaction chamber - The fate of NO2 N2O5, HNO3, and O3 at different humidities, Atmos. Environ., 30, 4007–4020, https://doi.org/10.1016/1352-2310(96)00117-3, 1996.
Mogno, C., Palmer, P. I., Knote, C., Yao, F., and Wallington, T. J.: Seasonal distribution and drivers of surface fine particulate matter and organic aerosol over the Indo-Gangetic Plain, Atmos. Chem. Phys., 21, 10881–10909, https://doi.org/10.5194/acp-21-10881-2021, 2021.
Morgan, W. T., Ouyang, B., Allan, J. D., Aruffo, E., Di Carlo, P., Kennedy, O. J., Lowe, D., Flynn, M. J., Rosenberg, P. D., Williams, P. I., Jones, R., McFiggans, G. B., and Coe, H.: Influence of aerosol chemical composition on N2O5 uptake: airborne regional measurements in northwestern Europe, Atmos. Chem. Phys., 15, 973–990, https://doi.org/10.5194/acp-15-973-2015, 2015.
Osthoff, H. D., Sommariva, R., Baynard, T., Pettersson, A., Williams, E. J., Lerner, B. M., Roberts, J. M., Stark, H., Goldan, P. D., Kuster, W. C., Bates, T. S., Coffman, D., Ravishankara, A. R., and Brown, S. S.: Observation of daytime N2O5 in the marine boundary layer during New England Air Quality Study – Intercontinental Transport and Chemical Transformation 2004, J. Geophys. Res.-Atmos., 111, D23s14, https://doi.org/10.1029/2006jd007593, 2006.
Petit, J. E., Amodeo, T., Meleux, F., Bessagnet, B., Menut, L., Grenier, D., Pellan, Y., Ockler, A., Rocq, B., Gros, V., Sciare, J., and Favez, O.: Characterising an intense PM pollution episode in March 2015 in France from multi-site approach and near real time data: Climatology, variabilities, geographical origins and model evaluation, Atmos. Environ., 155, 68–84, https://doi.org/10.1016/j.atmosenv.2017.02.012, 2017.
Phillips, G. J., Thieser, J., Tang, M., Sobanski, N., Schuster, G., Fachinger, J., Drewnick, F., Borrmann, S., Bingemer, H., Lelieveld, J., and Crowley, J. N.: Estimating N2O5 uptake coefficients using ambient measurements of NO3, N2O5, ClNO2 and particle-phase nitrate, Atmos. Chem. Phys., 16, 13231–13249, https://doi.org/10.5194/acp-16-13231-2016, 2016.
Platt, U., Perner, D., Schroder, J., Kessler, C., and Toennissen, A.: The Diurnal-Variation of NO3, J. Geophys. Res.-Oceans, 86, 1965–1970, https://doi.org/10.1029/JC086iC12p11965, 1981.
Platt, U. F., Winer, A. M., Biermann, H. W., Atkinson, R., and Pitts, J. N.: Measurement of nitrate radical concentrations in continental air, Environ. Sci. Technol., 18, 365–369, https://doi.org/10.1021/es00123a015, 1984.
Pritchard, H.: The nitrogen pentoxide dissociation equilibrium, Int. J. Chem. Kinet., 26, 61–71, https://doi.org/10.1002/kin.550260108, 1994.
Stutz, J., Alicke, B., Ackermann, R., Geyer, A., White, A., and Williams, E.: Vertical profiles of NO3, N2O5, O3, and NOx in the nocturnal boundary layer: 1. Observations during the Texas Air Quality Study 2000, J. Geophys. Res.-Atmos., 109, D12306, https://doi.org/10.1029/2003jd004209, 2004.
Vrekoussis, M., Mihalopoulos, N., Gerasopoulos, E., Kanakidou, M., Crutzen, P. J., and Lelieveld, J.: Two-years of NO3 radical observations in the boundary layer over the Eastern Mediterranean, Atmos. Chem. Phys., 7, 315–327, https://doi.org/10.5194/acp-7-315-2007, 2007.
Wagner, N. L., Riedel, T. P., Young, C. J., Bahreini, R., Brock, C. A., Dubé, W. P., Kim, S., Middlebrook, A. M., Öztürk, F., Roberts, J. M., Russo, R., Sive, B., Swarthout, R., Thornton, J. A., VandenBoer, T. C., Zhou, Y., and Brown, S. S.: N2O5 uptake coefficients and nocturnal NO2 removal rates determined from ambient wintertime measurements, J. Geophys. Res.-Atmos., 118, 9331–9350, https://doi.org/10.1002/jgrd.50653, 2013.
Wahner, A., Mentel, T. F., Sohn, M., and Stier, J.: Heterogeneous reaction of N2O5 on sodium nitrate aerosol, J. Geophys. Res.-Atmos., 103, 31103–31112, https://doi.org/10.1029/1998jd100022, 1998.
Wang, H., Lu, K., Chen, X., Zhu, Q., Chen, Q., Guo, S., Jiang, M., Li, X., Shang, D., Tan, Z., Wu, Y., Wu, Z., Zou, Q., Zheng, Y., Zeng, L., Zhu, T., Hu, M., and Zhang, Y.: High N2O5 Concentrations Observed in Urban Beijing: Implications of a Large Nitrate Formation Pathway, Environ. Sci. Tech. Lett., 4, 416–420, https://doi.org/10.1021/acs.estlett.7b00341, 2017a.
Wang, H., Lu, K., Guo, S., Wu, Z., Shang, D., Tan, Z., Wang, Y., Le Breton, M., Lou, S., Tang, M., Wu, Y., Zhu, W., Zheng, J., Zeng, L., Hallquist, M., Hu, M., and Zhang, Y.: Efficient N2O5 uptake and NO3 oxidation in the outflow of urban Beijing, Atmos. Chem. Phys., 18, 9705–9721, https://doi.org/10.5194/acp-18-9705-2018, 2018.
Wang, H., Chen, X., Lu, K., Hu, R., Li, Z., Wang, H., Ma, X., Yang, X., Chen, S., Dong, H., Liu, Y., Fang, X., Zeng, L., Hu, M., and Zhang, Y.: NO3 and N2O5 chemistry at a suburban site during the EXPLORE-YRD campaign in 2018, Atmos. Environ., 224, 117180, https://doi.org/10.1016/j.atmosenv.2019.117180, 2020a.
Wang, H., Chen, X., Lu, K., Tan, Z., Ma, X., Wu, Z., Li, X., Liu, Y., Shang, D., Wu, Y., Zeng, L., Hu, M., Schmitt, S., Kiendler-Scharr, A., Wahner, A., and Zhang, Y.: Wintertime N2O5 uptake coefficients over the North China Plain, Sci. Bull., 65, 765–774, https://doi.org/10.1016/j.scib.2020.02.006, 2020b.
Wang, J., Zhao, B., Wang, S., Yang, F., Xing, J., Morawska, L., Ding, A., Kulmala, M., Kerminen, V.-M., Kujansuu, J., Wang, Z., Ding, D., Zhang, X., Wang, H., Tian, M., Petäjä, T., Jiang, J., and Hao, J.: Particulate matter pollution over China and the effects of control policies, Sci. Total Environ., 584–585, 426–447, https://doi.org/10.1016/j.scitotenv.2017.01.027, 2017b.
Wang, S., Shi, C., Zhou, B., Zhao, H., Wang, Z., Yang, S., and Chen, L.: Observation of NO3 radicals over Shanghai, China, Atmos. Environ., 70, 401–409, https://doi.org/10.1016/j.atmosenv.2013.01.022, 2013.
Wang, X., Wang, H., Xue, L., Wang, T., Wang, L., Gu, R., Wang, W., Tham, Y. J., Wang, Z., Yang, L., Chen, J., and Wang, W.: Observations of N2O5 and ClNO2 at a polluted urban surface site in North China: High N2O5 uptake coefficients and low ClNO2 product yields, Atmos. Environ., 156, 125–134, https://doi.org/10.1016/j.atmosenv.2017.02.035, 2017c.
Wang, Y., Yao, L., Wang, L., Liu, Z., Ji, D., Tang, G., Zhang, J., Sun, Y., Hu, B., and Xin, J.: Mechanism for the formation of the January 2013 heavy haze pollution episode over central and eastern China, Sci. China Earth Sci., 57, 14–25, https://doi.org/10.1007/s11430-013-4773-4, 2014.
Wang, Z., Wang, W., Tham, Y. J., Li, Q., Wang, H., Wen, L., Wang, X., and Wang, T.: Fast heterogeneous N2O5 uptake and ClNO2 production in power plant and industrial plumes observed in the nocturnal residual layer over the North China Plain, Atmos. Chem. Phys., 17, 12361–12378, https://doi.org/10.5194/acp-17-12361-2017, 2017.
Yan, C., Tham, Y. J., Zha, Q. Z., Wang, X. F., Xue, L. K., Dai, J. N., Wang, Z., and Wang, T.: Fast heterogeneous loss of N2O5 leads to significant nighttime NOx removal and nitrate aerosol formation at a coastal background environment of southern China, Sci. Total Environ., 677, 637–647, https://doi.org/10.1016/j.scitotenv.2019.04.389, 2019.
Yu, C., Wang, Z., Xia, M., Fu, X., Wang, W., Tham, Y. J., Chen, T., Zheng, P., Li, H., Shan, Y., Wang, X., Xue, L., Zhou, Y., Yue, D., Ou, Y., Gao, J., Lu, K., Brown, S. S., Zhang, Y., and Wang, T.: Heterogeneous N2O5 reactions on atmospheric aerosols at four Chinese sites: improving model representation of uptake parameters, Atmos. Chem. Phys., 20, 4367–4378, https://doi.org/10.5194/acp-20-4367-2020, 2020.