the Creative Commons Attribution 4.0 License.
the Creative Commons Attribution 4.0 License.
 | 09 Mar 2022
Atmospheric measurements at Mt. Tai – Part I: HONO formation and its role in the oxidizing capacity of the upper boundary layer
Chaoyang Xue
Jörg Kleffmann
Chenglong Zhang
Valéry Catoire
Fengxia Bao
Abdelwahid Mellouki
Likun Xue
Jianmin Chen
Keding Lu
Yong Zhao
Hengde Liu
Zhaoxin Guo
A comprehensive field campaign, with measurements of HONO and related parameters, was conducted in summer 2018 at the foot (150 m a.s.l.) and the summit (1534 m a.s.l.) of Mt. Tai (Shandong province, China). At the summit station, high HONO mixing ratios were observed (mean ± 1σ: 133 ± 106 pptv, maximum: 880 pptv), with a diurnal noontime peak (mean ± 1σ: 133 ± 72 pptv at 12:30 local time). Constraints on the kinetics of aerosol-derived HONO sources (NO2 uptake on the aerosol surface and particulate nitrate photolysis) were performed and discussed, which enables a better understanding of the interaction of HONO and aerosols, especially in the polluted North China Plain. Various evidence of air mass transport from the ground to the summit level was provided. Furthermore, daytime HONO formation from different paths and its role in radical production were quantified and discussed.
We found that the homogeneous reaction NO + OH could only explain 8.0 % of the daytime HONO formation, resulting in strong unknown sources (Pun). Campaigned-averaged Pun was about 290 ± 280 pptv h−1, with a maximum of about 1800 pptv h−1. Aerosol-derived HONO formation mechanisms were not the major sources of Pun at the summit station. Their contributions to daytime HONO formation varied from negligible to moderate (similar to NO + OH), depending on the chemical kinetic parameters used. Coupled with sensitivity tests on the kinetic parameters used, the NO2 uptake on the aerosol surface and particulate nitrate photolysis contributed 1.5 %–19 % and 0.6 %–9.6 % of the observed Pun, respectively. Based on synchronous measurements at the foot and the summit station, an amount of field evidence was proposed to support the finding that the remaining majority (70 %–98 %) of Pun was dominated by the rapid vertical transport from the ground to the summit level and heterogeneous formation on the mountain surfaces during transport.
HONO photolysis at the summit level initialized daytime photochemistry and still represented an essential OH source in the daytime, with a contribution of about one-quarter of O3. We provided evidence that ground-derived HONO played a significant role in the oxidizing capacity of the upper boundary layer through the enhanced vertical air mass exchange driven by mountain winds. The follow-up impacts should be considered in regional chemistry transport models.
- Article
(6589 KB) - Full-text XML
- Companion paper
-
Supplement
(1038 KB) - BibTeX
- EndNote


In the past 2 decades, atmospheric nitrous acid (HONO) has attracted numerous laboratory experiments and field campaigns because of its significant contribution to the production of hydroxyl radicals (OH) and the incomplete understanding of its sources (Kleffmann, 2007). Besides the homogeneous reaction of NO with OH, various HONO formation pathways were proposed, including (a) emissions from combustion processes, e.g., vehicle exhaust, domestic combustion and biomass burning (Klosterköther et al., 2021; Kramer et al., 2020; Kurtenbach et al., 2001; Liu et al., 2017; Peng et al., 2020; Theys et al., 2020); (b) dark and photosensitized heterogeneous reactions of NO2 on surfaces, such as soot (Ammann et al., 1998; Monge et al., 2010), organic compounds (George et al., 2005; Han et al., 2017; Stemmler et al., 2006, 2007), acids (Kleffmann et al., 1998), urban grime (J. Liu et al., 2019), MgO (Ma et al., 2017), mineral dust (Ndour et al., 2008), and vegetation leaves (Marion et al., 2021); (c) photolytic reactions of total nitrate (particulate nitrate and adsorbed nitric acid) (Bao et al., 2018; Laufs and Kleffmann, 2016; Ye et al., 2016; Zhou et al., 2003, 2011) and ortho-nitrophenols (Bejan et al., 2006); and (d) emissions from soil (Donaldson et al., 2014; Oswald et al., 2013; Su et al., 2011; Xue et al., 2019a). Though many potential HONO sources have been identified in the past, there is still a significant gap between model results and observations (Fu et al., 2019; Liu et al., 2017; Xue et al., 2020; Zhang et al., 2019a, b). One of the critical puzzles is the quantity of HONO formation from the aerosol-derived sources, particularly NO2 uptake on aerosol surfaces and aerosol nitrate photolysis in high-aerosol regions such as the North China Plain (NCP).
The NO2 uptake on aerosol surfaces was proposed to be much less important than that on ground surfaces in previous studies because of the low (surface-to-volume ratio) of particles compared to ground surfaces and the similar reaction kinetic parameters on the same types of surfaces (Nie et al., 2015; Stemmler et al., 2007). However, the contribution of NO2 uptake on aerosol surfaces to HONO formation in the extremely polluted region is not well constrained. For example, previous studies using box models or regional transport chemistry models found that NO2 uptake on aerosol surfaces led to a negligible impact on daytime HONO formation in the polluted NCP (Y. Liu et al., 2019; Xue et al., 2020; Zhang et al., 2019a, b). Nevertheless, a recent chamber study (Ge et al., 2019) found a high dark NO2 uptake coefficient (2.0 × 10⁻⁵ to 1.7 × 10⁻⁴) on NaCl particles under high RH (90 %), NH3 (50–2000 ppbv), and SO2 (600 ppbv) conditions. First, such severe pollution rarely occurred. Second, if such a high NO2 coefficient on the aerosol surface was applied in nighttime HONO budget analysis, the dominant role of NO2 uptake on the ground surface in nighttime HONO formation, which was already generally accepted, might be challenged (Kleffmann, 2007; Kurtenbach et al., 2001; Stutz et al., 2002; Xue et al., 2020). In addition, recent nocturnal vertical measurements of HONO in Beijing found that both ground-based and aerosol-derived sources may play important roles in HONO formation during the clean period and haze period, respectively (Meng et al., 2020). Therefore, the contribution of NO2 uptake on the aerosol surface to HONO formation still needs more field constraints.
The photolysis of particulate nitrate (pNO3) was found to be an important HONO source in low-NOx areas such as forest canopy and the marine boundary layer. High enhancement factors (EFs , within the range of tens to thousands, were proposed in forest areas, the marine boundary layer, and polluted areas like the NCP (Bao et al., 2020; Ye et al., 2016, 2017; Zhou et al., 2007, 2011). However, model studies with field constraints (Romer et al., 2018; Xue et al., 2020) found that the EF was moderate (7–30) rather than tens to thousands obtained in laboratory studies (Bao et al., 2020; Ye et al., 2016, 2017; Zhou et al., 2007). Moreover, a recent laboratory flow tube study (Wang et al., 2021) revealed that the EF was lower than 1 in the aqueous phase. Another flow tube study (Laufs and Kleffmann, 2016) also reported a slow HONO formation from secondary heterogeneous reactions of NO2 produced during HNO3 photolysis. In addition, a recent chamber study (Shi et al., 2021) found that the EF values of airborne nitrate were lower than 10 (generally around 1), which also indicates an insignificant contribution of nitrate photolysis to HONO formation. Furthermore, when considering the large variation of EF values (from digits to thousands) in the model, model performance on HONO simulations could be improved but was accompanied by large uncertainties (Fu et al., 2019; Y. Liu et al., 2019b; Zhang et al., 2021). Therefore, HONO formation from nitrate photolysis also needs more field constraints.
Moreover, the role of HONO photolysis in the oxidizing capacity of the upper boundary layer remains unclear. As there is a significant gradient in HONO distribution, HONO photolysis was found to be much less important compared to O3 photolysis in the upper boundary layer compared to the lower boundary layer (Ye et al., 2018; Zhang et al., 2009). However, in mountainous regions, mountain winds, including mountain breeze (downslope) and valley breeze (upslope) can accelerate the air mass exchange between the mountain summit and the ground levels, which may affect HONO levels and the atmospheric oxidizing capacity at the summit level (Jiang et al., 2020; Schmid et al., 2020; Ye et al., 1987).
Atmospheric measurements at the foot (∼ 150 m a.s.l.) and the summit (∼ 1534 m a.s.l.) of Mt. Tai were conducted in summer 2018 and presented in this study. Comprehensive measurements allow us to understand more about (1) the transport of ground-formed HONO and its role in the upper boundary layer, (2) HONO formation from the aerosol-derived sources as the ground-derived sources might be less effective compared to measurements near to ground surface, and (3) the oxidizing capacity of the upper boundary layer and its contributors.
2.1 Site description
HONO was alternately measured at two locations: the foot and the summit of Mt. Tai (Figs. 1 and S1). The foot station is inside the Shandong College of Electric Power, a typical urban site (36.18∘ N, 117.11∘ E). HONO, volatile organic compounds (VOCs), oxygenated VOCs (OVOCs), CO, O3, SO2, NOx, PM2.5, PM10, J(NO2), and meteorological parameters were continuously measured at this station. Details about the foot station and the instruments used can be found in the companion study (Xue et al., 2022). The summit station (36.23∘ N, 117.11∘ E) is located inside a meteorological observatory at the eastern part of the summit of Mt. Tai, with an altitude of about 1534 m a.s.l. It is in the north part of Tai'an (altitude: ∼ 150 m, population: ∼ 5.6 million), and about 60 km south of Jinan (the capital city of Shandong province, altitude: ∼ 20 m, population: ∼ 8.7 million).
Since Mt. Tai is a famous tourist place, most of the tourist activities on the summit happen around the Southern Heavenly Gate, the Bixia Temple, and the Jade Emperor Peak. The most crowded period is around sunrise, when visitors come for the view of sunrise. The Southern Heavenly Gate is about 1 km west of and about 100 m lower than our station. There are several small restaurants nearby, but they do not cause significant emissions as they only use electricity for their energy supply. The Bixia Temple is about 200 m west to and about 50 m lower than our station, and small anthropogenic emissions may be produced here because of the incense burning, but the impact on our measurements is expected to be negligible as a result of the fast dilution process at the summit level. The Jade Emperor Peak is about 200 m northwest of and has a similar altitude to our station. Visitors generally stay there for a short time and do not conduct activities that may produce significant emissions. A detailed discussion about the influence of anthropogenic emissions at the summit level on our measurements is presented in Sect. 3.2.1.
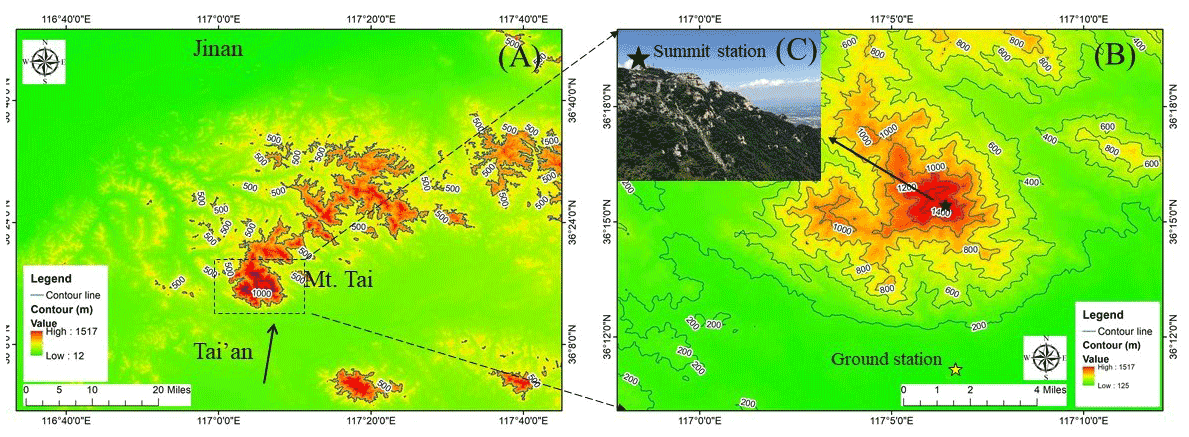
Figure 1Locations of Mt. Tai, the summit station, and the ground station. (a) Locations of Mt. Tai and nearby cities (Tai'an and Jinan) colored by altitude; the black arrow represents the dominated wind direction. (b) Contour map of Mt. Tai; the black and yellow stars represent the locations of the summit and the ground stations, respectively. (c) A view of the station from the southwest. Map data were taken from the National Catalogue Service for Geographic Information (https://www.webmap.cn, last access: 7 March 2022). Photo copyright: Chaoyang Xue.
2.2 Instrumentation
During the campaign, HONO was continuously measured by the LOPAP instrument (LOng Path Absorption Photometer, Model-03, QUMA GmbH, Germany) with a detection limit of 1.5 pptv for 5 min on average (Heland et al., 2001; Kleffmann et al., 2006). The performance of LOPAP was well assessed and recorded in different environmental conditions (Heland et al., 2001), including low-NOx and high-altitude sites (Kleffmann and Wiesen, 2008). In addition, this LOPAP has been successfully used in our previous studies (Xue et al., 2019b, 2020). The LOPAP instrument was installed at the foot station from 29 May to 8 July 2017 and then transported to the summit station with successful measurements from 9 to 31 July 2017. At the summit station, a temperature-controlled measurement container was used to house all the instruments. The external sampling unit of LOPAP was installed on the top of the container, about 2.5 m above the ground surface. Zero air (ultrapure N2) measurements were conducted two or three times per day. Liquid calibration with diluted standard nitrite solution (Sigma-Aldrich) was conducted every week. Both zero air measurements and liquid calibration were conducted after changing any solution, cleaning the instrument, or replacing any component of the instrument (the air pump was broken on 21 July and replaced by a new one on 25 July). The precision of the instrument determined from 2σ noise of the calibration was 1 %. An accuracy of 7 % was determined by error propagation including all known uncertainties, i.e., the concentration of the calibration standard (±3 %–4 %) and the liquid (±1 %) and gas flow (±2 %) rates. Known artificial HONO formation on inlet surfaces (e.g., Zhou et al., 2002) was minimized by using the external sampling unit, with only a 3 cm sunlight-shielded glass inlet to the ambient atmosphere. Other interferences were considered of minor importance, as they were corrected for by the two-channel concept of the instrument. In addition, excellent agreement between LOPAP and differential optical absorption spectroscopy (DOAS) techniques was observed under complex conditions in a smog chamber and in the ambient atmosphere (Kleffmann et al., 2006). NO2 was measured by a Model T500U CAPS NO2 analyzer (Teledyne API, USA) that utilizes a patented Cavity Attenuated Phase Shift (CAPS) technique to measure NO2 in the air directly. NO and NOy were measured by an API T200U NOy analyzer (Teledyne API, USA) based on the chemiluminescence principle coupled with a remote NOy converter via umbilical cable to allow for measurements with a lower detectable limit of 50 pptv. PM2.5 was measured by a SHARP 5030 monitor (Thermo Scientific, USA). CO and SO2 were measured by a T300U-CO monitor (Teledyne API, USA) and a Model 43C SO2 monitor (Thermo Scientific, USA), respectively. J(NO2) was measured by a 4-π J(NO2) filter radiometer (Metcon GmbH, Germany). Other J values used in this study, including J(HONO), J(O(1D)), and J(HNO3), are calculated by the trigonometric solar zenith angle (SZA) function (MCM default photolysis frequency calculation; see the companion paper and Jenkin et al., 1997) and scaled by the measured J(NO2). For instance, J(HONO) = J(HONO)model × J(NO2)(NO2)model.
Water-soluble ions, including particulate nitrate (pNO3) of PM2.5, were collected by filter method and analyzed by an ion chromatograph (Liu et al., 2020) every 2 h late June and early July, but it suffered a sampling problem after 12 July. Aerosol size (13.6–763.5 nm) distribution was measured by a scanning mobility particle sizer (SMPS; Model 3938, TSI Inc., USA) equipped with a differential mobility analyzer (DMA; Model 3082, TSI Inc., USA) and a condensation particle counter (CPC; Model 3775, TSI Inc., USA). Meteorological parameters (temperature, relative humidity, wind speed, and wind direction) were measured by instruments from the Shandong Taishan Meteorological Station simultaneously, and details can be found in previous studies at this station (Jiang et al., 2020). In this study, 10 min averaged data were used for the following analysis. Details about the instrumentation at the foot station can be found in the companion ACP paper. Measurements at the foot station ended on 16 July. To compare pollutants between the foot and the summit levels during the same period (Sect. 3.2.2), measurements (only hourly CO, NO2, PM2.5, PM10, O3, and SO2 were available) from the monitoring station (∼ 200 m east to the foot station) were used.
3.1 Overview of the observations
Figure 2 shows the meteorological parameters measured at the summit of Mt. Tai during the campaign. The air temperature (T in ∘ C) was slightly lower (∼ 17 ∘C) in the first 2 d compared to the period after 10 July (∼ 20 ∘C). As clouds were frequently formed at the summit (Li et al., 2020), the observed relative humidity (RH) commonly reached 100 %, with a mean of 96 %. Based on the wind measurements, air mass at the summit mainly came from the south (direction of Tai'an), with a mean wind speed (WS) of 5.1 m s−1. In particular, during the period of 23 to 26 July, high wind speed (1 min max: 19.5 m s−1, 10 min max: 18.5 m s−1) was observed, accompanied by a relatively low temperature, low pressure (p), low radiation (J(NO2)), and high RH.
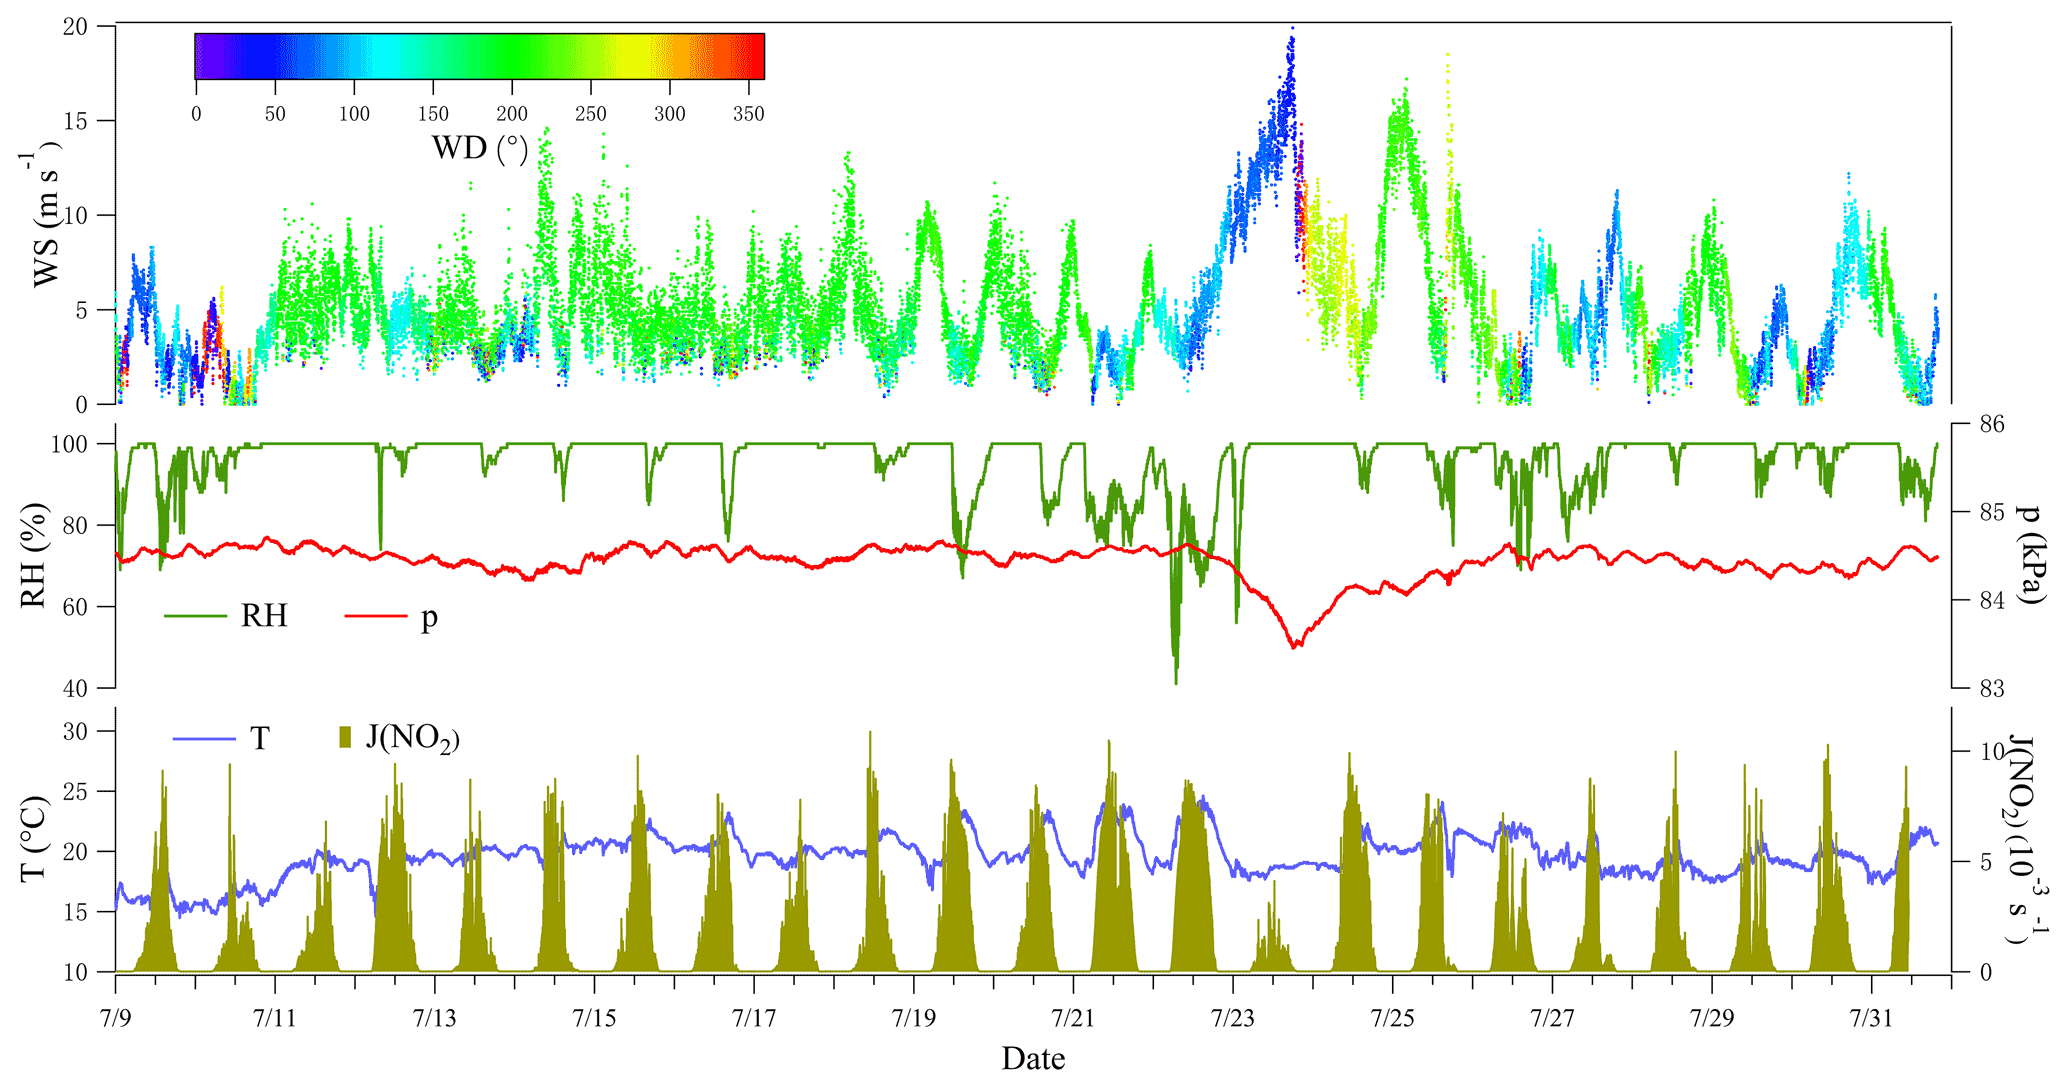
Figure 3 illustrates the time series of HONO and related pollutants measured at the summit station. Several pollution events were observed. For example, the measured daytime PM2.5 was generally larger than 20 µg m−3, and high SO2 mixing ratios (> 1 ppbv) were observed during the daytime on some days (i.e., from 14 to 26 July). NO mixing ratios were generally lower than 0.5 ppbv due to significant suppression by high O3 levels of usually higher than 50 ppbv. NO2 was generally lower than 2 ppbv with several events, during which NO2 was relatively high. In addition, the measured HONO mixing ratio varied from 1.1 pptv (close to the detection limit) to 880 pptv, with a mean of 133 pptv and a median of 101 pptv, respectively (Table 1). For the same sampling site at the summit of Mt. Tai, as listed in Table 2, the observed mean HONO mixing ratio in summer is similar to those observed in winter (150 pptv, December 2017) and spring (130 pptv, March–April 2018) reported by Jiang et al. (2020), but the variation of HONO mixing ratios in summer was within a much narrower range (1–880 pptv) than in winter (0–1140 pptv) and spring (0.5–3230 pptv). With an exception for relatively lower HONO levels at altitudes higher than 2000 m or in the free troposphere (Ye et al., 2018), HONO mixing ratios are significantly higher at the summit of Mt. Tai than at other mountain sites (Table 2). For example, mean HONO mixing ratios observed at Mt. Whiteface in the USA (Zhou et al., 2007) and Mt. Hohenpeissenberg in Germany (Acker et al., 2006) were 46 and 100 (daytime)/30 (nighttime) pptv, respectively. This phenomenon could be explained by fewer human activities around these mountains, while Mt. Tai is located in the middle of the NCP, with a relatively high pollution level.
Note that high HONO mixing ratios were observed during the period from 14 to 26 July, with the co-occurrence of high SO2 (a primary pollutant generally emitted at the ground level with a relatively short lifetime). To better understand HONO formation and its role at different pollution levels, data were classified into two periods: high HONO period (HP; 14 to 26) and low HONO period (LP) that covers all the other days. Statistics of observations during the two periods are summarized in Table 1. Average HONO, NOy, SO2, and PM2.5 during LP are 76 pptv, 4.7 ppbv, 0.3 ppbv, and 12 µg m−3, respectively, slightly lower than during HP (194 pptv, 7.0 ppbv, 0.8 ppbv, and 17 µg m−3, respectively).
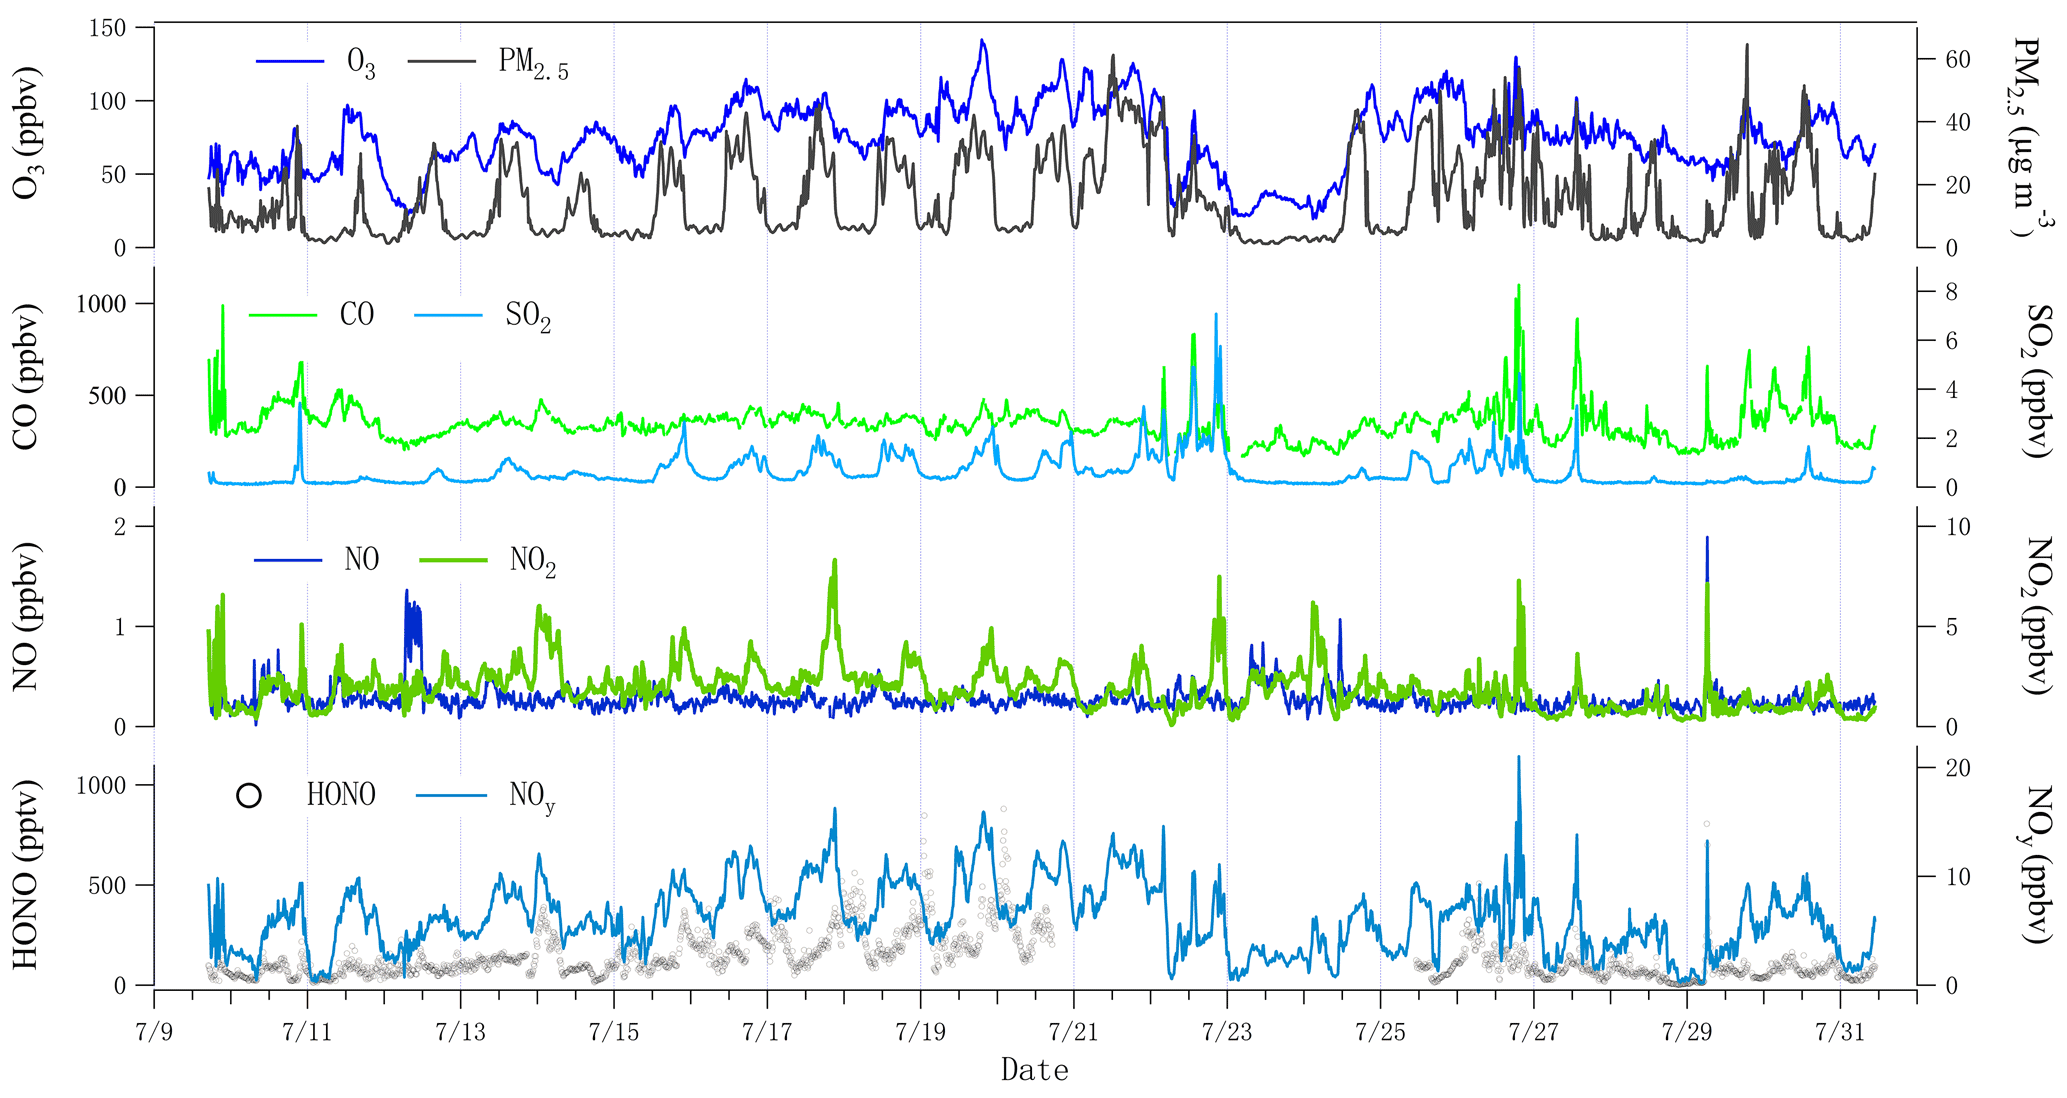
Table 1Statistics of observations from 9 to 31 July 2018 at the summit of Mt. Tai. High HONO period (HP): 14–26 July. Low HONO period (LP): 9–13 and 27–31 July.
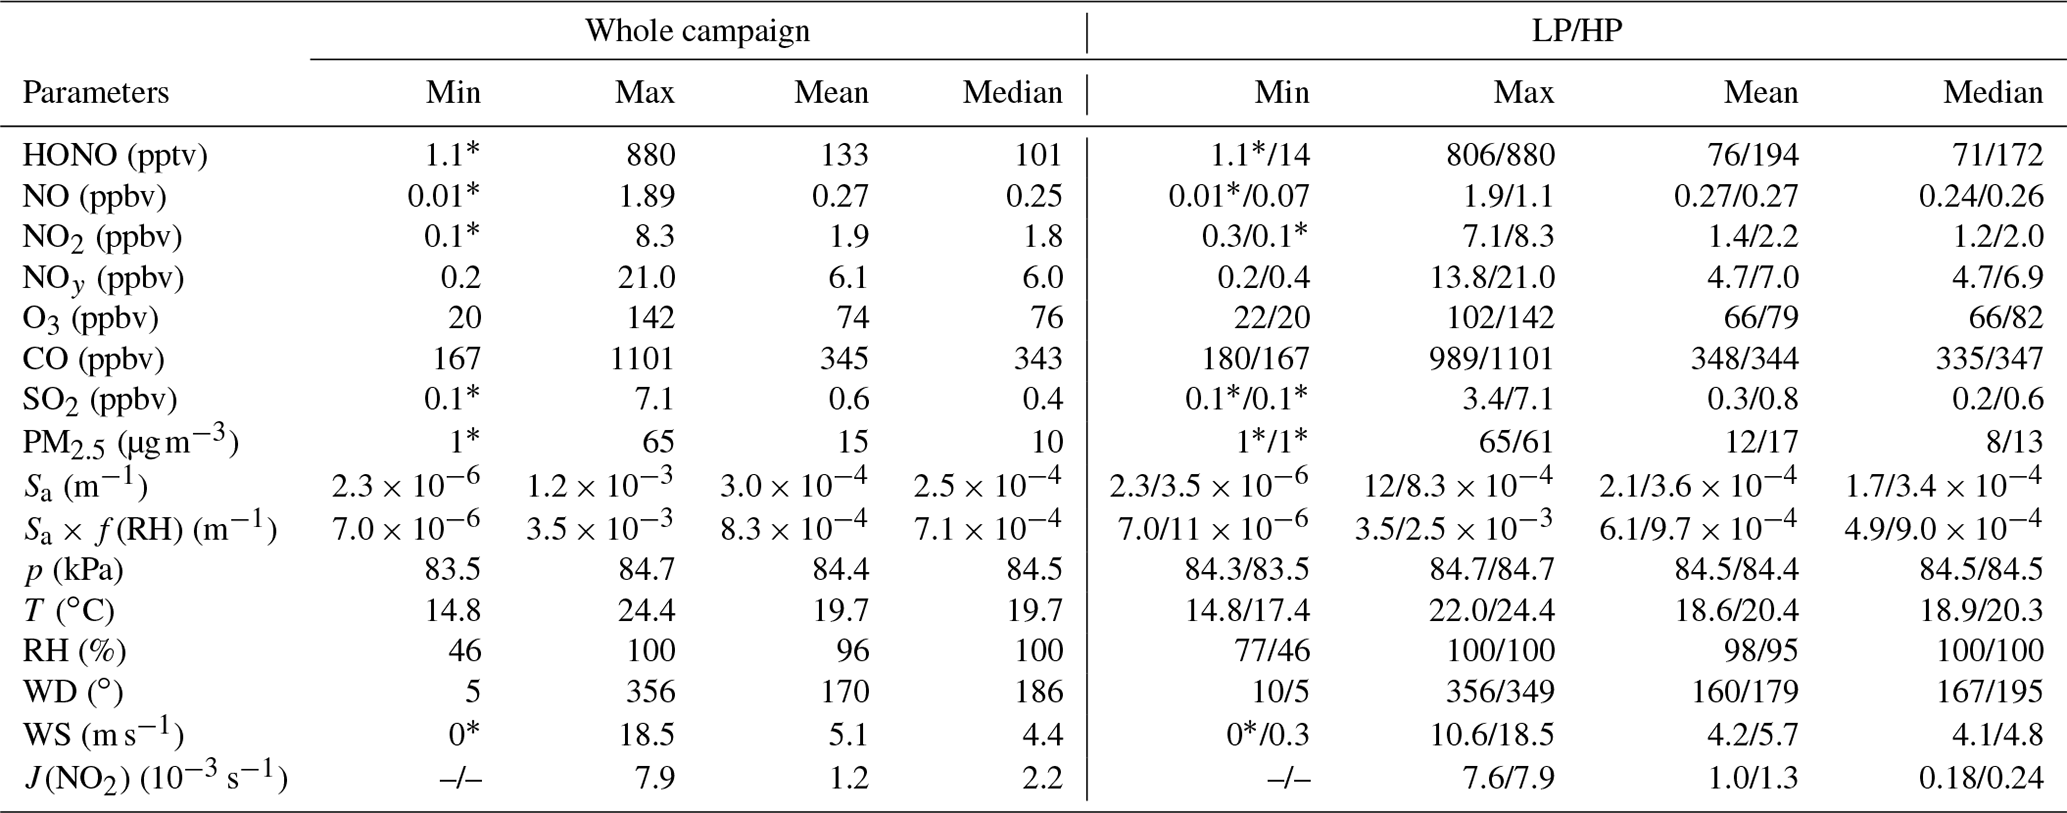
* Near or below the detection limit of the instrument used.
Table 2Summary of ground-based or aircraft-based HONO measurements at background/remote sites (including mountain or pole sites) and cities near Mt. Tai.
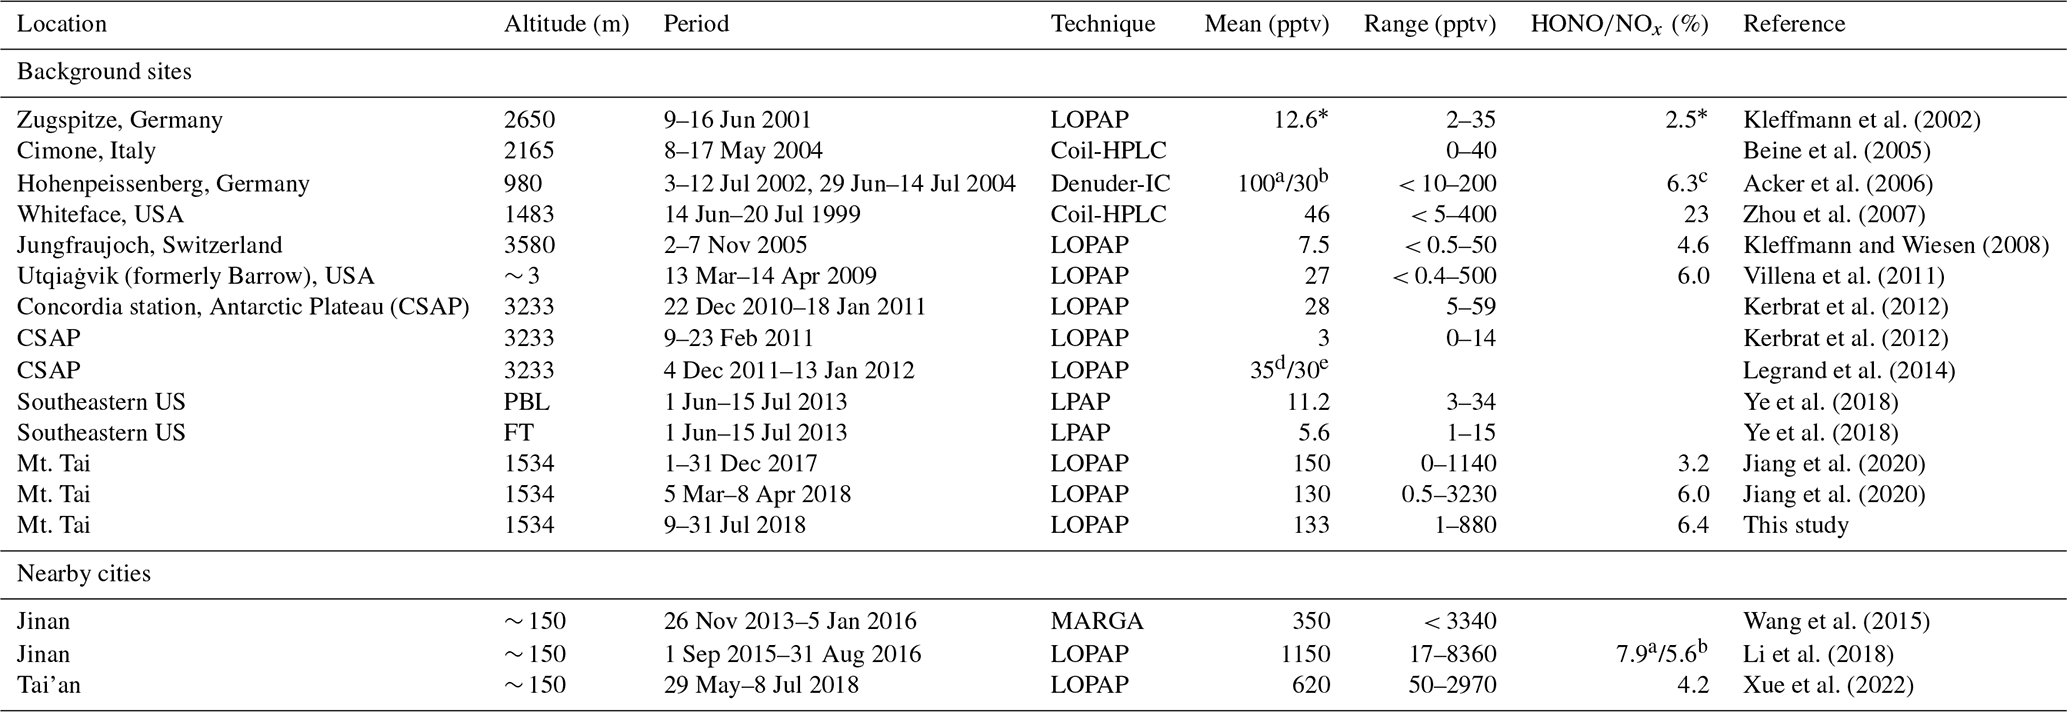
∗ Data published in Kleffmann and
Wiesen (2008) and some unpublished data from the study of
Kleffmann et al. (2002).
a Noontime. b Nighttime. c . d and
e Mean values in December and January, respectively.
PBL and FT: the planetary boundary layer and the free troposphere.
3.2 Impact of anthropogenic emissions on the measured HONO
3.2.1 Impact of emissions at the summit level (1534 m a.s.l.)
High values of are expected in a very fresh plume with significant local emissions. Throughout the campaign, the average ratio was 0.43 ± 0.28, which was much lower than fresh plumes observed in the nearest city of Tai'an, with an average of 0.93 ± 0.05 (from the measurements at the foot station), indicating an aged air mass and a general small impact of nearby anthropogenic emissions at the summit level.
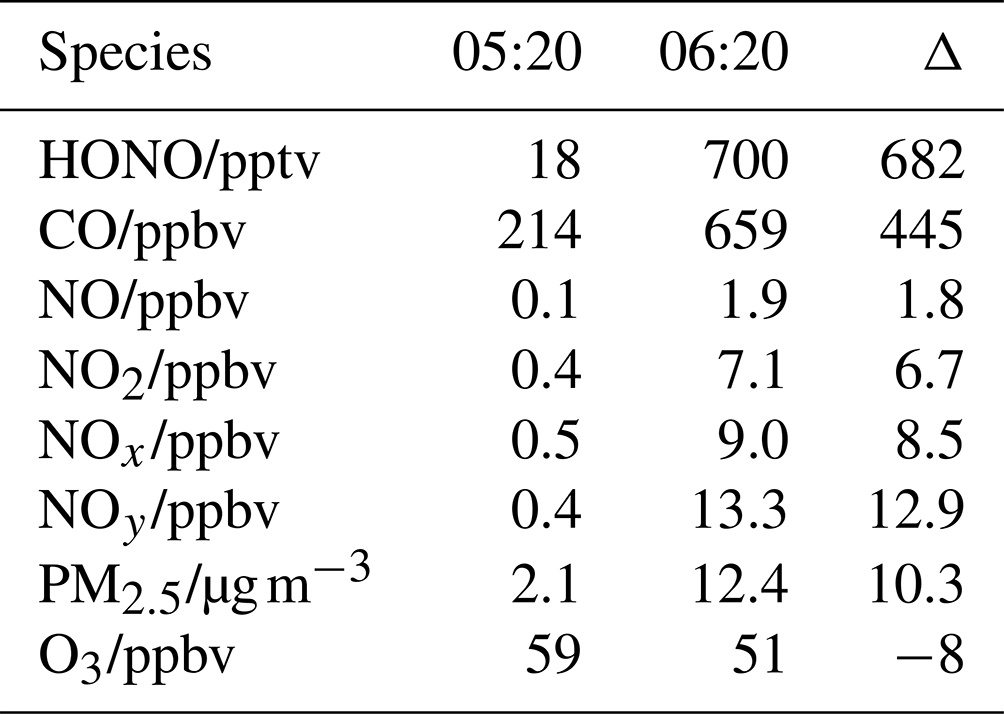
However, regular local emissions may cause rapid increases in some pollutants such as morning peaks. As an example, the most rapid increases in HONO and other pollutants observed between 05:20 and 06:20 on 29 July 2018 are shown in Fig. 4. During this event, HONO rapidly increased from 18 to 700 pptv, in concert with rises in NO, CO, PM2.5, NOx, and NOy but a decrease in O3 (Table 3). The synchronous increase in NO (a primary pollutant of combustion) and decrease in O3 indicate a relatively fresh plume due to the fast titration reaction, as shown in Reaction (R1):
During this event, air mass originated from the south (Fig. 2), the polluted urban region (Fig. S1e in the Supplement) rather than the direction of the potential sources at the summit level. This event lasted about 1.5 h (05:20–06:50), much longer than the duration of the typical fresh plumes observed at the foot station. Furthermore, the ratio of this plume was 0.21, lower than that of the direct emission ratio of ∼ 0.9 (Carslaw and Beevers, 2005; He et al., 2020; Kurtenbach et al., 2012; Wild et al., 2017). This is also lower than that of the close-to-fresh plumes observed at the foot station, with an average ratio of 0.46 ± 0.19 at high O3 levels (Xue et al., 2022). Therefore, we could conclude that the observed plume should originate from the foot urban region rather than nearby emissions at the summit. The within this plume was 8 %, much larger than that inferred from direct emissions (typically inferred as less than 1 %). The ratio could be enhanced by (1) nighttime NO2-to-HONO conversion at the ground level, where the air mass was already aged before being transported to the summit level; (2) in-plume NO2-to-HONO conversion along the mountain slope (rock and vegetation surfaces, etc.); and (3) in-plume NO2-to-HONO conversion on particle surfaces as both the boundary layer height (BLH) elevation and the valley breeze are initialized after sunrise.
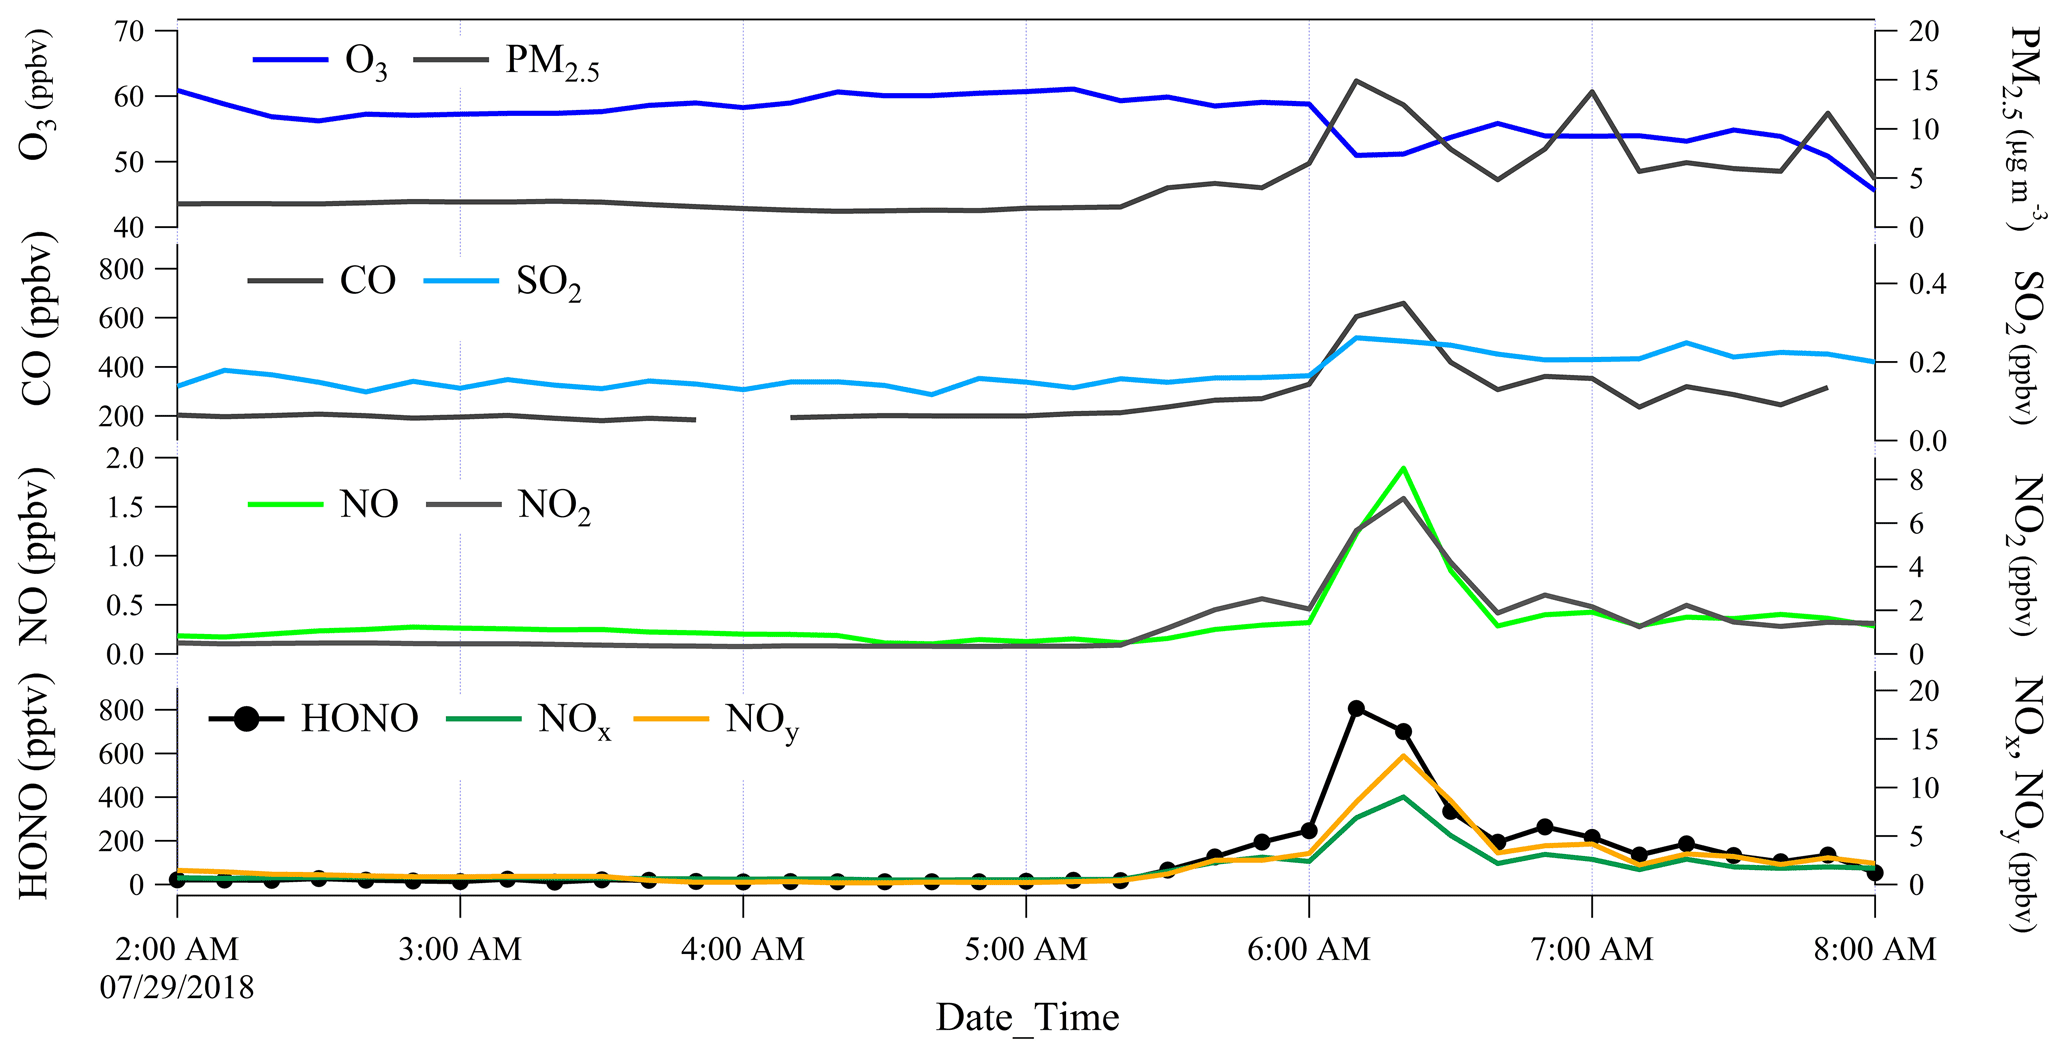
Table 3Concentrations of HONO and related species measured at 05:20 and 06:20 on 29 July 2018.
3.2.2 Impacts from the level below the summit
Insight into the morning peaks of the diurnal profiles
In Fig. 5, the campaign averaged diurnal data are shown, in which most observed species, including HONO, NO, NO2, NOy, CO, and PM2.5, showed small peaks during 06:00–06:30. This suggests a regular process responsible for this phenomenon rather than an accidental event. Note that the sun started to rise and heat the ground surface, as well as the mountain surface, 1 h before those peaks, leading to an increasing BLH (Anisimov et al., 2017). On the other hand, sunrise would initiate the daytime upslope valley breeze wind (Kalthoff et al., 2000; Schmid et al., 2020; Ye et al., 1987), which could also be supported by the increasing pressure and temperature (1 h after sunrise) observed at the summit (Fig. S2). Hence, it can be inferred that the morning peaks resulted from the rising air parcel, within which pollutants accumulated during nighttime. Interestingly, similar morning peaks were also observed in winter and spring (Fig. S3a), indicating the persistent impact of this process.
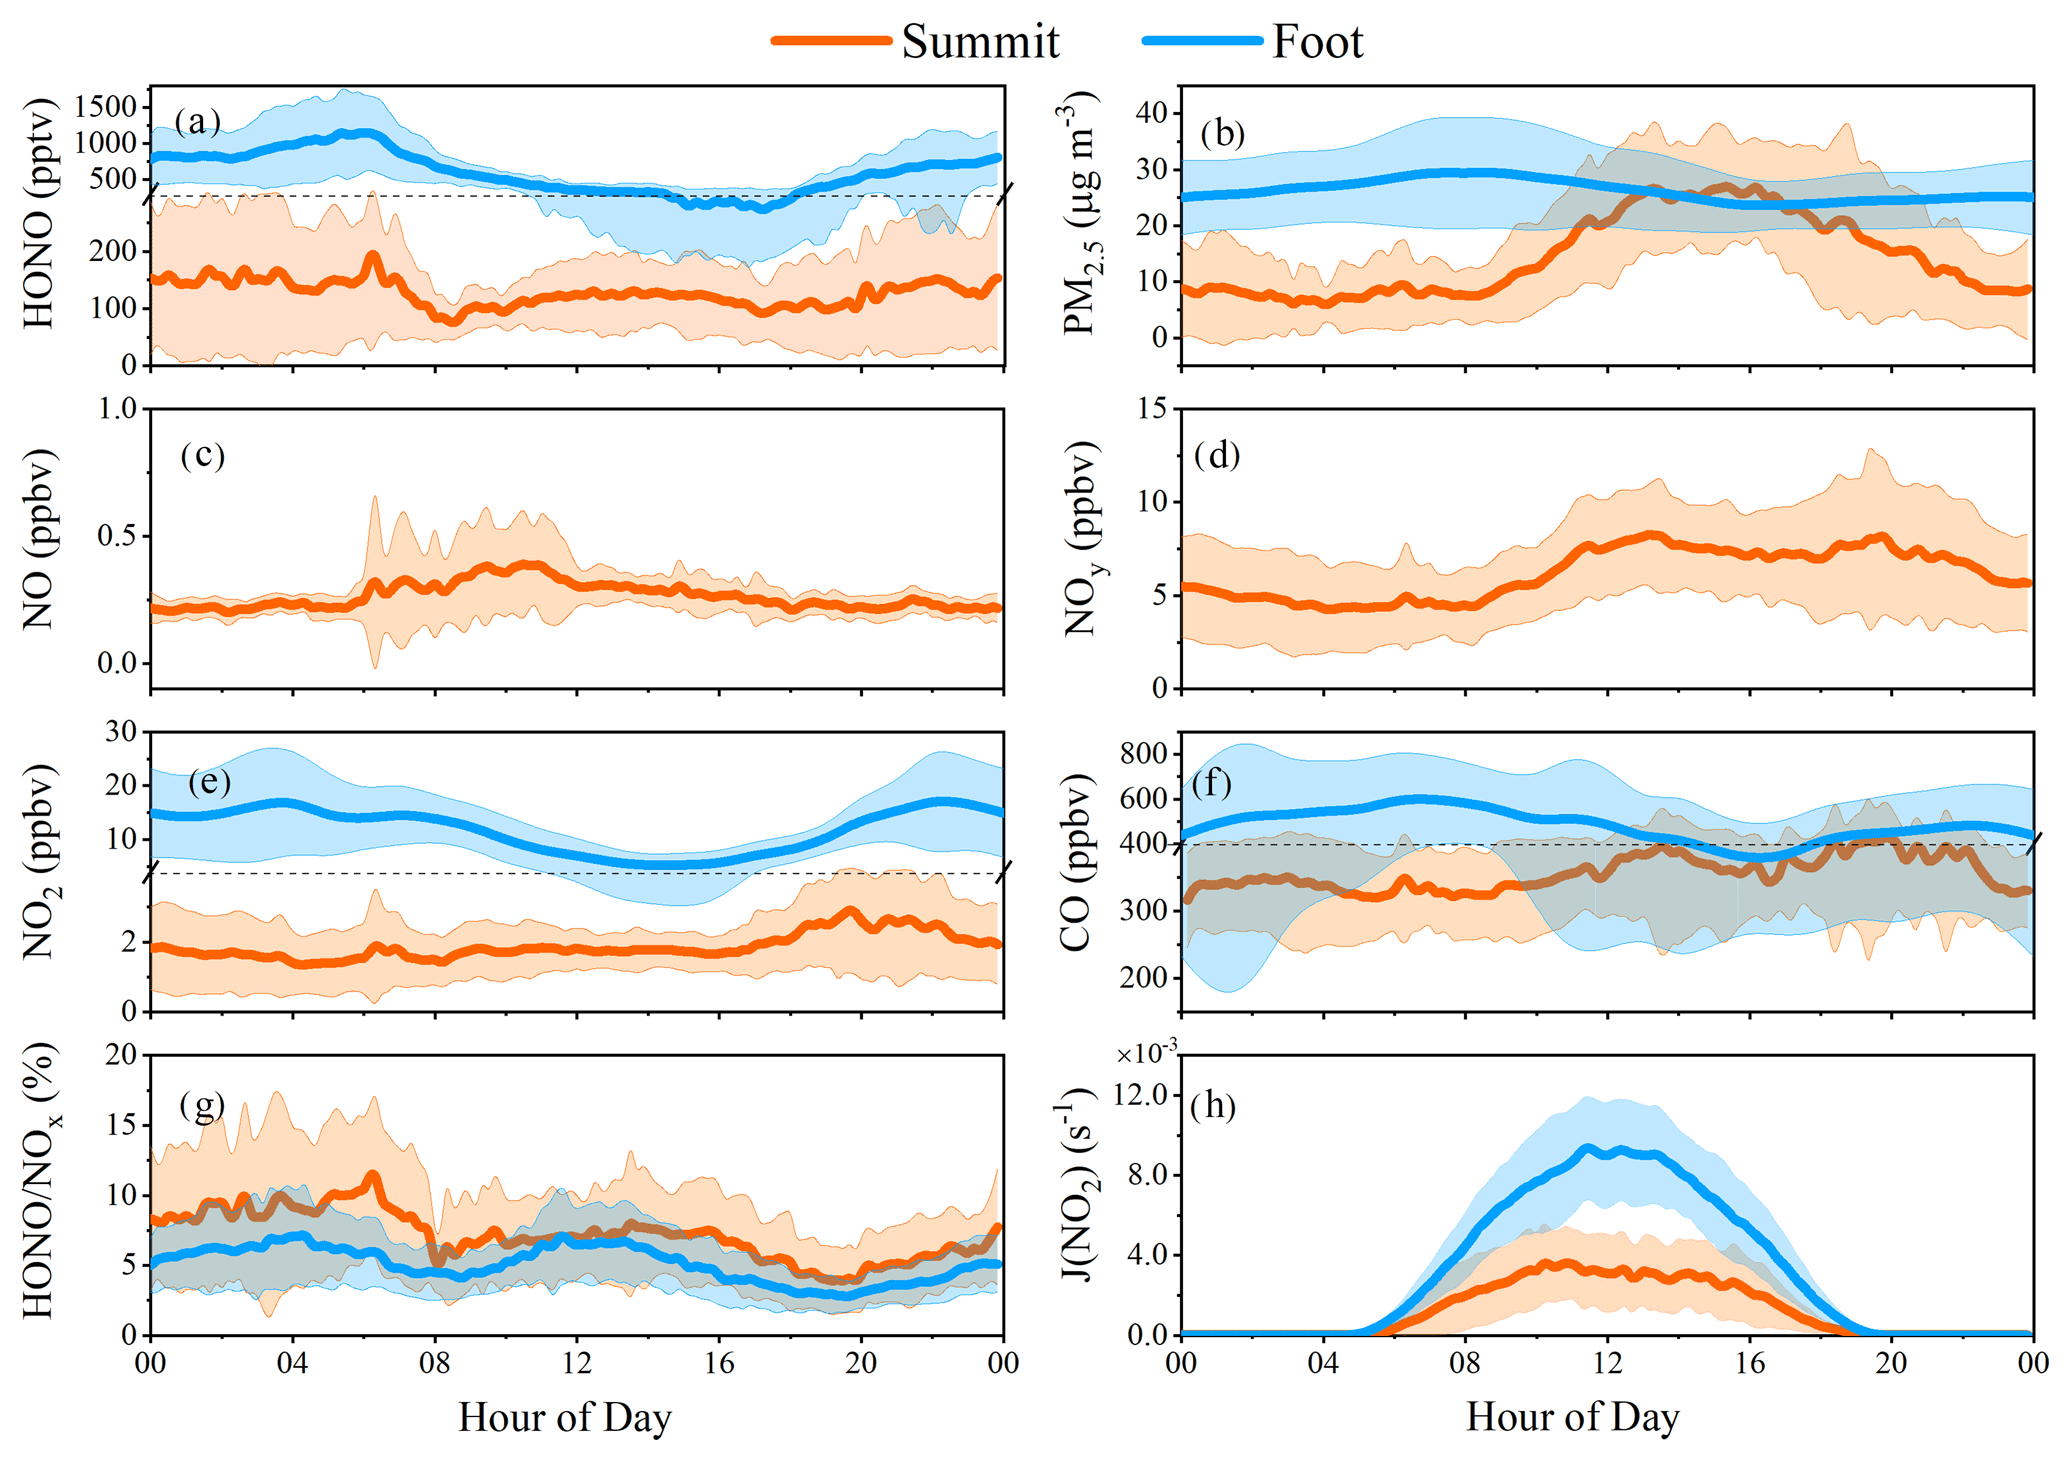
Figure 5Diurnal variations of HONO and related parameters observed at the summit (orange) and the foot (blue) stations. Data for the summit station have a time resolution of 10 min. Hourly PM2.5, NO2, and CO were available but NO and NOy were not available at the foot station during this period. All the data were in the same measurement period from 9 to 31 July, except for HONO, , and J(NO2) for the foot station measured from 29 May to 8 July.
Insight on the seasonal HONO variations
In addition to the morning peaks analysis, seasonal HONO variations at the summit were also summarized (Figs. 6 and S3), including measurements in winter, spring, and summer. Distinctly higher PM2.5 and NO2 were observed in winter (Fig. 6b and c) than in summer. However, HONO levels in winter, spring, and summer were similar (Fig. 6a), indicating that the aerosol-derived sources did not dominate HONO formation at the summit level. In general, HONO levels observed at the ground level of the NCP were significantly higher in winter than in summer (Li et al., 2018; Nie et al., 2015; Xue et al., 2020). A similar HONO level observed in summer was possible because of a more rapid vertical exchange between the ground level and the summit level (see Sect. 3.2.3).

Figure 6Statistic summaries of (a): HONO, (b): PM2.5, and (c): NO2 in the three seasons. Error bars represent the standard deviation. The top and the bottom of each diamond represent the 25 % and 75 % percentages, respectively. The star and the line inside each diamond denote the average and the median, respectively. Data for winter and spring was taken from Jiang et al. (2020).
Insight on the comparison of pollutants at the foot and summit level
Comparison of daytime (05:00–18:00) average PM2.5, CO, O3, and SO2 observed at the foot and the summit station is shown in Fig. 7. It is apparent that all the average daytime levels of primary pollutants (CO and SO2), partially primary pollutant (PM2.5) and secondary pollutant (O3), show very similar variation trends at both monitoring stations, revealing (1) a significant or even dominant impact of pollutants at the foot level on that at the summit level and (2) the presence of a pathway that enables the vertical air mass exchange between the summit and the foot level. This is also consistent with the higher daytime HONO (Fig. S3a) observed at the summit station in winter than in summer because the regional pollution was generally much more severe in winter than in summer.
In addition, during nighttime, the summit (∼ 1500 m altitude) is above the boundary layer (in the residual layer), and similar variation trends of pollutants were also found at the foot and the summit station (Fig. S4), still indicating the presence of vertical air mass exchange at night. This could also be inferred from the higher nighttime HONO (Fig. S3a) in summer than in winter because (1) more south winds (the direction to Tai'an) were observed in summer (Fig. S5) and (2) the nocturnal boundary layer height was generally much lower in winter than that in summer.
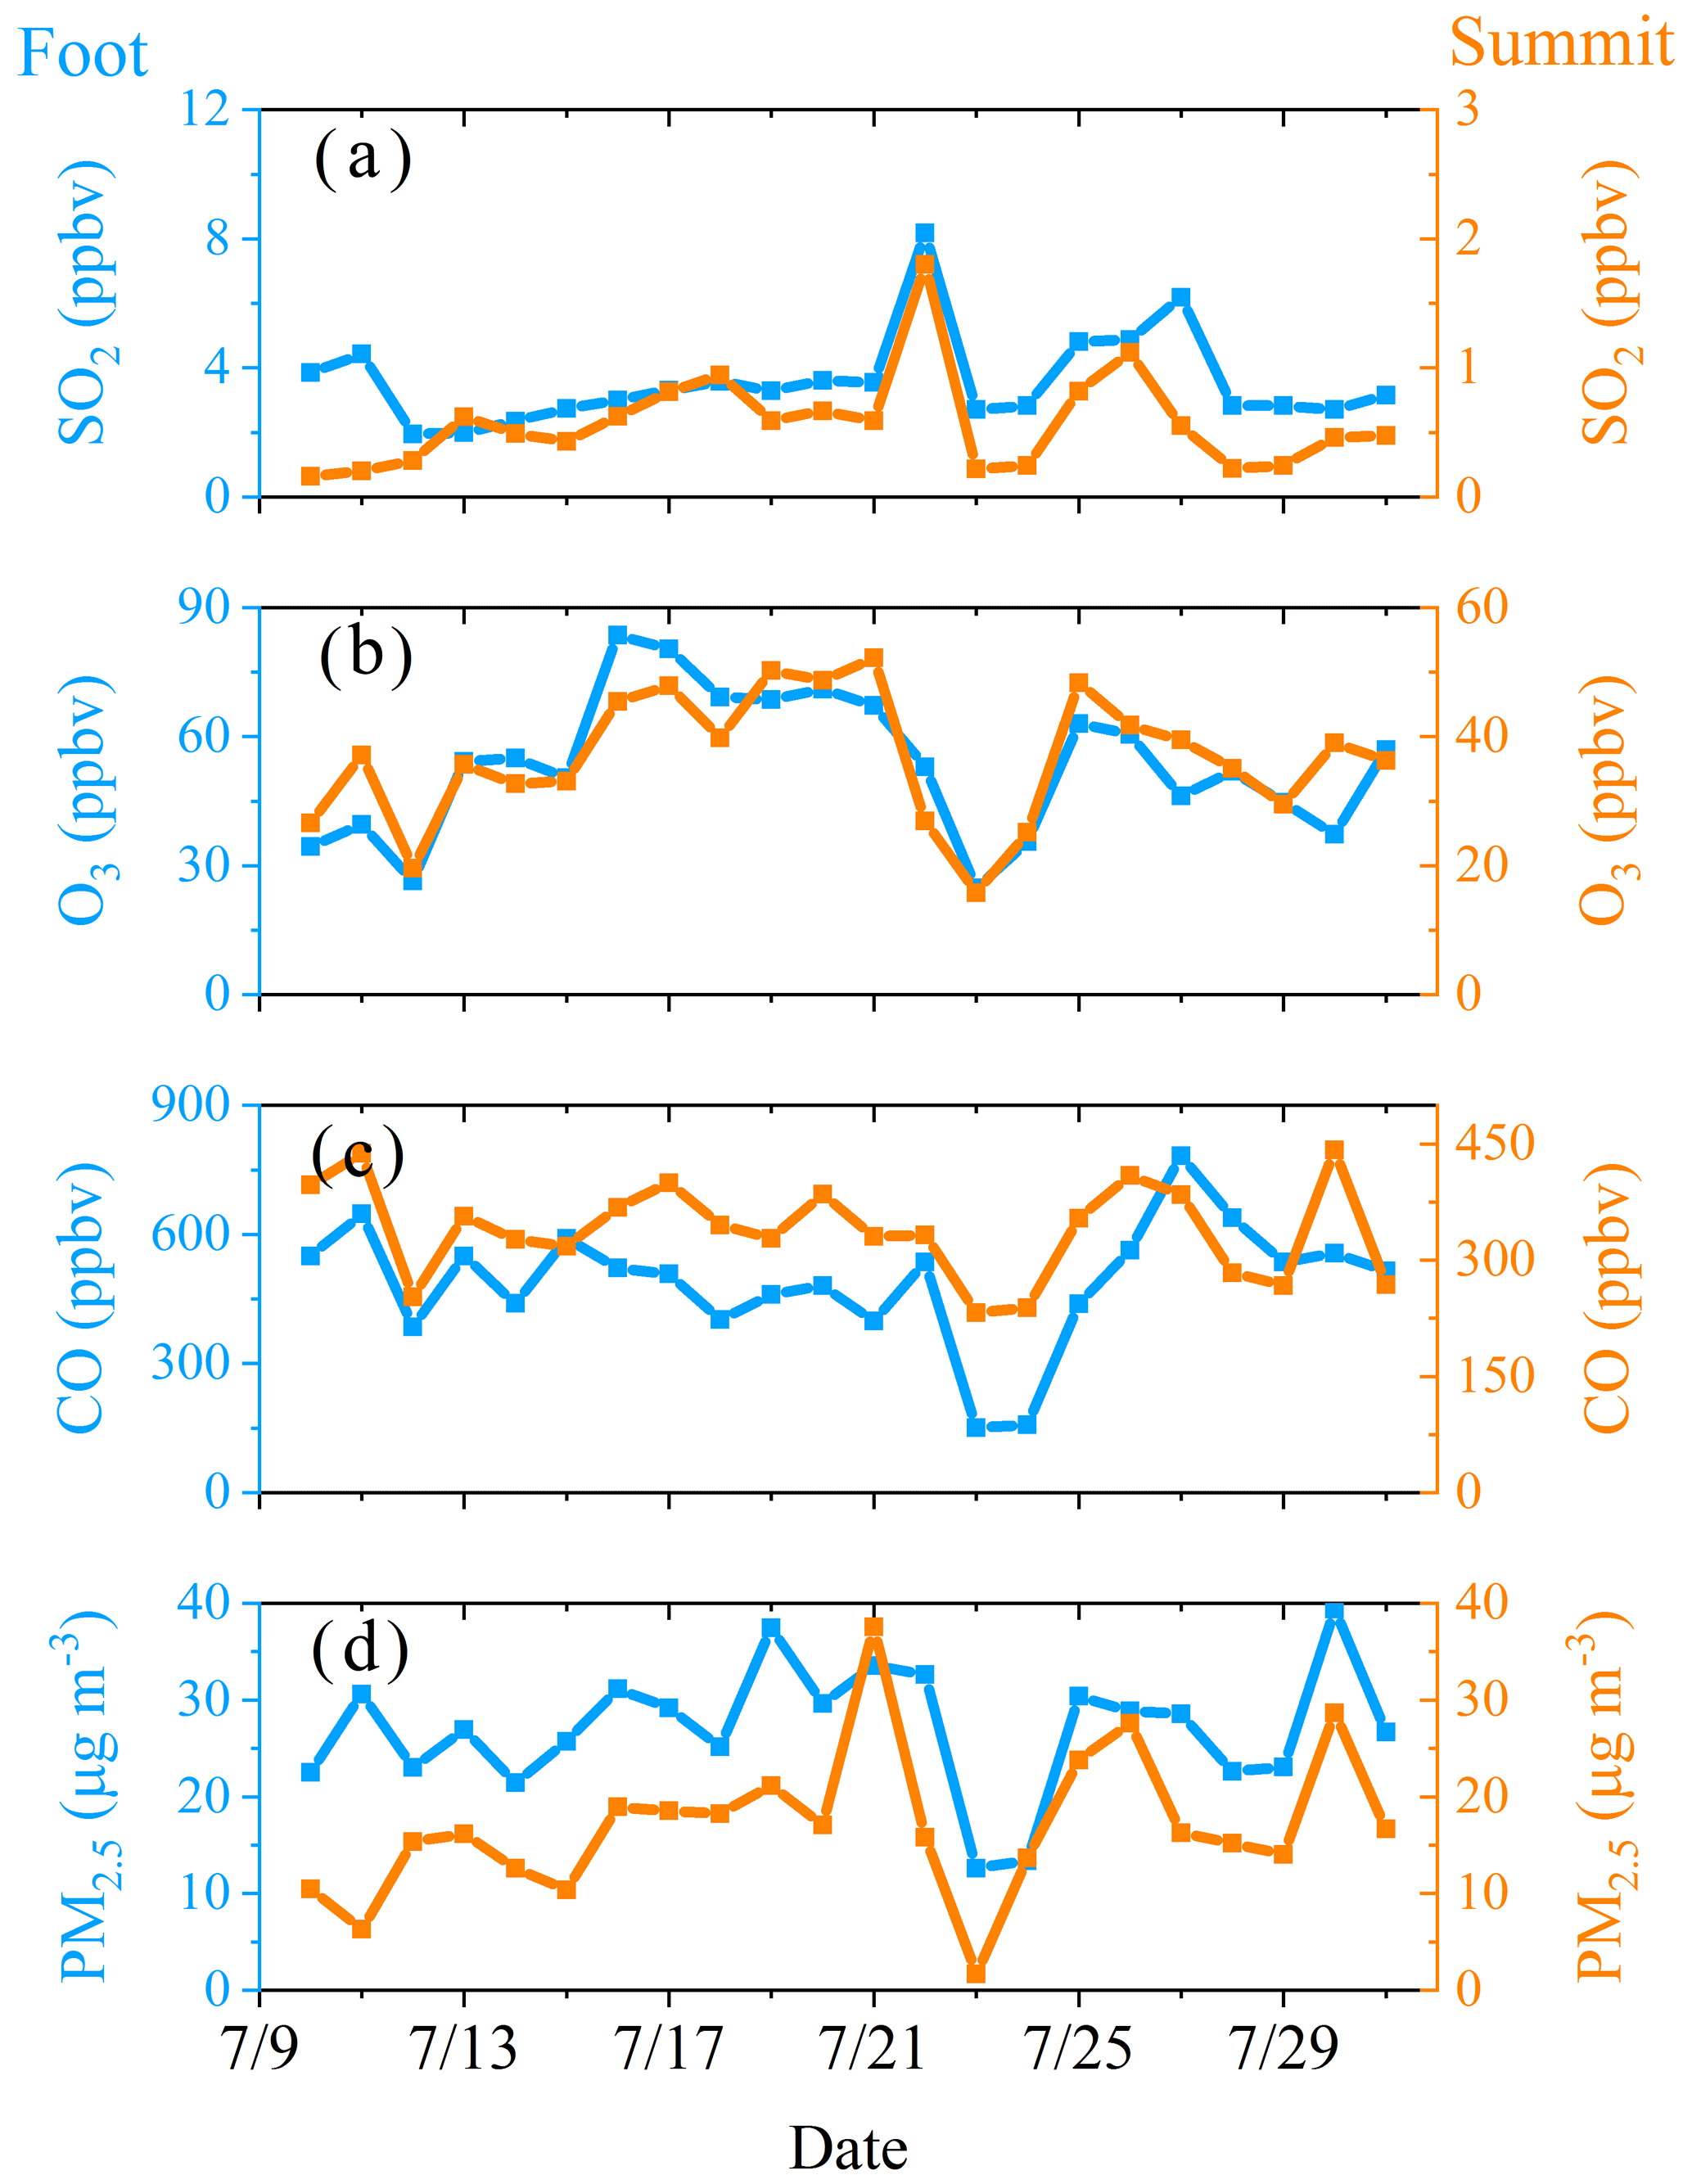
Figure 7Comparison of daytime (05:00–18:00) average (a) SO2, (b) O3, (c) CO, and (d) PM2.5 observed at the foot (left axis in blue) and summit (right axis in orange) stations during the same period from 9 to 31 July.
3.2.3 Impact from Tai'an (150 m a.s.l.)
Besides the discussion in Sect. 3.2.1, five arguments point to the potential impact from pollution in the nearest city (Tai'an, ∼ 150 m a.s.l.) on the summit HONO level:
- a.
The “∩” shape of HONO variation in the daytime was different from that of NO2 (a constant level during the daytime), NOy (which increased in the early morning and then remained stable at noontime, followed by a continuous increase in the late afternoon), and PM2.5 (which also showed a “∩” shape variation, but its peak was 3 h later than the HONO peak). These observations indicate that the observed HONO at the summit was not dominated by in situ aerosol-derived formation (Fig. 5) but an external HONO source such as transport.
- b.
High-level HONO was frequently observed at the ground level (150 m a.s.l.) in Tai'an (Table 2), and almost the same variation trends of were observed at both the summit and foot stations (Fig. 5g).
- c.
HONO peaks at the summit occurred at noontime when the BLH was high and valley breeze wind was strong.
- d.
High-level HONO (> 200 pptv) observed at the summit mainly appeared when the air mass came from south or southwest (the direction to Tai'an; see Fig. 8).
- e.
HONO peaks occurred synchronously with the peaks of SO2, which is mainly emitted at the ground level, and NO2, which is an important HONO precursor (Fig. 3).
The impact could be achieved through (1) the air mass ascended by valley breeze upslope wind (daytime) and by the south wind (daytime and nighttime, “Insight into the comparison of pollutants at the foot and summit level” in Sect. 3.2.2), and (2) HONO formation during the air mass ascending process, i.e., HONO formation through the NO2 heterogeneous uptake on the mountain slope surfaces (George et al., 2005; Marion et al., 2021; Stemmler et al., 2006). The HONO production from the above processes is defined as P(HONO)transport and will be discussed in Sect. 3.6.
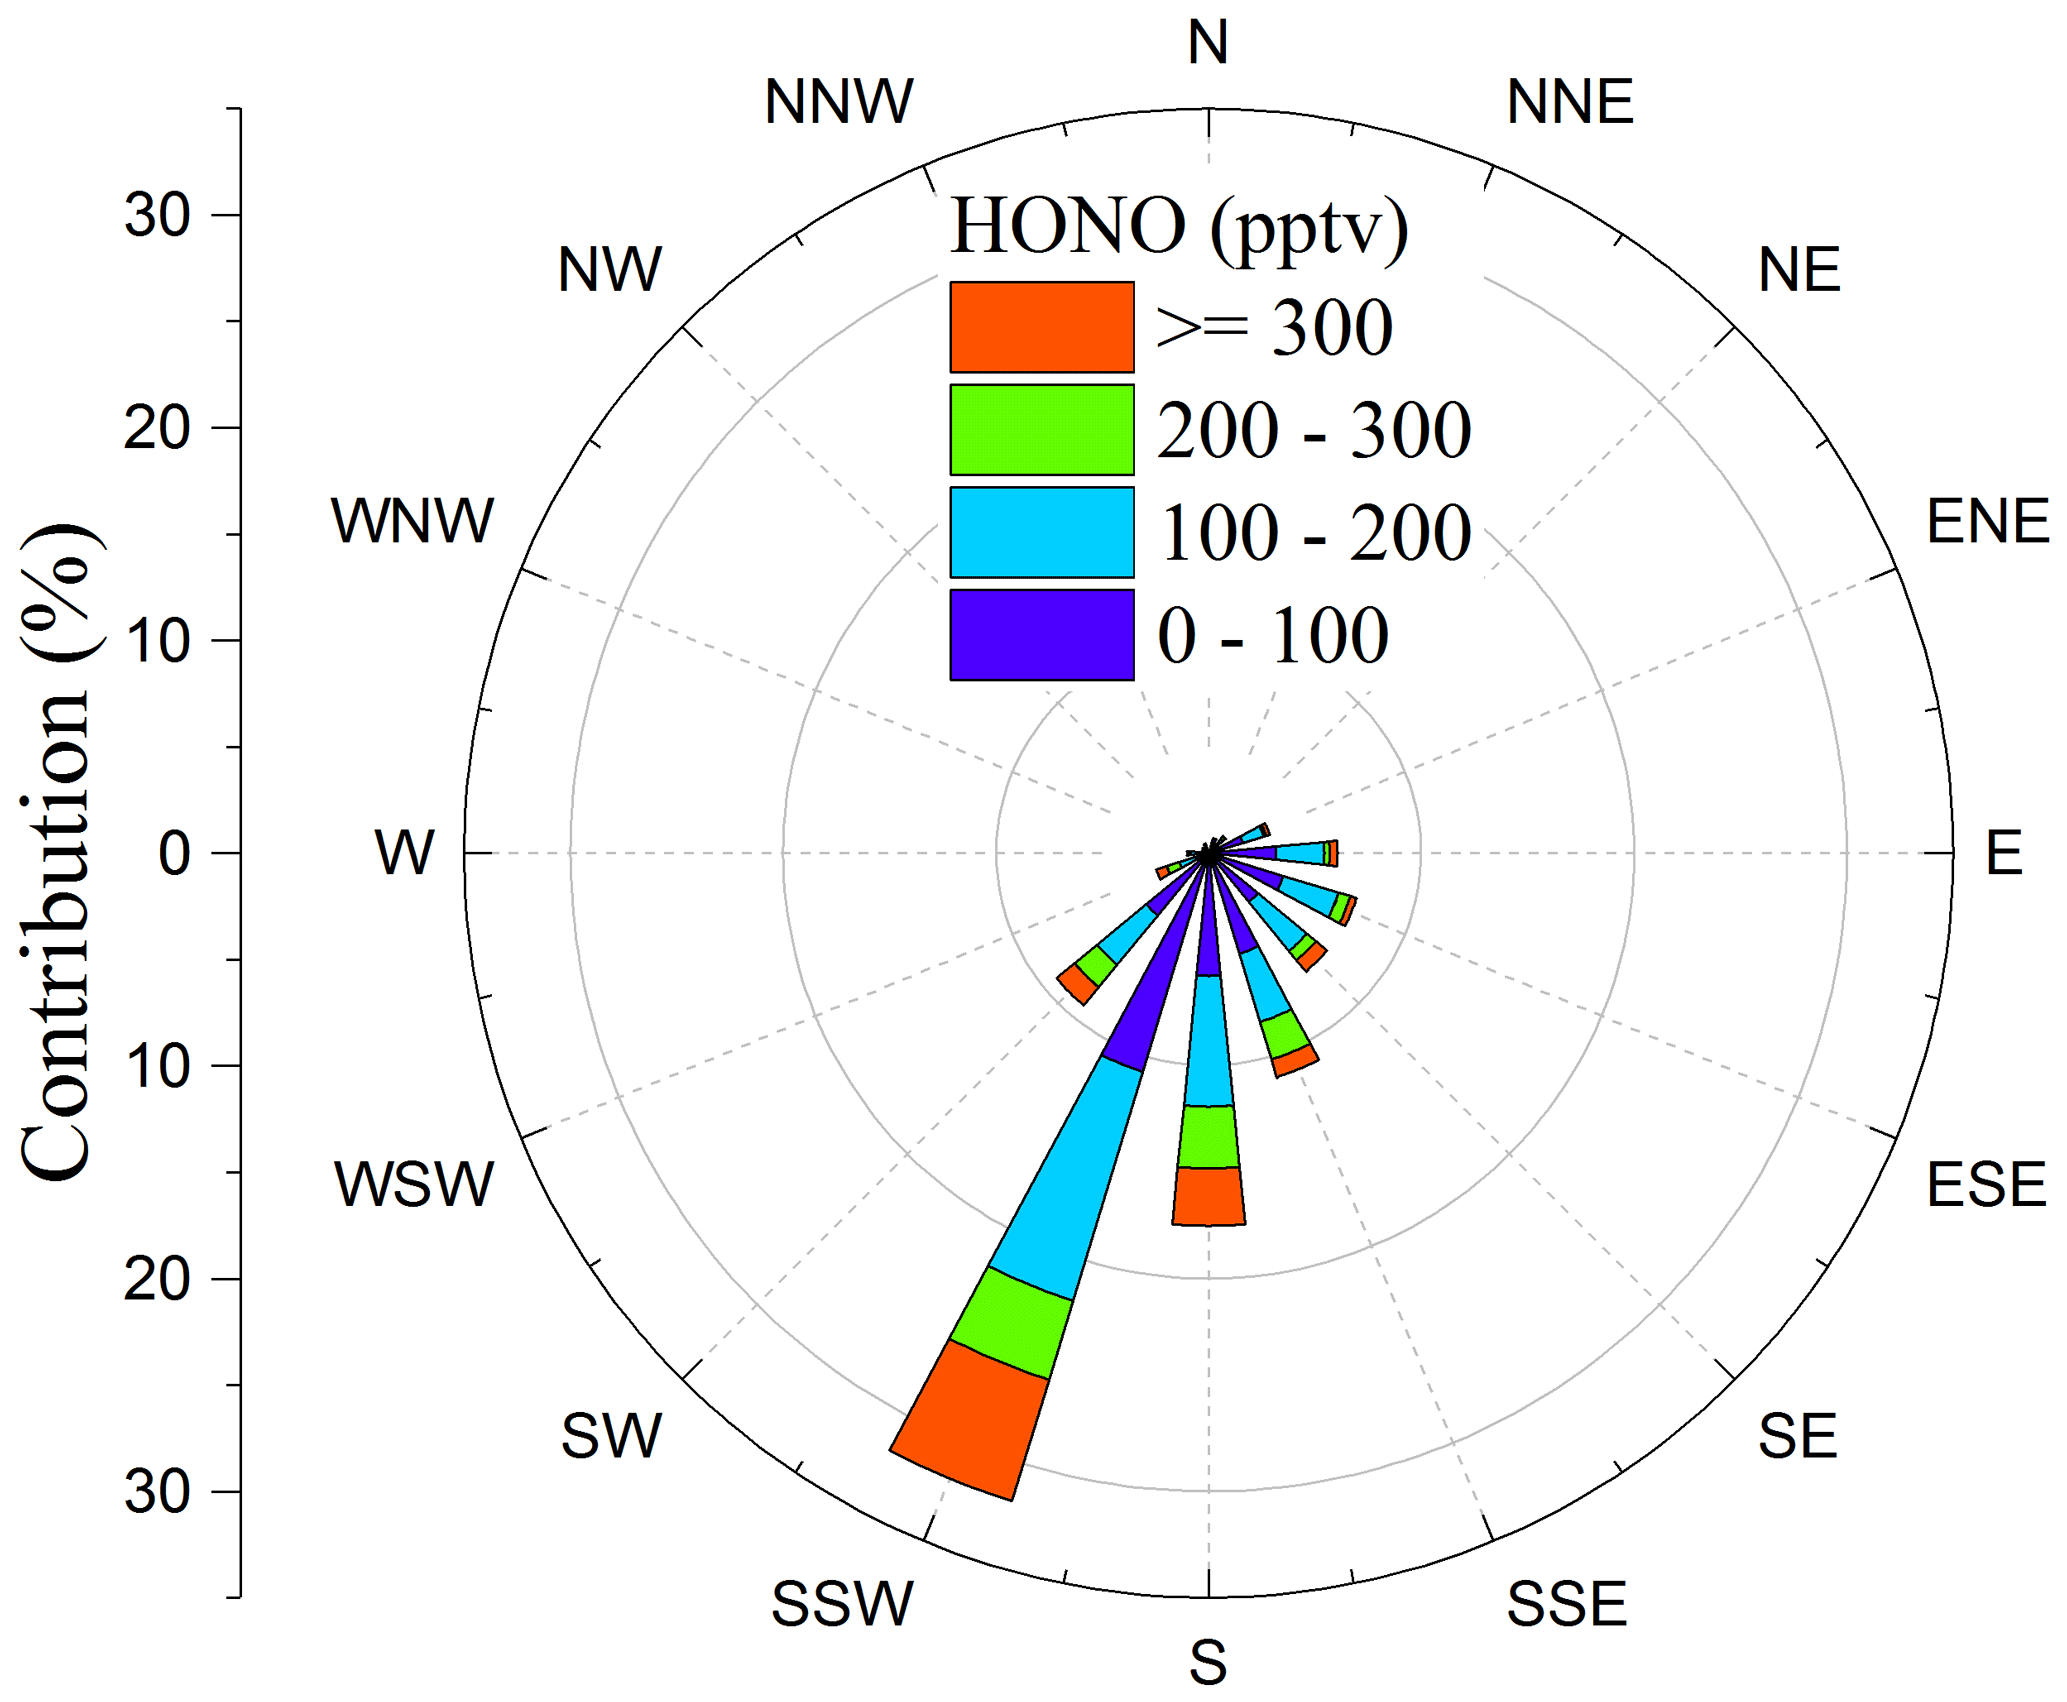
Figure 8Pollution rose plot of HONO against the wind direction. The frequency contribution of counts by wind direction is also shown on the left axis.
The length of the hypotenuse from the foot to the summit is about 4.2 km, with an average elevation angle of about 20∘. In the daytime, the valley breeze could occur with an upslope wind speed of 2–5 m s−1 reported in previous measurements (Kalthoff et al., 2000; Schmid et al., 2020; Ye et al., 1987; see also https://glossary.ametsoc.org/wiki/Upvalley_wind, last access: 7 March 2022); it takes about 14–35 min (ttransport) for the air mass to be transported from the foot to the summit. The upslope valley breeze wind could transport polluted air mass from the foot to the summit levels. This process could be accelerated by the dominant south wind (Fig. 8) as the urban site (150 m a.s.l.) is south of the summit station (1534 m a.s.l.). The mean south winds measured at the ground and summit stations are > 2 and > 5 m s−1, respectively. Then the integrated wind speed along the mountain slope should be 4–10 m s−1, and the calculated ttransport will be reduced to 7–17.5 min.
The key question is the quantity of HONO that still exists after transport from the foot to the summit levels regarding its photolysis in the daytime. Assuming first-order decay of HONO by photolysis during the transport, the remaining HONO and its ratio at the summit can be calculated:
where ct, c0, J(HONO), and α represent the remaining HONO after a transport period (ttransport), the initial HONO concentration at the foot, the HONO photolysis frequency, and the remaining proportion of HONO.
Figure 9 shows the calculated α with ttransport=7 or 17.5 min during the daytime. It is apparent that α is larger than 43 % with ttransport=17.5 min and larger than 72 % with ttransport=7 min, providing a theoretical basis for the potential role of vertical HONO transport from the ground to the summit level. The calculations do not consider the atmospheric dilution or dispersion during the transport, which may reduce α. This effect could be roughly quantified by comparing levels of long lifetime species (e.g., CO) at the foot and the summit station. The measured hourly CO averages at noon are 493 and 379 ppbv at the foot and the summit station, respectively (Fig. 5). Taking the minima of CO measurements at the summit station as the background CO level (167 ppbv), we can obtain a dilution factor of 2.3. The dilution process may also similarly affect HONO; i.e., α is expected to be reduced by a factor of 2.3, leading to α values of > 31 % and > 19 % with ttransport=7 or 17.5 min, respectively. The above calculation only included the daytime HONO sink through photolysis and atmospheric dilution, but the sources, such as NO + OH and heterogeneous NO2 reactions, were not considered, and hence, the calculated α represents a lower limit. Thus, the impact of transport is expected to be larger when (1) taking other HONO formation paths (e.g., NO2 heterogeneous reactions on the mountain surfaces and the vegetation surfaces) into account, and (2) vegetation shadows on the mountain surface slow down HONO photolysis during the transport. Therefore, ground-level (∼ 150 m a.s.l.) HONO as well as its formation during transport may affect the HONO measurement at the summit significantly. The quantification of the contribution will be discussed in Sect. 3.6.
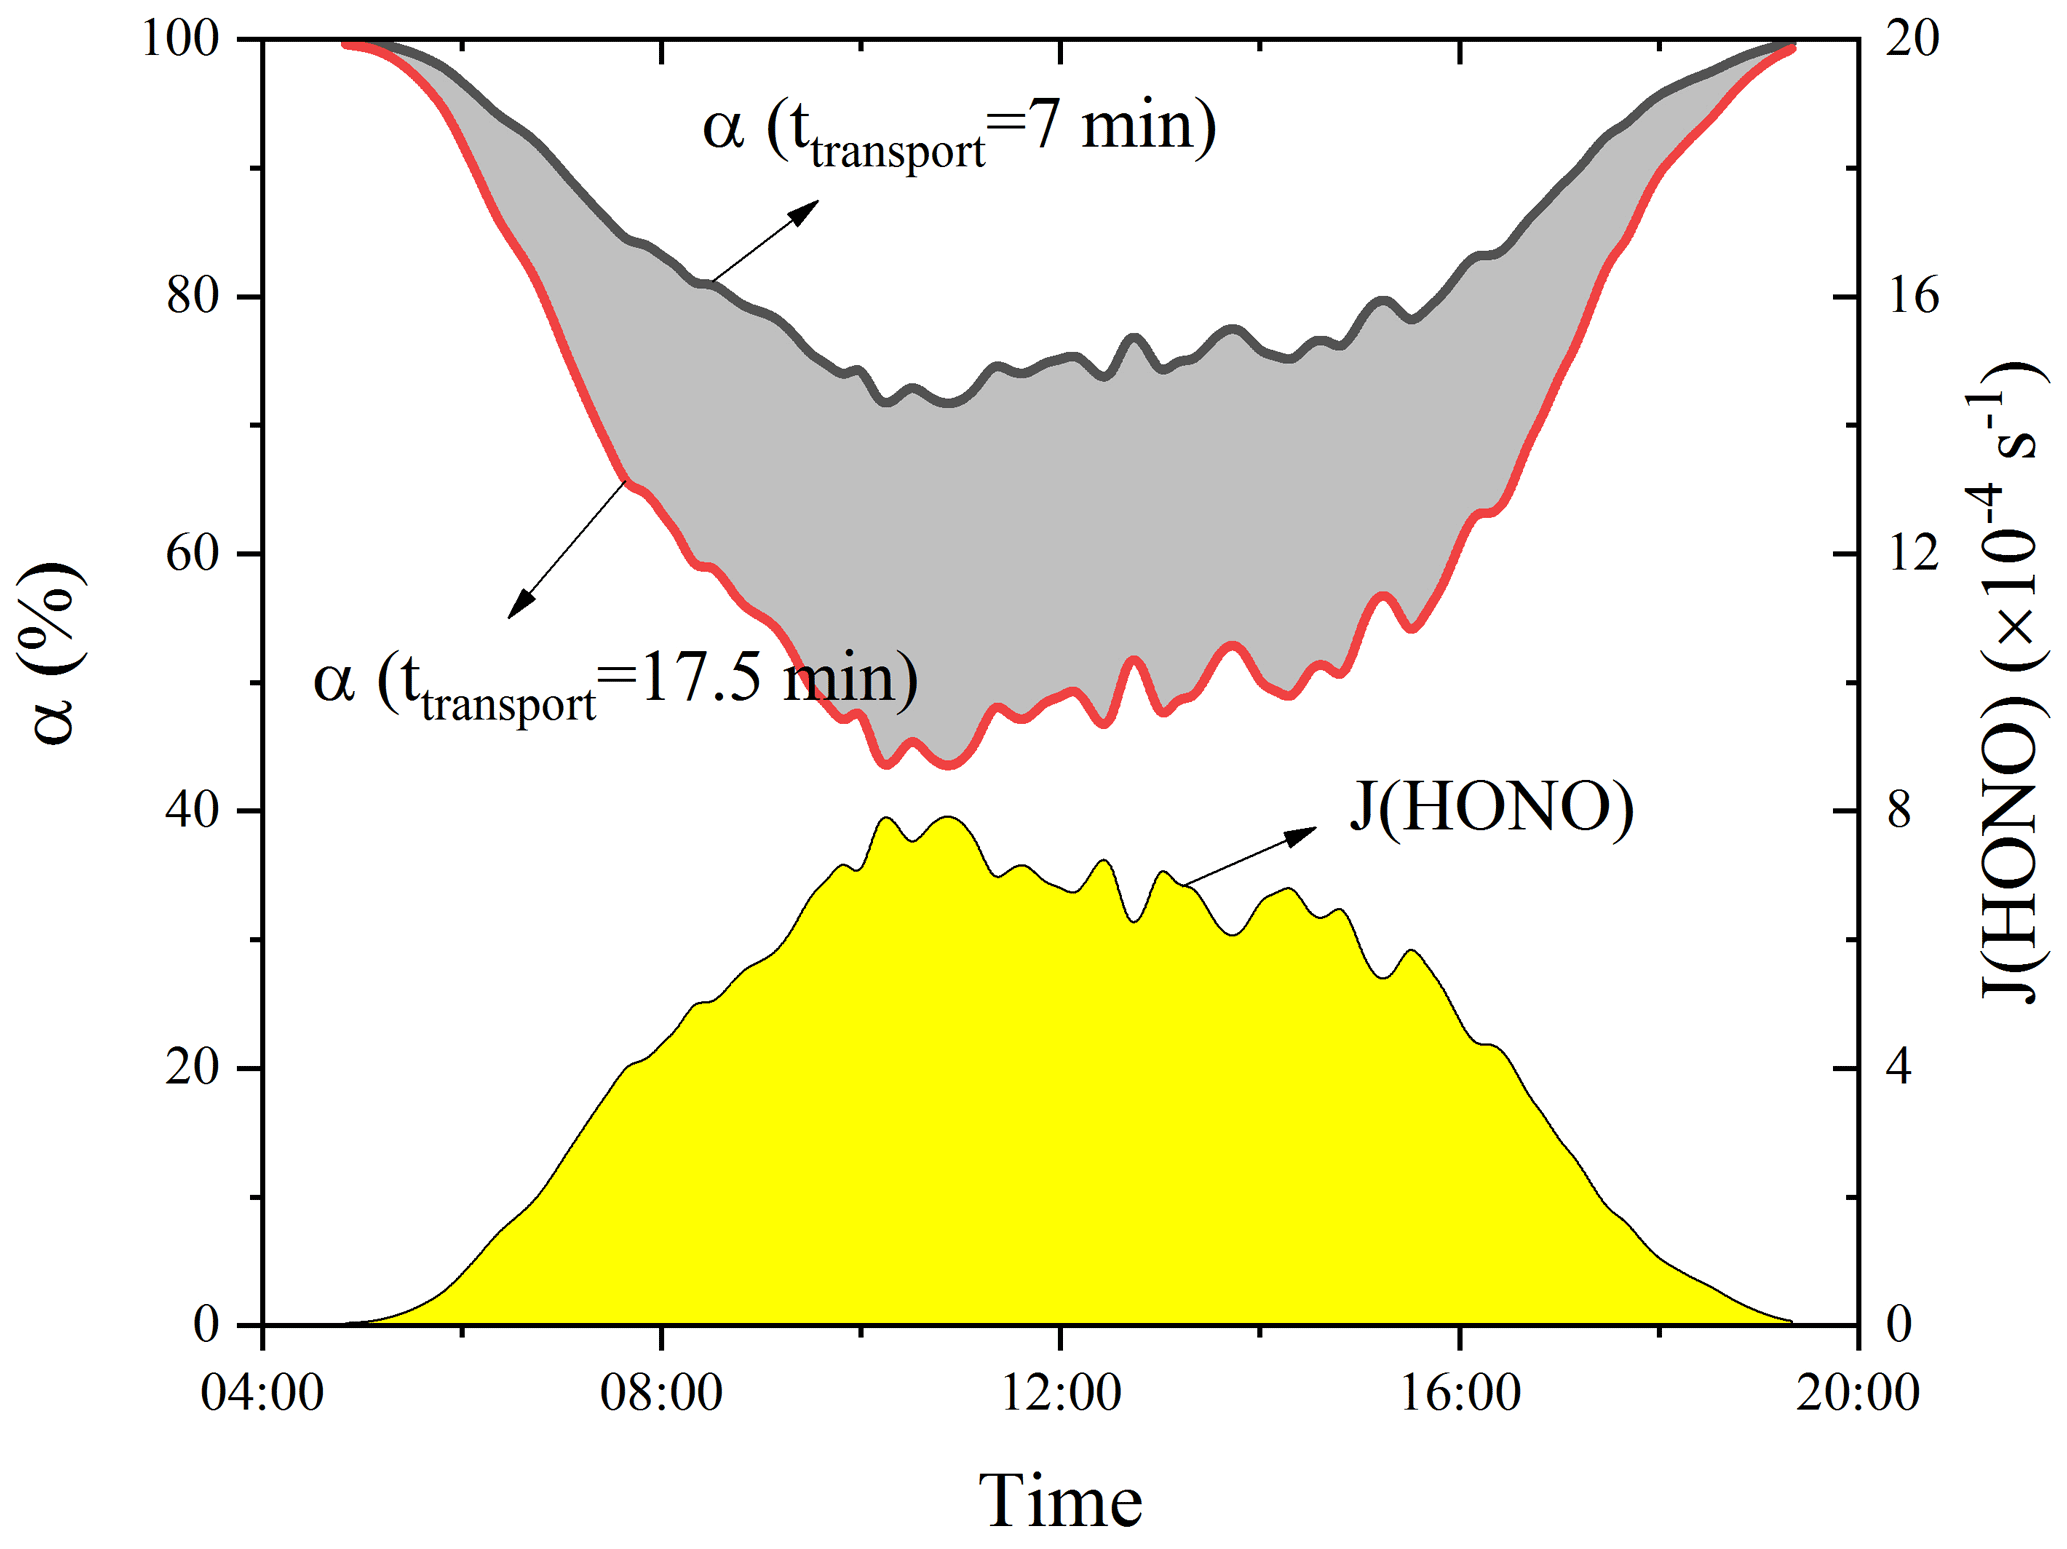
Figure 9Diurnal profiles of the remaining proportion of HONO (α) after a period of transport (ttransport) from the ground to the summit levels and J(HONO) during the daytime.
3.3 Daytime unknown HONO source strength
The photostationary state (PSS), presented by the following equations, is valid to calculate the unknown HONO source strength (Pun) when local emission was negligible (Crilley et al., 2016; Kleffmann et al., 2005; Michoud et al., 2012). The predicted HONO concentration by PSS ([HONO]PSS) and Pun can be calculated by Eqs. (3) and (4), respectively.
OH measurements were not available during this campaign. One popular method used to estimate OH is based on the correlation between OH and solar ultraviolet radiation (e.g., J(O1D)) (Rohrer and Berresheim, 2006). Considering that Mt. Tai is surrounded by polluted regions, empirical formulas between OH and J(O1D) from the ground or other mountain measurements may not be reasonable here. In June 2006, Kanaya et al. (2009) conducted a comprehensive field campaign at the summit of Mt. Tai. OH levels and sources were studied by a box model. From the average diurnal variations of the modeled OH and J(O1D), a significant correlation (R2>0.9) between them was found, which was used here to estimate OH concentrations. This method could lead to some uncertainties in OH levels because (1) high correlations between OH and J(O1D) were found in their average diurnal variations but may not be in their time series, and (2) HONO was not constrained in the box model simulations, so OH could be underestimated for the MTX 2006 campaign.
One way to consider HONO impact is to discuss the OH uncertainties caused by the lack of HONO chemistry. Assuming that the impact of HONO on OH levels is determined by its contribution to primary OH production, we can preliminarily deduce the OH uncertainties at the summit station caused by the lack of HONO chemistry based on measurements and model simulations for the foot station. At the foot station, HONO photolysis contributed 64 % of primary OH production (see Sect. 3.6). If the box model was not constrained by the measured HONO, OH would be underestimated by 25 % (see the companion paper, Xue et al., 2022). At the summit station, HONO contributed 18 % of the primary OH production (see Sect. 3.6). Therefore, OH underestimation due to the lack of HONO chemistry at the summit station should be roughly around 7 % or so.
Hence, to cover the uncertainties caused by the above issues, we added OH sensitivity tests, reducing or increasing the OH level by 30 %, to quantify the impact of the OH uncertainties in our further analysis and conclusions. The OH used, the corresponding HONOpss, and Pun results from the sensitivity tests are also shown in Fig. S6. The estimated OH level was lower than that modeled during the MTX campaign (Kanaya et al., 2009, 2013). This is mainly caused by lower J(O1D) resulting from frequent cloudy weather during the present study period. For instance, the average RH during this campaign was 96 %, which is much higher than that during the MTX campaign (67 %). Reducing or enlarging OH levels by 30 % indeed remarkably impacted HONOpss. However, HONOpss (5–15 pptv level) is still 1–2 orders of magnitude lower than the observed HONO (50–200 pptv level), leading to a small impact of variable OH and HONOpss levels on Pun. Hence, we highlight the uncertainties in OH levels estimated by the current method, but its impact on following HONO budget analysis should be small as discussed above.
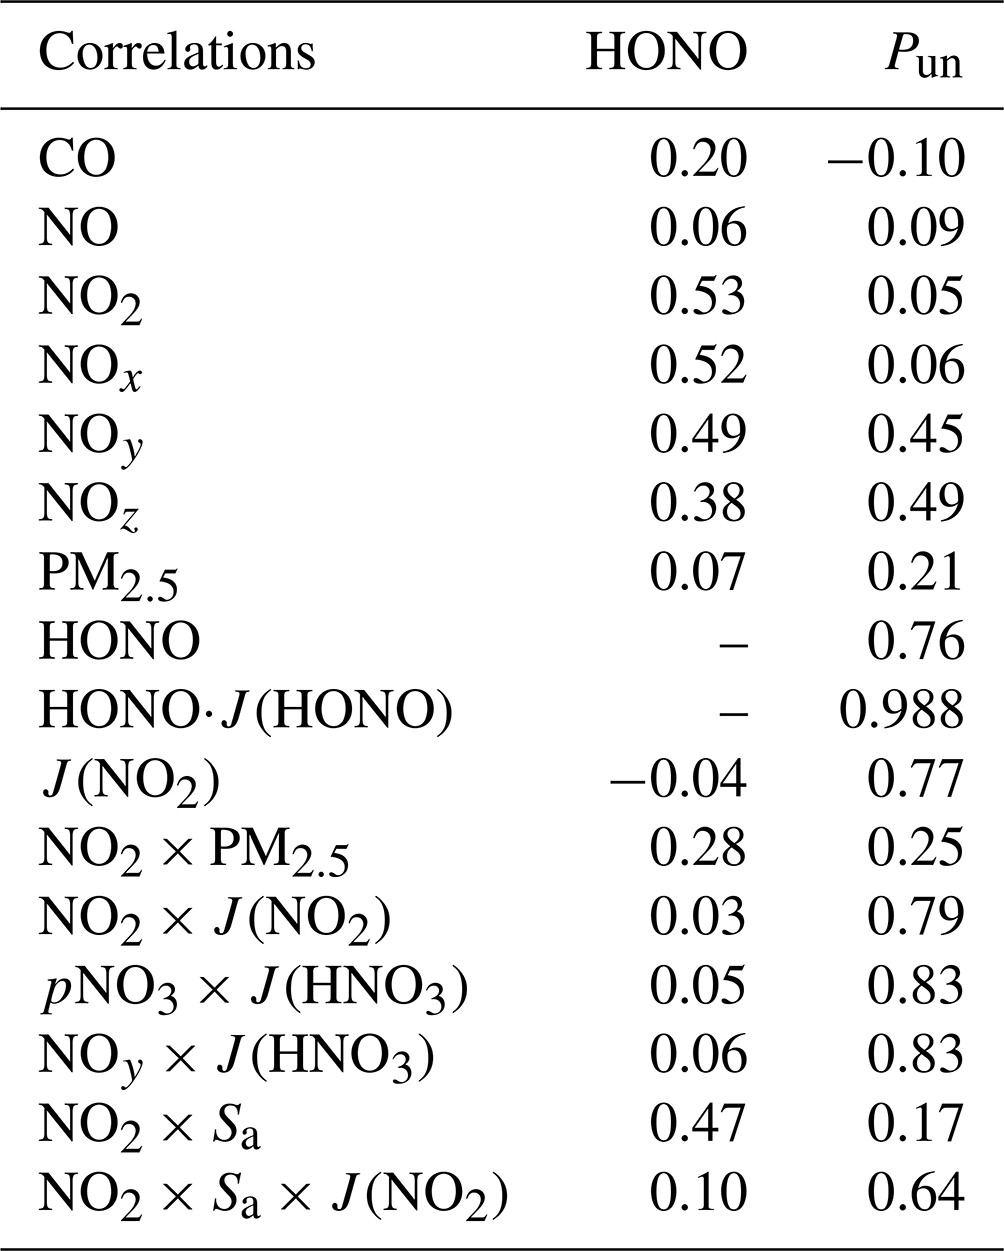
The diurnal variation of the calculated noontime (10:00–16:00) Pun is shown in Fig. 10. Campaign-averaged Pun was about 290 ± 280 pptv h−1, with a maximum of about 1800 pptv h−1. The maximum Pun value appeared at midday (13:00), indicating a photo-enhanced HONO source. High correlations (r=0.79, 0.83, or 0.83) were found between Pun and NO2 × J(NO2), pNO3 × J(HNO3), or NOy × J(HNO3) (Table 4), suggesting the potential HONO formation from photosensitized NO2 reactions or photolysis of NOz (NOz = NOy–NO–NO2) species such as particulate nitrate (pNO3). Moreover, the relatively poor correlations (r=0.17 or 0.64) between Pun and NO2 × Sa or NO2 × Sa × J(NO2) (Table 4) suggested minor roles of dark and photo-enhanced NO2 uptake on the aerosol surface in the HONO formation. In addition, a high correlation between Pun and HONO (r=0.76) was obtained. A possible reason could be that HONO and other pollutants were not dominated by in situ formation but by transport, as discussed in Sect. 3.2.2. As correlation analysis is only a preliminary indicator and it might not be instructive for HONO budget analysis when the vertical air mass exchange occurs, further investigation of NO2 uptake on aerosol surface and photolysis of pNO3 is presented in Sect. 3.4 and 3.5, respectively.
Table 4The correlation coefficients (r) between HONO or Pun and other parameters (first column).
3.4 Constraint on HONO formation from NO2 uptake on the aerosol surface
During the daytime, the HONO production rate from the NO2 uptake on the aerosol surface (P(HONO)a) with the photo-enhanced effect is parameterized by the following equation. Note that dark NO2 uptake on the aerosol surface was not considered due to a much lower uptake coefficient generally at a level of 10−6 (George et al., 2005; Han et al., 2017; Stemmler et al., 2006, 2007).
where ν(NO2), Sa, γa, and J(NO2).005 are the molecular speed of NO2 (m s−1), aerosol surface density (m−1), the photo-enhanced uptake coefficient of NO2 on the aerosol surfaces, and the photo-enhancement factor normalized to a J(NO2)=0.005 s−1. In Eq. (5), an upper limit HONO yield for the NO2 conversion of 100 % was assumed. Additionally, RH was proposed to significantly influence aerosol surface density, especially at our site, with frequently high RH up to 100 %. Then besides calculating the aerosol surface density based on the measured aerosol size distribution (Sa_measured), we estimated the effective aerosol surface density per meter with an RH enhancement factor f(RH) (Sa=Sa_measured × f(RH)) using the following equation:
where a and b are empirical values of 2.06 and 3.60, respectively (Liu et al., 2008). The average Sa without and with RH enhancement is 3.0 × 10⁻⁴ and 8.3 × 10⁻⁴ m−1, respectively. Note that the uncertainty of Sa is not expected to cause a significant uncertainty on HONO budget analysis as P(HONO)a was not the dominant source (Fig. 10, and see the discussion below on P(HONO)a contribution).
As Pun includes all the sources except NO + OH, then P(HONO)a≪Pun can always be obtained. Hence, the real γa value should be much lower than the values inferred (γa_inferred) from Pun=P(HONO)a. In total, 606 γa values were inferred based on the measurements, varying from 1.3 × 10⁻⁴ to 8.5 × 10⁻³, with a mean of (8.3 ± 7.5) × 10−4. However, the minimum (γa_inferred_mini) of 1.3 × 10⁻⁴ is still very high, compared to the results of most lab studies, in which values of γa of typically a few times 10−5 or even less were observed (Han et al., 2016; J. Liu et al., 2019; Ndour et al., 2008; Sosedova et al., 2011; Stemmler et al., 2007). Hence a popularly used value of γa=2 × 10⁻⁵ was used to calculate P(HONO)a, and γa_inferred_mini of 1.3 × 10⁻⁴ was also used for uncertainty analysis as the upper limit.
The calculated P(HONO)a with these γa values is shown in Fig. 10. It is obvious that P(HONO)a is significantly lower than Pun with either lab-based γa=2 × 10⁻⁵ or even γa_inferred_mini= 1.3 × 10⁻⁴, pointing out the minor role of NO2 uptake on the aerosol surface in daytime HONO formation. With the lab-based γa=2 × 10⁻⁵, P(HONO)a could only explain 3 % of Pun, which is similar to previous model studies (Y. Liu et al., 2019; Xue et al., 2020; Zhang et al., 2016). The contribution of P(HONO)a to Pun increased when using γa_inferred_mini but resulted from an overestimated γa as discussed before. Nevertheless, analysis in this study still could be an important effort in the field constraints on the NO2-to-HONO conversion on the aerosol surface.
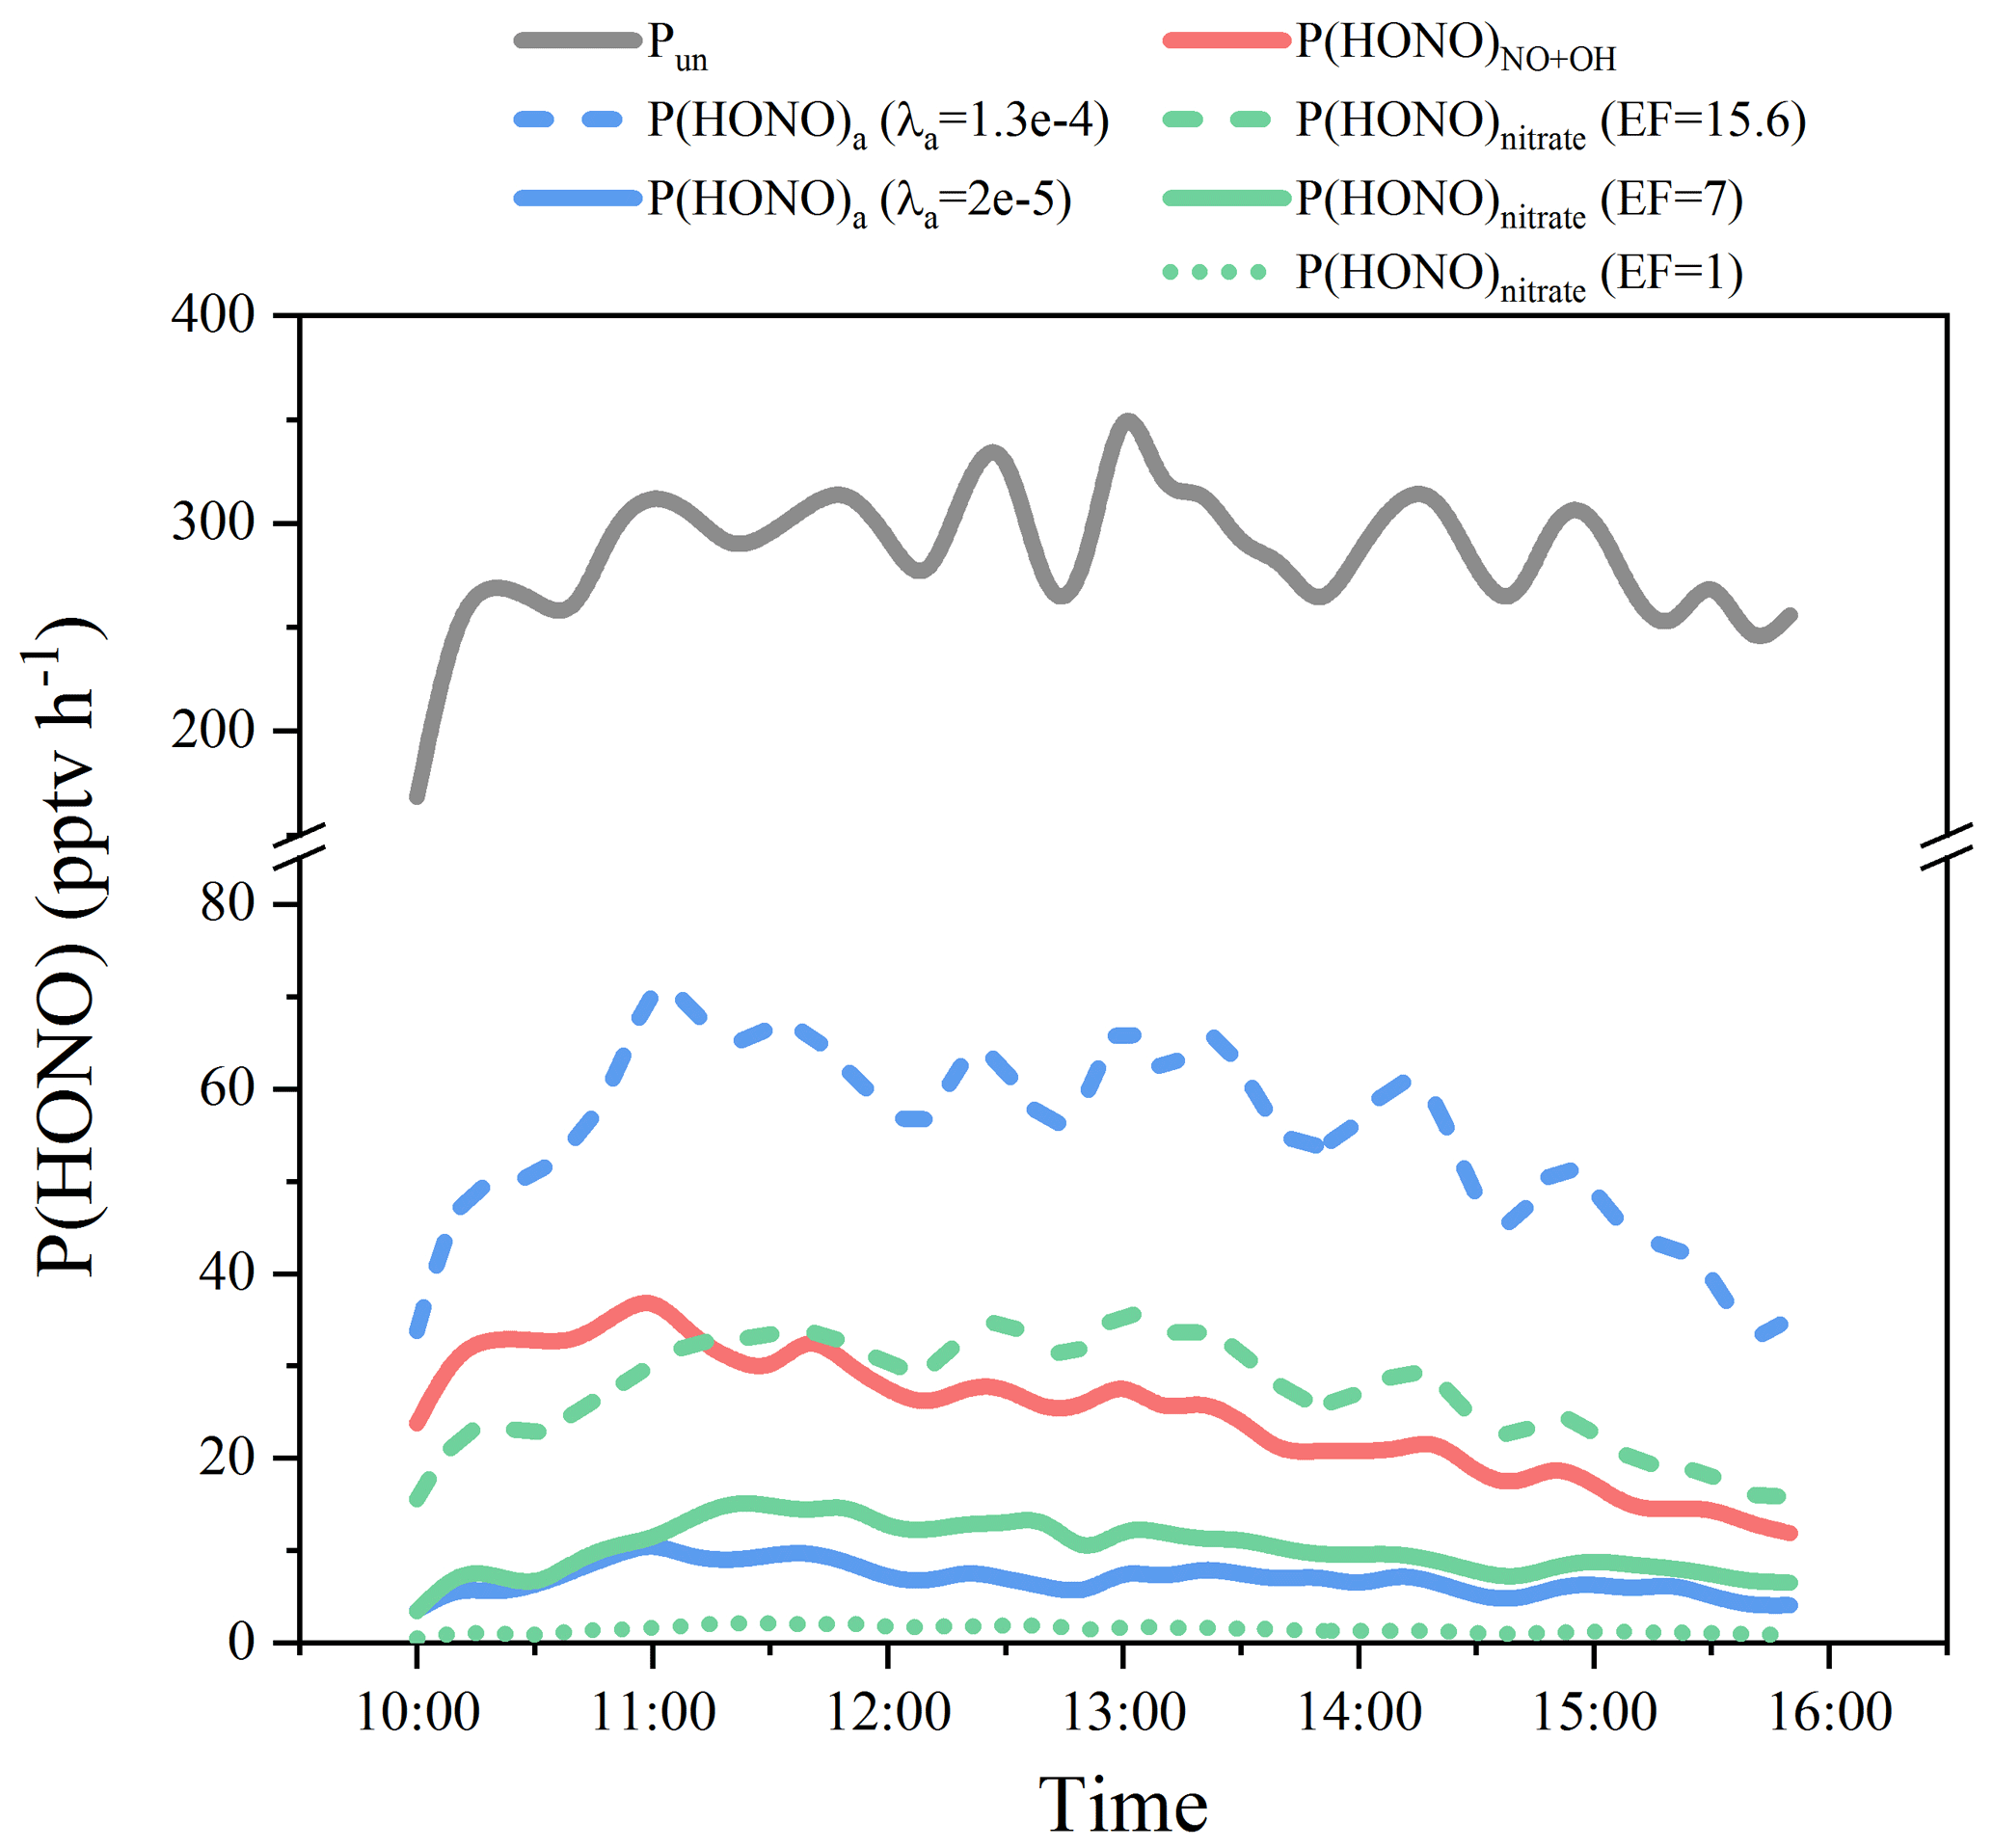
Figure 10Unknown HONO source strength (Pun) and HONO production rates from NO + OH (P(HONO)NO+OH), NO2 uptake on the aerosol surface (P(HONO)a) with the inferred γa_inferred_mini=1.3 × 10⁻⁴ and the popular used γa=2 × 10⁻⁵), and nitrate photolysis (P(HONO)nitrate) with EF values of 1, 7, and 15.6.
3.5 Constraint on HONO formation from the photolysis of particulate nitrate
As one of the important inorganic components of aerosols, particulate nitrate (pNO3) could undergo photolysis, with the production of HONO. This process needs more field constraints as discussed in the Introduction. During the present campaign, pNO3 at the summit was measured by a filter method every 2 h (Liu et al., 2020), but it suffered a sampling problem after 12 July. Because NOz (NOz = NOy–NO–NO2) mainly contains pNO3 and its precursors, e.g., HNO3 and N2O5, similar variations are expected between NOz and pNO3. As shown in Fig. S7, NOz and pNO3 exhibited a very high correlation (R2=0.895), for which pNO3 makes 44 % of NOz, and this fraction was used to estimate pNO3 in the period when it was not measured. The uncertainty of the estimated pNO3 should have no significant impact on daytime HONO formation concerning its small contribution to daytime HONO formation (see Sect. 3.6).
A high correlation between Pun and pNO3 × J(HNO3) was found (Table 4), suggesting a possible impact of pNO3 on HONO formation. But one should bear in mind that the high correlation might also be caused by the remarkable impact on pNO3 formation from HONO-related reactions (e.g., HONO OH HNO3→pNO3) (Xue et al., 2020) or other photolytic processes. For parameterization, an enhancement factor (EF) was defined as the ratio of photolysis frequencies of pNO3 to gas-phase HNO3. Then HONO production from pNO3 photolysis (P(HONO)nitrate) could be quantified by Eq. (7):
Similar to NO2 uptake on the aerosol surface, one can always find P(HONO)nitrate≪Pun. Hence, it is expected that the real EF should be much lower than the inferred values (EFinferred) from P(HONO)nitrate=Pun. Therefore, 606 EF values were inferred, in the range of 15.6 to 1072, with a mean of 173 ± 98, which is much higher than values (around 1) determined in recent flow tube or smog chamber studies (Shi et al., 2021; Wang et al., 2021). The minimum (EFinferred_mini=15.6) is at a similar level to field studies of Romer et al. (2018) and Zhou et al. (2003) and the lower values in the laboratory studies (Bao et al., 2018; Ye et al., 2016, 2017; Zhou et al., 2011). To quantify the HONO production from pNO3 photolysis, the EF value of 7 from a recent field study (Romer et al., 2018) was used for P(HONO)nitrate calculation, and EFinferred_mini (15.6) from this study and EF values of ∼ 1 from recent laboratory studies (Shi et al., 2021; Wang et al., 2021) were also used for the uncertainty analysis and comparison.
The calculated P(HONO)nitrate with these EF values is shown in Fig. 10. With EF = 7, P(HONO)nitrate was at a level of half of NO + OH but much lower than Pun, which was also observed at the summit of Mt. Whiteface (Zhou et al., 2007). P(HONO)nitrate could explain 4.3 % of the observed Pun. Its contribution varied from 0.6 % to 9.6 %, depending on EF values varying from 1 to 15.6 in the sensitivity tests. Therefore, with a P(HONO)a (γa=2 × 10⁻⁵) contribution of 3 % (Sect. 3.4) and a P(HONO)nitrate (EF = 7) contribution of 4.3 %, the other sources (defined as P(HONO)(HONO)a−P(HONO)nitrate, mainly transported from the ground level as discussed in Sect. 3.2.2) made a dominant contribution of 92.7 % to the observed Pun.
Moreover, significant differences between EF values obtained from field studies and laboratory studies indicate a complex process of pNO3 photolysis that may be influenced by various environmental parameters, e.g., the aerosol pNO3 loading and the aerosol composition (Bao et al., 2018, 2020; Ye et al., 2016, 2017), and experimental laboratory conditions, e.g., collected particles on the filter or generated airborne particles (Shi et al., 2021; Wang et al., 2021). We therefore suggest that this process still needs further field or laboratory constraints. To the best of our knowledge, this study provided the first field constraint on the aerosol-derived HONO sources in the NCP region, where the abundance of aerosol was frequently observed, and its role in HONO formation is still highly controversial.
The landscape (e.g., mountains) enhances the vertical air mass exchange, leading to a weak vertical HONO distribution within the boundary layer, which is not yet considered in previous studies (Jiang et al., 2020). This will underestimate the role of ground-derived sources in HONO formation in the upper boundary layer over mountain regions. Radicals, including OH and HO2, are not expected to be transported far due to their short enough lifetimes (< 100 s). However, 15 % of daytime HONO was formed at the ground level through NO + OH as reported in the companion ACP paper (Xue et al., 2022), and part of OH consumed at the ground level would be released at the summit level through HONO photolysis. Hence, it could be preliminarily inferred that radicals (i.e., OH) could be transported through their precursors/reservoirs (like HONO) with lifetimes longer than themselves. Furthermore, the enhanced vertical air mass exchange could also lead to fast transport of other pollutants (PM2.5, O3, CO, SO2, etc.) from the ground to the summit level, which will significantly impact the atmospheric composition as well as its chemistry in the upper boundary layer or the residual layer. The discussion and implications in this study are instructive for further field and model studies.
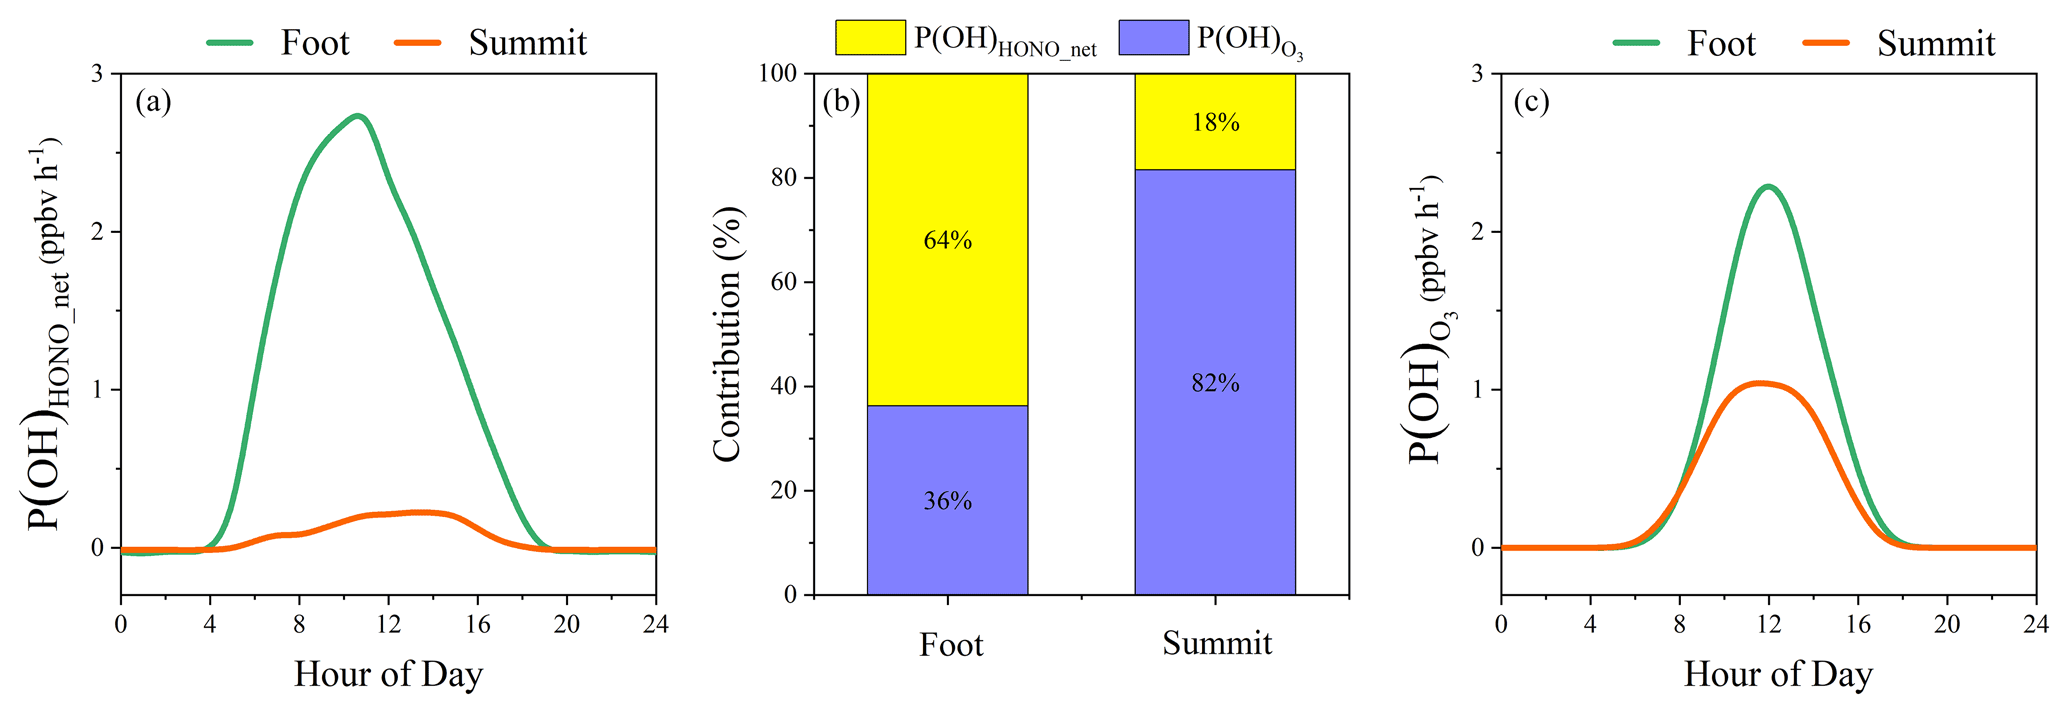
Figure 11OH production from photolysis of HONO (P(OH)HONO_net) and O3 (P(OH)) at the foot and the summit of Mt. Tai. (a) P(OH)HONO_net, (b) relative contributions, and (c) P(OH).
3.6 Role of HONO in the oxidizing capacity of the lower and the upper boundary layer
O3 was typically the major OH source in high-altitude regions, including the upper boundary layer. Then we compared the OH production rates from O3 and HONO photolysis to investigate whether HONO could play a significant role in the oxidizing capacity of the atmosphere at this high-altitude site. Photolysis of HONO and O3 with their net OH production is shown in Reactions (R2) and (R5) to (R7), respectively. OH loss through HONO + OH and NO + OH was subtracted from P(OH)HONO to obtain P(OH)HONO_net.
where the reaction constants were taken from the IUPAC kinetic database (https://iupac-aeris.ipsl.fr, last access: 7 March 2022). The atmospheric RH and temperature largely influenced the branching ratio of Reactions (R6) to (R7). The average OH yield (ϕ) during the campaign of 20 % was used for calculating OH production from O3 photolysis.
Additionally, in the companion paper, HONO was reported as the most important primary OH source at the foot station (Xue et al., 2022). A comparison between the roles of HONO at the foot and the summit station could provide more insights into the importance of HONO throughout the boundary layer. Moreover, as reported in the companion paper, HONO observed at the foot station was mainly produced through NO2 heterogeneous reactions and NO+OH. Therefore, the comparison could also shed light on the link between the atmospheric oxidizing capacity in the lower and the upper boundary layer, although measurements at two stations were conducted during two consecutive periods rather than the same one in summer 2018.
Figure 11 displays the diurnal profiles of net OH production rates from HONO and O3 photolysis at the foot and the summit station. Both P(OH)HONO_net and P(OH) showed higher levels at the foot station compared to the summit station. For instance, average P(OH)HONO_net and P(OH) at the foot station are 0.9 and 0.5 ppbv h−1, respectively, both of which are significantly higher than those (0.06 and 0.28 ppbv h−1) at the summit station. This is caused by relatively low HONO and O3 concentrations and lower solar photolysis frequencies as a result of frequent cloud formation observed at the summit station.
In particular, after nighttime accumulation, HONO photolysis is found to initialize daytime photochemistry in the early morning at the ground level (Alicke et al., 2002; Kleffmann, 2007; Platt et al., 1980). This was also observed at the foot station. As shown in Fig. S8, at the foot station, the contribution of P(OH)HONO_net to P(OH)sum was almost 100 % at sunrise around 05:00. It showed a declining trend but still played the dominant role in P(OH)sum, with a contribution larger than 90 % in the early morning (05:00–07:00). At the summit station, at 05:00, solar radiation was very weak, for instance, J(NO2) was only 3.6 × 10⁻⁴ s−1. At this time, P(OH)HONO_net was slightly negative (−7 × 10⁻³ ppbv h−1) due to OH loss through HONO + OH and NO + OH. O3 photolysis was initialized at the same time, but P(OH) was nearly zero (7 × 10⁻⁴ ppbv h−1). From 06:00 to 07:00, a considerable amount of net OH was produced through HONO photolysis (0.04–0.09 ppbv h−1), with its contribution to P(OH)sum decreasing from 64 % to 39 % (Fig. S8). Hence, it could be inferred that daytime atmospheric photochemistry at the summit level is also initialized by HONO photolysis.
On average, the contribution of P(OH)HONO_net to P(OH)sum was 64 % at the foot station, higher than that at the summit station (18 %), indicating the essential role of HONO in the atmospheric oxidizing capacity at both the ground (lower boundary layer) and the summit (upper boundary layer) level in mountainous regions. As discussed before, the transport from the ground to the summit level contributed to the majority of HONO observed at the summit level. This points to a new insight that ground-derived HONO plays an important role in the oxidizing capacity, not only at the ground level, but also in the upper boundary layer (∼ 1500 m) in mountainous regions. Yet this vertical exchange might only be valid in the mountainous areas, and the follow-up regional impact still needs to be quantified by further model studies.
Observations of HONO and related parameters at the summit of Mt. Tai (1534 m a.s.l.) in July 2018 were presented. The average HONO mixing ratio is 133 ± 106 pptv, with a maximum of 880 pptv, significantly higher than observations at other mountain summits worldwide. Along with observations at the ground level (the nearest city, Tai'an), HONO formation from different paths and its role in the atmospheric oxidizing capacity of the upper boundary layer were explored and discussed.
The main conclusions are listed as follows:
-
Constraints on the kinetics of NO2 uptake coefficient on the aerosol surface and photolysis of pNO3 were obtained based on the assumption that Pun could be solely explained by NO2 uptake on the aerosol surface, P(HONO)a, or particulate nitrate photolysis, P(HONO)nitrate. The inferred γa and EF values were much higher than most values obtained from recent laboratory studies, indicating that aerosol-derived HONO could not explain the observed Pun. In the NCP region, the abundance of aerosol was frequently observed, but its role in HONO formation is still highly controversial as a result of uncertain kinetics. This study provided the first field constraints on aerosol-derived HONO sources in this region and will be instructive for further laboratory or model studies.
-
With a γa value of 2 × 10⁻⁵ and an EF value of 7, P(HONO)a and P(HONO)nitrate showed small contributions (3 % and 4.3 %, respectively) to daytime HONO formation at the summit station. Both P(HONO)a and P(HONO)nitrate varied from negligible to moderate levels (similar to NO + OH), depending on γa and EF values, suggesting the necessity to further study the related kinetics. Additionally, although high values of γa (1.3 × 10⁻⁴) and EF (15.6) compared with recent studies were tested here, both sources were still much lower than the observed Pun. The remaining majority (92.7 %) of Pun was dominated by the rapid vertical transport from the ground to the summit level, including heterogeneous HONO formation on surfaces of the mountain slope, which was inferred from comprehensive evidence presented in this study.
-
A comparison of HONO contributions to primary OH at the summit and the foot level was conducted. It was confirmed that HONO photolysis initialized daytime photochemistry at both sites in the early morning. On average, HONO made contributions of 64 % and 18 % to P(OH)sum at the foot and the summit level, respectively, indicating the important role of HONO in the oxidizing capacity of the atmosphere in mountainous areas. HONO formation at the ground level could significantly influence the HONO mixing ratios and the atmospheric oxidizing capacity at the summit level through vertical air mass exchange. Moreover, the enhanced vertical air mass exchange could also lead to a fast exchange of other pollutants between the ground and the summit levels, which significantly impacts the atmospheric composition as well as the chemistry in the upper boundary layer or the residential layer. However, those follow-up impacts, by far, are not quantified by the current model studies.
All the summertime data used in this study are available upon request from the corresponding authors.
The supplement related to this article is available online at: https://doi.org/10.5194/acp-22-3149-2022-supplement.
CX, CY, CZ, YZ, HL, and ZG performed the field measurements. CX analyzed the observation data and wrote the paper with inputs from all co-authors. CY and JK helped with the data analysis and manuscript writing. JK, CY, VC, AM, LX, JC, KL, FB, and YM revised the manuscript.
The contact author has declared that neither they nor their co-authors have any competing interests.
Publisher's note: Copernicus Publications remains neutral with regard to jurisdictional claims in published maps and institutional affiliations.
We are grateful to Xiaowei He, Pengfei Liu, Chao Zhu, Jiarong Li, Hui Chen, Xianmang Xu, Hongyong Li, Pengcheng Zhang, and Jinhe Wang for their help with the measurements at the summit of Mt. Tai. We thank all researchers involved in this campaign from the Research Centre for Eco-Environmental Sciences, Chinese Academy of Sciences, Fudan University, Shandong Jianzhu University, Shandong University, and the Municipal Environmental Protection Bureau of Tai'an. We thank Yunqiao Zhou for his help with the map plotting. We thank the two anonymous reviewers and the editor, Yugo Kanaya, for their efforts towards improving our manuscript.
This work was supported by the National Natural Science Foundation of China (grant nos. 41727805, 91544211, 41975164, and 21876186) and the PIVOTS project provided by the Region Centre – Val de Loire (ARD 2020 program and CPER 2015 – 2020).
This paper was edited by Yugo Kanaya and reviewed by two anonymous referees.
Acker, K., Möller, D., Wieprecht, W., Meixner, F. X., Bohn, B., Gilge, S., Plass-Dülmer, C., and Berresheim, H.: Strong daytime production of OH from HNO2 at a rural mountain site, Geophys. Res. Lett., 33, L02809, https://doi.org/10.1029/2005GL024643, 2006.
Alicke, B., Platt, U., and Stutz, J.: Impact of nitrous acid photolysis on the total hydroxyl radical budget during the Limitation of Oxidant Production/Pianura Padana Produzione di Ozono study in Milan, J. Geophys. Res.-Atmos., 107, 8196, https://doi.org/10.1029/2000JD000075, 2002.
Ammann, M., Kalberer, M., Jost, D. T., Tobler, L., Rössler, E., Piguet, D., Gäggeler, H. W., and Baltensperger, U.: Heterogeneous production of nitrous acid on soot in polluted air masses, Nature, 395, 157–160, https://doi.org/10.1038/25965, 1998.
Anisimov, S. V., Galichenko, S. V., and Mareev, E. A.: Electrodynamic properties and height of atmospheric convective boundary layer, Atmos. Res., 194, 119–129, https://doi.org/10.1016/j.atmosres.2017.04.012, 2017.
Bao, F., Li, M., Zhang, Y., Chen, C., and Zhao, J.: Photochemical Aging of Beijing Urban PM2.5: HONO Production, Environ. Sci. Technol., 52, 6309–6316, https://doi.org/10.1021/acs.est.8b00538, 2018.
Bao, F., Jiang, H., Zhang, Y., Li, M., Ye, C., Wang, W., Ge, M., Chen, C., and Zhao, J.: The Key Role of Sulfate in the Photochemical Renoxification on Real PM2.5, Environ. Sci. Technol., 54, 3121–3128, https://doi.org/10.1021/acs.est.9b06764, 2020.
Beine, H. J., Amoroso, A., Esposito, G., Sparapani, R., Ianniello, A., Georgiadis, T., Nardino, M., Bonasoni, P., Cristofanelli, P., and Dominé, F.: Deposition of atmospheric nitrous acid on alkaline snow surfaces, Geophys. Res. Lett., 32, L10808, https://doi.org/10.1029/2005GL022589, 2005.
Bejan, I., Abd El Aal, Y., Barnes, I., Benter, T., Bohn, B., Wiesen, P., and Kleffmann, J.: The photolysis of ortho-nitrophenols: A new gas phase source of HONO, Phys. Chem. Chem. Phys., 8, 2028–2035, https://doi.org/10.1039/b516590c, 2006.
Carslaw, D. C. and Beevers, S. D.: Estimations of road vehicle primary NO2 exhaust emission fractions using monitoring data in London, Atmos. Environ., 39, 167–177, https://doi.org/10.1016/j.atmosenv.2004.08.053, 2005.
Crilley, L. R., Kramer, L., Pope, F. D., Whalley, L. K., Cryer, D. R., Heard, D. E., Lee, J. D., Reed, C., and Bloss, W. J.: On the interpretation of: In situ HONO observations via photochemical steady state, Faraday Discuss., 189, 191–212, https://doi.org/10.1039/c5fd00224a, 2016.
Donaldson, M. A., Bish, D. L., and Raff, J. D.: Soil surface acidity plays a determining role in the atmospheric-terrestrial exchange of nitrous acid, P. Natl. Acad. Sci. USA, 111, 18472–18477, https://doi.org/10.1073/pnas.1418545112, 2014.
Fu, X., Wang, T., Zhang, L., Li, Q., Wang, Z., Xia, M., Yun, H., Wang, W., Yu, C., Yue, D., Zhou, Y., Zheng, J., and Han, R.: The significant contribution of HONO to secondary pollutants during a severe winter pollution event in southern China, Atmos. Chem. Phys., 19, 1–14, https://doi.org/10.5194/acp-19-1-2019, 2019.
Ge, S., Wang, G., Zhang, S., Li, D., Xie, Y., Wu, C., Yuan, Q., Chen, J., and Zhang, H.: Abundant NH3 in China Enhances Atmospheric HONO Production by Promoting the Heterogeneous Reaction of SO2 with NO2, Environ. Sci. Technol., 53, 14339–14347, https://doi.org/10.1021/acs.est.9b04196, 2019.
George, C., Strekowski, R. S., Kleffmann, J., Stemmler, K., and Ammann, M.: Photoenhanced uptake of gaseous NO2 on solid organic compounds: A photochemical source of HONO?, Faraday Discuss., 130, 195–210, https://doi.org/10.1039/b417888m, 2005.
Han, C., Yang, W., Wu, Q., Yang, H., and Xue, X.: Heterogeneous Photochemical Conversion of NO2 to HONO on the Humic Acid Surface under Simulated Sunlight, Environ. Sci. Technol., 50, 5017–5023, https://doi.org/10.1021/acs.est.5b05101, 2016.
Han, C., Yang, W., Yang, H., and Xue, X.: Enhanced photochemical conversion of NO2 to HONO on humic acids in the presence of benzophenone, Environ. Pollut., 231, 979–986, https://doi.org/10.1016/j.envpol.2017.08.107, 2017.
He, L., Zhang, S., Hu, J., Li, Z., Zheng, X., Cao, Y., Xu, G., Yan, M., and Wu, Y.: On-road emission measurements of reactive nitrogen compounds from heavy-duty diesel trucks in China, Environ. Pollut., 262, 114280, https://doi.org/10.1016/j.envpol.2020.114280, 2020.
Heland, J., Kleffmann, J., Kurtenbach, R., and Wiesen, P.: A New Instrument To Measure Gaseous Nitrous Acid (HONO) in the Atmosphere, Environ. Sci. Technol., 35, 3207–3212, https://doi.org/10.1021/es000303t, 2001.
Jenkin, M. E., Saunders, S. M., and Pilling, M. J.: The tropospheric degradation of volatile organic compounds: a protocol for mechanism development, Atmos. Environ., 31, 81–104, https://doi.org/10.1016/S1352-2310(96)00105-7, 1997.
Jiang, Y., Xue, L., Gu, R., Jia, M., Zhang, Y., Wen, L., Zheng, P., Chen, T., Li, H., Shan, Y., Zhao, Y., Guo, Z., Bi, Y., Liu, H., Ding, A., Zhang, Q., and Wang, W.: Sources of nitrous acid (HONO) in the upper boundary layer and lower free troposphere of the North China Plain: insights from the Mount Tai Observatory, Atmos. Chem. Phys., 20, 12115–12131, https://doi.org/10.5194/acp-20-12115-2020, 2020.
Kalthoff, N., Horlacher, V., Corsmeier, U., Volz-Thomas, A., Kolahgar, B., Geiß, H., Möllmann-Coers, M., and Knaps, A.: Influence of valley winds on transport and dispersion of airborne pollutants in the Freiburg-Schauinsland area, J. Geophys. Res.-Atmos., 105, 1585–1597, https://doi.org/10.1029/1999JD900999, 2000.
Kanaya, Y., Pochanart, P., Liu, Y., Li, J., Tanimoto, H., Kato, S., Suthawaree, J., Inomata, S., Taketani, F., Okuzawa, K., Kawamura, K., Akimoto, H., and Wang, Z. F.: Rates and regimes of photochemical ozone production over Central East China in June 2006: a box model analysis using comprehensive measurements of ozone precursors, Atmos. Chem. Phys., 9, 7711–7723, https://doi.org/10.5194/acp-9-7711-2009, 2009.
Kanaya, Y., Akimoto, H., Wang, Z.-F., Pochanart, P., Kawamura, K., Liu, Y., Li, J., Komazaki, Y., Irie, H., Pan, X.-L., Taketani, F., Yamaji, K., Tanimoto, H., Inomata, S., Kato, S., Suthawaree, J., Okuzawa, K., Wang, G., Aggarwal, S. G., Fu, P. Q., Wang, T., Gao, J., Wang, Y., and Zhuang, G.: Overview of the Mount Tai Experiment (MTX2006) in central East China in June 2006: studies of significant regional air pollution, Atmos. Chem. Phys., 13, 8265–8283, https://doi.org/10.5194/acp-13-8265-2013, 2013.
Kerbrat, M., Legrand, M., Preunkert, S., Gallée, H., and Kleffmann, J.: Nitrous acid at Concordia (inland site) and Dumont d'Urville (coastal site), East Antarctica, J. Geophys. Res.-Atmos., 117, D08303, https://doi.org/10.1029/2011JD017149, 2012.
Kleffmann, J.: Daytime Sources of Nitrous Acid (HONO) in the Atmospheric Boundary Layer, Chem. Phys. Chem., 8, 1137–1144, https://doi.org/10.1002/cphc.200700016, 2007.
Kleffmann, J. and Wiesen, P.: Technical Note: Quantification of interferences of wet chemical HONO LOPAP measurements under simulated polar conditions, Atmos. Chem. Phys., 8, 6813–6822, https://doi.org/10.5194/acp-8-6813-2008, 2008.
Kleffmann, J., Becker, K. H., and Wiesen, P.: Heterogeneous NO2 conversion processes on acid surfaces: Possible atmospheric implications, Atmos. Environ., 32, 2721–2729, https://doi.org/10.1016/S1352-2310(98)00065-X, 1998.
Kleffmann, J., Heland, J., Kurtenbach, R., Lörzer, J., and Wiesen, P.: A New Instrument (LOPAP) for the Detection of Nitrous Acid (HONO), Environ. Sci. Pollut. Res., 9, 48–54, 2002.
Kleffmann, J., Gavriloaiei, T., Hofzumahaus, A., Holland, F., Koppmann, R., Rupp, L., Schlosser, E., Siese, M., and Wahner, A.: Daytime formation of nitrous acid: A major source of OH radicals in a forest, Geophys. Res. Lett., 32, L05818, https://doi.org/10.1029/2005GL022524, 2005.
Kleffmann, J., Lörzer, J. C., Wiesen, P., Kern, C., Trick, S., Volkamer, R., Rodenas, M., and Wirtz, K.: Intercomparison of the DOAS and LOPAP techniques for the detection of nitrous acid (HONO), Atmos. Environ., 40, 3640–3652, https://doi.org/10.1016/j.atmosenv.2006.03.027, 2006.
Klosterköther, A., Kurtenbach, R., Wiesen, P., and Kleffmann, J.: Determination of the emission indices for NO, NO2 , HONO, HCHO, CO, and particles emitted from candles, Indoor Air, 31, 116–127, https://doi.org/10.1111/ina.12714, 2021.
Kramer, L. J., Crilley, L. R., Adams, T. J., Ball, S. M., Pope, F. D., and Bloss, W. J.: Nitrous acid (HONO) emissions under real-world driving conditions from vehicles in a UK road tunnel, Atmos. Chem. Phys., 20, 5231–5248, https://doi.org/10.5194/acp-20-5231-2020, 2020.
Kurtenbach, R., Becker, K. H., Gomes, J. A. G., Kleffmann, J., Lörzer, J. C., Spittler, M., Wiesen, P., Ackermann, R., Geyer, A., and Platt, U.: Investigations of emissions and heterogeneous formation of HONO in a road traffic tunnel, Atmos. Environ., 35, 3385–3394, https://doi.org/10.1016/S1352-2310(01)00138-8, 2001.
Kurtenbach, R., Kleffmann, J., Niedojadlo, A., and Wiesen, P.: Primary NO2 emissions and their impact on air quality in traffic environments in Germany, Environ. Sci. Eur., 24, 21, https://doi.org/10.1186/2190-4715-24-21, 2012.
Laufs, S. and Kleffmann, J.: Investigations on HONO formation from photolysis of adsorbed HNO3 on quartz glass surfaces, Phys. Chem. Chem. Phys., 18, 9616–9625, https://doi.org/10.1039/c6cp00436a, 2016.
Legrand, M., Preunkert, S., Frey, M., Bartels-Rausch, Th., Kukui, A., King, M. D., Savarino, J., Kerbrat, M., and Jourdain, B.: Large mixing ratios of atmospheric nitrous acid (HONO) at Concordia (East Antarctic Plateau) in summer: a strong source from surface snow?, Atmos. Chem. Phys., 14, 9963–9976, https://doi.org/10.5194/acp-14-9963-2014, 2014.
Li, D., Xue, L., Wen, L., Wang, X., Chen, T., Mellouki, A., Chen, J., and Wang, W.: Characteristics and sources of nitrous acid in an urban atmosphere of northern China: Results from 1-yr continuous observations, Atmos. Environ., 182, 296–306, https://doi.org/10.1016/j.atmosenv.2018.03.033, 2018.
Li, J., Zhu, C., Chen, H., Zhao, D., Xue, L., Wang, X., Li, H., Liu, P., Liu, J., Zhang, C., Mu, Y., Zhang, W., Zhang, L., Herrmann, H., Li, K., Liu, M., and Chen, J.: The evolution of cloud and aerosol microphysics at the summit of Mt. Tai, China, Atmos. Chem. Phys., 20, 13735–13751, https://doi.org/10.5194/acp-20-13735-2020, 2020.
Liu, J., Li, S., Mekic, M., Jiang, H., Zhou, W., Loisel, G., Song, W., Wang, X., and Gligorovski, S.: Photoenhanced Uptake of NO2 and HONO Formation on Real Urban Grime, Environ. Sci. Technol. Lett., 6, 413–417, https://doi.org/10.1021/acs.estlett.9b00308, 2019.
Liu, P., Ye, C., Xue, C., Zhang, C., Mu, Y., and Sun, X.: Formation mechanisms of atmospheric nitrate and sulfate during the winter haze pollution periods in Beijing: gas-phase, heterogeneous and aqueous-phase chemistry, Atmos. Chem. Phys., 20, 4153–4165, https://doi.org/10.5194/acp-20-4153-2020, 2020.
Liu, X., Cheng, Y., Zhang, Y., Jung, J., Sugimoto, N., Chang, S.-Y., Kim, Y. J., Fan, S., and Zeng, L.: Influences of relative humidity and particle chemical composition on aerosol scattering properties during the 2006 PRD campaign, Atmos. Environ., 42, 1525–1536, https://doi.org/10.1016/j.atmosenv.2007.10.077, 2008.
Liu, Y., Lu, K., Ma, Y., Yang, X., Zhang, W., Wu, Y., Peng, J., Shuai, S., Hu, M., and Zhang, Y.: Direct emission of nitrous acid (HONO) from gasoline cars in China determined by vehicle chassis dynamometer experiments, Atmos. Environ., 169, 89–96, https://doi.org/10.1016/j.atmosenv.2017.07.019, 2017.
Liu, Y., Lu, K., Li, X., Dong, H., Tan, Z., Wang, H., Zou, Q., Wu, Y., Zeng, L., Hu, M., Min, K.-E., Kecorius, S., Wiedensohler, A., and Zhang, Y.: A Comprehensive Model Test of the HONO Sources Constrained to Field Measurements at Rural North China Plain, Environ. Sci. Technol., 53, 3517–3525, https://doi.org/10.1021/acs.est.8b06367, 2019.
Ma, Q., Wang, T., Liu, C., He, H., Wang, Z., Wang, W., and Liang, Y.: SO2 Initiates the Efficient Conversion of NO2 to HONO on MgO Surface, Environ. Sci. Technol., 51, 3767–3775, https://doi.org/10.1021/acs.est.6b05724, 2017.
Marion, A., Morin, J., Gandolfo, A., Ormeño, E., D'Anna, B., and Wortham, H.: Nitrous acid formation on Zea mays leaves by heterogeneous reaction of nitrogen dioxide in the laboratory, Environ. Res., 193, 110543, https://doi.org/10.1016/j.envres.2020.110543, 2021.
Meng, F., Qin, M., Tang, K., Duan, J., Fang, W., Liang, S., Ye, K., Xie, P., Sun, Y., Xie, C., Ye, C., Fu, P., Liu, J., and Liu, W.: High-resolution vertical distribution and sources of HONO and NO2 in the nocturnal boundary layer in urban Beijing, China, Atmos. Chem. Phys., 20, 5071–5092, https://doi.org/10.5194/acp-20-5071-2020, 2020.
Michoud, V., Kukui, A., Camredon, M., Colomb, A., Borbon, A., Miet, K., Aumont, B., Beekmann, M., Durand-Jolibois, R., Perrier, S., Zapf, P., Siour, G., Ait-Helal, W., Locoge, N., Sauvage, S., Afif, C., Gros, V., Furger, M., Ancellet, G., and Doussin, J. F.: Radical budget analysis in a suburban European site during the MEGAPOLI summer field campaign, Atmos. Chem. Phys., 12, 11951–11974, https://doi.org/10.5194/acp-12-11951-2012, 2012.
Monge, M. E., D'Anna, B., Mazri, L., Giroir-Fendler, A., Ammann, M., Donaldson, D. J., and George, C.: Light changes the atmospheric reactivity of soot, P. Natl. Acad. Sci. USA, 107, 6605–6609, https://doi.org/10.1073/pnas.0908341107, 2010.
Ndour, M., D'Anna, B., George, C., Ka, O., Balkanski, Y., Kleffmann, J., Stemmler, K., and Ammann, M.: Photoenhanced uptake of NO2 on mineral dust: Laboratory experiments and model simulations, Geophys. Res. Lett., 35, L05812, https://doi.org/10.1029/2007GL032006, 2008.
Nie, W., Ding, A. J., Xie, Y. N., Xu, Z., Mao, H., Kerminen, V.-M., Zheng, L. F., Qi, X. M., Huang, X., Yang, X.-Q., Sun, J. N., Herrmann, E., Petäjä, T., Kulmala, M., and Fu, C. B.: Influence of biomass burning plumes on HONO chemistry in eastern China, Atmos. Chem. Phys., 15, 1147–1159, https://doi.org/10.5194/acp-15-1147-2015, 2015.
Oswald, R., Behrendt, T., Ermel, M., Wu, D., Su, H., Cheng, Y., Breuninger, C., Moravek, A., Mougin, E., Delon, C., Loubet, B., Pommerening-Röser, A., Sörgel, M., Pöschl, U., Hoffmann, T., Andreae, M. O., Meixner, F. X., and Trebs, I.: HONO emissions from soil bacteria as a major source of atmospheric reactive nitrogen, Science, 341, 1233–1235, https://doi.org/10.1126/science.1242266, 2013.
Peng, Q., Palm, B. B., Melander, K. E., Lee, B. H., Hall, S. R., Ullmann, K., Campos, T., Weinheimer, A. J., Apel, E. C., Hornbrook, R. S., Hills, A. J., Montzka, D. D., Flocke, F., Hu, L., Permar, W., Wielgasz, C., Lindaas, J., Pollack, I. B., Fischer, E. V., Bertram, T. H., and Thornton, J. A.: HONO Emissions from Western U.S. Wildfires Provide Dominant Radical Source in Fresh Wildfire Smoke, Environ. Sci. Technol., 54, 5954–5963, https://doi.org/10.1021/acs.est.0c00126, 2020.
Platt, U., Perner, D., Harris, G. W., Winer, A. M., and Pitts Jr, J. N.: Observations of nitrous acid in an urban atmosphere by differential optical absorption, Nature, 285, 312–314, https://doi.org/10.1038/285312a0, 1980.
Rohrer, F. and Berresheim, H.: Strong correlation between levels of tropospheric hydroxyl radicals and solar ultraviolet radiation, Nature, 442, 184–187, https://doi.org/10.1038/nature04924, 2006.
Romer, P. S., Wooldridge, P. J., Crounse, J. D., Kim, M. J., Wennberg, P. O., Dibb, J. E., Scheuer, E., Blake, D. R., Meinardi, S., Brosius, A. L., Thames, A. B., Miller, D. O., Brune, W. H., Hall, S. R., Ryerson, T. B., and Cohen, R. C.: Constraints on Aerosol Nitrate Photolysis as a Potential Source of HONO and NOx, Environ. Sci. Technol., 52, 13738–13746, https://doi.org/10.1021/acs.est.8b03861, 2018.
Schmid, F., Schmidli, J., Hervo, M., and Haefele, A.: Diurnal Valley Winds in a Deep Alpine Valley: Observations, Atmosphere, 11, 54, https://doi.org/10.3390/atmos11010054, 2020.
Shi, Q., Tao, Y., Krechmer, J. E., Heald, C. L., Murphy, J. G., Kroll, J. H., and Ye, Q.: Laboratory Investigation of Renoxification from the Photolysis of Inorganic Particulate Nitrate, Environ. Sci. Technol., 55, 854–861, https://doi.org/10.1021/acs.est.0c06049, 2021.
Sosedova, Y., Rouvière, A., Bartels-Rausch, T., and Ammann, M.: UVA/Vis-induced nitrous acid formation on polyphenolic films exposed to gaseous NO2, Photochem. Photobiol. Sci., 10, 1680–1690, https://doi.org/10.1039/c1pp05113j, 2011.
Stemmler, K., Ammann, M., Donders, C., Kleffmann, J., and George, C.: Photosensitized reduction of nitrogen dioxide on humic acid as a source of nitrous acid, Nature, 440, 195–198, https://doi.org/10.1038/nature04603, 2006.
Stemmler, K., Ndour, M., Elshorbany, Y., Kleffmann, J., D'Anna, B., George, C., Bohn, B., and Ammann, M.: Light induced conversion of nitrogen dioxide into nitrous acid on submicron humic acid aerosol, Atmos. Chem. Phys., 7, 4237–4248, https://doi.org/10.5194/acp-7-4237-2007, 2007.
Stutz, J., Alicke, B., and Neftel, A.: Nitrous acid formation in the urban atmosphere: Gradient measurements of NO2 and HONO over grass in Milan, Italy, J. Geophys. Res.-Atmos., 107, 8192, https://doi.org/10.1029/2001JD000390, 2002.
Su, H., Cheng, Y., Oswald, R., Behrendt, T., Trebs, I., Meixner, F. X., Andreae, M. O., Cheng, P., Zhang, Y., and Pöschl, U.: Soil Nitrite as a Source of Atmospheric HONO and OH Radicals, Science, 333, 1616–1618, https://doi.org/10.1126/science.1207687, 2011.
Theys, N., Volkamer, R., Müller, J.-F., Zarzana, K. J., Kille, N., Clarisse, L., De Smedt, I., Lerot, C., Finkenzeller, H., Hendrick, F., Koenig, T. K., Lee, C. F., Knote, C., Yu, H., and Van Roozendael, M.: Global nitrous acid emissions and levels of regional oxidants enhanced by wildfires, Nat. Geosci., 13, 681–686, https://doi.org/10.1038/s41561-020-0637-7, 2020.
Villena, G., Wiesen, P., Cantrell, C. A., Flocke, F., Fried, A., Hall, S. R., Hornbrook, R. S., Knapp, D., Kosciuch, E., Mauldin, R. L., McGrath, J. A., Montzka, D., Richter, D., Ullmann, K., Walega, J., Weibring, P., Weinheimer, A., Staebler, R. M., Liao, J., Huey, L. G., and Kleffmann, J.: Nitrous acid (HONO) during polar spring in Barrow, Alaska: A net source of OH radicals?, J. Geophys. Res.-Atmos., 116, D00R07, https://doi.org/10.1029/2011JD016643, 2011.
Wang, L., Wen, L., Xu, C., Chen, J., Wang, X., Yang, L., Wang, W., Yang, X., Sui, X., Yao, L., and Zhang, Q.: HONO and its potential source particulate nitrite at an urban site in North China during the cold season, Sci. Total Environ., 538, 93–101, https://doi.org/10.1016/j.scitotenv.2015.08.032, 2015.
Wang, X., Dalton, E. Z., Payne, Z. C., Perrier, S., Riva, M., Raff, J. D., and George, C.: Superoxide and Nitrous Acid Production from Nitrate Photolysis Is Enhanced by Dissolved Aliphatic Organic Matter, Environ. Sci. Tech. Let., 8, 53–58, https://doi.org/10.1021/acs.estlett.0c00806, 2021.
Wild, R. J., Dubé, W. P., Aikin, K. C., Eilerman, S. J., Neuman, J. A., Peischl, J., Ryerson, T. B., and Brown, S. S.: On-road measurements of vehicle NO2/NOx emission ratios in Denver, Colorado, USA, Atmos. Environ., 148, 182–189, https://doi.org/10.1016/j.atmosenv.2016.10.039, 2017.
Xue, C., Ye, C., Zhang, Y., Ma, Z., Liu, P., Zhang, C., Zhao, X., Liu, J., and Mu, Y.: Development and application of a twin open-top chambers method to measure soil HONO emission in the North China Plain, Sci. Total Environ., 659, 621–631, https://doi.org/10.1016/j.scitotenv.2018.12.245, 2019a.
Xue, C., Ye, C., Ma, Z., Liu, P., Zhang, Y., Zhang, C., Tang, K., Zhang, W., Zhao, X., Wang, Y., Song, M., Liu, J., Duan, J., Qin, M., Tong, S., Ge, M., and Mu, Y.: Development of stripping coil-ion chromatograph method and intercomparison with CEAS and LOPAP to measure atmospheric HONO, Sci. Total Environ., 646, 187–195, https://doi.org/10.1016/j.scitotenv.2018.07.244, 2019b.
Xue, C., Zhang, C., Ye, C., Liu, P., Catoire, V., Krysztofiak, G., Chen, H., Ren, Y., Zhao, X., Wang, J., Zhang, F., Zhang, C., Zhang, J., An, J., Wang, T., Chen, J., Kleffmann, J., Mellouki, A., and Mu, Y.: HONO Budget and Its Role in Nitrate Formation in the Rural North China Plain, Environ. Sci. Technol., 54, 11048–11057, https://doi.org/10.1021/acs.est.0c01832, 2020.
Xue, C., Ye, C., Kleffmann, J., Zhang, W., He, X., Liu, P., Zhang, C., Zhao, X., Liu, C., Ma, Z., Liu, J., Wang, J., Lu, K., Catoire, V., Mellouki, A., and Mu, Y.: Atmospheric measurements at Mt. Tai – Part II: HONO budget and radical (ROx + NO3) chemistry in the lower boundary layer, Atmos. Chem. Phys., 22, 1035–1057, https://doi.org/10.5194/acp-22-1035-2022, 2022.
Ye, C., Zhou, X., Pu, D., Stutz, J., Festa, J., Spolaor, M., Tsai, C., Cantrell, C., Mauldin, R. L., Campos, T., Weinheimer, A., Hornbrook, R. S., Apel, E. C., Guenther, A., Kaser, L., Yuan, B., Karl, T., Haggerty, J., Hall, S., Ullmann, K., Smith, J. N., Ortega, J., and Knote, C.: Rapid cycling of reactive nitrogen in the marine boundary layer, Nature, 532, 489–491, https://doi.org/10.1038/nature17195, 2016.
Ye, C., Zhang, N., Gao, H., and Zhou, X.: Photolysis of Particulate Nitrate as a Source of HONO and NOx, Environ. Sci. Technol., 51, 6849–6856, https://doi.org/10.1021/acs.est.7b00387, 2017.
Ye, C., Zhou, X., Pu, D., Stutz, J., Festa, J., Spolaor, M., Tsai, C., Cantrell, C., Mauldin III, R. L., Weinheimer, A., Hornbrook, R. S., Apel, E. C., Guenther, A., Kaser, L., Yuan, B., Karl, T., Haggerty, J., Hall, S., Ullmann, K., Smith, J., and Ortega, J.: Tropospheric HONO distribution and chemistry in the southeastern US, Atmos. Chem. Phys., 18, 9107–9120, https://doi.org/10.5194/acp-18-9107-2018, 2018.
Ye, Z. J., Segal, M., and Pielke, R. A.: Effects of Atmospheric Thermal Stability and Slope Steepness on the Development of Daytime Thermally Induced Upslope Flow, J. Atmos. Sci., 44, 3341–3354, https://doi.org/10.1175/1520-0469(1987)044<3341:EOATSA>2.0.CO;2, 1987.
Zhang, J., An, J., Qu, Y., Liu, X., and Chen, Y.: Impacts of potential HONO sources on the concentrations of oxidants and secondary organic aerosols in the Beijing-Tianjin-Hebei region of China, Sci. Total Environ., 647, 836–852, https://doi.org/10.1016/j.scitotenv.2018.08.030, 2019a.
Zhang, J., Chen, J., Xue, C., Chen, H., Zhang, Q., Liu, X., Mu, Y., Guo, Y., Wang, D., Chen, Y., Li, J., Qu, Y., and An, J.: Impacts of six potential HONO sources on HOx budgets and SOA formation during a wintertime heavy haze period in the North China Plain, Sci. Total Environ., 681, 110–123, https://doi.org/10.1016/j.scitotenv.2019.05.100, 2019b.
Zhang, L., Wang, T., Zhang, Q., Zheng, J., Xu, Z., and Lv, M.: Potential sources of nitrous acid (HONO) and their impacts on ozone: A WRF-Chem study in a polluted subtropical region, J. Geophys. Res.-Atmos., 121, 3645–3662, https://doi.org/10.1002/2015JD024468, 2016.
Zhang, N., Zhou, X., Shepson, P. B., Gao, H., Alaghmand, M., and Stirm, B.: Aircraft measurement of HONO vertical profiles over a forested region, Geophys. Res. Lett., 36, L15820, https://doi.org/10.1029/2009GL038999, 2009.
Zhang, S., Sarwar, G., Xing, J., Chu, B., Xue, C., Sarav, A., Ding, D., Zheng, H., Mu, Y., Duan, F., Ma, T., and He, H.: Improving the representation of HONO chemistry in CMAQ and examining its impact on haze over China, Atmos. Chem. Phys., 21, 15809–15826, https://doi.org/10.5194/acp-21-15809-2021, 2021.
Zhou, X., He, Y., Huang, G., Thornberry, T. D., Carroll, M. A., and Bertman, S. B.: Photochemical production of nitrous acid on glass sample manifold surface, Geophys. Res. Lett., 29, 26-1–26-4, https://doi.org/10.1029/2002GL015080, 2002.
Zhou, X., Gao, H., He, Y., Huang, G., Bertman, S. B., Civerolo, K., and Schwab, J.: Nitric acid photolysis on surfaces in low-NOx environments: Significant atmospheric implications, Geophys. Res. Lett., 30, 2217, https://doi.org/10.1029/2003GL018620, 2003.
Zhou, X., Huang, G., Civerolo, K., Roychowdhury, U., and Demerjian, K. L.: Summertime observations of HONO, HCHO,and O3 at the summit of W hiteface Mountain, New York, J. Geophys. Res.-Atmos., 112, 1–13, https://doi.org/10.1029/2006JD007256, 2007.
Zhou, X., Zhang, N., TeraVest, M., Tang, D., Hou, J., Bertman, S., Alaghmand, M., Shepson, P. B., Carroll, M. A., Griffith, S., Dusanter, S., and Stevens, P. S.: Nitric acid photolysis on forest canopy surface as a source for tropospheric nitrous acid, Nat. Geosci., 4, 440–443, https://doi.org/10.1038/ngeo1164, 2011.