the Creative Commons Attribution 4.0 License.
the Creative Commons Attribution 4.0 License.
 | 08 Mar 2022
Technical note: Real-time diagnosis of the hygroscopic growth micro-dynamics of nanoparticles with Fourier transform infrared spectroscopy
Xiuli Wei
Haosheng Dai
Huaqiao Gui
Jiaoshi Zhang
Yin Cheng
Jie Wang
Yixin Yang
Jianguo Liu
Nanoparticles can absorb water to grow, and this process will affect the light-scattering behavior, cloud condensation nuclei properties, lifetime, and chemical reactivity of these particles. Current techniques for calculation of aerosol liquid water content (ALWC) usually restrict the size of particles to be within a certain range, which may result in a large uncertainty when the particle size is beyond the specified range. Furthermore, current techniques are difficult to use to identify the intermolecular interactions of phase transition micro-dynamics during particles' hygroscopic growth process because their limited temporal resolutions are unable to capture complex intermediate states. In this study, the hygroscopic growth properties of nanoparticles with electrical mobility diameters (Dem) of ∼ 100 nm and their phase transition micro-dynamics at the molecular level are characterized in real time by using the Fourier transform infrared (FTIR) spectroscopic technique. We develop a novel real-time method for ALWC calculation by reconstructing the absorption spectra of liquid water and realize real-time measurements of water content and dry nanoparticle mass to characterize hygroscopic growth factors (GFs). The calculated GFs are generally in good agreement with the Extended Aerosol Inorganics Model (E-AIM) predictions. We also explore the phenomenon that the deliquescence points of the ammonium sulfate sodium nitrate () mixed nanoparticles and the AS oxalic acid () mixed nanoparticles are lower than that of the pure AS. We further normalize the FTIR spectra of nanoparticles into 2D IR spectra and identify in real time the hydration interactions and the dynamic hygroscopic growth process of the functional groups for AS, , and nanoparticles. The results show that both SN and OA compounds can lower the deliquescence point of AS, but they affect AS differently. The SN can change but OA cannot change the hydrolysis reaction mechanism of AS during the hygroscopic growth process. Compared with previous studies, we captured more complex processes and the intermediate state of the hygroscopic growth of nanoparticles. This study not only can provide important information with respect to the difference in the phase transition point under different conditions but also can improve current understanding of the chemical interaction mechanism between nanoparticles (particularly for organic particles) and the surrounding medium, which is of great significance for investigation of haze formation in the atmosphere.
- Article
(3266 KB) - Full-text XML
-
Supplement
(337 KB) - BibTeX
- EndNote


Nanoparticles have long atmospheric lifetimes of weeks to months (Lee and Allen, 2012). As relative humidity (RH) increases, the sizes of nanoparticles will grow due to the absorption of water, which may have complex phases and mixing states (Riemer et al., 2019) that influence the light-scattering behavior, cloud condensation nuclei properties, lifetime, and chemical reactivity of the nanoparticles (Vogel et al., 2016; Abbott and Cronin, 2021). Improved knowledge of these complex phases and mixing states is crucial for investigating gas–particle interactions in the atmosphere. Since the nanoparticle size vs. water uptake relationship is influenced by mixing characteristics of various inorganic and organic compounds (Nguyen et al., 2016; Steinfeld and Pandis, 2016), characterization of the water–aerosol interactions is also critical for identifying the fate and transport of trace species in the Earth's system and their effects on air quality, radiative forcing, and regional hydrological cycling (Carlton et al., 2020; Fan et al., 2018).
Ammonium sulfate ((NH4)2SO4, AS) is an important atmospheric constituent and a major source of atmospheric nanoparticles that originated from anthropogenic activities (Ruehl et al., 2016; Kirkby et al., 2011; Xu et al., 2020). Various techniques such as the hygroscopic tandem differential mobility analyzer (H-TDMA), the electrodynamic balance (EDB), and the environmental scanning electron microscope (ESEM) have been used to investigate the hygroscopicity of AS (Tang and Munkelwitz, 1977, 1994; Gysel et al., 2002; Matsumura and Hayashi, 2007). These methods can characterize the deliquescence or phase transition process of particles down to the nanoscale. However, they usually restrict the size of particle to be within a certain range in calculation of aerosol liquid water content (ALWC), which may result in a large uncertainty when the particle size is beyond the specified range. Furthermore, current techniques are difficult to use to identify the intermolecular chemical interactions of phase transition micro-dynamics during nanoparticles' hygroscopic growth process because their limited temporal resolutions are unable to capture complex intermediate states.
Recent studies concluded that the phase transition process of nanoparticles may include multiple intermediate states and are more complex than those disclosed in previous studies. These intermediate states differ from one to the other and last less than 10 ms (Esat et al., 2018). A label-free photonic microscope which uses Bloch surface waves as the illumination source for imaging and sensing is capable of providing real-time measurements of the hygroscopic growth process of a single particle with a diameter of less than 100 nm (Kuai et al., 2020). It can provide valuable insights into the deliquescence and phase transition mechanisms of nanoparticles but cannot identify the chemical composition information of the nanoparticles deliquescence or growth or phase transition process. It is necessary to develop a method to characterize the intermolecular interaction mechanisms of the hygroscopic growth of nanoparticles, which is crucial to understanding the physicochemical properties of atmospheric aerosol and the nanoparticle–water interactions during aerosol's hygroscopic growth process. This information is of great significance for improving current knowledge of haze formation.
In this study, the hygroscopic growth properties of pure AS, the (AS sodium nitrate (SN)) mixed nanoparticles, and the (NH4)2SO4 oxalic acid () mixed nanoparticles as well as their phase transition interactions at the molecular level are characterized in real time by using the Fourier transform infrared (FTIR) spectroscopic technique. We first use a FTIR spectrometer to measure and the Extended Aerosol Inorganics Model (E-AIM) to predict the hygroscopic growth factors (GFs) of AS, , and nanoparticles. We further normalize the FTIR spectra of nanoparticles into 2D IR spectra to analyze the intermolecular interactions during the hygroscopic growth processes of these nanoparticles. This study not only can provide important information with respect to the difference in phase transition point under different conditions but also can improve current understanding of the chemical interaction mechanism between nanoparticles (particularly for organic particles) and the surrounding medium, which is of great significance for investigation of haze formation in the atmosphere.
2.1 Experiment description
The experimental setup includes a nanoparticle generation system, a humidification system, and a FTIR analysis system. Particles are aerosolized by an atomizer (model 255, Met One), dried by a diffusion dryer (model 3062, TSI), sorted into a specific electrical mobility diameter (Dem) by a differential mobility analyzer (DMA; model 3082, TSI), and finally deposited onto a 3 cm × 3 cm zinc selenide (ZnSe) substrate inside a cylinder sample cell with a radius of 3 cm and a length of 4 cm through a cone-shaped hole (Fig. 1). The sheath-to-sample flow ratio of the DMA is set to be 10 : 1 (the sheath flow is 10 L min−1, and the sample flow is 1 L min−1), which can produce an effective mobility for the measured aerosols with sizes ranging from 14.9 to 673.2 nm. We only selected nanoparticles with Dem values of ∼ 100 nm for deposition. After a deposition time of ∼ 12 h, the substrate is sealed inside the sample cell to obtain a stable RH condition for subsequent analysis. There are about 100 000 nanoparticles deposited onto the substrate. For the 100 nm nanoparticle, its hydration characteristic mainly depends on its chemical composition, and the Kelvin effect is negligible (Cruz and Pandis, 2000; Lee et al., 1998). The enrichment of the nanoparticles is to improve the signal of FTIR measurement because the hygroscopic signal of a single nanoparticle is too weak to be measured by the FTIR method. Since the chemical composition is not changed during the deposition, this deposition process can obtain the same results as those for a single particle.
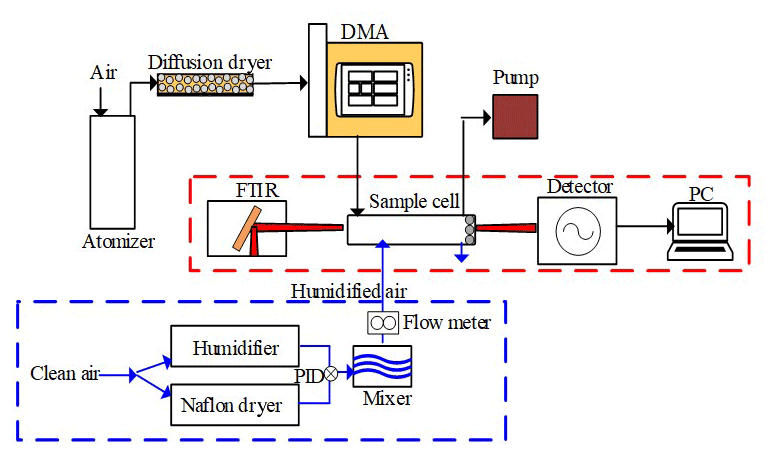
Figure 1Diagrammatic sketches of the experimental system used to measure nanoparticle hygroscopicity. The dashed red box represents the FTIR system, and the dashed blue box represents the humidification system (DMA: differential mobility analyzer; PID: proportional integral differential control).
The humidification system can provide a specific RH for the sample cell (Kuai et al., 2020). A RH sensor (HC2-S, Rotronic AG, Switzerland) with an accuracy of ±0.8 % for a 0 %–100 % RH range is mounted at the inlet of the sample cell. The RH downstream of the DMA varies over 16.52 % to 18.74 %, which is well below the efflorescence relative humidity (ERH) of AS (about ∼32 % RH) (Fig. S1 in the Supplement). As a result, the initial states of all nanoparticles are in dry conditions.
The FTIR spectrometer (Tensor 27, Bruker Optics, Germany) starts to take absorption spectra of the samples approximately 5 min after the injection of each designated RH. This time interval is used to stabilize the atmospheric condition, especially the RH, inside the sample cell. The FTIR spectrometer is equipped with a KBr beam splitter and a liquid-nitrogen-cooled mercury cadmium telluride (MCT) detector for measuring the absorption spectra of the samples. A He–Ne laser metrology keeps the FTIR instrument in a good optical alignment. The FTIR spectrometer saves middle infrared (MIR) spectra from 800 to 4000 cm−1 with a spectral resolution of 4 cm−1 and a repeat time of 64 scans. An air conditioner is run uninterruptedly to keep the laboratory at a constant temperature of ∼ 25 ∘C.
2.2 Sample description
In this study, all chemical reagents are produced by the Aladdin Reagent Inc. (reagent grade, 99.8 % purity), and the water is obtained from an ultrapure water system (Direct-Q 3, Millipore). Table 1 summarizes all chemical compounds and their concentrations used in the experiment. The density, solubility, and molecular mass of all chemical compounds are prescribed based on the CRC Handbook of Chemistry and Physics (Lide, 2007). All single chemical compounds are dissolved individually in ultrapure water with a concentration of 4.0 g L−1. All mixed solutions (including and ) are generated by mixing the two corresponding single compounds with a mass ratio of 1 : 1. As a result, both and nanoparticles are internally mixed nanoparticles.
Table 1The density, solubility, and molecular mass of all chemical compounds used in this study.
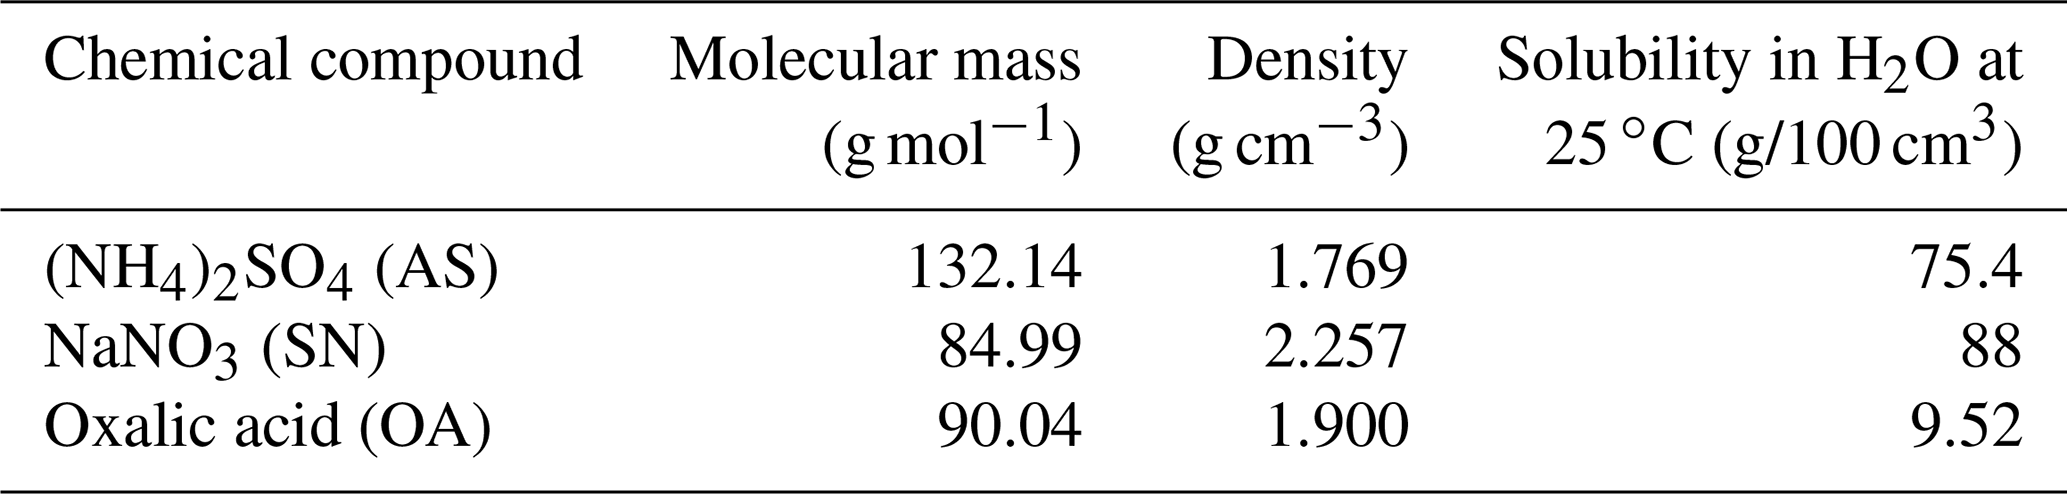
AS is selected as a representative of inorganic salt, and OA is an important water-soluble organic compound contained in atmospheric aerosols. We select AS as a representative of inorganic salt because it is a significant constituent of the submicron-scale aerosol in the atmosphere. In addition to an important water-soluble organic compound contained in atmospheric aerosols (Wang et al., 2019), OA is also the dominant dicarboxylic acid in both urban and remote atmospheric aerosols (Richard et al., 2020).
2.3 Methodology
2.3.1 Quantifying ALWC and the mass of nanoparticles
We first correct the baseline of the measured absorption spectra with the Opus 7.0 software provided by Bruker, Germany. We then iteratively recalculate the spectra with the absorption coefficients of liquid water provided by Downing and Williams (1975) through the non-linear least-squares method till the residual between the measured spectra and the calculated spectra is minimized. We stop the iteration and derive the liquid water content once the root mean square error (RMSE) of the residual is below 0.3 %. After the deliquescence of the nanoparticles and the position of the absorption peak (referring to the wavenumber that shows the strongest absorption) of SO is relatively stable, we use a similar non-linear least-squares method to derive the mass of SO (Msulfate) (Wei et al., 2019). Finally, the mass of AS (MAS), (), and () can be derived with the Msulfate via the following equations.
2.3.2 GF calculation
The GF indicating the water uptake ability of aerosol particles is defined as GF = , where Dwet (cm) is the mean volume equivalent diameter (Dve) of the particles at the designated RH and D0 (cm) is the mean initial Dve of the dry particles at the temperature of the sample cell. In the present work, the RH varies from 50 % to 95 % and we assume that the temperature of the sample cell equals the room temperature of ∼ 25 ∘C. The GF used for investigation of hygroscopic growth properties of nanoparticles can be calculated via Eqs. (4) to (7):
where V0 (cm3) is the initial volume of the dry nanoparticle at approximately 25 ∘C and Vwater (cm3) is the volume of water contained in the nanoparticle at the designated RH. Yan et al. (2020) have compared the Dve and the Dem of AS sorted by a DMA identical to the one used in this study. A good agreement between Dem and Dve for ∼ 100 nm AS was observed by Yan et al. (2020). As a result, in the present work, we use Dem in the same way as the Dve. Mwater (g) is the calculated water content at the designated RH; Mi (g) is the calculated mass of the ith pure compound; ρwater (g cm−3) (approximately 1 g cm−3) and ρi (g cm−3) are the densities of water and the ith pure compound, respectively, and i is the number of pure compounds.
We use the Extended Aerosol Inorganics Model (E-AIM) proposed by Wexler and Clegg to predict the GFs of nanoparticles (http://www.aim.env.uea.ac.uk/aim/aim.php, last access: 20 May 2021). The E-AIM takes the solution thermodynamics into consideration, including the water activity, the phase state, and the equilibrium distribution in the particles. The E-AIM calculate the water activity of the organic water mixtures based on the contributions of the functional groups.
2.3.3 The 2D IR analysis method
Although the absorption spectra recorded by the FTIR spectrometer can be used to characterize the liquid water content and the mass of functional groups contained in the nanoparticles during the hygroscopic growth process, the absorption peaks of the nanoparticles (especially for organic compounds) are difficult to separate since they overlap with each other. In contrast, the 2D IR analysis technique can resolve the overlapped absorption peaks (McKelvy et al., 1998; Du et al., 2021) and, more importantly, can provide detailed information about the dynamic hygroscopic growth process of the functional groups (Noda and Ozaki, 2014).
After baseline correction, we normalize all infrared spectra into 2D IR spectra (denoted as D) with the 2DShige software developed by Kwansei Gakuin University, Japan (Noda and Ozaki, 2014). The 2D IR spectra represent the perturbation-induced variations in a series of spectral intensity observed during the interval of external variable RH. As expressed in Eqs. (8) and (9), the 2D IR spectra can be used to calculate the synchronous and asynchronous correlation coefficients of the spectral intensities at different wavenumbers. The wavenumber regions ranging from 800–1400 cm−1 and from 2800–3800 cm−1, which almost cover the absorption features of all identifiable functional groups of interest, are selected for analysis.
Here DT denotes the transposed D and Φ(ν1,ν2) and Ψ(ν1,ν2) represent the synchronous and asynchronous correlation coefficients of the spectral intensities at the wavenumbers v1 and v2, respectively. Ψ(ν1,ν2) is obtained by orthogonalizing D with the Hilbert transform matrix H and calculating the rows cross product between D and the orthogonal matrix HD. The synchronous map displays correlations between all spectral intensities changing in phase in the experiment and shows whether they increase or decrease relatively to each other. The asynchronous correlation map, in contrast, relates spectral intensities that change at different rates and contains information about the sequence of the occurring events. In this study, we use the synchronous correlation maps to diagnose if the spectral intensities at different wavenumbers vary simultaneously and use the asynchronous correlation maps to identify the sequential order of occurrence of the hydration interactions.
In the present work, the red and blue areas in the 2D IR spectra indicate positive and negative correlations of the spectral intensities at v1 and v2, respectively. In the synchronous correlation maps, the positive and negative correlations indicate simultaneous and opposite changes, respectively, in the spectral intensities observed at the wavenumber pair (ν1, ν2). In the asynchronous correlation maps, the positive correlation indicates that the spectral intensity change at ν1 occurs predominantly before that at ν2, while the negative correlation indicates that the spectral intensity change at ν2 occurs predominantly before that at ν1.
3.1 Spectral characteristics of nanoparticles during the hygroscopic growth process
Figure 2 shows the FTIR spectral absorption characteristics of the AS nanoparticles under humidity conditions from 50 % to 90 %. Figure 3 shows the predicted and the measured hygroscopic properties of 100 nm AS nanoparticles as a function of RH during the hygroscopic growth process. The strong absorption peaks observed at 3250 and 1112 cm−1 at the initial RH of 50 % are the stretching vibration peak of OH and the symmetrical stretching vibration peak of SO, respectively (Wang et al., 2017; Nájera and Horn, 2009; Gopalakrishnan et al., 2005). The areas of OH and SO absorption peaks reflect the liquid water content and the concentration of SO contained in the AS nanoparticles. With the increase in RH between 50 % and 79 %, the SO absorption peak (1112 cm−1) starts to shift toward red slowly (Fig. 3), which indicates that liquid water molecules have been attached to the surface of the solid AS nanoparticles, and the SO is then bonded with these liquid water molecules to form a hydrogen bond during this hygroscopic growth process (Yeşilbaş and Boily, 2016). In the meantime, the position and the area of the OH absorption peak do not change significantly, indicating that no hygroscopic growth of the AS nanoparticles occurs for the RH between 50 % and 79 % (Wang et al., 2019; Tang et al., 2016; Nájera and Horn, 2009; Martin, 2000). It is worth noting that the SO has two different absorption peaks in solid and aqueous AS nanoparticles and Fig. 3 only presents the area of SO absorption peak in aqueous AS nanoparticles. As a result, the area of OH absorption peak is zero for the RH between 50 % and 79 % since no hygroscopic growth occurs in this RH range.
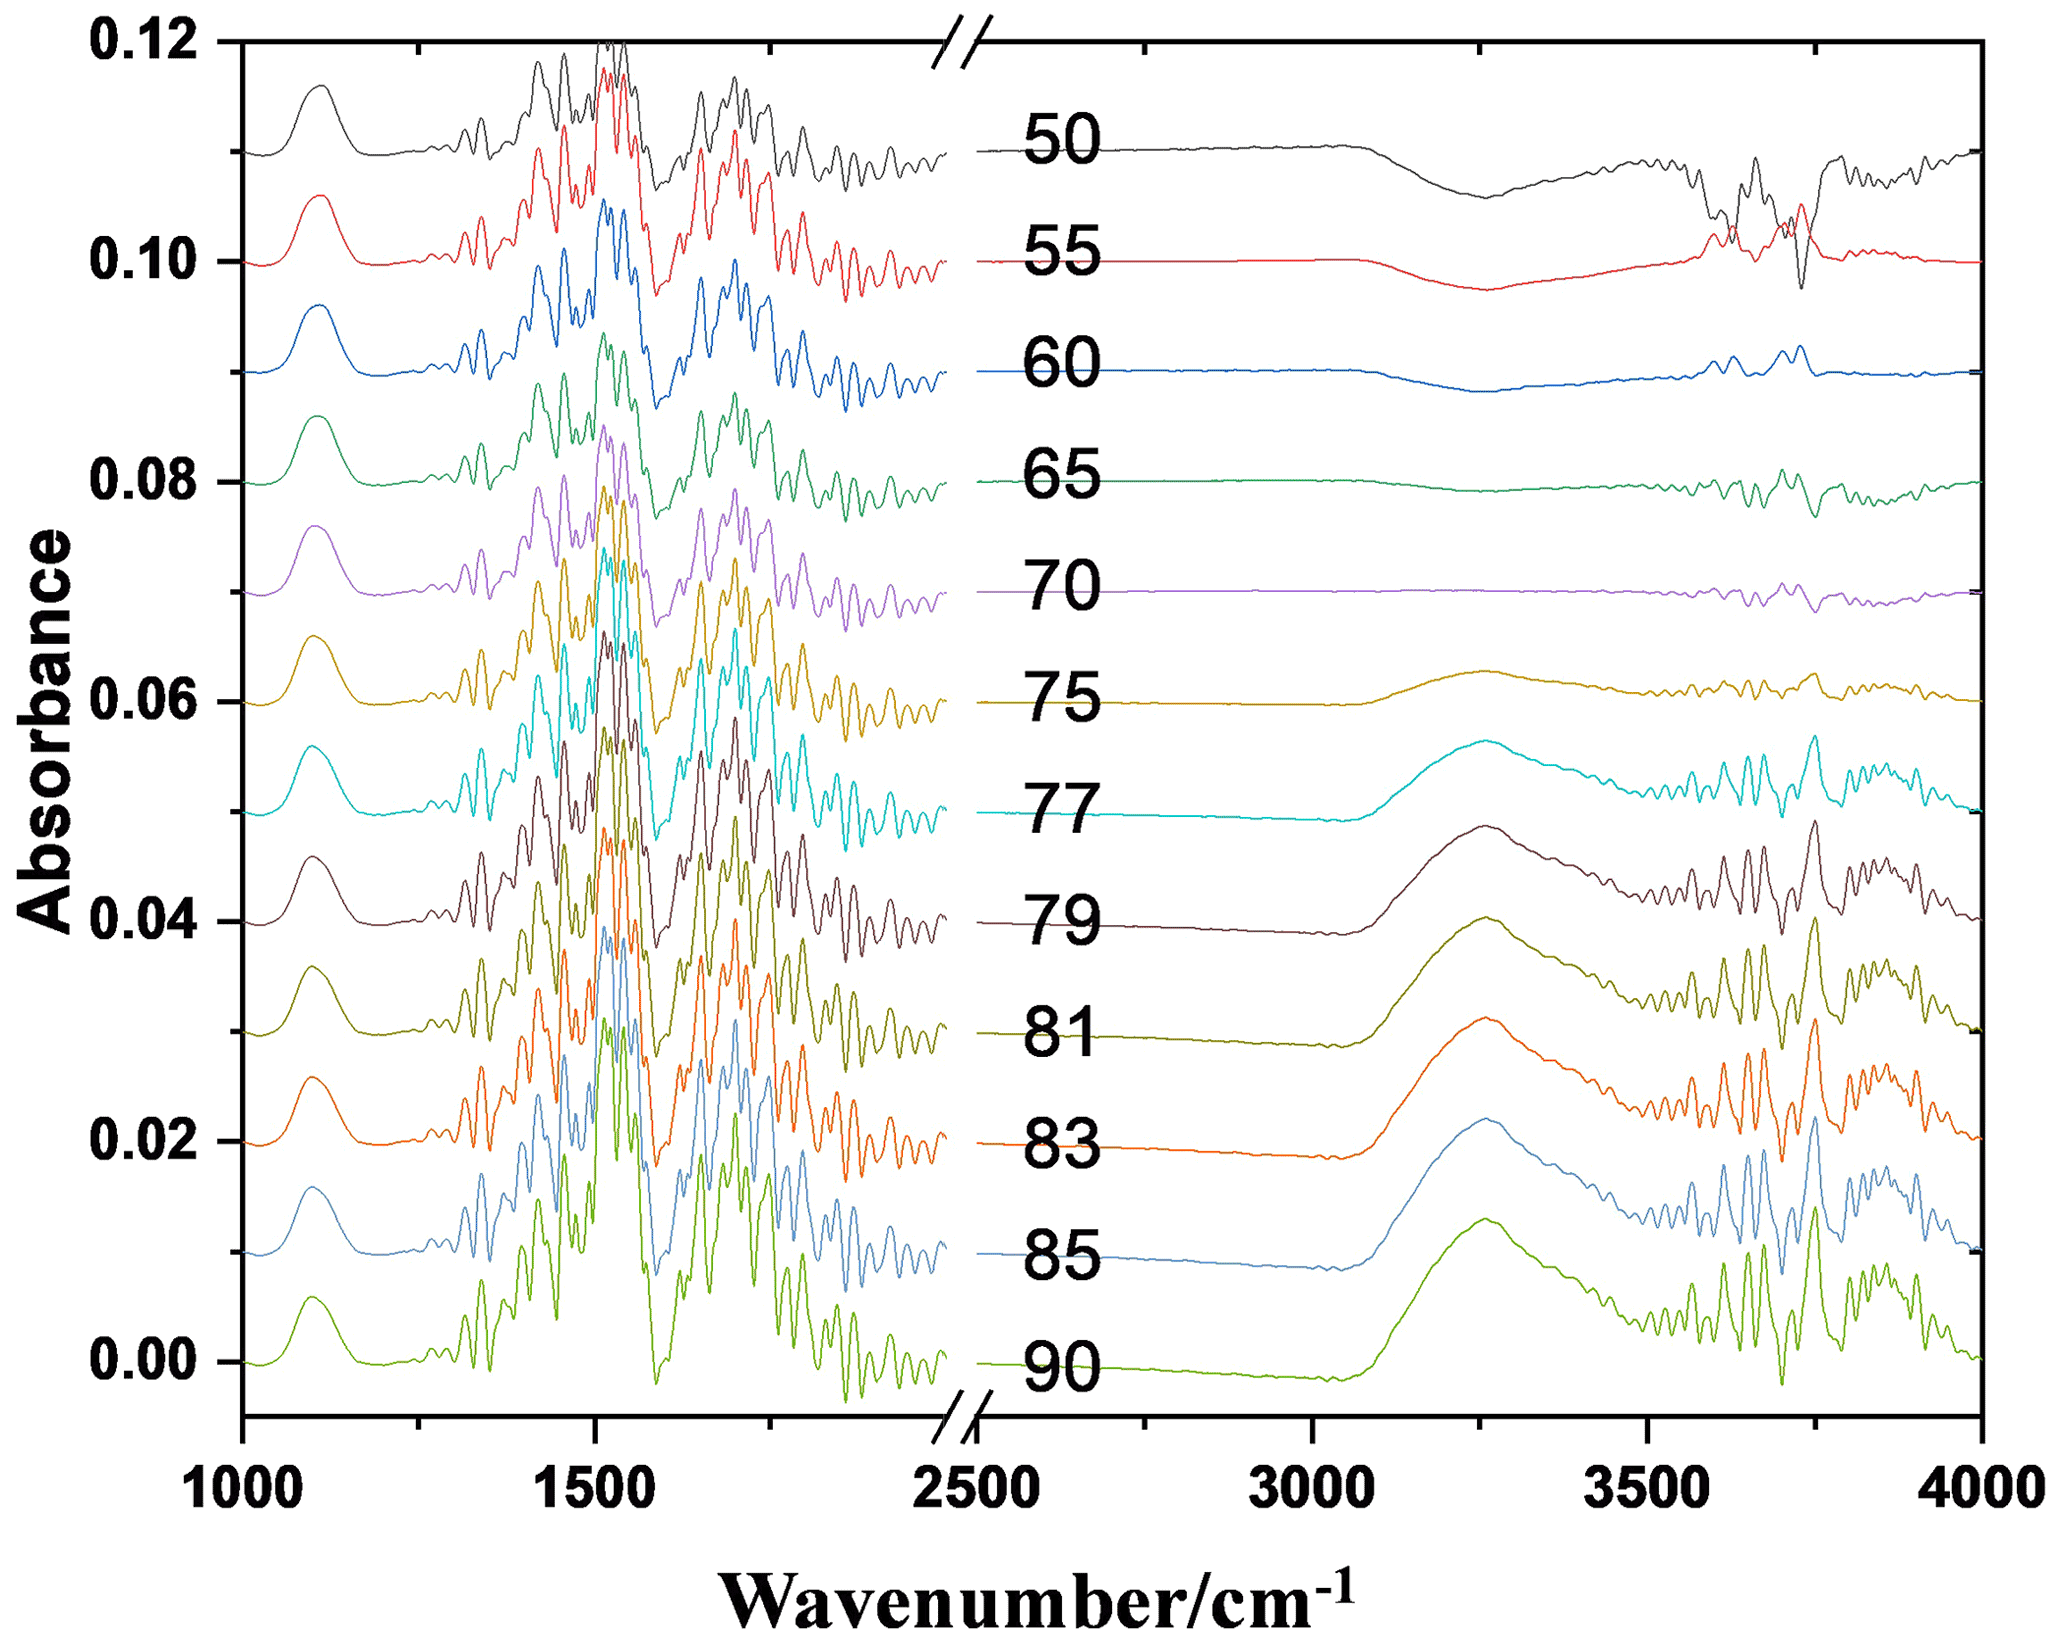
Figure 2FTIR spectral characteristics of the AS nanoparticles under humidity conditions from 50 % to 90 % (RH).
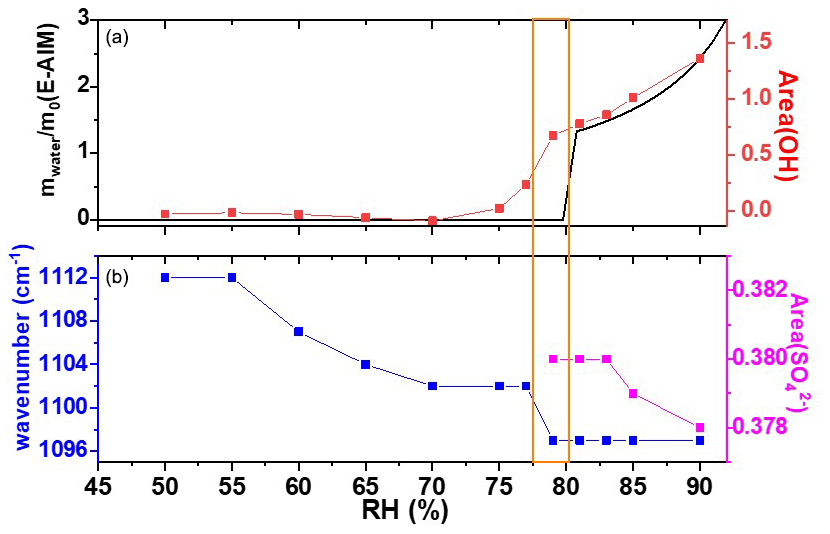
Figure 3(a) Predicted and the area of the OH stretching peak as a function of RH; (b) the center wavenumber and the area of the symmetrical stretching vibration peak of SO in the aqueous AS nanoparticles as a function of RH. The black curve shows the E-AIM predictions. The orange box indicates the deliquescence relative humidity point.
When the RH reaches 79 %, the position of the SO absorption peak has shifted from 1102 to 1097 cm−1 and its area increases abruptly from 0 to 0.38. In the meantime, the position of the OH absorption peak is still the same as that in initial humidity conditions (50 %), but its area increases abruptly from 0.18 to 0.67 (Fig. 3). The area of the OH absorption peak can be used to ascertain the phase transition of nanoparticles since it is sensitive to the surrounding chemical environment (Braban et al., 2003). The abrupt increase in the area of the OH absorption peak indicates the phase transition of AS; i.e., the AS nanoparticles have absorbed water rapidly and transformed from the crystalline phase to the aqueous phase. According to the E-AIM predictions and the results from previous studies (Estillore et al., 2016; Cruz and Pandis, 2000; Tang, 1982), this process is called the deliquescence, and the RH at this stage is referred to as the deliquescence RH (DRH). When deliquescence occurs, NH molecules hydrated with SO are replaced with H2O molecules, which leads to the redshift of the SO absorption peak (Dong et al., 2007). Tang (1982), Cruz and Pandis (2000), and Estillore et al. (2016) have used photonic microscopes to observe the hygroscopic growth properties of large-size AS particles. Our method and the particle size are different from previous studies, but we obtained a DRH (about 79 % ± 0.8 %) consistent with those in Tang (1982), Cruz and Pandis (2000), and Estillore et al. (2016), where the DRH for AS was found to be 79 % ± 1 % or 80 % ± 0.4 %. This is because the hydration characteristics of nanoparticles mainly depend on their chemical composition, and the Kelvin effect is negligible. Lee et al. (1998) concluded that, for particles with Dve values larger than 100 nm, their critical hydration characteristics are essentially independent of the particle size and are similar to the condensation of water on a flat surface (Lee et al., 1998).
The AS nanoparticles continue to be humidified after deliquescence, resulting in a further increase in the area of the OH absorption peak due to continuous water uptake. However, the position of the SO absorption peak remains constant regardless of RH, indicating that the AS nanoparticles are still in the aqueous phase after deliquescence. With a further increase in RH, the volume of AS nanoparticles increases due to the increase in liquid water content, but the mass of AS nanoparticles remains constant, resulting in a decrease in SO concentration. As a result, we observe a decrease in the area of the SO absorption peak starting from ∼ 83 % RH.
Figure 4 is the same as Fig. 2 but for the OA nanoparticles. The results for the OA nanoparticle differ from those for AS. The FTIR spectral absorption characteristics of SN, , and nanoparticles under humidity conditions from 50 % to 90 % are shown in Figs. S2, S3, and S4, respectively. Throughout its hygroscopic growth process, the OH absorption peak at 3250 cm−1 was not detected, indicating that liquid water is not absorbed by the OA. Previous studies conclude that, for the dihydrate crystalline state of OA particles, its deliquescence point is larger than 97% RH (Peng et al., 2001) but, for the amorphous state of OA particle, it starts to uptake water above 45 % RH (Mikhailov et al., 2009). From this point of view, the OA particles in this study could be in the dihydrate crystalline state, and our findings are consistent with those of Jing et al. (2016) and Ma et al. (2019).
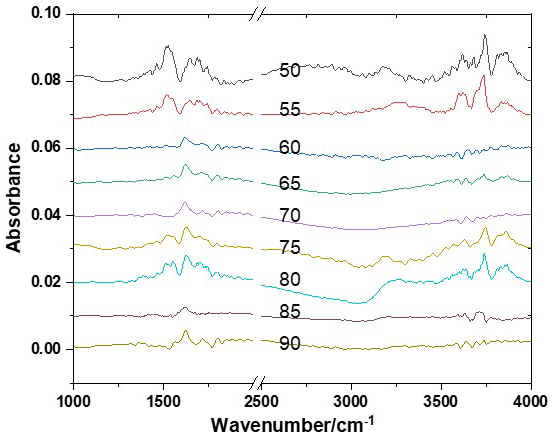
Figure 5 compares the (Mwater is the mass of liquid water in the nanoparticles; M0 is the initial mass of nanoparticles) ratio predicted by the E-AIM (UNIFAC model) (http://www.aim.env.uea.ac.uk/aim/aim.php, last access: 20 May 2021) and the measured hygroscopic properties from the FTIR spectra with the method described in Sect. 2.3 for the AS, , and nanoparticles during the hygroscopic growth process from 50 % to 90 % (RH). The results show that the predicted and measured results for both pure and mixed nanoparticles are generally in good agreement during the whole hygroscopic growth process, indicating consistent water uptake between the predictions and the measurements with the increase in RH.
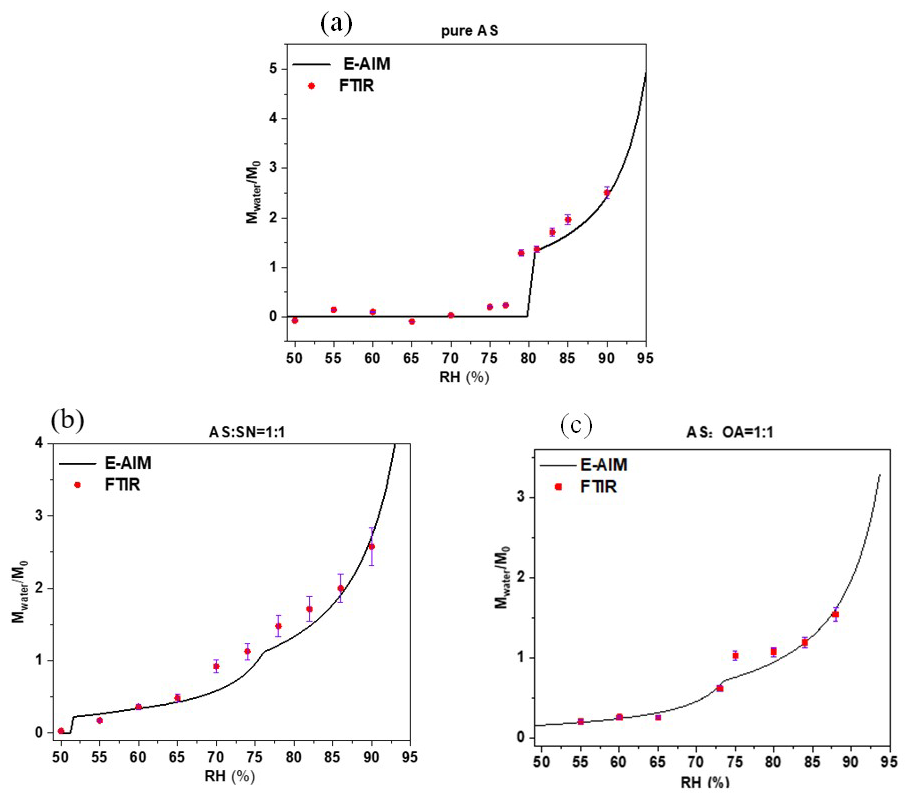
Figure 5Comparison between the measured and predicted for pure AS (a), (b), and nanoparticles (c) with a dry diameter of 100 nm during the hygroscopic growth process as a function of the RH. The black curves represent the E-AIM predictions and the red square represent the measured results from the FTIR spectra. The error bar is defined as the 1σ standard deviation of repeated measurements.
3.2 Hygroscopic growth properties of pure and mixed nanoparticles
With the results derived from the FTIR measurements, we calculated the GFs for both pure and mixed nanoparticles via Eq. (7) and investigated their variabilities with respect to the changes in RH. Figure 6 compares the measured and predicted GFs for both pure and mixed nanoparticles under the humidity conditions from 50 % to 90 %. The measured and predicted GFs are in good agreement through the whole humidity range. The GFs can be obtained precisely using the H-TDMA technique via a direct measurement of the aerosol diameter. In this study, the GFs for both pure and mixed nanoparticles are calculated with liquid water content and the relative masses of dry nanoparticles obtained from FTIR measurements. Though with different methods, the GFs for both pure and mixed nanoparticles in this study are in good agreement with those from previous studies (Jing et al., 2016; Braban et al., 2003).
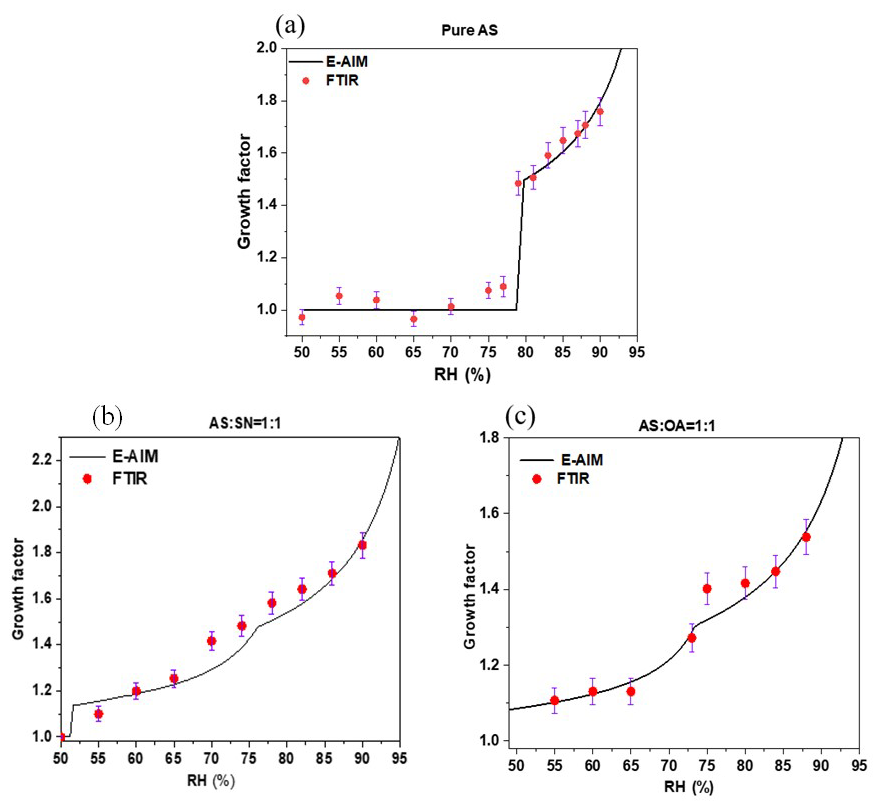
The GF curves can be used to investigate the sensitivity of particle volume to RH. At the RH of 79 ± 0.8 %, deliquescence occurs, the diameters of AS nanoparticles grow sharply by up to a factor of approximately 1.48 and transform from the crystalline to aqueous phase. At the RH of 85 ± 0.8 %, the GF for AS is 1.65 ± 0.05, which is slightly higher than the values deduced with the H-TDMA (about 1.49; Cruz and Pandis, 2000) and Environmental Scanning Electron Microscope (about 1.50; Matsumura and Hayashi, 2007) but is close to the value deduced with the E-AIM (about 1.60).
Since both the and mixed nanoparticles have lower DRHs than that of the AS and absorb liquid water below their DRHs, their GF curves differ from that of the pure AS particles. Although OA particles do not absorb water, OA and AS in the aqueous solution can react with each other via the following pathway (Miñambres et al., 2013):
This reaction can be identified in Fig. S5, where the absorption peak at 1245 cm−1 is the stretching vibration peak of HSO. As a result, a lower DRH for the mixed nanoparticles relative to the pure AS can be attributed to the formation of NH4HSO4, which has a lower DRH (about 40 %) than the pure AS (80 %) (Tang and Munkelwitz, 1994). All the above findings are in good agreement with those in Seinfeld and Pandis (2016), which measure GFs with the H-TDMA.
3.3 Phase transition dynamics of pure AS nanoparticles
The 2D IR spectra based on the spectral variations induced by the deliquescence of pure AS between 50 %–90 % RH are shown in Fig. 7. The correlation maps for the OA nanoparticles are not shown because they do not absorb water and thus present no deliquescence transition during hygroscopic growth processes. In the synchronous correlation maps, one main red–positive auto-peak of (3250, 1097 cm−1) was observed for the AS nanoparticles in the 50 %–90 % RH range, which indicates simultaneous increases in the spectral intensities of OH and SO absorption peaks. This means that the liquid water and SO in the aqueous AS nanoparticles increase simultaneously during hygroscopic growth processes. Furthermore, two main blue–negative auto-peaks of (1112, 1097 cm−1) and (3250, 1112 cm−1) were also observed for the AS nanoparticles. The blue–negative auto-peak of (1112, 1097 cm−1) indicates that the spectral intensity of the OH absorption peak increases with RH, while the spectral intensity of the SO absorption peak in the solid AS nanoparticles decreases with RH. It also indicates that the SO components in solid and aqueous AS nanoparticles can transform into each other, and the decrease in SO in solid AS nanoparticles results in an increase in SO in aqueous AS nanoparticles. This behavior can be explained by the fact that NH particles hydrated with SO are replaced by H2O molecules with an increase in RH.
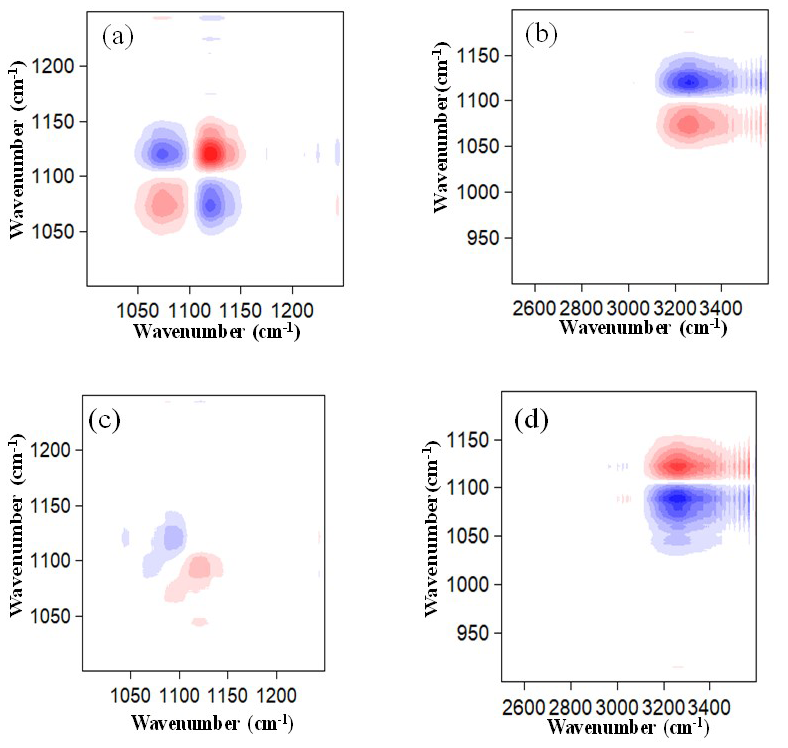
Figure 7Panels (a) and (b) are synchronous correlation maps of AS nanoparticles within different wavenumber regions. Panels (c) and (d) are the same as (a) and (b) but for asynchronous correlation maps. Red and blue areas represent positive and negative correlations, respectively.
The asynchronous map indicates the sequential changes in the spectral intensities in response to the hygroscopic activities. As shown in the asynchronous correlation maps in Fig. 7, two main red–positive auto-peaks of (3250, 1097 cm−1) and (1112, 1097 cm−1) and two main blue–negative auto-peaks of (3250, 1112 cm−1) and (1097, 1112 cm−1) were observed for the AS nanoparticles, which indicates that spectral intensities of the absorption peaks changed in the order of 1112 > 3250 > 1097 cm−1. The decrease in SO in the solid AS nanoparticles does not result in a simultaneous increase in SO in the aqueous AS nanoparticles during the AS deliquescence transition. The former process occurred predominantly before the later process. This suggests an intriguing possibility of the existence of an intermediate state between the solid and aqueous AS nanoparticles. Meanwhile, the water uptake occurred predominantly before the decrease in SO in the solid AS nanoparticles during the AS deliquescence transition. We speculate that the surface-limited process may control the transport of liquid water to the AS nanoparticles or, in other words, the surface-limited process determines the hygroscopic behavior of AS nanoparticles (Leng et al., 2015).
The above 2D IR spectroscopic results verify that the hygroscopic growth of AS nanoparticles may include the following phase transition micro-dynamics stages at the molecular level: the first stage (adsorption) pertains to the attachment of liquid water molecules to the surface of the solid (NH4)2SO4 (Yeşilbaş and Boily, 2016), which would cause a decrease in the solid (NH4)2SO4; then the NH particles hydrated with SO are gradually replaced by the H2O molecules, and finally, the AS nanoparticles become fully liquid droplets. Although the hygroscopic growth characteristics observed in this study are similar to those in previous studies (Cruz and Pandis, 2000), the 2D IR spectroscopic technique captured a more complex processes and the intermediate state during the hygroscopic growth of AS nanoparticles (Tang et al., 1977, 1994).
3.4 Phase transition dynamics of mixed nanoparticles
Figure 8 is the same as Fig. 7 but for mixed nanoparticles. In the synchronous correlation maps, one main red–positive auto-peak of (3250, 1097 cm−1) and two blue–negative auto-peaks of (1320, 1112 cm−1) and (3250, 1112 cm−1) were observed in the RH range from 50 %–90 %. The red–positive auto-peak of (3250, 1097 cm−1) indicates the simultaneous increase in the spectral intensities of OH and SO absorption peaks. The blue–negative auto-peaks of (1320, 1112 cm−1) and (3250, 1112 cm−1) indicate that the spectral intensities of the NO and the OH absorption peaks increase with RH, while the spectral intensity of SO absorption peak in solid mixed nanoparticles decreases with RH. This can be explained by the fact that the NH or Na+ hydrated with SO and NO is replaced by H2O molecules with the increase in RH. In the asynchronous correlation map, three main red–positive auto-peaks of (3250, 1097 cm−1), (1097, 1112 cm−1), and (1320, 1097 cm−1) and two main blue–negative auto-peaks of (3250, 1320 cm−1) and (1112, 1097 cm−1) were observed, which indicates that the spectral intensities of the absorption peaks change in the order of 1320 < 3250 > 1097 > 1112 cm−1. This means that the increase in NO occurred predominantly before the increase in SO in the aqueous mixed nanoparticles because the SN has a lower DRH (RH = 74.3 ± 0.4 %) relative to that of AS (Seinfeld and Pandis, 2016; Tang and Munkelwitz, 1993). Meanwhile, the decrease in SO in solid mixed nanoparticles occurred predominantly after the increase in SO in the aqueous mixed nanoparticles, which suggests an intermediate state between the aqueous SO and solid SO states. Furthermore, the hydrolysis reaction mechanism for the AS in mixed nanoparticles differs from that for the pure AS nanoparticles. This is because NO absorbs water at a lower RH than that of pure AS nanoparticles, which enhances the dissolution of the pure AS in the mixed nanoparticles. Therefore, the NH hydrated with the SO is replaced by the H2O molecules. This process continues till the mixed nanoparticles become fully liquid droplets (Jing et al., 2016).
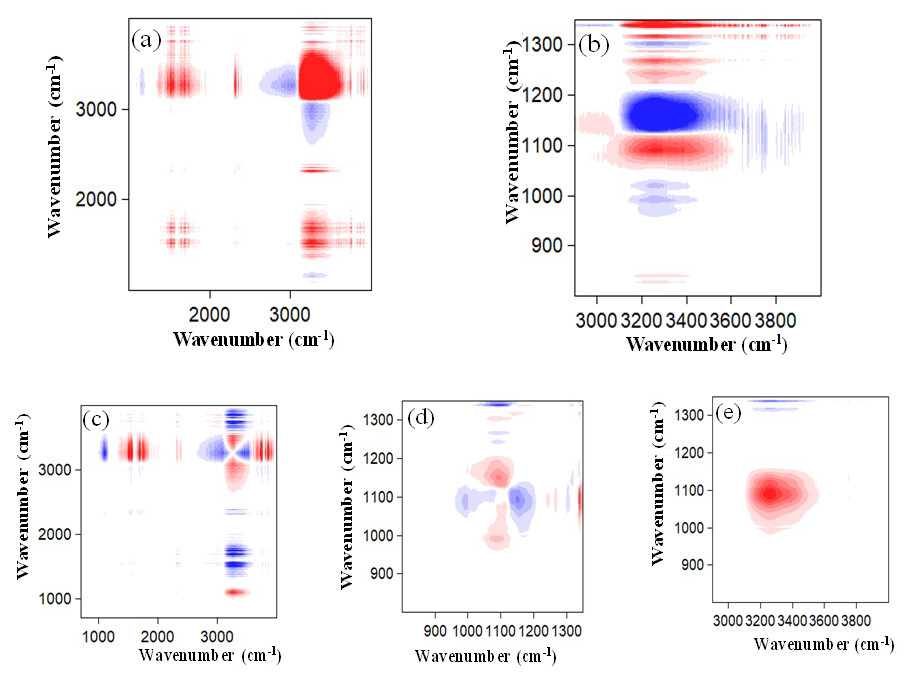
Figure 8The same as Fig. 7 but for mixed nanoparticles. Panel (b) is an enlarged view of (a), and (d) and (e) are enlarged views of (c) within different wavenumber regions.
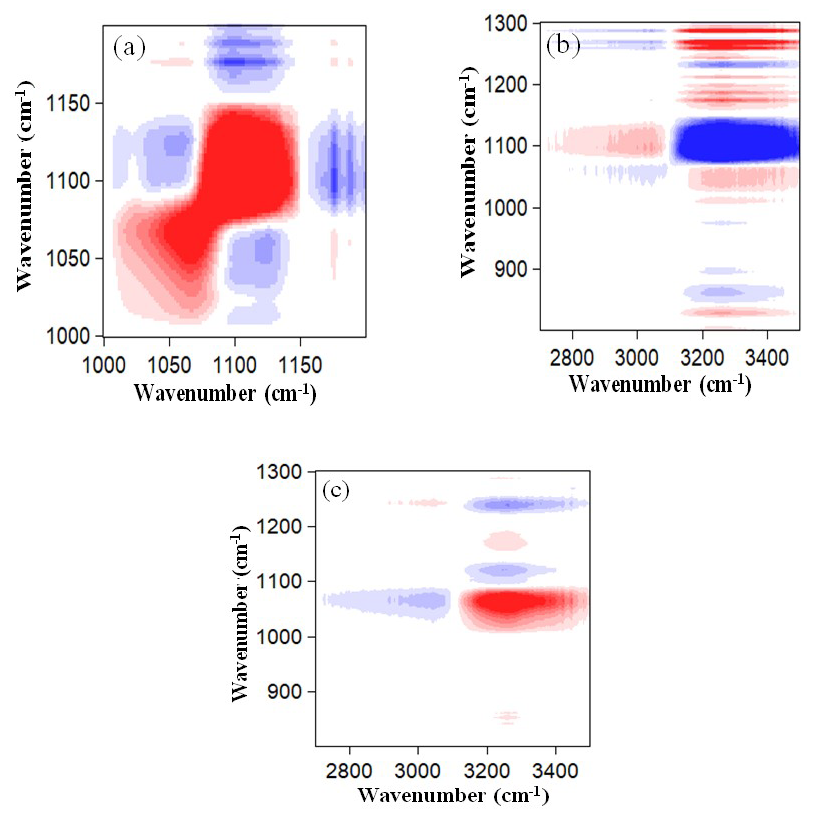
Figure 9 is the same as Fig. 8 but for the mixed nanoparticles. In the synchronous correlation map, one main red–positive auto-peak of (3250, 1080 cm−1) and two main blue–negative auto-peaks of (1112, 1080 cm−1) and (3250, 1112 cm−1) were observed in the RH range from 50 %–90 %. The wavenumber of 1080 cm−1 is the SO absorption peak in the aqueous mixed nanoparticles. The red–positive auto-peak of (3250, 1080 cm−1) indicates the simultaneous increase in the spectral intensities of OH and SO absorption peaks. The blue–negative auto-peak of (1112, 1080 cm−1) indicates that the SO in solid and aqueous nanoparticles can transform into each other, and the decrease in SO in solid nanoparticles results in the increase in SO in aqueous nanoparticles. The blue–negative auto-peak of (3250, 1112 cm−1) indicates that the spectral intensity of the OH absorption peak increases with RH, while the intensity of the SO absorption peak in solid nanoparticles decreases with RH. In the asynchronous correlation map, one main red–positive auto-peak of (3250, 1080 cm−1) and one main blue–negative auto-peak of (3250, 1112 cm−1) were observed, which indicates that the spectral intensities of the absorption peaks change in the order of 1112 > 3250 > 1080 cm−1. This sequential order of occurrence is consistent with that of the pure AS nanoparticles during the hygroscopic growth process. This is because OA does not absorb water, and thus the hydrolysis reaction mechanism of AS in mixed nanoparticles is similar to that of the pure AS nanoparticles. With current measurements, we cannot judge if the hygroscopic growth processes of AS and have the same intermediate states.
In this work, we demonstrated the usage of the FTIR spectroscopic technique to characterize in real time the hygroscopic growth properties of nanoparticles with electrical mobility diameters (Dem) of ∼ 100 nm and their phase transition micro-dynamics at the molecular level. We first realize real-time measurements of water content and dry nanoparticle mass to characterize hygroscopic growth factors (GFs). The calculated GFs are generally in good agreement with the Extended Aerosol Inorganics Model (E-AIM) predictions in the 50 %–95 % RH range. We further normalize the FTIR spectra of nanoparticles into 2D IR spectra and identify in real time the hydration interactions and the dynamic hygroscopic growth process of the functional groups for AS, , and nanoparticles. The 2D IR spectroscopic results disclosed that the hygroscopic growth of nanoparticles may include the following phase transition micro-dynamics stages at the molecular level:
- a.
For pure AS nanoparticles, the first stage (adsorption) pertains to the attachment of liquid water molecules to the surface of the solid (NH4)2SO4, which would cause a decrease in the solid (NH4)2SO4; then the NH particles hydrated with SO are gradually replaced by the H2O molecules, and finally, the AS nanoparticles become fully liquid droplets.
- b.
For , the hydrolysis reaction mechanism for the AS in mixed nanoparticles differs from that for the pure AS nanoparticles. The increase in SO in the aqueous mixed nanoparticles occurred predominantly before the decrease in SO in solid mixed nanoparticles. Then, the NH hydrated with the SO is replaced by the H2O molecules. This process continues till the mixed nanoparticles become fully liquid droplets (Jing et al., 2016).
- c.
For mixed nanoparticles, the hydrolysis reaction mechanism of AS in mixed nanoparticles is similar to that of the pure AS nanoparticles. With current measurements, we cannot judge if the hygroscopic growth process of AS and have the same intermediate states.
Although the hygroscopic growth characteristics observed in this study are similar to those in previous studies, the FTIR spectroscopic technique demonstrated in this study captured more complex processes and the intermediate state during the hygroscopic growth of nanoparticles. This study verified that the FTIR spectroscopic technique provides a suitable new method for real-time diagnosis of the hygroscopic growth micro-dynamics of nanoparticles at the molecular level. By means of this new method, we can better understand the physicochemical properties of atmospheric aerosol and the nanoparticle–water interactions during aerosol's hygroscopic growth process. This information is of great significance for improving current knowledge of haze formation.
The code and data are available upon request from Xiuli Wei (xlwei@aiofm.ac.cn).
The supplement related to this article is available online at: https://doi.org/10.5194/acp-22-3097-2022-supplement.
XW designed the experiment and wrote the paper with contributions from all co-authors; HG contributed to scientific discussions and suggested analyses; HD and JZ prepared the humidification system; YC, JW, YY, and JL contributed to this work by providing constructive comments; YS contributed to this work by providing constructive comments, review, and editing.
The contact author has declared that neither they nor their co-authors have any competing interests.
Publisher's note: Copernicus Publications remains neutral with regard to jurisdictional claims in published maps and institutional affiliations.
This work was supported by the National Natural Science Foundation of China (nos. 41905028, 91544218), the Natural Science Foundation of Anhui Province (no. 2108085MD139), and the Science and Technological Fund of Anhui Province for Outstanding Youth (no. 1808085J19). We are also grateful to the China Scholarship Council for their support.
This research has been supported by the National Natural Science Foundation of China (grant nos. 41905028 and 91544218), the Science and Technological Fund of Anhui Province for Outstanding Youth (grant no. 1808085J19), the China Scholarship Council (grant no. 20163035), and the Natural Science Foundation of Anhui Province (grant no. 2108085MD139).
This paper was edited by Annele Virtanen and reviewed by three anonymous referees.
Abbott, T. H. and Cronin, T. W.: Aerosol invigoration of atmospheric convection through increases in humidity, Science, 371, 83–85, https://doi.org/10.1126/science.abc5181, 2021.
Braban, C. F., Carroll, M. F., Styler, S. A., and Abbatt, J. P. D.: Phase Transitions of Malonic and Oxalic Acid Aerosols, J. Phys. Chem. A, 107, 6594–6602, https://doi.org/10.1021/jp034483f, 2003.
Carlton, A. G., Christiansen, A. E., Flesch, M. M., Hennigan, C. J., and Sareen, N.: Multiphase Atmospheric Chemistry in Liquid Water: Impacts and Controllability of Organic Aerosol, Accounts Chem. Res., 53, 1715–1723, https://doi.org/10.1021/acs.accounts.0c00301, 2020.
Cruz, C. N. and Pandis, S. N.: Deliquescence and Hygroscopic Growth of Mixed Inorganic-Organic Atmospheric Aerosol, Environ. Sci. Technol., 34, 4313–4319, https://doi.org/10.1021/es9907109, 2000.
Dong, J.-L., Li, X.-H., Zhao, L.-J., Xiao, H.-S., Wang, F., Guo, X., and Zhang, Y.-H.: Raman Observation of the Interactions between NH, SO, and H2O in Supersaturated (NH4)2SO4 Droplets, J. Phys. Chem. B, 111, 12170–12176, https://doi.org/10.1021/jp072772o, 2007.
Downing, H. D. and Williams, D.: Optical constants of water in the infrared, J. Geophys. Res., 80, 1656–1661, https://doi.org/10.1029/JC080i012p01656, 1975.
Du, H., Guo, G., Yu, M., and Xu, H.: Investigation of carbon dynamics in rhizosphere by synchrotron radiation-based Fourier transform infrared combined with two dimensional correlation spectroscopy, Sci. Total Environ., 762, 143078, https://doi.org/10.1016/j.scitotenv.2020.143078, 2021.
Esat, K., David, G. Poulkas, T., Shein, M., and Signorell, R.: Phase transition dynamics of single optically trapped aqueous potassium carbonate particles, Phys. Chem. Chem. Phys., 20, 11598–11607, https://doi.org/10.1039/C8CP00599K, 2018.
Estillore, A. D., Hettiyadura, A. P. S., Qin, Z., Leckrone, E., Wombacher, B., Humphry, T., Stone, E. A., and Grassian, V. H.: Water Uptake and Hygroscopic Growth of Organosulfate Aerosol, Environ. Sci. Technol., 50, 4259–4268, https://doi.org/10.1021/acs.est.5b05014, 2016.
Fan, J., Rosenfeld, D., Zhang, Y., Giangrande, S. E., Li, Z., Machado, L. A. T., Martin, S. T., Yang, Y., Wang, J., Artaxo, P., Barbosa, H. M. J., Braga, R. C., Comstock, J. M., Feng, Z., Gao, W., Gomes, H. B., Mei, F., Pöhlker, C., Pöhlker, M. L., Pöschl, U., and de Souza, R. A. F.: Substantial convection and precipitation enhancements by ultrafine aerosol particles, Science, 359, 411–418, https://doi.org/10.1126/science.aan8461, 2018.
Gopalakrishnan, S., Jungwirth, P., Tobias, D. J., and Allen, H. C.: Air-Liquid Interfaces of Aqueous Solutions Containing Ammonium and Sulfate: Spectroscopic and Molecular Dynamics Studies, J. Phys. Chem. B, 109, 8861–8872, https://doi.org/10.1021/jp0500236, 2005.
Gysel, M., Weingartner, E., and Baltensperger, U.: Hygroscopicity of Aerosol Particles at Low Temperatures. 2. Theoretical and Experimental Hygroscopic Properties of Laboratory Generated Aerosols, Environ. Sci. Technol., 36, 63–68, https://doi.org/10.1021/es010055g, 2002.
Jing, B., Tong, S., Liu, Q., Li, K., Wang, W., Zhang, Y., and Ge, M.: Hygroscopic behavior of multicomponent organic aerosols and their internal mixtures with ammonium sulfate, Atmos. Chem. Phys., 16, 4101–4118, https://doi.org/10.5194/acp-16-4101-2016, 2016.
Kirkby, J., Curtius, J., Almeida, J., Dunne, E., Duplissy, J., Ehrhart, S., Franchin, A., Gagné, S., Ickes, L., Kürten, A., Kupc, A., Metzger, A., Riccobono, F., Rondo, L., Schobesberger, S., Tsagkogeorgas, G., Wimmer, D., Amorim, A., Bianchi, F., Breitenlechner, M., David, A., Dommen, J., Downard, A., Ehn, M., Flagan, R. C., Haider, S., Hansel, A., Hauser, D., Jud, W., Junninen, H., Kreissl, F., Kvashin, A., Laaksonen, A., Lehtipalo, K., Lima, J., Lovejoy, E. R., Makhmutov, V., Mathot, S., Mikkilä, J., Minginette, P., Mogo, S., Nieminen, T., Onnela, A., Pereira, P., Petäjä, T., Schnitzhofer, R., Seinfeld, J. H., Sipilä, M., Stozhkov, Y., Stratmann, F., Tomé, A., Vanhanen, J., Viisanen, Y., Vrtala, A., Wagner, P. E., Walther, H., Weingartner, E., Wex, H., Winkler, P. M., Carslaw, K. S., Worsnop, D. R., Baltensperger, U., and Kulmala, M.: Role of sulphuric acid, ammonia and galactic cosmic rays in atmospheric aerosol nucleation, Nature, 476, 429–433, 2011.
Kuai, Y., Xie, Z., Chen, J., Gui, H., Xu, L., Kuang, C., Wang, P., Liu, X., Liu, J., Lakowicz, J. R., and Zhang, D.: Real-Time Measurement of the Hygroscopic Growth Dynamics of Single Aerosol Nanoparticles with Bloch Surface Wave Microscopy, ACS Nano, 14, 9136–9144, https://doi.org/10.1021/acsnano.0c04513, 2020.
Lee, S.-H. and Allen, H. C.: Analytical Measurements of Atmospheric Urban Aerosol, Anal. Chem., 84, 1196–1201, https://doi.org/10.1021/ac201338x, 2012.
Lee, Y.-L., Chou, W.-S., and Chen, L.-H.: The adsorption and nucleation of water vapor on an insoluble spherical solid particle, Surf. Science, 414, 363–373, 1998.
Leng, C., Pang, S., Zhang, Y., Chen, C., Liu, Y., and Zhang, Y.: Vacuum FTIR Observation on the Dynamic Hygroscopicity of Aerosols under Pulsed Relative Humidity, Environ. Sci. Technol., 49, 9107–9115, 2015.
Lide, D. R. (Ed.): CRC Handbook of Chemistry and Physics, 87th Edn., Taylor and Francis, Boca Raton, FL, ISBN 0-8493-0483-0, 2007.
Ma, Q., Zhong, C., Liu, C., Liu, J., Ma, J., Wu, L., and He, H.: A Comprehensive Study about the Hygroscopic Behavior of Mixtures of Oxalic Acid and Nitrate Salts: Implication for the Occurrence of Atmospheric Metal Oxalate Complex, ACS Earth Space Chem., 3, 1216–1225, 2019.
Martin, S. T.: Phase Transitions of Aqueous Atmospheric Particles, Chem. Rev., 100, 3403–3454, https://doi.org/10.1021/cr990034t, 2000.
Matsumura, T. and Hayashi, M.: Hygroscopic Growth of an (NH4)2SO4 Aqueous Solution Droplet Measured Using an Environmental Scanning Electron Microscope (ESEM), Aerosol Sci. Tech., 41, 770–774, https://doi.org/10.1080/02786820701436831, 2007.
McKelvy, M. L., Britt, T. R., Davis, B. L., Gillie, J. K., Graves, F. B., and Lentz, L. A.: Infrared Spectroscopy, Anal. Chem., 70, 119–178, https://doi.org/10.1021/a1000006w, 1998.
Miñambres, L., Méndez, E., Sánchez, M. N., Castaño, F., and Basterretxea, F. J.: Water uptake of internally mixed ammonium sulfate and dicarboxylic acid particles probed by infrared spectroscopy, Atmos. Environ., 70, 108–116, 2013.
Mikhailov, E., Vlasenko, S., Martin, S. T., Koop, T., and Pöschl, U.: Amorphous and crystalline aerosol particles interacting with water vapor: conceptual framework and experimental evidence for restructuring, phase transitions and kinetic limitations, Atmos. Chem. Phys., 9, 9491–9522, https://doi.org/10.5194/acp-9-9491-2009, 2009.
Nájera, J. J. and Horn, A. B.: Infrared spectroscopic study of the effect of oleic acid on the deliquescence behaviour of ammonium sulfate aerosol particles, Phys. Chem. Chem. Phys., 11, 483–494, https://doi.org/10.1039/B812182F, 2009.
Nguyen, T. K. V., Zhang, Q., Jimenez, J. L., Pike, M., and Carlton, A. G.: Liquid Water: Ubiquitous Contributor to Aerosol Mass, Environ. Sci. Tech. Let., 3, 257–263, https://doi.org/10.1021/acs.estlett.6b00167, 2016.
Noda, I. and Ozaki, Y.: Two-Dimensional Correlation Spectroscopy – Applications in Vibrational and Optical Spectroscopy, 15–38, John Wiley & Sons, https://doi.org/10.1002/0470012404, 2014.
Peng, C., Chan, M. N., and Chan, C. K.: The hygroscopic properties of dicarboxylic and multifunctional acids: Measurements and UNIFAC predictions, Environ. Sci. Technol., 35, 4495–4501, 2001.
Richard, D. S., Trobaugh, K. L., Hajek-Herrera, J., Price, C. L., Sheldon, C. S., Davies, J. F., and Davis, R. D.: Ion-molecule interactions enable unexpected phase transitions in organic-inorganic aerosol, Sci. Adv., 6, eabb5643, https://doi.org/10.1126/sciadv.abb5643, 2020.
Riemer, N., Ault, A. P., West, M., Craig, R. L., and Curtis, J. H.: Aerosol Mixing State: Measurements, Modeling, and Impacts, Rev. Geophys., 57, 187–249, https://doi.org/10.1029/2018RG000615, 2019.
Ruehl, C. R., Davies, J. F., and Wilson K. R.: An interfacial mechanism for cloud droplet formation on organic aerosols, Science, 351, 1447–1450, https://doi.org/10.1126/science.aad4889, 2016.
Steinfeld, J. I. and Pandis, S. N.: Atmospheric Chemistry and Physics: From Air Pollution to Climate Change, 3rd Edn., John Wiley & Sons, https://doi.org/10.1063/1.882420, 2016.
Tang, I. N.: The relative importance of atmospheric sulfates and nitrates in visibility reduction, Atmos. Environ., 16, 2753, https://doi.org/10.1016/0004-6981(82)90361-4, 1982.
Tang, I. N. and Munkelwitz, H. R.: Aerosol growth studies – III ammonium bisulfate aerosols in a moist atmosphere, J. Aerosol Sci., 8, 321–330, https://doi.org/10.1016/0021-8502(77)90019-2, 1977.
Tang, I. N. and Munkelwitz, H. R.: Composition and temperature dependence of the deliquescence properties of hygroscopic aerosols, Atmos. Environ. A-Gen., 27, 467–473, https://doi.org/10.1016/0960-1686(93)90204-C, 1993.
Tang, I. N. and Munkelwitz, H. R.: Water activities, densities, and refractive indices of aqueous sulfates and sodium nitrate droplets of atmospheric importance, J. Geophys. Res., 99, 18801–18808, 1994.
Tang, M., Cziczo, D. J., and Grassian, V. H.: Interactions of Water with Mineral Dust Aerosol: Water Adsorption, Hygroscopicity, Cloud Condensation, and Ice Nucleation, Chem. Rev., 116, 4205–4259, https://doi.org/10.1021/acs.chemrev.5b00529, 2016.
Vogel, A. L., Schneider, J., Müller-Tautges, C., Phillips, G. J., Pöhlker, M. L., Rose, D., Zuth, C., Makkonen, U., Hakola, H., Crowley, J. N., Andreae, M. O., Pöschl, U., and Hoffmann, T.: Aerosol Chemistry Resolved by Mass Spectrometry: Linking Field Measurements of Cloud Condensation Nuclei Activity to Organic Aerosol Composition, Environ. Sci. Technol., 50, 10823–10832, https://doi.org/10.1021/acs.est.6b01675, 2016.
Wang, N., Jing, B., Wang, P., Wang, Z., Li, J., Pang, S., Zhang, Y., and Ge, M.: Hygroscopicity and Compositional Evolution of Atmospheric Aerosols Containing Water-Soluble Carboxylic Acid Salts and Ammonium Sulfate: Influence of Ammonium Depletion, Environ. Sci. Technol., 53, 6225–6234, https://doi.org/10.1021/acs.est.8b07052, 2019.
Wang, X., Jing, B., Tan, F., Ma, J., Zhang, Y., and Ge, M.: Hygroscopic behavior and chemical composition evolution of internally mixed aerosols composed of oxalic acid and ammonium sulfate, Atmos. Chem. Phys., 17, 12797–12812, https://doi.org/10.5194/acp-17-12797-2017, 2017.
Wei, X., Zhang, J., Schwab, J., Gao, M., Gui, H., and Liu, J.: Aerosol Pollution Characterization before Chinese New Year in Zhengzhou in 2014, Aerosol Air Qual. Res., 19, 1294–1306, https://doi.org/10.4209/aaqr.2018.06.0226, 2019.
Xu, W., Kuang, Y., Bian, Y., Liu, L., Li, F., Wang, Y., Xue, B., Luo, B., Huang, S., Yuan, B., Zhao, P., and Shao, M.: Current Challenges in Visibility Improvement in Southern China, Environ. Sci. Tech. Let., 7, 395–401, https://doi.org/10.1021/acs.estlett.0c00274, 2020.
Yan, K., Xie, Z., Chen, J., Gui, H., Xu, L., Kuang, C., Wang, P., Liu, X., Liu, J., Lakowicz, J., and Zhang, D.: Real-Time Measurement of the Hygroscopic Growth Dynamics of Single Aerosol Nanoparticles with Bloch Surface Wave Microscopy, ACS Nano, 14, 9136–9144, https://doi.org/10.1021/acsnano.0c04513, 2020.
Yeşilbaş, M. and Boily, J.-F.: Particle Size Controls on Water Adsorption and Condensation Regimes at Mineral Surfaces, Sci. Rep.-UK, 6, 32136, https://doi.org/10.1038/srep32136, 2016.