the Creative Commons Attribution 4.0 License.
the Creative Commons Attribution 4.0 License.
 | 01 Mar 2022
Evaluation of the daytime tropospheric loss of 2-methylbutanal
María Asensio
María Antiñolo
Sergio Blázquez
José Albaladejo
Saturated aldehydes, e.g. 2-methylbutanal (2 MB, CH3CH2CH(CH3)C(O)H), are emitted into the atmosphere by several biogenic sources. The first step in the daytime atmospheric degradation of 2 MB involves gas-phase reactions initiated by hydroxyl (OH) radicals, chlorine (Cl) atoms, and/or sunlight. In this work, we report the rate coefficients for the gas-phase reaction of 2 MB with OH (kOH) and Cl (kCl), together with the photolysis rate coefficient (J), in the ultraviolet solar actinic region in Valencia (Spain) at different times of the day. The temperature dependence of kOH was described in the 263–353 K range by the following Arrhenius expression: exp cm3 molec.−1 s−1. At 298 K, the reported kOH and kCl are ( and cm3 molec.−1 s−1, respectively. Identification and quantification of the gaseous products of the Cl reaction and those from the photodissociation of 2 MB were carried out in a smog chamber by different techniques (Fourier transform infrared spectroscopy, proton transfer time-of-flight mass spectrometry, and gas chromatography coupled to mass spectrometry). The formation and size distribution of secondary organic aerosols formed in the Cl reaction were monitored by a fast mobility particle sizer spectrometer. A discussion on the relative importance of the first step in the daytime atmospheric degradation of 2 MB is presented together with the impact of the degradation products in marine atmospheres.
Please read the corrigendum first before continuing.
-
Notice on corrigendum
The requested paper has a corresponding corrigendum published. Please read the corrigendum first before downloading the article.
-
Article
(951 KB)
- Corrigendum
-
Supplement
(1356 KB)
-
The requested paper has a corresponding corrigendum published. Please read the corrigendum first before downloading the article.
- Article
(951 KB) - Full-text XML
- Corrigendum
-
Supplement
(1356 KB) - BibTeX
- EndNote


The saturated aldehyde 2-methylbutanal (2 MB, CH3CH2CH(CH3)C(O)H) is emitted into the low atmosphere from several sources. It is known that 2 MB is formed during the fermentation and drying processes of cocoa beans (Utrilla-Vázquez et al., 2020), the manufacturing process of tea leaves (e.g. Camellia Sinensis, Flaig et al., 2020), and as a consequence of the stress suffered by grapevine leaves due to drought (Griesser et al., 2015). Besides, this aldehyde is emitted into the atmosphere from wildland fires (Urbanski et al., 2008) and many industrial activities, such as poultry rendering operations during which animal by-products are processed (Kolar and Kastner, 2010). As a secondary pollutant, 2 MB can be formed in situ in the atmosphere by oxidation of 2-methyl-1-butanol (CH3CH2CH(CH3)CH2OH), which is used as a biochemical pesticide, commercially used as a solvent in paints and oils, and used as flavorant in many processed foods.
Once in the atmosphere, 2 MB can react with daytime tropospheric oxidants, such as hydroxyl (OH) radicals or chlorine (Cl) atoms in coastal or marine regions. During daytime, 2 MB can also be photolysed by the solar actinic radiation (λ>290 nm). Other possible sinks of 2 MB are dry and wet depositions that have been previously reported to be minor sinks for other aldehydes such as acetaldehyde (Millet et al., 2010). Since the gas-phase chemistry of 2 MB can lead to the formation of secondary pollutants, its emission may have a significant impact on tropospheric chemistry and air pollution at a local/regional scale. For that reason, in this work we evaluate the potential impact of the diurnal degradation of 2 MB. Firstly, the photodissociation of 2 MB (Reaction R1) has been investigated at room temperature by determining its absorption cross sections (σλ) between 220 and 360 nm, the photolysis rate coefficient (J) under the irradiation conditions of this work (λ≥290 nm) and the corresponding effective quantum yield (φeff).
Secondly, the gas-phase kinetics with OH (Reaction R2) and Cl (Reaction R3) under tropospheric conditions of temperature and pressure was investigated to assess the tropospheric lifetime (τ) of 2 MB due to both removal routes.
The rate coefficient kOH was determined between 263 and 353 K as a function of total pressure (50–600 Torr of He; 1 Torr = 133.32 Pa), while kCl was measured at 298 K and (760±5) Torr of air. Finally, the gaseous products of Reactions (R1) and (R3) have been identified under NOx-free conditions using several detection techniques, and a reaction mechanism is proposed for NOx-free atmosphere. Furthermore, the formation yield of secondary organic aerosols (SOAs) formed in Reaction (R3) has been measured to assess the impact of 2 MB on the formation of ultrafine particles. With all this information, we discuss the potential impact of atmospheric 2 MB on local or regional air quality in terms of the estimated tropospheric lifetime and the reaction products formed.
In this section, a brief description of the experimental techniques and the methodology employed in this work is given. More details can be found in the Supplement.
2.1 Photodissociation of 2-methylbutanal
2.1.1 Gas-phase ultraviolet (UV) absorption spectroscopy (220–360 nm)
Ultraviolet absorption spectroscopy was used to determine the absorption cross sections of 2 MB as a function of wavelength (σλ in base e) between 220 and 360 nm. The experimental set-up employed in this work has been described in detail elsewhere (Blázquez et al., 2020). This system consists of a deuterium-tungsten light source (DT-200, StellarNet) placed at the entrance of a 107.15 cm jacketed Pyrex® cell, connected by an optical fibre to a spectrometer that possesses a concave holographic grating (590 grooves mm−1) and a 2048-pixel charge-coupled device (CCD) camera (BLACK-Comet model C, StellarNet). The absorbance is recorded in a computer with the data acquisition software SpectraWiz v5.33. The experiments were carried out by introducing pure gaseous 2 MB (1.085–6.642 Torr) into the UV cell in static mode. Applying the Beer–Lambert law, σλ was determined from the slope of the absorbance (in base e) versus 2 MB concentration ([2 MB]).
Figure S1 shows some examples of the absorbance versus [2 MB]. Even though the spectral resolution of the recorded UV spectra was higher than 0.11 nm, in Table S1 absolute values of σλ are only given at 1 nm intervals for ease of presentation. Note that the tabulated values are not the integrated σλ in 1 nm. All absolute σλ values are available in the Excel file included in the Supplement.

Figure 1Schematics of the photolysis set-up using a solar simulator as a continuous irradiation source.
2.1.2 Continuous irradiation with a solar simulator (λ≥290 nm)
A schematic of the set-up used in this work to investigate the photochemistry of 2 MB under atmospheric conditions is shown in Fig. 1. A Pyrex (l=20 cm and i.d. = 4 cm) cell sealed with quartz windows was filled with (760±3) Torr of diluted 2 MB (interval of dilution factor from to in synthetic air) from a 10 L Pyrex storage bulb at (298±2) K. The partial pressure of 2 MB, the total pressure inside the storage bulb, and the pressure in the photolysis cell were measured by capacitance pressure transducers (Leybold, model CERAVAC, 10 and 1000 Torr full scale). The initial concentration of 2 MB in the photolysis cell ranged from 1.2 to 6.9×10¹⁶ molec. cm−3. These concentrations were determined by FTIR (Fourier transform infrared) spectroscopy using the absorption cross sections (see Supplement). Before irradiating the sample and after each irradiation time, the FTIR spectrum of the mixture was recorded in a 16 L White-type cell with an optical path length of 96 m by a FTIR spectrometer (Thermo Fisher Scientific, model Nicolet Nexus 870) with a liquid-N2-cooled MCT (mercury cadmium telluride) detector. IR spectra were recorded between 650 and 4000 cm−1 at a resolution of 2 cm−1, after the accumulation of 32 interferograms. The selected IR bands for monitoring 2 MB were the ones centred at 2700 and 2800 cm−1.
The sample of 2 MB in air was irradiated by an ABA class solar simulator (SunLite™ solar simulator, model 11002-2) during 30, 60, 90, 120, and 150 min. The solar simulator, equipped with a Xe arc lamp and an air mass (AM) 1.5G filter, emits radiation over 290 nm with a spectrum that simulates the solar reference spectrum AM 1.5G (see Fig. S2). This reference spectrum corresponds to the terrestrial solar spectral irradiance at the surface when the air mass factor is 1.5 and the sun is about 41∘ above the horizon and under specific atmospheric conditions defined by the U.S. Standard Atmosphere (Gueymard et al., 2002). Irradiance was determined in each experiment with a 1 cm2 solar reference cell for which a 100 mV output corresponds to 1 Sun, defined as the irradiance of the AM 1.5G reference solar spectrum described above. In this work, the measured irradiance was 2.225±0.145 Suns.
As shown in Fig. 1, during the irradiation of the diluted sample of 2 MB, control valves 2 and 3 were closed. After irradiation, the gas sample was expanded to the 16 L FTIR cell to measure the 2 MB concentration over time ([2 MB]t) and, thus, to determine the photolysis rate coefficient, J. In that case, the total pressure decreases to 7 Torr and control valves 1 and 4 were closed.
Possible losses due to the heterogeneous reaction of 2 MB onto the walls were evaluated in experiments without light at different times (45, 90, and 135 min). As the photolysis cell used has a large surface volume ratio (276.46 cm2 251.33 cm3=1.1 cm−1), the heterogeneous loss of 2 MB contributes significantly to the total decay of 2 MB. The heterogeneous loss rate, kheterog (in s−1), has been measured to contribute around 24 % to the total loss. Therefore, the photolysis rate coefficient of 2-methylbutanal at λ>290 nm, J (in s−1), can be obtained from the slope of the plot of ln([2 MB]0 [2 MB]t) versus time according to Eq. (1).
For the identification of the photolysis products, three complementary detection techniques were used: FTIR spectroscopy, gas chromatography–mass spectrometry (GC-MS), and proton transfer reaction time-of-flight mass spectrometry (PTR-ToF-MS). The gas chromatography–mass spectrometer (Thermo Electron, models Trace GC Ultra and DSQ II) was equipped with a BPX35 column (30 m × 0.25 mm i.d. × 0.25 µm, SGE Analytical Science) working at a temperature ramp that ranged between 40 and 250 ∘C (Ballesteros et al., 2017). The solid-phase micro-extraction technique was used as a sampling method in these experiments; thus, a µm Divinylbenzene/Carboxen/Polydimethylsiloxane (DVB/CAR/PDMS) fibre (Supelco) was exposed for 10 min to the gas mixture of the photolysis cell, and then the fibre was injected into the GC-MS for 5 min. Independently, in some experiments a PTR-ToF-MS (IONICON, model PTR-TOF 4000), working with a field density ratio () of 137 Td, a time resolution of 20 s, and a detected mass range between 29 and 390.86 amu (Antiñolo et al., 2020), was coupled to the FTIR cell, in which the content of the photolysis cell was diluted in 760 Torr of air, to detect the photolysis products at the end of the experiment. However, quantification of the photolysis products could only be carried out by FTIR spectroscopy. The PTR-ToF-MS could not be used to quantify them as the sampling flow rate was too high, making the total pressure in the FTIR cell drop rapidly, and it did not allow for a stable signal. The quantification by GC-MS was not performed due to the absence of an internal standard that would have been needed due to the instability of the GC-MS signal.
2.2 Pulsed laser photolysis coupled to laser-induced fluorescence (PLP-LIF) technique
The absolute kinetic study of the reaction of OH radicals with 2 MB (Reaction R2) was performed as a function of temperature (T=263–353 K) and total pressure (PT=50–600 Torr of He) in a Pyrex doubled-wall reactor of ca. 200 mL (Martínez et al., 1999). The gas temperature was measured by a type K (chromel–alumel) thermocouple inserted several millimetres above the reaction, and T was kept constant (±0.2 K) during each experiment. The total pressure inside the reactor was controlled by a needle valve placed at the exit of the reactor and prior to the pump, and it was measured by pressure transducers (Oerlikon Leybold Vacuum, model CERAVAC CTR 100N, 0–100 and 0–1000 Torr). All gases were introduced in the reactor by means of mass flow controllers. The total flow through the reactor, FTotal, was kept constant in the 485–496 sccm (standard cubic centimetre) range, while the flow rate of diluted 2 MB and OH precursor (H2O2 or HNO3) were varied between 3.1 and 29 sccm) and between 14.4 and 96.8 sccm, respectively. The residence time in the cell ranged between 0.8 and 13 s, depending on the total flow, pressure, and temperature conditions of the experiment. More details are given in the Supplement.
The OH radicals were generated in situ from the pulsed laser photolysis (PLP) of H2O2 or HNO3 at 248 nm, the radiation coming from a KrF excimer laser (Coherent, ExciStar 200). The laser fluence was 23 mJ pulse−1 cm−2 at 10 Hz. The OH radicals generated in the electronic ground state were excited at ca. 282 nm (laser energy between 0.4 and 1.0 mJ pulse−1 at 10 Hz) to the first excited electronic state by a tuneable pulsed laser (Continuum, ND60; pumped by Continuum, NY 81 CA-10). The photolysis and excitation lasers traverse the reactor perpendicularly. From the intersection of both lasers, in which the reaction takes place, the excited OH radicals emit off-resonance laser-induced fluorescence (LIF) (at ca. 310 nm), which was collected by a photomultiplier tube (Thorn EMI, 9813B model) set perpendicular to both lasers.
Under pseudo-first-order conditions (i.e. when the initial concentration of OH precursor and 2 MB are in large excess with respect to that of OH radicals), the time evolution of the LIF signal follows a single exponential decay (see some examples in Fig. S3). From the analysis of these decays, the pseudo-first-order rate coefficient, k′, was determined at the given [OH precursor]0 and [2 MB]0 for each temperature and pressure. In the absence of 2 MB, the measured pseudo-first-order rate coefficient is . Examples of the versus [2 MB]0 plots at 263 and 353 K, from which the rate coefficient kOH was obtained, are depicted in Fig. S4. [OH precursor]0 was measured by UV absorption spectroscopy between 200 and 230 nm using the same experimental system described in Sect. 2.1.1. In this case, the absorption measurements were carried out under flowing conditions. From [OH precursor]0 and the laser fluence at 248 nm, the initial amount of OH radicals inside the reactor cell was estimated. The ranges of [OH precursor]0, [2 MB]0, dilution factor f of 2 MB in the storage bulb, and k′ are also listed for each temperature and pressure in Table S2 of the Supplement.
2.3 Simulation (smog) chambers coupled to a variety of detection techniques
For the kinetic and mechanistic study of the Cl reaction with 2 MB, several experimental systems were used (Ballesteros et al., 2017; Antiñolo et al., 2019, 2020). Two cylindrical chambers made of Pyrex were available to perform the different experiments: a 16 L cell and a 264 L reactor. Both chambers were surrounded by actinic lamps (Philips Actinic BL TL 40W/10 1SL/25, λ=340–400 nm): four for the 16 L gas cell and eight for the 264 L. These lamps were used to continuously generate Cl atoms in situ by UV photolysis of Cl2. The gas-phase species (2 MB and Cl2) were introduced in the reactor from a gas line, and they were diluted with synthetic air at (298±2) K and (760±5) Torr of total pressure. The total pressure in the gas line and in the reactors was measured with two capacitor pressure transducers (Leybold, model CERAVAC, 10 and 1000 Torr full scale). Three different detection methods were employed: FTIR spectroscopy, GC-MS, and PTR-ToF-MS, previously described in Sect. 2.1.2.
2.3.1 Relative rate kinetic studies (298 K and 760 Torr of air)
The kinetic experiments were carried out by mixing 2 MB, a reference compound (ethanol or isoprene), Cl2, and synthetic air in the 16 L cell and using FTIR to monitor 2 MB and the reference compound as a function of reaction time. The IR bands selected for monitoring the loss of 2 MB and the reference compounds were centred at 2700 cm−1 for 2 MB, 1070 cm−1 for ethanol, and 3095 cm−1 for isoprene. The disappearance of 2 MB and the reference compound is mainly due to reaction with Cl, although they can also be lost by heterogeneous reaction onto the reactor walls, UV photolysis, and/or reaction with the oxidant precursor. These loss processes were evaluated in preliminary and independent experiments in the absence of Cl2 and UV light (wall loss, kw), in the absence of UV light (reaction with Cl[Cl2]0), and by irradiating in the absence of Cl2 (UV photolysis, khν) as described in previous studies (Antiñolo et al., 2019, 2020). Table 1 summarizes the loss rate coefficients for these processes and the overall loss rate coefficients, kTotal_loss (kloss for 2 MB and kRef,loss for the reference compound).
Table 1Measured loss rate coefficients of 2 MB and the reference compounds.
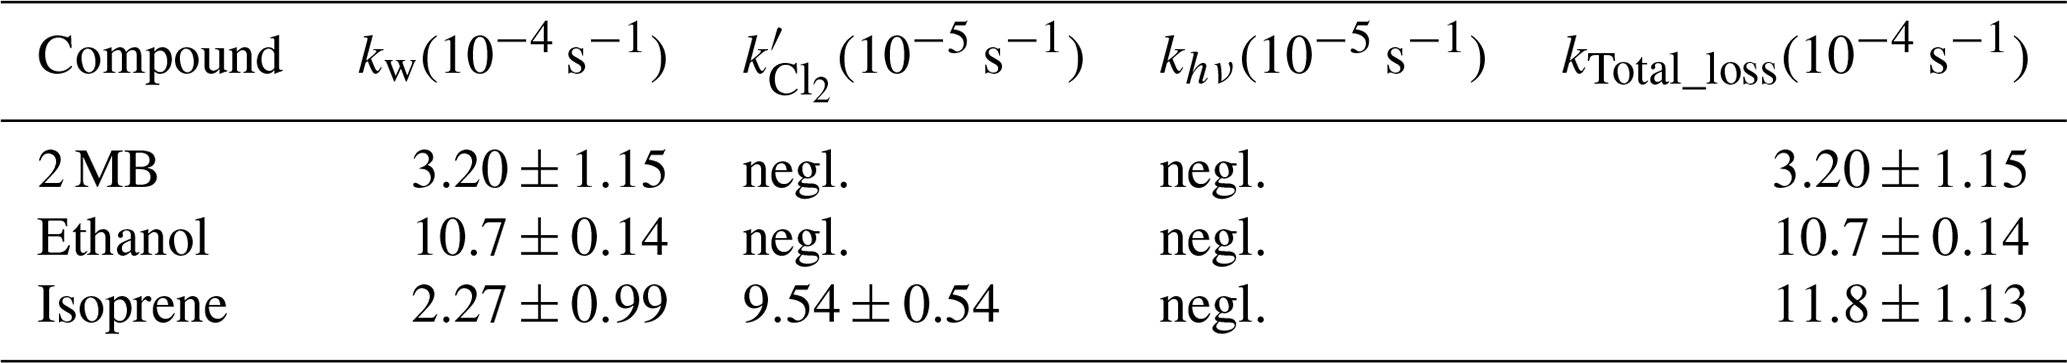
negl.: negligible.
Therefore, taking into account the overall losses for both 2 MB and the reference compound, the integrated rate equation is given by the following expression:
where kref is the rate coefficient for the Cl reaction with the reference compound at 298 K and 760 Torr. [2 MB]0, [2 MB]t, [Ref]0, and [Ref]t are the concentrations of 2 MB and the reference compound at the beginning of the reaction and at a reaction time t, respectively. Initial concentrations in the cell were [2 MB] molec. cm−3, [Cl2] molec. cm−3, [ethanol] molec. cm−3, and [isoprene] molec. cm−3. In Fig. S5, an example of the plots of Eq. (2) is presented for both reference compounds.
2.3.2 Product study in the Cl reaction
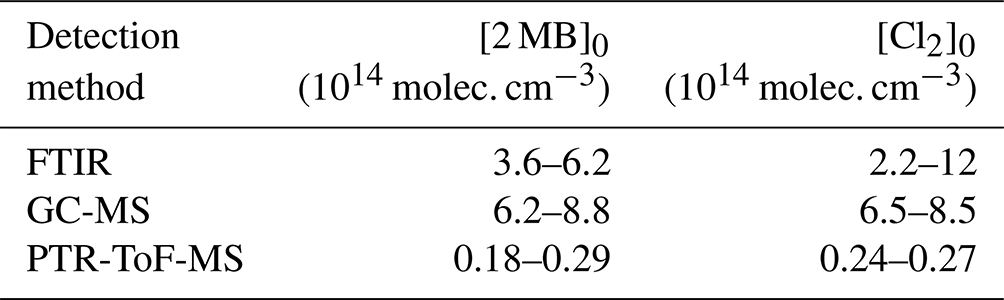
The identification of the gaseous products generated in the reaction of 2-methylbutanal with Cl atoms was performed using complementary detection techniques: FTIR spectroscopy (using the 16 L reactor) (Ballesteros et al., 2017; Antiñolo et al., 2019), GC-MS, and PTR-ToF-MS (using the 264 L simulation chamber) (Antiñolo et al., 2020) in separate experiments. In all cases, preliminary tests were carried out to check if products were generated during the dark reaction of 2 MB with Cl2 and/or during the UV light exposure of 2 MB. When GC-MS was used, no products due to these processes were observed. Nevertheless, with FTIR and PTR-ToF-MS the formation of some products was observed during UV light exposure of 2 MB (see Sect. 4.3.1). In all the experiments, synthetic air was used as diluent gas at 298 K and 760 Torr, and the reaction mixture was irradiated for 60 min. IR spectra, chromatograms, and mass spectra were recorded every 2 min, 10 min, and 20 s, respectively. In Table 2, the initial concentrations of 2 MB, Cl2, and air mixtures are summarized. Because of the high sensitivity of the PTR-ToF-MS, the initial concentrations of 2 MB and Cl2 were reduced with respect to those employed in the FTIR and GC-MS experiments. Furthermore, at the inlet of the PTR-ToF-MS the reaction mixture was diluted (a factor of ) with an air flow by means of a dynamic inlet dilution system to avoid signal saturation. Quantified products were corrected to account for their loss due to Cl reaction according to the method described by Ceacero-Vega et al. (2012).
In addition to the gaseous reaction products, the secondary organic aerosols produced in the Cl+2 MB reaction were detected, and the size distribution of these SOAs was measured by a fast mobility particle sizer (FMPS) spectrometer (TSI 3091). The detailed experimental procedure can be found in the Supplement.
Table 2Initial concentrations of 2 MB and Cl precursor in the reactor.
2.4 Chemicals
For gases, synthetic air (99.999 %, Air Liquide), Cl2 (Sigma Aldrich, 99.8 %), and He (Nippon Gases, 99.999%) were used as supplied. Liquids from Sigma Aldrich, with purities in brackets, were used after freeze–pump–thaw cycles: 2-methylbutanal (95 %), ethanol (99.8 %), isoprene (99 %), butanone (99 %), and acetaldehyde (99.5 %). The aqueous solution of H2O2 (Sharlab, >50 % ) was preconcentrated as described by Albaladejo et al. (2002).
3.1 UV photochemistry of 2-methylbutanal
3.1.1 Photolysis frequency (J) and effective quantum yield (Φeff) at λ≥290 nm
As shown in Fig. 2, 2 MB absorbs in the ultraviolet range, exhibiting a weak absorption band in the 220–360 nm range due to the forbidden transition of the C=O chromophore, with a maximum at 296 nm. The maximum σλ was determined to be ( cm2 per molecule (stated uncertainty in our results throughout the document is ±2σ statistical). Therefore, in the troposphere the actinic radiation (λ≥290 nm) can initiate photochemical processes for 2 MB. Four photolysis experiments were performed under the conditions described in Sect. 2.1.2. In Fig. 3 the average values of individual ln([2 MB]0 [2 MB]t) obtained in the four experiments are plotted against t, showing a good linearity. From the slope of such a plot and correcting it with the wall losses of 2 MB, as described in Sect. 2.1.2, s−1 was obtained.
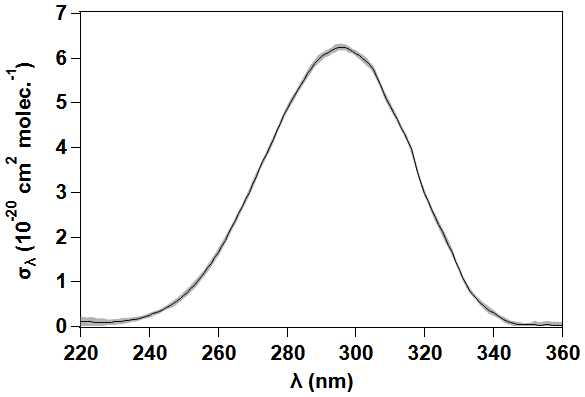
Figure 2UV absorption cross sections of 2 MB at 298 K. The grey shadow represents the statistical uncertainty.
The photolysis quantum yield at a single wavelength (Φλ) is related to the photolysis rate coefficient as follows:
where Iλ is the irradiance in photons per square centimetre per nanometre per second (cm−2 nm−1 s−1) at λ. However, J can be approximated to
where, in this work, Φeff is the effective quantum yield of 2 MB, Iλ>290 nm is the measured irradiance at each wavelength, σλ is the experimentally determined UV absorption cross sections of 2 MB, and Δλ=1 nm. Taking into account all these parameters, ). An experiment was done in the presence of cyclohexane ([cyclohexane] [2 MB] = 8.2), which is widely used as the OH scavenger in this kind of experiment to evaluate the impact of oxidants formed in this reaction. No difference was observed with the experiments with no cyclohexane, indicating that the chemistry of the OH radical is negligible. This value is ca. half of that previously reported (Wenger, 2006) measured in the atmospheric simulation chamber EUPHORE (Valencia) under natural irradiation conditions: ). The reason for this difference is unknown. It is worth to note though that in the same study, for structurally similar aldehydes like pentanal or 3-methybutanal, the reported Φeff were closer (0.30±0.02 and 0.27±0.01, respectively) to that determined in this work.
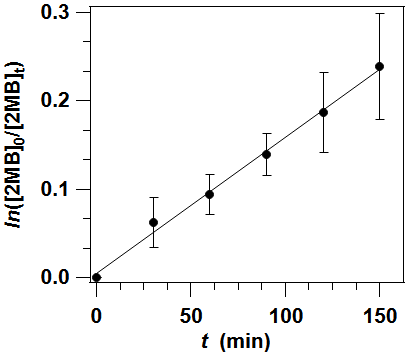
Figure 3Plot of Eq. (1) in which the average ln([2 MB]0 [2 MB]t) over time has been represented
3.1.2 UV photolysis products of 2 MB
Photodissociation of 2 MB by UV radiation can proceed through the following channels.
Reactions (R1a) and (R1b) are radical-forming channels, while Reaction (R1c) yields close-shell molecules, i.e. butane (CH3CH2CH2CH3) and carbon monoxide (CO). Figure 4a shows the recorded IR spectra of the 2 MB and air sample before irradiation. After 150 min of irradiation, the IR features from 2 MB were subtracted to identify the formed products, as shown in Fig. 4b. Products from Reaction (R1c), butane and CO, were clearly identified at 2800–3000 cm−1 and 2000–2300 cm−1, respectively, indicating that this channel is open in the investigated wavelength range. The product yield (Yproduct) is obtained from the slope of the concentration of the product versus the consumed 2 MB, Δ[2 MB]. To determine the effective quantum yield of Reaction (R1c), φR1c, the yield of formation of CO (YCO) or butane (Ybutane) could be used if no secondary chemistry was present, which is not the case for CO since it is a very end degradation product and can be formed in many oxidation reactions. Therefore, CO is not a good marker for the importance of the photolysis Reaction (R1c). In addition, YCO was observed to increase when the initial concentration of 2 MB decreased. Butane was quantified using the reference spectrum shown in Fig. S6 and the 2800–3000 cm−1 IR band, yielding ) % (see Fig. S10). As presented in Fig. 4b, butanone (CH3CH2C(O)CH3) was also identified as a product of 2 MB photolysis in the presence of air, and its product yield was ) % (see Fig. S10). Quantification of butanone was done using the reference spectra shown in Fig. S6 for the IR bands: 2850–3100 cm−1 and 1650–1800 cm−1. After subtracting the IR features of CO, butane, and butanone, some IR features were left in the residual spectrum (Fig. 4c). The band centred around 1040 cm−1 can be assigned to the C−O stretching mode of an alcohol (probably 2-butanol or methanol according to the proposed mechanism in Sect. 3.4.2), and the one centred around 1740 cm−1 can be assigned to the C=O stretching mode of a carbonyl group, alluding to aldehydes or ketones formation. The bands centred around 3000–2860 cm−1 can be assigned to the Csp3−H stretching mode, and finally, the bands located around 1300–1400 cm−1 can correspond to the C−H bending mode. However, the remaining IR bands in the residual spectrum could not be assigned to other gaseous oxidation products.
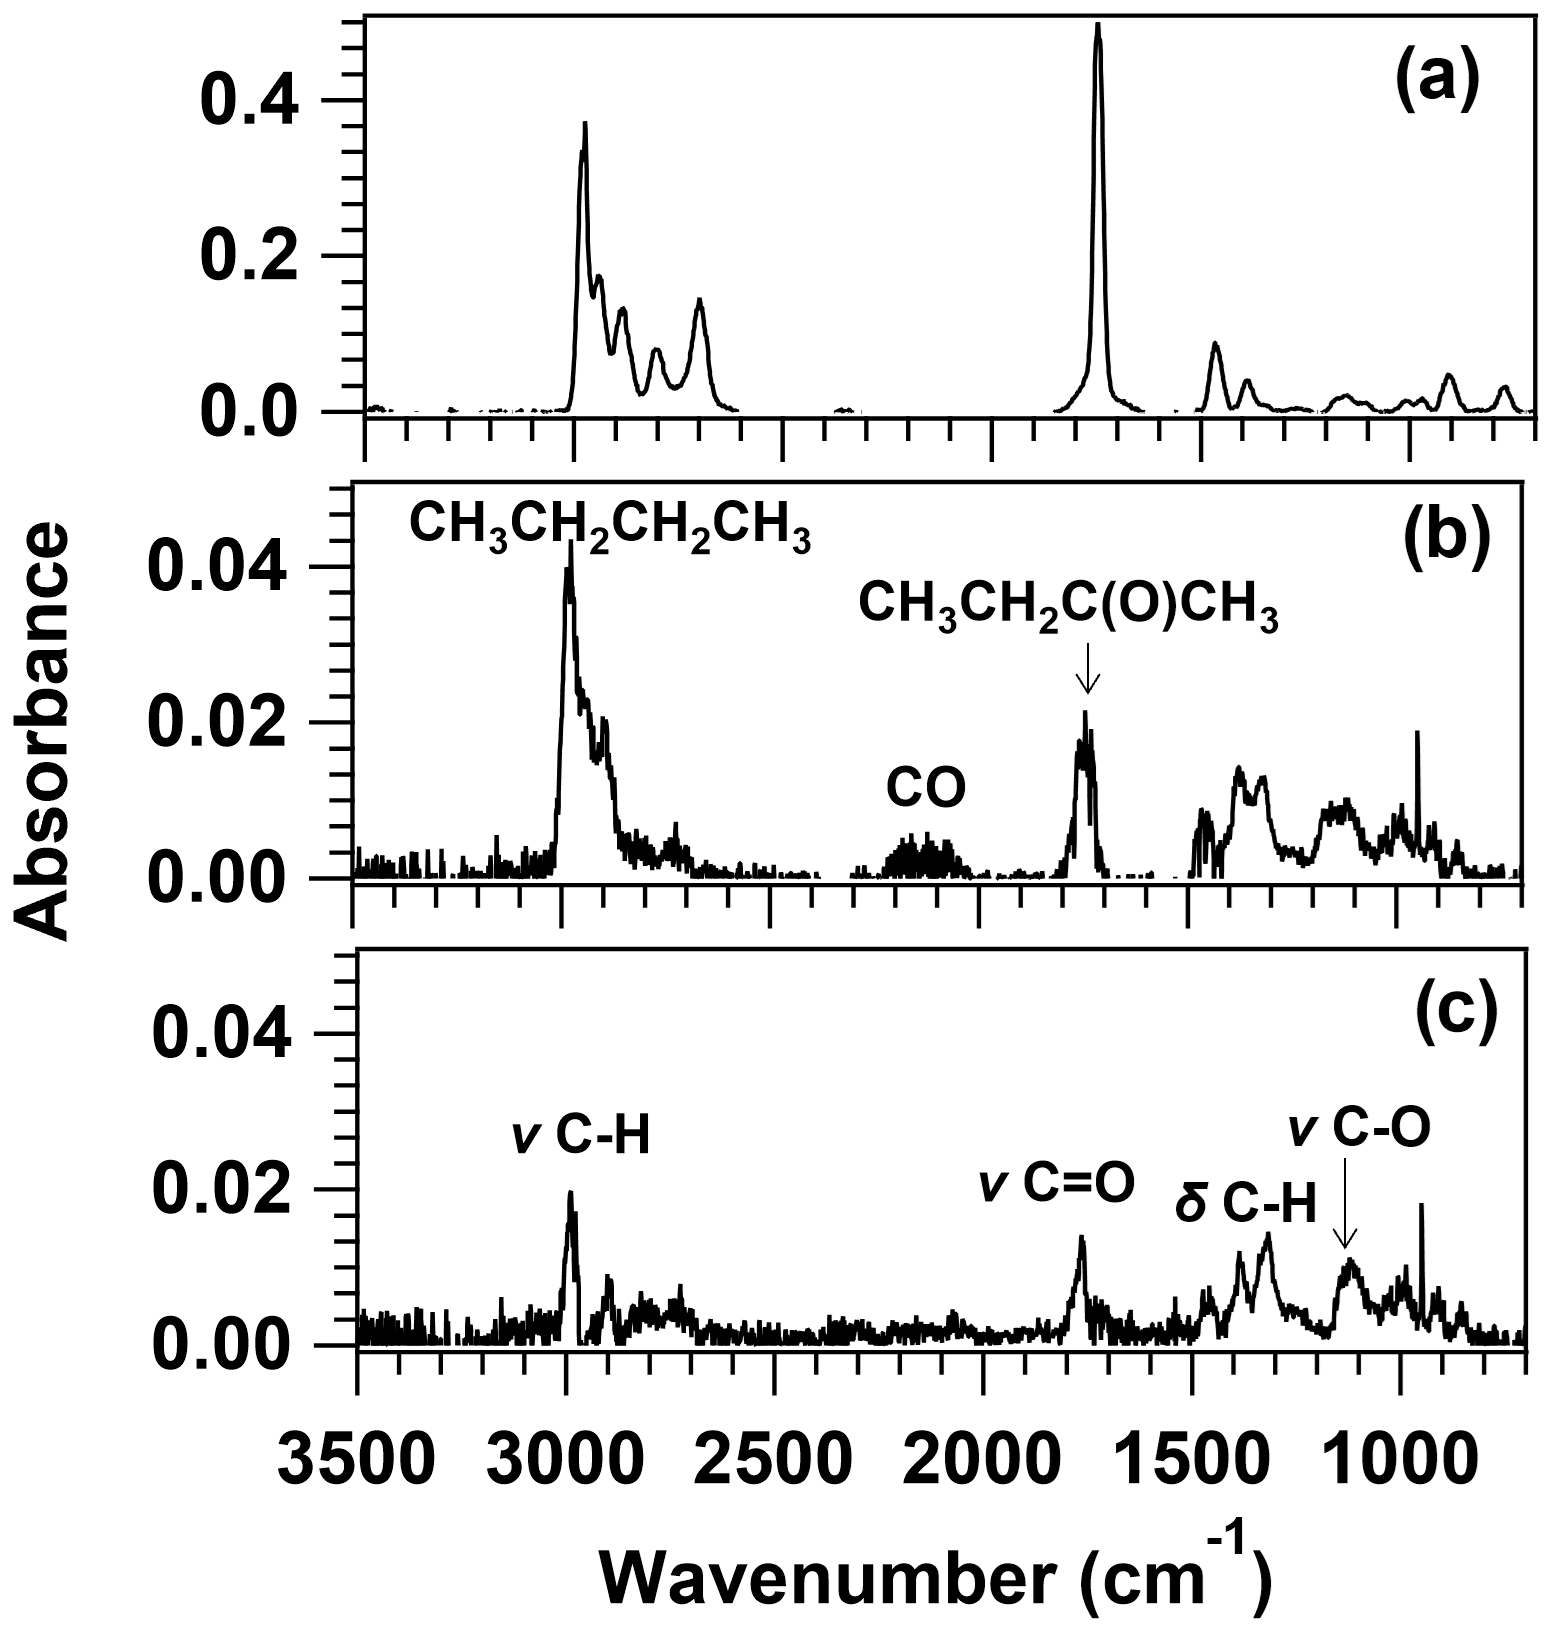
Figure 4FTIR spectra of a 2-methylbutanal and air mixture (a) before irradiation and (b) after 150 min of photolysis with the features of 2 MB subtracted (major products are labelled in the spectrum, exact positions of the bands are given in the main text), as well as (c) residual spectrum after the subtraction of the reference spectra of the identified products shown in Fig. S6.
Butanone was also identified by GC-MS and PTR-ToF-MS. Figure S7 shows an example of the chromatogram of a mixture of 2 MB in synthetic air before and after photolysis (150 min). Although the PTR-ToF-MS technique allows the measurement of volatile organic compounds in gaseous samples as a function of time by taking some flow from the sample, the volume of the photolysis cell was too small to maintain the pressure during the photolysis experiments. For that reason, after 150 min of photolysis, the maximum photolysis time used in this work, the content of the photolysis cell was transferred to the 16 L chamber and diluted in synthetic air. This diluted sample was flowed through the PTR-ToF-MS for 5 min, in which mass spectra were measured. From the average of these mass spectra, only products could be detected, but a temporal evolution could not be obtained. Under these conditions, butanone (C4H8OH+, ) was detected.
Table 3Individual rate coefficients of the 2 MB + OH reaction as a function of temperature and total pressure.
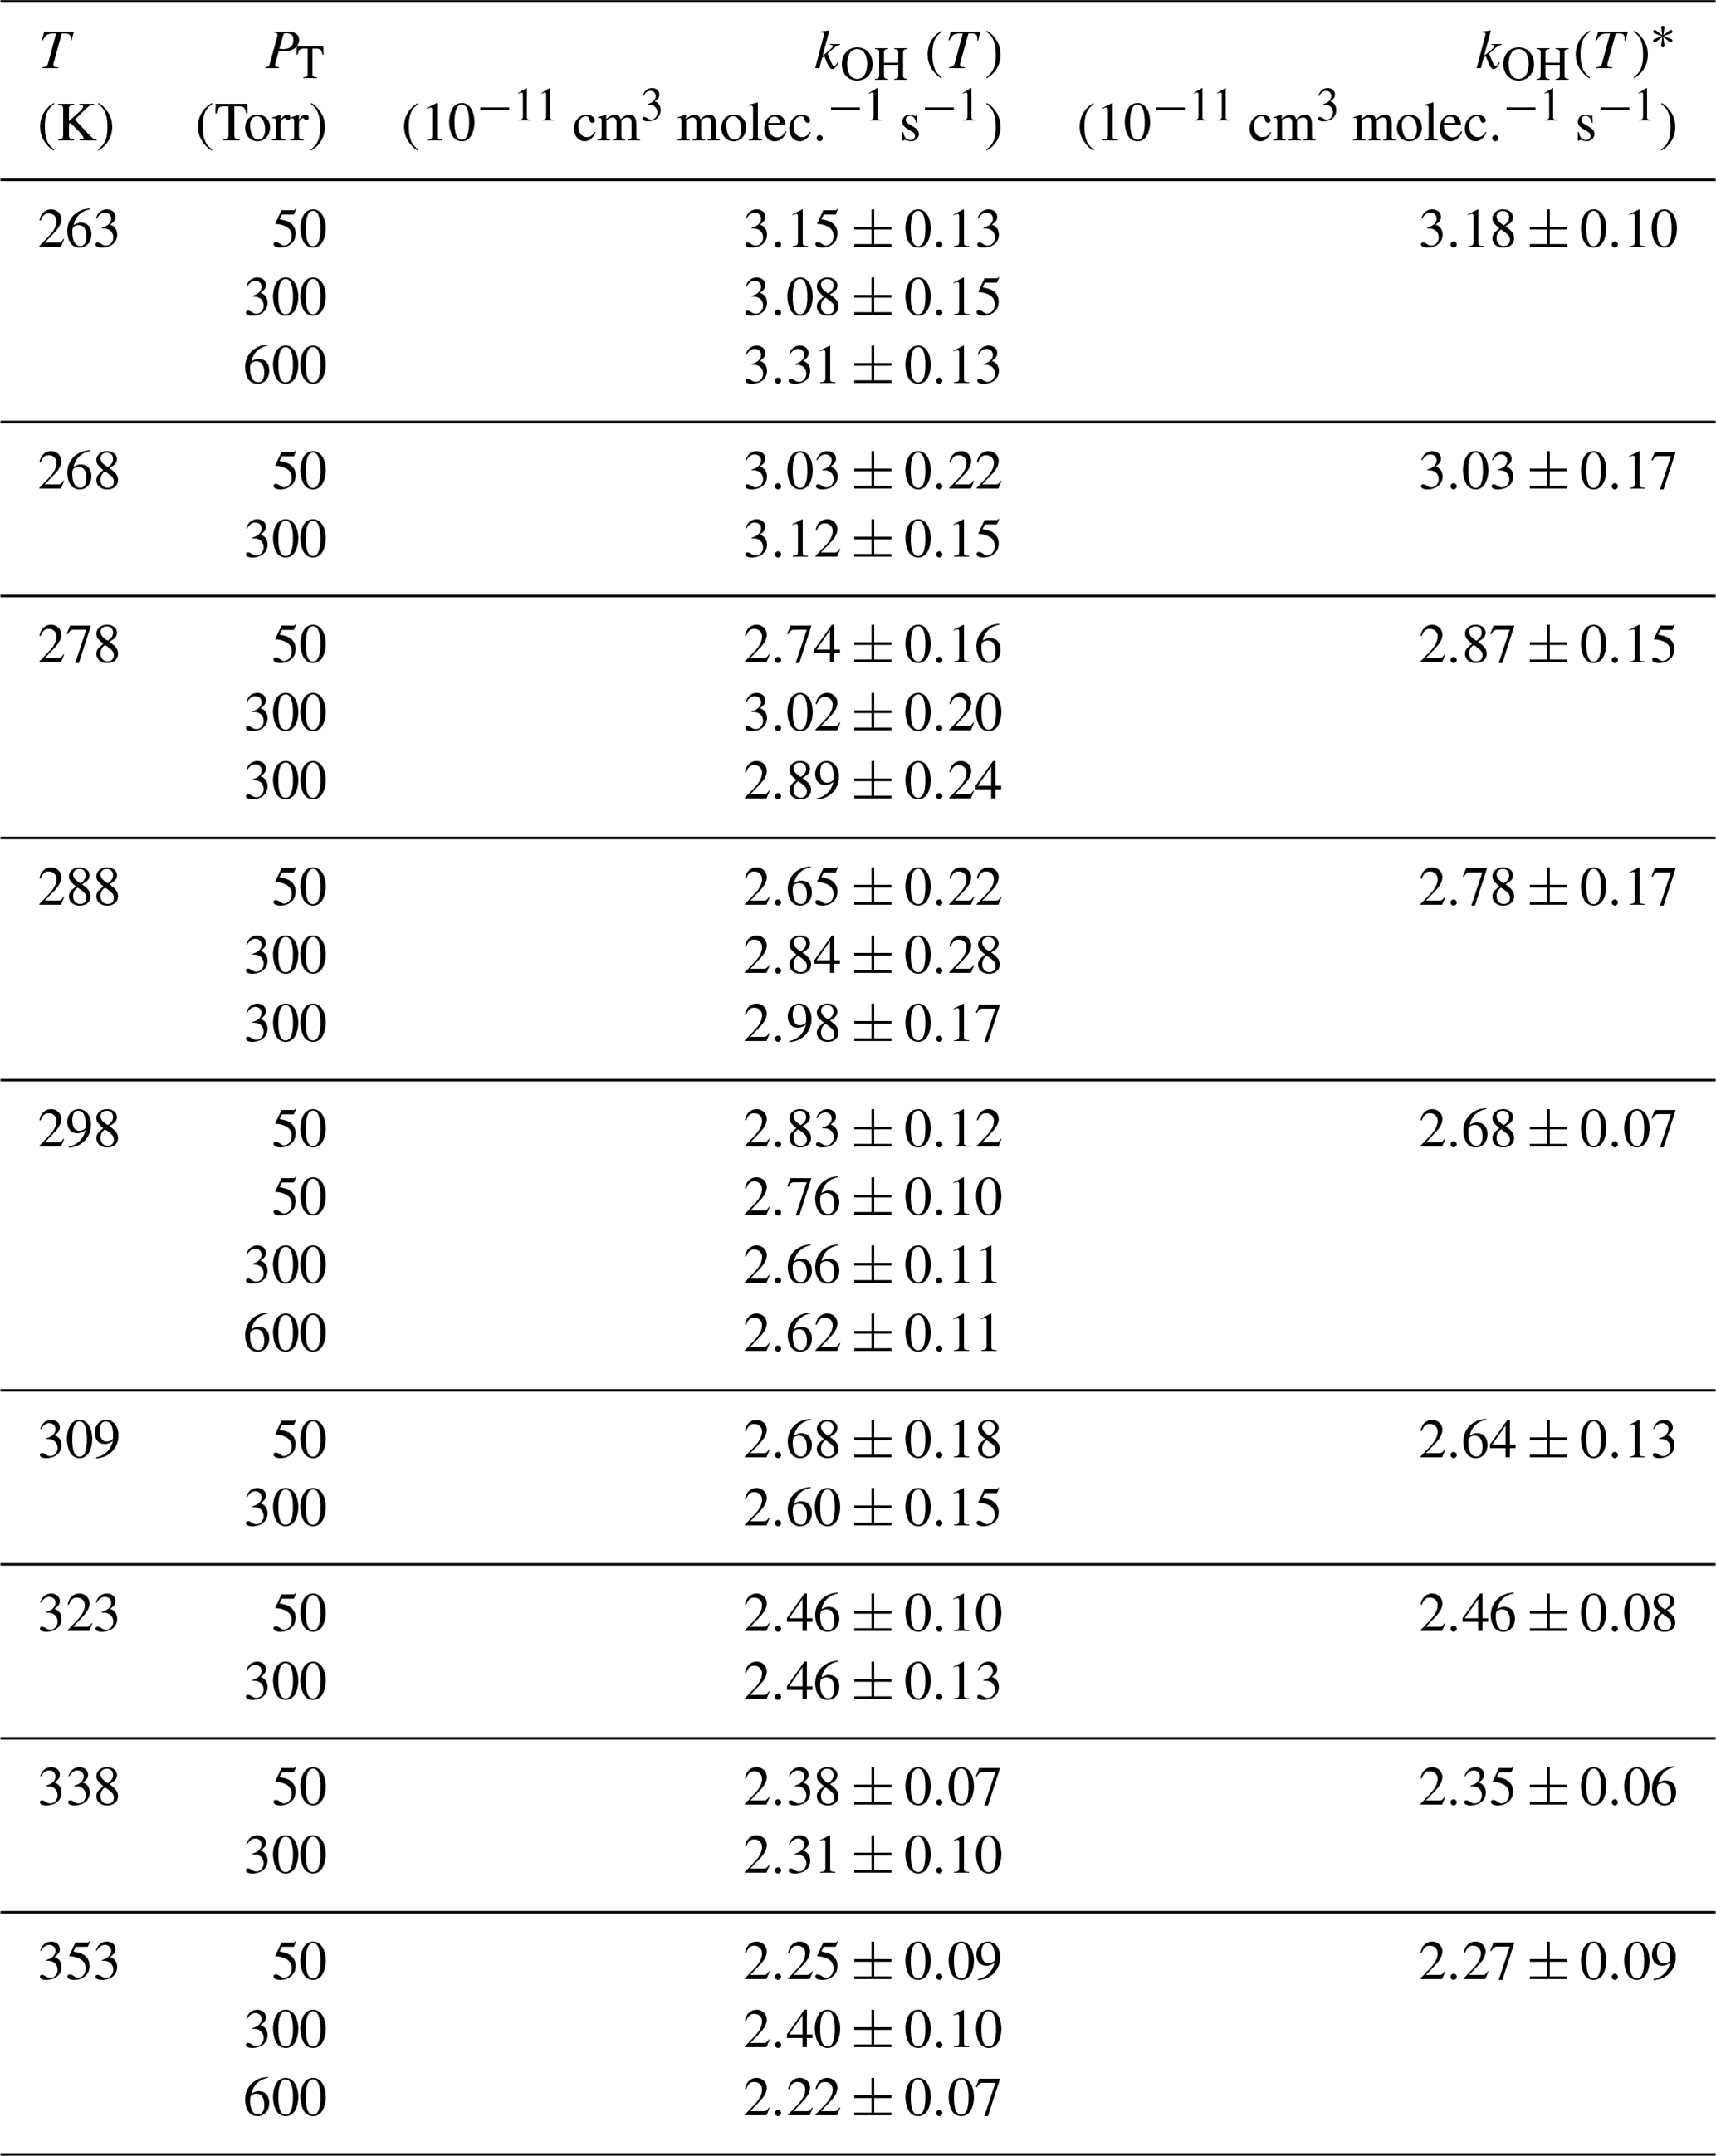
∗ Values obtained from the versus [2 MB]0 plot combining all kinetic data at different total pressures.
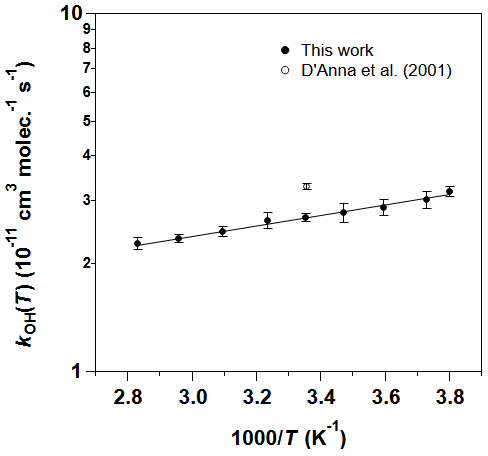
Figure 5Arrhenius plot for the rate coefficient of the 2 MB + OH reaction between 263 and 353 K.
3.2 Kinetics of 2 MB with OH at T and P conditions of the troposphere
The individual rate coefficients for the 2 MB + OH reaction obtained at a certain temperature and total cell pressure (PT) are listed in Table 3. No pressure dependence of kOH(T) in the studied temperature range was observed, within the experimental uncertainties. For that reason, all values obtained at different total pressures were combined and plotted versus [2 MB]0, according to Eq. (3) of the Supplement, as shown in Fig. S4 for 263 and 353 K. The resulting kOH(T) are listed in the last column of Table 3. We observe a slight negative T dependence of kOH(T), increasing 40 % from 353 to 263 K. In Fig. 5, kOH(T) as a function of temperature is depicted, together with the previous reported data by D'Anna et al. (2001), at room temperature. The observed T dependence is well-described by the following Arrhenius equation (solid line in Fig. 5):
where the activation energy is () kJ mol−1. The reported kOH by D'Anna et al. (2001) at room temperature was cm3 molec.−1 s−1, which is 22 % higher than the one obtained in this work: kOH(298 K) = cm3 molec.−1 s−1. The reason for this discrepancy may be found in the different methods used: D'Anna et al. (2001) used a relative rate kinetic method with FTIR spectroscopy as the detection technique in which they used air as bath gas at (298±2) K and (760±7) Torr. They only used one reference compound for their analysis, 1-butene, and that may result in an important source of error. In addition, the selected IR band for 1-butene (3140–3070 cm−1) is too weak to be accurately monitored. Another possibility is that this band, or the selected one for 2 MB (2740–2670 cm−1), might interfere with IR features from reaction products.
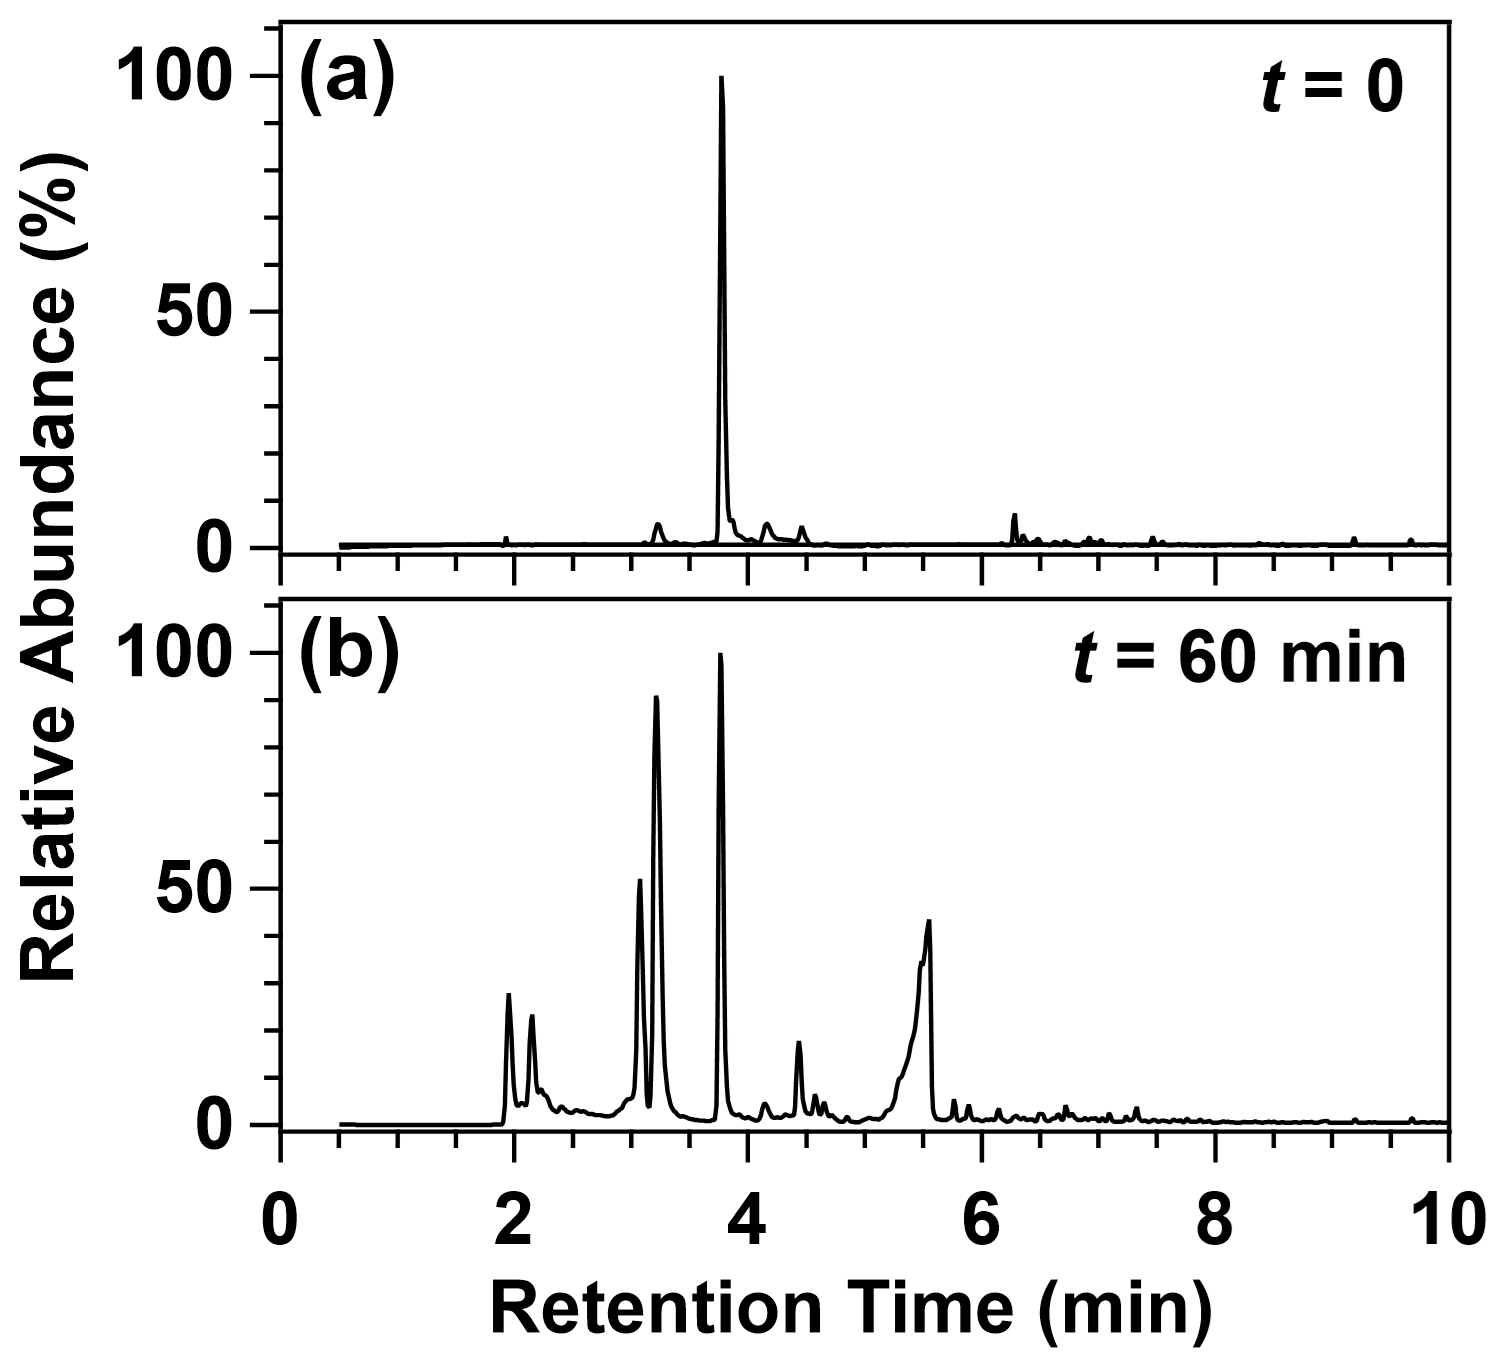
Figure 6Chromatograms obtained for a 2 MB and Cl2 mixture before irradiation (a) and after 60 min of irradiation (b).
Table 4Results obtained in the kinetic experiments for the gas-phase reaction of Cl with 2-methylbutanal at 298±2 K and 760±5 Torr of air.
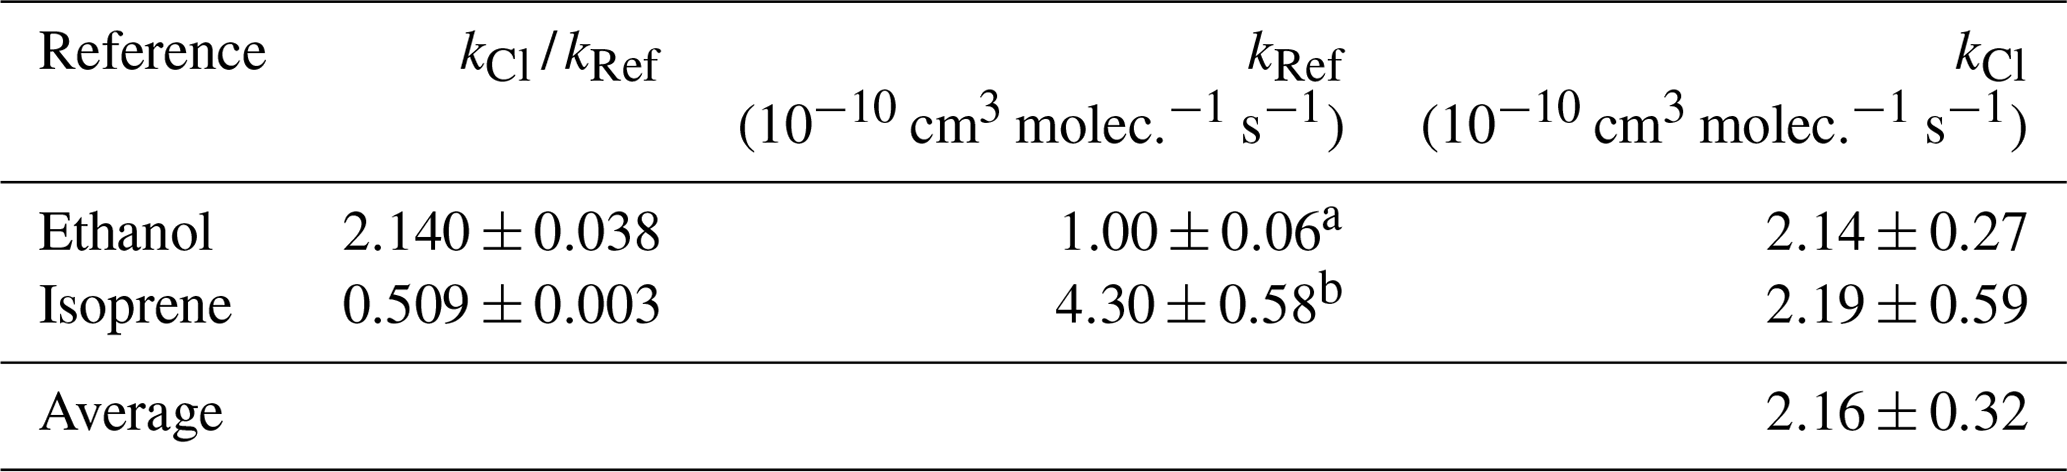
a Atkinson et al. (2006), b Orlando et al. (2003).
3.3 Cl reaction of 2 MB at T and P conditions of the marine boundary layer
3.3.1 Kinetics with Cl atoms
The plots of Eq. (2) for the two references used in this work can be seen in Fig. S5, in which a good linearity is shown, indicating that no secondary reactions were interfering. From the slope of these plots, kCl/kRef was obtained according to Eq. (2). Thus, from the rate coefficients of the reference compounds previously reported for the Cl reaction of ethanol and isoprene (Atkinson et al., 2006; Orlando et al., 2003), kCl was determined. Table 4 shows the rate coefficients obtained in this work with each reference compound and the averaged value: ( cm3 molec.−1 s−1. The uncertainty in kCl includes the propagation of the reported errors in kRef, the uncertainties in kloss, and the statistical errors from the slope of the plots shown in Fig. S5. The contribution of kloss to the total loss of 2 MB was found to be 4 %.
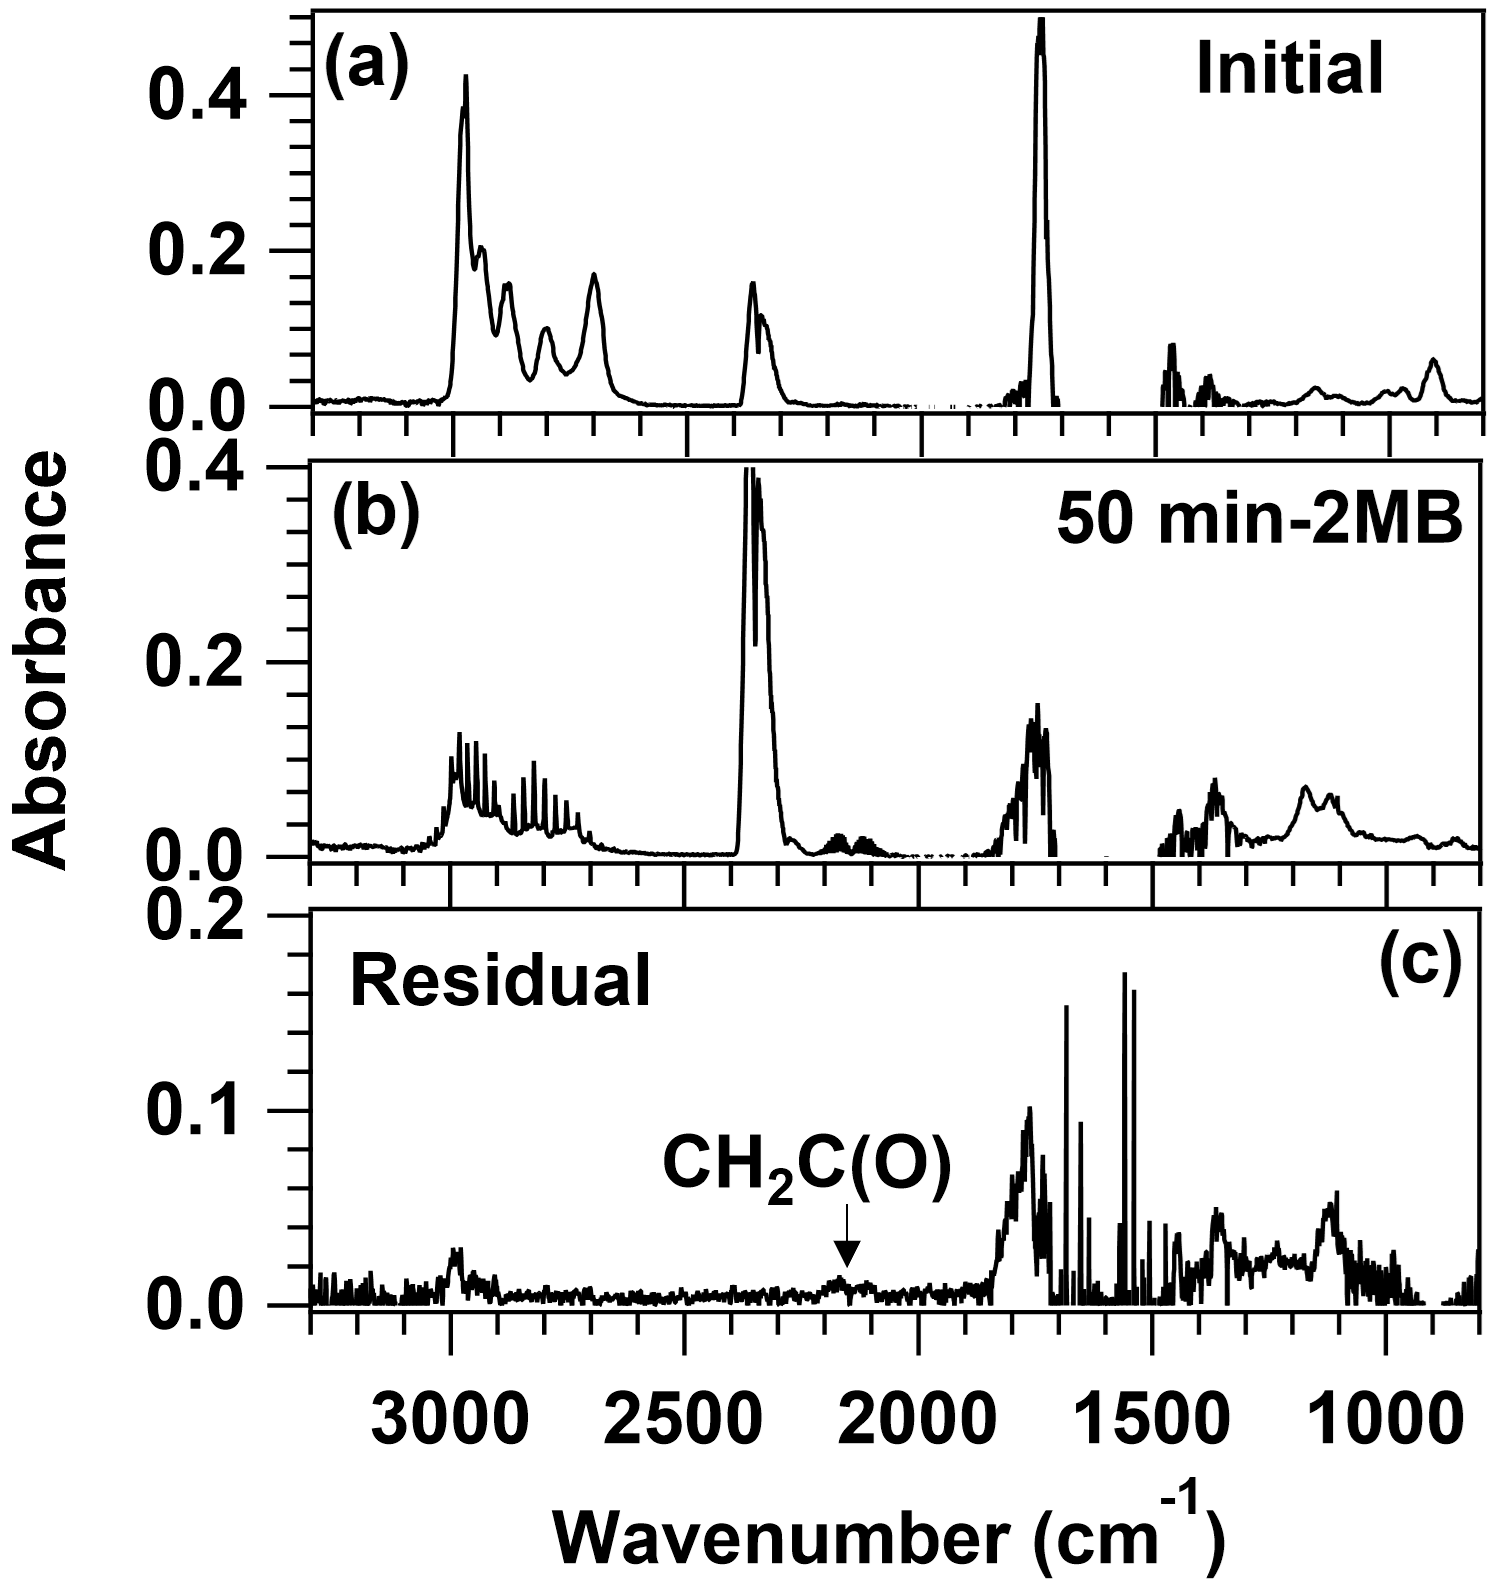
Figure 7FTIR spectra used in the identification of the products in the Cl reaction of 2 MB. The top panel shows the initial spectrum, the central panel shows the spectrum obtained after 50 min of Cl reaction, with the features of 2 MB subtracted, and the bottom panel shows the residual spectrum after the subtraction of reaction products shown in Fig. S6.
3.3.2 Identification and quantification of the gaseous products of the Cl + 2 MB reaction
Identification by GC-MS
Figure 6 shows the obtained chromatograms before and after 60 min reaction time, and Fig. S8 shows the mass spectra of the detected products corresponding to those chromatographic peaks. The peak corresponding to 2 MB was observed at a retention time (RT) of 3.76 min. The rest of the peaks that appear in the chromatogram were assigned, according to their mass spectrum, to the following products: acetaldehyde (RT = 2.15 min), 2-butanol (RT = 3.08 min), butanone (RT = 3.21 min), methylglyoxal (RT = 4.44 min), and 2-methylbutanoic acid (RT = 5.55 min).
Identification and quantification by FTIR Spectroscopy
Figure 7 shows the FTIR spectrum recorded after 50 min of reaction time. The features of 2-methylbutanal have been subtracted for clarity purposes. By comparison with the reference spectra (shown in Fig. S6), the most abundant products observed were HCl, butanone, and CO. The yield for butanone, Ybutanone, obtained from the plots shown in Fig. S9a, was (53.1±1.6) %. Formation of acetaldehyde and formaldehyde was also observed, but their quantification was very imprecise due to the low signal of the residual spectrum, the similarity between both IR spectra, and the possible presence of other minor products such as propanal and 2-butanol. After subtracting HCl, butanone, and CO, ketene (CH2C(O)) could be identified in the residual spectrum (shown in the bottom panel of Fig. 7) by comparison with the IR features reported by Wallington et al. (1996). The remaining bands could come from methylglyoxal, which was observed by GC-MS. It is worth noting that small amounts of acetaldehyde, formaldehyde, butanone, and CO ( molec. cm−3) were observed during UV light exposure of 2-methylbutanal, but their amount was negligible compared with the observed ones during the Cl reaction molec. cm−3).
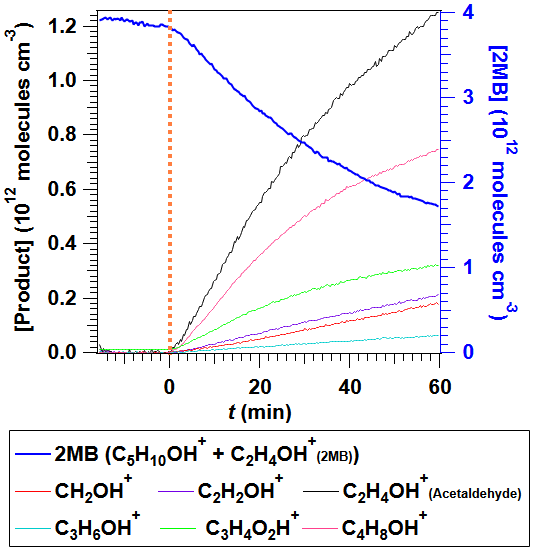
Figure 8Temporal evolution of 2-methylbutanal (sum of the two identified ions) and the most abundant products measured by PTR-ToF-MS during the 2-methylbutanal + Cl reaction. Vertical dashed line indicates when UV lamps are switched on.
Identification by PTR-ToF-MS
The identified reaction products, with an average ion concentration greater than or equal to 0.2 ppb, were acetaldehyde (C2H4OH+, ), butanone (C4H8OH+, ), methylglyoxal (C3H4O2H+, ), 2-butanol (C4H10OH+ ), formaldehyde (CH2OH+ ), ketene (C2H2OH+, ), methanol (CH4OH+, ), 2-methylbutanoic acid (C5H10O2H+, ), and propanal (C3H6OH+, ). All the products observed by GC-MS and FTIR, except CO and HCl, were also observed by PTR-ToF-MS. In the PTR-ToF-MS analysis, it was observed that 2 MB yields two different ions when ionized: C5H10OH+ (39 %) and C2H4OH+ (61 %). As the most abundant fragment from 2 MB, C2H4OH+, overlaps with the molecular ion from acetaldehyde, in order to quantify this product the contribution of 2 MB to the C2H4OH+ signal was eliminated taking into account its correlation with the C5H10OH+ signal when only 2 MB was present in the chamber. In Fig. 8 the time-evolution of 2 MB (plotted as the sum of the two identified ions) and the main products, acetaldehyde, butanone, and methylglyoxal, are shown. The molar product yields, obtained from the plots shown in Fig. S9b, were (67.9±0.8) %, (34.9±0.6) %, and (14.8±0.2) %, respectively. In addition, very low concentrations of 2-butanol were detected with a product yield of (0.11±0.03) %. It must be noted that formaldehyde and ketene are formed during UV light exposure of 2-methylbutanal in the test prior to the Cl reaction but at very low concentrations ( molec. cm−3) compared with the observed levels after the Cl reaction.
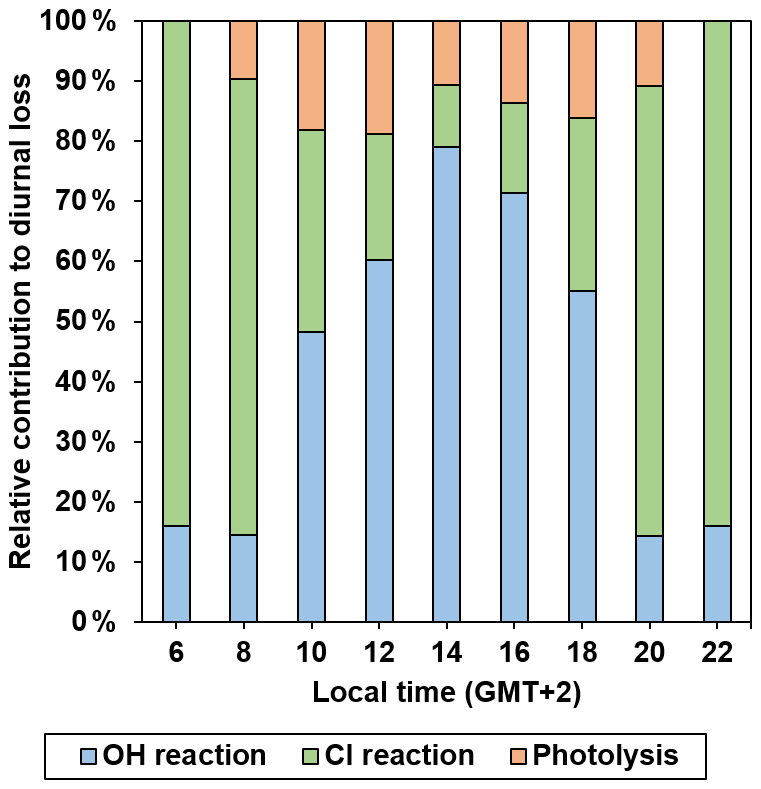
Figure 9Relative contribution of the three removal routes studied in this work to the total diurnal loss.
3.3.3 Secondary organic aerosols (SOAs)
The yield of SOAs formed in the Cl + 2 MB reaction, YSOA, was determined under different conditions (see Table S3) from plots such as the one presented in Fig. S11. As summarized in Table S3, YSOA ranged from 0.16 % to 0.76 % and shows a negative dependence on [2 MB]0 [Cl2]0, i.e. it decreased when that ratio increased. The size distribution of the particles formed in the Cl + 2 MB reaction with diameters (Dp) between 6 and 523 nm is shown in Fig. S12 in terms of the normalized particle number, dN dlogDp, and mass, dM dlogDp. The maximum dM dlogDp was observed at diameters near 500 nm, close to the maximum Dp that the FMPS apparatus can measure. After 12–30 min of reaction, SOAs coagulated (Dp>500 nm) and were not able to be detected by the FMPS.
3.4 Photodegradation mechanisms
3.4.1 Mechanism of the UV photodissociation of 2 MB
It is clear that the molecular elimination of CO (Reaction R1c) occurs since butane (Ybutane=9.80 %) and CO were detected. Although CO is directly produced in Reaction (R1c), it can also be rapidly produced by the reaction of formyl radical, HCO, formed in Reaction (R1b) with O2 (Fig. S13b). Butanone (Ybutanone=14.8 %) is plausible to be formed from the radical-forming Reactions (R1a) and (R1b). The CH3CH2CH(CH3)CO and CH3CH2CH(CH3) radicals formed in those reactions, respectively, react rapidly with O2 to produce the corresponding peroxy (RO2) radical that is involved in a sequence of reactions to generate butanone, among other species. Other molecular photolysis pathways are the following (Gruver and Calvert, 1956; Wenger, 2006).
None of these products were detected by PTR-ToF-MS or GC-MS. However, it is possible that CH3CH=CHC(O)H and/or CH3CH=CHOH were responsible of the remaining bands observed in the residual IR spectrum, although this could not be justified due to the lack of reference spectra. Neither CH4 nor CH2=CH2 could be clearly detected.
3.4.2 Mechanism of the 2 MB + Cl reaction
After evaluating the gas-phase products formed in the Cl reaction with 2-methylbutanal, some information can be inferred concerning the reaction mechanism. The presence of HCl as a primary product and the fact that no other chlorinated products were observed indicate that the reaction proceeds via the H abstraction from different sites in 2 MB. There are five susceptible reaction sites in 2 MB.
The mechanisms for the H abstraction from the −C(O)H group and from the hydrocarbon chain are depicted in Figs. S13a and S14, respectively. As shown in the figures, acetaldehyde (CH3C(O)H), formaldehyde (HC(O)H), or methanol (CH3OH) formation can be explained by any of the five possibilities, CH3CH2C(O)CH3 can be only formed if the aldehydic H (Fig. S13a) or the tertiary H in C-2 are abstracted (Fig. S14a), and methylglyoxal (CH3C(O)C(O)H) is a product only when a hydrogen atom from C-2 and C-3 is abstracted (Fig. S14a–b). Although abstraction at the −C(O)H and tertiary C-2 site is likely dominant, methylglyoxal may not be a major product of C-3, and thus our product data are not conclusive on this issue.
Considering the most important diurnal degradation pathways (UV photolysis and reactions with OH radicals and Cl atoms), the relative importance of these three degradation routes on the total atmospheric loss of 2 MB, katmos_loss (2 MB), can be estimated, according to Eq. (6).
where J(z,θ) is the photolysis rate of 2 MB at a certain altitude z and zenith solar angle (θ); kOH and kCl are those determined in this work at 298 K; and [OH] and [Cl] are the tropospheric concentrations of OH radicals and Cl atoms which depend on the considered scenario. Each term was estimated for a coastal city (Valencia, Spain) at sea level (z=0 km) for two scenarios: (i) as a function of time from 06:00 to 18:00 LT (local time, corresponding to GMT + 2) and (ii) for 24 h average conditions. J(z,θ) is defined as follows (Jiménez et al., 2007):
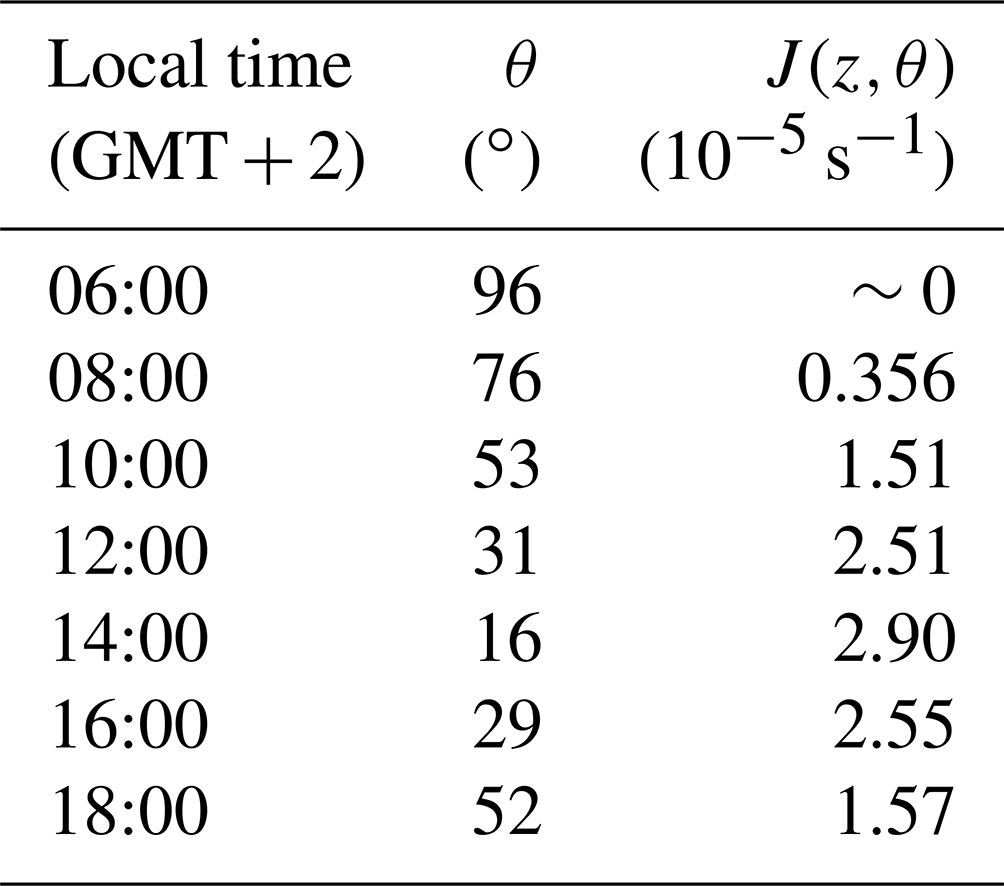
where σλ values used in the calculation are those listed in Table S1, and Φeff=0.30, determined in this work. (in photons cm−2 nm−1 s−1) is the solar spectral actinic flux at 0 km for a specific θ in the troposphere, obtained using the TUV radiative transfer model (5.3 version) developed by Madronich and Flocke (1999), and Δλ=1 nm. In scenario (i), was set for θ between 16∘ at 14:00 LT and 96∘ at 06:00 LT, while in scenario (ii) is the 24 h average solar spectral actinic flux. The estimated J (z, θ) values at sea level as a function of the zenith angle are provided in Table 5. As expected, it is observed that photolysis is faster at 14:00 ( s−1) when the solar actinic flux is maximum, whereas it is negligible at the beginning and the end of the day. In scenario (ii), the calculated J(z,θ) was s−1.
Table 5Estimated photolysis rate coefficients of 2-methylbutanal at sea level (z=0 km) in the summer solstice day in Valencia (Spain).
To calculate the contribution of the OH reaction to katmos_loss (2 MB) in scenario (i), the temporal values of [OH] are considered to be similar to those modelled by Forberich et al. (1999) for a day at the end of June at Weybourne (UK), a location with similar θ as Valencia in June except for the middle time of the day. In scenario (ii) a 24 h average of 1×10⁶ radicals cm−3 (Krol et al., 1998) was accepted for [OH]. In contrast, [Cl] was considered as a time-independent value in both scenarios. In scenario (i) an upper limit of 1.3×10⁵ atoms cm−3, taken as the peak Cl concentration predicted by Spicer et al. (1998) in marine environments, was considered, while a 24 h average value of 1×10³ atoms cm−3 (Singh et al., 1996) was assumed in scenario (ii).
Taking into account all these calculations, the relative contribution of each degradation route evaluated in this study to the diurnal loss of 2 MB in scenario (i) is depicted in Fig. 9. At dawn, the Cl reaction dominates the loss of 2 MB with a relative contribution of 84 %, followed by the OH reaction (16 %). On the other hand, in the middle times of the day, OH reaction is clearly the main removal route for 2 MB, with a relative contribution of 79 % at 14:00, followed by a competition between photolysis (11 %) and Cl reaction (10 %). Note that the relative contribution of Cl reaction is an upper limit as the considered [Cl] is a peak value. In scenario (ii), the OH reaction is the main removal route for 2 MB with a relative contribution of 72.7 %, followed by UV photolysis (26.7 %). The relative contribution of the Cl reaction is very small (0.6 %), which seems to be more realistic than using the peak Cl concentration.
The tropospheric lifetime of 2 MB, τ, can be estimated according to Eq. (6) using the conditions of scenario (ii).
In the atmosphere of Valencia (Spain) in June, the overall τ for 2 MB was estimated to be 7.5 h. Once emitted, 2 MB is degraded in few hours during daytime, so it will not be transported over long distances. Its degradation products include CO and carbonyl compounds such as butanone, acetaldehyde, or methylglyoxal that can be further oxidized in the troposphere and contribute to photochemical smog, impacting on human health. The evidence found in this work shows that ultrafine particles are formed in the Cl + 2 MB reaction but with yields of less than 1 %. Therefore, little impact on human health is expected by inhalation at those concentration levels. Finally, HCl, detected in the oxidation of 2 MB by Cl, can contribute to acid rain. However, it must be noted that the impact of the observed products on air quality and human health has a strong dependence on the amounts of 2 MB emitted to the troposphere.
This work presents a comprehensive study on the relative importance of the most important diurnal atmospheric degradation routes of 2-methylbutanal (2 MB) and on the formation of secondary pollutants (particulate matter and gaseous products). This study describes, for the first time, the kinetics of the UV photolysis of 2 MB at (298±2) K and (760±3) Torr, the temperature dependence of the rate coefficient for the OH + 2 MB reaction between 263 and 353 K at PT=50–600 Torr of He, and the rate coefficient of the Cl + 2 MB reaction at 298 K and 760 Torr. For the summer solstice day in Valencia (Spain), it was found that, for the 24 h average, the OH reaction is the main removal route for 2 MB, with a relative contribution of ca. 73 %. UV photolysis of 2 MB is also important, corresponding to a ca. 27 % of its total diurnal loss. Under these conditions, the overall tropospheric lifetime for 2 MB was estimated to be 7.5 h. In terms of the degradation products, it must be noted that the conditions used in this work ([RO2] > [HO2]) cannot be directly extrapolated to a real clean atmosphere, where the HO2 reactions are more important than those for RO2 radicals. However, the end-products identified in this work (CO, HCl, butanone, acetaldehyde, and methylglyoxal) are expected to be the same. Major products of the Cl + 2 MB reaction are butanone, acetaldehyde, CO, and HCl, but methylglyoxal was also detected. UV photolysis of 2 MB in the actinic region produces butane, butanone, and CO as major products. The carbonyl products formed can contribute to photochemical smog, whereas HCl can contribute to acid rain; however the real impact will depend on the amounts of 2 MB emitted to the troposphere. In addition, the yield of secondary organic aerosols formed in the Cl + 2 MB reaction is too small (<1 %) to affect human health.
Data are presented either in the paper or the Supplement.
The electronic Supplement includes additional tables, figures, and description of the methods. In addition, the Supplement also includes an Excel file with the determined UV and IR absorption cross sections as a function of wavelength. The supplement related to this article is available online at: https://doi.org/10.5194/acp-22-2689-2022-supplement.
MAs, MAn, and SB designed and conducted the experiments and analysed the experimental data. EJ and JA designed and supervised the experiments and managed the project. All the co-authors have contributed to preparing the manuscript and discussing the obtained results.
The contact author has declared that neither they nor their co-authors have any competing interests.
Publisher's note: Copernicus Publications remains neutral with regard to jurisdictional claims in published maps and institutional affiliations.
This work has been supported by the Regional government of Castilla-La Mancha through CINEMOL project (Ref.: SBPLY/19/180501/000052) and by the University of Castilla-La Mancha – UCLM (Ayudas para la financiación de actividades de investigación dirigidas a grupos (REF: 2019-GRIN-27175, 2021-GRIN-31279). María Antiñolo and Sergio Blázquez also acknowledge UCLM (Plan Propio de Investigación) for funding their contracts during the performance of this investigation.
This research has been supported by the Junta de Comunidades de Castilla-La Mancha (grant no. SBPLY/19/180501/000052) and the Universidad de Castilla-La Mancha (grant no. 2019-GRIN-27175, 2021-GRIN-31279).
This paper was edited by John Orlando and reviewed by two anonymous referees.
Albaladejo, J., Ballesteros, B., Jiménez, E., Martín, P., and Martínez, E.: A PLP–LIF kinetic study of the atmospheric reactivity of a series of C4–C7 saturated and unsaturated aliphatic aldehydes with OH, Atmos. Environ., 36, 3231–3239, https://doi.org/10.1016/S1352-2310(02)00323-0, 2002.
Antiñolo, M., Jiménez, E., Notario, A., Martínez, E., and Albaladejo, J.: Tropospheric photooxidation of CF3CH2CHO and CF3(CH2)2CHO initiated by Cl atoms and OH radicals, Atmos. Chem. Phys., 10, 1911–1922, https://doi.org/10.5194/acp-10-1911-2010, 2010.
Antiñolo, M., Olmo, R. D., Bravo, I., Albaladejo, J., and Jiménez, E.: Tropospheric fate of allyl cyanide (CH2=CHCH2CN): Kinetics, reaction products and secondary organic aerosol formation, Atmos. Environ., 219, 117041, https://doi.org/10.1016/j.atmosenv.2019.117041, 2019.
Antiñolo, M., Asensio, M., Albaladejo, J., and Jiménez, E.: Gas-Phase Reaction of trans-2-Methyl-2-butenal with Cl: Kinetics, Gaseous Products, and SOA Formation, Atmosphere, 11, 715, https://doi.org/10.3390/atmos11070715, 2020.
Atkinson, R., Baulch, D. L., Cox, R. A., Crowley, J. N., Hampson, R. F., Hynes, R. G., Jenkin, M. E., Rossi, M. J., Troe, J., and IUPAC Subcommittee: Evaluated kinetic and photochemical data for atmospheric chemistry: Volume II – gas phase reactions of organic species, Atmos. Chem. Phys., 6, 3625–4055, https://doi.org/10.5194/acp-6-3625-2006, 2006.
Ballesteros, B., Jiménez, E., Moreno, A., Soto, A., Antiñolo, M., and Albaladejo, J.: Atmospheric fate of hydrofluoroolefins, CxF2x+1CH=CH2 ( and 6): Kinetics with Cl atoms and products, Chemosphere, 167, 330–343, https://doi.org/10.1016/j.chemosphere.2016.09.156, 2017.
Blázquez, S., González, D., Neeman, E. M., Ballesteros, B., Agúndez, M., Canosa, A., Albaladejo, J., Cernicharo, J., and Jiménez, E.: Gas-phase kinetics of CH3CHO with OH radicals between 11.7 and 177.5 K, Phys. Chem. Chem. Phys., 22, 20562–20572, https://doi.org/10.1039/D0CP03203D, 2020.
Ceacero-Vega, A. A., Ballesteros, B., Bejan, I., Barnes, I., Jiménez, E., and Albaladejo, J.: Kinetics and Mechanisms of the Tropospheric Reactions of Menthol, Borneol, Fenchol, Camphor, and Fenchone with Hydroxyl Radicals (OH) and Chlorine Atoms (Cl), J. Phys. Chem. A, 116, 4097–4107, https://doi.org/10.1021/jp212076g, 2012.
D'Anna, B., Andresen, Ø., Gefen, Z., and Nielsen, C. J.: Kinetic study of OH and NO3 radical reactions with 14 aliphatic aldehydes, Phys. Chem. Chem. Phys., 3, 3057–3063, https://doi.org/10.1039/B103623H, 2001.
Flaig, M., Qi, S., Wei, G., Yang, X., and Schieberle, P.: Characterization of the Key Odorants in a High-Grade Chinese Green Tea Beverage (Camellia sinensis; Jingshan cha) by Means of the Sensomics Approach and Elucidation of Odorant Changes in Tea Leaves Caused by the Tea Manufacturing Process, J. Agr. Food Chem., 68, 5168–5179, https://doi.org/10.1021/acs.jafc.0c01300, 2020.
Forberich, O., Pfeiffer, T., Spiekermann, M., Walter, J., Comes, F. J., Grigonis, R., Clemitshaw, K. C., and Burgess, R. A.: Measurement of the Diurnal Variation of the OH Radical Concentration and Analysis of the Data by Modelling, J. Atmos. Chemi., 33, 155–181, https://doi.org/10.1023/A:1005973130335, 1999.
Griesser, M., Weingart, G., Schoedl-Hummel, K., Neumann, N., Becker, M., Varmuza, K., Liebner, F., Schuhmacher, R., and Forneck, A.: Severe drought stress is affecting selected primary metabolites, polyphenols, and volatile metabolites in grapevine leaves (Vitis vinifera cv. Pinot noir), Plant Phys. Biochem., 88, 17–26, https://doi.org/10.1016/j.plaphy.2015.01.004, 2015.
Gruver, J. T. and Calvert, J. G.: The Vapor Phase Photolysis of 2-Methylbutanal at Wave Length 3130 Å.1, J. Am. Chem. Soc., 78, 5208–5213, https://doi.org/10.1021/ja01601a021, 1956.
Gueymard, C. A., Myers, D., and Emery, K.: Proposed reference irradiance spectra for solar energy systems testing, Solar Energ., 73, 443–467, https://doi.org/10.1016/S0038-092X(03)00005-7, 2002.
Jiménez, E., Lanza, B., Martínez, E., and Albaladejo, J.: Daytime tropospheric loss of hexanal and trans-2-hexenal: OH kinetics and UV photolysis, Atmos. Chem. Phys., 7, 1565–1574, https://doi.org/10.5194/acp-7-1565-2007, 2007.
Kolar, P. and Kastner, J. R.: Low-temperature catalytic oxidation of aldehyde mixtures using wood fly ash: Kinetics, mechanism, and effect of ozone, Chemosphere, 78, 1110–1115, https://doi.org/10.1016/j.chemosphere.2009.12.033, 2010.
Krol, M., van Leeuwen, P. J., and Lelieveld, J.: Global OH trend inferred from methylchloroform measurements, J. Geophys. Res.-Atmos., 103, 10697–10711, https://doi.org/10.1029/98JD00459, 1998.
Madronich, S. and Flocke, S.: The Role of Solar Radiation in Atmospheric Chemistry, in: Environmental Photochemistry, edited by: Boule, P., Springer Berlin Heidelberg, Berlin, Heidelberg, 1–26, https://doi.org/10.1007/978-3-540-69044-3_1, 1999.
Martínez, E., Albaladejo, J., Jiménez, E., Notario, A., and Aranda, A.: Kinetics of the reaction of CH3S with NO2 as a function of temperature, Chem. Phys. Lett., 308, 37–44, https://doi.org/10.1016/S0009-2614(99)00579-5, 1999.
Millet, D. B., Guenther, A., Siegel, D. A., Nelson, N. B., Singh, H. B., de Gouw, J. A., Warneke, C., Williams, J., Eerdekens, G., Sinha, V., Karl, T., Flocke, F., Apel, E., Riemer, D. D., Palmer, P. I., and Barkley, M.: Global atmospheric budget of acetaldehyde: 3-D model analysis and constraints from in-situ and satellite observations, Atmos. Chem. Phys., 10, 3405–3425, https://doi.org/10.5194/acp-10-3405-2010, 2010.
Orlando, J. J., Tyndall, G. S., Apel, E. C., Riemer, D. D., and Paulson, S. E.: Rate coefficients and mechanisms of the reaction of cl-atoms with a series of unsaturated hydrocarbons under atmospheric conditions, Int. J. Chem. Kinet., 35, 334–353, https://doi.org/10.1002/kin.10135, 2003.
Singh, H. B., Thakur, A. N., Chen, Y. E., and Kanakidou, M.: Tetrachloroethylene as an indicator of low Cl atom concentrations in the troposphere, Geophys. Res. Lett., 23, 1529–1532, https://doi.org/10.1029/96GL01368, 1996.
Spicer, C. W., Chapman, E. G., Finlayson-Pitts, B. J., Plastridge, R. A., Hubbe, J. M., Fast, J. D., and Berkowitz, C. M.: Unexpectedly high concentrations of molecular chlorine in coastal air, Nature, 394, 353–356, https://doi.org/10.1038/28584, 1998.
Urbanski, S. P., Hao, W. M., and Baker, S.: Chapter 4 Chemical Composition of Wildland Fire Emissions, in: Developments in Environmental Science, edited by: Bytnerowicz, A., Arbaugh, M. J., Riebau, A. R., and Andersen, C., Elsevier, 8, 79–107, https://doi.org/10.1016/S1474-8177(08)00004-1, 2008.
Utrilla-Vázquez, M., Rodríguez-Campos, J., Avendaño-Arazate, C. H., Gschaedler, A., and Lugo-Cervantes, E.: Analysis of volatile compounds of five varieties of Maya cocoa during fermentation and drying processes by Venn diagram and PCA, Food Res. Int., 129, 108834, https://doi.org/10.1016/j.foodres.2019.108834, 2020.
Wallington, T. J., Ball, J. C., Straccia, A. M., Hurley, M. D., Kaiser, E. W., Dill, M., Schneider, W. F., and Bilde, M.: Kinetics and mechanism of the reaction of Cl atoms with CH2 CO (Ketene), Int. J. Chem. Kinet., 28, 627–635, 1996.
Wenger, J. C.: Chamber Studies on the Photolysis of Aldehydes Environmental, Dordrecht, 111–119, https://doi.org/10.1007/1-4020-4232-9_8, 2006.
The requested paper has a corresponding corrigendum published. Please read the corrigendum first before downloading the article.
- Article
(951 KB) - Full-text XML
- Corrigendum
-
Supplement
(1356 KB) - BibTeX
- EndNote