the Creative Commons Attribution 4.0 License.
the Creative Commons Attribution 4.0 License.
 | 22 Feb 2022
Investigating the impact of Saharan dust aerosols on analyses and forecasts of African easterly waves by constraining aerosol effects in radiance data assimilation
Dustin Francis Phillip Grogan
Cheng-Hsuan Lu
Shih-Wei Wei
Sheng-Po Chen
This study incorporates aerosol effects into satellite radiance calculations within the Global Data Assimilation System (GDAS) to investigate its impact on the analyses and forecasts of African easterly waves (AEWs). Analysis fields from the aerosol-aware assimilation experiment were compared to an aerosol-blind control during August 2017. The results showed that the aerosol-aware assimilation warmed the Saharan boundary layer, accelerated the African easterly jet, and modified the time-averaged AEWs by enhancing the northern track and reducing the southern track. The changes to the tracks are qualitatively consistent with arguments of baroclinic and barotropic instability. During the time period, we also examined two AEWs that developed hurricanes Gert and Harvey over the Atlantic but were structurally different over Africa; the AEW for Gert consisted of a southern vortex, while the AEW for Harvey consisted of a northern and southern vortex. Analysis differences of the cases showed stronger vorticity changes for the AEW that developed Harvey, which we attribute to the aerosol-aware assimilation capturing the radiative effects of a large-scale Saharan dust plume interacting with the northern vortex of the wave. Subsequent forecasts for the AEW cases using the Global Forecast System (GFS, v14) showed that the aerosol-aware assimilation reduced errors in the downstream vorticity structure for the AEW that developed Harvey; neutral improvement was found for the AEW that developed Gert. Thus, aerosol-affected radiances in the assimilation system have the ability to account for dust radiative effects on the analyzed AEWs, which, in turn, can improve the forecasting of AEWs downstream.
- Article
(3609 KB) - Full-text XML
- BibTeX
- EndNote


In regions around the world, aerosols can have a profound impact on weather. This is especially the case over North Africa as it houses the Sahara desert, which is the largest emitter of mineral dust aerosols, and African easterly waves (AEWs), which bring crucial rainfall to populations in the Sahel.
AEWs are the dominant synoptic-scale disturbance over North Africa from March to October (Carlson, 1969; Burpee, 1972). The waves develop along the African easterly jet (AEJ), which is a tropospheric jet (∼ 650 hPa) whose axis is centered in the Sahel (∼ 15∘ N). The AEWs are also maintained by the AEJ through barotropic and baroclinic energy conversions (Norquist et al., 1977). Consequently, the AEWs can have two cyclonic circulations (vortices) that reside on either side of the AEJ axis (Reed et al., 1988; Pytharilous and Thorncroft, 1999). The vortex south of the AEJ peaks at ∼ 650 hPa and is frequently coupled to moist convection (Kiladis et al., 2006; Berry and Thorncroft, 2005), while the northern vortex peaks at ∼ 850 hPa, is dry, and can be immersed in Saharan dust (Knippertz and Todd, 2010; Grogan and Thorncroft, 2019). Over the eastern Atlantic, the two vortices often merge into a single vortex, which can produce a favorable environment for tropical cyclogenesis (Schwendike and Jones, 2010; Ross and Krishnamurti, 2007).
During summer, Saharan dust emissions are most active over the western Sahel (16–24∘ N, 0–15∘ W; Cowie et al., 2014), which is the same region where the AEW northern track resides. The emissions are driven by enhanced surface winds that blow over dry and erodible regions (Tegan and Fun, 1994; Webb and Strong, 2011). Once lifted, the dust mixes within the deep Saharan boundary layer (Cuesta et al., 2009; Knippertz and Todd, 2012) and can form plumes that span thousands of kilometers. The transport of these large-scale dust plumes has been connected to African easterly waves (Westphal et al., 1988; Jones et al., 2003; Knippertz and Todd, 2010; Nathan et al., 2019; Grogan and Thorncroft, 2019; Grogan and Nathan, 2021). The dust can also be carried westward over the Atlantic within the Saharan air layer (SAL; Karyampudi et al., 1999; Chen et al., 2010), which is an elevated layer of dry air that originates from the Saharan boundary layer.
Dust directly affects the scattering and absorption of incoming and outgoing radiation of the atmosphere, which produces heating rates that can influence AEWs through two distinct pathways (Bercos-Hickey et al., 2017). The first pathway is through the background (time-averaged) dust fields which produce heating rates that modify the background temperature and wind fields (i.e., the AEJ), which, in turn, affects the AEW structure and development (Jones et al., 2004; Wilcox et al., 2010; Jury and Santiago, 2010). The second pathway is through the formation of large-scale episodic dust plumes, which produces heating rates that correlate with the wind and temperature of the AEW to directly affect its growth rates, phase speeds, energetics, and spatial structures (Grogan et al., 2016, 2017, 2019; Nathan et al., 2017).
To incorporate the abovementioned dust radiative effects on AEWs within a numerical weather prediction (NWP) system, it is important to represent the episodic nature of the aerosols. These radiative effects have been included into NWP systems through the following two approaches: (i) radiatively coupling aerosols in the forecast model and (ii) incorporating aerosols in satellite radiance calculations during data assimilation (DA).
For the first approach, aerosol attenuation modifies the heating rates within the radiation schemes of the forecast model of the NWP system. Studies have shown that this improves the forecast skill of several features in dust-affected regions over North Africa and the eastern Atlantic, including sea level pressure and atmospheric temperature (Perez et al., 2006; Mulcahy et al., 2014), AEWs linked to tropical cyclogenesis (Reale et al., 2009, 2011; Chen et al., 2015), and the AEJ (Reale et al., 2014). Major efforts are also ongoing to improve aerosol prediction models, including the particle emission and removal processes, assimilating observations such as aerosol optical depth (AOD), and model verification and evaluation (see Benedetti et al., 2018, for a comprehensive discussion). Such advances in aerosol prediction models can, in turn, improve weather prediction. But, despite these advances, the radiative coupling of episodic aerosols in the NWP system is often not feasible in an operational setting due to the computational costs. Thus, most operational NWP systems use prescribed aerosol climatologies, such as the National Centers for Environmental Prediction (NCEP) operational Global Forecast System (GFS; Hou et al., 2002) and the ECMWF integrated forecast system (IFS; Bozzo et al., 2017). Consequently, the NWP system sacrifices the ability to represent episodic aerosol signals.
For the second approach, aerosol transmittance effects are considered during radiance DA, which modifies the analysis fields of the NWP system. Kim et al. (2018) demonstrated this approach by including 3 h aerosol fields from the Goddard Chemistry Aerosol Radiation and Transport (GOCART) model into the radiance calculations within the Goddard Earth Observing System Atmospheric Data Assimilation System (GEOS ADAS). Kim et al. (2018) showed that, when aerosols were considered, they found the fit to observations improved for satellite infrared (IR) sounders due to accounting for the aerosol transmittance effects in the form of cooling brightness temperatures (BTs), which has been observed in previous studies (e.g., Sokolik, 2002). As a result, the cooling of BTs led to warmer analyzed surface temperatures in the tropical Atlantic. Similarly, Wei et al. (2020, 2021) showed that, when including aerosols from the NOAA Environmental Modeling System (NEMS) GFS Aerosol Component (NGAC) into NCEP's Global Data Assimilation System (GDAS), the aerosol transmittance effects warmed analyzed sea surface temperatures and low-level air temperatures over the Atlantic and Africa. Wei et al. (2020) also showed that the aerosols improved GFS forecasts of vector winds and geopotential heights at multiple levels in the tropical region.
Incorporating aerosol transmittance effects into the radiance calculation of DA is excluded from all NWP centers, despite its relatively low computation costs and its potential to leverage aerosol-affected radiances in a physical and consistent way. But more studies investigating this approach are needed. For example, no study has used this approach to examine the impacts of dust radiative effects on AEWs in the NWP system. Motivated by the results in Kim et al. (2018) and Wei et al. (2020, 2021), along with the physical understanding of the dust radiative effects on AEWs identified above, this study seeks to examine how, and to what extent, episodic aerosols in the satellite radiance calculations can affect analyses and forecasts of AEWs over North Africa and the eastern Atlantic. We focus our study on two AEWs during August 2017 that are structurally different over North Africa but later developed hurricanes over the Atlantic.
In Sect. 2, we describe the model experiments and the methods used to track the AEWs. Section 3 presents the analyses and forecasts from each experiment and examines the aerosol-aware experiment in the context of dust radiative effects on AEWs. Section 4 provides conclusions and a short discussion.
2.1 Model experiments
The schematic in Fig. 1 illustrates the workflow of the experiments in this study, which were conducted from 25 July to 28 August 2017. The first experiment is an aerosol blind run (CTL), where aerosols are not considered in the assimilation system. The second experiment is an aerosol-aware run (AER), which constrains aerosol transmittance effects into the radiance calculations of the assimilation system (i.e., aerosol-affected radiances). For our experiments, we employ version 14 of the National Centers for Environmental Prediction (NCEP) Global Forecast System (GFS, v14), which consists of an analysis system, the Global Data Assimilation System (GDAS), and a forecast model, the Global Spectral Model (GSM), with GFS physics. The experiments are fully cycled, which means that each analysis is constructed from their respective forecasts of the prior cycle.
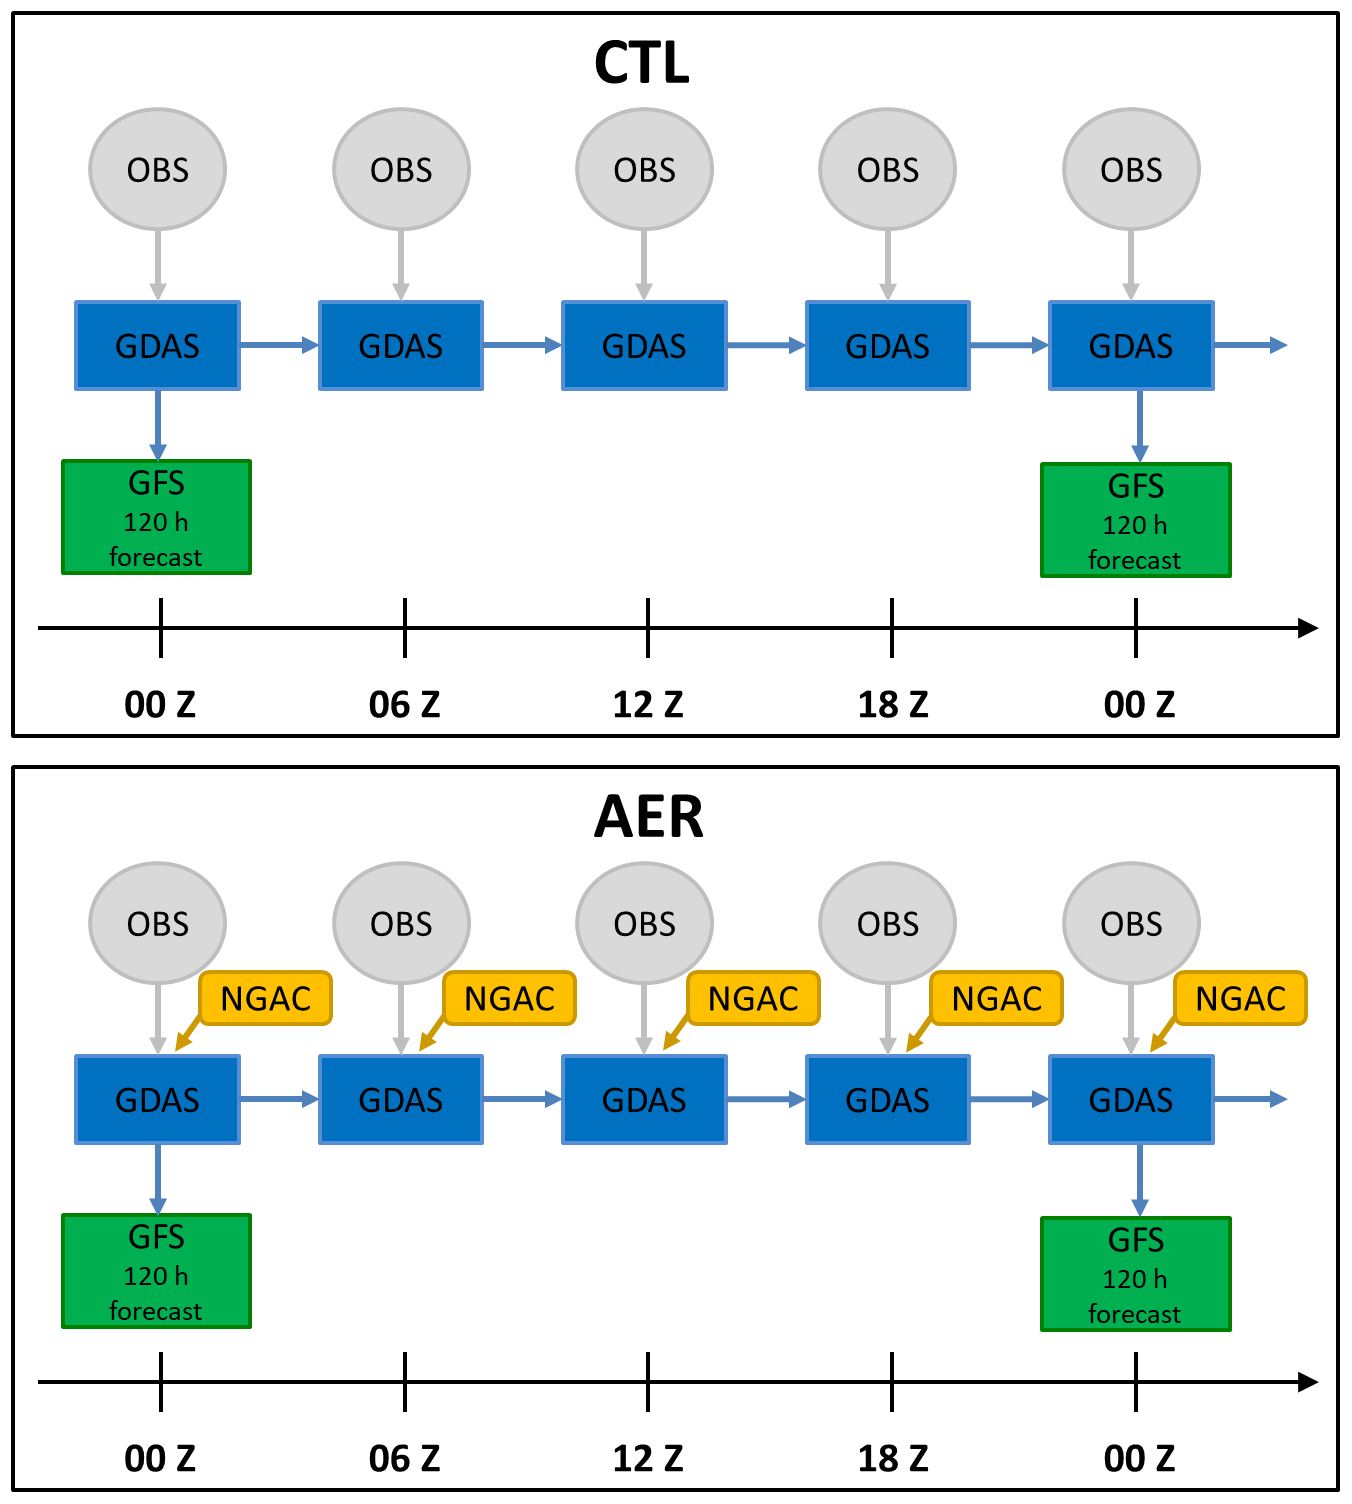
Figure 1Schematic flowchart of the aerosol-blind (CTL) and aerosol-aware (AER) experiments in this study. See Sect. 2.1 for details.
The analyses are constructed using GDAS (Fig. 1; blue), which is a Gridpoint Statistical Interpolation (GSI)-based, four-dimensional, ensemble-variational (4DEnVar) assimilation system. The assimilation system is run for 80 ensemble members at T254 (∼ 80 km) resolution. In GDAS, the radiance calculations are conducted by the Community Radiance Transfer Model (CRTM; Lu et al., 2021). The CRTM generates simulated brightness temperatures (BTs) and computes the radiance sensitivities with respect to the state variables (Han et al., 2006).
For both experiments, various observations are ingested into GDAS, including the conventional dataset (radiosondes, ships, buoys, etc.) and satellite observations (e.g., retrievals and radiances; Fig. 1; gray). For the radiance observations, we include the level 1 product of IR and microwave sensors, which are pre-processed by NOAA's National Environmental Satellite, Data, and Information Service (NESDIS). For a complete list of the thermal IR sensors, see Table 1 in Wei et al. (2021).
For AER, aerosol transmittance effects can be constrained in CRTM by ingesting three-dimensional aerosol mixing ratios into GDAS. CRTM contains look-up tables for aerosol optical properties – absorption coefficient, single scattering albedo, and asymmetric factor – to compute the aerosol-affected radiances (Lu et al., 2021). The optical properties are based on the Optical Properties of Aerosols and Clouds (OPAC) software package (Hess et al., 1998).
The aerosol mixing ratios are provided by the NEMS GFS Aerosol Component (NGAC) model (v2; Fig. 1; gold), which is based on GOCART (Colarco et al., 2010). NGAC simulates the emission, mixing, transport, and removal (wet and dry) for 15 externally mixed aerosols, including dust, sea salt, sulfate, organic carbon, and black carbon (Lu et al., 2016; Wang et al., 2018). The NGAC forecasts are used to predict the aerosol mixing ratios during the analysis window of each cycle. Like the meteorological fields, the aerosol mixing ratios are interpolated to the observations in space and time using the first guess at appropriate time (FGAT) method (Lorenc and Rawlins, 2005). Figure 2 shows the NGAC forecasts' total AOD (all aerosols at 550 nm) averaged over 1–28 August 2017. The AOD peaks over the western Sahara, near the coast of West Africa, and in the Bodélé Depression, within the interior of the continent, which are consistent with source regions over summertime in North Africa (Engelstader and Washington, 2007). The AOD, however, overestimates the hot spots by ∼ 25 % when compared to the summer AOD climatology from the Modern-Era Retrospective analysis for Research and Applications (MERRA, v2; Randles et al., 2016). Nonetheless, the use of NGAC does not affect our qualitative interpretation of the aerosol-affected radiances on the analyses and forecasts.
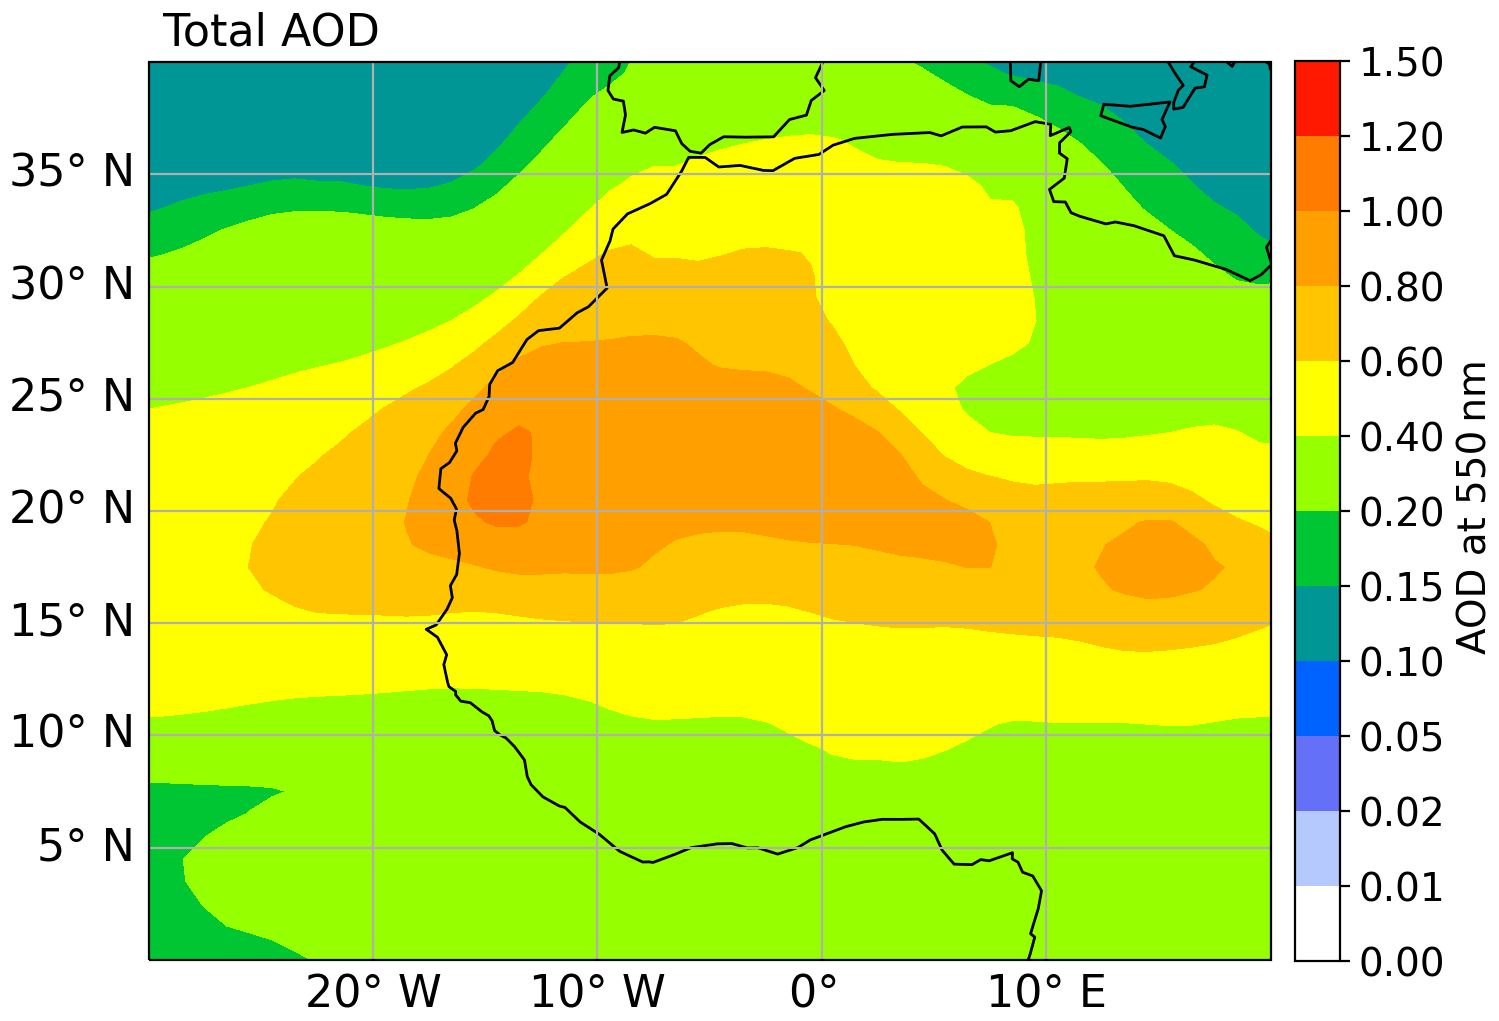
Figure 2Total aerosol optical depth (AOD), from the NGAC forecasts, averaged over 1–28 August 2017.
We also conducted short-range forecasts in each experiments' fully cycled system. To do this, the forecast model within GFS runs 120 h weather forecasts at T670 (∼ 30 km) resolution, which are initialized on 00:00 UTC of each day (Fig. 1; green). The forecast model does account for aerosol radiative effects using prescribed monthly aerosol climatologies from OPAC (Hess et al., 1998). But, for both experiments, we use the same configuration in the forecast model, which means that changes to the forecasts arise solely by the model's response to the analysis differences rather than the physics driving the forecast model.
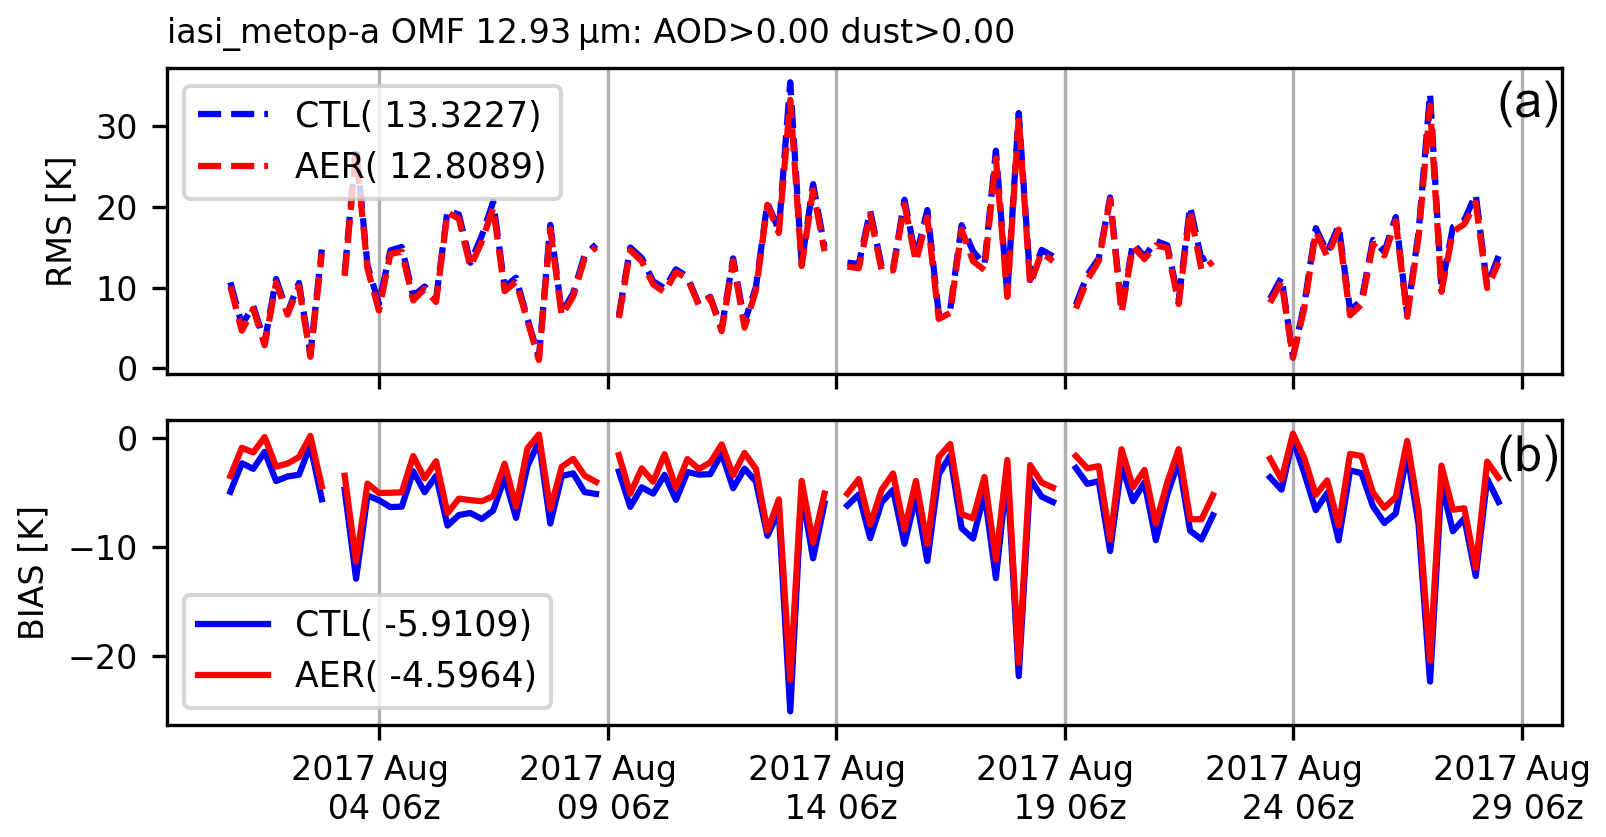
Figure 3Statistics for the observation-minus-forecast (OMF) infrared brightness temperatures (IR BTs; 12.93 µm) from the Infrared Atmospheric Sounding Interferometer (IASI) hyperspectral sensor from CTL (red) and AER (blue). The time series includes all observations over the region (0–40∘ N, 20∘ E–30∘ W), irrespective of the aerosol loading. The numbers in the legend are the mean values for the (a) RMS (root mean square) and (b) bias for each experiment.
To demonstrate the aerosol impact on the IR radiances, Fig. 3 shows a time series of each experiment's observation-minus-forecast (OMF) BT for an IR channel (12.93 µm) from the Infrared Atmospheric Sounding Interferometer (IASI); the channel and sensor are representative of other IR window channels and thermal IR sensors, respectively. For both experiments, Fig. 3 shows that the OMFs, which are averaged over North Africa and the East Atlantic, have a similar root mean square (RMS; Fig. 3a) and negative, or cold, bias (Fig. 3b) during the period of interest. But for the cold bias, the AER run (red) is slightly more positive than the CTL run (blue). This reduction in the cold bias for AER is due to the incorporation of aerosol transmittance effects on the forecast (simulated) BT (via scattering). The average impacts are small (∼ 1.7 K) over the region, but the bias differences can be substantial (up to ∼ 10 K) in localized regions during strong Saharan dust events (Sokolik, 2002). When the aerosol-affected OMFs are assimilated, this produces warmer analyzed temperatures at low levels in the atmosphere (Weaver et al., 2003; Kim et al., 2018; Wei et al., 2021).
2.2 Wave tracking
To identify the synoptic wave patterns during the period of interest, we used an objective tracking algorithm similar to that in Brammer and Thorncroft (2015). Briefly, the tracking algorithm involves analyzing mass-weighted centers of vorticity at multiple levels (i.e., curvature vorticity at 850, 700, and 500 hPa; relative vorticity at 850 and 700 hPa). The wave center is then determined from a weighted average of the centers within a specified radius (500 km). For each experiment, the wave centers were extracted using the 6 h analysis fields, which identified several systems that traversed North Africa and the eastern Atlantic. The tracking included waves that later developed hurricanes, which we focus on in this study, given their long lifetimes and downstream implications.

Figure 4Daily locations (at 00:00 UTC) of the AEWs corresponding to Gert (solid) and Harvey (dashed), as obtained by the tracking algorithm in the CTL run (time period in August 2017).
For the time period of interest, two hurricanes developed from AEWs, i.e., Gert and Harvey. Figure 4 shows the objective track locations for the AEWs that developed hurricanes Gert and Harvey in the CTL run over North Africa and the eastern Atlantic. For Gert (solid line), the storm originates over northeastern Africa, at 5–10∘ N, on 31 July, and moves northwestward over North Africa before reaching the eastern Atlantic on 4 August. In contrast, Harvey (dotted line) originates from two vortices over North Africa, at 25–29∘ N and 8–12∘ N, which develop on 8 August and merge into one vortex near the coast on 12 August; the storm then moves west/southwest over the eastern Atlantic. Both waves developed hurricanes while over the western portion of the Atlantic Ocean.
A comparison of the track locations for CTL and AER shows little difference in the storm positions during their evolution (not shown). After the initial development, the track locations among the two cases are less than 250 km. Given the wavelength of the AEW span 2000–5000 km (Burpee, 1974), the aerosol-aware assimilation does not appear to have a significant influence on the wave tracks. Therefore, we use track locations from CTL when investigating the storm structures in the analyses and forecasts for both cases.
3.1 Analysis differences: time-averaged fields
Before investigating the AEW cases shown in Fig. 4, we first examine the aerosol impacts on the time-averaged background temperature, background zonal wind, and AEW meridional wind variances.
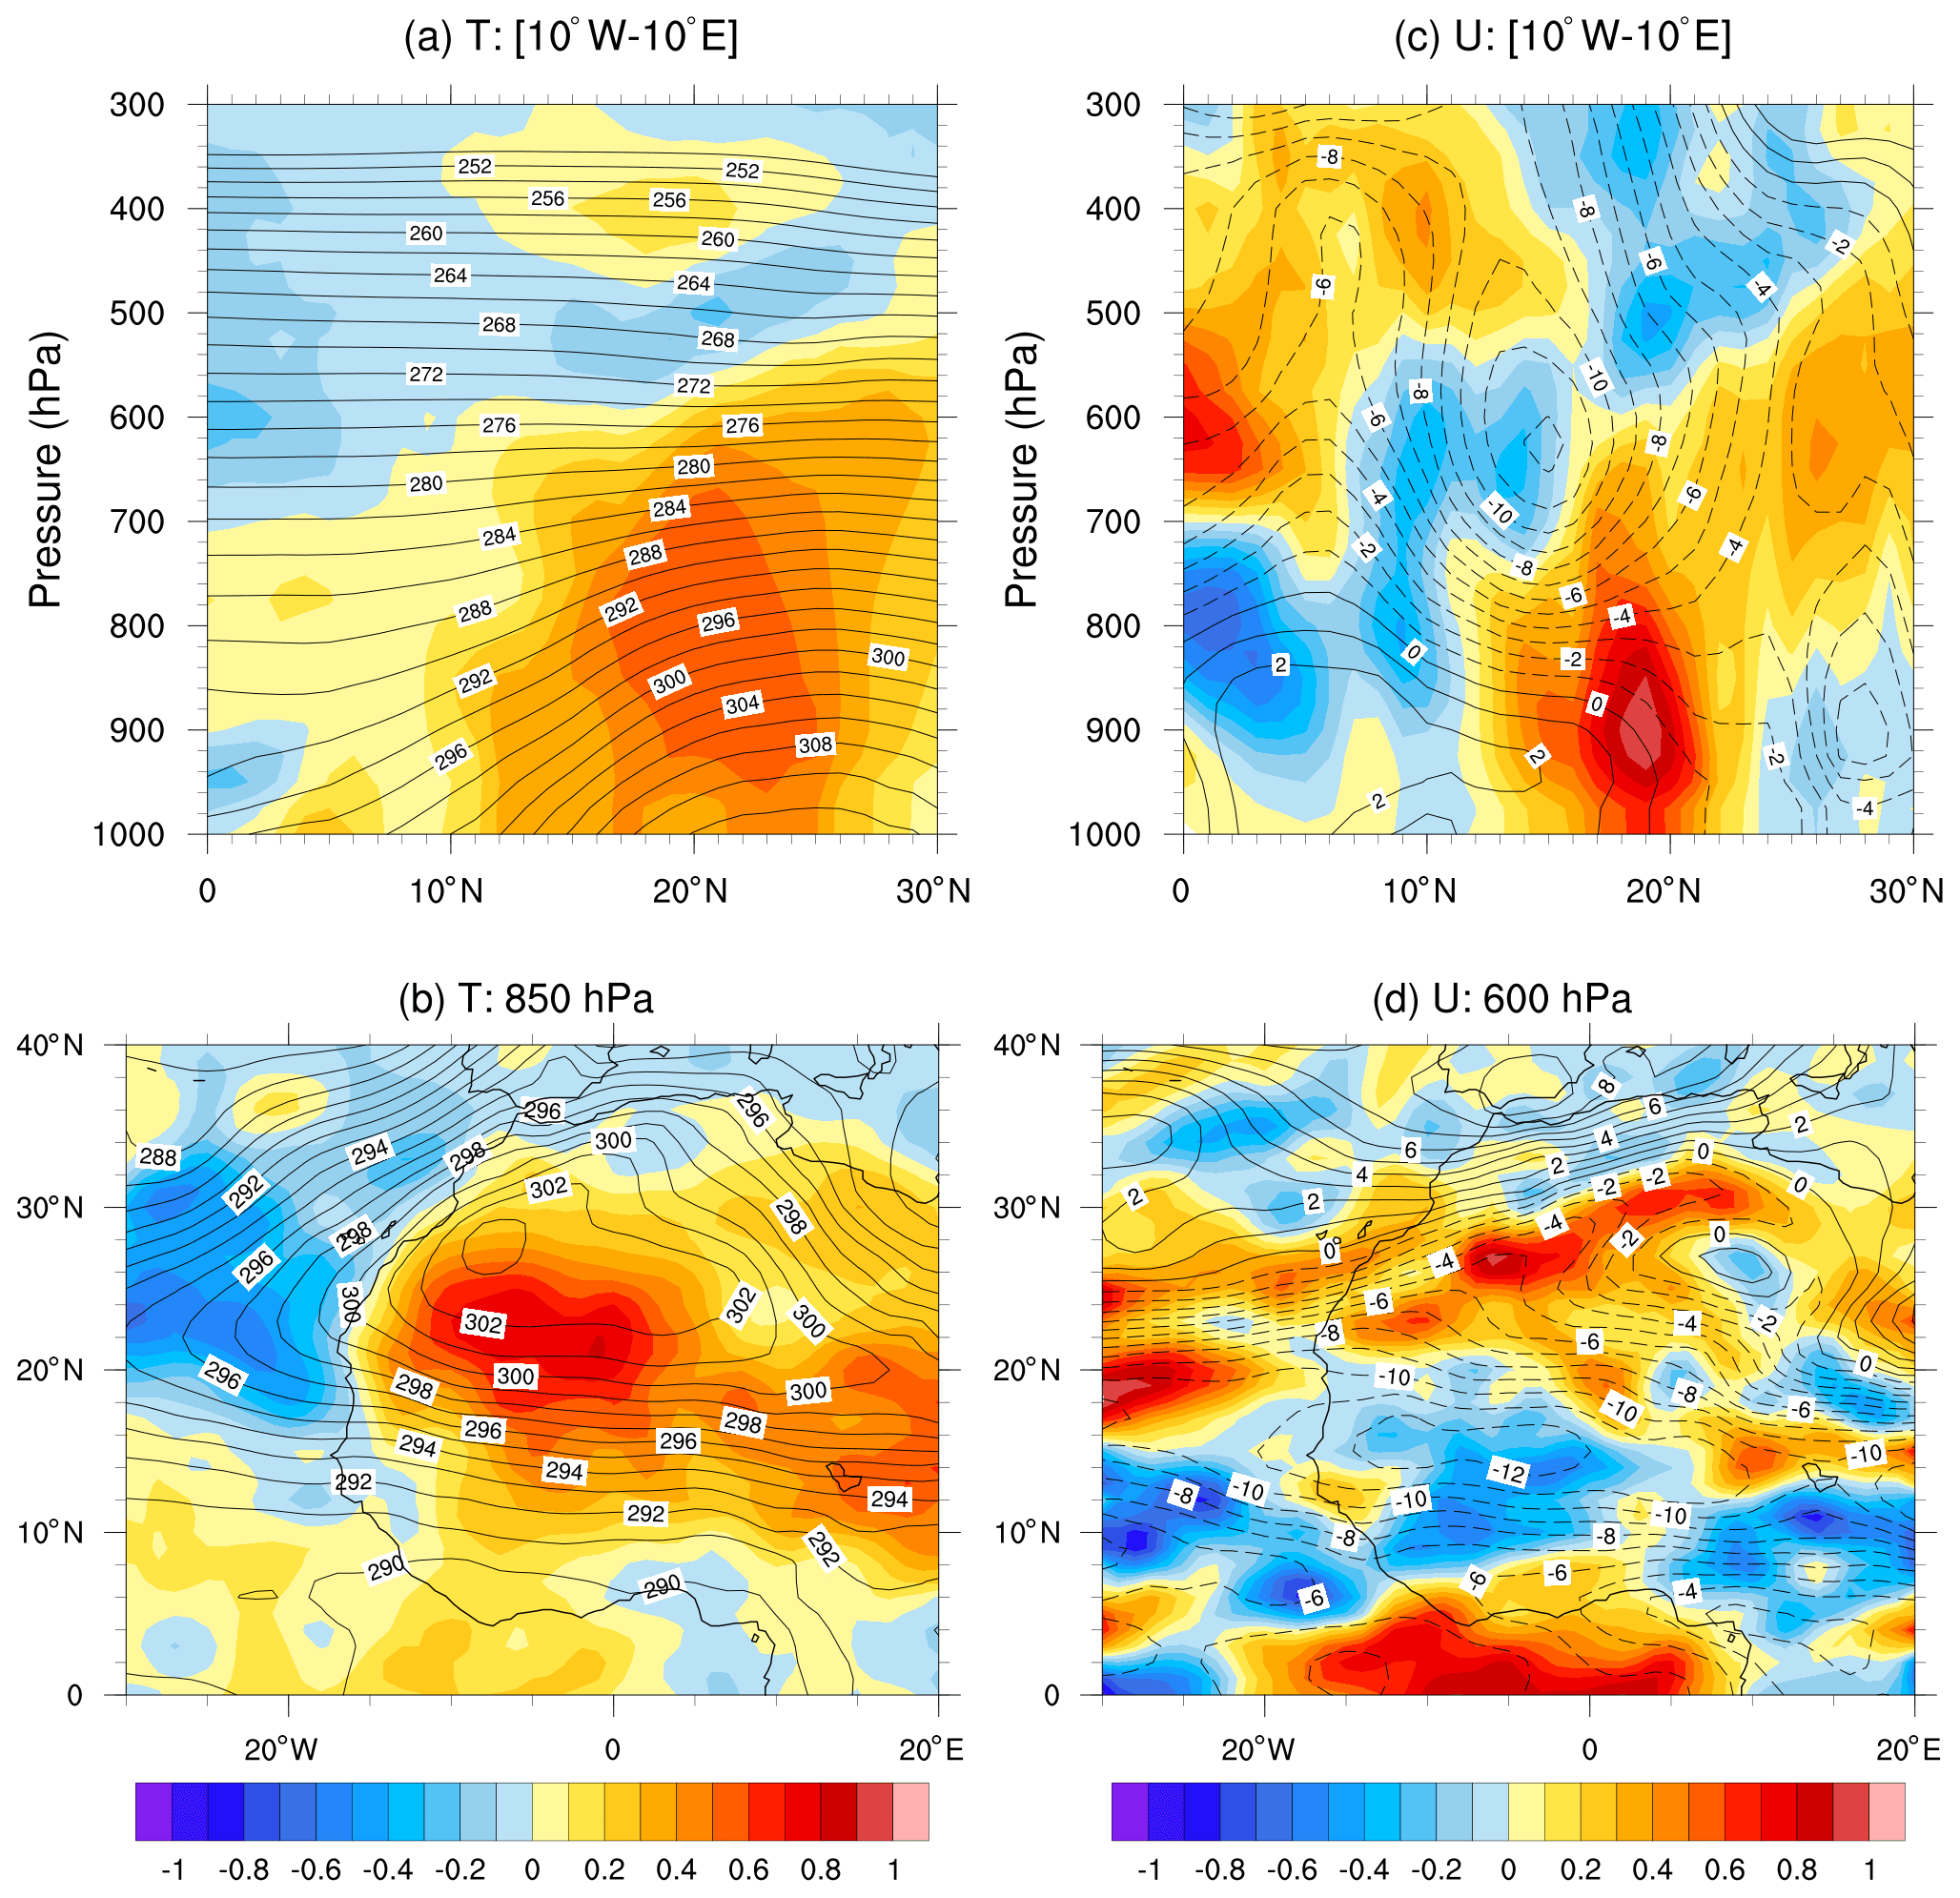
Figure 5Vertical and horizontal cross sections of the CTL analysis (contours) and the AER–CTL analysis difference (colors) for (a, b) temperature, T, and (c, d) zonal wind, U. The vertical sections (a, c) are zonally averaged from 10∘ W to 10∘ E, while horizontal sections (b, d) are taken at specified pressure levels. Contour/color units are in (a, b) kelvin (K) and (c, d) meters per second (m s−1). The fields are time averaged from 1–28 August 2017.
Figure 5 shows cross sections of the time-averaged background temperature and zonal wind for CTL (contours) and the AER–CTL difference (colors) averaged over 1–28 August 2017. Consider the CTL run first. The experiment captures the main summertime circulation features over the region. For temperatures, the warmest air is positioned near the surface over the Sahara desert (Fig. 5a; 20–30∘ N). This warming sets up a strong meridional temperature gradient that extends vertically up to ∼ 650 hPa and horizontally across the Sahel and over the eastern Atlantic (Fig. 5b; 30∘ W–20∘ E). For the zonal wind, there is a well-defined AEJ at 650 hPa (Fig. 5c; 15∘ N) that extends across North Africa and the eastern Atlantic (Fig. 5d; 20∘ W–15∘ E, 10–15∘ N) and low-level westerlies (800–1000 hPa) that are associated with the West African Monsoon (WAM) flow (Fig. 5c; 8–18∘ N).
The AER–CTL differences in Fig. 5 indicate how the aerosol-affected radiances impact the time-averaged background fields. For temperature, the aerosol impacts warm the boundary layer over the Sahara and Sahel by ∼ 0.5 K (reddish colors in Fig. 5a; 10–30∘ N, 1000–650 hPa) and cool the marine boundary layer below the SAL by ∼ 0.5 K (blueish colors in Fig. 5b; 15∘ N–25∘ W, 15–30∘ N). These temperature changes are qualitatively consistent with enhanced aerosol heating in the boundary layer over the continent and in the SAL offshore. Over land, the heating peaks at 800 hPa in the Sahel and the southern Sahara desert (Fig. 5a: 15–25∘ N). The location of the heating indicates that the aerosol-aware assimilation (i) increases lapse rates (or reduces static stability) below the peak heating (1000–800 hPa) in the Sahel and southern Sahara and (ii) enhances the meridional temperature gradient below the AEJ (1000–650 hPa) across the Sahel.
The AER–CTL differences in temperature support the changes to the background zonal wind via adjustments to the thermal wind. For example, along the enhanced meridional temperature gradient, AER accelerates the AEJ by ∼ 0.5 m s−1 (blueish colors in Fig. 5c at 10–15∘ N, 700–600 hPa; blueish colors in Fig. 5d at 20∘ E–30∘ W, 10–15∘ N) and accelerates the westerly flow of the WAM by about ∼ 1.0 m s−1 (reddish colors in Fig. 5c at 12–19∘ N, 1000–850 hPa). Away from these features, the structural changes to the zonal wind are more difficult to interpret. But an inspection of the shear difference plots show that the aerosol-aware assimilation (i) increases the vertical shear below the AEJ (15–22∘ N, 900–700 hPa) and (ii) decreases the horizontal shear on the flanks of the AEJ axis (8–18∘ N, 800–600 hPa; not shown).
Figure 6 shows a vertical cross section of the time-averaged, 2–6 d filtered meridional wind variances, which is a proxy used to assess AEW amplitudes (Reed et al., 1988; Pytharilous and Thorncroft, 1999). The filtered meridional wind variances capture the two AEW tracks over the interior of North Africa (contours show the CTL run). For both experiments, the wave structures peak at levels consistent with AEWs examined in previous studies (south at 8–13∘ N, 700–600 hPa; north at 18–22∘ N, 950–800 hPa). But the AER–CTL differences (colors) show that, for the AER run, the meridional wind variances increase by ∼ 15 % in the northern vortex and decrease by ∼ 10 % in the southern vortex. Note that the AER run also increases the wind variances near the AEJ core by ∼ 25 % (15∘ N, 600 hPa), but this increase does not change the peak location of the southern vortex.
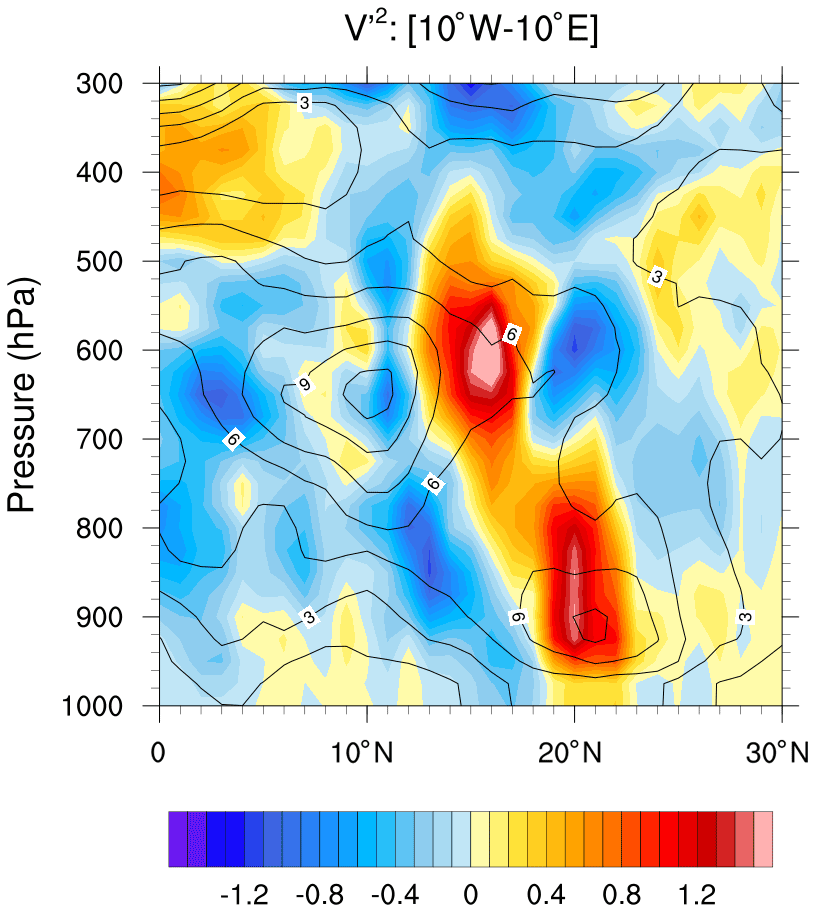
Figure 6Time averaged 2–6 d filtered meridional wind variances, v′2, of the CTL analysis (contours) and the AER–CTL analysis difference (colors) zonally averaged from 10∘ W–10∘ E for August 2017. Contour/color units are square meters per second m2 s−2.
The differences in the AEW meridional wind variances shown in Fig. 6 are, in part, due to changes to the background fields, which can be explained by the local wave energetics (Norquist et al., 1977; Hseih and Cook, 2005; Bercos-Hickey et al., 2020). In absence of diabatic processes, the AEW's southern structure extracts energy from the background via barotropic conversions, which are proportional to the horizontal shear of the AEJ, while the northern structure extracts energy via baroclinic energy conversions, which are inversely proportional to the static stability (Thorncroft and Hoskins, 1994; Paradis et al., 1995; Thorncroft, 1995). This means that, for AER, the changes to the background zonal wind and temperature (i) reduce wind variances in the southern vortex via decreased horizontal shear on the equatorward side of the AEJ (barotropic) and (ii) increase wind variances in the northern vortex via reduced static stability below the AEJ (baroclinic).
The qualitative explanation of how aerosol-affected radiances impact the waves via the background fields aligns with the first of two pathways in which dust can affect AEWs mentioned in the introduction. That is, the aerosol-aware assimilation captures dust radiative effects that operate on the analyzed background temperature, AEJ, and, thus, the AEW wind variances. But it is worth mentioning that dust radiative effects are also coupled to the forecast model (i.e., from the OPAC aerosol climatology) which operates on the analysis fields via the first-guess meteorological fields. Thus, in AER, changes to the time-averaged fields in Figs. 5 and 6 are due to the NGAC aerosols in the assimilation system modifying existing radiative effects imposed by the OPAC aerosol climatology in the forecast model.
3.2 Analysis differences: AEW cases
In this subsection, we examine the impact of the aerosol-aware assimilation on the AEW analysis fields for our cases described in Sect. 2.2.
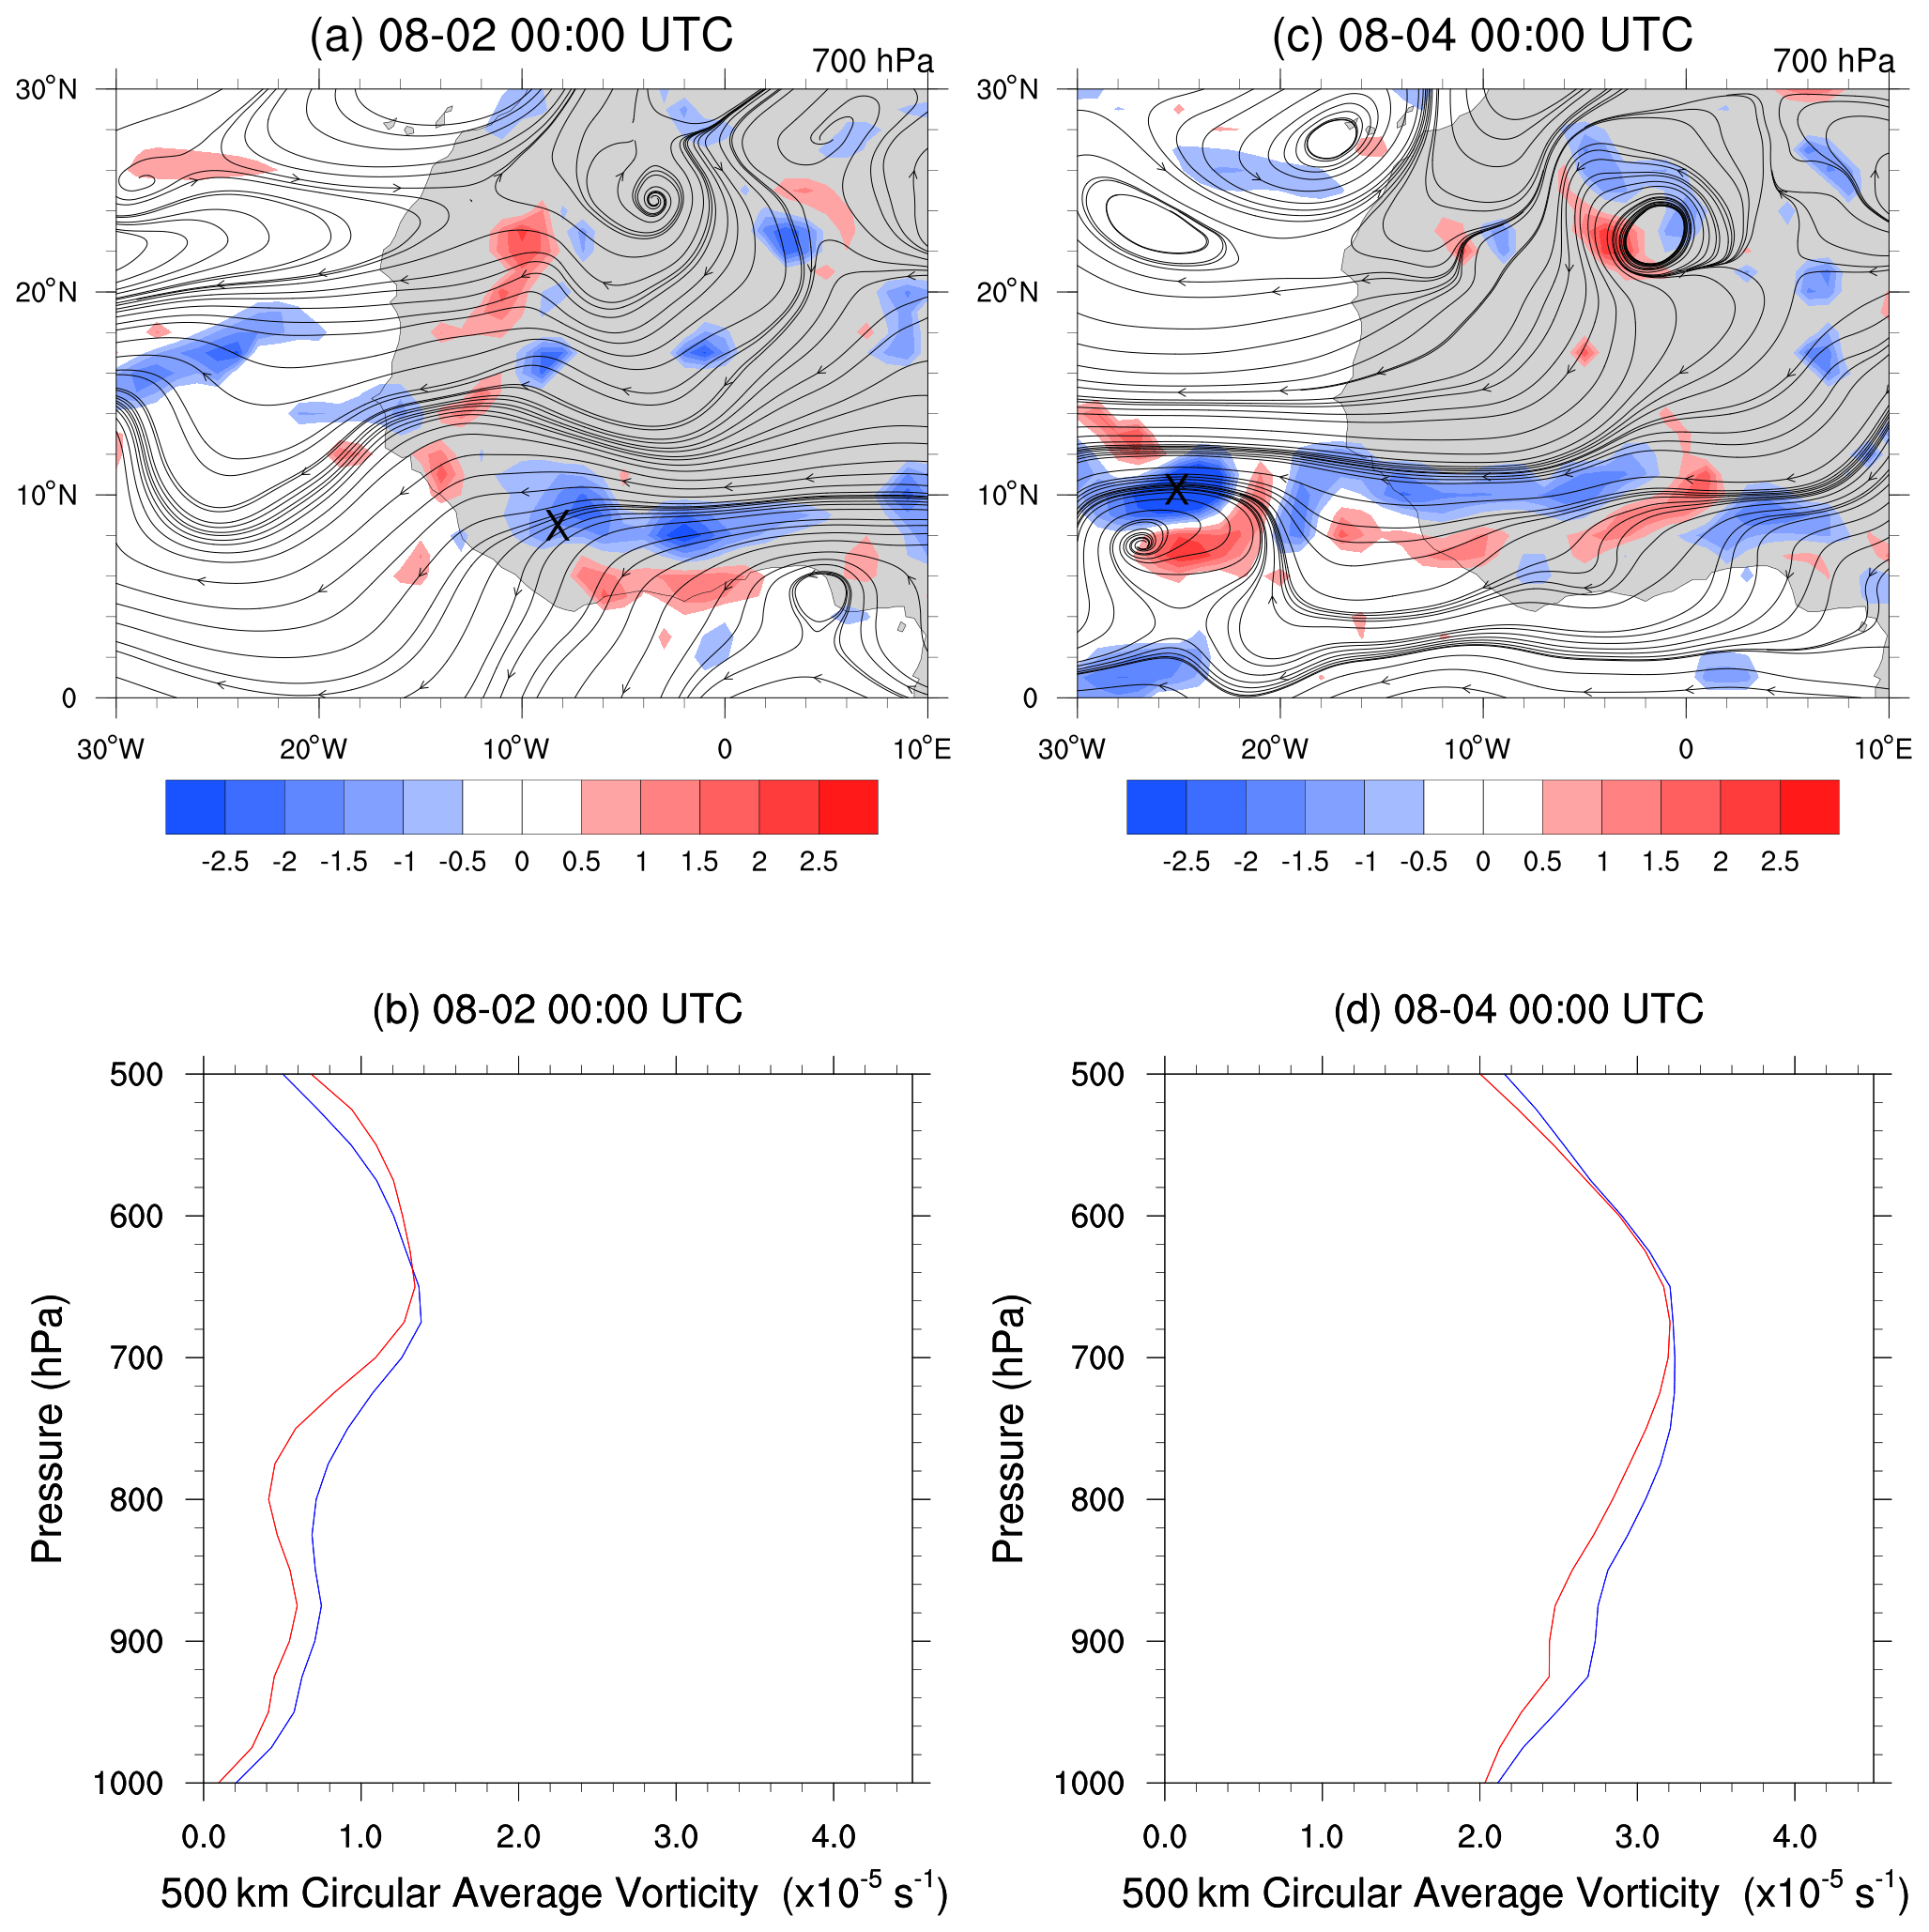
Figure 7The evolution of the AEW associated with Gert on 2 August (a, b) and 4 August (c, d) . The top panels (a, c) show the 700 hPa CTL streamlines (black) and the AER–CTL 700 hPa cyclonic vorticity differences (red/blue); the cross (X) marks the wave's location from the tracking algorithm. The bottom panels (b, d) show the circular average vorticity (radius 500 km) taken at the crosses (X) for CTL (blue) and AER (red). Note that, for the dates in the panel headings, the first digit corresponds to the month and the second digit to the day.
Figure 7 compares the structure of the AEW that developed Gert for CTL and AER. The AEW crosses Africa and the eastern Atlantic from 31 July to 4 August. During these times, the wave remains south of the AEJ and is, thus, largely away from the dust aerosols. But despite this separation, the aerosol-aware assimilation affects the evolution of the wave structure (Fig. 7a and c; colors surrounding the crosses). For example, on 2 August, the AER run decreases the wave, which, at this stage, is an open trough (Fig. 7a; blueish colors surrounding the cross). The vertical structure also shows that the cyclonic vorticity for AER (red) is ∼ 10 % less than for CTL (blue) from 600–800 hPa (Fig. 7b). On 4 August, the wave intensifies as it moves offshore, forming a closed streamline circulation (Fig. 7c). But, similar to the onshore wave, the aerosol impacts on the vertical structures continue to reduce the vorticity within the storm center by ∼ 10 % (Fig. 7d).

Figure 8As in Fig. 7 but for the evolution of the AEW associated with Harvey on 9 August (a, b) and 12 August(c, d). The horizontal panels (a, b) show 850 hPa CTL streamlines and 850 hPa AER–CTL cyclonic vorticity differences, instead of 700 hPa, to better capture the two-vortex signal. Over Africa (b), we overlaid the vertical vorticity structures of the northern (solid) and southern (dotted) vorticities for CTL (blue) and AER (red).
Figure 8 compares the structure of the AEW that developed Harvey for CTL and AER. The AEW develops as two vortices over East Africa on 8 August and travels westward. On 9 August, the land-based AEW is broad in structure and covers a large portion of the continent (Fig. 8a). For AER, there are strong changes within both vortex centers, which include increases in the vorticity around the northern vortex (reddish colors at 18∘ N) and decreases in the southern vortex (blueish colors at 14∘ N). The vertical structures show that vorticity for the northern vortex is, on average, ∼ 20–35 % larger from 600–850 hPa (Fig. 8b; cf. solid blue and solid red lines), while the southern vortex is ∼ 20–35 % smaller from 750–850 hPa (Fig. 8b; cf. dotted blue and dotted red lines). On 12 August, the two vortices merge into a single wave offshore. Compared to the land-based AEW, the amplitudes of the combined wave are weak, and its vertical structure changes little with height (Fig. 8c and d). Consequently, the aerosol impacts are reduced, affecting the vorticity by ∼ 5–15 % from 1000–500 hPa (Fig. 8d).
Over Africa, the aerosol impacts on the AEWs for Gert and Harvey were consistent with the time-averaged AEW meridional wind variances in Fig. 6, but the impacts were stronger for Harvey. The story is different offshore, as the impacts remain moderate for Gert but weaken for Harvey; the latter may be due to the merging of the vortices and the positioning of the aerosols. Therefore, we focus on the land-based stage of the AEWs and further investigate the aerosol impacts.
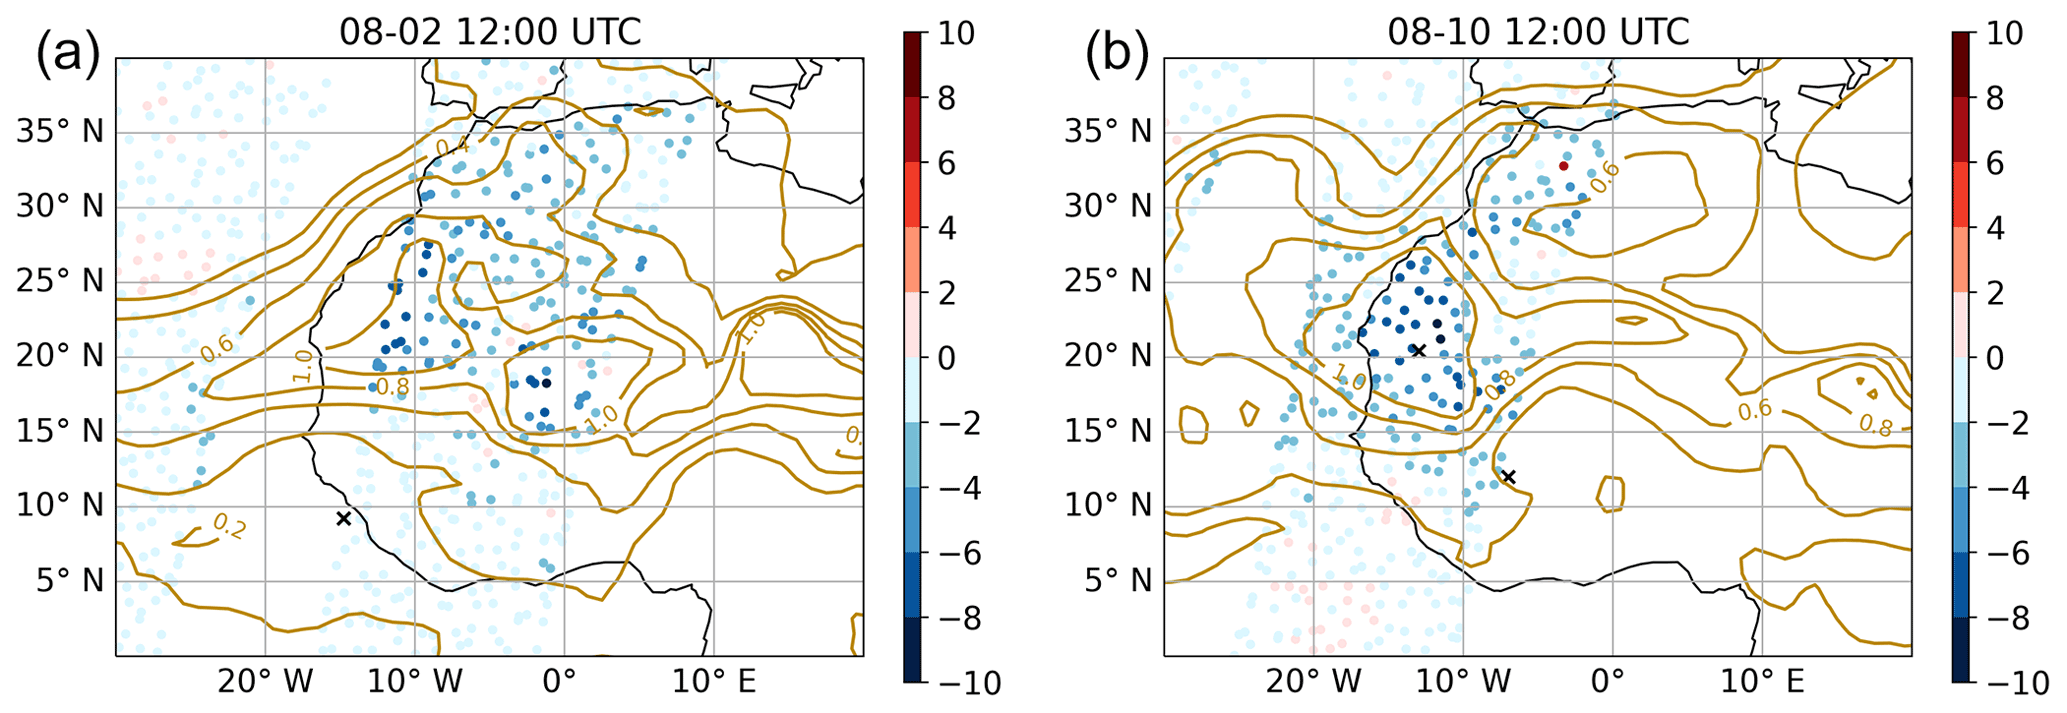
Figure 9AER–CTL differences in simulated BT at 12.93 µm from the IASI (colored circles) with the NGAC AOD (brown contours) on 2 August, 12:00 UTC (a), and 10 August, 12:00 UTC (b). The crosses (X) mark the location of the wave centers for the AEW that developed Gert (a; 8∘ N, 14∘ W) and Harvey (b; 12∘ N, 17∘ W and 20.5∘ N, 13∘ W). Color bar units are in kelvin (K).
To understand how the aerosol-aware assimilation impacts our AEW cases, it is informative to examine the episodic dust plumes and radiance observations. Figure 9 shows a snapshot of the NGAC AOD (brown contours) for times when the AEW for (Fig. 9a) Gert and (Fig. 9b) Harvey are over Africa; the crosses mark the position of the vortex centers. Overlying the AOD are observations from the IASI sensor at the same time, and the AER–CTL differences in the BT at 12.93 µm (circles) are shown, which is the same sensor and channel shown in Fig. 3. For Gert, the BT differences surrounding the wave are negative. This indicates that, near the wave center, the BTs are cooler in the AER run (Fig. 9a), but the values are small (light blue circles). In contrast, for Harvey, the negative values are largest near the northern vortex (dark blue circles), which is also immersed in a dust plume with AODs over 1.0 (Fig. 9b).
When aerosol-affected radiances are assimilated, warmer analyzed temperatures are typically produced at low levels over North Africa and the eastern Atlantic (Kim et al., 2018; Wei et al., 2021). For the AEW that developed Gert, the degree of warming over Africa is similar to the time-averaged AER–CTL background temperatures shown in Fig. 5a and b. But, for the AEW that developed Harvey in AER, the temperatures over the wave's northern vortex (18–22∘ N) warm as much as 1.5 K at mid-levels, 900–600 hPa, which is double the time average. The implications of this additional warming on the AEW vorticity is explained below.
Grogan and Thorncroft (2019) showed, through energetic arguments, that the heating from an episodic dust signal that interacts with the AEW's northern vortex generates eddy available potential energy (APE; ∼ T′2). Previous idealized studies have also shown that dust-induced eddy APE amplifies the northern structure of AEWs (Grogan et al., 2016, 2019; Nathan et al., 2017; Bercos-Hickey et al., 2017). For the Harvey case in the AER run, the scenario is the same as in Grogan and Thorncroft (2019), but the aerosol-affected radiances capture the heating from the dust plume rather than the forecast model, which, in turn, drives the amplified vorticity in the AEW's northern vortex.
The impact of the episodic dust plume on the northern vortex for the AEW that developed Harvey aligns with the second pathway in which dust can affect the AEWs mentioned in the introduction. Thus, the combined effects of both pathways may help to explain why the aerosol impacts for the AEW with Harvey are stronger than the AEW with Gert.
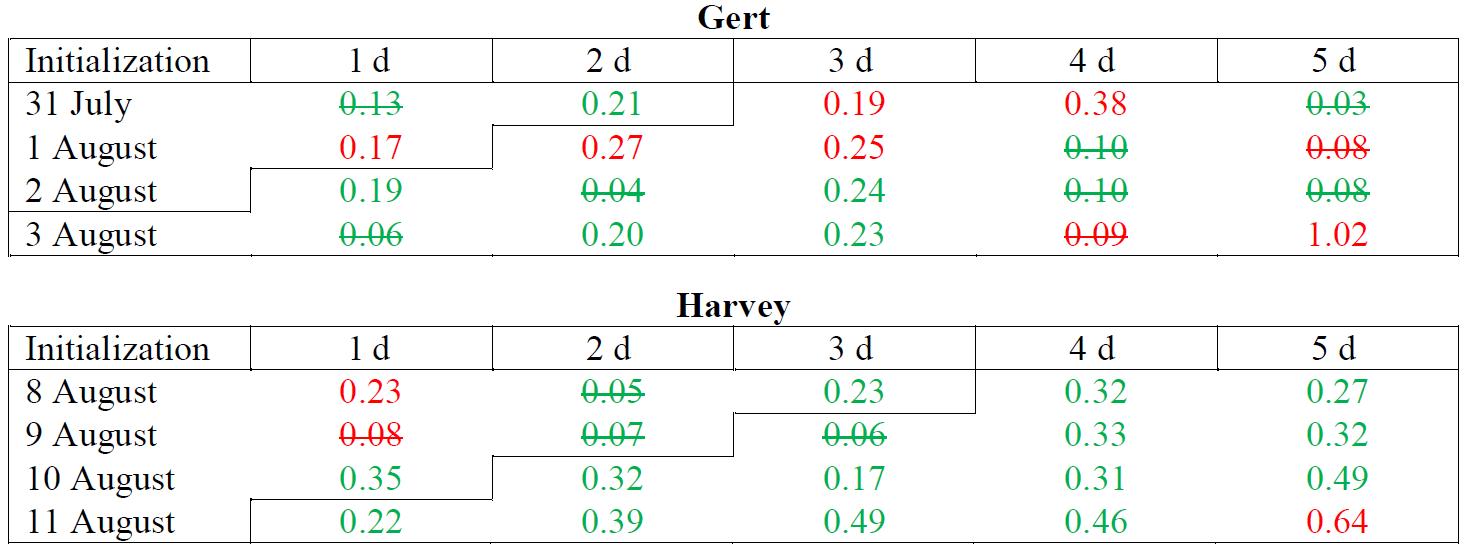
Table 1RMSE (root mean square error) relative differences in the 1000–500 hPa relative vorticity between the AER and CTL forecasts for the AEWs that developed Gert and Harvey. For each forecast day, the relative differences are calculated by taking (AER–CTL)/CTL of the RMSEs over the region following the AEWs (see the text for more details). The green values indicate the AER improved the forecast, while red values indicate the AER degraded the forecast; crossed-out values were not significant to the 99 % confidence interval. The staircase border in each case separates times when the waves are located onshore (upper left) and offshore (lower right).
3.3 Forecast differences: AEW cases
To examine the impact of the aerosol-aware assimilation on the forecasts for our AEW cases, we compare the root mean square error (RMSE) in vorticity for CTL and AER; the forecasts were verified against their respective analysis. Table 1 shows the RMSE relative differences between AER and CTL for the 1000–500 hPa vorticity following the AEWs. To compute the RMSE following the AEW at each forecast time, we use the CTL wave locations shown in Sect. 2. For Gert, a 10∘ latitude by 10∘ longitude window is centered on the wave. For Harvey, our window over North Africa has a fixed latitude of 5–25∘ N and a 15∘ longitude range that is centered on the two vortices; over the Atlantic Ocean, a 10∘ latitude by 10∘ longitude window is centered on the merged vortex.
Table 1 shows that the AER run produces neutral improvement in the forecasting of the AEW that developed Gert, as evidenced by the mixture of red and green values in the RMSE relative differences. An inspection of the forecasts shows that both AER and CTL underestimate the intensification of the AEW when initialized onshore, on 31 July–2 August, and overestimate the intensification when initialized offshore, on 3 August. As a result, there were several instances where the RMSE forecast differences did not produce statistically significant results (i.e., crossed out values for Gert in Table 1).
In contrast to the AEW that developed Gert, Table 1 shows that the AER run produces a statistically significant improvement in forecasting the AEW that developed Harvey. The largest improvements are found for the forecasts initialized on 10 and 11 August, with the forecast on 10 August showing reductions in RMSE for every forecast day (errors reduced by ∼ 15–49 %). For the initialized times that we examine for Harvey (8–11 August), both the analyzed amplitudes and AER–CTL vorticity differences were larger than Gert while onshore (cf. Figs. 7 and 8). An inspection of the forecasts reveals that the CTL run continues to suppress the wave amplitudes downstream, while the AER run better maintains the intensity of the wave as the two vortices merge over the eastern Atlantic and travel downstream.
In summary, the forecast error of the 1000–500 hPa averaged vorticity for the AEW that developed Gert are similar among the two experiments but dramatically reduced in AER for the AEW that developed Harvey. This marked improvement with Harvey is likely associated with the aerosol-aware assimilation capturing radiative effects of the large-scale Saharan dust plume that interacted with the AEWs northern vortex. Therefore, ingesting mixing ratios of episodic aerosols to constrain radiance calculations within the assimilation system can improve forecasting the evolution of AEWs.
In this study, we examined how incorporating time-varying aerosols into the assimilation of satellite radiances affected the analyses and forecasts from GFS v14 and the corresponding GDAS. In particular, we investigated the impacts of Saharan dust on AEWs and their environment over North Africa and the eastern Atlantic during August 2017. To do this, aerosol forecasts from the NGAC, v2, model were ingested into GDAS and constrained to the radiance calculations to produce analysis fields (aerosol aware) that were compared to a control experiment that excluded aerosols (aerosol blind). The analysis fields from both cases were then used to forecast two AEW cases during our time period that were structurally different over Africa but later developed hurricanes Gert and Harvey over the Atlantic Ocean.
The analysis differences showed that the aerosol-aware assimilation affected several fields over North Africa and the eastern Atlantic. For example, the aerosol-aware assimilation warmed the Saharan boundary layer, accelerated the AEJ and the westerlies associated with the WAM, and modified AEW meridional variances, with amplitudes increasing within the northern vortex and decreasing in the southern vortex. The changes in the AEW meridional variances were also consistent with the vorticity changes for the individual AEW cases examined.
The impact of the analysis differences on forecasting our AEW cases depended on the wave structure. For the AEW that developed Gert, which did not have a northern vortex, RMSE differences showed that the aerosol-aware experiment produced neutral improvement in the forecasts of the vorticity field tracking the wave over North Africa and the Atlantic. But, for the AEW that developed Harvey, which had a northern vortex, the aerosol-aware experiment improved the vorticity field in most forecasts. Moreover, the largest reductions in RMSE occurred when analysis differences in the AEW structures were largest.
In exploring the results, we showed qualitatively that the aerosol-aware experiment (via NGAC aerosols) captured the two pathways involving dust radiative effects on the AEWs, i.e., through dust-induced changes to the AEJ and background temperature fields (first pathway) and through the interaction between the episodic dust plumes and the waves (second pathway). For example, the aerosol-aware experiment modified the analyzed background temperature and AEJ, which, in turn, modified the analyzed time-averaged AEWs that are consistent with barotropic and baroclinic instability. Additionally, the aerosol-aware assimilation captured the enhanced warming and vorticity associated with the formation of an episodic dust plume interacting with the northern vortex of the AEW that developed Harvey. The aerosol impact on the AEW that developed Harvey is similar to dust-coupled AEWs shown in Grogan and Thorncroft (2019). In contrast, the impact is absent in the AEW the developed Gert because the wave neither had a northern vortex nor did it interact with a dust plume.
The improvement on forecasting the AEW that developed Harvey suggests the importance of the aerosol-aware assimilation in capturing dust radiative effects on AEWs involving episodic dust plumes. Although the AEW that developed Gert was influenced by the aerosol transmittance effects on the time-averaged background fields, this did not improve the forecasting of the storm. Therefore, investigating more cases that do and do not interact with episodic dust plumes would better determine the utility of our approach for forecasting AEWs. Moreover, there are known variabilities in AEW activity (Brammer and Thorncroft, 2017) and dust source regions over West Africa (Wagner et al., 2017), and therefore, different scenarios of the AEW-dust plume interaction should be examined. Nonetheless, forecast improvements, such as those shown for the AEW that developed Harvey, are encouraging and could be critical for determining the timing and location of tropical cyclogenesis that originate from developing AEWs.
Aerosol radiative effects can be incorporated into the NWP system through the forecast model and through the assimilation system. Though few studies focus on the assimilation approach, such as Kim et al. (2018) and Wei et al. (2021), this study has demonstrated the importance of incorporating time-varying, episodic aerosols into the satellite radiance calculations to capture dust radiative effects on the analyzed AEWs. More work, however, is needed to better understand how to optimize the aerosol-aware assimilation, such as adjusting the bias correction and quality control procedures (Wei et al., 2021). Moreover, future work should investigate how much complexity is needed to represent aerosol processes adequately and accurately and, thus, effectively account for aerosol effects within the NWP system.
Analyses and forecasts from the AER and CTL runs can be provided upon request to the first author of the paper.
DFPG and CHL developed the ideas for the study. SWW and SPC conducted the numerical experiments. DFPG, CHL, and SWW analyzed and interpreted the results. DFPG prepared the paper. DFPG, CHL, and SWW reviewed the paper.
The contact author has declared that neither they nor their co-authors have any competing interests.
Publisher's note: Copernicus Publications remains neutral with regard to jurisdictional claims in published maps and institutional affiliations.
The work presented here has been supported by NOAA NWS NGGPS R2O (grant no. NA15NWS468008). The NWS project is a collaborative effort from the University at Albany (Cheng-Hsuan Lu, Shih-Wei Wei, Sheng-Po Chen, and Dustin Grogan), NCEP/EMC (Robert Grumbine, Andrew Collard, Jun Wang, Partha Bhattacharjee, Bert Katz, and Xu Li), and NESDIS/STAR (Quanhua Liu and Zhu Tong). The GDAS experiments were conducted at the University of Wisconsin–Madison Space Science and Engineering Center's Satellite Simulations and Data Assimilation Studies computer, or S4, cluster.
This research has been supported by the National Oceanic and Atmospheric Administration (grant no. NA15NWS468008).
This paper was edited by Ralf Sussmann and reviewed by three anonymous referees.
Benedetti, A., Reid, J. S., Knippertz, P., Marsham, J. H., Di Giuseppe, F., Rémy, S., Basart, S., Boucher, O., Brooks, I. M., Menut, L., Mona, L., Laj, P., Pappalardo, G., Wiedensohler, A., Baklanov, A., Brooks, M., Colarco, P. R., Cuevas, E., da Silva, A., Escribano, J., Flemming, J., Huneeus, N., Jorba, O., Kazadzis, S., Kinne, S., Popp, T., Quinn, P. K., Sekiyama, T. T., Tanaka, T., and Terradellas, E.: Status and future of numerical atmospheric aerosol prediction with a focus on data requirements, Atmos. Chem. Phys., 18, 10615–10643, https://doi.org/10.5194/acp-18-10615-2018, 2018.
Bercos-Hickey, E., Nathan, T. R., and Chen, S.-H.: Saharan dust and the African easterly jet-African easterly wave system: structure, location and energetics, Q. J. Roy. Meteor. Soc., 143, 2797–2808, https://doi.org/10.1002/qj.3128, 2017.
Bercos-Hickey, E., Nathan, T. R., and Chen, S.-H.: On the Relationship between the African Easterly Jet, Saharan Mineral Dust Aerosols, and West African Precipitation, J. Climate, 143, 3533–3546, https://doi.org/10.1175/JCLI-D-18-0661.1, 2020.
Berry G. J. and Thorncroft C. D.: Case study of an intense African easterly wave, Mon. Weather Rev., 123, 752–766, https://doi.org/10.1175/MWR2884.1, 2005.
Bozzo, A., Remy, S., Benedetti, A., Fleming, J., Betchold, P., Rodwell, M. J., and Morcrette, J.-J.: Implementation of a CAMS-based aerosol climatology in the IFS, ECMWF Technical Memorandum, 801, ECMWF, https://www.ecmwf.int/en/elibrary/17771-radiation-numerical-weather-prediction (last access: 17 February 2022), 2017.
Brammer, A. and Thorncroft, C. D.: Variability and evolution of African easterly wave structures and their relationship with tropical cyclogenesis over the eastern Atlantic, Mon. Weather Rev., 143, 4975–4995, https://doi.org/10.1175/MWR-D-15-0106.1, 2015.
Brammar A. and Thorncroft, C. D.: Spatial and temporal variability of the three-dimensional flow around African easterly waves, Mon. Weather Rev., 145, 2879–2897, https://doi.org/10.1175/MWR-D-16-0454.1, 2017.
Burpee, R. W.: The origin and structure of easterly waves in the lower troposphere of North Africa, J. Atmos. Sci., 29, 77–90, https://doi.org/10.1175/1520-0469(1972)029<0077:TOASOE>2.0.CO;2, 1972.
Burpee, R. W.: Characteristics of North African Easterly Waves During the Summers of 1968 and 1969, J. Atmos. Sci., 31, 1556–1570, https://doi.org/10.1175/1520-0469(1974)031<1556:CONAEW>2.0.CO;2, 1974.
Carlson, T. N.: Some Remarks on African Disturbances and their Progress over the Tropical Atlantic, Mon. Weather Rev., 97, 716–726, https://doi.org/10.1175/1520-0493(1969)097<0716:SROADA>2.3.CO;2, 1969.
Chen, S.-H., Wang, S.-H., and Waylonis, M.: Modification of Saharan air layer and environmental shear over the eastern Atlantic Ocean by dust-radiation effects, J. Geophys. Res., 115, D21202, https://doi.org/10.1029/2010JD014158, 2010.
Chen, S.-H., Liu, Y.-C., Nathan, T. R., Davis, C., Torn, R., Sowa N., Cheng, C.-T., and Chen, J.-P.: Modeling the effects of dust-radiative forcing on the movement of Hurricane Helene (2006), Q. J. Roy. Meteor. Soc., 141, 2463–2570, https://doi.org/10.1002/qj.2542, 2015.
Colarco, P., da Silva A., Chin M., and Diehl T.: Online simulations of global aerosol distributions in the NASA GEOS-4 model and comparisons to satellite and ground-based aerosol optical depth, J. Geophys. Res., 115, D14207, https://doi.org/10.1029/2009JD012820, 2010.
Cowie, S. M., Knippertz, P., and Marsham, J. H.: A climatology of dust emission events from northern Africa using long-term surface observations, Atmos. Chem. Phys., 14, 8579–8597, https://doi.org/10.5194/acp-14-8579-2014, 2014.
Cuesta, J., Marsham J. H., Parker D. H., and Flamant C.: Dynamical mechanisms controlling the vertical redistribution of dust and the thermodynamic structure of the West Saharan atmospheric boundary layer during summer, Atmos. Sci. Lett., 10, 34–42, https://doi.org/10.1002/asl.207, 2009.
Engelstaedter, S. and Washington R.: Atmospheric controls on the annual cycle of North African dust, J. Geophys. Res.-Atmos., 112, D03103, https://doi.org/10.1029/2006JD007195, 2007.
Grogan, D. F. P. and Nathan, T. R.: Passive versus active transport of Saharan dust aerosol by African easterly waves, Geosciences, 12, 1509, https://doi.org/10.3390/atmos12111509, 2021.
Grogan, D. F. P. and Thorncroft, C. D.: The characteristics of African easterly waves coupled to Saharan mineral dust aerosols, Q. J. Roy. Meteor. Soc., 145, 1–17, https://doi.org/10.1002/qj.3483, 2019.
Grogan, D. F. P., Nathan, T. R., and Chen, S.-H.: Effect of Saharan dust on the linear dynamics of African easterly waves, J. Atmos. Sci., 73, 891–911, https://doi.org/10.1175/JAS-D-15-0143.1, 2016.
Grogan, D. F. P., Nathan, T. R., and Chen, S.-H.: Saharan dust and the nonlinear evolution of the African easterly jet-African easterly wave system, J. Atmos. Sci., 74, 24–47, https://doi.org/10.1175/JAS-D-16-0118.1, 2017.
Grogan, D. F. P., Nathan, T. R., and Chen, S.-H.: Structural Changes in the African Easterly Jet and Its Role in Mediating the Effects of Saharan Dust on the Linear Dynamics of African Easterly Waves, J. Atmos. Sci., 76, 3359–3365, https://doi.org/10.1175/JAS-D-19-0104.1, 2019.
Han, Y., van Deist, P., Liu, Q., Weng, F., Yan, B., Treason, R., and Derber, J.: JCSDA community radiative transfer model (CRTM): Version 1, NOAA Technical Report NESDIS 122, NOAA, National Environmental Satellite, Data, and Information Service, https://repository.library.noaa.gov/view/noaa/1157/noaa_1157_DS1.pdf (last access: 17 February 2022), 2006.
Hess, M. P., Koepke, P., and Shult, I.: Optical properties of aerosol and clouds: The software package OPAC, B. Am. Meteorol. Soc., 79, 831–844, https://doi.org/10.1175/1520-0477(1998)079<0831:OPOAAC>2.0.CO;2, 1998.
Hou, Y.-T., Moorhi, S., and Campana, K.: Parameterization of solar radiation transfer in the NCEP models, NCEP Office Note 441, NOAA, https://repository.library.noaa.gov/view/noaa/23085/noaa_23085_DS1.pdf (last access: 17 February 2022), 2002.
Hsieh, J.-S. and Cook, K. H.: Generation of African easterly wave disturbances: relationship to the African easterly jet, Mon. Weather Rev., 133, 1311–1327, https://doi.org/10.1175/MWR2916.1, 2005.
Jones, C., Mahowald, N., and Luo, C.: The role of easterly waves on African desert dust transport, J. Climate, 16, 3617–3628, https://doi.org/10.1175/1520-0442(2003)016<3617:TROEWO>2.0.CO;2, 2003.
Jones, C., Mahowald, N., and Luo, C.: Observational evidence of African desert dust intensification of easterly waves, Geophys. Res. Lett., 31, L17208, https://doi.org/10.1029/2004GL020107, 2004.
Jury, M. R. and Santiago, M. J.: Composite analysis of dust impacts on African easterly waves in the Moderate Resolution Imaging Spectrometer era, J. Geophys. Res., 115, D16213, https://doi.org/10.1029/2009JD013612, 2010.
Karyampudi, V. M., Palm, S. P., Reagen, J. A., Fang, H., Grand, W. B., Hoff, R. M., Moulin, C., Pierce, H. F., Torres, O., Browell, E. V., and Melfi, S. H.: Validation of the Saharan Dust Plume Conceptual Model Using Lidar, Meteosat, and ECMWF Data, B. Am. Meteorol. Soc., 80, 1045–1076, https://doi.org/10.1175/1520-0477(1999)080<1045:VOTSDP>2.0.CO;2, 1999.
Kiladis, G. N., Thorncroft, C. D., and Hall, N. M. J.: Three-Dimensional Structure and Dynamics of African Easterly Waves. Part I: observations, J. Atmos. Sci., 63, 2212–2230, https://doi.org/10.1175/JAS3741.1, 2006.
Kim, J., Akella, S., da Silva, A. M., Todling, R., and McCarty, W.: Preliminary evaluation of influence of aerosols on the simulation of brightness temperature in NASA's Goddard Earth Observing System Atmospheric Data Assimilation System, Technical Report Series on Global Modeling and Data Assimilation, NASA, 49, https://ntrs.nasa.gov/api/citations/20180001946/downloads/20180001946.pdf (last access: 17 February 2022), 2018.
Knippertz, P. and Todd, M. C.: The central west Saharan dust hot spot and its relation to African easterly waves and extratropical disturbances, Geophys. Res. Lett., 115, D12117, https://doi.org/10.1029/2009JD012819, 2010.
Knippertz, P. and Todd, M.: Mineral dust aerosols over the Sahara: Meteorological controls on emission and transport and implications for modeling, Rev. Geophys., 50, RG1007, https://doi.org/10.1029/2011RG000362, 2012.
Lorenc, A. C. and Rawlins, F.: Why Does 4D-Var Beat 3D-Var?, Q. J. Roy. Meteor. Soc., 131, 3247–3257, https://doi.org/10.1256/qj.05.85, 2005.
Lu, C.-H., da Silva, A., Wang, J., Moorthi, S., Chin, M., Colarco, P., Tang, Y., Bhattacharjee, P. S., Chen, S.-P., Chuang, H.-Y., Juang, H.-M. H., McQueen, J., and Iredell, M.: The implementation of NEMS GFS Aerosol Component (NGAC) Version 1.0 for global dust forecasting at NOAA/NCEP, Geosci. Model Dev., 9, 1905–1919, https://doi.org/10.5194/gmd-9-1905-2016, 2016.
Lu, C.-H., Liu, Q., Wei, S.-W., Johnson, B. T., Dang, C., Stegmann, P. G., Grogan, D., Ge, G., and Hu, M.: The Aerosol Module in the Community Radiative Transfer Model (v2.2 and v2.3): accounting for aerosol transmittance effects on the radiance observation operator, Geosci. Model Dev. Discuss. [preprint], https://doi.org/10.5194/gmd-2021-145, in review, 2021.
Mulcahy, J. P., Walters, D. N., Bellouin, N., and Milton, S. F.: Impacts of increasing the aerosol complexity in the Met Office global numerical weather prediction model, Atmos. Chem. Phys., 14, 4749–4778, https://doi.org/10.5194/acp-14-4749-2014, 2014.
Nathan, T. R., Grogan, D. F. P., and Chen, S.-H.: Subcritical destabilization of African easterly waves by Saharan mineral dust, J. Atmos. Sci., 74, 1039–1055, https://doi.org/10.1175/JAS-D-16-0247.1, 2017.
Nathan, T. R., Grogan, D. F. P. and Chen. S.-H.: Saharan dust transport during the incipient growth phase of African easterly waves, Geosciences, 9, 388, https://doi.org/10.3390/geosciences9090388, 2019.
Norquist, D. C., Recker, E. R., and Reed, R. J.: The Energetics of African Wave Disturbances as observed During Phase III of GATE, Mon. Weather Rev., 105, 334–342, https://doi.org/10.1175/1520-0493(1977)105<0334:TEOAWD>2.0.CO;2, 1977.
Paradis, D., Lafore, J.-P., Redelsperger, J.-L., and Balaji, V.: African easterly waves and convection. Part I: linear simulations, J. Atmos. Sci., 52, 1657–1679, https://doi.org/10.1175/1520-0469(1995)052<1657:AEWACP>2.0.CO;2, 1995.
Pérez, C., Nickovic, S., Pejanovic, G., Baldasano, J. M., and Özsoy, E.: Interactive dust-radiation modeling: A step to improve weather forecasts, J. Geophys. Res. Lett., 111, D16206, https://doi.org/10.1029/2005JD006717, 2006.
Pytharoulis, I. and Thorncroft, C. D.: The low-level structure of African easterly waves in 1995, Mon. Weather Rev., 127, 2266–2280, https://doi.org/10.1175/1520-0493(1999)127<2266:TLLSOA>2.0.CO;2, 1999.
Randles, C. A., da Silva, A. M., Buchard, V., Darmenov, A., Colarco, P. R., Aquila, V., Bian, H., Nowottnick, E. P., Pan, X., Smirnov, A., Yu, H., and Govindaraju, R.: The MERRA-2 Aerosol Assimilation, NASA TM-2016-104606, Vol. 45, https://gmao.gsfc.nasa.gov/pubs/docs/Randles887.pdf (last access: 17 February 2022), NASA Global Modeling and Assimilation Office, 132 pp, 2016.
Reale, O. and Lau, K. M.: Impact of an interactive aerosol on the African easterly jet in the NASA GOES-5 global forecasing system, Weather Forecast., 26, 504–519, https://doi.org/10.1175/WAF-D-10-05025.1, 2011.
Reale, O., Lau, K. M., Kim, K.-Y., and Brin, E.: Atlantic Tropical Cyclogenetic Processes during SOP-3 NAMMA in the GEOS-5 Global Data Assimilation and Forecast System, J. Atmos. Sci., 66, 3563–3578, https://doi.org/10.1175/2009JAS3123.1, 2009.
Reale, O., Lau, K. M., da Silva, A. M., and Matsui, T.: Impact of assimilated and interactive aerosol on tropical cyclogenesis, Geophys. Res. Lett., 41, 3282–3288, https://doi.org/10.1002/2014GL059918, 2014.
Reed, R. J., Klinker, E., and Hollingsworth, A.: The structure and characteristics of African easterly wave disturbances as determined from the ECMWF operational analysis/forecast system, Meteorol. Atmos. Phys., 38, 22–33, https://doi.org/10.1007/BF01029944, 1988.
Ross, R. S. and Krishnamurti, T. N.: Low-level African easterly wave activity and its relation to Atlantic tropical cyclogenesis in 2001, Mon. Weather Rev., 135, 3950–3964, https://doi.org/10.1175/2007MWR1996.1, 2007.
Schwendike, J. and Jones, S. C.: Convection in an African Easterly Wave over West Africa and the eastern Atlantic: A model case study of Helene (2006), Q. J. Roy. Meteor. Soc., 135, 364–396, https://doi.org/10.1002/qj.566, 2010.
Sokolik, I.: The spectral radiative signature of wind-blown mineral dust: Implications for remote sensing in the thermal IR region, Geophys. Res. Lett., 29, 2154, https://doi.org/10.1029/2002GL015910, 2002.
Tegen, I. and Fung I.: Modeling of mineral dust in the atmosphere: Sources, transport, and optical thickness, J. Geophys. Res., 99, 22897–22914, https://doi.org/10.1029/94JD01928, 1994.
Thorncroft, C. D.: An idealized study of African easterly waves. III: More realistic basic states, Q. J. Roy. Meteor. Soc., 121, 1589–1614, https://doi.org/10.1002/qj.49712152706, 1995.
Thorncroft, C. D. and Hoskins, B. J.: An idealized study of African easterly waves. I: Linear theory, Q. J. Roy. Meteor. Soc., 120, 953–982, https://doi.org/10.1002/qj.49712051809, 1994.
Wagner, R., Schepanski, K., Heiinold, B., and Tegen, I.: Interannual variability in the Saharan dust source activation—toward understanding the differences between 2007 and 2008, J. Geophys. Res.-Atmos., 121, 4538–4562, https://doi.org/10.1002/2015JD024302, 2017.
Wang, J., Bhattacharjee, P. S., Tallapragada, V., Lu, C.-H., Kondragunta, S., da Silva, A., Zhang, X., Chen, S.-P., Wei, S.-W., Darmenov, A. S., McQueen, J., Lee, P., Koner, P., and Harris, A.: The implementation of NEMS GFS Aerosol Component (NGAC) Version 2.0 for global multispecies forecasting at NOAA/NCEP – Part 1: Model descriptions, Geosci. Model Dev., 11, 2315–2332, https://doi.org/10.5194/gmd-11-2315-2018, 2018.
Weaver, C. J., Joiner, J., and Ginoux, P.: Mineral aerosol contamination of TIROS Operational Vertical Sounder (TOVS) temperature and moisture retrievals, J. Geophys. Res., 108, 4246, https://doi.org/10.1029/2002JD002571, 2003.
Webb, N. P. and Strong, C. L.: Soil erodibility dynamics and its representation for wind erosion and dust emission models, Aeolian Res., 3, 165–179, https://doi.org/10.1016/j.aeolia.2011.03.002, 2011.
Wei, S.-W., Collard, A., Grumbine, R., Liu, Q., and Lu, C.-H.: Impacts of aerosols on meteorological assimilation: Aerosol impact on simulated brightness temperature and analysis fields, JCSDA Quarterly, 66, Spring 2020, https://doi.org/10.25923/4pt1-wx36, 2020.
Wei, S.-W., Lu, C.-H., Liu, Q., Collard, A., Zhu, T., Grogan, D. F. P., Li, X., Wang, J., Grumbine R., and Bhattacharjee, P.: The impact of aerosols on satellite radiance data assimilation using NCEP global data assimilation system, Atmosphere, 12, 432, https://doi.org/10.3390/atmos12040432, 2021.
Westphal, D. L., Toon O. B., and Carlson, T. N.: A case study of mobilization and transport of Saharan dust, J. Atmos. Sci., 45, 2145–2175, https://doi.org/10.1175/1520-0469(1988)045<2145:ACSOMA>2.0.CO;2, 1988.
Wilcox, E. M., Lau, K. M., and Kim, K. Y.: A northward shift of the North Atlantic Ocean Intertropical Convergence Zone in response to summertime Saharan dust outbreaks, Geophys. Res. Lett., 24, L04804, https://doi.org/10.1029/2009GL041774, 2010.