the Creative Commons Attribution 4.0 License.
the Creative Commons Attribution 4.0 License.
 | 21 Feb 2022
Enhanced summertime ozone and SOA from biogenic volatile organic compound (BVOC) emissions due to vegetation biomass variability during 1981–2018 in China
Jing Cao
Shuping Situ
Yufang Hao
Shaodong Xie
Lingyu Li
Coordinated control of fine particulate matter (PM2.5) and ozone (O3) has become a new and urgent issue for China's air pollution control. Biogenic volatile organic compounds (BVOCs) are important precursors of O3 and secondary organic aerosol (SOA) formation. China experienced a rapid increase in BVOC emissions as a result of increased vegetation biomass. We applied WRF-Chem3.8 coupling with MEGAN2.1 to conduct long-term simulations for impacts of BVOC emissions on O3 and SOA during 1981–2018, using the emission factors extrapolated by localized emission rates and annual vegetation biomass. In summer 2018, BVOC emissions were 9.91 Tg (in June), which led to an average increase of 8.6 ppb (16.75 % of the total) in daily maximum 8 h (MDA8) O3 concentration and 0.84 µg m−3 (73.15 % of the total) in SOA over China. The highest contribution to O3 is concentrated in the Great Khingan Mountains, Qinling Mountains, and most southern regions while in southern areas for SOA. Isoprene has the greatest contribution to O3, while monoterpene has the largest SOA production. BVOC emissions have distinguished impacts in different regions. The Chengdu–Chongqing (CC) region has the highest O3 and SOA generated by BVOCs, while the Beijing–Tianjin–Hebei (BTH) region has the lowest. From 1981 to 2018, the interannual variation of BVOC emissions caused by increasing leaf biomass resulted in O3 concentration increasing by 7.38 % at an average rate of 0.11 ppb yr−1 and SOA increasing by 39.30 % at an average rate of 0.008 µg m−3 yr−1. Due to the different changing trends of leaf biomass by region and vegetation type, O3 and SOA show different interannual variations. The Fenwei Plain (FWP), Yangtze River Delta (YRD), and Pearl River Delta (PRD) regions have the most rapid O3 increment, while the increasing rate of SOA in CC is the highest. BTH has the smallest enhancement in O3 and SOA concentration. This study will help to recognize the impact of historical BVOC emissions on O3 and SOA and further provide a reliable scientific basis for the precise prevention and control of air pollution in China.
- Article
(7549 KB) - Full-text XML
-
Supplement
(517 KB) - BibTeX
- EndNote


In recent years, China has suffered from more and more severe O3 pollution, with continuously increasing O3 concentration in most regions (H. Liu et al., 2018; Liu and Wang, 2020; Wang et al., 2017). On the other hand, although the ambient concentrations of PM2.5 have decreased, its pollution is still severe (Fan et al., 2020; Li et al., 2019b; Silver et al., 2018; Zhai et al., 2019). PM2.5 and O3 are currently important atmospheric pollutants affecting air quality in urban and regional areas of China. Their coordinated prevention and control has become a new and urgent issue for China's air pollution control. Volatile organic compounds (VOCs) are precursors of O3 and secondary organic aerosol (SOA) formation (Claeys et al., 2004; Hallquist et al., 2009; Kota et al., 2015), which can be emitted by biogenic and anthropogenic sources. On the global scale, up to 90 % of total VOC emissions come from biogenic sources, including 99 % from vegetation (Guenther et al., 1995). Therefore, the biogenic VOCs (BVOCs) in this study refer to the VOCs emitted by vegetation. BVOCs play a key role in the formation of secondary pollution due to their large emission and high activity, including isoprene, monoterpene, and sesquiterpene (Carslaw et al., 2010; Emanuelsson et al., 2013; Ng et al., 2008; Tasoglou and Pandis, 2015). Globally, BVOC emissions contribute about 20 % and 76 % to the O3 and SOA formation, respectively (Hallquist et al., 2009; Wang et al., 2019). In China, BVOC emissions are estimated to be approximately 1.8 times those of anthropogenic VOCs (Li et al., 2016; Yang et al., 2021). The high BVOC emissions can lead to great increases by 29 %–49 % in surface O3 concentration in most southern urban areas (Li et al., 2018; Y. Liu et al., 2018; Situ et al., 2013; Wu et al., 2020) and contribute 70 %–75 % to China's total SOA formation in summer (Hu et al., 2017; Wu et al., 2020). Therefore, it is essential to understand the emission characteristics of BVOCs and their impacts on the formation of O3 and SOA for making effective policies of secondary air pollution control in China.
In the past 4 decades, China's BVOC emissions have increased by 55.38 % due to biomass growth and climate change, of which biomass variability dominates the interannual variations in emission, which were reported in our previous studies (Li and Xie, 2014; Li et al., 2021). During 1981–2018, the leaf biomass of forests and crops increased by 118.63 % and 316.83 %, respectively, resulting in a continuous growth trend in BVOC emissions by 0.52 Tg yr−1 averagely. The increasing BVOC emissions will affect their contributions to O3 and SOA formation. Some studies investigated the impact of historical and future BVOC emissions on O3 and SOA. Fu and Liao (2012) applied GEOS-Chem coupling with the Model of Emissions of Gases and Aerosols from Nature (MEGAN) using the default constant BVOC emission factors and annual leaf area index (LAI) data and found that the interannual variations in BVOCs led to 2 %–5 % differences in simulated O3 and SOA in summer over the years 2001–2006. Li et al. (2015) concluded that the BVOC emissions (including isoprene, α-pinene, and β-pinene) from the early 1990s to 2006 caused a 0.9–4.6 ppb increment in O3 concentrations over the downwind areas in the PRD region, based on annual land cover data. Sun et al. (2019) used MEGAN2.1 to calculate biogenic emissions which only include isoprene and monoterpenes and showed that their interannual changes caused by meteorology led to an increment of 0.3 ppb O3 over central eastern China from 2003 to 2015. Liu et al. (2019) concluded that climate-driven BVOC emission changes would enhance O3 and SOA concentrations by 0.90 % and 7.33 % in eastern China from 2015s to 2050s under future climate scenario RCP8.5 and reduce them by 0.80 % and 6.50 % respectively under scenario RCP4.5, simulated by the same emission factors and land cover data. However, the BVOC emission inventories applied in these studies may have high uncertainties because of the lack of localized emission factors and high-resolution land cover data, which is not conducive to the accurate evaluation for the contribution of BVOC emissions on O3 and SOA formation. In addition, China has experienced continuously increasing forest volume, while few studies focus on the impact of changes in BVOC emissions caused by vegetation biomass variability over a longer time span. This makes it difficult to accurately evaluate the impact of BVOCs on O3 and SOA and guide the precise control of O3 and PM2.5. How to obtain the accurate historical contribution of BVOCs to O3 and SOA based on localized accurate BVOC emissions is both an important issue and a great challenge.
In this study, firstly we updated the localized emission factor and detailed vegetation data to obtain more accurate BVOC emissions. The emission factors were extrapolated by localized emission rates and annual vegetation biomass at the provincial level. Then, based on the estimated historical emissions, their long-term impacts on O3 and SOA during 1981–2018 were simulated through coupling MEGAN2.1 in WRF-Chem3.8. We aimed to investigate the impact of interannual BVOC emission variations on O3 and SOA formation caused by vegetation biomass variability. The spatial variations in BVOC effects were discussed. Also, their contribution by different components was studied. It is expected that an accurate evaluation of BVOC contribution to O3 and SOA can be obtained through improving the accuracy of emission inventory. Our study can help to better understand the role of vegetation biomass variability in the BVOC impact on O3 and SOA in China in the past 4 decades.
2.1 MEGAN
The MEGAN2.1 was utilized to estimate BVOC emissions in China at a spatial resolution of 36 km × 36 km (Guenther et al., 2012). It can calculate hourly emissions of 147 BVOC species, including isoprene, monoterpene, sesquiterpene, carbonyls, and other VOCs. The BVOC emissions simulated by MEGAN2.1 were the online inputs of the WRF-Chem simulation.
Meteorological and vegetation data are inputs to drive MEGAN. MEGAN2.1 requires hourly weather variables to drive the calculation of hourly BVOC emissions. The hourly meteorological fields including temperature, downward shortwave radiation, wind speed, water vapor mixing ratio, pressure, and precipitation were simulated by the WRF model in this study. Temperature and radiation play key roles in BVOC emissions. We used the observed daily average temperature at 2411 sites in 2008 and 684 sites in 2018 in China to evaluate the reliability of the 2 m temperature (T2) simulated by WRF in this study. The observations were from the National Meteorological Data Center in China (http://data.cma.cn/, last access: 16 February 2022). The simulated radiation was not evaluated because of a lack of available site observations. We conducted the statistical verification of meteorological variables, as shown in Table S1, including the average mean bias (MB), mean absolute error (MAE), and root-mean-square error (RMSE). The results show that the WRF simulation is considered reasonable for driving MEGAN. The vegetation data include gridded fraction of plant functional types (PFTs), leaf area index (LAI), and PFT-specific emission factors. The new detailed PFT classification and distribution were developed from the Vegetation Atlas of China (1:1 000 000) at a high resolution of ∼ 250 m, including 82 PFTs of forests, crops, grasses, and shrubs. The atlas was compiled based on multi-year vegetation survey data and related research studies over 30–40 years and provides a more detailed distribution of vegetation in China. Previous studies typically included a coarse vegetation classification that is based on a less detailed vegetation distribution (Gao et al., 2019; Klinger et al., 2002; Wang et al., 2007). And the MEGAN2.1 defined 15 vegetation types by default (Guenther et al., 2012). For LAI, the MODIS LAI data were used.
Emission factors were extrapolated by the leaf-level emission rates and leaf biomass using the canopy environment model described in MEGAN2.1. In our previous studies on BVOC emission inventories, a large number of observations from China and other countries were summarized to obtain more accurate basal emission rates using a theoretically effective statistical approach (Li et al., 2020). The dataset contained isoprene and monoterpene emission rates of 192 plant species/genera including the dominant forest tree and crop species, and grass and shrub genera, which were expected to be more accurate and localized. In previous studies, traditional emission categories were used to determine emission rates (Guenther et al., 1994; Klinger et al., 2002; Simpson et al., 1999; Wang et al., 2007), which usually utilized coarse categories and resulted in high uncertainty. The vegetation species/type-specific leaf biomass at the province level originated from statistics of vegetation volume and production using biomass apportion models, which revealed differences among plant species and regions compared with previous studies (Li et al., 2013, 2020; Li and Xie, 2014). Previous studies usually applied an average value for each vegetation class, such as broadleaf trees, needleleaf trees, crops, and grasses, without revealing their differences among regions and plant species (Klinger et al., 2002; Wang et al., 2007). The statistics on forest volumes were from the National Forest Inventory of China. Eight forest inventories for the periods of 1977–1981, 1984–1988, 1989–1993, 1994–1998, 1999–2003, 2004–2008, 2009–2013, and 2014–2018 were used. The last year of each period was selected to simulate the historical emissions and concentration of O3 and SOA during 1981–2018. Crop productions were from the China Statistical Yearbook for the year 1981, 1988, 1993, 1998, 2003, 2008, 2013, and 2018. Grass production was from the Grassland Resource Data of China. Consequently, the extrapolated emission factors vary over the years. After the emission factor calculation of total monoterpene, the emission factors for each monoterpene and sesquiterpene species were allocated from total monoterpene based on the global average emission factor proportions described in MEGAN2.1. For the emission factors of other VOCs, the default MEGAN emission factors were used.
2.2 WRF-Chem
The chemistry version of the WRF model (WRF-Chem3.8) was used in this study to simulate the concentration of surface O3 and SOA (Grell et al., 2005). WRF-Chem realizes the online coupling of meteorological models and chemical models, considering the emission, transport, diffusion, dry and wet deposition, photolysis, meteorological chemistry, and aerosol chemical processes of pollutants, which have been widely used to conduct the online calculations of meteorology and chemistry. A large number of global and regional air pollution studies widely apply it to simulate secondary pollutants, and the verification results show that it can reproduce the observed pollutant concentrations well (Gupta and Mohan, 2015; Hoshyaripour et al., 2016; Li et al., 2018; Situ et al., 2013; Wu et al., 2018).
One nested domain centered at 34.53∘ N and 108.92∘ E was adopted, with a 36 km horizontal resolution covering the whole area of the China region. Main parameterization options for physical and chemical schemes of the model setup are listed in Table S2 in the Supplement. The United States National Centers for Environmental Prediction (NCEP)/Department of Energy (DOE) Reanalysis II data at 1∘ × 1∘ were used as the initialization field and boundary conditions for WRF, which are updated every 6 h (00:00, 06:00, 12:00, and 18:00 UTC). The NOAA/ESRL RACM (Stockwell et al., 1997) gas-phase chemistry scheme and the volatility basis set (VBS) (Donahue et al., 2006) aerosol chemistry module were selected in this study. The RACM consists of 77 chemical species and considers 237 reactions, including relatively detailed organic chemistry which considers the oxidation mechanism for BVOCs (e.g., isoprene, α-pinene, and β-limonene). In the VBS, a unified set of saturated vapor pressure is used, and the coupling matrix of the gas phase and condensed phase is established to describe the photochemical multi-generation oxidation and gas–particle partition process. This approach can better represent multi-generation oxidation of BVOCs in the gas phase and their aging processes in the aerosol phase (Hu et al., 2017). The photolysis scheme of Fast-J (Wild et al., 2000) was selected because it can better compute photolysis rates from the predicted O3, aerosol, and cloud profiles.
The observed daily maximum 8 h (MDA8) O3 and daily average PM2.5 concentrations at 1588 sites in June 2018 in China were applied to evaluate the WRF-Chem simulations in the control run (as listed in Table 1) in this study. The observations were from the daily updated national air quality released by the China National Environmental Monitoring Centre (http://www.cnemc.cn/, last access: 16 February 2022). The verification statistics are shown in Table S1. Notably, PM2.5 had no systematic bias between the observation and simulation, while the model-predicted O3 concentrations were lower than measurements. The errors could be mainly attributed to the anthropogenic emissions data used in this study, as described in Sect. 2.3.
2.3 Simulation setups
In this study, June was selected as the simulated period to investigate the effects of summertime BVOC emissions on O3 and SOA generation. Seven simulation scenarios were set up to investigate the effects of BVOC emissions by each compound category and historical emission variation. The details of simulation setup are listed in Table 1. We focused on the contribution of historical BVOC emissions caused by biomass variability, so the anthropogenic emissions in all scenarios were fixed using the MIX Asian anthropogenic source emission inventory (Li et al., 2017).
In the BASE scenario, a 1-month-long simulation using anthropogenic emissions and total BVOC emissions in June of 2018 was conducted as the control run for this study. Excluding all the BVOC emissions, the BIO scenario was set to simulate the O3 and SOA concentration to quantify the impacts of total BVOC emissions compared with the results of BASE scenario (BASE-BIO). Different compound categories have different contributions to the formation of secondary pollutants. Thus, scenarios “ISOP”, “MTP”, “SQT”, and “ISOPRENOID” were designed to simulate the impacts of isoprene, monoterpene, sesquiterpene, and isoprenoid (total of the above three categories) on O3 and SOA, by excluding their emissions. For these simulations, the meteorology of 2018 was used to drive MEGAN to estimate biogenic emissions in June 2018. The “HISTORY” scenario was an interannual comparison simulation to estimate the impacts of historical BVOC emissions caused by the change of vegetation leaf biomass. It was run using annual emission factors extrapolated from emission rates and annual leaf biomass during 1981–2018. For the meteorology, the fixing set of 2008, a mid-range year from 1981–2018, was used for all the HISTORY simulations. To explore the impacts of interannual BVOC emission variations caused by vegetation biomass variability, influences of annual meteorology on BVOC emissions and formation of secondary air pollutants were not considered.
Table 1Description of different model simulations in this study.

3.1 BVOC emission
3.1.1 Spatial distributions of BVOC emissions
The total BVOC emissions in China estimated by MEGAN2.1 are 9.91 Tg in June 2018, of which isoprene, monoterpene, sesquiterpene, and other BVOCs account for 64.21 %, 10.58 %, 2.12 %, and 23.09 %, respectively. As shown in Fig. 1, BVOC emissions show significant spatial variations with the highest emissions in the Changbai Mountains, Greater Khingan Mountains, Qinling Mountains, the southeast and southwest China forest regions, and Hainan and Taiwan provinces and the lowest in the Qinghai–Tibet Plateau and southern Xinjiang province.
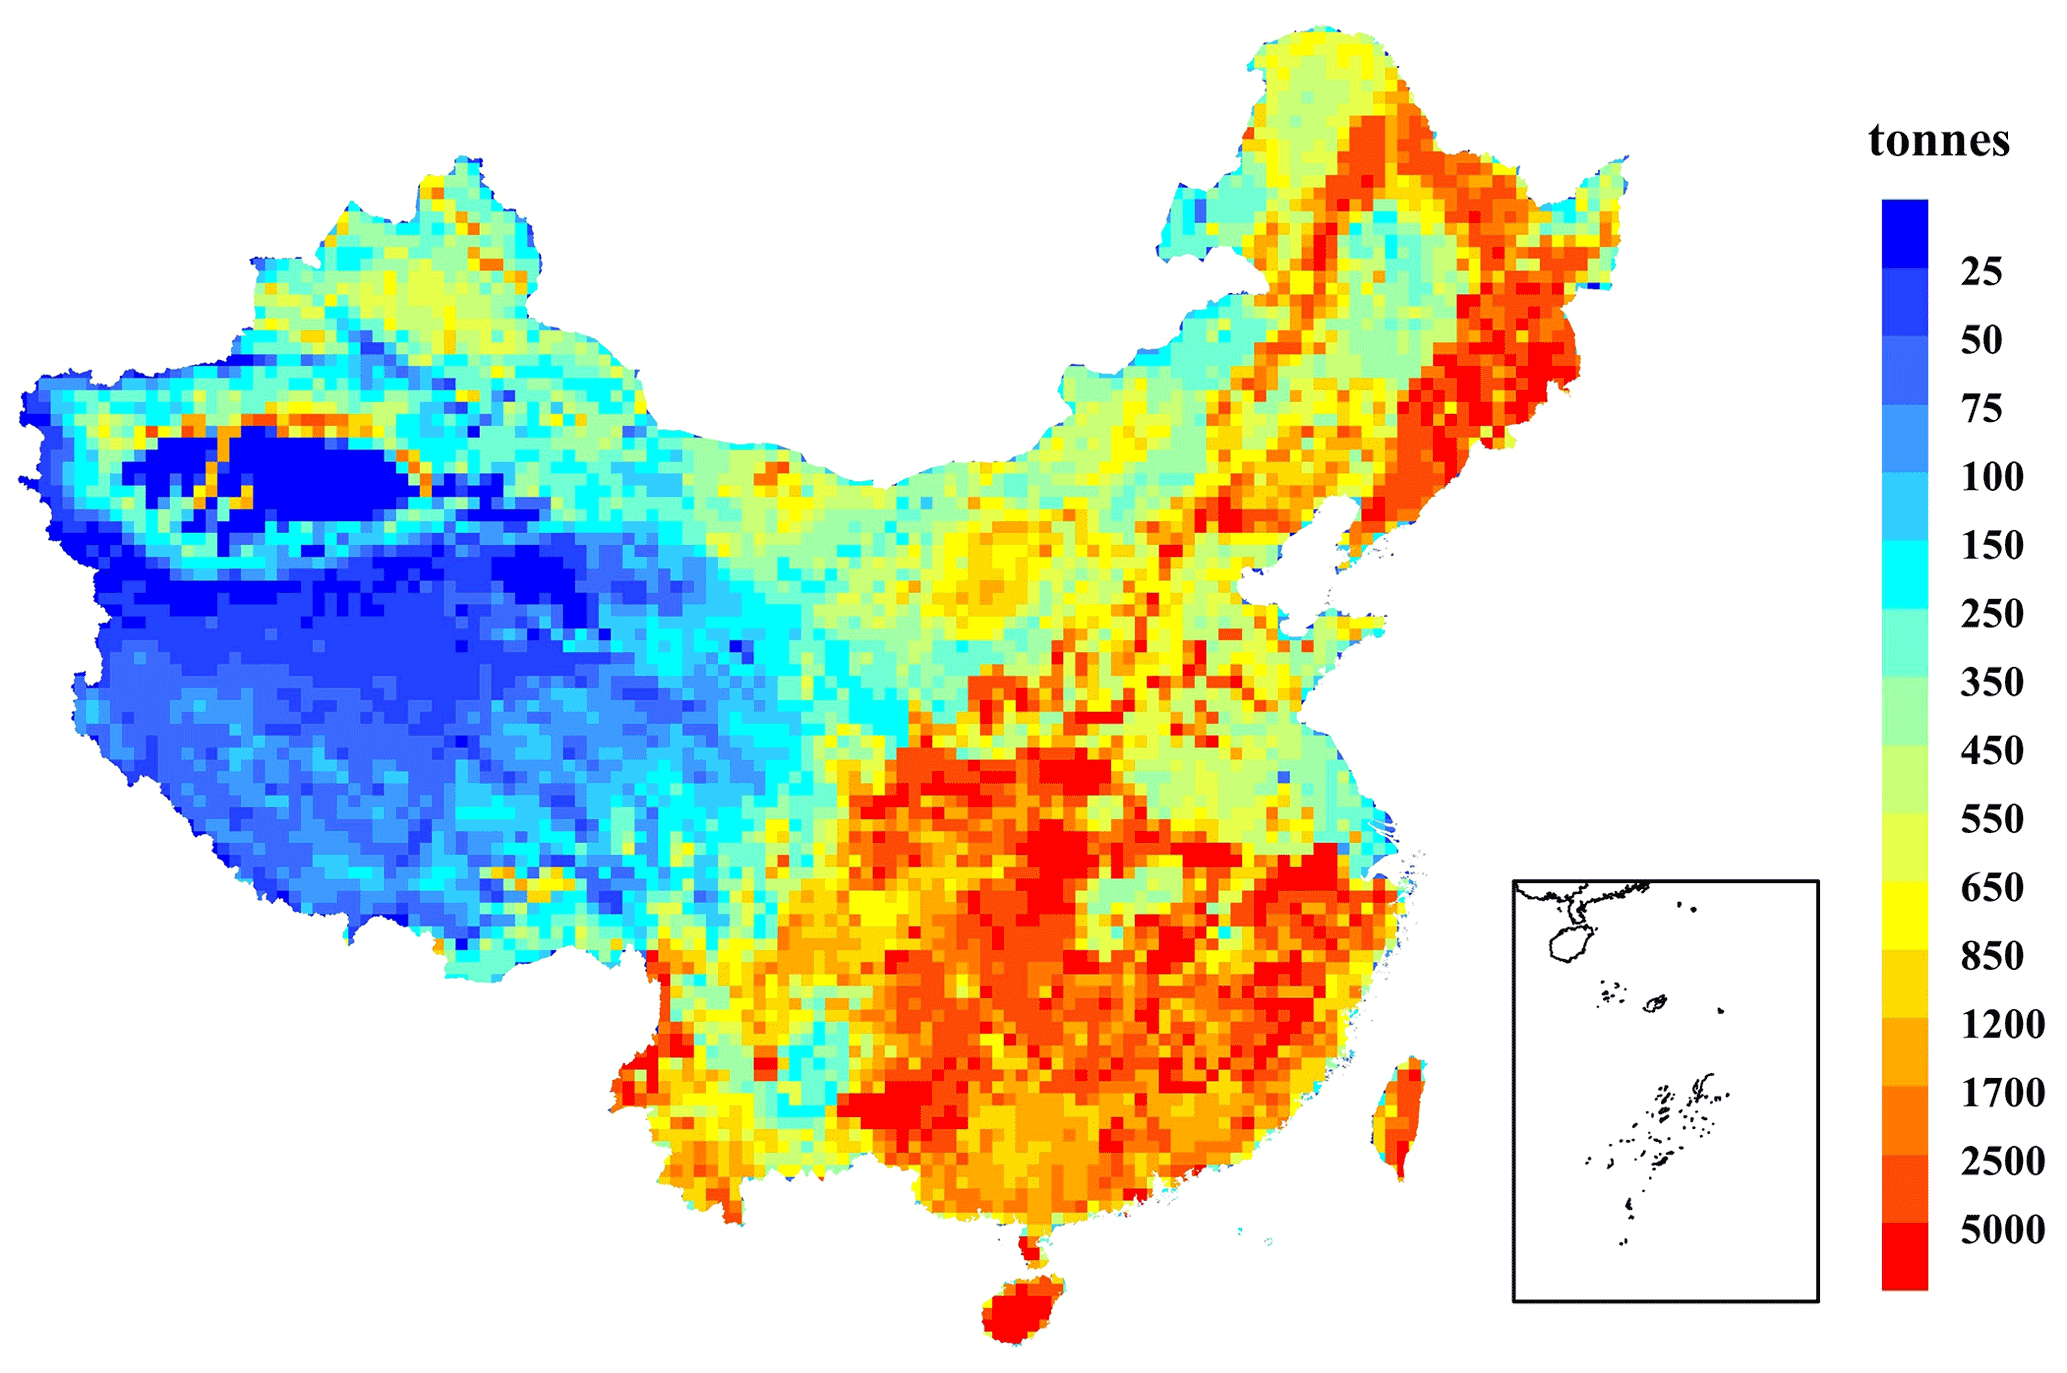
Figure 1Spatial variations in BVOC emissions in June 2018.
The emission simulations were validated using the formaldehyde (HCHO) concentration and measurements of BVOC emission flux. Isoprene is the main compound in BVOC species, accounting for nearly half of total BVOC emissions in China. It undergoes chemical and photochemical reactions in the atmosphere, and the oxidation product is mainly HCHO (Bai and Hao, 2018; Orlando et al., 2000). In forest areas and in summer, biogenic isoprene is the dominant source of HCHO, so satellite HCHO column concentration is widely used to constrain isoprene emissions (Opacka et al., 2021; Palmer et al., 2003; Stavrakou et al., 2018; Wang et al., 2021; Zhang et al., 2021). In this study, we used the HCHO vertical column detected by the Ozone Monitoring Instrument (OMI) to validate the spatial variability of isoprene estimates. The monthly OMI HCHO data from the EU FP7 project QA4ECV product (Quality Assurance for Essential Climate Variables; http://www.qa4ecv.eu, last access: 16 February 2022) were used in this study. The result of the statistical analysis with a confidence interval of 99 % indicates that the monthly averaged OMI HCHO vertical column in June 2018 is significantly correlated to the model-estimated isoprene emissions. The flux measurements of BVOCs conducted in China were collected (Bai et al., 2015, 2016, 2017). The details of these measurements are provided in Table S3, including the location of sampling sites and observed BVOC emission fluxes. The gridded BVOC emissions estimated by MEGAN were extracted where the flux measurement sites were located to do the comparison (Fig. S1 in the Supplement). The modeled fluxes of BVOCs in this study capture the spatial variability of observations better, with a correlation coefficient of 0.84. But the estimation is higher than the measurement, with an average mean bias of 1.11 mg m−2 h−1 in these sampling sites, mainly because of the differences in time between them.
3.1.2 Influence of leaf biomass variability
The leaf biomasses increased from 378.35 × 10¹² g in 1981 to 1107.16 × 1012 g in 2018 at an average rate of 17.97 × 10¹² g yr−1. Among them, the forest and crop leaf biomass increased from 237.10 × 10¹² to 518.38 × 10¹² g and from 141.25 × 10¹² to 588.79 × 10¹² g, respectively, totally increasing by 192.63 %. The spatial distribution of interannual variations in leaf biomass is presented in Fig. S2. The increase of leaf biomass is most significant in the Great Khingan, Changbai Mountains, the North China Plain, and south and southwest China. This is mainly due to the increased stock of broadleaf and coniferous forests as a result of afforestation. The northern Qinghai–Tibet area and northwest China have a relatively high grass cover rate but insignificant increase in leaf biomass of vegetation. This is because the grass biomasses were the same over the historical simulations due to a lack of data.
Due to the increased volume and production of vegetation, the total BVOC emissions increased by 58.66 % at average rates of 96.64 Gg yr−1, of which isoprene, monoterpene, and sesquiterpene increased by 108.57 %, 38.17 %, and 33.35 % at average rates of 11.10, 0.99, and 0.17 Gg yr−1, respectively. Isoprene emissions increased more rapidly over the past 40 years, which is primarily due to the greater increase in the biomass of broadleaf trees, which have the highest isoprene emission rates. Monoterpene and sesquiterpene increased at a lower rate because the increase of leaf biomass of conifers is relatively small. Figure 2 shows the spatial distribution of interannual variations in BVOC emissions caused by the changing leaf biomass. Since the needleleaf and broadleaf trees tend to have a higher emission potential than grass or crop (Guenther et al., 2012), their wide distribution and the substantial increase in biomass result in the largest interannual variability of BVOC emissions in the Great Khingan, Changbai Mountains, North China Plain, Central and Southern China, and Hainan province. However, the emission of BVOCs in the northwest and southern coastal areas has decreased.
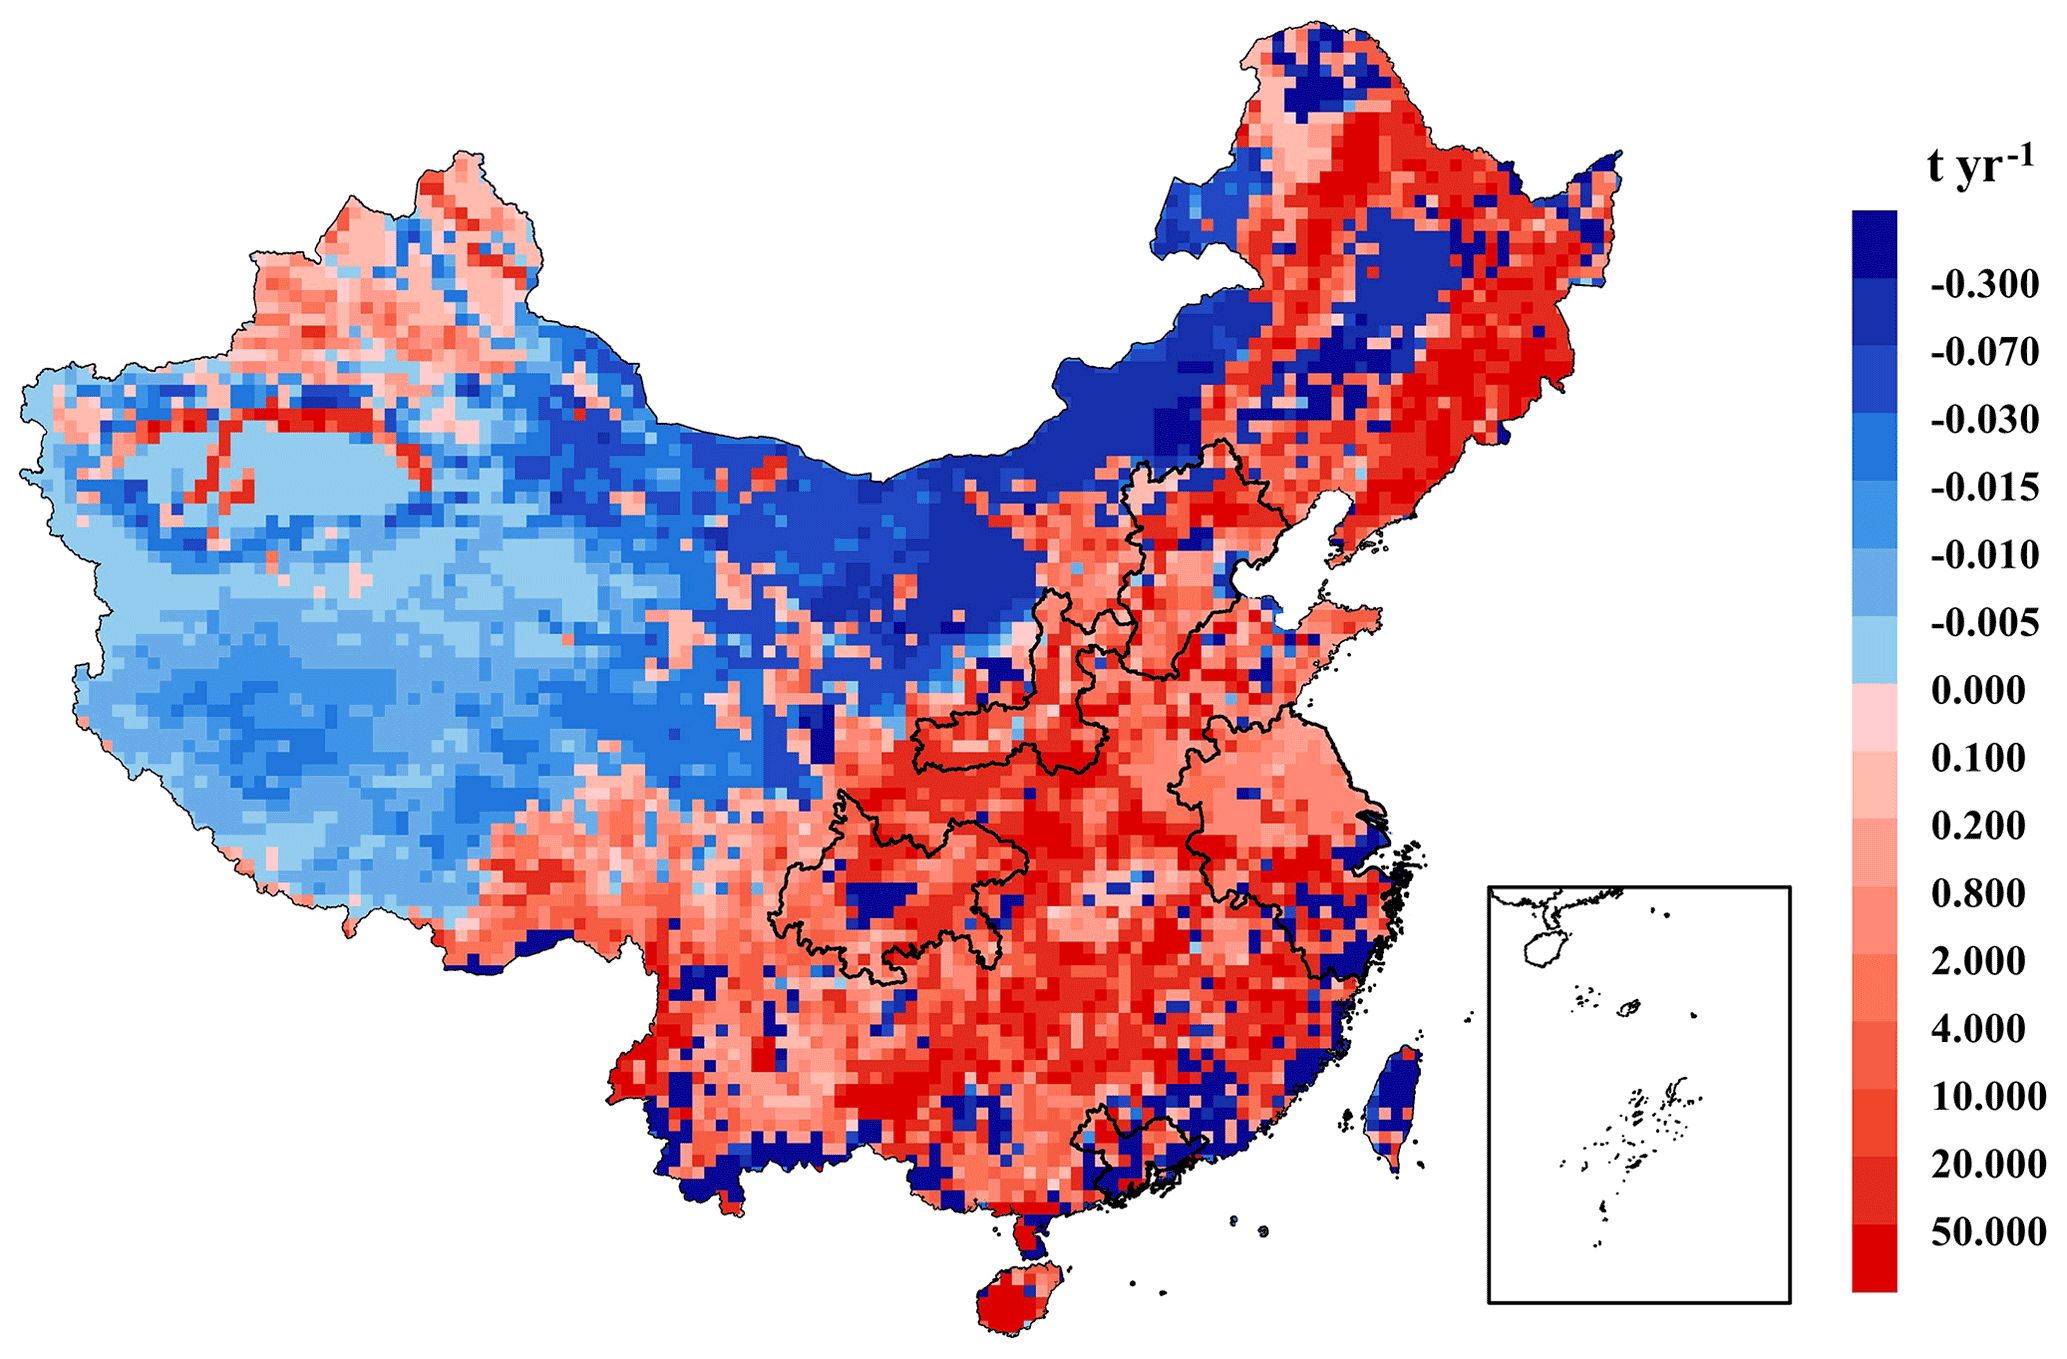
Figure 2Spatial distribution of interannual variations in BVOC emissions caused by leaf biomass changes.
3.2 Impacts of BVOC emissions on O3 and SOA
3.2.1 O3
BVOC emissions generate additional O3 and contribute 8.61 ppb MDA8 O3 over China on average in summer 2018. Their nationally averaged contribution is 16.75 %. There are distinct differences spatially in the impact of BVOC emissions. The spatial distribution of the difference in MDA8 O3 concentrations between simulations with and without BVOC emissions in summer 2018 is shown in Fig. 3. BVOC emissions lead to the increase of O3 concentration in most regions, with the highest contribution of > 30 ppb. The highest contribution is concentrated in southern China, which is mainly caused by their higher BVOC emissions due to higher temperature and vegetation biomass (Li et al., 2020). Their impact ranges from 10.50 to 77.17 ppb, contributing 36.20 %–70.83 % to the total O3 formation, respectively. Because most land cover in western China, including Qinghai–Tibet Plateau and Xinjiang province, is sparse or herbaceous vegetation with low emission potential, O3 is less affected by BVOC emission. In addition, it is interesting to note that the extremely low contribution in some areas of the Bohai Rim in eastern region is inconsistent with the high BVOC emissions. This is likely because O3 is more sensitive to anthropogenic emissions.
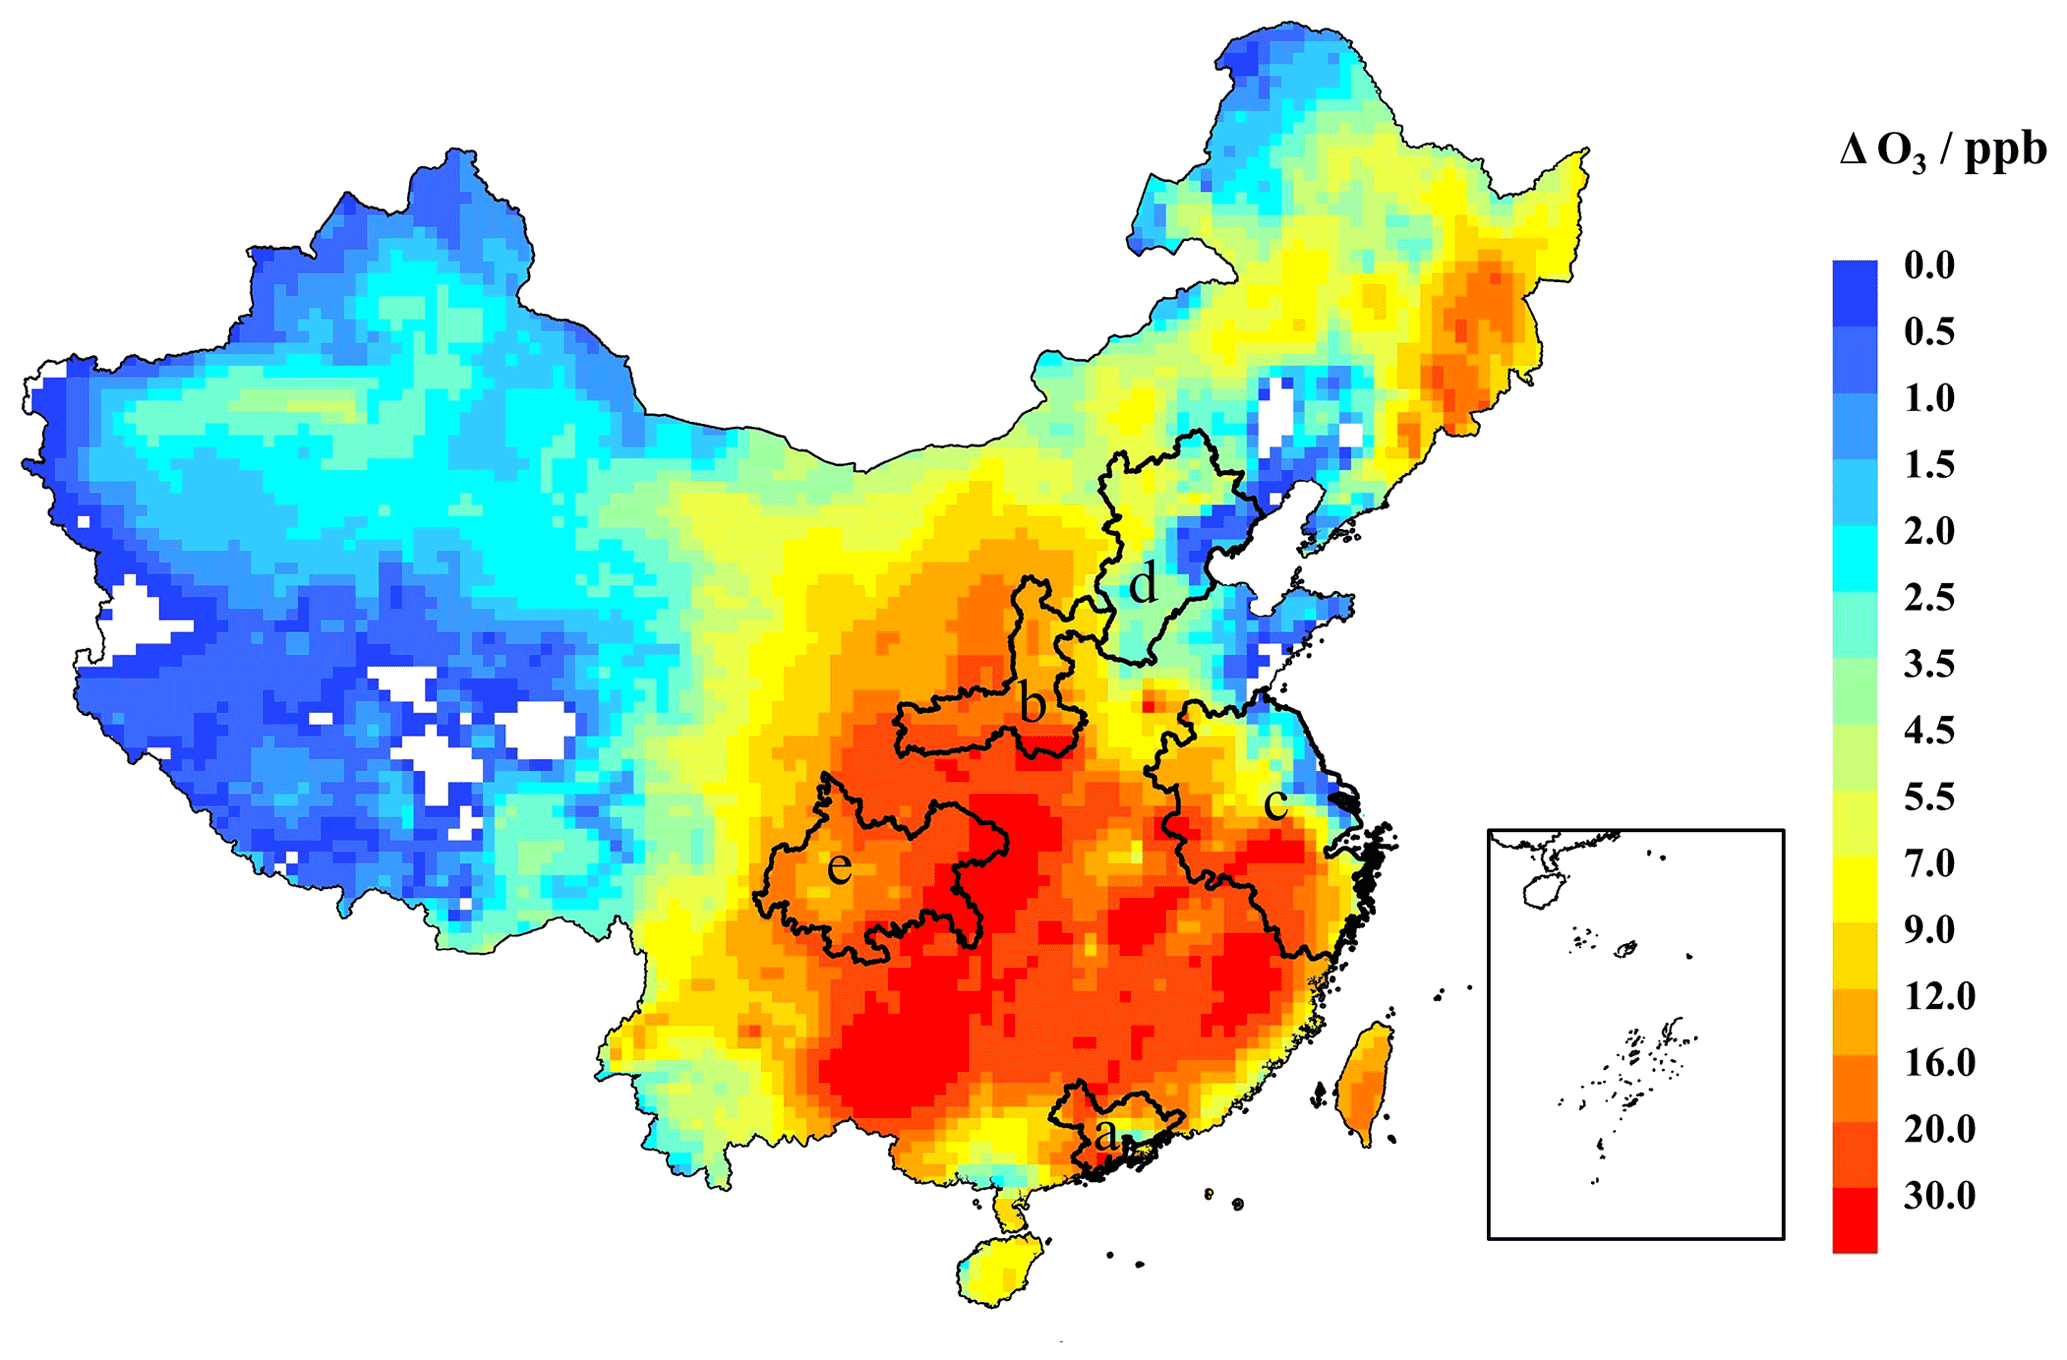
Figure 3Spatial variations in impact of BVOC emission on MDA8 O3 concentration. The key regions include the (a) Pearl River Delta (PRD), (b) Fenwei Plain (FWP), (c) Yangtze River Delta (YRD), (d) Beijing–Tianjin–Hebei (BTH), and (e) Chengdu–Chongqing (CC).
The spatial pattern of estimated MDA8 O3 impacted by BVOC emissions differs from the spatial distribution of BVOC emissions, mainly because of the variability of the nonlinear response relationship between O3 formation and precursors. As important precursors, VOCs and NOx react in the presence of hydroxyl (OH) and hydroperoxyl (HO2) radicals to create O3. The O3 formation is expected to be affected by the different levels of O3 precursors in different land use functional areas. According to different ratio, O3 formation regimes can be classified into VOC-limited (VOC-sensitive), transition, and NOx-limited (NOx-sensitive) regimes (Lu et al., 2019; Wang et al., 2008). From the spatial distribution of the BVOC effect (Fig. 3), the surface O3 is sensitive to BVOC emissions in most regions in China, which can further indicate they are usually VOC-limited. It confirms the conclusion made by Lu et al. (2019), Lyu et al. (2016), and Tan et al. (2018) that the VOC-limited regime is dominant in southern China. Compared with the spatial distribution of BVOC emissions (Fig. 1), the areas with high BVOC emissions usually have a higher contribution to O3. Because the dense population leads to a large number of NOx emitted by human activities, NOx is saturated with the formation of O3, which is more sensitive to VOC emissions. Therefore, the higher BVOC emissions usually cause a greater contribution to O3 in these areas. In the VOC-limited regime, the reduction of VOC emissions reduces the chemical production of organic radicals (RO2), which in turn leads to decreased cycling with NOx and consequently lower concentration of O3 (Jin and Holloway, 2015; Milford et al., 1989). Decreasing BVOC emissions by planting plants with low emission potential may contribute to O3 pollution control. Notably, both northeastern and southern regions have the highest BVOC emissions, but their contributed O3 levels differ much, which indicates that O3 formation in the south is more sensitive to VOCs than in the northeast. Hainan province also has higher BVOC emissions but a relatively low contribution to O3.
Five key regions with stronger economy, larger population, and higher O3 pollution are selected to further investigate the regional variability in the impact of BVOC emissions on O3, which are Beijing–Tianjin–Hebei (BTH), Fenwei Plain (FWP), PRD (Pearl River Delta), Yangtze River Delta (YRD), and Chengdu–Chongqing (CC) (Table 2). Their BVOC effects were more significant than the national average, except for the BTH region. These four key areas are populous and economically developed, and power grids are dense. The high concentration of NOx emissions may lead to saturation of NOx and excessive consumption of OH, so ozone generation is more sensitive to VOC emissions (Jin and Holloway, 2015). The contribution is the largest in the CC region, with a 23.29 ppb O3 increment, which accounts for 44.98 % of the total O3 concentration, although its BVOC emissions are relatively low among the five regions. This is mainly due to its low concentration of other precursors including NO2 and CO in summer and its low topography that is favorable for the accumulation of O3 (Cao et al., 2018). The difference in MDA8 O3 with and without BVOC emissions shows a small gap between FWP and PRD regions, both of which are ∼ 19 ppb, but the contribution to total O3 in PRD (41.83 %) is 1.17 times that in FWP (35.81 %), which could indicate a higher contribution by the anthropogenic VOC emissions in FWP. In addition, FWP has a higher O3 concentration in summer than PRD (Li et al., 2019a; Wang et al., 2019; Xie et al., 2021). The BVOC emissions in BTH are the lowest among the five regions, so the impact on MDA8 O3 is the least significant, which is 4.10 ppb and 15.84 % of the total O3. This can be explained by the greater contribution of anthropogenic emissions to surface O3 caused by manufacturing, electricity production, and transportation.
3.2.2 SOA
BVOCs undergo a series of atmospheric degradation processes to produce oxidation products, which may contribute to the formation and growth of SOA. This process is affected by the concentration of precursors and meteorological conditions. In summer, high biogenic emissions combined with enhanced photochemical levels, caused by high temperature and strong solar radiation, lead to the peak of SOA production in this season (Kelly et al., 2018). From our simulations, SOA produced by BVOCs (BSOA) plays an important role in SOA production, accounting for 73.15 % of the total concentration, which is in good agreement with previous studies that considered BSOA a major contributor (Hu et al., 2017; Wu et al., 2020). The BVOC emissions generate an additional ∼ 0.8 µg m−3 SOA on average, with a gridded maximum of 4.12 µg m−3. Figure 4 shows the spatial distribution of BSOA contribution in June 2018. The whole country has increases in SOA concentration after considering BVOC emissions compared with simulations without them. Generally, spatial variability in BVOC contribution to SOA corresponds with that in BVOC emissions. Southern China has a higher contribution than northeastern areas, although they both have the highest BVOC emissions in summer. This is mainly because the southern area has higher emissions of monoterpenes, which contribute most to SOA generation. Notably, the hotspots of BVOC contribution to SOA with > 2 µg m−3 (accounting for > 70 % of the total SOA) are mainly distributed in the Sichuan Basin, northeast Yunnan, and northwest Guizhou, which may be because the high level of BVOCs in southern China can be transported to these regions due to the influence of the southeast monsoon in the summertime and accumulate under the barrier of the western plateau (Wang et al., 2018). The sensitivity of SOA to BVOC emission is the lowest in the western Qinghai–Tibet Plateau and southwestern Xinjiang, where the contribution of BVOCs is only about 0.15 µg m−3, lower than 60 % of the total produced SOA. This is mainly because of their lower biogenic emissions contribution.

Figure 4Spatial variations in impact of BVOC emission on SOA concentration.
The impacts of BVOC emissions on SOA differ much among the five key regions (Table 2). The results indicate that SOA production is most sensitive to BVOC emissions in CC, followed by PRD, FWP, and YRD, and the least in BTH. Among the five regions, CC has the lowest BVOC emissions but the strongest impacts on SOA, with an additional 2.51 µg m−3 SOA and contributing 84.27 % to the total, which is a characteristic that coincides with impacts on O3. This can be explained by the widely distributed forest in the southwest forest region and the topography that is beneficial to the accumulation of BVOCs and SOA. The BVOC emissions of 462.92 Gg in PRD generate 1.96 µg m−3 SOA, accounting for 74.63 % of the total SOA. YRD and FWP regions have similar emission budgets and additional SOA generation by BVOCs but different proportions of total BSOA. The contribution of BSOA in FWP (77.75 %) is greater than that in YRD (69.12 %), which indicates a higher contribution of anthropogenic VOCs in YRD. BTH has the lowest production of BSOA with 0.74 µg m−3, which is lower than the national average, mainly due to its lowest biogenic emissions among the five regions.
3.2.3 BVOC component contribution
Table 2 shows the contributions of different BVOC categories to MDA8 O3 and SOA. Isoprene, monoterpene, and sesquiterpene contribute 7.01, 1.17, and 0.16 ppb O3 and 0.25, 0.52, and 0.22 µg m−3 SOA over China, respectively. Among the emission-dominated categories, including isoprene, monoterpene, and sesquiterpene, isoprene has the largest contribution to O3 production. Owing to its highest emissions and reactivity with various oxidants, isoprene plays an important role in the formation of O3 (Wennberg et al., 2018). Sesquiterpene emission is the lowest, resulting in the smallest contribution to O3. As key precursors of SOA formation, monoterpene emissions are only one-sixth of isoprene, but their contribution to SOA is the highest, about 2 times the contribution by isoprene. The reaction of monoterpenes with atmospheric oxidants such as O3, OH, and NO3 is considered to be an important reason for the resultant SOA formation (Hoffmann et al., 1997; Mutzel et al., 2016; Watne et al., 2017). The contribution of isoprene to SOA is relatively low because isoprene mainly reacts with OH radicals to form SOA, while the reactions with other oxidants in the atmosphere (including O3 and NO3) contribute little to SOA production (Claeys et al., 2004; Henze and Seinfeld, 2006; Ruppert and Becker, 2000). Sesquiterpene has much lower emissions than isoprene, but their generated SOAs are equivalent, indicating the higher SOA yield of sesquiterpene (Hoffmann et al., 1997). From the simulation of the scenario “ISOPRENOID”, which excludes the emissions of isoprene, monoterpene, and sesquiterpene together, the additional generation of O3 and SOA by isoprenoid is not a linear combination of those by each category. The contributions by isoprenoid are usually larger than the sum of those by each category. It can be concluded that there is a complex nonlinear relationship between BVOCs and the formation of O3 and SOA.
Table 2Emissions of each BVOC category and their corresponding contribution to MDA8 O3 and SOA concentration in the five key regions of China in June 2018.

For all the five regions, isoprene has both the largest emissions and the highest contribution of O3 generation, followed by monoterpene and sesquiterpene. O3 in CC, FWP, and PRD is greatly impacted by isoprene, where the impacts are on average 20.49, 18.01, and 16.81 ppb, respectively. Among them, CC has the lowest isoprene emissions, but the concentration of O3 generated by isoprene is the highest, which is mainly because of the low concentration of other precursors. Isoprene emissions are the greatest in PRD. For the impact of monoterpene on O3, CC contributes the most because it has higher monoterpene emissions. Monoterpenes are the largest contributor to SOA production among the key regions except YRD. In YRD, the generated SOAs by isoprene and monoterpene are equivalent, although their emissions can be distinguished. These also indicate the different SOA yields of isoprene and monoterpene. SOA contributed by isoprene is also higher in CC and PRD regions due to their absolute advantage in topography and emission, respectively. BTH and FWP have similar monoterpene emissions, but their generated SOAs differ much due to the different ratios of the different BVOC component emissions. Compared with isoprene and monoterpenes, the contribution of sesquiterpene to SOA is small.
3.3 Interannual variability
3.3.1 O3
The concentration of O3 enhances from 48.82 to 52.43 ppb at an average growth rate of 0.11 ppb yr−1 during 1981–2018. At the 95 % confidence level, the increasing trend for O3 is significant. But the interannual variability in O3 can be distinguished regionally. Figure 5 shows the spatial distribution for changes of MDA8 O3 concentration due to the changed BVOC emissions caused by vegetation leaf biomass variability in the past 40 years. The strongest enhancement of O3 from interannual variation of BVOC emissions is mainly distributed in most of the southern areas, which have an average annual rate of > 0.2 ppb and some > 0.4 ppb. In these areas, the increase in biomass of broadleaf trees and needleleaf trees with high emission potential has contributed to the increased BVOC emissions and O3 concentration as a result. The enhancement of O3 in the area of the Changbai Mountains is also large mainly due to the increased broadleaf tree biomass. The weakest increments are found mainly in Xinjiang, southwestern Yunnan province, and Taiwan. In Xinjiang province, there is a greater distribution of vegetation with lower emission potentials, including crops and shrubs, which has a small change in leaf biomass. In the past 4 decades, the leaf biomass in Xinjiang increased by 17.55 × 10¹² g, accounting for only 2.41 % of the total growth in China. The tropical forest in the southwest of Yunnan province has declined in volume because of commercial deforestation and expanded plantations of economic trees.
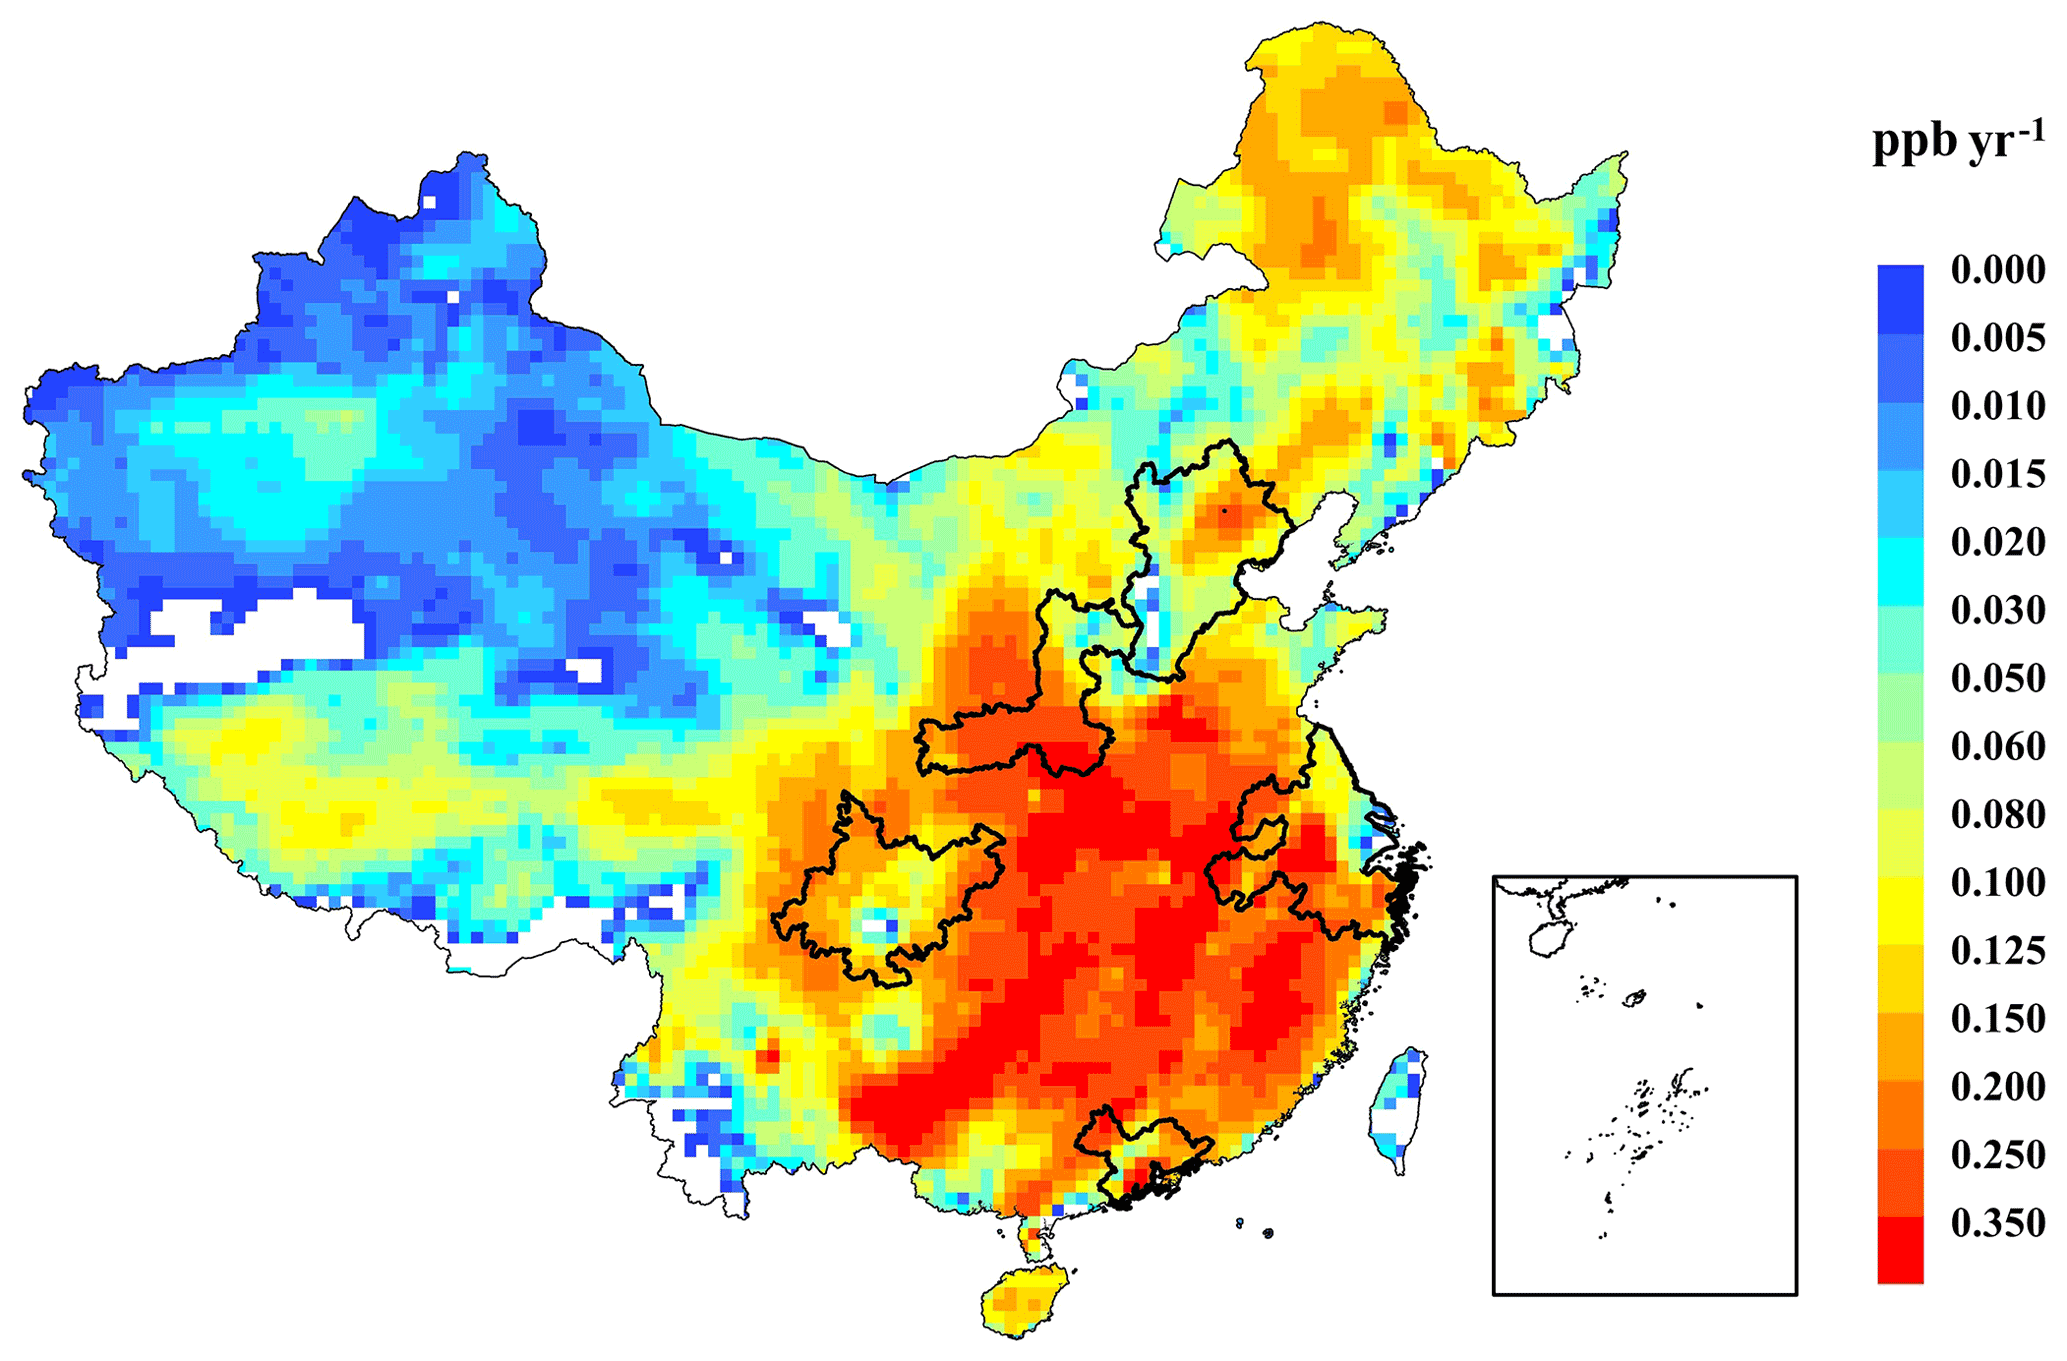
Figure 5Spatial distribution of interannual variations in O3 simulated using annual BVOC emission factors.
Although there is evidence of the overall positive influence of historical BVOC emissions on MDA8 O3, different trends are shown during different periods within 1981–2018. In the 1980s, due to the demand for social development, urban land continued to expand, resulting in massive deforestation. The decrease of forest biomass led to a decrease in BVOC emissions, resulting in little change in O3 concentration (only 0.03 ppb) from 1981 to 1988. In order to offset the deterioration of the ecological environment caused by a large amount of deforestation, large-scale afforestation activities have been carried out all over the country, and forest biomass has been increasing. Most of the planted species selected for this ecological project were broadleaf trees with high emission potential (Klinger et al., 2002). During 1988 and 2018, the forest volume and crop production increased by 6.60 × 10⁹ m2 and 1487.25 × 106 t, respectively. As a result, the vegetation leaf biomass continued to grow by 95.89 %, which led to 3.58 ppb O3 enhancement by 6.88 %. Among the annual growth rates, the growth was the biggest in 2003, with an increase of 1.99 % compared with 1998.

The interannual variations in O3 have significant differences among the five key regions (Fig. 6). But the overall growth trend can be found. From 1981 to 2018, MDA8 O3 concentration in BTH, YRD, PRD, CC, and FWP increased by 19.87 %, 23.24 %, 22.91 %, 12.71 %, and 15.44 % at average rates of 0.10, 0.22, 0.21, 0.19, and 0.22 ppb yr−1, respectively. This reflects O3 increments of 4.90, 7.70, 9.26, 5.81, and 6.35 ppb, respectively. As the surface O3 in urban areas is more sensitive to VOCs, the increment of O3 concentration caused by BVOC emissions in all the regions is greater than the national average. FWP, YRD, and PRD regions have the highest increasing rates annually, which may be because of the rapid increase in leaf biomass of broadleaf trees with high isoprene emission potential. At the end of the last century, the implementation of the reform and opening-up policy led to the continuous acceleration of the level of urbanization and the reduction of forest and arable land biomass, eventually resulting in the fluctuating decline of MDA8 O3 in YRD and PRD during 1981–2003. The rapid growth of MDA8 O3 in PRD led to a greater average annual growth rate of MDA8 O3 in PRD than that in YRD from 1981 to 2018. The lowest growth rate occurs in BTH. Due to the Three-North Shelterbelt System Project, the area coverage of natural forest in the north of BTH has more than tripled compared to that in 2003, resulting in an increase in leaf biomass and BVOC emissions (Ma et al., 2019). However, because of the rapid urbanization in Beijing, a large amount of forest has been converted to urban construction land, and the reduction of BVOC emission related to losses of trees may offset part of their increase associated with rising coverage and volume in the surrounding areas.
3.3.2 SOA
The historically varied BVOC emissions caused by changes in leaf biomass had a significant influence on SOA formation in China from 1981–2018 according to our simulation. The national SOA was enhanced at an annual rate of 0.01 µg m−3, showing a significantly increasing trend (p<0.05). As shown in Fig. 7, which depicts the spatial distributions of interannual changes in SOA, most of southern China shows a significantly increasing trend, with an average growth rate higher than 0.02 µg m−3, even > 0.03 µg m−3 in some areas. It is mainly because of the continuous expansion of vegetation coverage and increase of biomass, which results in enhanced BVOC emissions. Monoterpene is the biggest contributor to BSOA, as described in Sect. 3.2.2. The spatial distribution of monoterpene emissions is consistent with that of needleleaf trees. The leaf biomass of needleleaf trees increased from 118.68 × 10¹² to 212.04 × 10¹² g during 1981–2018. Needleleaf trees are densely distributed in southern China, including Masson pine, spruce, and hemlock, with high monoterpene emission rates (Li et al., 2020). The highest average annual growth rates of SOA occur in the intersecting area of southwest and southeast China, and then the growth rate gradually declines to the surrounding areas. This can be partly attributed to the spatial distribution and increasing volume of needleleaf trees in the southwest forest area. The lowest growth is found in the northwestern areas, Hainan, and southwest Yunnan. Some of these areas show negative growth. In northwestern areas, BVOCs, especially monoterpene emissions, experienced the weakest growth, and some even decrease. Although the ecological shelterbelt projects were conducted in northwest China, broadleaf tree species were mostly planted with lower monoterpene emissions. Because of the tropical climate in southwestern Yunnan and Hainan, needleleaf trees with greater monoterpene emission potential are less distributed, and the change of leaf biomass is small, which led to small or even negative changes in the growth of SOA.
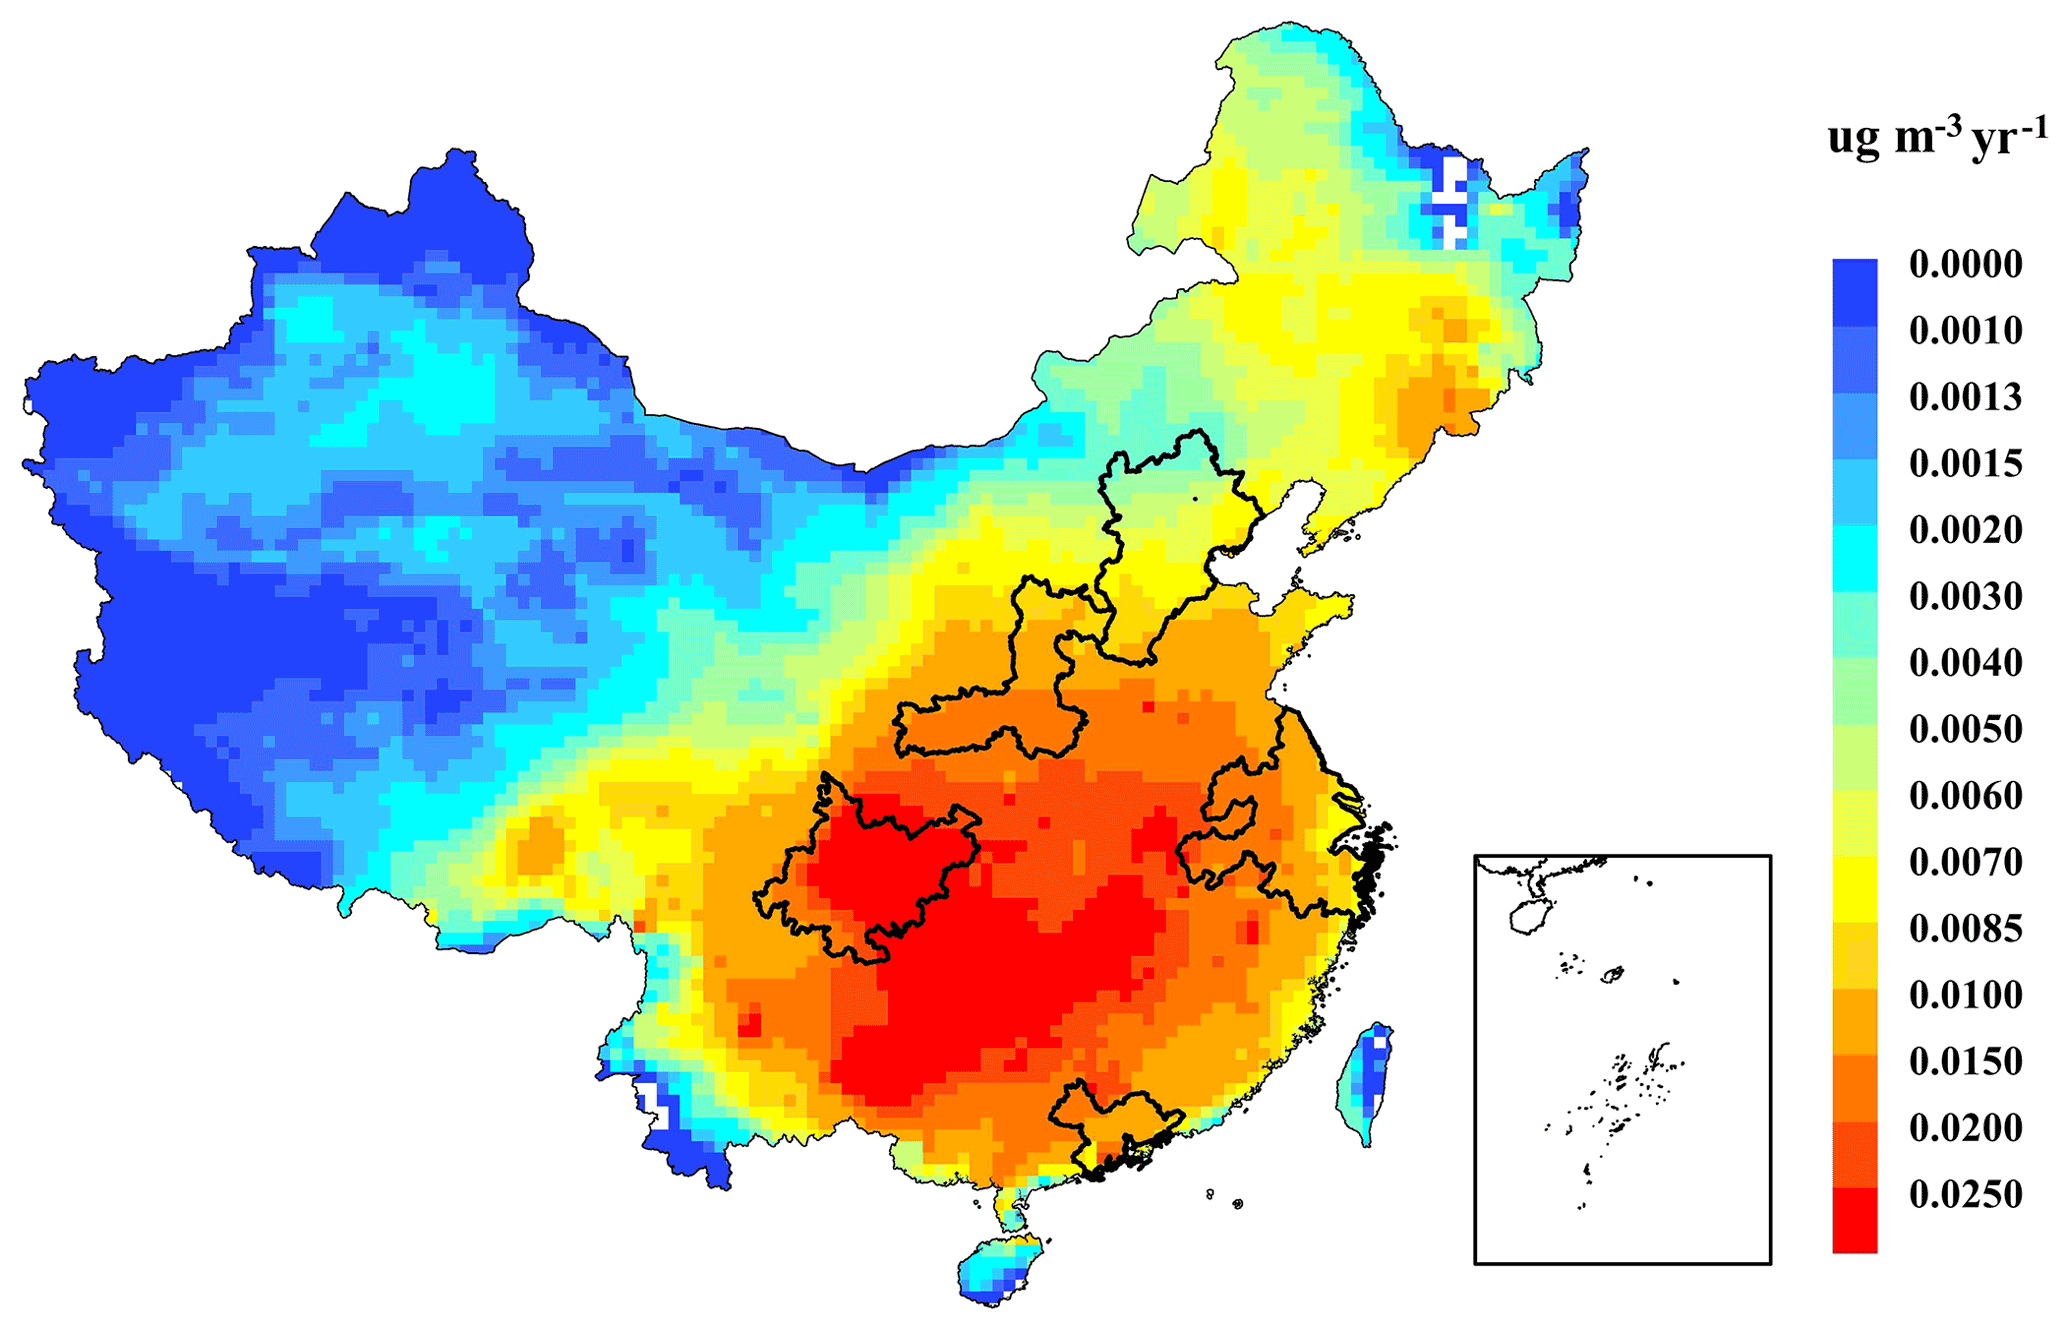
Figure 7Spatial distribution of interannual variations in SOA simulated using annual BVOC emission factors.
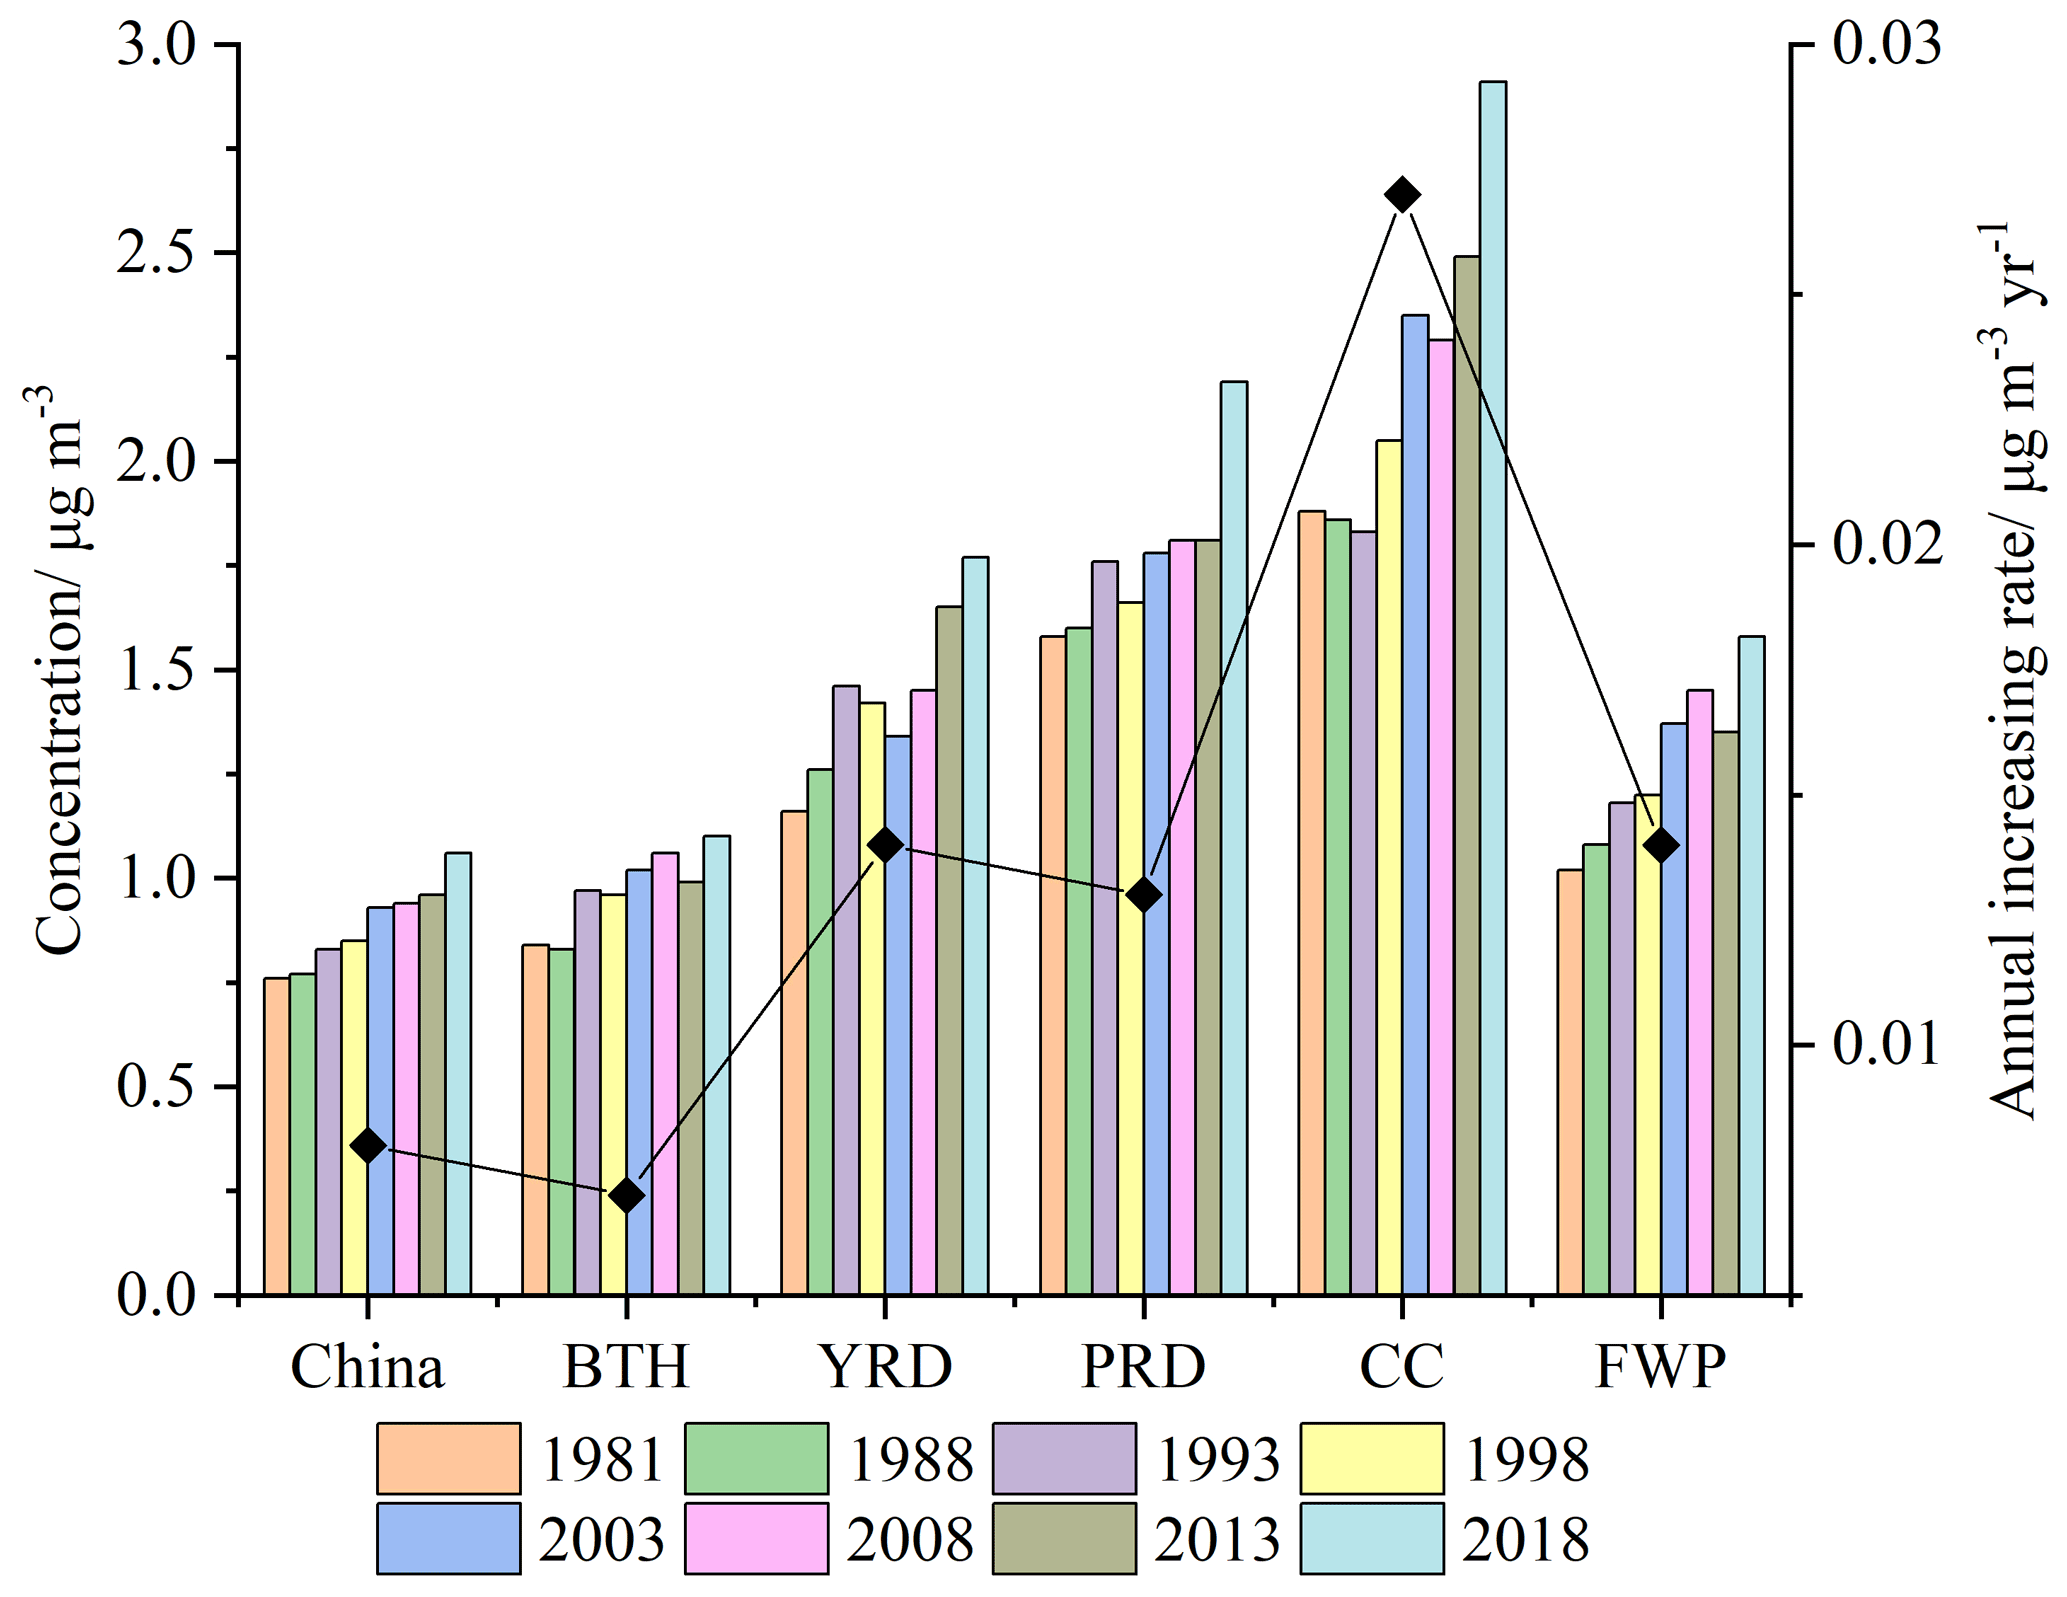
The national average SOA in 2018 is 1.06 µg m−3, 39.30 % higher than that in 1981. In the past 40 years, China has had an overall growth for the SOA from BVOCs and a more rapid growth in 2003 and 2018. The historical SOA concentrations and their changes in BTH, YRD, PRD, CC, and FWP regions are presented in Fig. 8. They underwent SOA increments of 31.08 %, 53.21 %, 37.97 %, 54.61 %, and 54.57 % during 1981–2018, at average rates of 0.007, 0.014, 0.013, 0.027, and 0.014 µg m−3 yr−1, respectively. CC is the region with the largest annual increasing rate since it has the more significantly enhanced leaf biomass of needleleaf trees and crops, which contribute much to monoterpene emissions. In BTH, SOA annual growth rate is the lowest and lower than the national average rate. It can be attributed to the obvious decrease of leaf biomass, with 17.57 × 10¹² g from 1998 to 2008. With a similar overall growth rate, however, YRD and PRD have different interannual variability. YRD experienced two stages of increasing before and after 2003. In PRD, SOA showed a striking growth during the last 5 years owing to the increase of leaf biomass by up to 4.21 × 10¹² g. To sum up, there are significant increases in SOA in the five key regions, but they have marked differences in the regularity of growth due to the different changes of leaf biomass over time.
BVOC emissions play a key role in the formation of O3 and SOA. In the summer of 2018, China's BVOC emissions of 9.91 Tg cause ambient O3 and SOA concentrations to increase by 8.6 ppb (16.75 %) and 0.84 µg m−3 (73.15 %) on average, respectively. The impacts of BVOCs have an obvious spatial difference: O3 and SOA in most southern regions show high sensitivities to BVOCs. Due to the different emissions and level of biogenic and anthropogenic precursors, BVOC emissions have distinguished impacts in different regions. The CC region has the highest O3 and SOA generated by BVOCs. Some areas with equivalently high BVOC emissions, however, have different contributions to O3, such as northeastern and southern China. The impacts of BVOCs are affected not only by the relative abundance of biogenic and anthropogenic VOCs, but also by the ratio. The sensitivity to BVOCs differs over regions. Decreasing BVOC emissions by planting plants with low emission potential may contribute to O3 pollution control in most regions of southern, central, and northeastern China. For the abatement of BSOA in summer, the decreased plantation of needleleaf trees or the replacement by trees with low monoterpene emission potential is expected to be helpful.
Considering the increasing vegetation coverage and greening trend in China in recent decades (Chen et al., 2019; Piao et al., 2015), the resultant changes in leaf biomass will influence BVOC emissions, which then affect the formation of O3 and SOA. The interannual variation of BVOC emissions caused by increasing leaf biomass results in significant increases (p<0.05) of O3 and SOA concentrations at average rates of 0.11 ppb yr−1 and 0.008 µg m−3 yr−1, respectively. It shows different interannual variations, which can be attributed to the differences in changing trends of leaf biomass. The southern region with an obvious increase of leaf biomass showed large enhancement of O3 and SOA. In the future, in order to achieve the goal of carbon neutrality, China will not only reduce carbon emissions through energy conservation and emission reduction, but also increase carbon sinks through the development of carbon sequestration technologies and biological carbon sinks (Wang and Zhang, 2020). Increasing forest carbon sinks will inevitably lead to an increase in vegetation coverage, so that BVOC emissions will continue to increase, leading to higher contributions to O3 and SOA production in the future. Therefore, studying the influence of land cover changes on BVOC emissions and their impact on the generation of O3 and SOA is of great significance for future research studies on the precise prevention and control of air pollution in China in the context of fighting climate change.
In this study, we aimed to explore the impact of interannual BVOC emission variations on O3 and SOA caused by vegetation biomass variability. The historical O3 and SOA concentrations were simulated by fixing the anthropogenic emissions and meteorological data in 2008. The influences of annual meteorology on BVOC emissions and formation of secondary air pollutants were not considered. Although vegetation change is the main driver of interannual variations of BVOC emissions, it still brings uncertainty to the simulation in this study. Future work can update the anthropogenic emission inventory and use dynamic meteorological data to explore multivariate effects and provide more accurate data for evaluating the roles of biogenic emissions in air quality. At the same time, the impact of meteorological changes on the long-term changes of BVOC emissions and formation of secondary air pollutants should also be considered to provide a scientific basis for the precise prevention and control of air pollution in response to climate change.
The code and data used in this study are available upon request from the corresponding author, Lingyu Li (lilingyu@qdu.edu.cn).
The supplement related to this article is available online at: https://doi.org/10.5194/acp-22-2351-2022-supplement.
LL planned and organized the project. SS provided the code, JC performed the simulation, analysis, and writing, and YH made adjustments to the paper's visualization. SX, YH, and LL revised the manuscript.
The contact author has declared that neither they nor their co-authors have any competing interests.
Publisher's note: Copernicus Publications remains neutral with regard to jurisdictional claims in published maps and institutional affiliations.
This work was supported by the National Natural Science Foundation of China (42075103, 41705098) and the Science and Technology Support Plan for Youth Innovation of Colleges and Universities of Shandong Province of China (DC2000000961).
This research has been supported by the National Natural Science Foundation of China (grant nos. 42075103 and 41705098) and the Science and Technology Support Plan for Youth Innovation of Colleges and Universities of Shandong Province of China (grant no. DC2000000961).
This paper was edited by Bryan N. Duncan and reviewed by two anonymous referees.
Bai, J., Guenther, A., Turnipseed, A., and Duhl, T.: Seasonal and interannual variations in whole-ecosystem isoprene and monoterpene emissions from a temperate mixed forest in Northern China, Atmos. Pollut. Res., 6, 696–707, https://doi.org/10.5094/APR.2015.078, 2015.
Bai, J., Guenther, A., Turnipseed, A., Duhl, T., Yu, S., and Wang, B.: Seasonal variations in whole-ecosystem BVOC emissions from a subtropical bamboo plantation in China, Atmos. Environ., 124, 12–21, https://doi.org/10.1016/j.atmosenv.2015.11.008, 2016.
Bai, J., Guenther, A., Turnipseed, A., Duhl, T., and Greenberg, J.: Seasonal and interannual variations in whole-ecosystem BVOC emissions from a subtropical plantation in China, Atmos. Environ., 161, 176–190, https://doi.org/10.1016/j.atmosenv.2017.05.002, 2017.
Bai, J. H. and Hao, N.: The relationships between biogenic volatile organic compound (BVOC) emissions and atmospheric formaldehyde in a subtropical Pinus plantation in China, Ecol. Environ. Sci., 27, 991–999, https://doi.org/10.16258/j.cnki.1674-5906.2018.06.001, 2018.
Cao, T. W., Wu, K., Kang, P., Wen, X. H., Li, H., Wang, Y., Lu, X. Y., Li, A. Q., Pan, W. H., Fan, W. B., Yi, R., Bao, X. B., and He, M. Q.: Study on ozone pollution characteristics and meteorological cause of Chengdu-Chongqing urban agglomeration, Acta Sci. Circum., 38, 1275–1284, https://doi.org/10.13671/j.hjkxxb.2017.0460, 2018.
Carslaw, K. S., Boucher, O., Spracklen, D. V., Mann, G. W., Rae, J. G. L., Woodward, S., and Kulmala, M.: A review of natural aerosol interactions and feedbacks within the Earth system, Atmos. Chem. Phys., 10, 1701–1737, https://doi.org/10.5194/acp-10-1701-2010, 2010.
Chen, C., Park, T., Wang, X., Piao, S., Xu, B., Chaturvedi, R. K., Fuchs, R., Brovkin, V., Ciais, P ., Fensholt, R., Tømmervik, H., Bala, G., Zhu, Z., Nemani, R. R., and Myneni, R. B.: China and India lead in greening of the world through land-use management, Nat. Sustain., 2, 122–129, https://doi.org/10.1038/s41893-019-0220-7, 2019.
Claeys, M., Graham, B., Vas, G., Wang, W., Vermeylen, R., Pashynska, V., Cafmeyer, J., Guyon, P., Andreae, M. O., and Artaxo, P.: Formation of secondary organic aerosols through photooxidation of isoprene, Science, 303, 1173–1176, https://doi.org/10.1126/science.1092805, 2004.
Donahue, N. M., Robinson, A. L., Stanier, C. O., and Pandis, S. N.: Coupled partitioning, dilution, and chemical aging of semivolatile organics, Environ. Sci. Technol., 40, 2635–2643, https://doi.org/10.1021/es052297c, 2006.
Emanuelsson, E. U., Hallquist, M., Kristensen, K., Glasius, M., Bohn, B., Fuchs, H., Kammer, B., Kiendler-Scharr, A., Nehr, S., Rubach, F., Tillmann, R., Wahner, A., Wu, H.-C., and Mentel, Th. F.: Formation of anthropogenic secondary organic aerosol (SOA) and its influence on biogenic SOA properties, Atmos. Chem. Phys., 13, 2837–2855, https://doi.org/10.5194/acp-13-2837-2013, 2013.
Fan, H., Zhao, C. F., and Yang, Y. K.: A comprehensive anal ysis of the spatio-temporal variation of urban air pollution in China during 2014–2018, Atmos. Environ., 220, 1–12, https://doi.org/10.1016/j.atmosenv.2019.117066, 2020.
Fu, Y. and Liao, H.: Simulation of the interannual variations of biogenic emissions of volatile organic compounds in China: Impacts on tropospheric ozone and secondary organic aerosol, Atmos. Environ., 59, 170–185, https://doi.org/10.1016/j.atmosenv.2012.05.053, 2012.
Gao, C., Zhang, X. L., Xiu, A. J., Huang, L., and Zhao, H. M., Wang, K., Tong, Q. Q.: Spatiotemporal distribution of biogenic volatile organic compounds emissions in China, Acta Sci. Circum., 39, 4140–4151, https://doi.org/10.13671/j.hjkxxb.2019.0243, 2019.
Grell, G. A., Peckham, S. E., Schmitz, R., McKeen, S. A., Frost, G., Skamarock, W. C., and Eder, B.: Fully coupled “online” chemistry within the WRF model, Atmos. Environ., 39, 6957–6975, https://doi.org/10.1016/j.atmosenv.2005.04.027, 2005.
Guenther, A., Zimmerman, P., and Wildermuth, M.: Natural volatile organic compound emission rate estimates for U.S. woodland landscapes, Atmos. Environ., 28, 1197–1210, https://doi.org/10.1016/1352-2310(94)90297-6, 1994.
Guenther, A., Hewitt, C. N., Erickson, D., Fall, R., Geron, C., Graedel, T., Harley, P ., Klinger, L., Lerdau, M., McKay, W. A., Pierce, T., Scholes, B., Steinbrecher, R., Tallamraju, R., Taylor, J., and Zimmerman, P.: A global model of natural volatile organic compound emissions, J. Geophys. Res., 100, 8873, https://doi.org/10.1029/94jd02950, 1995.
Guenther, A. B., Jiang, X., Heald, C. L., Sakulyanontvittaya, T., Duhl, T., Emmons, L. K., and Wang, X.: The Model of Emissions of Gases and Aerosols from Nature version 2.1 (MEGAN2.1): an extended and updated framework for modeling biogenic emissions, Geosci. Model Dev., 5, 1471–1492, https://doi.org/10.5194/gmd-5-1471-2012, 2012.
Gupta, M. and Mohan, M.: Validation of WRF/Chem model and sensitivity of chemical mechanisms to ozone simulation over megacity Delhi, Atmos. Environ., 122, 220–229, 2015.
Hallquist, M., Wenger, J. C., Baltensperger, U., Rudich, Y., Simpson, D., Claeys, M., Dommen, J., Donahue, N. M., George, C., Goldstein, A. H., Hamilton, J. F., Herrmann, H., Hoffmann, T., Iinuma, Y., Jang, M., Jenkin, M. E., Jimenez, J. L., Kiendler-Scharr, A., Maenhaut, W., McFiggans, G., Mentel, Th. F., Monod, A., Prévôt, A. S. H., Seinfeld, J. H., Surratt, J. D., Szmigielski, R., and Wildt, J.: The formation, properties and impact of secondary organic aerosol: current and emerging issues, Atmos. Chem. Phys., 9, 5155–5236, https://doi.org/10.5194/acp-9-5155-2009, 2009.
Henze, D. K. and Seinfeld, J. H.: Global secondary organic aerosol from isoprene oxidation, Geophys. Res. Lett., 33, 6–9, https://doi.org/10.1029/2006GL025976, 2006.
Hoffmann, T., Odum, J. R., Bowman, F., Collins, D., Klockow, D., Flagan, R. C., and Seinfeld, J. H.: Formation of organic aerosols from the oxidation of biogenic hydrocarbons, J. Atmos. Chem., 26, 189–222, https://doi.org/10.1023/A:1005734301837, 1997.
Hoshyaripour, G., Brasseur, G., Andrade, M. F., Gavidia-Calder, M., Bouarar, I., and Ynoue, R. Y.: Prediction of ground-level ozone concentration in Sao Paulo, Brazil: deterministic versus statistic models, Atmos. Environ., 145, 365–375, https://doi.org/10.1016/j.atmosenv.2016.09.061, 2016.
Hu, J., Wang, P., Ying, Q., Zhang, H., Chen, J., Ge, X., Li, X., Jiang, J., Wang, S., Zhang, J., Zhao, Y., and Zhang, Y.: Modeling biogenic and anthropogenic secondary organic aerosol in China, Atmos. Chem. Phys., 17, 77–92, https://doi.org/10.5194/acp-17-77-2017, 2017.
Jin, X. and Holloway, T.: Spatial and temporal variability of ozone sensitivity over China observed from the ozone monitoring instrument, J. Geophys. Res.-Atmos., 120, 7229–7246, https://doi.org/10.1002/2015jd023250, 2015.
Kelly, J. M., Doherty, R. M., O'Connor, F. M., and Mann, G. W.: The impact of biogenic, anthropogenic, and biomass burning volatile organic compound emissions on regional and seasonal variations in secondary organic aerosol, Atmos. Chem. Phys., 18, 7393–7422, https://doi.org/10.5194/acp-18-7393-2018, 2018.
Klinger, L. F., Li, Q. J., Guenther, A. B., Greenberg, J. P., Baker, B., and Bai, J. H.: Assessment of volatile organic compound emissions from ecosystems of China, J. Geophys. Res.-Atmos., 107, 16–21, https://doi.org/10.1029/2001jd001076, 2002.
Kota, S. H., Schade, G., Estes, M., Boyer, D., and Ying, Q.: Evaluation of MEGAN predicted biogenic isoprene emissions at urban locations in Southeast Texas, Atmos. Environ., 110, 54–64, https://doi.org/10.1016/j.atmosenv.2015.03.027, 2015.
Li, J., Li, L. Y., Wu, R. R., Li, Y. Q., Bo, Y., and Xie, S. D.: Inventory of highly resolved temporal and spatial volatile organic compounds emission in China, Air. Pollut., 207, 79–86, https://doi.org/10.2495/AIR160081, 2016.
Li, K., Jacob, D. J., Liao, H., Shen, L., Zhang, Q., and Bates, K. H.: Anthropogenic drivers of 2013–2017 trends in summer surface ozone in China, P. Natl. Acad. Sci. USA, 116, 422–427, https://doi.org/10.1073/pnas.1812168116, 2019a.
Li, K., Jacob, D. J., Liao, H., Zhu, J., Shah, V., Shen, L., Bates, K. H., Zhang, Q., and Zhai, S.: A two-pollutant strategy for improving ozone and particulate air quality in China, Nat. Geosci., 12, 906–910, https://doi.org/10.1038/s41561-019-0464-x, 2019b.
Li, L., Yang, W., Xie, S., and Wu, Y.: Estimations and uncertainty of biogenic volatile organic compound emission inventory in China for 2008–2018, Sci. Total. Environ., 733, 139301, https://doi.org/10.1016/j.scitotenv.2020.139301, 2020.
Li, L. Y. and Xie, S. D.: Historical variations of biogenic volatile organic compound emission inventories in China, 1981–2003, Atmos. Environ., 95, 185–196, https://doi.org/10.1016/j.atmosenv.2014.06.033, 2014.
Li, L. Y., Chen, Y., and Xie, S. D.: Spatio-temporal variation of biogenic volatile organic compounds emissions in China, Environ. Pollut., 182, 157–168, https://doi.org/10.1016/j.envpol.2013.06.042, 2013.
Li, L. Y., Zhang, B. W., Cao, J., Xie, S. D., and Wu, Y.: Isoprenoid emissions from natural vegetation increased rapidly in eastern China, Environ. Res., 200, 111462, https://doi.org/10.1016/j.envres.2021.111462, 2021.
Li, M., Song, Y., Liu, M., Yao, H., Huang, X., Wang, X., and Zhang, Y.: Impacts of decadal variations in natural emissions due to land-cover changes on ozone production in southern China, Tellus B., 67, 27676, https://doi.org/10.3402/tellusb.v67.27676, 2015.
Li, M., Zhang, Q., Kurokawa, J.-I., Woo, J.-H., He, K., Lu, Z., Ohara, T., Song, Y., Streets, D. G., Carmichael, G. R., Cheng, Y., Hong, C., Huo, H., Jiang, X., Kang, S., Liu, F., Su, H., and Zheng, B.: MIX: a mosaic Asian anthropogenic emission inventory under the international collaboration framework of the MICS-Asia and HTAP, Atmos. Chem. Phys., 17, 935–963, https://doi.org/10.5194/acp-17-935-2017, 2017.
Li, N., He, Q., Greenberg, J., Guenther, A., Li, J., Cao, J., Wang, J., Liao, H., Wang, Q., and Zhang, Q.: Impacts of biogenic and anthropogenic emissions on summertime ozone formation in the Guanzhong Basin, China, Atmos. Chem. Phys., 18, 7489–7507, https://doi.org/10.5194/acp-18-7489-2018, 2018.
Liu, H., Liu, S., Xue, B., Lv, Z., Meng, Z., Yang, X., Xue, T., Yu, Q., and He, K.: Ground-level ozone pollution and its health impacts in China, Atmos. Environ., 173, 223–230, https://doi.org/10.1016/j.atmosenv.2017.11.014, 2018.
Liu, S., Xing, J., Zhang, H., Ding, D., Zhang, F., Zhao, B., Sahu, S. K., and Wang, S.: Climate-driven trends of biogenic volatile organic compound emissions and their impacts on summertime ozone and secondary organic aerosol in China in the 2050s, Atmos. Environ., 218, 117020, https://doi.org/10.1016/j.atmosenv.2019.117020, 2019.
Liu, Y. and Wang, T.: Worsening urban ozone pollution in China from 2013 to 2017 – Part 1: The complex and varying roles of meteorology, Atmos. Chem. Phys., 20, 6305–6321, https://doi.org/10.5194/acp-20-6305-2020, 2020.
Liu, Y., Li, L., An, J. Y., Huang, L., Yan, R. S., Huang, C., Wang, H. L., Wang, Q., Wang, M., and Zhang, W.: Estimation of biogenic VOC emissions and its impact on ozone formation over the Yangtze River Delta region, China, Atmos. Environ., 186, 113–128, https://doi.org/10.1016/j.atmosenv.2018.05.027, 2018.
Lu, H., Lyu, X., Cheng, H., Ling, Z., and Guo, H.: Overview on the spatial-temporal characteristics of the ozone formation regime in China, Environ. Sci., 21, 916–929, https://doi.org/10.1039/C9EM00098D, 2019.
Lyu, X. P., Chen, N., Guo, H., Zhang, W. H., Wang, N., Wang, Y., and Liu, M.: Ambient volatile organic compounds and their effect on ozone production in Wuhan, central China, Sci. Total Environ., 541, 200–209, https://doi.org/10.1016/j.scitotenv.2015.09.093, 2016.
Ma, M., Gao, Y., Wang, Y., Zhang, S., Leung, L. R., Liu, C., Wang, S., Zhao, B., Chang, X., Su, H., Zhang, T., Sheng, L., Yao, X., and Gao, H.: Substantial ozone enhancement over the North China Plain from increased biogenic emissions due to heat waves and land cover in summer 2017, Atmos. Chem. Phys., 19, 12195–12207, https://doi.org/10.5194/acp-19-12195-2019, 2019.
Milford, J. B., Russell, A. G., and Mcrae, G. J.: A new approach to photochemical pollution-control: Implications of spatial patterns in pollutant responses to reductions in nitrogen-oxides and reactive organic gas emissions, Environ. Sci. Technol., 23, 1290–1301, https://doi.org/10.1021/es00068a017, 1989.
Mutzel, A., Rodigast, M., Iinuma, Y., Böge, O., and Herrmann, H.: Monoterpene SOA – Contribution of first-generation oxidation products to formation and chemical composition, Atmos. Environ., 130, 136–144, https://doi.org/10.1016/j.atmosenv.2015.10.080, 2016.
Ng, N. L., Kwan, A. J., Surratt, J. D., Chan, A. W. H., Chhabra, P. S., Sorooshian, A., Pye, H. O. T., Crounse, J. D., Wennberg, P. O., Flagan, R. C., and Seinfeld, J. H.: Secondary organic aerosol (SOA) formation from reaction of isoprene with nitrate radicals (NO3), Atmos. Chem. Phys., 8, 4117–4140, https://doi.org/10.5194/acp-8-4117-2008, 2008.
Opacka, B., Müller, J.-F., Stavrakou, T., Bauwens, M., Sindelarova, K., Markova, J., and Guenther, A. B.: Global and regional impacts of land cover changes on isoprene emissions derived from spaceborne data and the MEGAN model, Atmos. Chem. Phys., 21, 8413–8436, https://doi.org/10.5194/acp-21-8413-2021, 2021.
Orlando, J. J., Nozière, B., Tyndall, G. S., Orzechowska, G. E., Grazyna, E., Paulson, S. E., and Rudich, Y.: Product studies of the OH- and ozone-initiated oxidation of some monoterpenes, J. Geophys. Res., 105, 11561–11572, https://doi.org/10.1029/2000JD900005, 2000.
Palmer, P. I., Jacob, D. J., Fiore, A. M., Martin, R. V., Chance, K., and Kurosu, T. P.: Mapping isoprene emissions over North America using formaldehyde column observations from space, J. Geophys. Res.-Atmos., 108, 4180, https://doi.org/10.1029/2002JD002153, 2003.
Piao, S., Yin, G., Tan, J., Cheng, L., Huang, M., Li, Y., Liu, R., Mao, J., Myneni, R. B., Peng, S., Poulter, B., Shi, X., Xiao, Z., Zeng, N., Zeng, Z., and Wang, Y.: Detection and attribution of vegetation greening trend in China over the last 30 years, Glob. Change Biol., 21, 1601–1609, https://doi.org/10.1111/gcb.12795, 2015.
Ruppert, L. and Becker, K. H.: A product study of the OH radical-initiated oxidation of isoprene: formation of C5-unsaturated diols, Atmos. Environ., 34, 1529–1542, https://doi.org/10.1016/S1352-2310(99)00408-2, 2000.
Silver, B., Reddington, C. L., Arnold, S. R., and Spracklen, D. V.: Substantial changes in air pollution across China during 2015–2017, Environ. Res. Lett., 13, 114012, https://doi.org/10.1088/1748-9326/aae718, 2018.
Simpson, D., Winiwarter, W., Börjesson, G., Cinderby, S., Ferreiro, A., Guenther, A., Hewitt, C. N., Janson, R., Aslam, K., Khalil, M., Owen, S., Pierce, T. E., Puxbaum, H., Shearer, M., Skiba, U., Steinbrecher, R., Tarrasón, L., and Öquist, M. G.: Inventorying emissions from Nature in Europe, J. Geophys. Res., 104, 8113–8152, https://doi.org/10.1029/98JD02747, 1999.
Situ, S., Guenther, A., Wang, X., Jiang, X., Turnipseed, A., Wu, Z., Bai, J., and Wang, X.: Impacts of seasonal and regional variability in biogenic VOC emissions on surface ozone in the Pearl River delta region, China, Atmos. Chem. Phys., 13, 11803–11817, https://doi.org/10.5194/acp-13-11803-2013, 2013.
Stavrakou, T., Müller, J.-F., Bauwens, M., De Smedt, I., Van Roozendael, M., and Guenther, A.: Impact of Short-Term Climate Variability on Volatile Organic Compounds Emissions Assessed Using OMI Satellite Formaldehyde Observations, Geophys. Res. Lett., 45, 8681–8689, 2018.
Stockwell, W. R., Kirchner, F., Kuhn, M., and Seefeld, S.: A new mechanism for regional atmospheric chemistry modeling, J. Geophys. Res.-Atmos., 102, 25847–25879, https://doi.org/10.1029/97JD00849, 1997.
Sun, L., Xue, L., Wang, Y., Li, L., Lin, J., Ni, R., Yan, Y., Chen, L., Li, J., Zhang, Q., and Wang, W.: Impacts of meteorology and emissions on summertime surface ozone increases over central eastern China between 2003 and 2015, Atmos. Chem. Phys., 19, 1455–1469, https://doi.org/10.5194/acp-19-1455-2019, 2019.
Tan, Z., Lu, K., Jiang, M., Su, R., Dong, H., Zeng, L., Xie, S., Tan, Q., and Zhang, Y.: Exploring ozone pollution in Chengdu, southwestern China: A case study from radical chemistry to O3-VOC-NOx sensitivity, Sci. Total Environ., 636, 775–786, https://doi.org/10.1016/j.scitotenv.2018.04.286, 2018.
Tasoglou, A. and Pandis, S. N.: Formation and chemical aging of secondary organic aerosol during the β-caryophyllene oxidation, Atmos. Chem. Phys., 15, 6035–6046, https://doi.org/10.5194/acp-15-6035-2015, 2015.
Wang, C. and Zhang, X. Y.: Implementation pathway and policy system of carbon neutrality vision, Chinese Journal of Environmental Management, 6, 58–64, https://doi.org/10.16868/j.cnki.1674-6252.2020.06.058, 2020.
Wang, H., Wu, Q., Guenther, A. B., Yang, X., Wang, L., Xiao, T., Li, J., Feng, J., Xu, Q., and Cheng, H.: A long-term estimation of biogenic volatile organic compound (BVOC) emission in China from 2001–2016: the roles of land cover change and climate variability, Atmos. Chem. Phys., 21, 4825–4848, https://doi.org/10.5194/acp-21-4825-2021, 2021.
Wang, P., Ying, Q., Zhang, H., Hu, J., Lin, Y., and Mao, H.: Source apportionment of secondary organic aerosol in China using a regional source-oriented chemical transport model and two emission inventories, Environ. Pollut., 237, 756–766, https://doi.org/10.1016/j.envpol.2017.10.122, 2018.
Wang, P., Chen, Y., Hu, J., Zhang, H., and Ying, Q.: Source apportionment of summertime ozone in China using a sourceoriented chemical transport model, Atmos. Environ., 211, 79–90, https://doi.org/10.1016/j.atmosenv.2019.05.006, 2019.
Wang, Q., Han, Z., Wang, T., and Higano, Y.: An estimate of biogenic emissions of volatile organic compounds during summertime in China, Environ. Sci. Pollut. Res., 14, 69–75, https://doi.org/10.1065/espr2007.02.376, 2007.
Wang, Q. G., Han, Z. W., Wang, T. J., and Zhang, R. J.: Impacts of biogenic emissions of VOC and NOx on tropospheric ozone during summertime in eastern China, Sci. Total. Environ., 395, 41–49, https://doi.org/10.1016/j.scitotenv.2008.01.059, 2008.
Wang, T., Xue, L., Brimblecombe, P., Lam, Y. F., Li, L., and Zhang, L.: Ozone pollution in China: A review of concentrations, meteorological influences, chemical precursors, and effects, Sci. Total Environ., 575, 1582–1596, https://doi.org/10.1016/j.scitotenv.2016.10.081, 2017.
Watne, A. K., Westerlund, J., Hallquist, A. M., Brune, W. H., and Hallquist, M.: Ozone and OH-induced oxidation of monoterpenes: Changes in the thermal properties of secondary organic aerosol (SOA), J. Aerosol Sci., 114, 31–41, https://doi.org/10.1016/j.jaerosci.2017.08.011, 2017.
Wennberg, P. O., Bates, K. H., Crounse, J. D., Dodson, L. G., McVay, R. C., Mertens, L. A., Nguyen, T. B., Praske, E., Schwantes, R. H., Smarte, M. D., St Clair, J. M., Teng, A. P., Zhang, X., and Seinfeld, J. H.: Gas-phase reactions of isoprene and its major oxidation products, Chem. Rev., 118, 3337–3390, https://doi.org/10.1021/acs.chemrev.7b00439, 2018.
Wild, O., Zhu, X., and Prather, M. J.: Fast-J: Accurate simulation of in- and below-cloud photolysis in tropospheric chemical models, J. Atmos. Chem., 37, 245–282, https://doi.org/10.1029/2006JD008007, 2000.
Wu, J., Bei, N., Li, X., Cao, J., Feng, T., Wang, Y., Tie, X., and Li, G.: Widespread air pollutants of the North China Plain during the Asian summer monsoon season: a case study, Atmos. Chem. Phys., 18, 8491–8504, https://doi.org/10.5194/acp-18-8491-2018, 2018.
Wu, K., Yang, X., Chen, D., Gu, S., Lu, Y., Jiang, Q., Wang, K., Ou, Y., Qian, Y., Shao, P., and Lu, S.: Estimation of biogenic VOC emissions and their corresponding impact on ozone and secondary organic aerosol formation in China, Atmos. Res., 231, 104656, https://doi.org/10.1016/j.atmosres.2019.104656, 2020.
Xie, S. Y., Huo, X. Q., Zeng, F. G., and Wang, S. J.: Analysis of ozone pollution in Fenwei Plain from 2015 to 2019, Environmental Monitoring in China, 37, 49–57, https://doi.org/10.19316/j.issn.1002-6002.2021.01.08, 2021.
Yang, W. Z., Cao, J., Wu, Y., Kong, F. L., and Li, L. Y.: Review on plant terpenoid emissions worldwide and in China, Sci. Total. Environ., 787, 147454, https://doi.org/10.1016/j.scitotenv.2021.147454, 2021.
Zhai, S., Jacob, D. J., Wang, X., Shen, L., Li, K., Zhang, Y., Gui, K., Zhao, T., and Liao, H.: Fine particulate matter (PM2.5) trends in China, 2013–2018: separating contributions from anthropogenic emissions and meteorology, Atmos. Chem. Phys., 19, 11031–11041, https://doi.org/10.5194/acp-19-11031-2019, 2019.
Zhang, M., Zhao, C., Yang, Y., Du, Q., Shen, Y., Lin, S., Gu, D., Su, W., and Liu, C.: Modeling sensitivities of BVOCs to different versions of MEGAN emission schemes in WRF-Chem (v3.6) and its impacts over eastern China, Geosci. Model Dev., 14, 6155–6175, https://doi.org/10.5194/gmd-14-6155-2021, 2021.