the Creative Commons Attribution 4.0 License.
the Creative Commons Attribution 4.0 License.
 | 21 Feb 2022
Biogeochemical and biophysical responses to episodes of wildfire smoke from natural ecosystems in southwestern British Columbia, Canada
Sara H. Knox
Ian McKendry
T. Andrew Black
Area burned, number of fires, seasonal fire severity, and fire season length are all expected to increase in Canada, with largely unquantified ecosystem feedbacks. However, there are few observational studies measuring ecosystem-scale biogeochemical (e.g., carbon dioxide exchanges) and biophysical (e.g., energy partitioning) properties during smoke episodes and hence assessing responses of gross primary production (GPP) to changes in incoming diffuse photosynthetically active radiation (PAR). In this study, we leveraged two long-term eddy covariance measurement sites in forest and wetland ecosystems to study four smoke episodes, which happened at different times and differed in length, over 4 different years (2015, 2017, 2018, and 2020). We found that the highest decrease in shortwave irradiance due to smoke was about 50 % in July and August but increased to about 90 % when the smoke arrived in September. When the smoke arrived in the later stage of summer, impacts on sensible and latent heat fluxes were very different than the earlier ones. Smoke generally increased the diffuse fraction (DF) from ∼ 0.30 to ∼ 0.50 and turned both sites into stronger carbon dioxide (CO2) sinks with increased GPP up to ∼ 18 % and ∼ 7 % at the forest and wetland site, respectively. However, when DF exceeded 0.80 as a result of dense smoke, both ecosystems became net CO2 sources as total PAR dropped to low values. The results suggest that this kind of natural experiment is important for validating future predictions of smoke–productivity feedbacks.
- Article
(3124 KB) - Full-text XML
-
Supplement
(1334 KB) - BibTeX
- EndNote


Among the many ecosystem services provided by temperate forests and wetlands in western North America, climate regulation is identified as one of their most important benefits to society (Millennium Ecosystem Assessment, 2005). However, these services are being greatly altered by increasing wildfire occurrences in terms of both frequency and duration (Settele et al., 2015). In addition to affecting visibility and air quality, aerosols arising from biomass burning can alter the radiation budget by scattering and absorbing radiation and hence potentially influence cloud processes (Crutzen and Andreae, 1990). The overall effect of aerosols on climate still remains uncertain according to the latest IPCC assessment (IPCC, 2014). This has triggered enormous interest in the radiative impacts of smoke plumes induced by biomass burning (Chubarova et al., 2012; Lasslop et al., 2019; Markowicz et al., 2017; McKendry et al., 2019; Moreira et al., 2017; Oris et al., 2014; Park et al., 2018; Sena et al., 2013). Heavy smoke conditions were found to cause net surface cooling of 3 ∘C in Amazonia (Yu et al., 2002), while some have observed net radiative cooling at the surface and net radiative warming at the top of the atmosphere in the Arctic and southeastern United States (Markowicz et al., 2017; Taubman et al., 2004), resulting in enhanced atmospheric stability. It has been estimated that aerosol emissions from boreal fires might have a net effect of inducing a positive feedback to global warming (Oris et al., 2014). Jacobson (2014) also suggested a net 20-year global warming of ∼ 0.4 K by including black and brown atmospheric carbon, heat and moisture fluxes, and cloud absorption effects. However, other studies using atmospheric modeling found a net cooling effect of aerosols, which can lead to a net reduction in the global radiative forcing of fires (Landry et al., 2015; Ward et al., 2012).
Changes in solar irradiance, in particular photosynthetically active radiation (PAR, 400–700 nm), affect plant physiological mechanisms that influence photosynthesis (i.e., gross primary production – GPP, net ecosystem exchange of CO2 – NEE, and light use efficiency – LUE). Sub-canopy leaves, especially in forest ecosystems, typically remain under light-deficit conditions. Increasing diffuse radiation makes it easier for PAR photons to penetrate deeper into the canopy (Doughty et al., 2010; Kanniah et al., 2012; Knohl and Baldocchi, 2008; Rap et al., 2015). Additionally, diffuse PAR coming from different angles can increase the efficiency of CO2 assimilated by plants because leaves are generally at different orientations (Alton et al., 2006). This increase in photosynthesis that results from the trade-off between decreased solar radiation and increased PAR scattering is referred to as the diffuse radiation fertilization (DRF) effect (Moreira et al., 2017; Park et al., 2018; Rap et al., 2015). However, DRF has not always been observed under fire smoke conditions and appears to be ecosystem-dependent. For instance, Ezhova et al. (2018) found that the mechanisms causing the increases in GPP are different between the boreal coniferous and mixed forest ecosystems. Some studies suggest that DRF might depend on canopy height and the leaf area index (LAI) (Cheng et al., 2015; Kanniah et al., 2012; Niyogi et al., 2004). For example, Cheng et al. (2015) found an increase in GPP due to diffuse radiation for forest sites but not for cropland sites using AmeriFlux data from 10 temperate climate ecosystems including three forests and seven croplands. Therefore, it is still uncertain how changes in diffuse radiation affect GPP, and it is also unclear how large the effect of aerosols is on diffuse radiation.
With an area of 95 million ha (Ministry of Forests, 2003), British Columbia (BC), Canada, is almost double the size of California, USA. Of that area, almost 64 % is forested with less than one-third of 1 % of BC's forest land harvested annually (Ministry of Forests, Mines and Land, 2010). Wetlands in BC comprise around 5.28 million ha, or approximately 5 % of the land base (Wetland Stewardship Partnership, 2009). Therefore, responses of forests and wetlands to wildfire smoke are very likely to have a significant impact on regional carbon budgets. In western Canada, a previous study found that a short, but severe, wildfire smoke episode in 2015 appreciably changed the energy balance and net CO2 exchange at wetland and forest sites in southwestern BC (McKendry et al., 2019). Another study investigated 2017 and 2018 smoke events in southwestern BC and found that the aerosols from wildfires suppressed the development of deep mountain convective layers and hence inhibited vertical mixing, convection, and cloud development (Ferrara et al., 2020). It is unclear whether the changes in NEE found by McKendry et al. (2019) were due to changes in GPP or ecosystem respiration (Re). Furthermore, biogeochemical and biophysical properties of wetland and forest ecosystems might respond differently to smoke events with different intensities and durations.
In 2015, 2017, 2018, and 2020, southwestern BC experienced smoke episodes that differed in both duration and intensity. In this study, we investigated the effect of those fire events on two natural ecosystems in southwestern BC; one is a temperate forest ecosystem (Douglas fir, Pseudotsuga menziesii) and the other is a wetland ecosystem (restored peatland) (Fig. 1). We aim to provide a better understanding of biogeochemical and biophysical responses to wildfire smoke episodes in natural ecosystems in southwestern BC. Specifically, we aim to (1) evaluate smoke-induced changes in shortwave irradiance, albedo, and energy partitioning at the two sites, (2) assess the biogeochemical responses to smoke by investigating changes in GPP and Re at the two sites, and (3) estimate the maximum effect of smoke on GPP due to changes in the ratio of diffuse to total PAR. Ultimately, we expect to provide a firm foundation for upscaling the impacts of wildfire smoke on the regional CO2 budget.
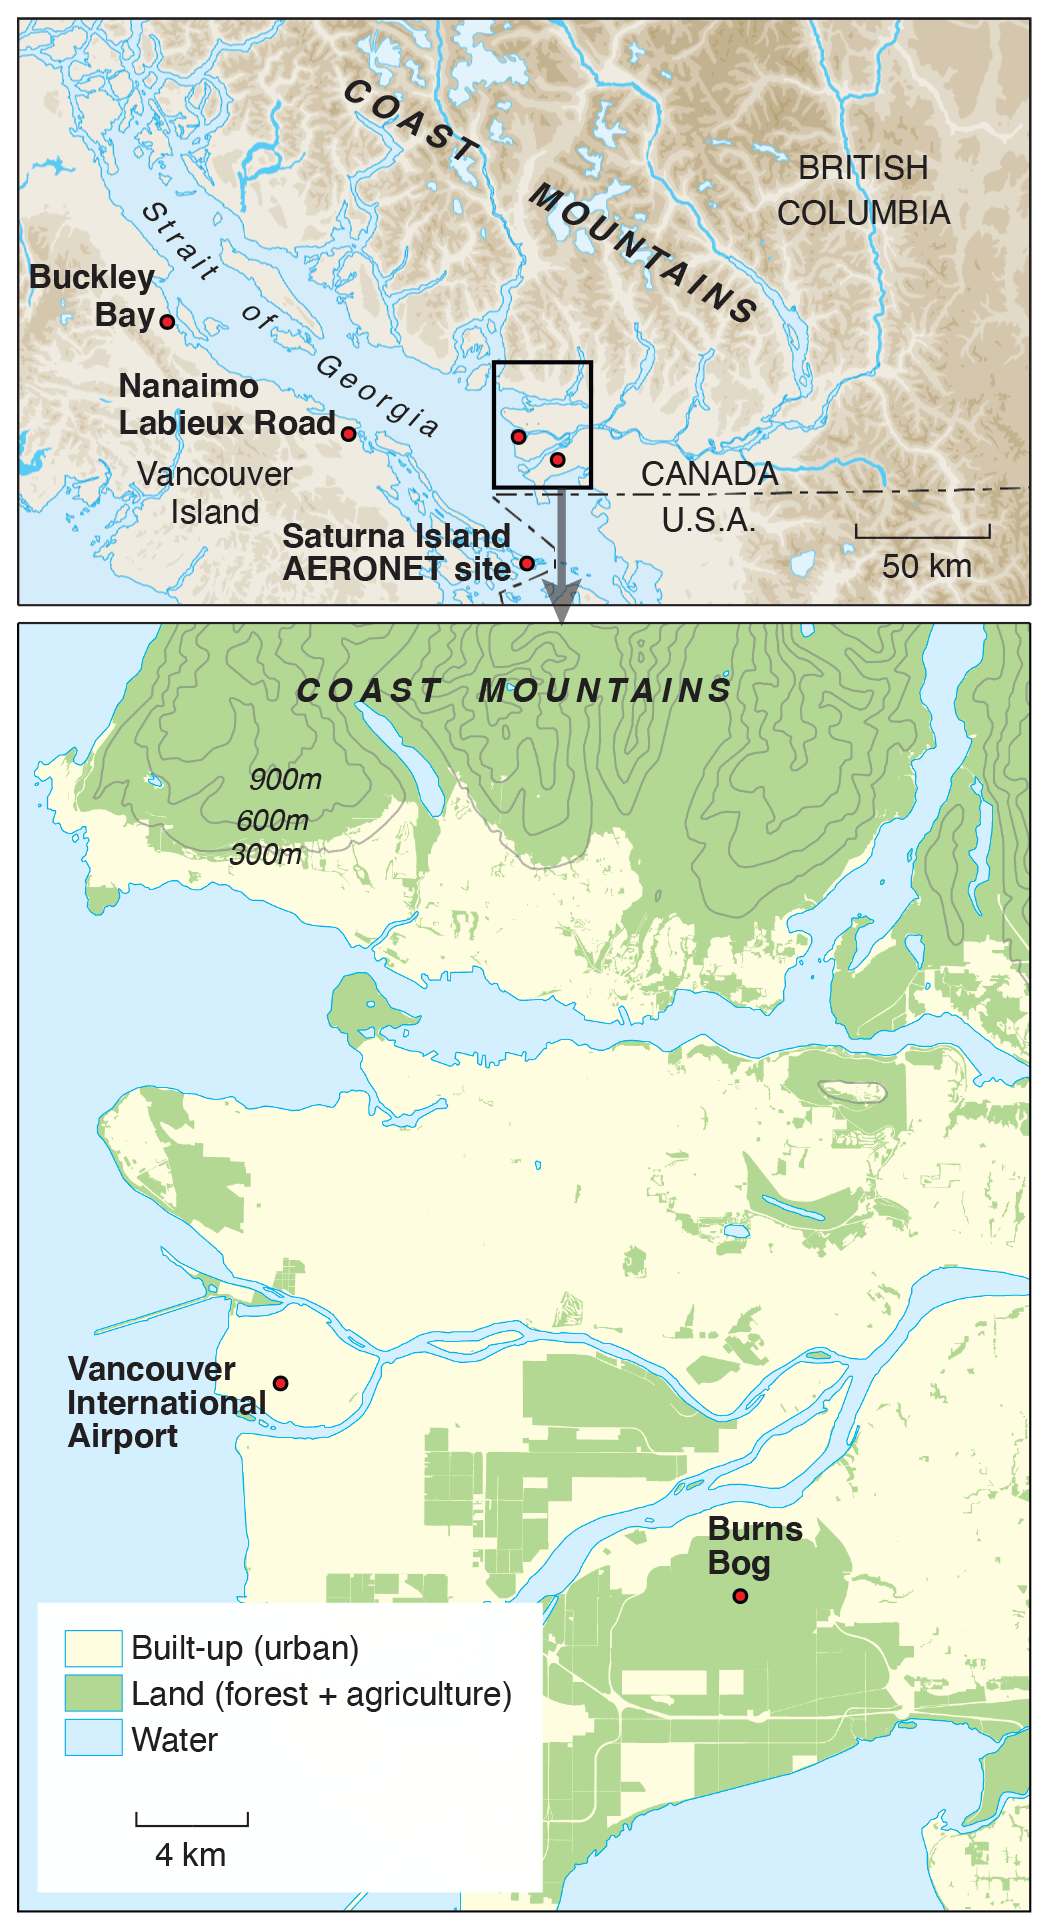
Figure 1Locations of the all sites mentioned in the text. Observations of aerosol optical depth at the reference 500 nm wavelength (AOD500) and particulate matter less than 2.5 µm in diameter (PM2.5) were collected at the Saturna Island AERONET site and Vancouver International Airport, respectively. The ground-level ozone concentrations were measured at Vancouver International Airport and Nanaimo Labieux Road stations. Flux and climate data for wetland and forest ecosystems were measured at Burns Bog and Buckley Bay, respectively.
2.1 Wildfire smoke episodes
2.1.1 Overview
In 2015, there was a series of wildfires across different provinces in Canada. During 4–8 July 2015, smoke spread across most of North America, and a particularly intense event occurring in ∼ 150 km north of Vancouver seriously impacted air quality and visibility in southwestern BC. The detailed evolution and synoptic patterns associated with this event are described in McKendry et al. (2019). In summer 2017, a smoke haze settled over the BC coast due to offshore winds advecting smoke from wildfires in the BC interior. The wildfire season in 2018 eclipsed the previous year's as the worst recorded in BC history, with 2117 fires consuming 1 354 284 ha of land (https://www2.gov.bc.ca/gov/content/safety/wildfire-status/about-bcws/wildfire-history/wildfire-season-summary, last access: 10 February 2022). Smoke covered the BC coast area for approximately 20 d with additional plumes drifting north from similar fires in Washington state, USA. In 2020, BC recorded a quiet fire season with 637 wildfires burning just over 15 000 ha of land between 1 April and 1 October. However, southwestern BC was significantly affected by smoke advected northward from an intense fire season affecting Washington state, Oregon, and California, USA. Notably, the cross-border smoke arrived in September, somewhat later than usual.
2.1.2 AERONET and AEROCAN
The global AERONET (AErosol RObotic NETwork) has been in operation since 1993 and is focused on measurements of vertically integrated aerosol properties using the CIMEL sun photometer and sky radiometer instrument (Holben et al., 1998). AEROCAN CIMELs (AEROCAN is the Canadian sub-network of AERONET) include a facility on Saturna Island, which is located 55 km to the south of the city of Vancouver (Fig. 1). Here, solar irradiance is acquired across eight spectral channels (340, 380, 440, 500, 670, 870, 1020, and 1640 nm) that are transformed into three processing levels of aerosol optical depth (AOD): 1.0 – non-cloud-screened; 1.5 – cloud-screened; and 2.0 – cloud-screened and quality-assured. McKendry et al. (2011) demonstrated the application of these data to the transport of California wildfire plumes. In this paper, we present the level 1.5 AOD data at the reference 500 nm wavelength (AOD500) in order to compare both the magnitude and duration of the four smoke episodes. The AOD500 ranged from 0 to 0.2 on average cloudless summer days on Saturna Island.
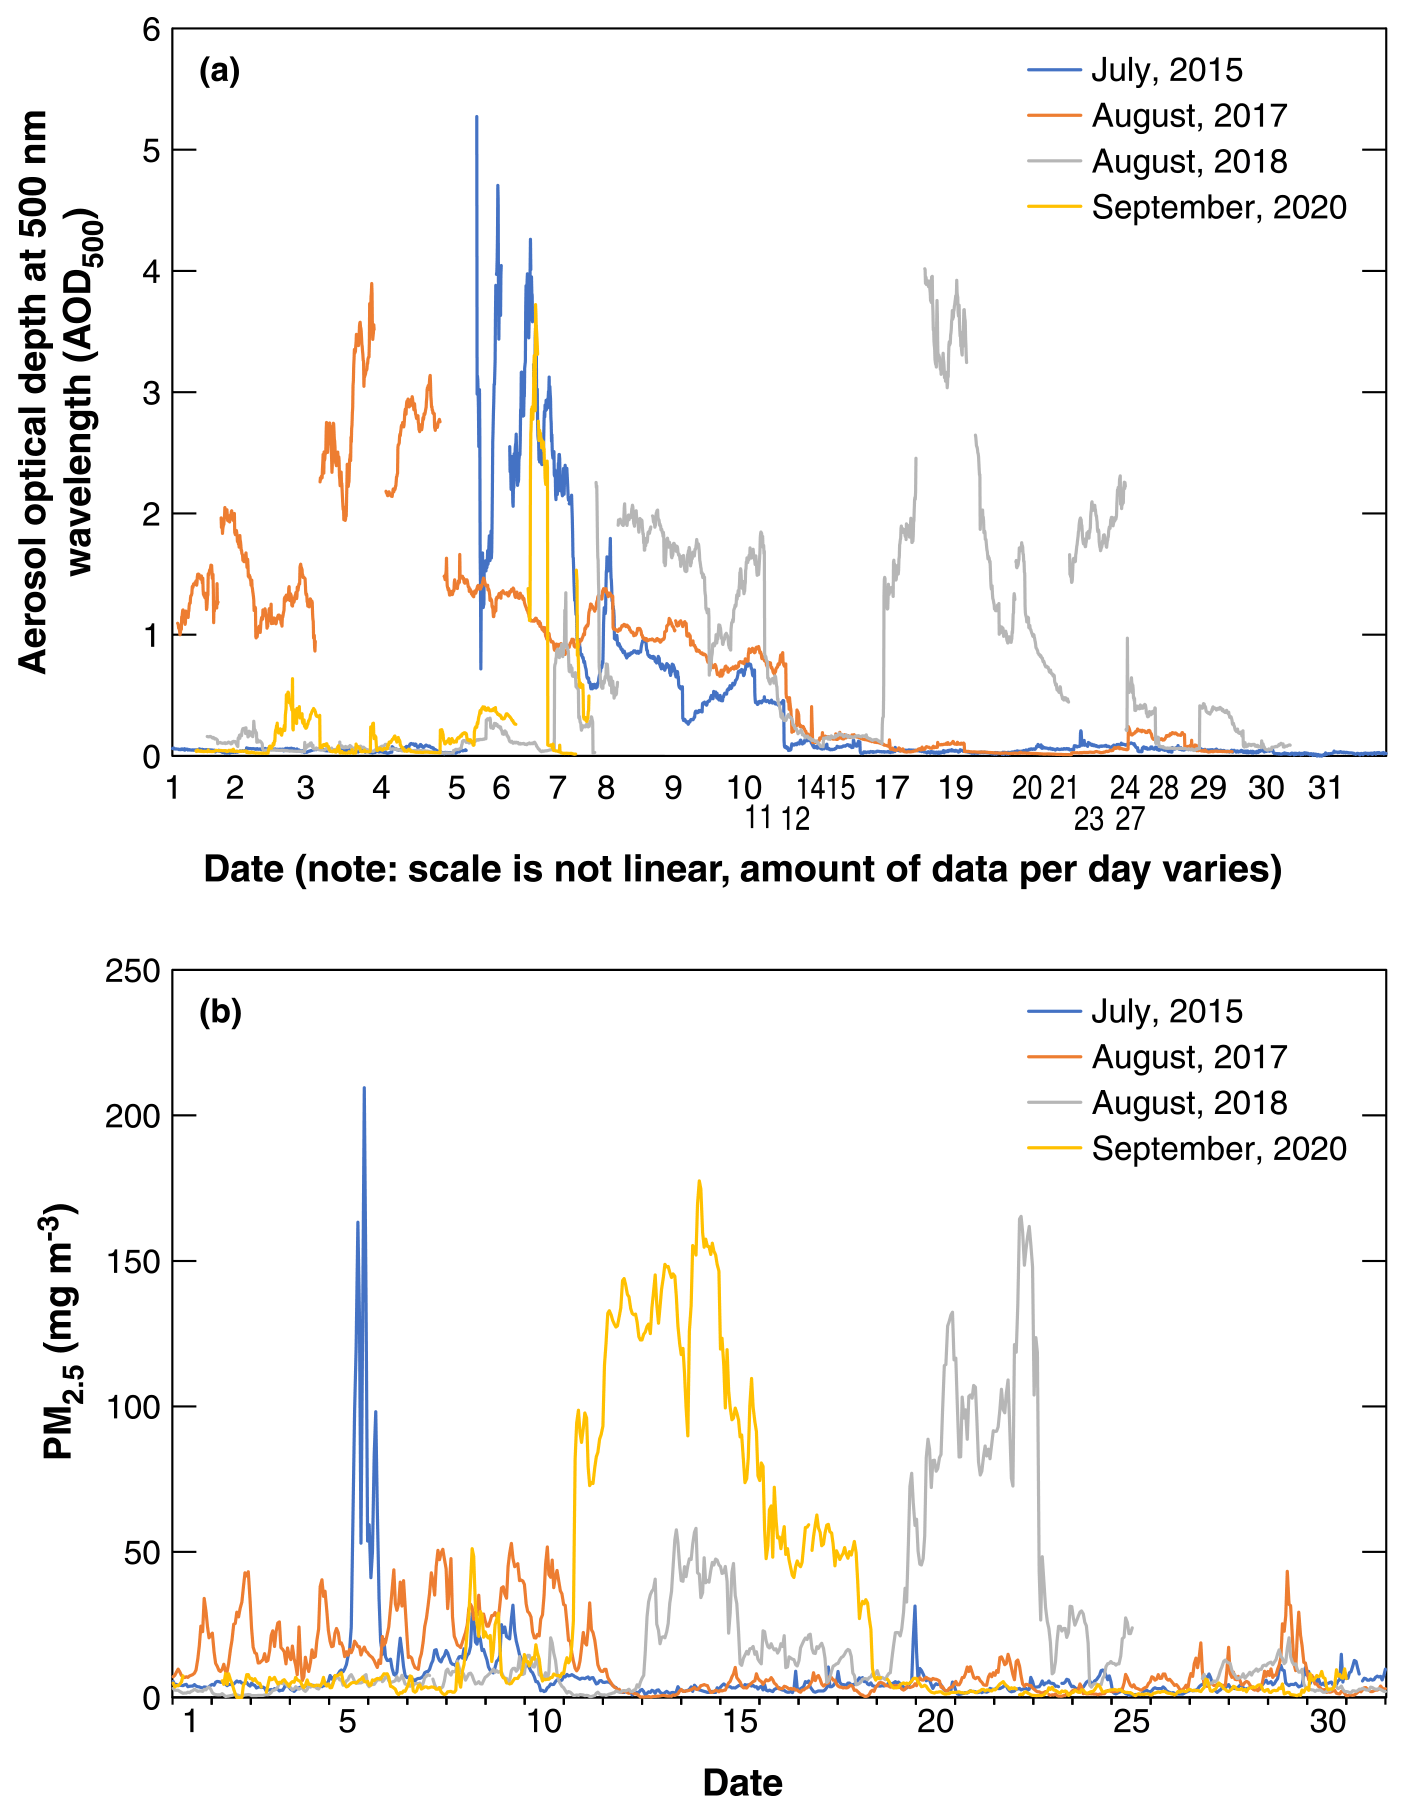
Figure 2(a) AOD500 at Saturna Island and (b) PM2.5 observations at Vancouver International Airport for the 4 months with wildfire smoke in Vancouver, British Columbia, Canada. There are different numbers of AOD500 data points per day in panel (a) and 24 PM2.5 data points per day in panel (b).
The monthly course of AOD500 for each of the four episodes at Saturna Island is shown in Fig. 2a. Due to technical difficulties, numbers of AOD500 data points per day were inconsistent. For each event there were persistent multi-day periods when AOD500 > 2 and reached or exceeded a value of 4. The impact of smoke events on ground-level PM2.5 (particulate matter less than 2.5 µm in diameter) concentrations at Vancouver International Airport is shown in Fig. 2b, and there were 24 PM2.5 data points for each day. From Fig. 2, it is evident that the smoke event of 2015, although the shortest of the four events, was the most intense with both AOD500 > 5 and ground-level PM2.5 concentrations > 200 µg m−3. This is likely due to the close proximity of the fires in this case (McKendry et al. 2019). The event of August 2017 was of somewhat longer duration in which AOD500 peaked at 4 but ground-level concentrations remained comparatively low (< 50 µg m−3), and it showed a strong diurnal pattern associated with boundary layer entrainment from elevated layers (Ferrara et al. 2020). In August 2018 the smoke was persistent and included a double maximum. Ground-level PM2.5 concentrations exceeded 150 µg m−3 and AOD500 reached 4. Finally, the early fall event in September 2020 was also a persistent event in which ground-level concentrations exceeded 150 µg m−3 and AOD500 reached 4. There was evidence in this case of two short peaks in smoke in late September that followed the main event. The impact of smoke events on ground-level ozone concentrations (O3) at Vancouver International Airport and Nanaimo Labieux Road stations on Vancouver Island is shown in Table 1. For all of the study periods, the maximum daily average O3 was below 25 ppb. The averages of the 4 months in the 4 years were ∼ 16 ppb.
Table 1Summaries for the four study periods.
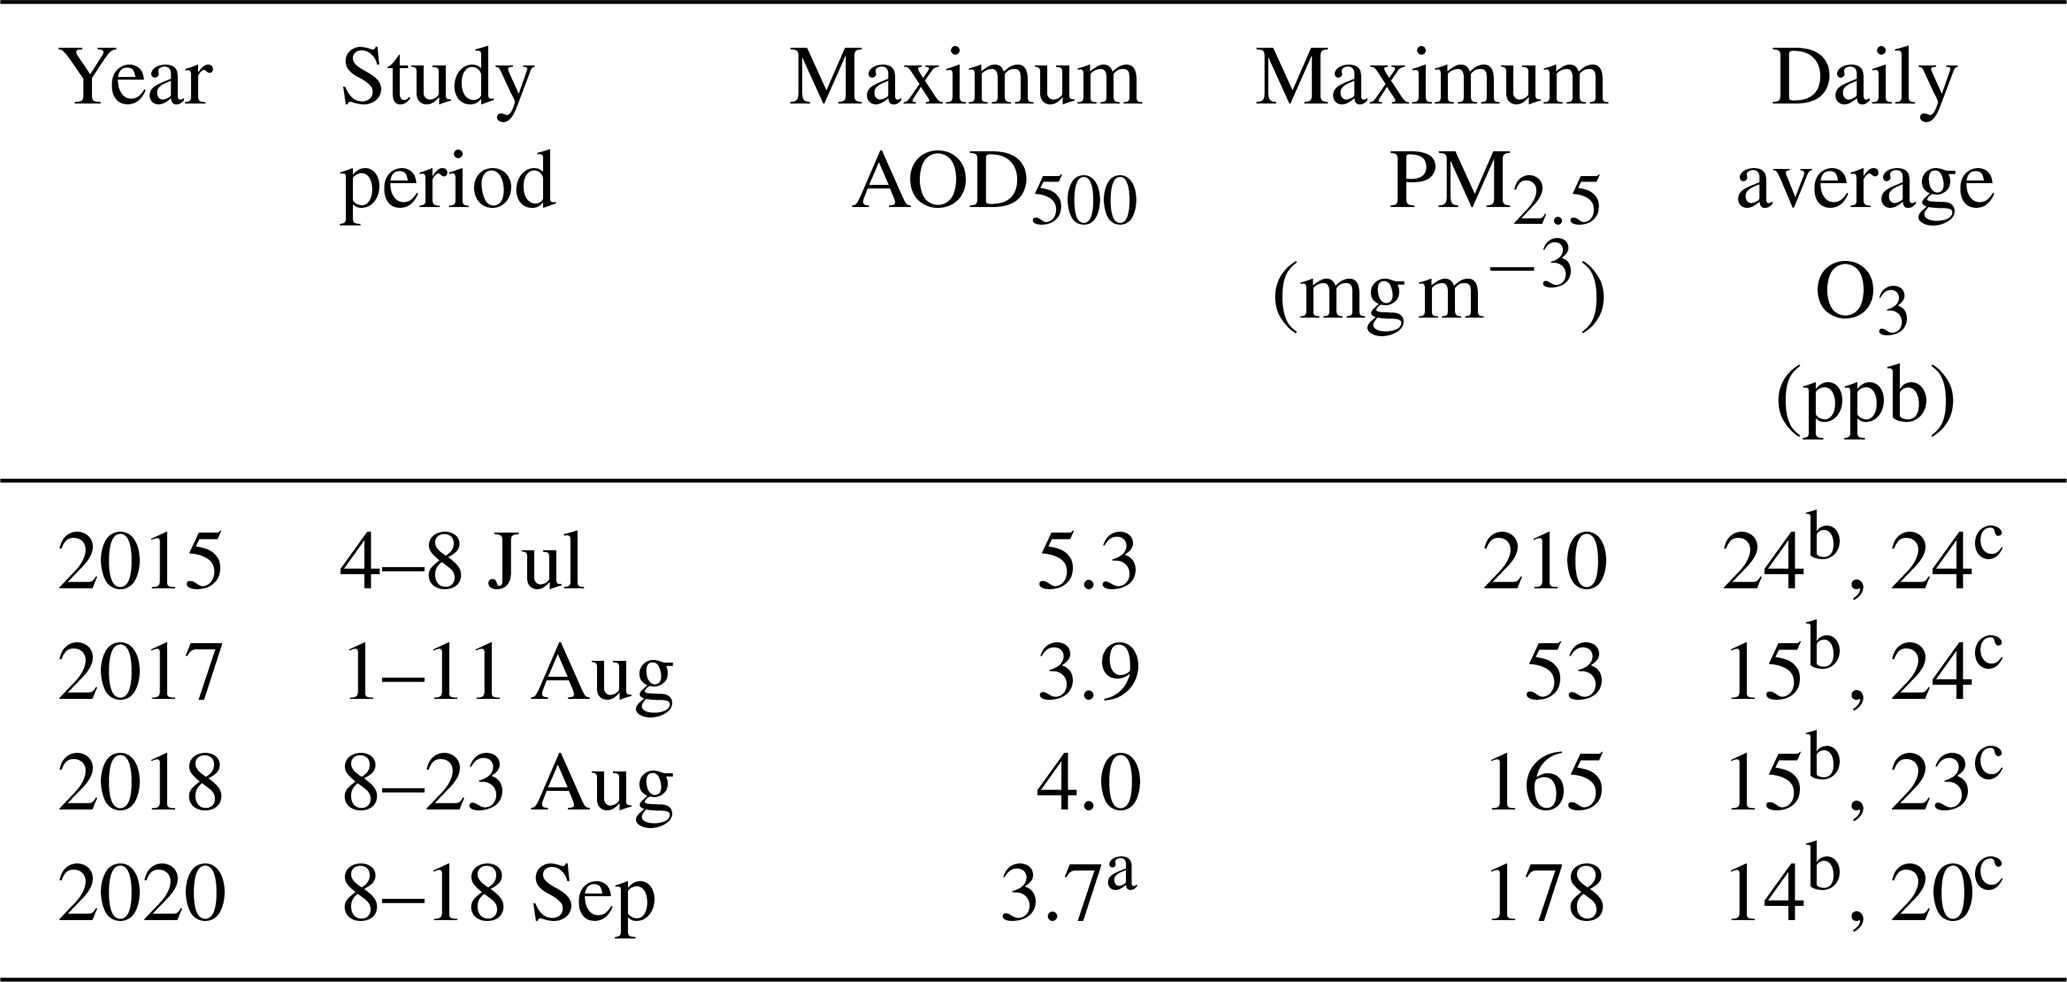
a There were no available observations during the 2020 smoke episode. The value shown here was observed on 6 September 2020. b The measurements were collected at Vancouver International Airport station. The monthly O3 averages were 20, 16, 15, and 15 ppb during July 2015, August 2017, August 2018, and September 2020, respectively. c The measurements were collected at Nanaimo Labieux Road station. The monthly O3 averages were 20, 22, 21, and 18 ppb during July 2015, August 2017, August 2018, and September 2020, respectively.
In summary, the four events were all quite different with respect to intensity of smoke, duration, and impact at ground level (a function of transport height of smoke layers and boundary layer processes). The most similar in character appear to be the 2018 and 2020 events, although it is likely that the “age” and life history of smoke were different for these two cases due to the different geographical sources and distances traveled.
2.1.3 Study periods
Study periods were defined using the following criteria. First, days were selected with AOD500 > 0.5 or PM2.5 > 50 µg m−3. Second, the Hazard Mapping System Fire and Smoke Product from the Office of Satellite and Product Operations at the National Oceanic and Atmospheric Administration was used to plot smoke polygons over the region of southwestern British Columbia. In the final step, we included a day into the study periods when the two sites were covered by the smoke polygon classified in the medium category. The study periods during the 4 months with wildfire smoke and the respective maximum AOD500, PM2.5, and O3 values are summarized in Table 1. To assess how smoke altered biophysical and biogeochemical properties under representative environmental conditions in different months, we compared the study periods with the non-smoky days, which were the remaining days in the same month.
2.2 Radiative and turbulent flux measurements
2.2.1 Wetland site
The rewetted peatland site (AmeriFlux ID: CA-DBB, 122∘59′5.60′′ W, 49∘07′45.59′′ N) (Christen and Knox, 2021) is located in the center of the Burns Bog Ecological Conservancy Area in British Columbia, Canada (Fig. 1). Burns Bog is recognized as the largest raised bog ecosystem on the west coast of Canada (Christen et al., 2016). The 5 m tall flux tower at Burns Bog was built in 2014 and is equipped with an eddy covariance (EC) system to continuously measure turbulent fluxes of sensible heat (H), latent heat (LE), and carbon dioxide (). and the turbulent heat fluxes were computed using the 30 min covariance of turbulent fluctuations in the vertical wind speed and the scalar of interest, and standard quality control involving removing spikes was applied to half-hourly EC-measured fluxes. We applied block averaging and time-lag removal by covariance maximization (Moncrieff et al., 1997). Coordinate rotations were performed so that mean wind speeds for each 30 min averaging interval were zero in the cross-wind and vertical directions. The flux data were further filtered to exclude the errors indicated by the sonic anemometer and gas analyzer diagnostic flags, typically attributable to heavy rainfall or snowfall. Fluxes were also filtered for spikes in 30 min mean mixing ratios, variances, and covariances with thresholds. was corrected by adding the estimated rate of change in CO2 storage in the air column below the EC sensor height to obtain NEE (Hollinger et al., 1994; Morgenstern et al., 2004). After obtaining cleaned fluxes, we filtered NEE and heat fluxes for low friction velocity (u∗). The u∗ threshold was 0.03 m s−1 determined by using the moving-point test (Papale et al., 2006). The algorithm used for u∗ threshold detection was run in R (R Core Team, 2017) by using the REddyProc 1.2-2 R package (Wutzler et al., 2018). NEE was partitioned into GPP and Re using a nighttime-based partitioning method (Reichstein et al., 2005). Four components of radiation (shortwave, longwave, incoming, and outgoing) were continuously measured by a four-component net radiometer (CNR1, Kipp and Zonen, Delft, Holland) on the top of the tower. The surface albedo (α) of the site, i.e., the ratio of the reflected shortwave radiation (K↑) to the shortwave irradiance (K↓), was estimated at noon. Total incoming PAR (PARg) was measured using a quantum sensor (LI-190, LI-COR Inc., Lincoln, NE, USA) at the same height. Several climate variables were also measured (e.g., net radiation – Rn, relative humidity – RH, and water table level). Further details of the site are described in Christen et al. (2016), Lee et al. (2017), and D'Acunha et al. (2019).
2.2.2 Forest site
Buckley Bay (AmeriFlux ID: CA-Ca3) is a flux tower with EC and radiation sensors measuring exchanges between a coniferous forest stand (Douglas fir, planted in 1988) and the atmosphere (Black, 2021). The site is located on the eastern slopes of the Vancouver Island Range, about 150 km to the west of Vancouver (Fig. 1). A 21 m tall, 25 cm triangular open-lattice flux tower was erected in 2001 and equipped with an EC system to continuously measure H, LE, and (Humphreys et al., 2006). In November 2017, this tower was decommissioned, and in June 2017, a 33 m tall walk-up scaffold flux tower (2 m wide × 4 m long) was erected and equipped with an EC system to continuously measure H, LE, and . H, LE, and were calculated and was also corrected by adding the estimated rate of change in CO2 storage in the air column below the EC sensor height to obtain NEE (Hollinger et al., 1994; Morgenstern et al., 2004). Fluxes during low turbulence periods (u∗, less than 0.16 m s−1) were rejected (Lee et al., 2020a). NEE was partitioned into GPP and Re using a nighttime relationship model following the Fluxnet-Canada Research Network procedure (Barr et al., 2004; Chen et al., 2009). Four components of radiation were continuously measured by a CNR1 (Kipp and Zonen) at the 32 m height facing south. α was calculated as at noon as done for the wetland site. PARg was measured using a quantum sensor (LI-190, LI-COR Inc.) at the same height. Incoming diffuse PAR (PARd) was measured at the 32 m height facing south (Sunshine sensor type BF3, Delta-T Devices Ltd, Cambridge, UK). Information on the quantum sensor is described in the next section. Further details of the site are described in Jassal et al. (2009), Krishnan et al. (2009), and Lee et al. (2020b).
2.3 Diffuse photosynthetically active radiation and light use efficiency
As mentioned above, it has been found that the dependence of GPP on the fraction of diffuse PAR (called “DF” hereafter) is ecosystem-dependent. In this study, we estimated the maximum GPP increase using the relationship between LUE and DF, as well as the relationship between total incoming PAR and DF. First, cloudy conditions increase incoming diffuse radiation but also decrease K↓, which can counteract productivity increases due to diffuse radiation alone (Alton, 2008; Letts et al., 2005; Oliphant et al., 2011). Cloudy conditions also affect other meteorological drivers of photosynthesis such as vapor pressure deficit (VPD) and surface temperature that regulate stomatal conductance and can confound quantification of the photosynthetic response to DF (Strada et al., 2015). In order to exclude this, we only included the day that was just before or just after the study periods if it was sunny. Extraterrestrial solar radiation (Kext), the flux density of solar radiation at the outer edge of the atmosphere, was also calculated using date, time, and latitude at the sites to obtain atmospheric bulk transmissivity () and hence determine whether a day was sunny (defined as T > 0.65).
Second, as there was no diffuse PAR measurement at the Burns Bog site, the formula (DF = 1.45–1.81T) following Gu et al. (2002) and Alton (2008) was used to estimate DF for this site. Also, DF was set at 0.95 when T was less than 0.28 and at 0.10 when T was greater than 0.75. DF at the Buckley Bay site in 2015 was estimated using the same method because diffuse PAR measurement was not yet available. For the later three episodes, DF was calculated as PARd measured by the BF3 divided by PARg measured by the quantum sensor.
Following Cheng et al. (2016), LUE (µmol CO2 (µmol photon)−1) was defined as the ratio of mean daily GPP () to mean daily PARg (), which gives GPP = LUE × PARg. Besides DF, air temperature (Ta) and VPD are two additional environmental factors that can influence stomatal conductance and photosynthesis, thus affecting GPP (Cheng et al., 2015). To assess the impacts of changes in Ta and VPD on GPP in addition to DF, we first followed Cheng et al. (2015) to obtain GPP residuals (i.e., GPP changes caused by factors other than direct PAR). The coefficients used in the Michaelis–Menten light response function (rectangular hyperbola) were from Lee et al. (2017) and Lee et al. (2020a) for the wetland and forest sites, respectively. After obtaining GPP residuals, we used Eqs. (3) and (4) in Cheng et al. (2015) to estimate the proportions of variation in GPP residuals explained by DF, Ta, and VPD.
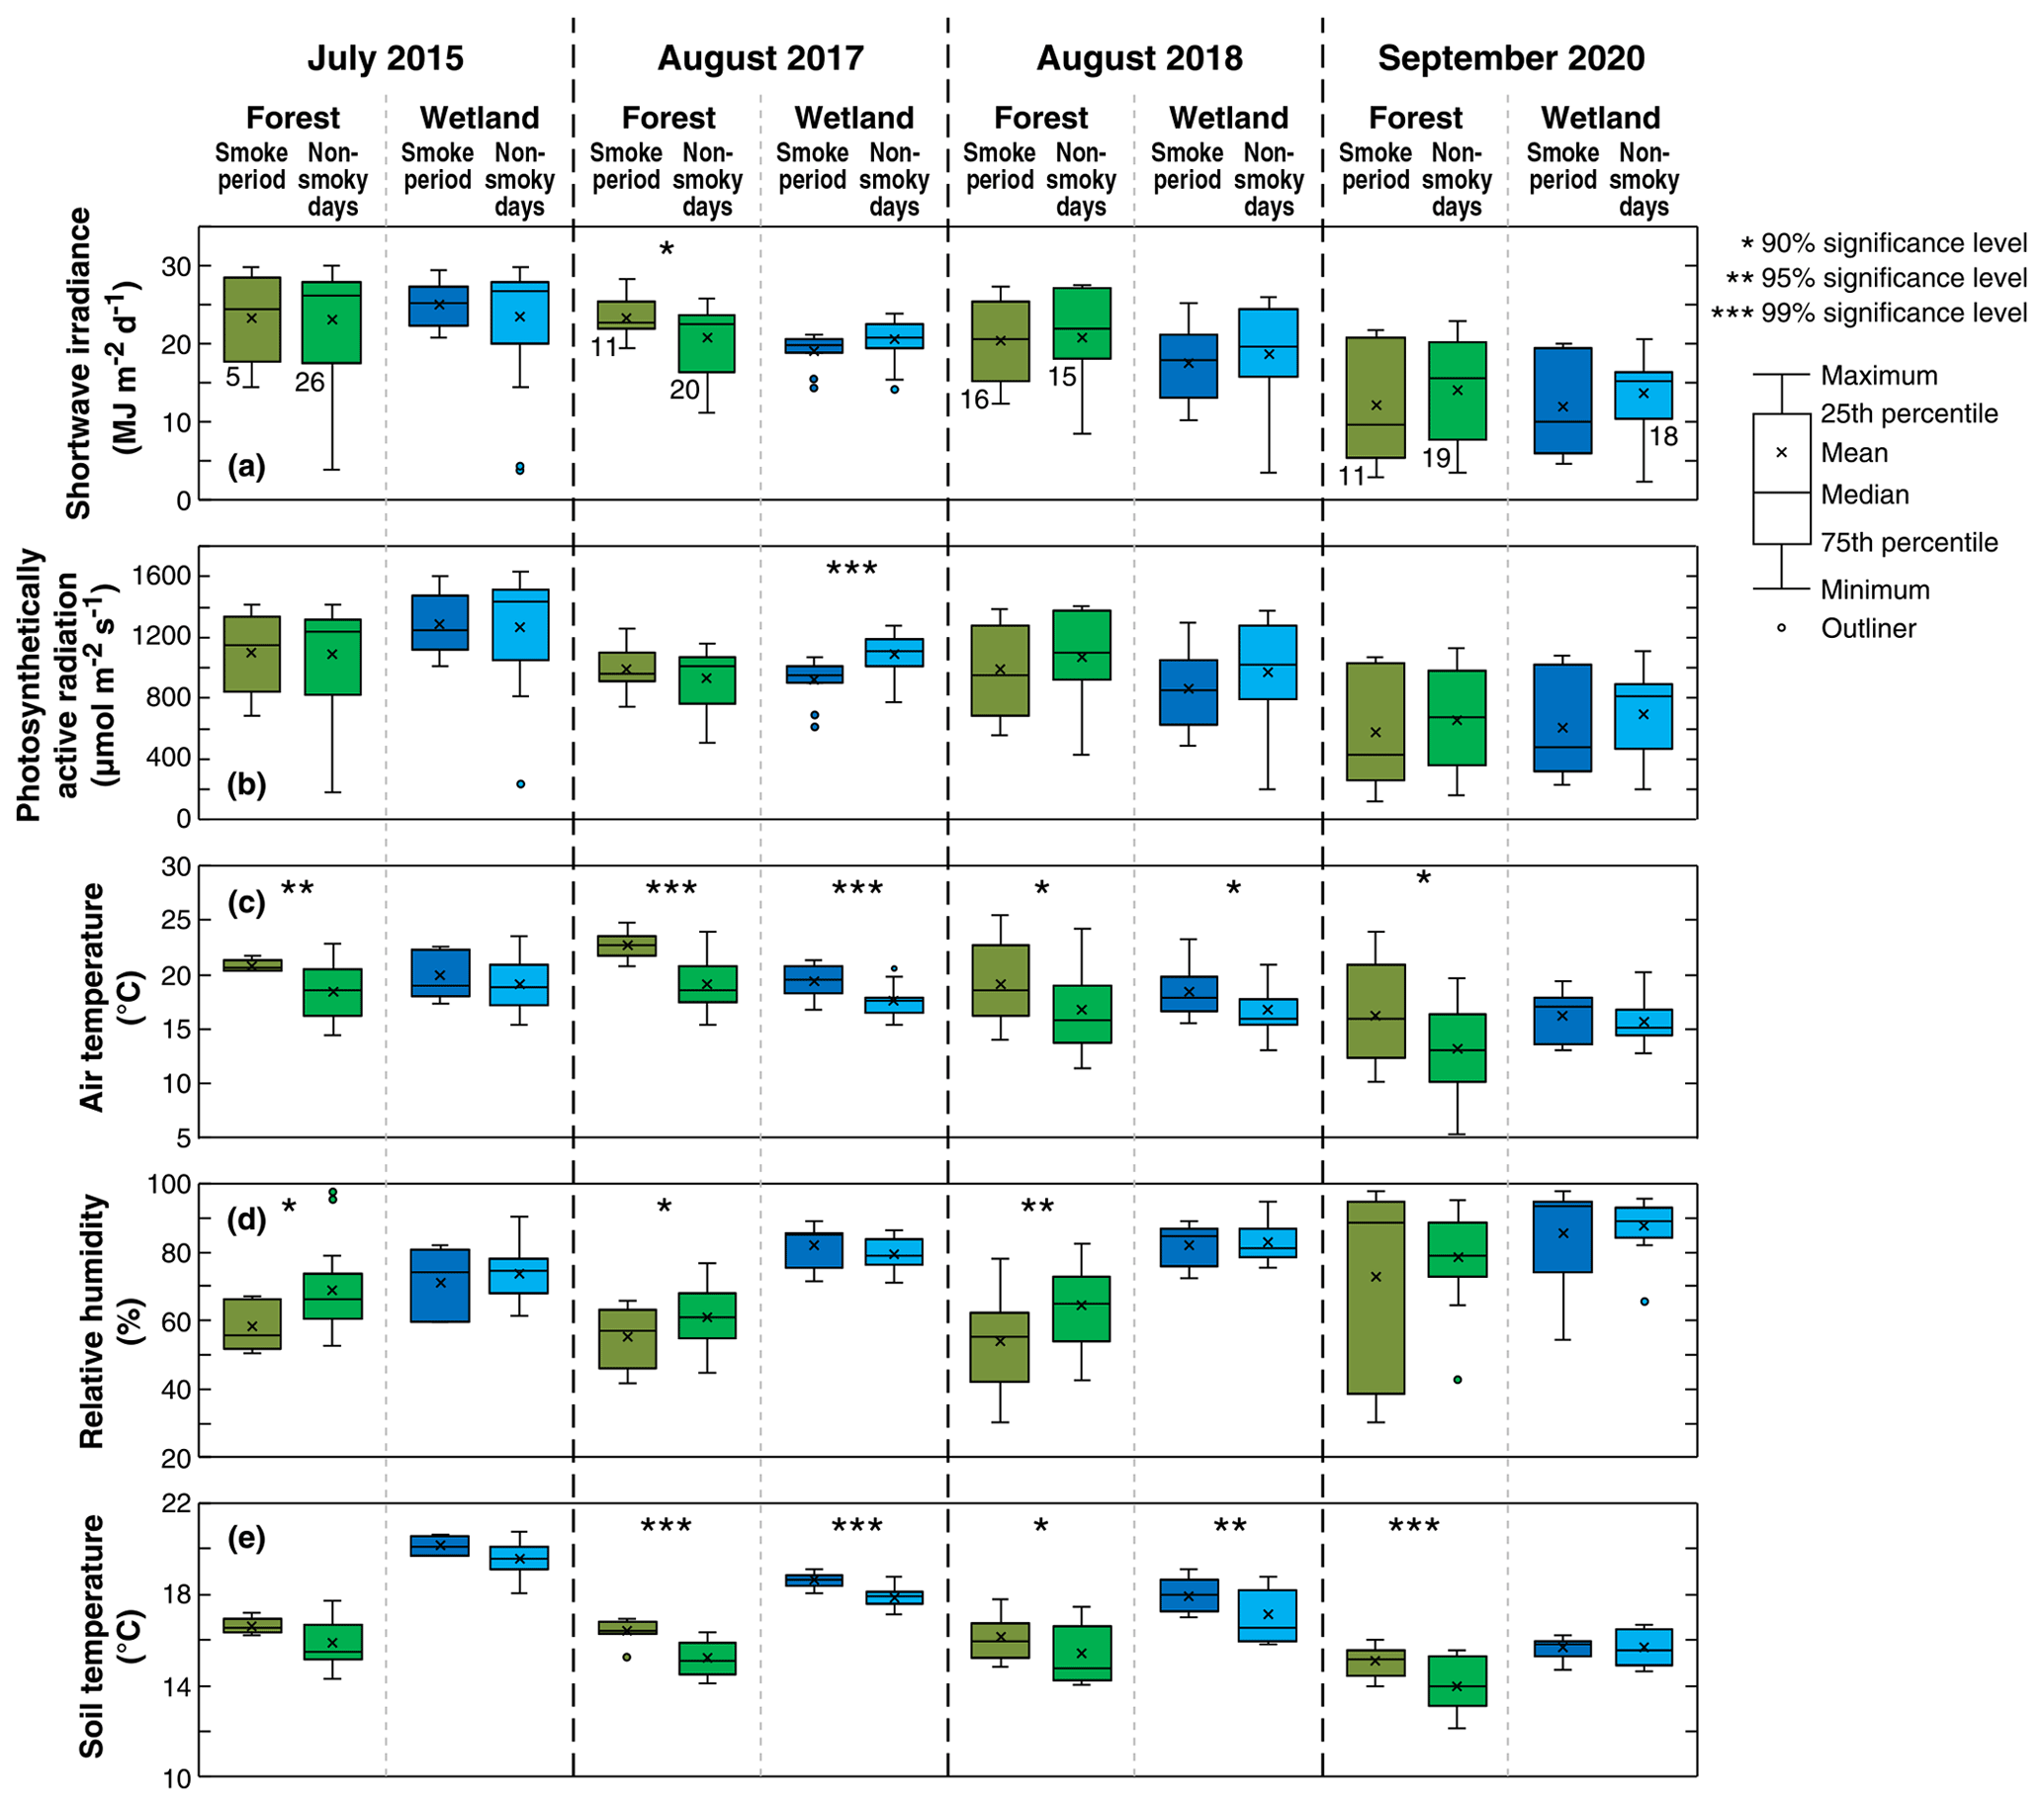
Figure 3Box plots of daily shortwave irradiance, average of total incoming photosynthetically active radiation during daytime, daily average air temperature, daily average relative humidity, and daily average soil temperature during the smoke episodes and non-smoky days in the month shown for 2015, 2017, 2018, and 2020 at Buckley Bay (the forest site) and at Burns Bog (the peatland site). The numbers of daily cases (n) used in the significance tests for each period for both the forest and wetland sites are shown beneath the box plot pairs for the forest site in panel (a). Unless otherwise shown, n is the same for all other variables and box plot pairs in the same year.
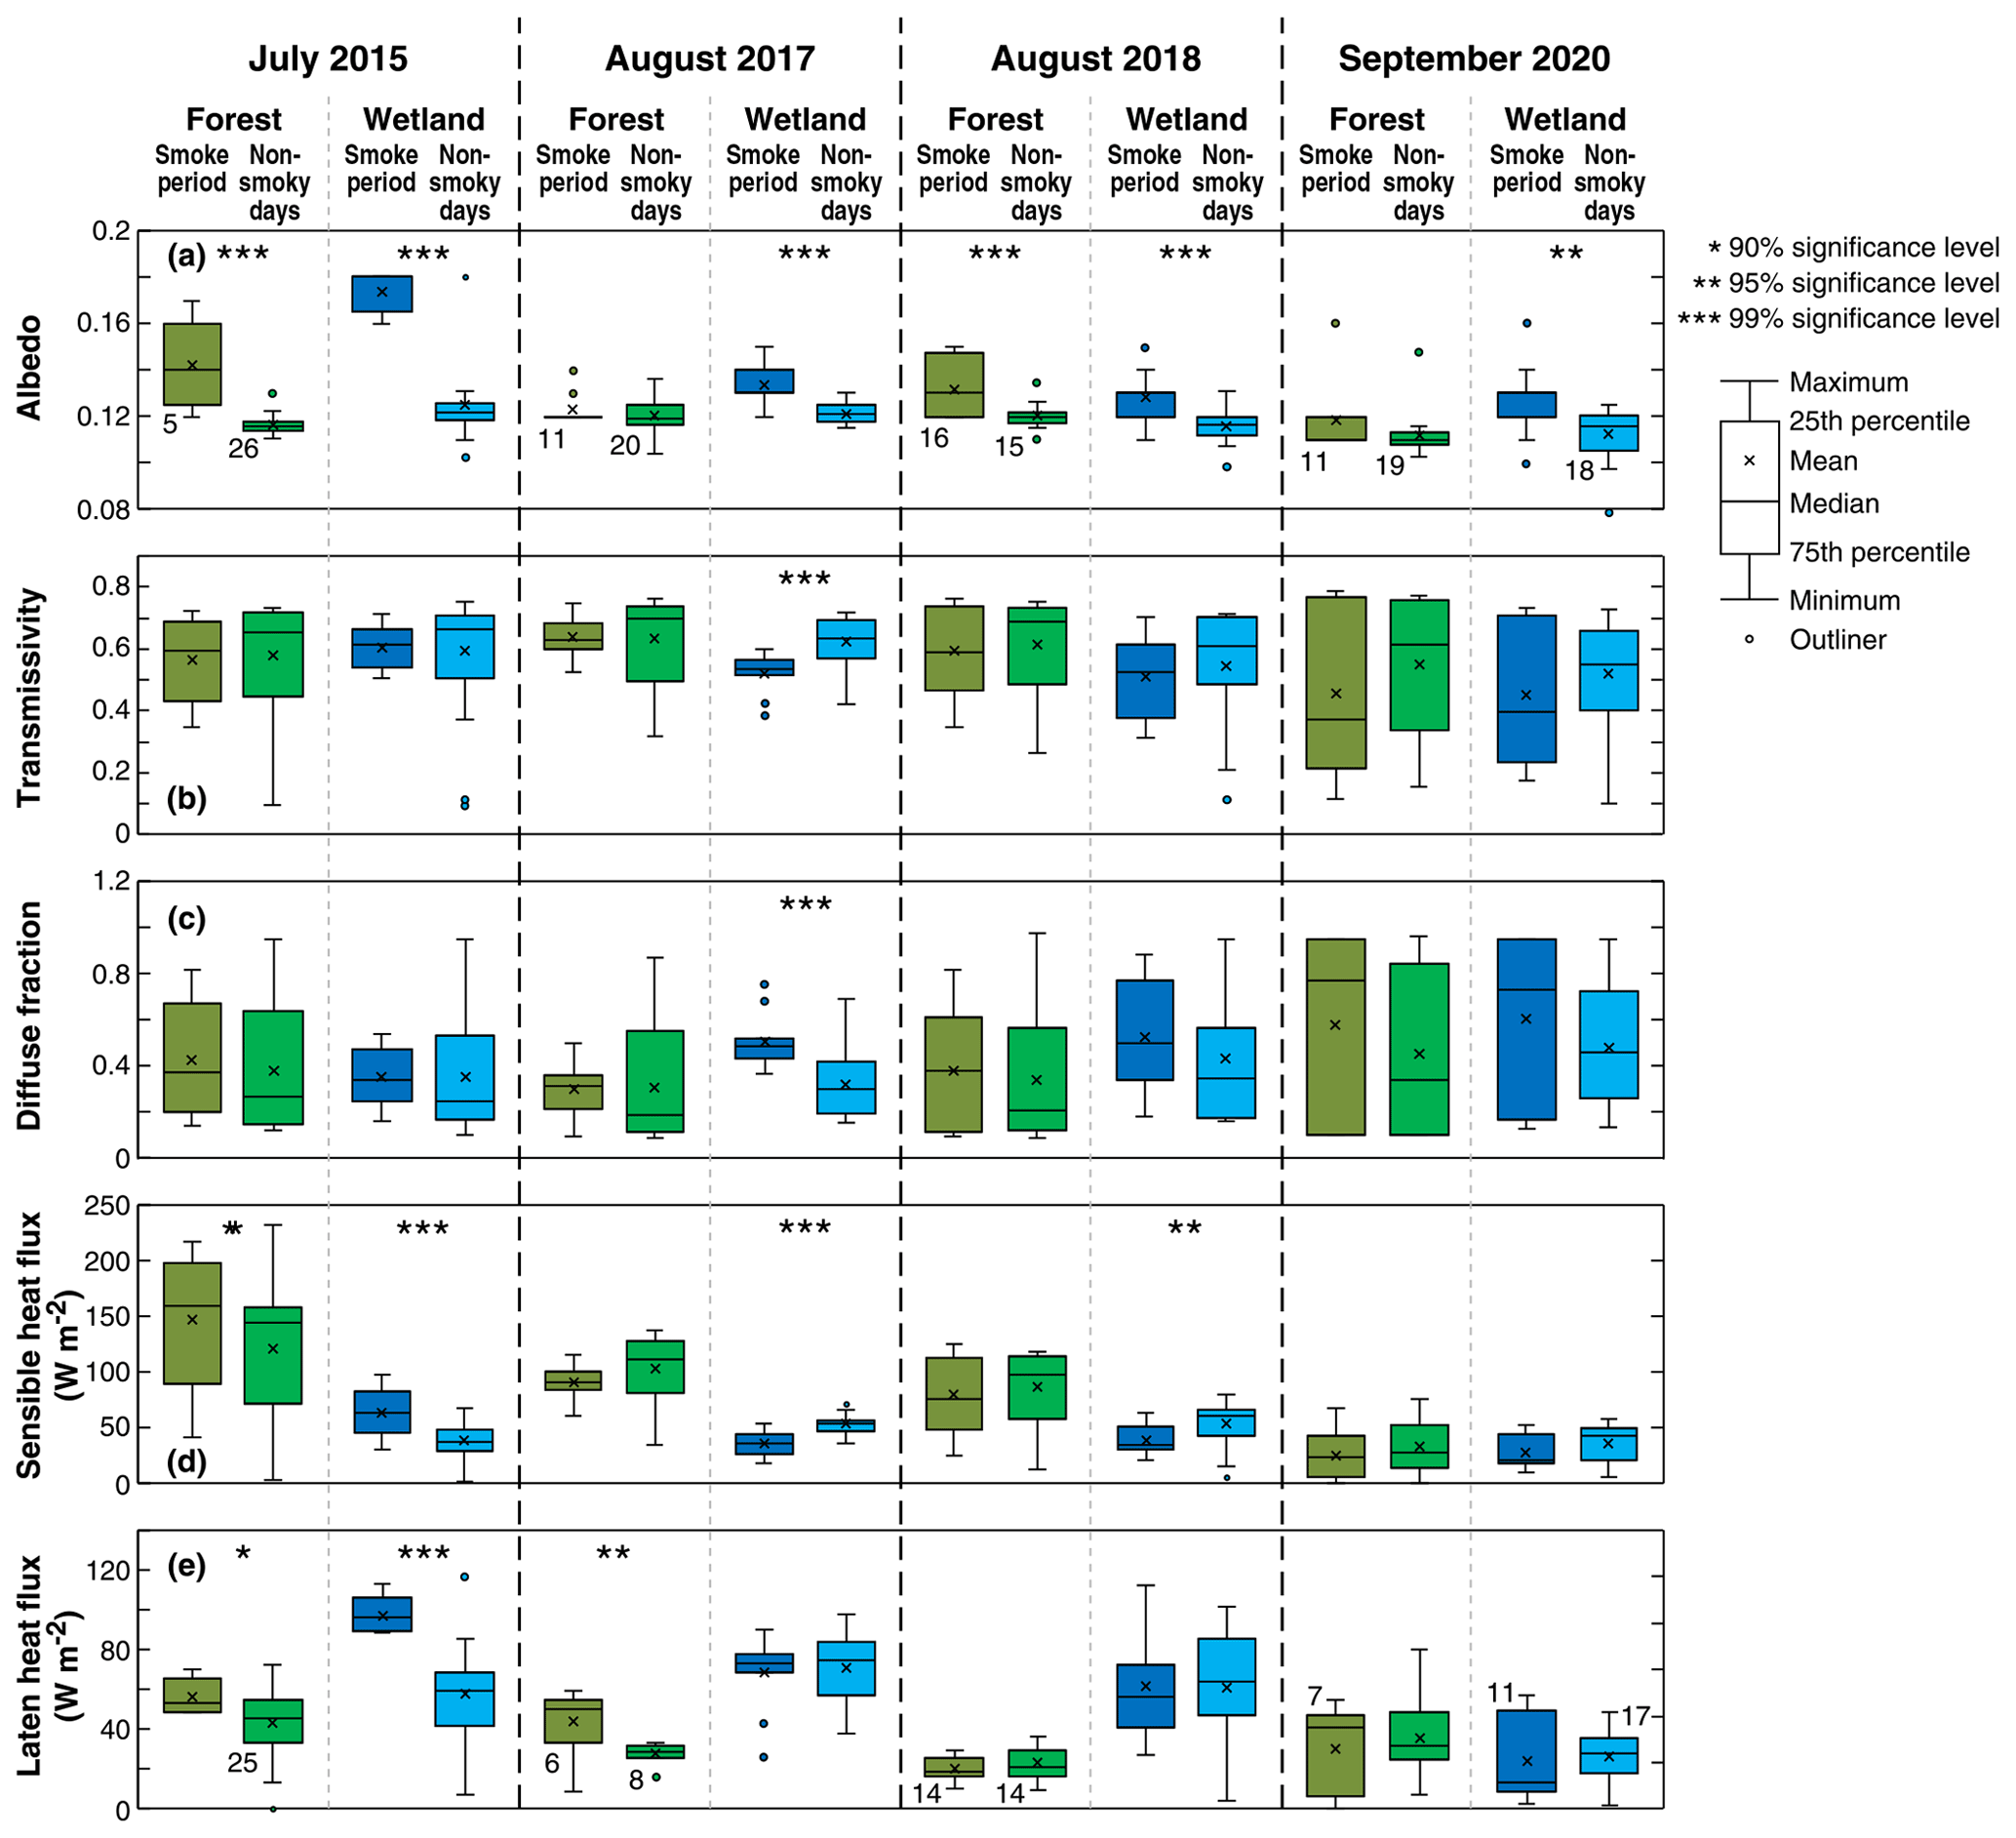
Figure 4Box plots of noontime albedo, daytime average of transmissivity, daily average diffuse fraction, daily average sensible heat flux, and daily average latent heat flux at the forest and wetland sites during the smoke events and non-smoky days in the month shown for 2015, 2017, 2018, and 2020. The numbers of daily cases (n) used in the significance tests for each period for both the forest and wetland sites are shown beneath the box plot pairs for the forest site in panel (a). Unless otherwise shown, n is the same for all other variables and box plot pairs in the same year.
3.1 Radiative changes and biophysical responses
3.1.1 Radiation and environmental conditions
Figure 3 shows box plots for measured K↓, PARg, Ta, RH, and soil temperature (Ts) during the smoky days (as defined in Table 1) and non-smoky days (defined as all the remaining days in the same month) over the study periods. Tests of significance are also shown in Figs. 3 to 5 to indicate when differences between the smoky and non-smoky days are statistically significant and at what significance level (Students t tests). During days that were not affected by smoke, both sites experienced a smooth diurnal course of radiation components consistent with typical summer clear-sky conditions. Mean K↓ values were generally lower during the smoke events compared to the days that were not affected by smoke (Fig. 3), but these differences were not statistically significant with the exception of the August 2017 event at Burns Bog. The difference was much greater for the September 2020 case. A few low K↓ values were observed during those non-smoky days and were likely due to the rain events (Fig. S1 in the Supplement). On non-smoky days, mean daily T values were approximately 70 % at the two sites except during 2020 when it was ∼ 60 % (Fig. 4). The mean T values during the smoky days typically dropped to ∼ 60 % but decreased to ∼ 40 % in 2020 (Fig. 4). In 2015, the most dramatic impact of the smoke plume on K↓ occurred on 5 July at Buckley Bay and 6 July at Burns Bog during otherwise clear-sky conditions (Fig. S2). Mean daily T dropped to ∼ 35 % and ∼ 50 % at Buckley Bay and at Burns Bog, respectively (Fig. S3). During the summer of 2017, the wetland site experienced the biggest impact of smoke on 4 August when T decreased to ∼ 40 % (Fig. S3). On 6 August, 2 d later, the forest site was most affected by the smoke with T reduced to ∼ 50 % (Fig. S3). The longest-duration smoke episode of the four occurred in 2018 and reduced T much earlier at Buckley Bay (11 August) than at Burns Bog (19 August). The magnitudes of the decrease in T were similar at the two sites (dropped to ∼ 35 %) in 2018 (Fig. S3). The September 2020 case is notable for being the latest (season-wise) of the four cases and the only case in which K↓ was reduced below 5 at both sites (Fig. S2). Mean daily T values in September were about 70 % at the two sites under sunny days (Fig. S3). T decreased appreciably to ∼ 10 % and 20 % at Buckley Bay and at Burns Bog, respectively, due to the smoke. These were the lowest values among the four study periods. Both Ta and Ts were higher during the smoky days than non-smoky days (Fig. 2), and the differences were generally statistically significant, with Ts experiencing smaller changes compared to Ta. RH dropped at the forest site during the smoke events except the 2020 case. In contrast, the wetland site had higher RH when affected by wildfire smoke, but the changes were not statistically significant. This partially reflects the substantial difference in wetness between the two sites.
3.1.2 Albedo and energy partitioning
Under non-smoky conditions, mean albedo values were 0.12 and 0.13 at Buckley Bay and Burns Bog, respectively (Fig. 4). These relatively low values are expected as the forest site has taller vegetation that will trap light more effectively, while the wetland site has dark water surfaces that lead to a lower albedo. A slight increase in albedo was observed at both sites with the arrival of smoke during the four study periods, and the increases were mostly statistically significant. In 2015, the albedo increased more than the other 3 years, especially at the wetland site. Excluding the 2015 case, the increase in albedo was only ∼ 10 % at both sites.
The differences in H and LE between smoky and non-smoky days were different every year (Fig. 4). Cloudy conditions could play a role in determining magnitudes of H and LE. Thus, the mean daytime values of H and LE are also shown in Fig. S4. As with K↓ in 2015, the most significant impact on H was on 5 July at Buckley Bay and Burns Bog, where H decreased to 18 % and 45 %, respectively, of non-smoky mean daytime (PARg ≥ 20 ) values. The impacts on LE were less than for H at both sites, with the minimum for LE occurring on 9 July. At both sites, the Bowen ratio, β (= ), was appreciably reduced on 5 July, with a greater reduction at Buckley Bay (i.e., from 3.22 to 0.84) due to the large reduction in H. In 2017, H during the smoky days was ∼ 85 % of the non-smoky mean daytime time value at the Buckley Bay site. However, LE increased significantly (p < 0.05) at Buckley Bay during the smoke period by ∼ 60 % of non-smoky mean daytime time values. During the 2018 smoke episode, Buckley Bay showed a similar decrease in H as 2017 but LE decreased slightly compared to 2017. During the 2017 and 2018 smoke events, H at Burns Bog decreased to ∼ 33 % and ∼ 27 % of non-smoky mean daytime time values in 2017 and 2018, respectively, while LE remained similar to the non-smoky mean daytime values. In September 2020, the latest of the four smoke episodes, H and LE dropped to low values at both sites for the smoky and non-smoky days (Fig. S4).

Figure 5Box plots of net ecosystem exchange, gross primary production, and ecosystem respiration at the forest site during the smoke events and non-smoky days in the month shown for 2015, 2017, 2018, and 2020. The numbers of daily cases (n) used in the significance tests for each period for both the forest and wetland sites are shown beneath the box plot pairs for the forest site in panel (a). Unless otherwise shown, n is the same for all other variables and box plot pairs in the same year.
In summary, the forest site had higher H than the wetland site during the smoky days, except for the 2020 case (Fig. 4). Similarly, LE was consistently higher at the wetter site (Burns Bog) compared to the forest site during smoky days, except for the 2020 case. Due to the smaller changes in H and LE, β at Burns Bog stayed near 50 % of non-smoky mean daytime values. However, β at Buckley Bay responded much more dramatically, and the observed range of β was between 26 % and 90 % of non-smoky mean daytime values. We also compared H and LE between smoky and sunny days (Table S1 in the Supplement). The results from the two comparisons (smoky vs. non-smoky days and smoky vs. sunny days) mostly agreed with each other, although greater differences were found when comparing smoky and sunny days.
3.1.3 Diffuse radiation fraction
Figure 4 shows DF (ratio of mean daytime PARd to mean daily PARg) during the four smoke episodes at Buckley Bay and Burns Bog. Under non-smoky conditions over the 4 years, PARd was roughly a constant fraction of PARg (i.e., ∼ 0.30). With the arrival of smoke in July or August, DF increased to about 0.40. When the smoke arrived later in the season, as in September 2020, DF increased appreciably to almost 0.80. There was another peak in DF around 23 September 2020 during daytime (Fig. S3). We attribute this to intermittent transport events linked to the original smoke episode. Over the four study periods, mean daily PARg values decreased during the smoke events (Fig. 3), suggesting that during heavy smoke, scattering and absorption of incoming PARg were enhanced.
3.2 Biogeochemical responses
3.2.1 Net ecosystem exchange
Daily totals for NEE are shown in Fig. 5. Both sites became a stronger CO2 sink when the smoke was present except in the September 2020 case. These increases were statistically significant in the first 2 years with the exception of the July 2015 event at Buckley Bay. The average change in daily (24 h) totals of NEE was about −1.00 during the 3 years prior to 2020, with this increase in sink strength primarily driven by an increase in GPP (Fig. 5). The increase in GPP (∼ 2.00 ) was generally more prominent than the decrease in Re (< 1.00 ). NEE during the September 2020 case did not change because both GPP and Re showed little response to the smoke.
Throughout the 2015 smoke period, Burns Bog remained a CO2 sink and showed an increasingly negative trend in NEE (stronger CO2 sink) over the duration of the smoke episode. Before the smoke arrived at the bog, the mean daily NEE was about −1.60 . The peak biogeochemical impact of the smoke at Burns Bog occurred on 7 July, which led to a daily NEE of −3.64 (CO2 sink) (Fig. S5). Conversely, on 5 July, when the peak reduction of K↓ was observed, NEE at the forest site became more positive (a stronger CO2 source). The Buckley Bay forest site became a strong CO2 sink on 6 and 7 July (−1.35 and −2.31 , respectively) when the smoke had started to disperse (Fig. S6).
In 2017, Burns Bog again became a stronger CO2 sink (daily NEE < −2.5 ) for 3 d (4–6 August) due to smoke (Fig. S5). The biogeochemical impacts of smoke were somewhat different at Buckley Bay, where daily NEE showed little change until the last day of the study period, when NEE decreased to −5.40 (stronger CO2 sink; Fig. S6).
During the 2018 episode, both ecosystems became a CO2 sink for the 3 d that smoke affected the sites (13 to 15 August at Burns Bog and 11 to 13 August at Buckley Bay) (Figs. S5 and S6). Both sites switched from being CO2-neutral to being a moderate CO2 sink of about −2.50 .
Throughout the 2020 smoke period, when DF was the highest of all cases (∼0.60 to 0.80), appreciable impacts on NEE were observed at both sites. Both became stronger CO2 sinks between 11 and 12 September (going from −0.57 to −4.00 and from −0.40 to −1.40 , respectively) (Figs. S5 and S6). However, after PARg dropped to low values, both sites turned into weak CO2 sources (2.10 and 0.37 for Buckley Bay and Burns Bog, respectively).
As was done for H and LE, we compared daily averages of NEE during smoky and sunny days (Table S1). Large differences between smoky and sunny days were also found in this case.
3.2.2 Gross primary production and ecosystem respiration
Measured NEE was partitioned into GPP and Re to further investigate the biogeochemical responses of the two sites to smoke (Fig. 5). In general, most differences in GPP and Re between the smoky and non-smoky days were statistically significant. In the 2015 smoke event at Buckley Bay, daily GPP increased by about 2 , while daily Re increased by only about 1.5 , which resulted in the site becoming a slightly stronger CO2 sink. At Burns Bog, the responses were somewhat different, with the relative increase in daily GPP by ∼ 1.5 and decrease in daily Re by ∼ 0.2 .
Due to missing data, an appreciable increase in CO2 sequestration was observed on only one day (6 August) at Buckley Bay in 2017 (Fig. S6). This was predominantly controlled by the sizable increase in daily GPP (170 %), while the increase in daily Re was minimal at 40 %. The increase in daily GPP also played a role in increasing CO2 sequestration at Burns Bog; however, the increase in GPP was not as great as at Buckley Bay. At Burns Bog the increase in daily GPP was about 20 %, while the decrease in daily Re was 25 %.
Compared to the previous 2 years in which both sites became stronger CO2 sinks from being weak CO2 sinks, the changes in 2018 at the two sites were similar but slightly smaller. The main reason was the weaker increase in daily GPP. The Burns Bog site had about a 30 % higher daily GPP during the smoke event than during non-smoky conditions (Fig. S5). However, the Buckley Bay site experienced about the same mean daily GPP during the smoke event (3.1 ) as during non-smoky conditions (3.0 ).
Throughout the 2020 smoke event, there were small increases in daily GPP of about ∼ 10 % at both sites. Due to the heavy smoke permitting only low PARg on 13 September, daily GPP dropped rapidly by about 70 % compared to the previous days (Figs. S5 and S6), which resulted in the two sites switching from being CO2 sinks to CO2 sources over the course of 1 d.
3.2.3 Relationship between smoke and gross primary production
Figure 6a shows the dependence of mean PARg on DF for the two sites. As expected, PARg decreases linearly as DF increases (R2 = 0.86 and 0.80 for Buckley Bay and Burns Bog, respectively). PARg decreased ∼ 10 % more rapidly at the wetland site than the forest site. The relationship between LUE and DF was also examined in order to better understand the behavior of the dependence of GPP on DF (Fig. 6b). A linear relationship is evident with an R2 of 0.52 and 0.34 for Buckley Bay and Burns Bog, respectively. LUE at the forest site increased with increasing DF by a factor of ∼ 3 more than at the wetland site.
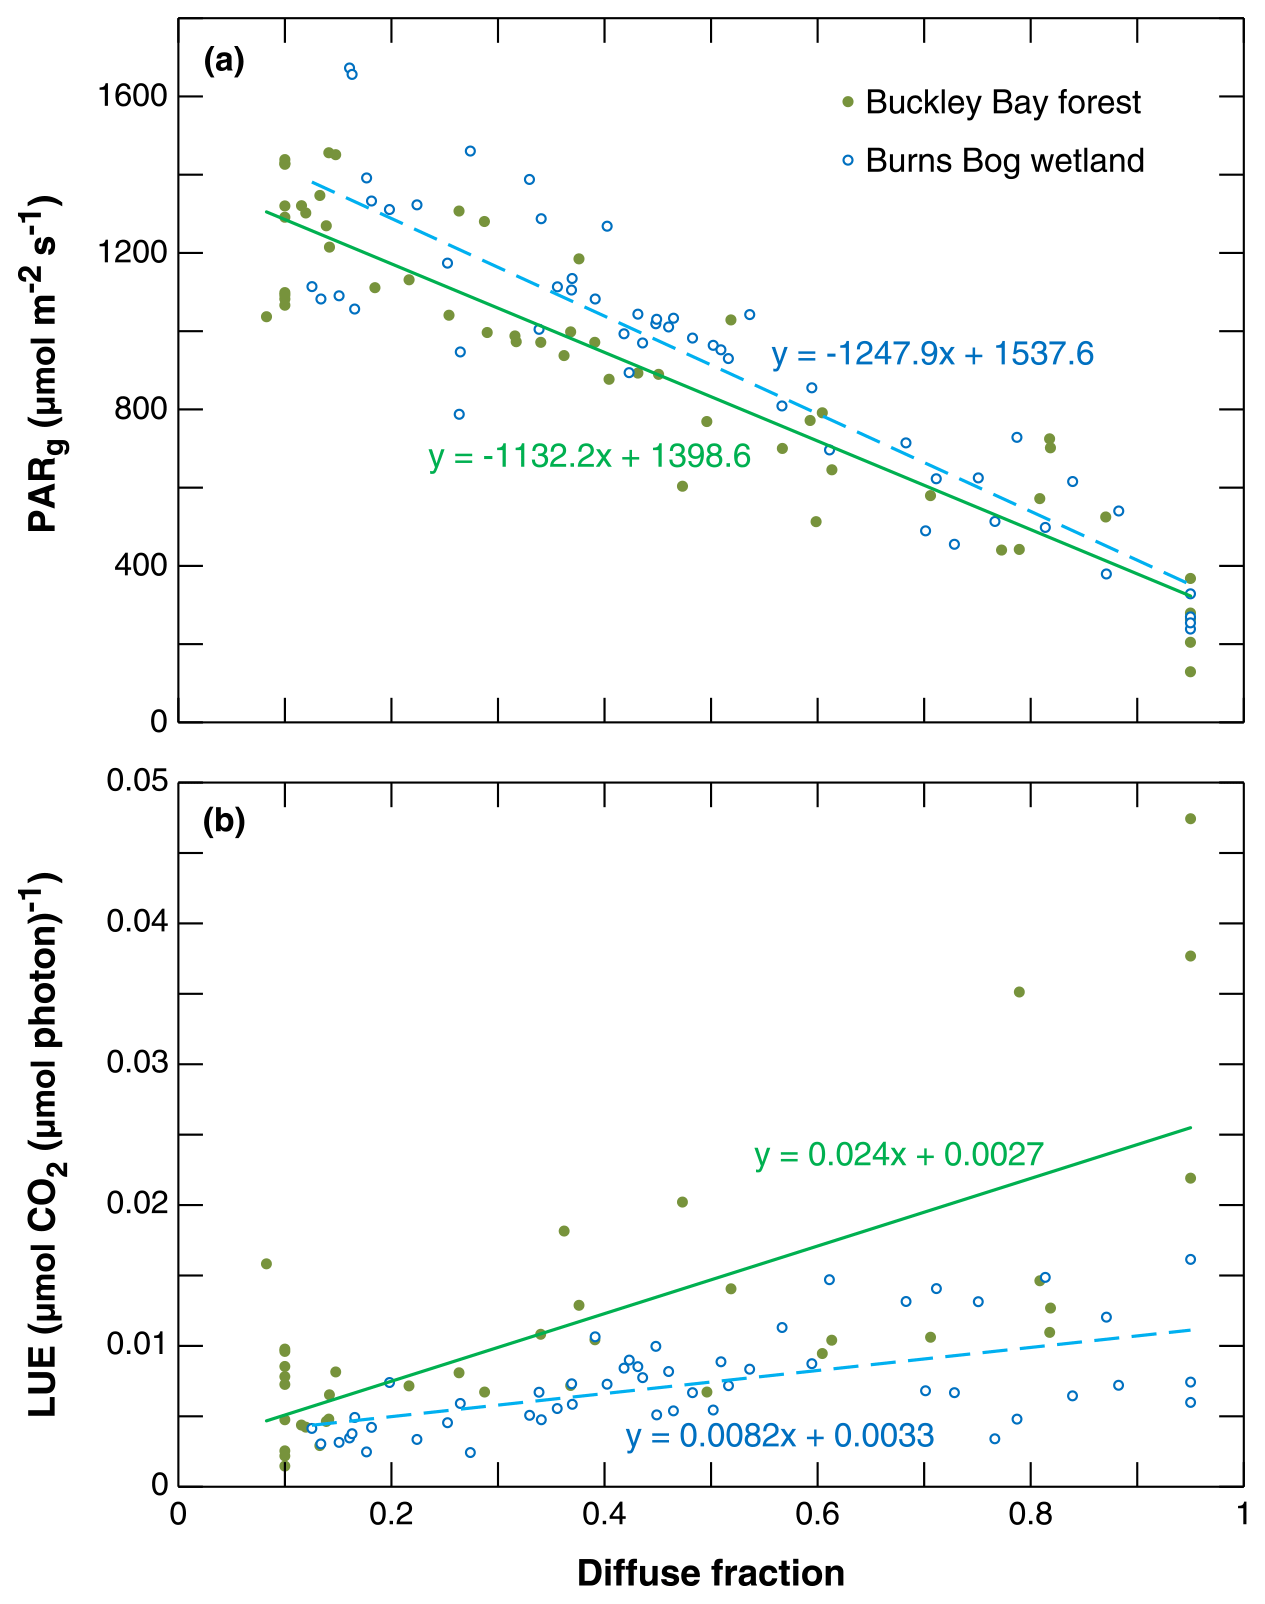
Figure 6(a) Total incoming photosynthetically active radiation (PARg) as a function of the diffuse fraction of PARg (DF). (b) Light use efficiency (LUE) as a function of DF.
By conducting the simple and multiple linear regressions, we investigated the amount of variance in GPP residuals attributable to the three environmental variables (i.e., DF, Ta, and VPD). When including the effects of Ta and VPD on GPP residuals with DF, the amount of variation in GPP residuals explained increased by up to an additional 38 % (at the forest site) with an average of 24 % and 9 % at the forest and wetland sites, respectively (Table S2). A combination of three variables explained more than 90 % of the variation in GPP residuals when the smoke arrived earlier in summer (i.e., July 2017) for both sites and for the forest site in August 2018. The only case for which Ta and VPD explained more of the variation in GPP residuals than DF was at the forest site during August 2017, which was the same month that the site experienced the greatest drop in LE.
4.1 Impact of smoke episodes on radiation and biophysical properties
Over the 4 study years, significant perturbation of both the radiation and energy budgets over the forest and wetland ecosystems in southwestern BC was observed when a dense layer of wildfire smoke impacted the region. Generally, changes were more pronounced at the Buckley Bay forest site on Vancouver Island relative to the Burns Bog wetland site in Metro Vancouver.
Table 2Observed decreased shortwave irradiance (K↓) from this study by comparing smoky and sunny days as well as several estimates from previously published studies.
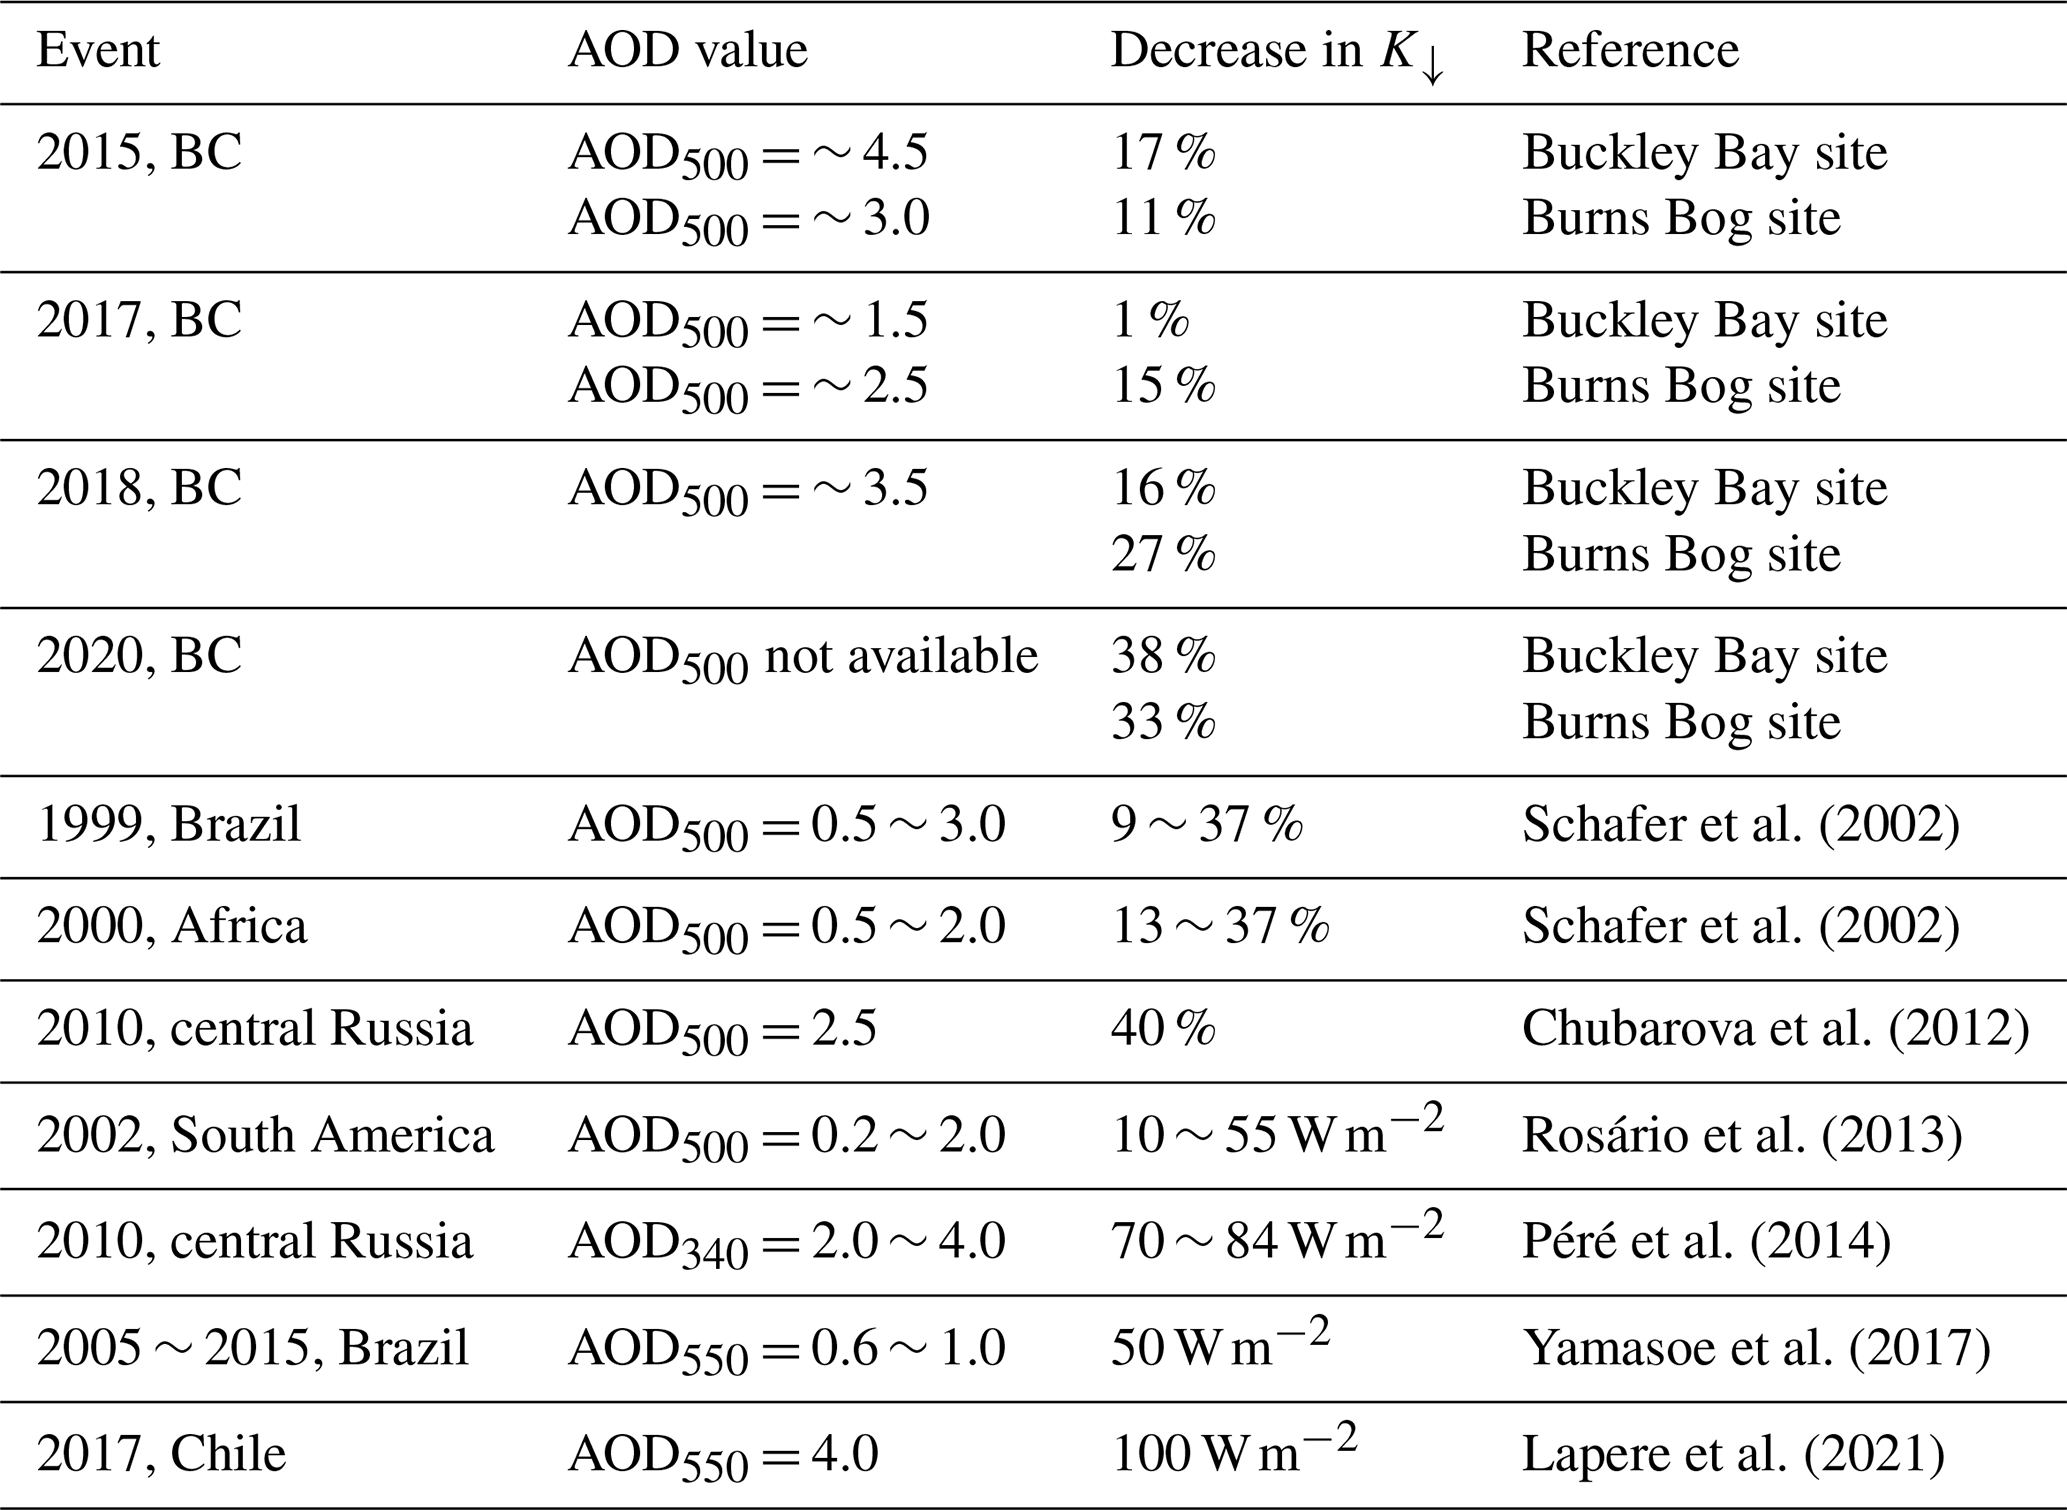
The observed decreases in K↓ at the two sites during the four study periods were minimal when comparing smoky and non-smoky days. In order to compare to other studies, we also compared K↓ between smoky and sunny days (Table 2), as was done for H, LE, and NEE. The average decreases in K↓ at both sites were about the same at ∼ 20 %. These values are comparable to reported reductions in K↓ by forest fire smoke in Brazil (the Brazilian Amazon with AOD500 peaking at 3.0) and Africa (Zambian savanna with AOD500 peaking at 2.0) (Schafer et al., 2002). Similar agreement is also apparent when compared with the 2010 fires in central Russia that led to a reduction of K↓ of about 40 % (Chubarova et al., 2012) or 80 W m−2 (Péré et al., 2014) and the 2017 Chilean mega-fires, which resulted in a decrease in K↓ of about 100 W m−2 (Lapere et al., 2021). The reduction in K↓ reported by Rosário et al. (2013) was smaller at about 55 W m−2 when AOD500 was near 2.0 during the 2002 biomass burning season in South America. Although the AOD550 value was slightly lower than in this study, Yamasoe et al. (2017) reported that K↓ was reduced by about 50 W m−2 over the spring, during the period of long-range transport of biomass burning plumes in São Paulo, Brazil. In our study, we found that K↓ dropped to 3 and 5 at the forest and wetland sites, respectively, during the smoke episode in September 2020. This reduction was much greater than the previous three smoke episodes (Fig. S2).
As with K↓, turbulent heat fluxes (H and LE) were appreciably affected by smoke at the two sites, with a greater impact at the Buckley Bay forest site. These results are consistent in both direction and magnitude with previous studies elsewhere, where the reduction in K↓ due to aerosols in turn impacted H and LE (Feingold et al., 2005; Jiang and Feingold, 2006; Mallet et al., 2009; Markowicz et al., 2021; Steiner et al., 2013). It is important to note that these results were similar despite the cited study sites being in geographical settings quite different from this study. Furthermore, they were associated with significantly lower AOD550 values than observed in the four BC smoke episodes.
It is important to note that energy partitioning can be very different in different ecosystems (Steiner et al., 2013). As discussed above, H was reduced significantly in 2017, 2018, and 2020 at the Buckley Bay forest site where canopy effects are most important. The possible mechanism could be that the switch from high direct radiation to predominately diffuse radiation during the smoke episodes likely caused the reduction in H as a consequence of reduced heating of leaves in a highly coupled forest canopy (Brümmer et al., 2012). In this study, the wetland site offers an interesting contrast to the Buckley Bay forest site. As McKendry et al. (2019) noted, with standing water as a result of restoration at the wetland site and little physiological control on LE, the impacts on the energy partitioning were modest compared to the physiologically controlled LE at Buckley Bay. Another factor affecting energy partitioning is accessibility to soil moisture. Our results indicate that LE at the forest site increased in 2015 and 2017 and remained about the same in 2018 during the smoke periods. This might be because the trees were still able to maintain transpiration by using water from deeper soil layers. Soil moisture also plays a role at the wetland site. Generally, the wetland site also had higher LE than H during the smoke episodes except in September 2020. This was likely because water level dropped below the rooting depth of most bog vegetation (Lee et al., 2017). For both H and LE, when the smoke arrived at the later stage of summer (September 2020), impacts were the most different among the four study periods. This is likely because both sites had the lowest available energy during this period and were dry after 2 months of low precipitation.
Only a slight increase in albedo was observed at both sites with the arrival of smoke during the four study periods, except July 2015 that had a much more significant increase. This was likely due to an increase in diffuse reflection. However, Nojarov et al. (2021) found that the albedo of the underlying surface greatly affects the radiative effect of aerosols at Musala (altitude 2925 m), Bulgaria. The results indicated that the aerosol amount at the surface level had a negative radiative effect when albedo values were low (< 0.4) but a positive radiative effect when albedo values were high (> 0.4). They explained that higher albedo can lead to larger amounts of reflected and scattered shortwave radiation, especially close to the Earth's surface. At higher aerosol amounts the result is an increase in scattered shortwave radiation, which also increases the global solar radiation.
4.2 Effects of aerosol loading on biogeochemical properties
The typical DF in southwestern BC under sunny conditions (T > 0.65) over these 4 years was ∼ 0.30. Generally, when DF increased to between 0.40 and 0.50 due to wildfire smoke, the two sites became a stronger CO2 sink (i.e., NEE became more negative). However, these responses were also controlled by VPD and Ta. When PARg dropped to low values, even if DF exceeded 0.80, both study sites became CO2 sources. These broad patterns are comparable to previous research in different environments (Niyogi et al., 2004; Park et al., 2018; Yamasoe et al., 2006). An observational study in the Amazon rainforest found that, under moderate AOD500, CO2 uptake was enhanced by the increased DF (Yamasoe et al., 2006). Park et al. (2018) also indicated that moderate levels of smoke resulted in small increases in CO2 sequestration, while extremely smoky conditions resulted in lower CO2 sequestration as the effect of the reduction in PARg outweighed the DRF effect.
The changes in NEE were primarily controlled by changes in GPP (Fig. 5). Therefore, in this study, we further investigated how GPP responded to smoke using the relationship between PARg and DF, as well as the relationship between LUE and DF. Ezhova et al. (2018) analyzed data from five forest sites that included two mixed forests and three Scots pine (Pinus sylvestris L.) forests (55, 60, and 100 years old). In that region, DF was approximately 0.11 on days characterized by low aerosol loading and about 0.25 on days with moderate aerosol loading. They also found that PARg decreased as DF increased across the five sites. Comparing their estimated values of PARg at zero DF, the Buckley Bay forest and Burns Bog wetland sites had values (1399 and 1538 , respectively) similar to those of four of the five forests (1480 to about 1608 ). PARg under clear-sky conditions was much lower at the 60-year-old Scots pine site (SMEAR I, 1212 ) compared with the other sites, which was partly due to its high latitude (Ezhova et al., 2018). Generally, the slopes of the linear dependences in the relationship between PARg and DF were similar in this study, which can likely be attributed to similar cloud-attenuating properties (Ezhova et al., 2018).
The slope in the relationship between LUE and DF reflects canopy properties such as leaf area index and thickness of the canopy (Ezhova et al. 2018). The Buckley Bay forest site had a slope of 0.0240 µmol CO2 (µmol photon)−1, which is about 3 times higher than the value for the Burns Bog wetland site (0.0082 µmol CO2 (µmol photon)−1). This indicates the ability of a forest stand to take up more CO2 in response to an increasing DF. Ezhova et al. (2018) found that two mixed forest sites (0.0238 to 0.0278 µmol CO2 (µmol photon)−1) had steeper LUE slopes compared to the other three coniferous forest sites (about 0.015 µmol CO2 (µmol photon)−1 on average). They attributed the difference to mixed forests having a larger potential for photosynthetic activity enhancement due to a larger leaf area index and a deeper canopy. Results from mixed and broadleaf forest sites in the USA showed that the increase in LUE was about 0.03 µmol CO2 (µmol photon)−1 (Cheng et al., 2016). Hemes et al. (2020) analyzed the EC measurements across one corn (C4 plant), one alfalfa (C3 plant), and two restored wetland (C3 plants) sites during a summer 2018 smoke event in California, USA. The slope of the relationship between LUE and DF for the corn site (0.0190 µmol CO2 (µmol photon)−1) was intermediate between the mature alfalfa site (0.0270 µmol CO2 (µmol photon)−1) and the two restored wetland sites (0.0140 and 0.0180 µmol CO2 (µmol photon)−1). This indicates that corn is more sensitive than the wetlands but less sensitive than alfalfa. Their restored wetland ecosystems were both characterized by quasi-managed mixes of tule and cattail vegetation with aboveground water levels. Thus, these two sites had lower LUE sensitivities to DF compared to the two crop sites. Our wetland site has even shorter vegetation compared to theirs and thus an even lower sensitivity (∼ 40 % lower).
Finally, based on the linear dependence of LUE on DF and PARg on DF, we estimated how GPP changed with DF. An increase up to ∼ 7 % in GPP was found at the Burns Bog wetland site. GPP at the Buckley Bay forest site increased by up to ∼ 18 %, which is slightly higher than the results from Ezhova et al. (2018), showing an increase in GPP between 6 % and 14 % at five forest sites. Increases of 3 %–4.1 % and 1.6 %–2.4 % in GPP due to a 1 % increase in DF were found for tree species and non-tree species, respectively, using 200 FLUXNET sites by Zhou et al. (2021). Hemes et al. (2020) found that the GPP enhancement was between 0.71 % and 1.16 % at four sites for every 1 % increase in DF when absorbed PARg was held constant. Lee et al. (2018) also showed a comparable GPP enhancement at 0.94 % GPP using a process-based sunshade canopy model with observations from a broadleaf forest in the eastern USA.
Our results also indicated that other environmental drivers that co-varied with DF can contribute to explaining GPP residuals under wildfire smoke events. Generally, Ta and VPD appeared to have small effects on GPP residuals at the two study sites (Table S2). In only one of the study events (Buckley Bay in 2017) did Ta and VPD account for more variation in GPP residuals than DF itself. Cheng et al. (2015) also observed this for mixed conifer forests, which implies that radiation changes can have a less important role when Ta and VPD can greatly increase stomatal conductance under smoky conditions at conifer forests. We note that although the empirical models based on conditional sampling in this study are able to explain much of the variation in observations, they have limitations compared to more mechanistic, process-based models (Knohl and Baldocchi, 2008; Lee et al., 2018). On the other hand, process-based models often require parameterizations for specific vegetation and photosynthetic types that introduce more complexities and hence probably lead to higher uncertainty (Hemes et al., 2020).
4.3 Study limitations
Due to their limited spatial and temporal scale, the results described here have limitations that restrict attempts to generalize (and easily scale up). Firstly, although the four cases examined extend our understanding of biophysical and biogeochemical impacts to a wider range of cases than McKendry et al. (2019), they are by no means exhaustive, nor are they likely representative of the broad variety of forest types across BC.
Secondly, attribution of ecosystem responses wholly to smoke, while rigorously controlling for other environmental variables (e.g., air quality, antecedent moisture conditions, wind, cloudiness, RH, temperature), is challenging. Our simple tests of significance highlight the fact that whilst there is a clear signal of biophysical and biogeochemical responses to smoke, it is by no means consistent across all four events, each land use type, or all variables. This suggests that each smoke event is somewhat unique in terms of antecedent conditions, present weather conditions, and the characteristics of the smoke itself (e.g., age, elevation, composition, density). For example, in addition to the effects of DF, wildfire smoke often incorporates a complex mixture of gases (e.g., CO, CH4, NOx, and O3), aerosols, and aerosol precursors (Crutzen et al., 1979; Jaffe and Wigder, 2012; Pfister et al., 2008). Although increased O3 and co-pollutants are often associated with wildfires (Jaffe and Wigder, 2012; Pfister et al., 2008; Yamasoe et al., 2006), they can have an indirect impact on ecosystem carbon budgets that is harder to quantify (Malavelle et al., 2019). We did not observe an appreciable increase in hourly ozone maxima or daily average O3 during the four smoke episodes (Table 1). Maximum hourly values at both sites were generally below 60 ppb, while daily average values during smoke events were within 2–3 ppb of overall monthly average values. On this basis and using the results of Hemes et. al. (2020), we estimated that O3 enhancements in smoke would contribute to a ∼ 1 % GPP reduction at Buckley Bay and Burns Bog.
An important note is that LUE is usually defined as GPP per unit absorbed PARg (i.e., APAR = fAPAR × PARg), with fAPAR as the fraction of the absorbed PARg. Generally, fAPAR is the LAI, the solar zenith angle, and other factors such as leaf color (Ezhova et al., 2018). Due to the temporal and spatial variation in these factors we chose to base the definition on PARg. Typically, fAPAR for tree heights greater than 10 m and at a moderate zenith angle (i.e., 40–60∘) can be estimated to be between 0.8 and 0.9 (Hovi et al., 2016).
Finally, we have compared smoky and non-smoky conditions exclusively during the months of these events. This is somewhat arbitrary and by default neglects a wide range of meteorological variability associated with each “type”. However, this simple approach serves to highlight the complex combination of processes involved. Various combinations of cloudiness, antecedent meteorological conditions, and wind, among other factors, all control biophysical and biogeochemical responses, with smoke being only one of the factors at play. Isolating the individual impact of smoke is challenging. There are, however, common elements that can be gleaned from this intercomparison of four cases. In particular, the presence of wildfire smoke is shown to have a statistically significant impact on DF that has the potential to turn both natural and managed ecosystems into a carbon sink when smoke densities are low to moderate. In this sense, this work is consistent with both theory and observations elsewhere and confirms that wildfire smoke can have a significant impact on regional carbon budgets.
Aerosol loading from wildfire smoke is not only becoming a regular component of air quality considerations in a warming world, but also has climate impacts and unexplored feedbacks. Through biogeochemical and biophysical processes, wildfire smoke influences the climate by altering both greenhouse gas dynamics and how energy and water are exchanged between the ecosystem and the atmosphere. Clearly, under conditions in which the presence of wildfire smoke is more frequent and perhaps of longer duration, the results described herein imply substantial impacts on the regional energy and carbon budgets.
Results from the four major smoke events in different years are broadly consistent with those described elsewhere, specifically for the forest and wetland sites examined.
-
The maximum reduction in daily totals of K↓ due to smoke was generally about 50 % but reached 90 % in the September 2020 case and was near 100 % in dense smoke.
-
During smoky days, the forest site had higher H than the wetland site and the wetland site had higher LE than the forest site. However, when the smoke arrived later (e.g., September 2020), both sites had similar H and LE in smoky conditions. This was attributed to the markedly reduced K↓ and to both sites being dry after 2 months of low precipitation.
-
Under non-smoky conditions during the summer months, DF in southwestern British Columbia is ∼0.30. The presence of smoke generally increased it to ∼0.50, and both the forest and wetland ecosystems became net CO2 sinks. However, with dense smoke increasing DF to ∼0.95, both sites turned into net CO2 sources because total photosynthetically active radiation dropped to low values.
-
Based on our estimates, GPP can increase by up to ∼ 18 % and ∼ 7 % at the forest and wetland sites, respectively, due to the direct effect of smoke particles compared to clean atmospheric conditions.
This study confirms a clear signal of diffuse radiation fertilization across four major smoke episodes, resulting in forest and wetland becoming enhanced carbon sinks under most smoke conditions, with the exception of heavy smoke conditions. This has implications for the regional carbon budget if the duration and frequency of smoke events increase as a result of climate change. However, we identify significant limitations in this preliminary research and identify a complex array of processes that contribute to biophysical and biogeochemical responses. Before attempting to scale up, further research is required in different forest types across the region to identify and control for the numerous processes and feedbacks influencing local carbon budgets in forest and wetland ecosystems.
An R programmatic interface for querying, downloading, and handling AmeriFlux data and metadata can be found at https://github.com/chuhousen/amerifluxr (Chu and Hufkens, 2021).
Data for the two study sites are available through AmeriFlux at https://doi.org/10.17190/AMF/1480302 (Black, 2021) and https://doi.org/10.17190/AMF/1543378 (Christen and Knox, 2021).
The supplement related to this article is available online at: https://doi.org/10.5194/acp-22-2333-2022-supplement.
The contact author has declared that neither they nor their co-authors have any competing interests.
Publisher's note: Copernicus Publications remains neutral with regard to jurisdictional claims in published maps and institutional affiliations.
We are grateful to the Natural Sciences and Engineering Research Council of Canada (NSERC) for support to individual researchers and graduate students involved in this work. The Buckley Bay flux tower was funded by NSERC and the Canadian Foundation for Innovation (CFI). We sincerely thank Island Timberlands LP for the permission to work on their land and their logistical support. The Burns Bog flux tower operation was funded by Metro Vancouver through contracts to Andreas Christen and Sara Knox. Selected instrumentation was supported by NSERC and CFI. We thank the substantial technical and logistical support by staff from Metro Vancouver and the city of Delta. We greatly appreciate the assistance of Robert Halsall, Rick Ketler, Zoran Nesic, and Marion Nyberg with their invaluable field and technical support.
This research has been supported by the Natural Sciences and Engineering Research Council of Canada (grant no. 85335127).
This paper was edited by Thomas Karl and reviewed by two anonymous referees.
Alton, P., Mercado, L., and North, P.: A sensitivity analysis of the land-surface scheme JULES conducted for three forest biomes: Biophysical parameters, model processes, and meteorological driving data, Global Biogeochem. Cy., 20, GB1008, https://doi.org/10.1029/2005GB002653, 2006.
Alton, P. B.: Reduced carbon sequestration in terrestrial ecosystems under overcast skies compared to clear skies, Agr. Forest Meteorol., 148, 1641–1653, 2008.
Barr, A. G., Black, T. A., Hogg, E. H., Kljun, N., Morgenstern, K., and Nesic, Z.: Inter-annual variability in the leaf area index of a boreal aspen-hazelnut forest in relation to net ecosystem production, Agr. Forest Meteorol., 126, 237–255, 2004.
Black, T. A.: AmeriFlux BASE CA-Ca3 British Columbia – Pole sapling Douglas-fir stand, Ver. 3–5, AmeriFlux AMP [data set], https://doi.org/10.17190/AMF/1480302, 2021.
Brümmer, C., Black, T. A., Jassal, R. S., Grant, N. J., Spittlehouse, D. L., Chen, B., Nesic, Z., Amiro, B. D., Arain, M. A., and Barr, A. G.: How climate and vegetation type influence evapotranspiration and water use efficiency in Canadian forest, peatland and grassland ecosystems, Agr. Forest Meteorol., 153, 14–30, 2012.
Chen, B., Black, T. A., Coops, N. C., Hilker, T., Trofymow, J. A. T., and Morgenstern, K.: Assessing tower flux footprint climatology and scaling between remotely sensed and eddy covariance measurements, Bound.-Lay. Meteorol., 130, 137–167, 2009.
Cheng, S. J., Bohrer, G., Steiner, A. L., Hollinger, D. Y., Suyker, A., Phillips, R. P., and Nadelhoffer, K. J.: Variations in the influence of diffuse light on gross primary productivity in temperate ecosystems, Agr. Forest Meteorol., 201, 98–110, 2015.
Cheng, S. J., Steiner, A. L., Hollinger, D. Y., Bohrer, G., and Nadelhoffer, K. J.: Using satellite-derived optical thickness to assess the influence of clouds on terrestrial carbon uptake, J. Geophys. Res.-Biogeo., 121, 1747–1761, 2016.
Christen, A. and Knox, S.: AmeriFlux BASE CA-DBB Delta Burns Bog, Ver (Vol. 2–5), AmeriFlux AMP [data set], https://doi.org/10.17190/AMF/1543378, 2021.
Christen, A., Jassal, R. S., Black, T. A., Grant, N. J., Hawthorne, I., Johnson, M. S., Lee, S.-C., and Merkens, M.: Summertime greenhouse gas fluxes from an urban bog undergoing restoration through rewetting, Mires Peat, 17, 1–24, https://doi.org/10.19189/MaP.2015.OMB.207, 2016.
Chu, H. and Hufkens, K.: “amerifluxr v1.0.0.” Computer software, Github [code], https://github.com/chuhousen/amerifluxr, last access: 10 May 2021.
Chubarova, N., Nezval', Ye., Sviridenkov, I., Smirnov, A., and Slutsker, I.: Smoke aerosol and its radiative effects during extreme fire event over Central Russia in summer 2010, Atmos. Meas. Tech., 5, 557–568, https://doi.org/10.5194/amt-5-557-2012, 2012.
Crutzen, P. J. and Andreae, M. O.: Biomass burning in the tropics: Impact on atmospheric chemistry and biogeochemical cycles, Science (80–), 250, 1669–1678, 1990.
Crutzen, P. J., Heidt, L. E., Krasnec, J. P., Pollock, W. H., and Seiler, W.: Biomass burning as a source of atmospheric gases CO, H2, N2O, NO, CH3Cl and COS, Nature, 282, 253–256, 1979.
D'Acunha, B., Morillas, L., Black, T. A., Christen, A., and Johnson, M. S.: Net ecosystem carbon balance of a peat bog undergoing restoration: integrating CO2 and CH4 fluxes from eddy covariance and aquatic evasion with DOC drainage fluxes, J. Geophys. Res.-Biogeo., 124, 884–901, 2019.
Doughty, C. E., Flanner, M. G., and Goulden, M. L.: Effect of smoke on subcanopy shaded light, canopy temperature, and carbon dioxide uptake in an Amazon rainforest, Global Biogeochem. Cy., 24, GB3015, https://doi.org/10.1029/2009GB003670, 2010.
Ezhova, E., Ylivinkka, I., Kuusk, J., Komsaare, K., Vana, M., Krasnova, A., Noe, S., Arshinov, M., Belan, B., Park, S.-B., Lavrič, J. V., Heimann, M., Petäjä, T., Vesala, T., Mammarella, I., Kolari, P., Bäck, J., Rannik, Ü., Kerminen, V.-M., and Kulmala, M.: Direct effect of aerosols on solar radiation and gross primary production in boreal and hemiboreal forests, Atmos. Chem. Phys., 18, 17863–17881, https://doi.org/10.5194/acp-18-17863-2018, 2018.
Feingold, G., Jiang, H., and Harrington, J. Y.: On smoke suppression of clouds in Amazonia, Geophys. Res. Lett., 32, L02804, https://doi.org/10.1029/2004GL021369, 2005.
Ferrara, M., Pomeroy, C., McKendry, I. G., Stull, R., and Strawbridge, K.: Suppression of “Handover” Processes in a Mountain Convective Boundary Layer due to Persistent Wildfire Smoke, Bound.-Lay. Meteorol., 175, 297–308, https://doi.org/10.1029/2009JD0121722, 2020.
Gu, L., Baldocchi, D., Verma, S. B., Black, T. A., Vesala, T., Falge, E. M., and Dowty, P. R.: Advantages of diffuse radiation for terrestrial ecosystem productivity, J. Geophys. Res.-Atmos., 107, 4050, https://doi.org/10.1029/2001JD001242, 2002.
Hemes, K. S., Verfaillie, J., and Baldocchi, D. D.: Wildfire-smoke aerosols lead to increased light use efficiency among agricultural and restored wetland land uses in California's Central Valley, J. Geophys. Res.-Biogeo., 125, e2019JG005380, https://doi.org/10.1029/2019JG005380, 2020.
Holben, B. N., Eck, T. F., Slutsker, I., Tanré, D., Buis, J. P., Setzer, A., Vermote, E., Reagan, J. A., Kaufman, Y. J., Nakajima, T., Lavenu, F., Jankowiak, I., and Smirnov, A.: AERONET – A federated instrument network and data archive for aerosol characterization, Remote Sens. Environ., 66, 1–16, https://doi.org/10.1016/S0034-4257(98)00031-5, 1998.
Hollinger, D. Y., Kelliher, F. M., Byers, J. N., Hunt, J. E., McSeveny, T. M., and Weir, P. L.: Carbon dioxide exchange between an undisturbed old-growth temperate forest and the atmosphere, Ecology, 75, 134–150, 1994.
Hovi, A., Liang, J., Korhonen, L., Kobayashi, H., and Rautiainen, M.: Quantifying the missing link between forest albedo and productivity in the boreal zone, Biogeosciences, 13, 6015–6030, https://doi.org/10.5194/bg-13-6015-2016, 2016.
Humphreys, E. R., Black, T. A., Morgenstern, K., Cai, T., Drewitt, G. B., Nesic, Z., and Trofymow, J. A.: Carbon dioxide fluxes in coastal Douglas-fir stands at different stages of development after clearcut harvesting, Agr. Forest Meteorol., 140, 6–22, 2006.
Jacobson, M. Z.: Effects of biomass burning on climate, accounting for heat and moisture fluxes, black and brown carbon, and cloud absorption effects, J. Geophys. Res.-Atmos., 119, 8980–9002, 2014.
Jaffe, D. A. and Wigder, N. L.: Ozone production from wildfires: A critical review, Atmos. Environ., 51, 1–10, 2012.
Jassal, R. S., Black, T. A., Spittlehouse, D. L., Brümmer, C., and Nesic, Z.: Evapotranspiration and water use efficiency in different-aged Pacific Northwest Douglas-fir stands, Agr. Forest Meteorol., 149, 1168–1178, 2009.
Jiang, H. and Feingold, G.: Effect of aerosol on warm convective clouds: Aerosol–cloud–surface flux feedbacks in a new coupled large eddy model, J. Geophys. Res.-Atmos., 111, D01202, https://doi.org/10.1029/2005JD006138, 2006.
Kanniah, K. D., Beringer, J., North, P., and Hutley, L.: Control of atmospheric particles on diffuse radiation and terrestrial plant productivity: A review, Prog. Phys. Geog., 36, 209–237, 2012.
Knohl, A. and Baldocchi, D. D.: Effects of diffuse radiation on canopy gas exchange processes in a forest ecosystem, J. Geophys. Res.-Biogeo., 113, G02023, https://doi.org/10.1029/2007JG000663, 2008.
Krishnan, P., Black, T. A., Jassal, R. S., Chen, B., and Nesic, Z.: Interannual variability of the carbon balance of three different-aged Douglas-fir stands in the Pacific Northwest, J. Geophys. Res.-Biogeo., 114, G04011, https://doi.org/10.1029/2008JG000912, 2009.
Landry, J.-S., Matthews, H. D., and Ramankutty, N.: A global assessment of the carbon cycle and temperature responses to major changes in future fire regime, Climatic Change, 133, 179–192, 2015.
Lapere, R., Mailler, S., and Menut, L.: The 2017 Mega-Fires in Central Chile: Impacts on Regional Atmospheric Composition and Meteorology Assessed from Satellite Data and Chemistry-Transport Modeling, Atmosphere-Basel, 12, 344, https://doi.org/10.3390/atmos12030344, 2021.
Lasslop, G., Coppola, A. I., Voulgarakis, A., Yue, C., and Veraverbeke, S.: Influence of fire on the carbon cycle and climate, Curr. Clim. Chang. Reports, 5, 112–123, 2019.
Lee, M. S., Hollinger, D. Y., Keenan, T. F., Ouimette, A. P., Ollinger, S. V., and Richardson, A. D.: Model-based analysis of the impact of diffuse radiation on CO2 exchange in a temperate deciduous forest, Agr. Forest Meteorol., 249, 377–389, 2018.
Lee, S.-C., Christen, A., Black, A. T., Johnson, M. S., Jassal, R. S., Ketler, R., Nesic, Z., and Merkens, M.: Annual greenhouse gas budget for a bog ecosystem undergoing restoration by rewetting, Biogeosciences, 14, 2799–2814, https://doi.org/10.5194/bg-14-2799-2017, 2017.
Lee, S.-C., Black, T. A., Jassal, R. S., Christen, A., Meyer, G., and Nesic, Z.: Long-term impact of nitrogen fertilization on carbon and water fluxes in a Douglas-fir stand in the Pacific Northwest, Forest Ecol. Manag., 455, 117645, https://doi.org/10.1016/j.foreco.2019.117645, 2020a.
Lee, S.-C., Christen, A., Black, T. A., Jassal, R. S., Ketler, R., and Nesic, Z.: Partitioning of net ecosystem exchange into photosynthesis and respiration using continuous stable isotope measurements in a Pacific Northwest Douglas-fir forest ecosystem, Agr. Forest Meteorol., 292, 108109, https://doi.org/10.1016/j.agrformet.2020.108109, 2020b.
Letts, M. G., Lafleur, P. M., and Roulet, N. T.: On the relationship between cloudiness and net ecosystem carbon dioxide exchange in a peatland ecosystem, Ecoscience, 12, 53–69, 2005.
Malavelle, F. F., Haywood, J. M., Mercado, L. M., Folberth, G. A., Bellouin, N., Sitch, S., and Artaxo, P.: Studying the impact of biomass burning aerosol radiative and climate effects on the Amazon rainforest productivity with an Earth system model, Atmos. Chem. Phys., 19, 1301–1326, https://doi.org/10.5194/acp-19-1301-2019, 2019.
Mallet, M., Tulet, P., Serça, D., Solmon, F., Dubovik, O., Pelon, J., Pont, V., and Thouron, O.: Impact of dust aerosols on the radiative budget, surface heat fluxes, heating rate profiles and convective activity over West Africa during March 2006, Atmos. Chem. Phys., 9, 7143–7160, https://doi.org/10.5194/acp-9-7143-2009, 2009.
Markowicz, K. M., Lisok, J., and Xian, P.: Simulations of the effect of intensive biomass burning in July 2015 on Arctic radiative budget, Atmos. Environ., 171, 248–260, 2017.
Markowicz, K. M., Zawadzka-Manko, O., Lisok, J., Chilinski, M. T., and Xian, P.: The impact of moderately absorbing aerosol on surface sensible, latent, and net radiative fluxes during the summer of 2015 in Central Europe, J. Aerosol Sci., 151, 105627, https://doi.org/10.1016/j.jaerosci.2020.105627, 2021.
McKendry, I., Strawbridge, K., Karumudi, M. L., O'Neill, N., Macdonald, A. M., Leaitch, R., Jaffe, D., Cottle, P., Sharma, S., Sheridan, P., and Ogren, J.: Californian forest fire plumes over Southwestern British Columbia: lidar, sunphotometry, and mountaintop chemistry observations, Atmos. Chem. Phys., 11, 465–477, https://doi.org/10.5194/acp-11-465-2011, 2011.
McKendry, I. G., Christen, A., Lee, S.-C., Ferrara, M., Strawbridge, K. B., O'Neill, N., and Black, A.: Impacts of an intense wildfire smoke episode on surface radiation, energy and carbon fluxes in southwestern British Columbia, Canada, Atmos. Chem. Phys., 19, 835–846, https://doi.org/10.5194/acp-19-835-2019, 2019.
Millennium Ecosystem Assessment: Ecosystems and human well-being, Island Press, Washington, DC, USA, ISBN 9781597260404, 2005.
Ministry of Forest: British Columbia's forest: and their management, https://www.for.gov.bc.ca/hfd/pubs/Docs/Mr/Mr113.htm (last access: 10 February 2022), 2003.
Ministry of Forests Mines and Land: The State of British Columbia's Forests Third Edition, https://www2.gov.bc.ca/assets/gov/environment/research-monitoring-and-reporting/reporting/envreportbc/archived-reports/sof_2010.pdf (last access: 10 February 2022), 2010.
Moncrieff, J. B., Massheder, J. M., DeBruin, H., Elbers, J., Friborg, T., Heusinkveld, B., Kabat, P., Scott, S., Søgaard, H., and Verhoef, A.: A system to measure surface fluxes of momentum, sensible heat, water vapour and carbon dioxide, J. Hydrol., 188, 589–611, 1997.
Moreira, D. S., Longo, K. M., Freitas, S. R., Yamasoe, M. A., Mercado, L. M., Rosário, N. E., Gloor, E., Viana, R. S. M., Miller, J. B., Gatti, L. V., Wiedemann, K. T., Domingues, L. K. G., and Correia, C. C. S.: Modeling the radiative effects of biomass burning aerosols on carbon fluxes in the Amazon region, Atmos. Chem. Phys., 17, 14785–14810, https://doi.org/10.5194/acp-17-14785-2017, 2017.
Morgenstern, K., Black, T. A., Humphreys, E. R., Griffis, T. J., Drewitt, G. B., Cai, T., Nesic, Z., Spittlehouse, D. L., and Livingston, N. J.: Sensitivity and uncertainty of the carbon balance of a Pacific Northwest Douglas-fir forest during an El Niño/La Niña cycle, Agr. Forest Meteorol., 123, 201–219, 2004.
Niyogi, D., Chang, H., Saxena, V. K., Holt, T., Alapaty, K., Booker, F., Chen, F., Davis, K. J., Holben, B., and Matsui, T.: Direct observations of the effects of aerosol loading on net ecosystem CO2 exchanges over different landscapes, Geophys. Res. Lett., 31, L20506, https://doi.org/10.1029/2004GL020915., 2004.
Nojarov, P., Arsov, T., Kalapov, I., and Angelov, H.: Aerosol direct effects on global solar shortwave irradiance at high mountainous station Musala, Bulgaria, Atmos. Environ., 244, 117944, https://doi.org/10.1016/j.atmosenv.2020.117944, 2021.
Oliphant, A. J., Dragoni, D., Deng, B., Grimmond, C. S. B., Schmid, H.-P., and Scott, S. L.: The role of sky conditions on gross primary production in a mixed deciduous forest, Agr. Forest Meteorol., 151, 781–791, 2011.
Oris, F., Asselin, H., Ali, A. A., Finsinger, W., and Bergeron, Y.: Effect of increased fire activity on global warming in the boreal forest, Environ. Rev., 22, 206–219, 2014.
IPCC: Climate Change 2014: Synthesis Report, in: Contribution of Working Groups I, II and III to the Fifth Assessment Report of the Intergovernmental Panel on Climate Change, edited by: Core Writing Team, Pachauri, R. K., and Meyer, L. A., IPCC, Geneva, Switzerland, 151 pp., 2014.
Papale, D., Reichstein, M., Aubinet, M., Canfora, E., Bernhofer, C., Kutsch, W., Longdoz, B., Rambal, S., Valentini, R., Vesala, T., and Yakir, D.: Towards a standardized processing of Net Ecosystem Exchange measured with eddy covariance technique: algorithms and uncertainty estimation, Biogeosciences, 3, 571–583, https://doi.org/10.5194/bg-3-571-2006, 2006.
Park, S.-B., Knohl, A., Lucas-Moffat, A. M., Migliavacca, M., Gerbig, C., Vesala, T., Peltola, O., Mammarella, I., Kolle, O., and Lavrič, J. V.: Strong radiative effect induced by clouds and smoke on forest net ecosystem productivity in central Siberia, Agr. Forest Meteorol., 250, 376–387, 2018.
Péré, J. C., Bessagnet, B., Mallet, M., Waquet, F., Chiapello, I., Minvielle, F., Pont, V., and Menut, L.: Direct radiative effect of the Russian wildfires and its impact on air temperature and atmospheric dynamics during August 2010, Atmos. Chem. Phys., 14, 1999–2013, https://doi.org/10.5194/acp-14-1999-2014, 2014.
Pfister, G. G., Wiedinmyer, C., and Emmons, L. K.: Impacts of the fall 2007 California wildfires on surface ozone: Integrating local observations with global model simulations, Geophys. Res. Lett., 35, L19814, https://doi.org/10.1029/2008GL034747, 2008.
Rap, A., Spracklen, D. V., Mercado, L., Reddington, C. L., Haywood, J. M., Ellis, R. J., Phillips, O. L., Artaxo, P., Bonal, D., Restrepo Coupe, N., and Butt, N.: Fires increase Amazon forest productivity through increases in diffuse radiation, Geophys. Res. Lett., 42, 4654–4662, https://doi.org/10.1002/2015GL063719, 2015.
R Core Tea.: R: A language and environment for statistical computing, https://www.r-project.org/ (last access: 10 February 2022), 2017.
Reichstein, M., Falge, E., Baldocchi, D., Papale, D., Aubinet, M., Berbigier, P., Bernhofer, C., Buchmann, N., Gilmanov, T., and Granier, A.: On the separation of net ecosystem exchange into assimilation and ecosystem respiratio.: review and improved algorithm, Glob. Change Biol., 11, 1424–1439, 2005.
Rosário, N. E., Longo, K. M., Freitas, S. R., Yamasoe, M. A., and Fonseca, R. M.: Modeling the South American regional smoke plume: aerosol optical depth variability and surface shortwave flux perturbation, Atmos. Chem. Phys., 13, 2923–2938, https://doi.org/10.5194/acp-13-2923-2013, 2013.
Schafer, J. S., Eck, T. F., Holben, B. N., Artaxo, P., Yamasoe, M. A., and Procopio, A. S.: Observed reductions of total solar irradiance by biomass-burning aerosols in the Brazilian Amazon and Zambian Savanna, Geophys. Res. Lett., 29, 1–4, 2002.
Sena, E. T., Artaxo, P., and Correia, A. L.: Spatial variability of the direct radiative forcing of biomass burning aerosols and the effects of land use change in Amazonia, Atmos. Chem. Phys., 13, 1261–1275, https://doi.org/10.5194/acp-13-1261-2013, 2013.
Settele, J., Scholes, R., Betts, R. A., Bunn, S., Leadley, P., Nepstad, D., Overpeck, J., Taboada, M. A., Fischlin, A., and Moreno, J. M.: Terrestrial and inland water systems, in: Climate change 2014 impacts, adaptation and vulnerability: Part A: Global and sectoral aspects, Cambridge University Press, Cambridge, UK and New York, NY, USA, 271–360, 2015.
Steiner, A. L., Mermelstein, D., Cheng, S. J., Twine, T. E., and Oliphant, A.: Observed impact of atmospheric aerosols on the surface energy budget, Earth Interact., 17, 1–22, 2013.
Strada, S., Unger, N., and Yue, X.: Observed aerosol-induced radiative effect on plant productivity in the eastern United States, Atmos. Environ., 122, 463–476, 2015.
Taubman, B. F., Marufu, L. T., Vant-Hull, B. L., Piety, C. A., Doddridge, B. G., Dickerson, R. R., and Li, Z.: Smoke over haze: Aircraft observations of chemical and optical properties and the effects on heating rates and stability, J. Geophys. Res.-Atmos., 109, D02206, https://doi.org/10.1029/2003JD003898, 2004.
Ward, D. S., Kloster, S., Mahowald, N. M., Rogers, B. M., Randerson, J. T., and Hess, P. G.: The changing radiative forcing of fires: global model estimates for past, present and future, Atmos. Chem. Phys., 12, 10857–10886, https://doi.org/10.5194/acp-12-10857-2012, 2012.
Wetland Stewardship Partnership: Wetland Ways: Interim Guidelines for Wetland Protection and Conservation in British Columbia, https://www2.gov.bc.ca/gov/content/environment/air-land-water/water/water-planning-strategies/wetlands-in-bc (last access: 10 February 2022), 2009.
Wutzler, T., Lucas-Moffat, A., Migliavacca, M., Knauer, J., Sickel, K., Šigut, L., Menzer, O., and Reichstein, M.: Basic and extensible post-processing of eddy covariance flux data with REddyProc, Biogeosciences, 15, 5015–5030, https://doi.org/10.5194/bg-15-5015-2018, 2018.
Yamasoe, M. A., von Randow, C., Manzi, A. O., Schafer, J. S., Eck, T. F., and Holben, B. N.: Effect of smoke and clouds on the transmissivity of photosynthetically active radiation inside the canopy, Atmos. Chem. Phys., 6, 1645–1656, https://doi.org/10.5194/acp-6-1645-2006, 2006.
Yamasoe, M. A., Do Rosario, N. M. E., and Barros, K. M. D.: Downward solar global irradiance at the surface in São Paulo city – The climatological effects of aerosol and clouds, J. Geophys. Res.-Atmos., 122, 391–404, 2017.
Yu, H., Liu, S. C., and Dickinson, R. E.: Radiative effects of aerosols on the evolution of the atmospheric boundary layer, J. Geophys. Res.-Atmos., 107, 4142, https://doi.org/10.1029/2001JD000754, 2002.
Zhou, H., Yue, X., Lei, Y., Zhang, T., Tian, C., Ma, Y., and Cao, Y.: Responses of gross primary productivity to diffuse radiation at global FLUXNET sites, Atmos. Environ., 244, 117905, https://doi.org/10.1016/j.atmosenv.2020.117905, 2021.