the Creative Commons Attribution 4.0 License.
the Creative Commons Attribution 4.0 License.
 | 16 Feb 2022
Atmospheric oxidation capacity and ozone pollution mechanism in a coastal city of southeastern China: analysis of a typical photochemical episode by an observation-based model
Taotao Liu
Youwei Hong
Mengren Li
Lingling Xu
Yahui Bian
Chen Yang
Yangbin Dan
Yingnan Zhang
Likun Xue
Min Zhao
Zhi Huang
Hong Wang
A typical multi-day ozone (O3) pollution event was chosen to explore the atmospheric oxidation capacity (AOC), OH reactivity, radical chemistry, and O3 pollution mechanism in a coastal city of southeastern China, with an observation-based model coupled to the Master Chemical Mechanism (OBM-MCM). The hydroxyl radical (OH) was the predominant oxidant (90 ± 25 %) for daytime AOC, while the NO3 radical played an important role in AOC during the nighttime (72 ± 9 %). Oxygenated volatile organic compounds (OVOCs; 30 ± 8 %), NO2 (29 ± 8 %), and CO (25 ± 5 %) were the dominant contributors to OH reactivity, accelerating the production of O3 and recycling of ROx radicals (ROx = OH + HO2 + RO2). Photolysis of nitrous acid (HONO, 33 ± 14 %), O3 (25 ± 13 %), formaldehyde (HCHO, 20 ± 5 %), and other OVOCs (17 ± 2 %) was a major ROx source, which played an initiation role in atmospheric oxidation processes. Combined with regional transport analysis, the reasons for this O3 episode were the accumulation of local photochemical production and regional transport. The results of sensitivity analysis showed that volatile organic compounds (VOCs) were the limiting factor of radical recycling and O3 formation, and the 5 % reduction of O3 would be achieved by decreasing 20 % anthropogenic VOCs. Controlling emissions of aromatics, alkenes, and alkanes with ≥4 carbons was beneficial for ozone pollution mitigation. The findings of this study provide significant guidance for emission reduction and regional collaboration for future photochemical pollution control in the relatively clean coastal cities of China and similar countries.
- Article
(6847 KB) - Full-text XML
-
Supplement
(1621 KB) - BibTeX
- EndNote


Tropospheric ozone (O3) is mainly produced by photochemical reactions of anthropogenic and natural emitted volatile organic compounds (VOCs) and nitrogen oxides (NOx) and is an important factor resulting in regional air pollution (Zhu et al., 2020; Lu et al., 2018). Elevated O3 concentrations enhance the atmospheric oxidation capacity (AOC) and have harmful effects on global climate change, ecosystems, and human health (J. Liu et al., 2019; Fowler et al., 2009). The formation mechanisms of O3 pollution are extremely difficult to figure out, due to the complex types and sources of its precursors (Simon et al., 2015). O3 formation is affected by multiple factors, such as O3 precursor speciation or level, atmospheric oxidation capacity, meteorological conditions, and regional transport (Gong and Liao, 2019; Chang et al., 2019). To effectively control tropospheric O3 pollution, exploration of the photochemical mechanism and judgment of the controlling factors of O3 formation have become extremely important for the scientific community (Chen et al., 2020; Li et al., 2018).
The atmospheric oxidation capacity reflects the essential driving force in tropospheric chemistry and plays an important place in the loss rates of primary components and production rates of secondary pollutants; thus the key factors to quantify AOC are processes and rates of species being oxidized in the atmosphere (Elshorbany et al., 2009). Atmospheric conditions (such as photolysis rate, meteorology, pollutant concentrations, and regional transport) together influence the AOC levels, and the AOC levels in polluted urban regions are generally much higher than those at the background sites or remote regions due to the dominant limiting factor for the significant differences of pollutant concentrations (Geyer et al., 2001; Xue et al., 2016). ROx radicals, including the hydroxyl radical (OH), hydroperoxy radical (HO2), and organic peroxy radical (RO2), are very important indicators in atmospheric photochemistry and dominate the atmospheric oxidation capacity (Li et al., 2018). Meanwhile, radical chemistry drives the transformation and recycling of O3 through initiating atmospheric oxidation processes (Wang et al., 2020). Among these radicals, the OH radical accounts for the majority of AOC over 90 % during the daytime; thus the OH reactivity (i.e., OH loss) indicates the primary contribution of individual pollutants (H. Wang et al., 2018; Mao et al., 2010). Hence, atmospheric oxidation capacity, OH reactivity, and radical chemistry are crucial aspects for understanding the complex atmospheric photochemistry processes (Li et al., 2018). For example, major ROx sources are the photolysis reaction of O3, formaldehyde (HCHO), other oxygenated volatile organic compounds (OVOCs), nitrous acid (HONO), and the reactions of O3 with unsaturated volatile organic compounds (VOCs; Volkamer et al., 2010). The dominant ROx sources at some rural sites were O3 photolysis and O3 reactions with VOCs (Li et al., 2018; Martinez et al., 2003), and those at many urban sites were HONO and OVOC photolysis (Xue et al., 2016; Liu et al., 2012; Emmerson et al., 2005). For oil and gas field sites, there were highly abundant VOCs to promote the formation of O3, and the contribution of OVOC photolysis was 2–5 times higher than that in urban areas (Chen et al., 2020; Edwards et al., 2013, 2014). HONO photolysis was a very important ROx source at the high-altitude or background sites. (Acker et al., 2001; Jiang et al., 2020).
Current studies of atmospheric O3 photochemical pollution observations have been conducted at urban, suburban, rural, and remote sites around the world (Smith et al., 2006; Eisele et al., 1997; Kanaya et al., 2001; Hofzumahaus et al., 2009; George et al., 1999; Emmerson et al., 2005; Kanaya et al., 2007; Michoud et al., 2012). In China, O3 photochemical pollution events have been reported in some megacities, such as Beijing, Shanghai, Guangzhou, and Chengdu (Liu et al., 2012; Tan et al., 2019; Zhu et al., 2020; Wang et al., 2020; X. Liu et al., 2019; Ling et al., 2017). Few studies on O3 photochemical pollution in cities with low O3 precursor emissions have been reported, and the air quality in these areas usually depends on the change of meteorological conditions. In a coastal city of southeastern China, the concentrations of O3 precursors were higher than those in remote sites and background but lower than those in most urban and suburban areas, even lower than those in rural regions (Table S1). In a word, O3 precursor emissions in our observation site were relatively low. Meanwhile, the southeastern coastal region is influenced by the East Asian monsoon and acts as an important transport path between the Yangtze River Delta (YRD) and the Pearl River Delta (PRD) (T. Liu et al., 2020a, b), which is a good “laboratory” to further explore O3 photochemical pollution and formation mechanisms with relatively low O3 precursors and complex meteorological conditions (Zhang et al., 2020b; Hu et al., 2020).
Observation-based models (OBMs) are widely used to investigate O3–VOC–NOx relationships and radical chemistry (H. Wang et al., 2018; Tan et al., 2019). The O3 sensitivity revealed the nonlinear relationship between O3 and its precursors (i.e., VOCs and NOx), which was established to investigate O3 formation mechanisms and control strategies (Wang et al., 2020). An OBM combined with the Master Chemical Mechanism (V3.3.1) (OBM-MCM) has been applied to explore the O3 photochemical pollution mechanism in different environmental conditions (Chen et al., 2020; Li et al., 2018; Xue et al., 2016; H. Wang et al., 2018). In this study, we chose a typical multi-day O3 pollution event in the coastal city Xiamen (Fig. S1), when Xiamen was affected by various meteorological conditions, such as typhoons and the West Pacific Subtropical High (WPSH), accompanied by temperature inversion phenomena. Based on the OBM-MCM analyses, the study aims to clarify (1) the pollution characteristics of O3 and its precursors, (2) the atmospheric oxidation capacity and radical chemistry, and (3) the O3 formation mechanism and sensitivity analysis. The results are expected to enhance the understanding of the O3 formation mechanism with low O3 precursor levels and provide scientific evidence for O3 pollution control in the coastal cities.
2.1 Study area and field observations
Xiamen is a coastal city in the southeastern area of China, to the west coast of the Taiwan Strait. The field campaigns were carried out at the Atmospheric Environment Observation Supersite (24.61∘ N, 118.06∘ E) on the rooftop of around 70 m high building in the Institute of Urban Environment, Chinese Academy of Sciences. The supersite was equipped with complete monitoring instruments to measure gas and aerosol species compositions, O3 precursors, meteorological parameters, and photolysis rate. Criteria air pollutants of O3, SO2, NO–NO2–NOx, and CO were monitored by commercial instruments TEI 49i, 43i, 42i, and 48i (Thermo Fisher Scientific, USA), respectively. The meteorological parameters of wind speed (WS), wind direction (WD), air temperature (T), pressure (P), and relative humidity (RH) were measured by a weather station with a sonic anemometer (150WX, Airmar, USA). HONO was measured with an analyzer for Monitoring Aerosols and Gases in Ambient Air (MARGA; ADI 2080, Applikon Analytical B.V., the Netherlands). A gas chromatography–mass spectrometer (GC-FID/MS, TH-300B, Wuhan, CN) was used for the monitoring of atmospheric VOC concentrations, involving about 103 species of VOCs with a 1 h time resolution. Photolysis frequencies were measured by a photolysis spectrometer (PFS-100, Focused Photonics Inc., Hangzhou, China). The photolysis rate constants include J(O1D), J(NO2), J(H2O2), J(HONO), J(HCHO), and J(NO3). Strict quality assurance and quality control were applied, and the detailed descriptions of the monitoring procedures were documented in our previous studies (Zhang et al., 2020b; Wu et al., 2020; Liu et al., 2020a; T. Liu et al., 2020b; Hu et al., 2020).
2.2 Observation-based chemical box model
In this study, an observation-based model (OBM) combined with the latest version 3.3.1 of MCM (MCM v3.3.1; http://mcm.leeds.ac.uk/MCM/, last access: 25 July 2021), involving 142 non-methane VOCs and more than 17 000 elementary reactions of 6700 primary, secondary, and radical species (Jenkin et al., 2003; Saunders et al., 2003), was used to explore the atmospheric oxidation processes and O3 formation mechanisms. The physical process of deposition within the boundary layer height (BLH), which varied from 300 m during nighttime to 1500 m during the daytime in autumn (Li et al., 2018), was considered in the model. Therefore, the dry deposition velocity was utilized to simulate the deposition loss of some reactants in the atmosphere (shown in Table S2), which avoided continuous accumulation of pollutant concentrations in the model (Zhang et al., 2003; Xue et al., 2016).
The observation parameters of the gaseous pollutants (i.e., O3, CO, NO, NO2, HONO, SO2, and VOCs), meteorological parameters (i.e., T, P, and RH), and photolysis rate constants (J(O1D), J(NO2), J(H2O2), J(HONO), J(HCHO), and J(NO3)) were input into the OBM-MCM model as constraints. The photolysis rates of other molecules such as OVOCs were parameterized by solar zenith angle and then scaled by the measured J(NO2) (Saunders et al., 2003). We pre-ran the model for 5 d before the start of the experiment to initialize the unmeasured compounds and radicals (Xue et al., 2014).
OBM-MCM is mainly used to simulate in situ atmospheric photochemical processes and quantify the O3 production rate, AOC, OH reactivity, and ROx radical budgets. Among them, primary sources of ROx, including the photolysis reactions of O3, HONO, formaldehyde (HCHO), and other OVOCs, as well as reactions of VOCs with O3 and NO3 radicals, are important (Xue et al., 2016). The termination reactions of ROx are controlled by cross-reactions with NOx (under high-NOx conditions) and ROx (under low-NOx conditions) to form nitric acid, organic nitrates, and peroxides (Liu et al., 2012; Xue et al., 2016). Table 1 shows the production and destruction reactions and relevant reaction rates of O3 in our study. The production rate of O3 (P(O3)) includes RO2 + NO (R1) and HO2 + NO reactions (R2, Eq. 1), and the destruction of O3 (D(O3)) involves reactions of O3 photolysis (R3), O3 + OH (R4), O3 + HO2 (R5), NO2 + OH (R6), O3 + VOCs (R7), and NO3 + VOCs (R8, Eq. 2). The net O3 production rate (Pnet(O3)) is calculated by P(O3) minus D(O3), as in Eq. (3).
Table 1Simulated production and destruction reactions and relevant reaction rates of O3 in our study.
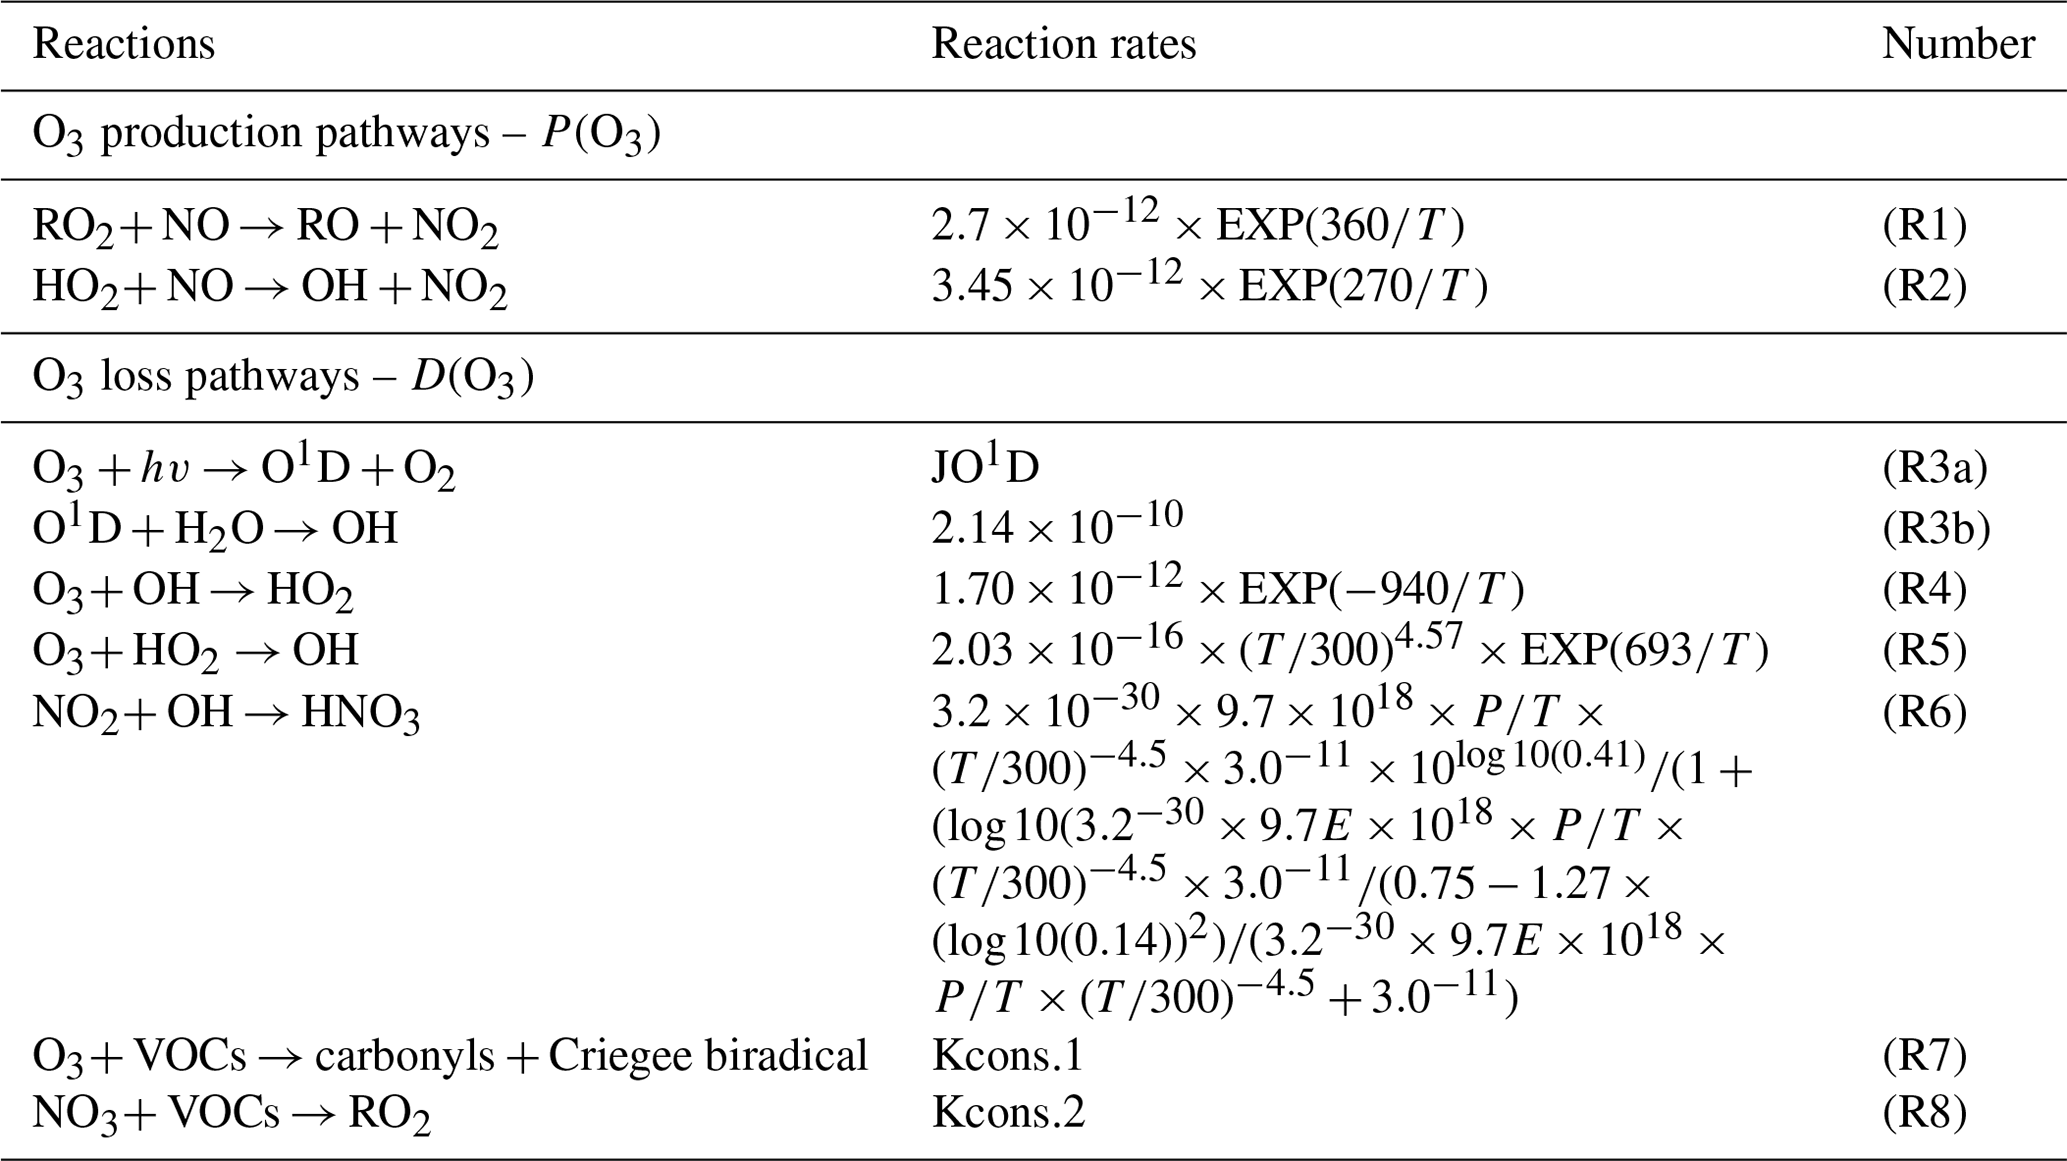
Note that the reaction rates of Kcons.1 and Kcons.2 were constant. There were around 700 reactions of VOCs + NO3 O3, and the relevant reaction rates were different, which can be obtained from http://mcm.leeds.ac.uk/MCM/ (last access: 25 July 2021).
where ki is the related reaction rate constant. Detailed descriptions of the chemistry calculation can be found elsewhere (Chen et al., 2020; H. Wang et al., 2018; Xue et al., 2014).
Relative incremental reactivity (RIR), an index to diagnose the sensitivity of O3 formation to precursors, is defined as the ratio of the differences in O3 production rate to the difference in precursor concentrations (Chen et al., 2020). Here, the in the OBM-MCM represents the percentage reduction in the input concentrations of each targeted O3 precursor group, and the value adopted is 20 % (X. Liu et al., 2020).
2.3 Model performance
The index of agreement (IOA) can be used to judge the reliability of the model simulation results, and its equation is (X. Liu et al., 2019)
where Si is the simulated value, Oi represents the observed values, denotes the average observed values, and n is the sample number. The IOA range is 0–1, and the higher the IOA value is, the better agreement there is between simulated and observed values. In many studies, when IOA ranges from 0.68 to 0.89 (Y. Wang et al., 2018), the simulation results are reasonable, and the IOA in our research is 0.80. Hence, the performance of the OBM-MCM model was reasonably acceptable.
2.4 Meteorological data and back trajectory calculation
The backward trajectories of air masses arriving at the observation site were calculated by MeteoInfo during the episode (Wang et al., 2014). The backward trajectories with 72 h were run with a time resolution of 3 h at 100 m height above ground level. The starting time was 00:00 LT, and the ending time was 23:00 LT. Meteorological data were provided by NOAA ARL (ftp://arlftp.arlhq.noaa.gov/pub/archives/gdas1, last access: 3 January 2020). The Final Operational Global Analysis data (FNL) are from the Global Data Assimilation System and analyze results with the model, which is also used by the National Center for Environmental Prediction (NCEP) in the Global Forecast System (GFS) (https://rda.ucar.edu/datasets/ds083.2/, last access: 17 December 2019). The weather charts were conducted using Grid Analysis and Display System (GrADS) with the specific programmed script files. A detailed description of the synoptic information was shown in our previous study (Wu et al., 2019).
3.1 Overview of observations
The O3 pollution events frequently appeared in the coastal city Xiamen during autumn, related to the WPSH, carrying favorable photochemical reaction conditions (high temperature, low RH, and stagnant weather conditions) and encouraging the formation and accumulation of O3 in the southeastern coastal area (H. Wang et al., 2018). The daily maximum 8 h average O3 concentrations (MDA8h O3) from 20 to 29 September 2019 ranged from 53 to 85 ppbv, partly exceeding Grade II of China's National Ambient Air Quality Standard of 75 ppbv. The time series and descriptive statistics of air pollutants and meteorological parameters during this multi-day O3 pollution event are shown in Fig. 1 and Table 2. During this period, the dominant wind direction was northeast, with an average wind speed of 1.8 ± 0.9 m s−1. The maximum hourly temperature was as high as 35 ∘C, and the average RH was 56.4 ± 12.6 %. Our previous study showed that particulate pollution was slight in Xiamen, which could affect solar radiation by the light-absorbing component, and the concentrations of particulate matter had not exceeded the National Ambient Air Quality Standard (Class II: 75 µg m−3) for a whole year (Hu et al., 2021; Deng et al., 2020). Therefore, solar radiation intensity and J(NO2) were strong, compared to those of the Yellow River Delta (Chen et al., 2020), Shanghai (Zhu et al., 2020), and Hong Kong (Xue et al., 2016). In general, these meteorological parameters were conducive to the production and accumulation of O3. In addition, O3 concentrations at nighttime stayed relatively high (Fig. 1), indicating the influence of regional transport and little NO titration (Zhang et al., 2020a; Wu et al., 2020). Figure S2 shows the 72 h back trajectories at the monitoring site. Among them, 80 % of the air masses came from the Yellow Sea, and the other 20 % air masses originated from the northeast China through long-range transport.
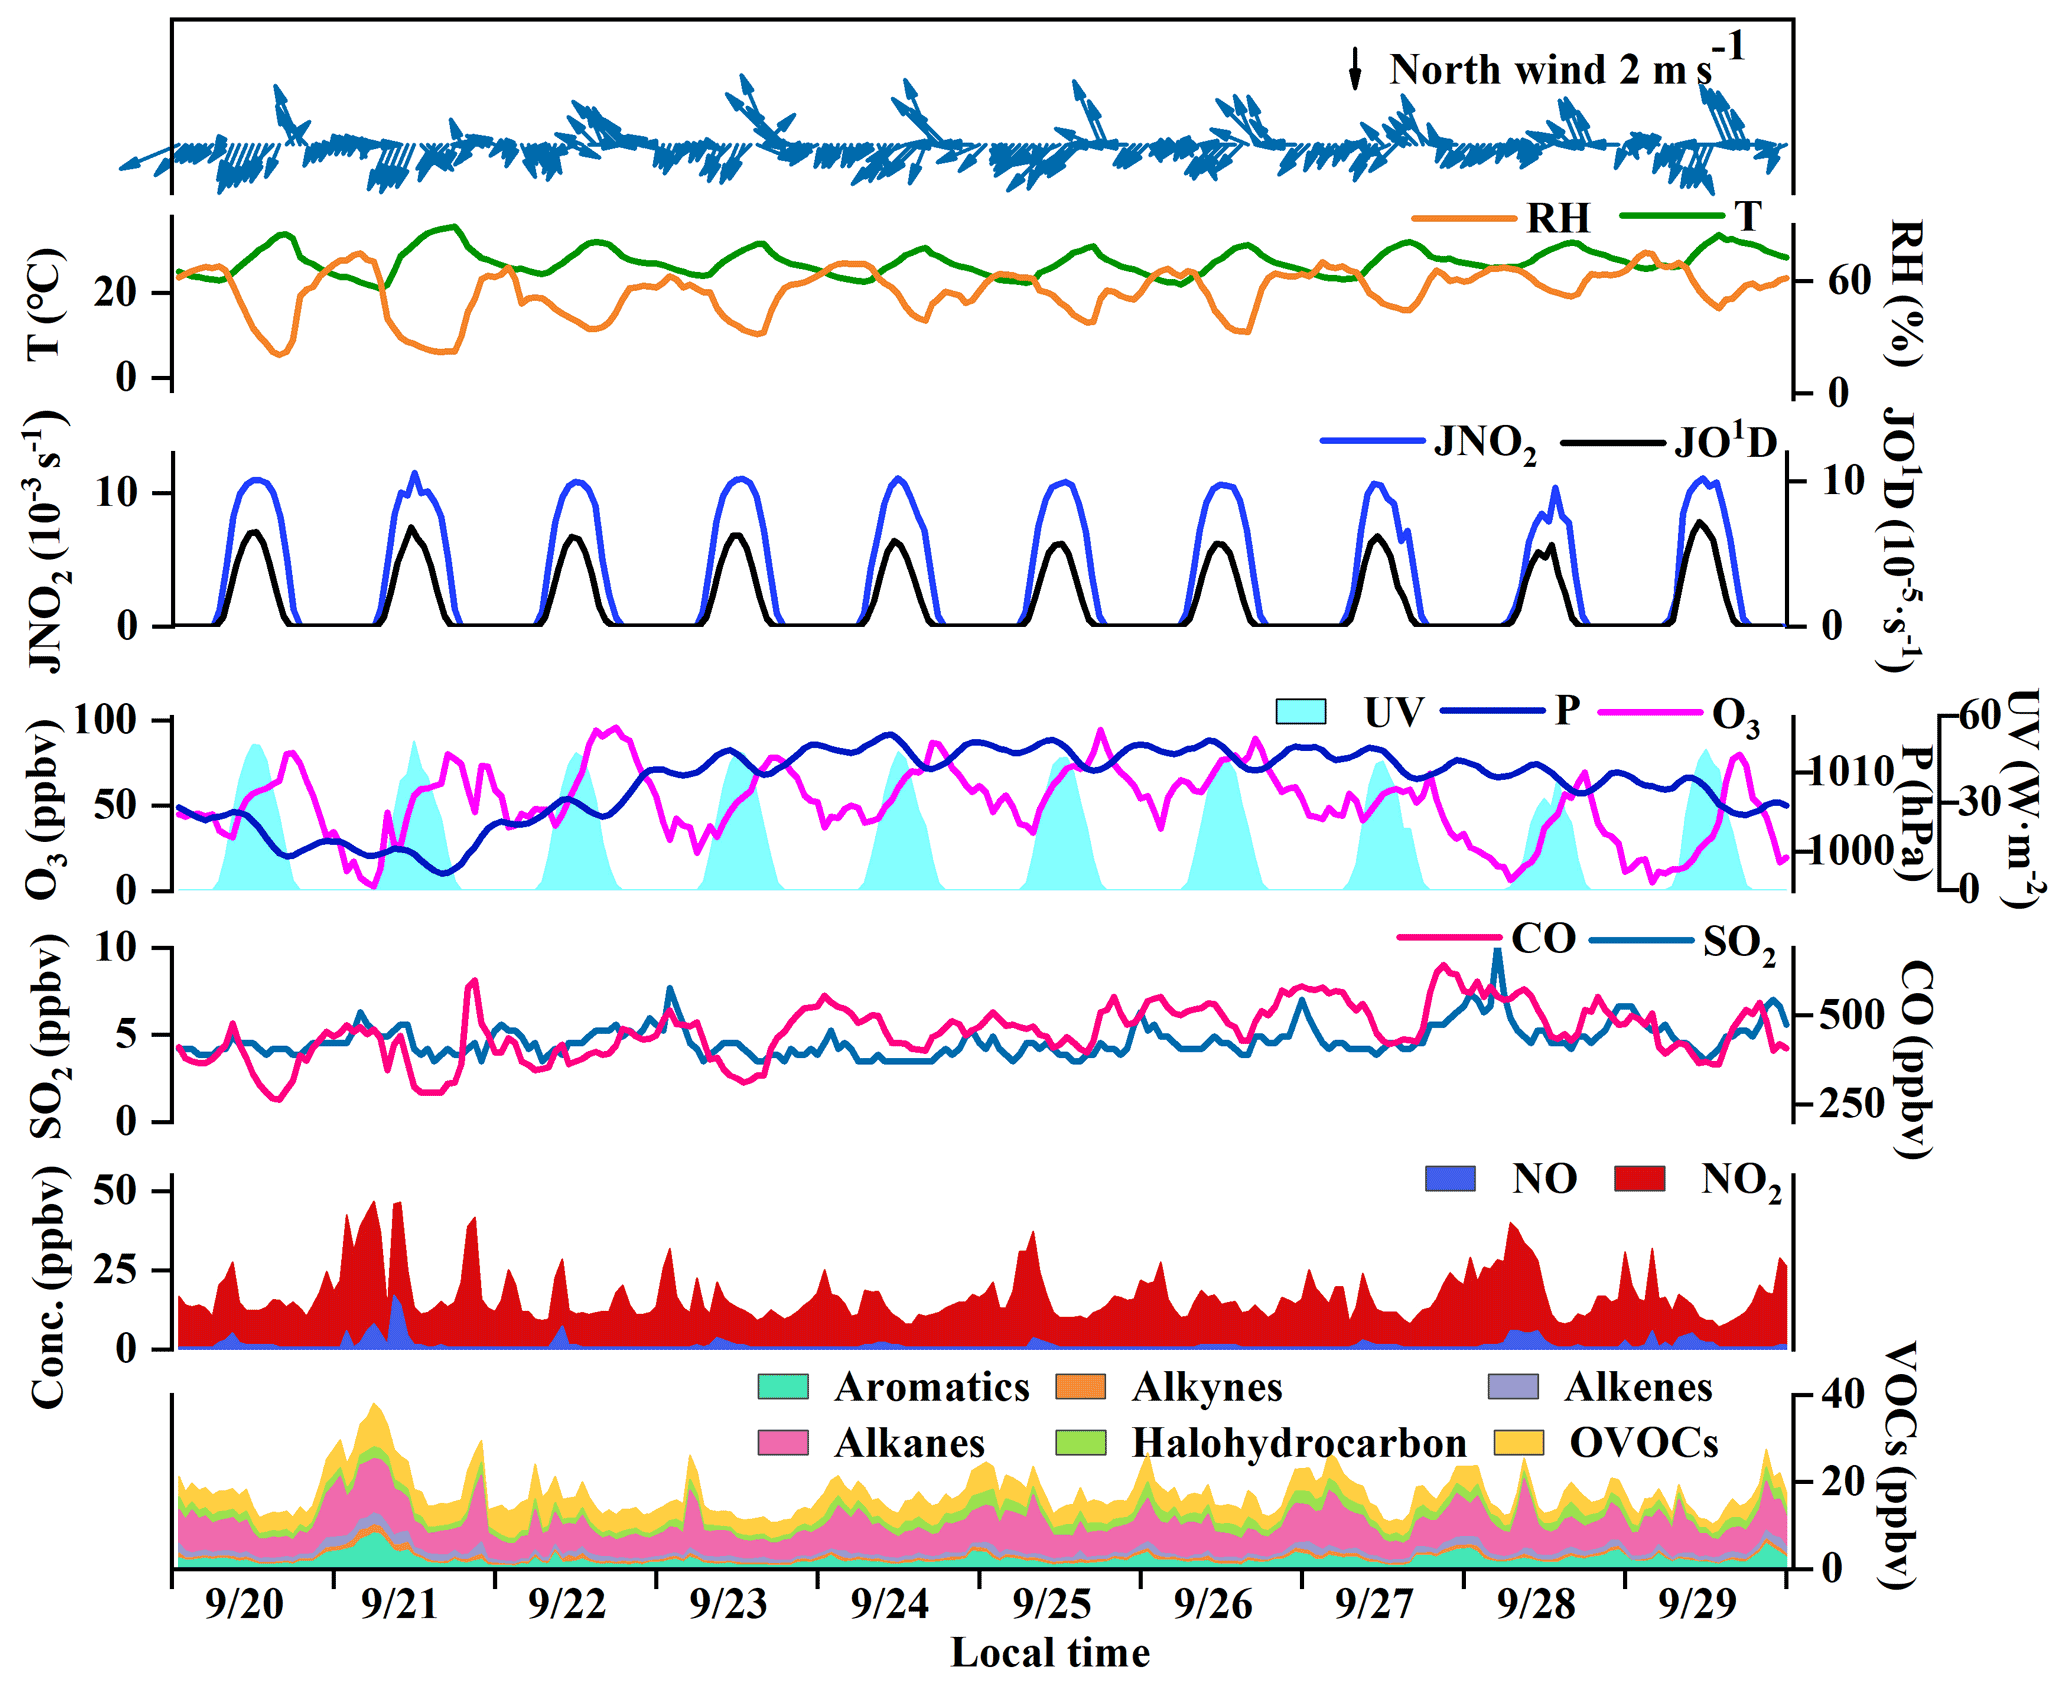
Figure 1Time series of major trace gases, photolysis rate constants, and meteorological parameters during 20–29 September 2019 in Xiamen.
Table 2Descriptive statistics of major trace gases (ppbv) and meteorological parameters during 20–29 September 2019.
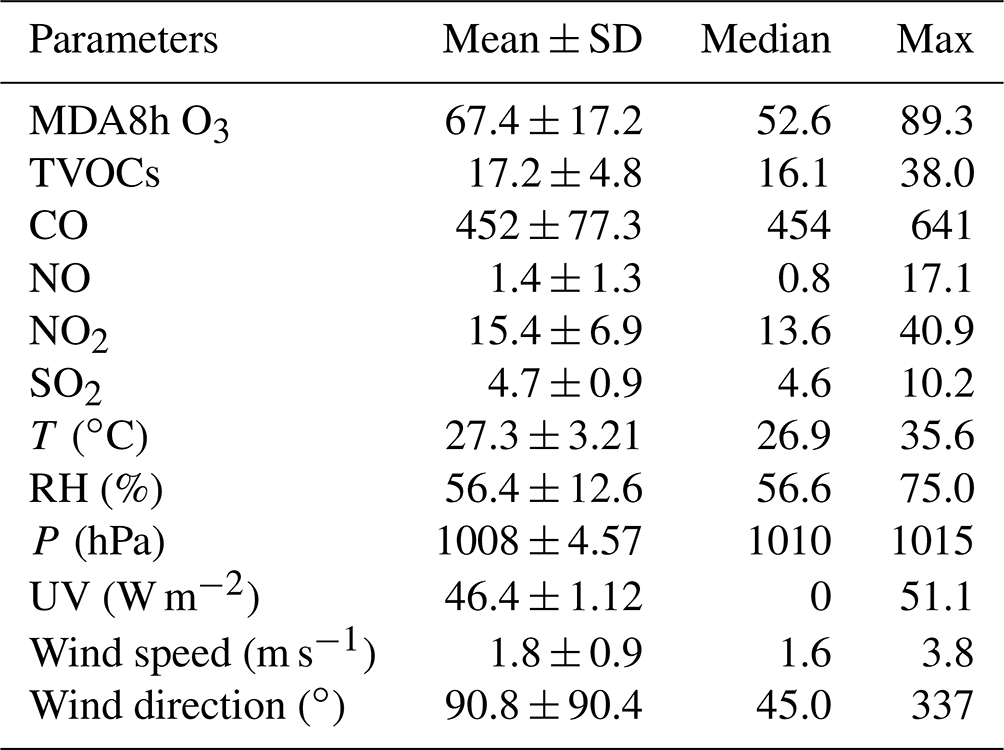
Table 3Measured VOC concentrations during 20–29 September 2019 in Xiamen (units: pptv). The classification of VOCs was used and introduced in Sect. 3.3.
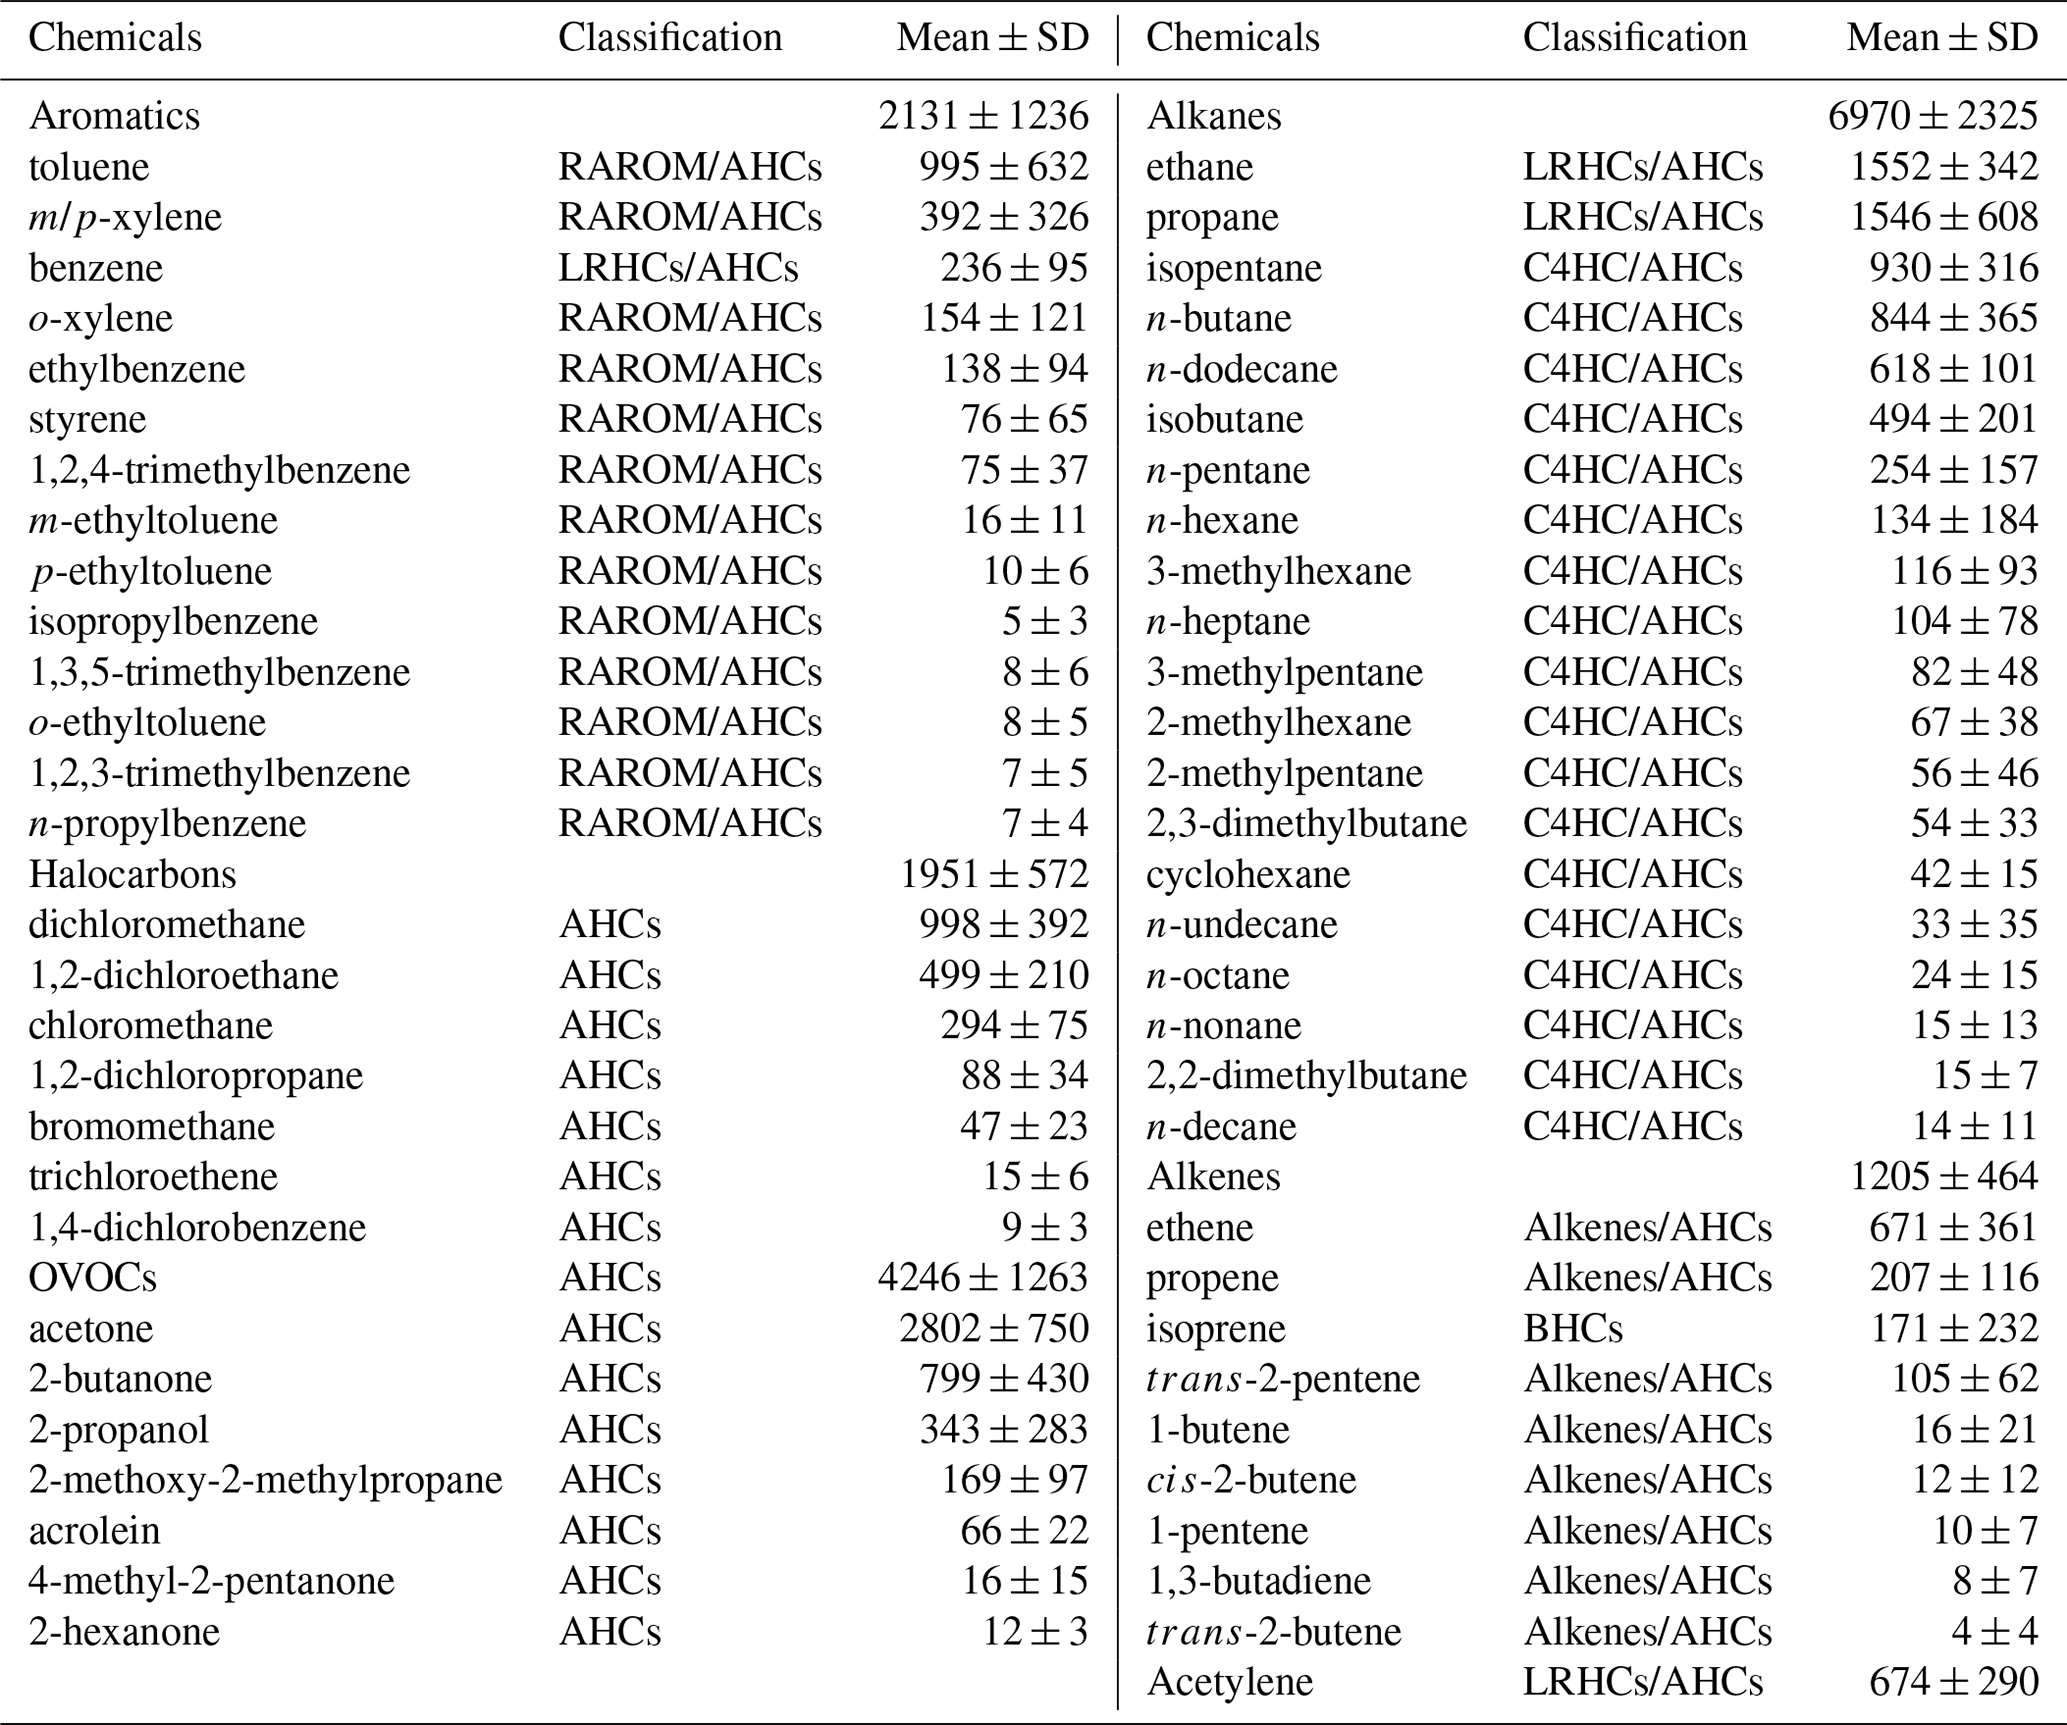
Table 3 lists the detailed VOC concentrations during the observation period. Alkanes (6970 ± 2325 pptv) were the predominant components of total VOCs, followed by OVOCs (4246 ± 1263 pptv), aromatics (2131 ± 1236 pptv), halocarbons (1951 ± 572 pptv), alkenes (1205 ± 464 pptv), and acetylene (674 ± 290 pptv). The ratio of ethene ethane (0.4 ± 0.2) was significantly (p<0.05) lower than that in Hong Kong (0.7 ± 0.1) with significant aged air masses, indicating that the high O3 in Xiamen might be partially attributed to the aged air masses (e.g., transport of air from polluted regions or intense atmospheric oxidation) (H. Wang et al., 2018). The concentration of TVOCs in Xiamen (17.2 ± 4.8 ppbv) was much lower than that in the developed areas with large anthropogenic emissions (i.e., Beijing (44.2 ppbv), Lanzhou (45.3 ppbv), Wuhan (30.2 ppbv), Chengdu (36.0 ppbv), Hong Kong (26.9 ppbv), Los Angeles (41.3 ppbv), and Tokyo (43.4 ppbv)) but was higher than that at the background and remote sites (i.e., Mt. Wuyi 4.7 ppbv and Mt. Waliguan 2.6 ppbv) (Table S1).
The O3 formation process depends on its precursors and related environmental conditions, while the photochemical reactions during the daytime are the basis for O3 changes. Figure 2 shows the diurnal patterns of major trace gases and meteorological parameters during 20–29 September 2019. The O3 concentration was maintained at relatively low levels from the night to 07:00 LT then rose and reached its maximum at around 17:00 LT. The O3 peak in the afternoon was related to the accumulation of both local photochemical reactions and potential regional transport (including O3 and its precursors in the upwind direction to the observation site), and detailed analysis will be shown in Sect. 3.3.2. The reduction of observed O3 (ΔO3) in the early morning rush hour caused by NO titration did not appear, verifying the impacts of regional transport (X. Liu et al., 2019; Zeren et al., 2019; Chen et al., 2020). Due to the photochemical reactions, the precursors of CO, NOx, and VOCs were consumed during the daytime and were accumulated during the nighttime with weak solar radiation. The diurnal patterns of VOCs, NOx, and CO were similar, with the highest concentrations at around 08:00 LT, which then decrease during 09:00–16:00 LT and increase at night, which is related to human activity emissions (especially vehicle exhaust) and the variations of the boundary layer (Elshorbany et al., 2009; Hu et al., 2020).
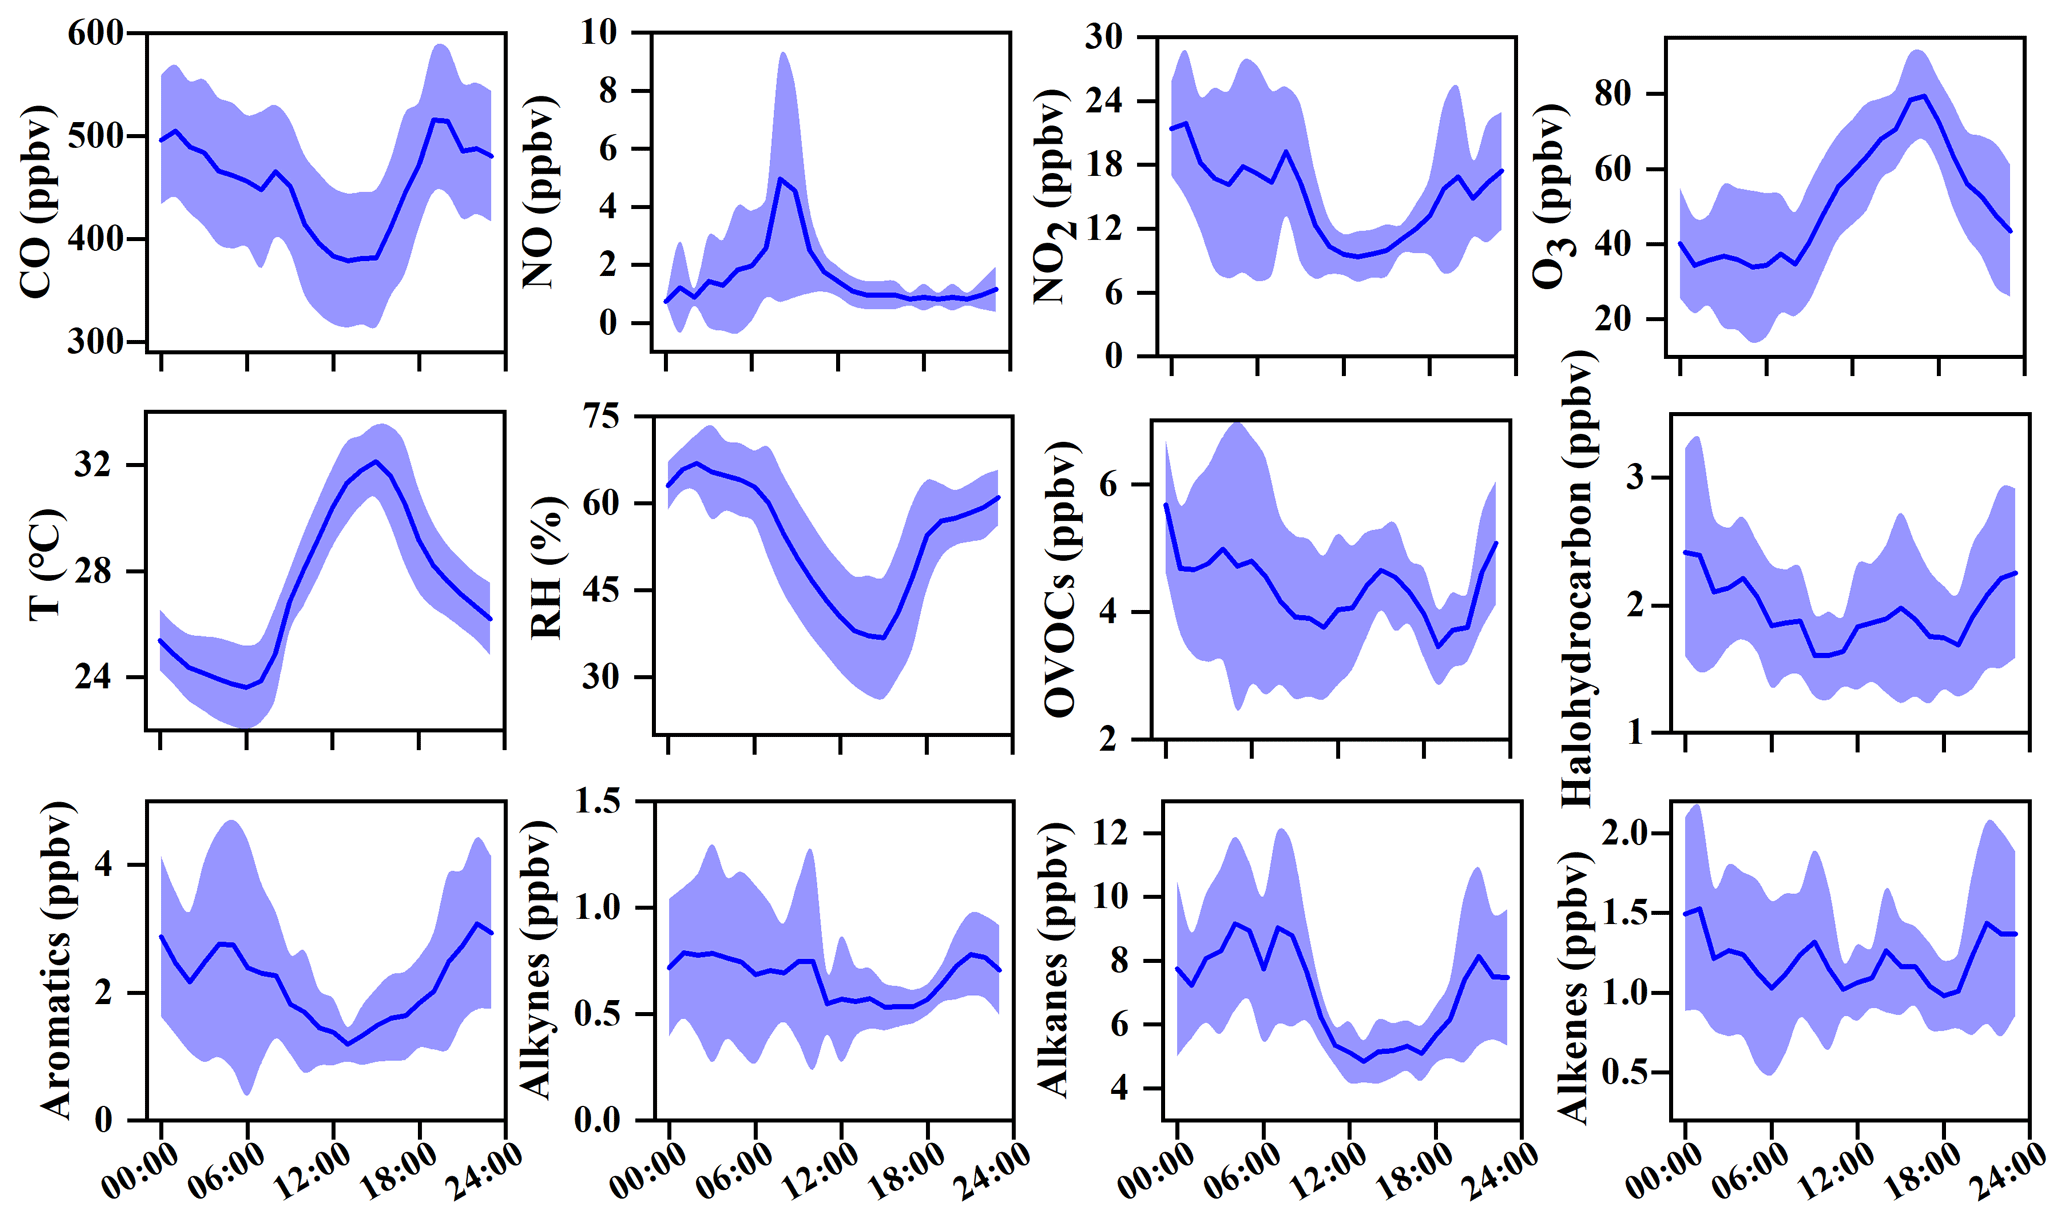
Figure 2Average diurnal patterns of major trace gases and meteorological parameters during 20–29 September 2019 in Xiamen. The error bar is the standard error.
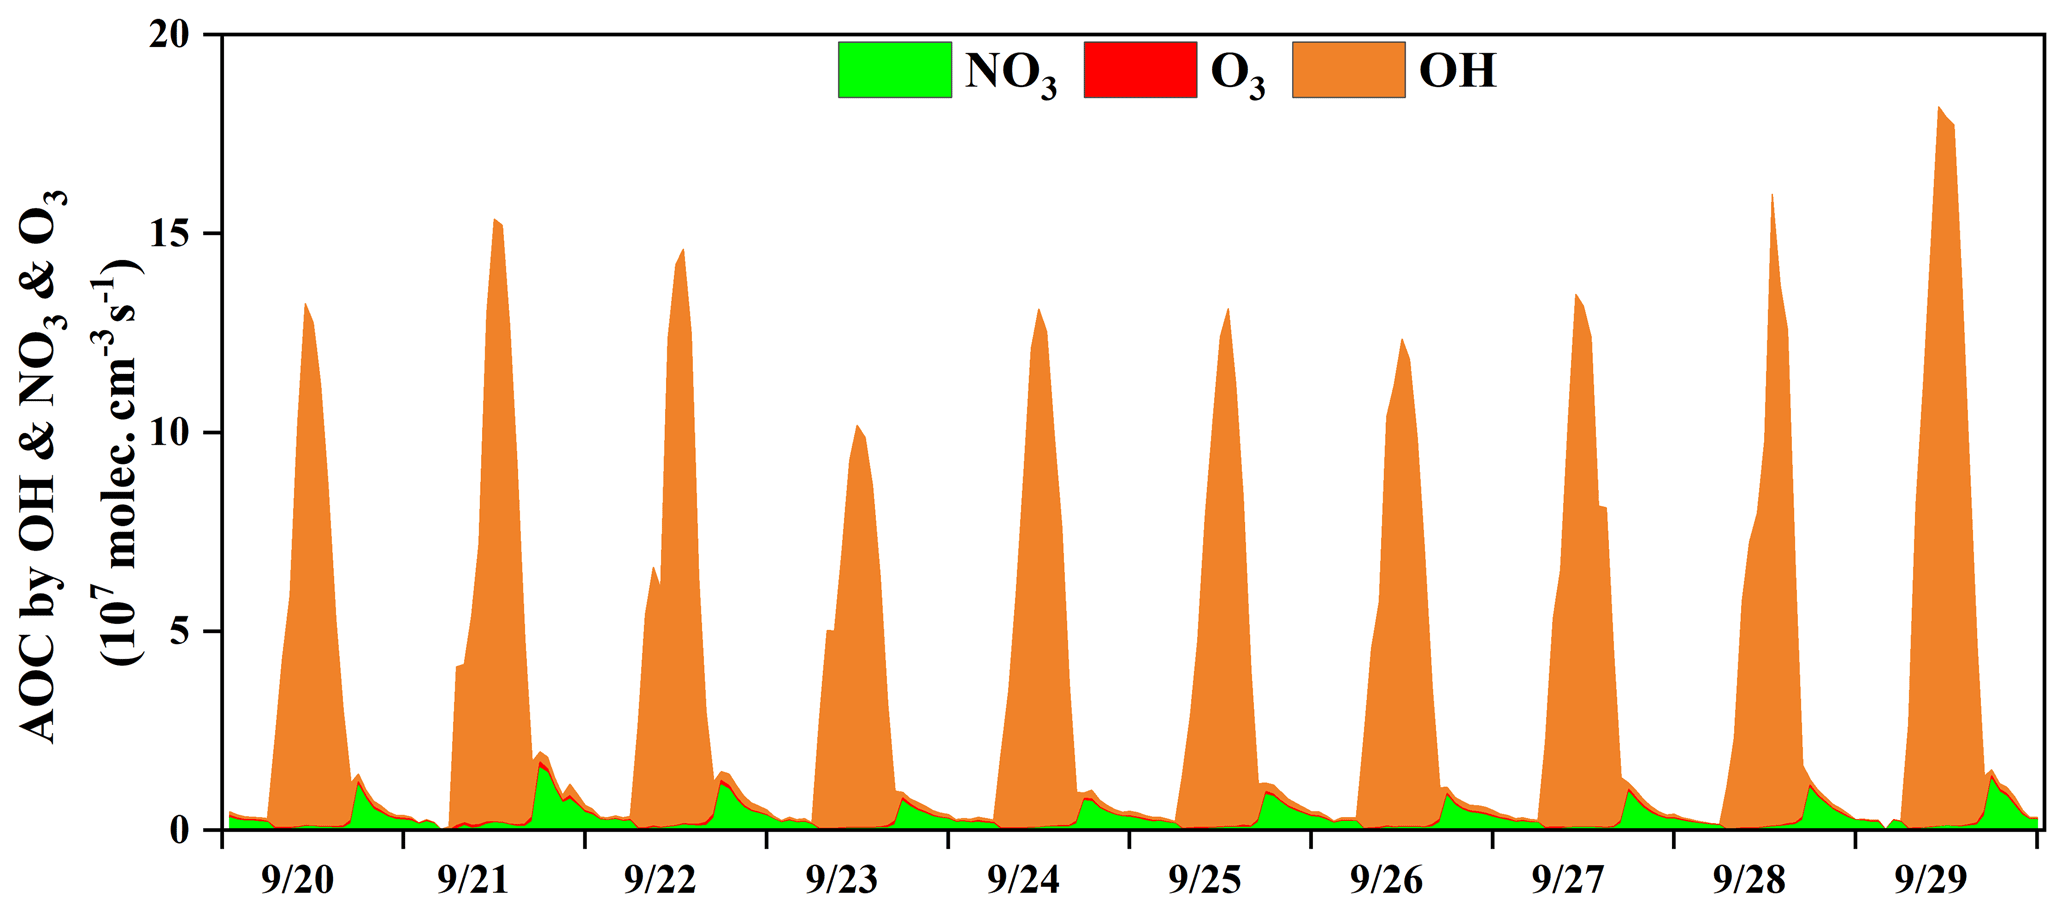
Figure 3Time series of the model-calculated atmospheric oxidation capacity (AOC) in Xiamen during 20–29 September 2019.
3.2 Atmospheric oxidation and radical chemistry
3.2.1 Atmospheric oxidation capacity (AOC)
Figure 3 shows the time series of the model-calculated AOC during the O3 pollution period. The AOC determines the removal rate of primary pollutants and the production rate of secondary pollutants and was the basis for reflecting atmospheric photochemical pollution (Geyer et al., 2001). AOC is calculated as the sum of oxidation rates of various primary pollutants (CO, NOx, and VOCs, etc.) by the major oxidants (i.e., OH, O3, NO3) (Chen et al., 2020; Xue et al., 2016, 2014). In this study, the average daytime AOC was 6.7×10⁷ molecules cm−3 s−1, and the daily maximum AOC was 1.3×10⁸ molecules cm−3 s−1, which was higher than that at rural sites, with much low pollution emissions in Berlin (1.4×10⁷ molecules cm−3 s−1) and a regional background in Hong Kong (6.2×10⁷), but lower than that in polluted cities, such as Santiago (3.2×10⁸ molecules cm−3 s−1), due to the main limiting factor of the significant differences of pollutant concentrations among different sites (Li et al., 2018; Xue et al., 2016; Geyer et al., 2001; Zhu et al., 2020). In some urban regions, the concentrations of air pollutants were higher than those in Xiamen, but their AOC levels (Hong Kong: 1.3×10⁸ molecules cm−3 s−1; Shanghai: 1.0×10⁸ molecules cm−3 s−1) were comparable to or even lower compared with the AOC in Xiamen, which could be attributed to the relatively high solar radiation (Xue et al., 2016; Zhu et al., 2020) (detailed descriptions shown in Sect. 3.1). The results of AOC characteristics in different regions were decided by the precursor concentrations/types and photochemical environment.
According to the diurnal patterns of the AOC contributed by OH, O3, and NO3, the predominant oxidant was OH (90 ± 25 %) during the daytime, followed by NO3 (8 ± 22 %) and O3 (2 ± 3 %). Meanwhile, the diurnal characteristics of AOC were consistent with the profile of the model-calculated OH (Fig. S3) and the observed photolysis rate constants (Fig. 1) (Zhu et al., 2020). Meanwhile, NO3 (72 ± 9 %) played the most important role in the oxidant capability during the nighttime, followed by OH (20 ± 12 %) and O3 (8 ± 1 %). In particular, the contribution of NO3 to AOC reached a maximum of 80 % at around 18:00 LT, when the concentrations of O3 and NO2 were relatively high and the formation of NO3 was accelerated (Fig. 2). In addition, solar radiation was weak during the nighttime, which resulted in the accumulation of NO3 due to the ceasing of photolysis of NO3 (Rollins et al., 2012; Chen et al., 2020). AOC contributed by O3 was negligible, owing to the relatively low concentration of alkenes at the monitoring site (Fig. 1 and Table 3), since O3 contributed to the oxidation capacity through alkene ozonolysis (Xue et al., 2016). In summary, the OH radical dominated the AOC, and it was necessary to further explore the partitioning of OH reactivity among different precursor groups.
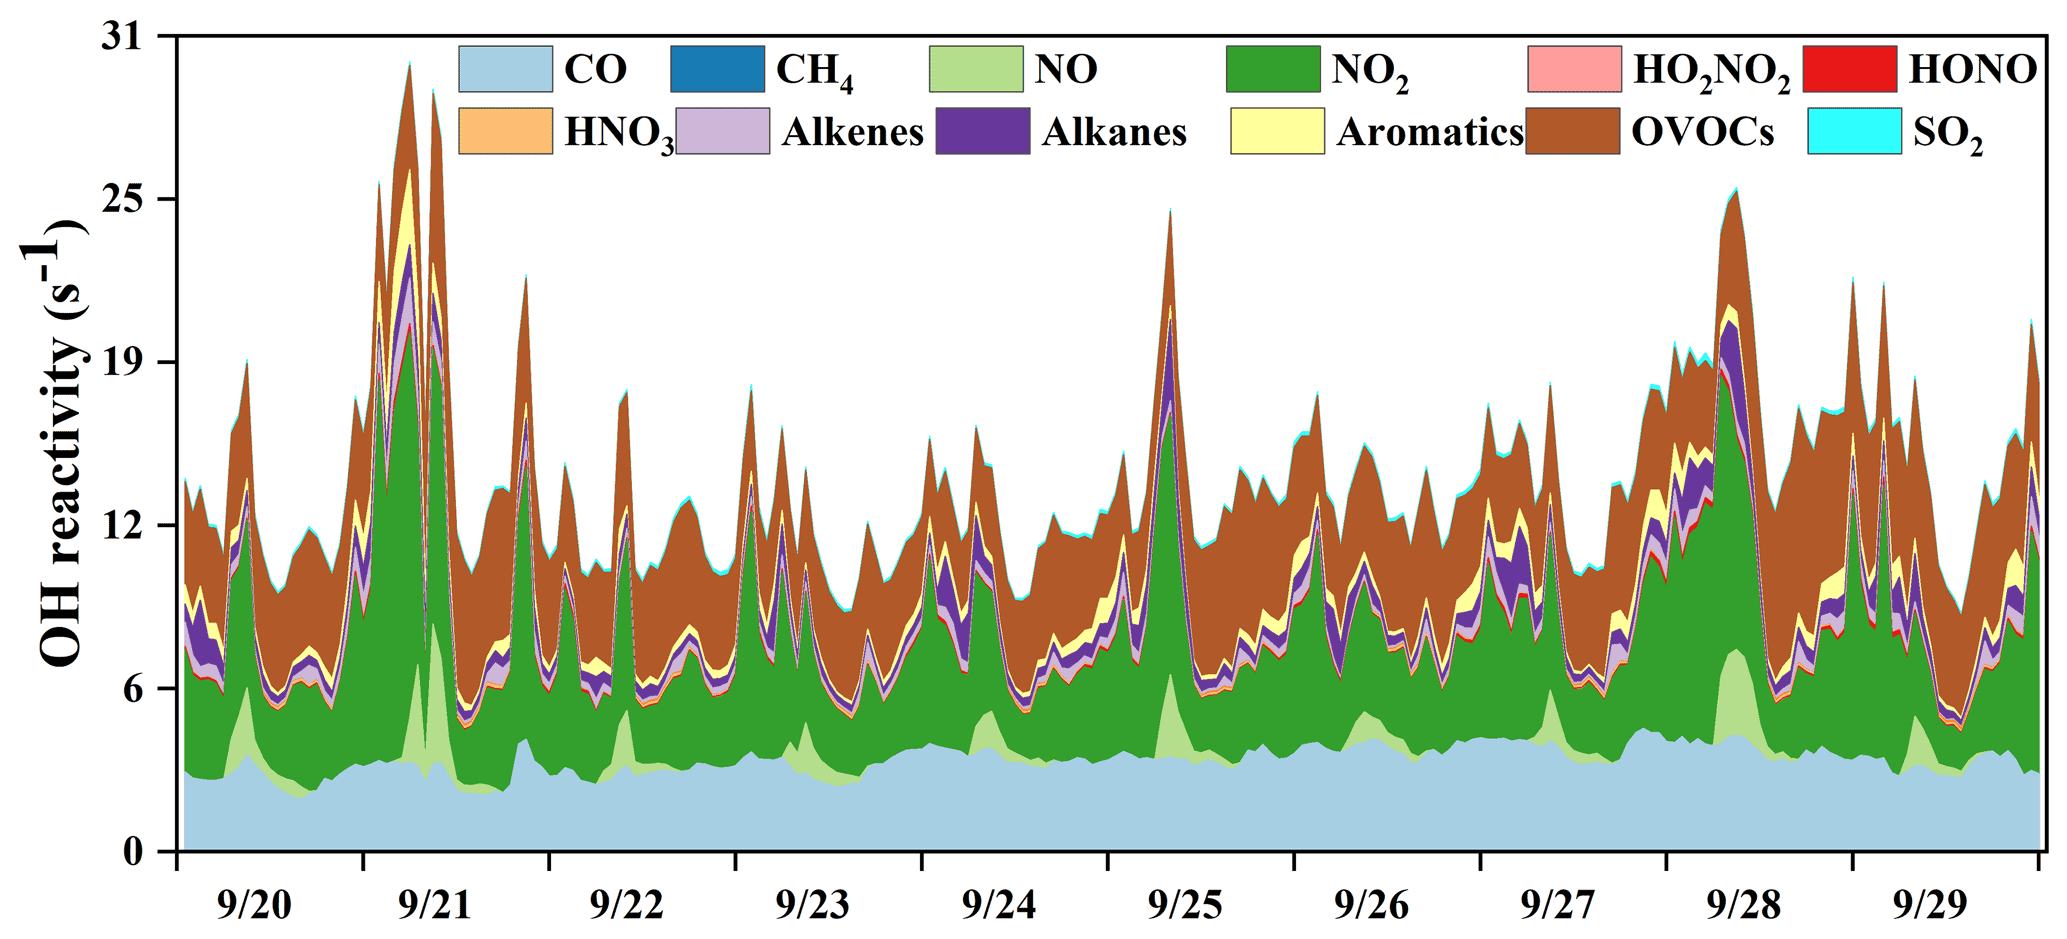
Figure 4Time series of model-calculated OH reactivity and its partitioning to the major reactants in Xiamen during 20–29 September 2019.
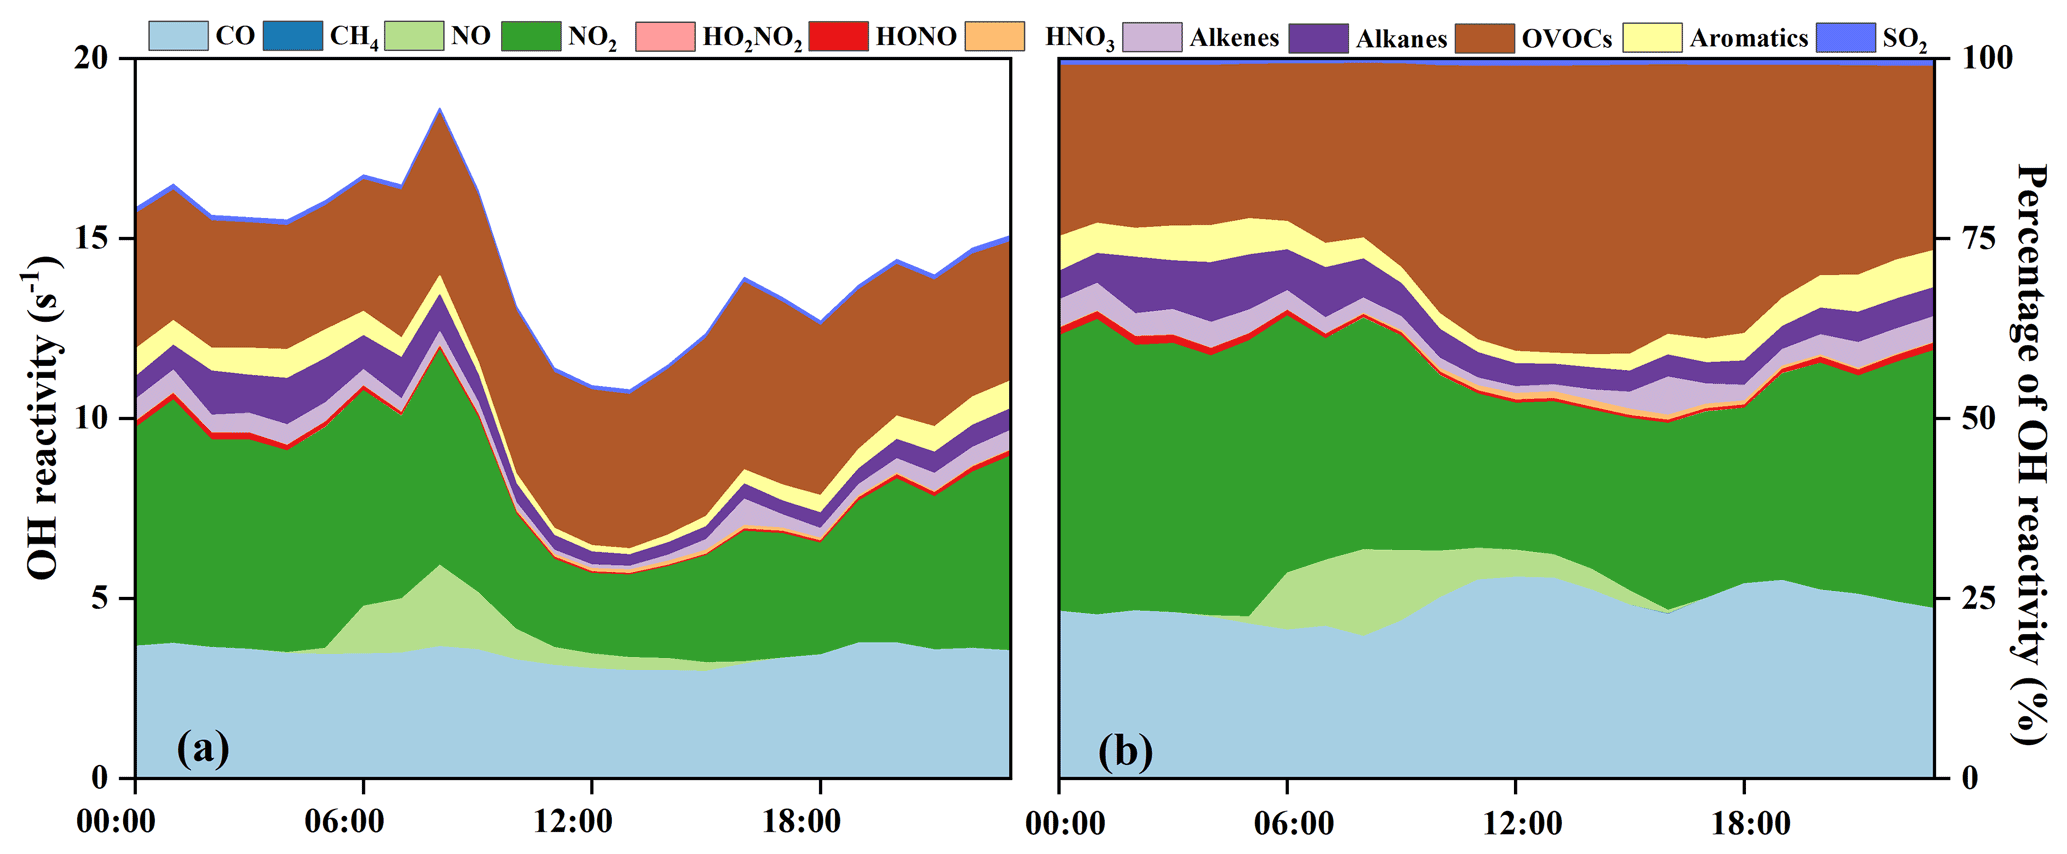
Figure 5(a) Diurnal patterns and (b) percentage of model-calculated OH reactivity and its partitioning to the major reactants.
The OH reactivity is an indicator for the OH chemical loss frequency, computed as the reaction rates of OH with CO, NOx, SO2, HONO, HNO3, HO2NO2, and VOCs (Whalley et al., 2016; Chen et al., 2020). Time series and diurnal patterns of model-calculated OH reactivity as well as its partitioning to the major reactants during the episode are shown in Figs. 4 and 5. The OH reactivity reached a peak (18.6 ± 4.8 s−1) at around 08:00 LT, mainly caused by the reaction of OH with NOx, since vehicles exhausted large amounts of NOx during rush hour. The average daily OH reactivity was 14.4 ± 3.83 s−1, which was much lower than that in some polluted regions in Santiago (42 s−1) and the PRD (50 s−1), comparable to that at a rural site in Nashville (11 s−1) but higher than that at a mountain site in Pennsylvania (6 s−1) (Elshorbany et al., 2009; Lou et al., 2010; Kovacs et al., 2003; Ren et al., 2005). Figure 5 shows the diurnal variations and percentage of model-calculated OH reactivity to the major reactants during the episode. The OH reactivity exhibited a morning peak caused by the reactions of NO with OH, which should be ascribed to the freshly emitted urban plumes. Furthermore, OVOCs showed high fractions at around 12:00–18:00 LT, which were mainly owing to the transport of the regional air masses containing the abundant OVOCs, as well as the oxidation effect by strong photochemical processes. As shown in Fig. 5b, OVOCs (30 ± 8 %) , NO2 (29 ± 8 %), and CO (25 ± 5 %) were the dominant contributors to OH reactivity, followed by alkanes (5 ± 3 %), aromatics (3 ± 2 %), alkenes (3 ± 1 %), and NO (2 ± 4 %). The high fraction of OVOCs and NO2 in OH reactivity indicated the high degree of aged air mass and the intensive NOx emissions during the observation period, respectively (Li et al., 2018). However, the fraction of CO to OH reactivity at our observation site was higher than that at an urban site in Los Angeles (Hansen et al., 2021), a rural site in Hong Kong (Li et al., 2018), and a mountain site in Colorado (Nakashima et al., 2014), comparable to that at the urban site of Shanghai (K. Zhang et al., 2021), which could be attributed to the abundant CO in our observation site. CO mainly comes from vehicle exhaust and the combustion of fossil fuels, and the observation site is a city with high density vehicles. Meanwhile, this pollution event was under the influence of the WPSH, which promoted the formation and accumulation of pollutants. The partitioning of OH reactivity elucidated the inherent photochemical processes and major reactants in southeastern China. High OH reactivity of OVOCs, NO2, and CO promotes the production of ROx radicals. Therefore, the investigation of detailed chemical budget of the ROx, recycling, and termination reaction is meaningful to figure out the complex atmospheric photochemistry (Li et al., 2018; Lou et al., 2010).
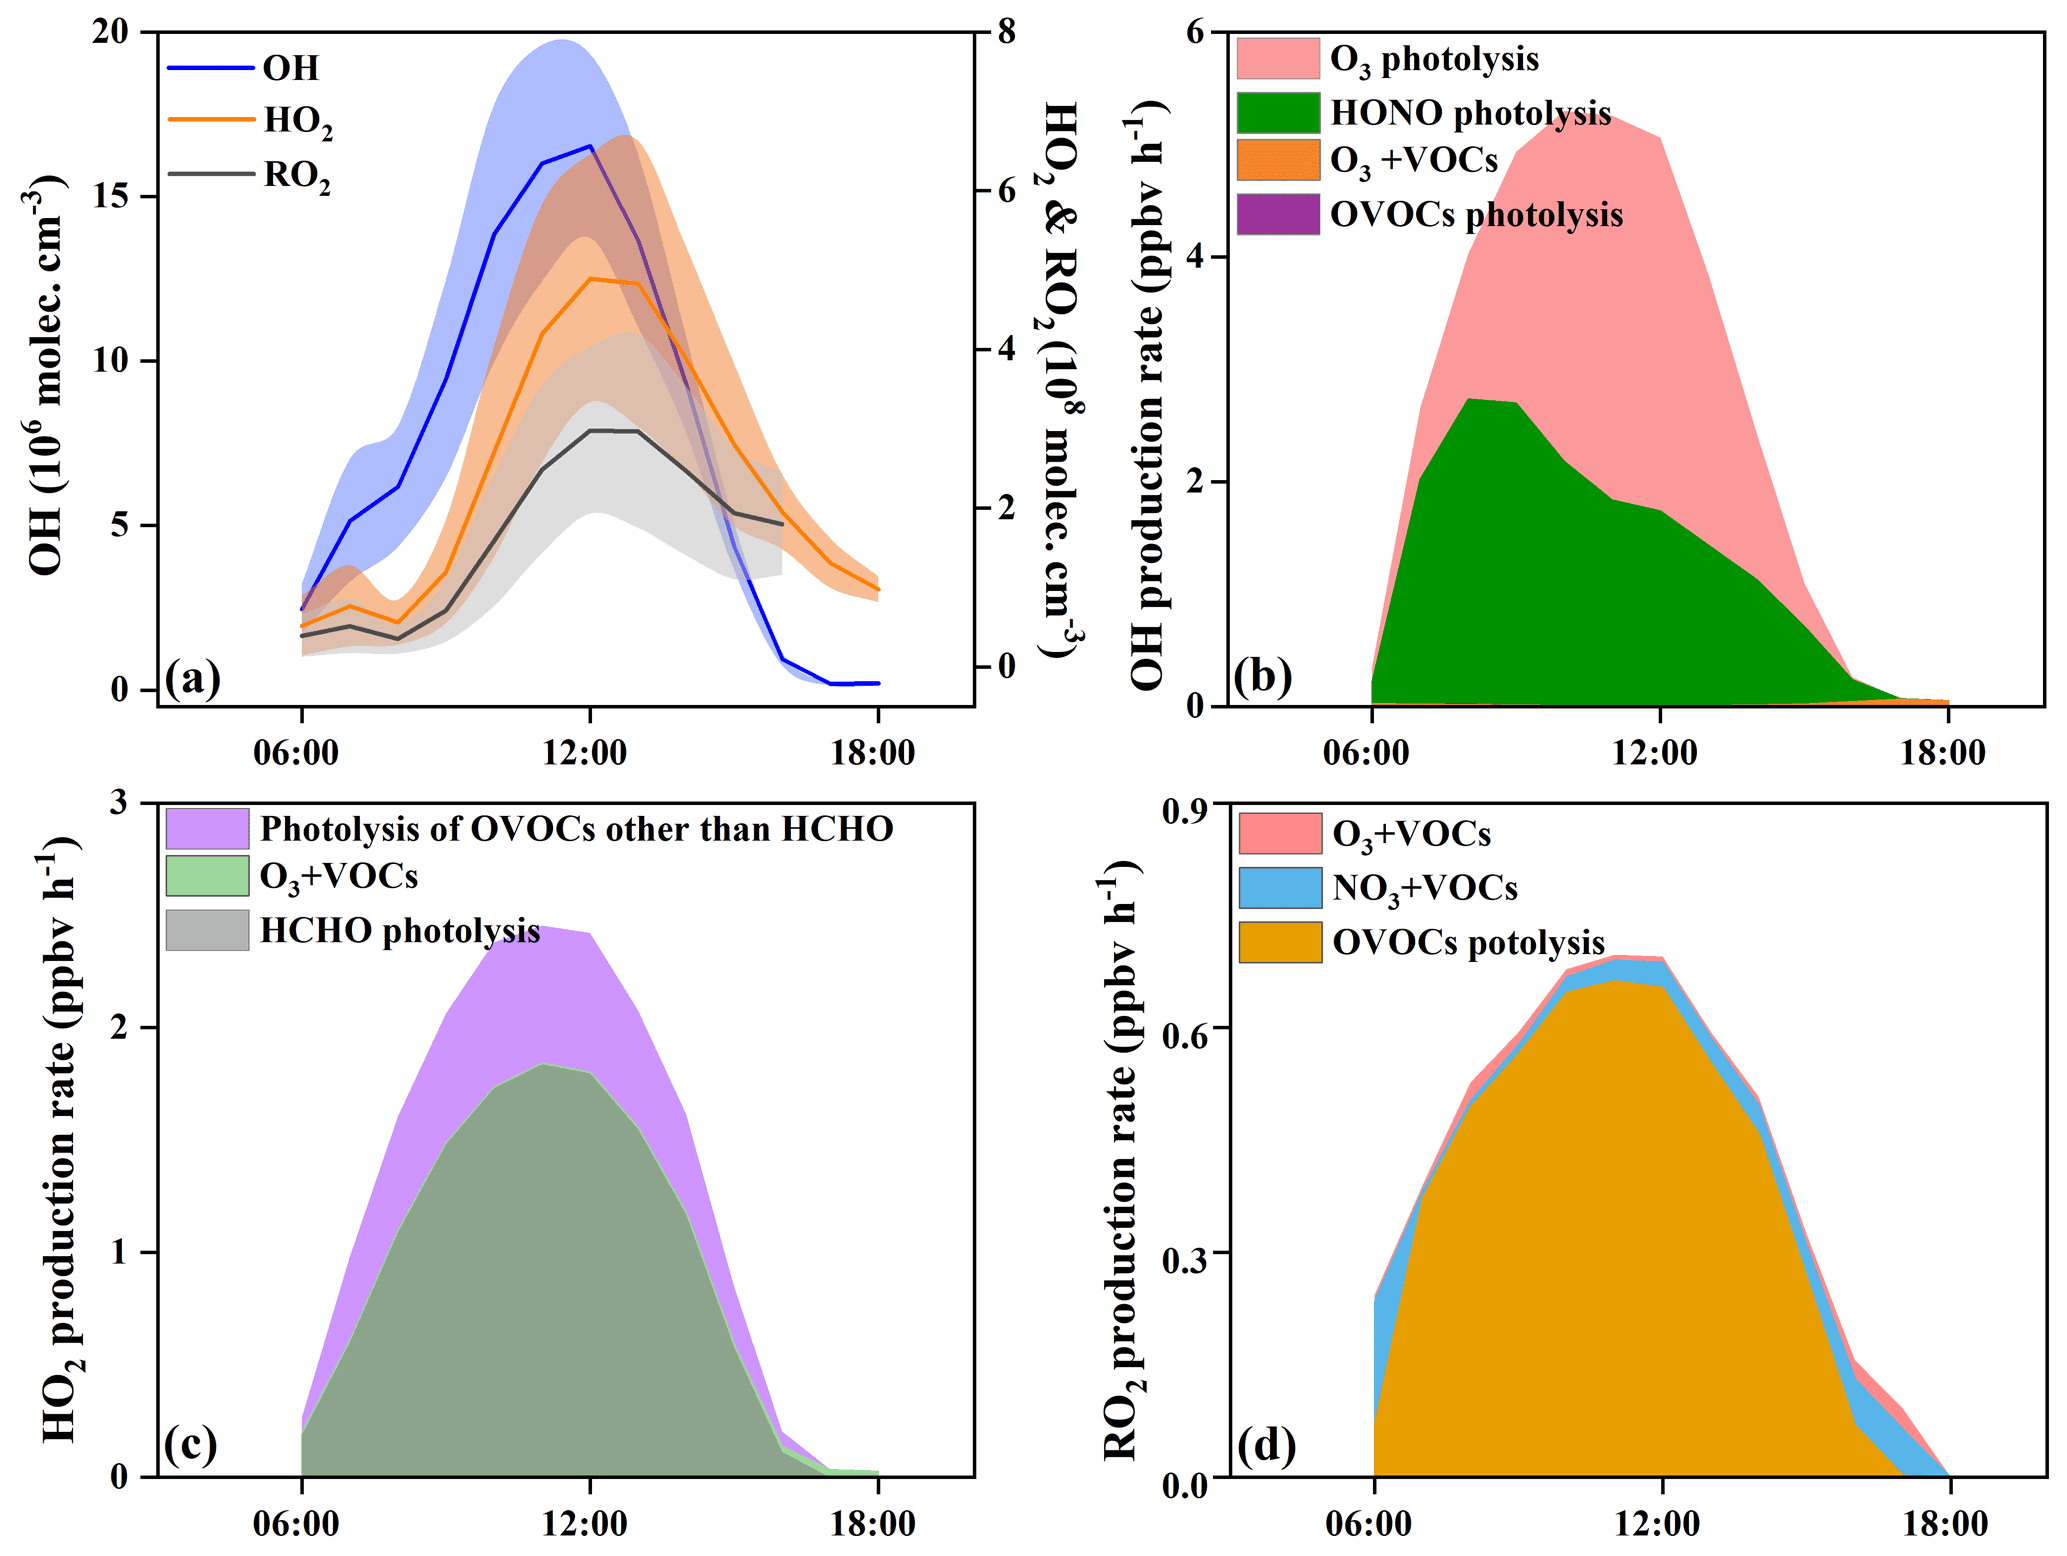
Figure 6Model-simulated daytime average diurnal variations in (a) OH, HO2, and RO2 concentrations and average primary production rates of (b) OH, (c) HO2, and (d) RO2 during 20–29 September 2019 in Xiamen.
3.2.2 Radical chemistry
With the influence of NOx and VOCs, ROx radicals (OH, HO2, and RO2) undergo efficient recycling and produce secondary pollutants, such as O3 and OVOCs (Sheehy et al., 2010). Figure 6 shows the model-simulated OH, HO2, and RO2 concentrations and their primary sources. The detailed time series of ROx concentrations and chemical budget are summarized in Fig. S3. Figure 6a shows the diurnal variations of the simulated OH, HO2, and RO2. The maximum daily values of OH, HO2, and RO2 concentrations were 2.4×10⁷, 7.9×10⁸, and 4.7×10⁸ molecules cm−3, with daytime average concentrations of 7.4×10⁶, 2.4×10⁸, and 1.7×10⁸ molecules cm−3, respectively. Model-predicted concentrations of OH in Xiamen were higher than that in the Yellow River Delta (an oil field with high VOC emission), while the concentrations of HO2 and RO2 showed reverse trends (Chen et al., 2020). The ROx recycling of OH → RO2 was mainly controlled by the reaction of OH + VOCs, and the RO2→ HO2 and HO2→ OH depended on the reactions with NO (Fig. 7). Combined with the ratio of VOCs NOx (1.1 ± 0.4), it was established that NOx would not be the limiting factor in the radical recycling processes. Hence, efficient conversions of radical propagation of RO2+ NO → HO2 and HO2+ NO → OH were expected, and the OH + VOCs → RO2 reaction was the rate-dependent step of the radical recycling in our study. The detailed radical chemistry is further discussed in the following.
Figure 6b shows the daytime average diurnal variations of primary OH sources. HONO photolysis reached a maximum of 2.7 ppb h−1 at around 08:00 LT, which occupied 56 ± 19 % of the total OH primary production rates. The second source of OH primary production was O3 photolysis (42 ± 21 %), and the percentages of O3+ VOC and OVOC photolysis were minor. The highest HONO photolysis rate appeared in the morning rush hour, suggesting the influence of vehicle emissions and nocturnal accumulation of HONO (Hu et al., 2020). Considering the radical recycling, the reaction of HO2+ NO (8.0 ± 6.2 ppb h−1) dominated the total production of OH (Fig. S3a). Meanwhile, OH-initiated oxidations of VOCs (4.9 ± 3.3 ppb h−1) consumed OH most during the daytime, followed by OH + CO (2.6 ± 1.9 ppb h−1), OH + NO2 (2.4 ± 1.1 ppb h−1), OH + NO (0.6 ± 0.3 ppb h−1), and OH + O3 (0.2 ± 0.1 ppb h−1).
In this study, HCHO photolysis was identified as the most important source for HO2 primary formation, with an average production rate of 1.1 ± 0.6 ppb h−1 (Fig. 6c), followed by the other OVOC photolysis (0.4 ± 0.2 ppb h−1). The rate of OVOC photolysis in Xiamen was much lower than that in some megacities, such as Beijing (Liu et al., 2012) and Hong Kong (Xue et al., 2016). The reactions of OH + CO (2.6 ± 2.2 ppb h−1) and RO2+ NO (2.5 ± 1.5 ppb h−1) were also important sources of HO2 (Fig. S3b). The main sink of HO2 was HO2+ NO (7.9 ± 6.2 ppb h−1), while the loss rates of HO2+ HO2 and HO2+ RO2 were negligible.
In Fig. 6d, OVOC photolysis contributed most to primary RO2 production with a rate of 0.5 ± 0.2 ppb h−1, accounting for 85 ± 20 % of total RO2 primary production. The reaction of unsaturated VOCs and NO3 was the second important source, accounting for 11 ± 18 % of the total primary RO2. The radical recycling rate of OH + VOCs was 8.4 times higher than the sum of RO2 primary production. The consumption reaction of RO2 was mainly caused by RO2+ NO (3.7 ± 2.9 ppb h−1), and the cross-reactions by ROx themselves were limited.
The daytime average ROx budget and its recycling are also demonstrated (Fig. 7). For the ROx primary sources, the photolysis of HONO (33 ± 14 %), O3 (25 ± 13 %), HCHO (20 ± 5 %), and other OVOCs (17 ± 2 %) was a major contributor. For ROx recycling, CO and VOCs reacted with OH, producing HO2 and RO2, with average rates of 4.0 and 4.4 ppbv h−1, respectively. RO2+ NO and HO2+ NO enhanced the production of RO (3.6 ppbv h−1) and OH (7.9 ppbv h−1), with O3 formed as a by-product. For the termination processes, the reaction rates of ROx and NOx were approximately 2–5 times faster than the cross-reaction rates of ROx.
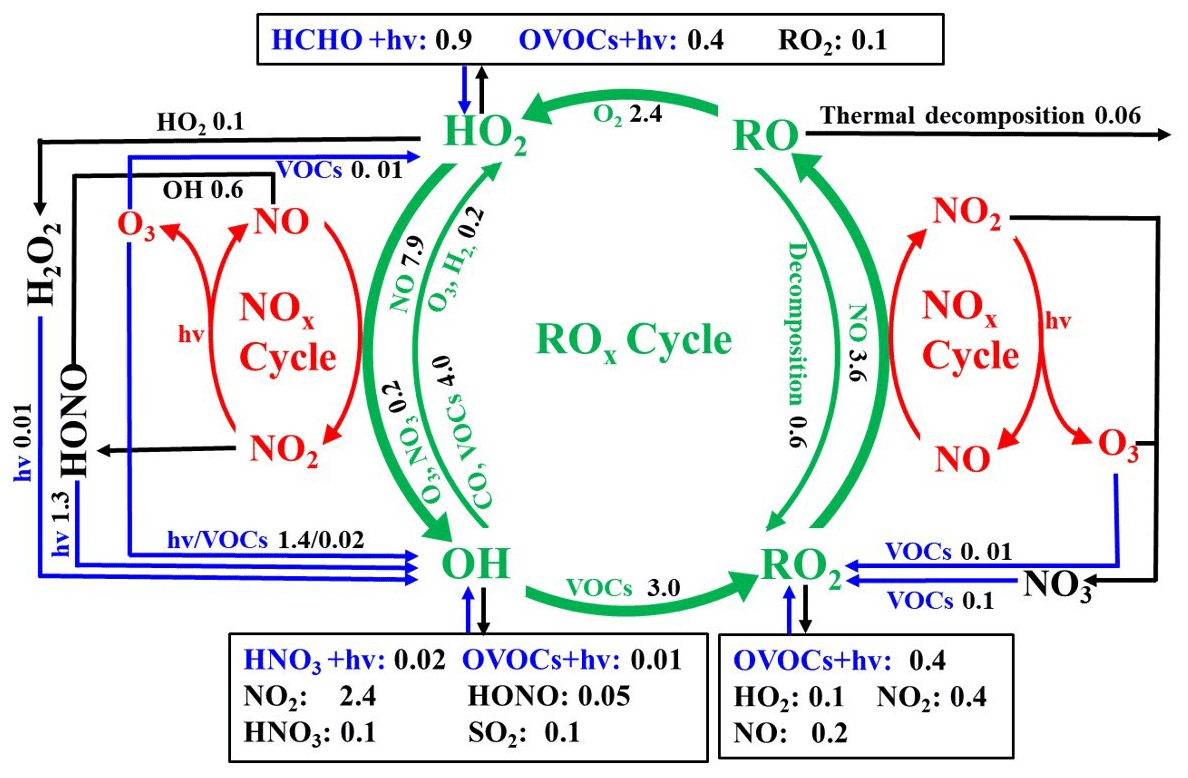
Figure 7Daytime ROx budget during 20–29 September 2019 in Xiamen. The unit is parts per billion per hour. The blue, black, and green lines and words indicate the production, destruction, and recycling pathways of radicals, respectively.

Figure 8Time series of model-simulated O3 chemical budgets during 20–29 September 2019 in Xiamen.
3.3 O3 formation mechanism
3.3.1 Chemical budget and sensitivity analysis of O3 production
The in situ O3 production mechanism was examined, and the detailed reaction weights are shown in Fig. 8. The daytime rate of HO2+ NO was 7.9 ± 6.2 ppb h−1, accounting for 68 ± 4 % of the total O3 production. This result was consistent with that in Sect. 3.2.2. The OH radical was the initiator of O3 photochemical formation, and the source of OH from HO2+ NO was also the dominant pathway to produce O3 (Liu et al., 2020c). The second pathway of O3 production was RO2+ NO (3.6 ± 2.0 ppb h−1). The reaction of RO2+ NO contained more than 1000 types of RO2 radicals, and the pathway of CH3O2+ NO (34 ± 6 %) contributed most among them. In contrast, the contributors of O3 destruction were OH+NO2 (61 ± 18 %), followed by O3 photolysis (18 ± 9 %), RO2+ NO2 (9 ± 10 %), O3+ HO2 (4 ± 4 %), and O3+ OH (4 ± 2 %), while the other pathways of O3+ VOCs as well as NO3+ VOCs contributed limitedly. In addition, the net O3 production (9.1 ± 5.7 ppb h−1) in Xiamen was ∼2–5 times lower than that derived from the metropolis of Shanghai (26 ppb h−1), Lanzhou (23 ppb h−1), and Guangzhou (50 ppb h−1), reflecting the influence of O3 precursor emissions and photochemical conditions (Xue et al., 2014).
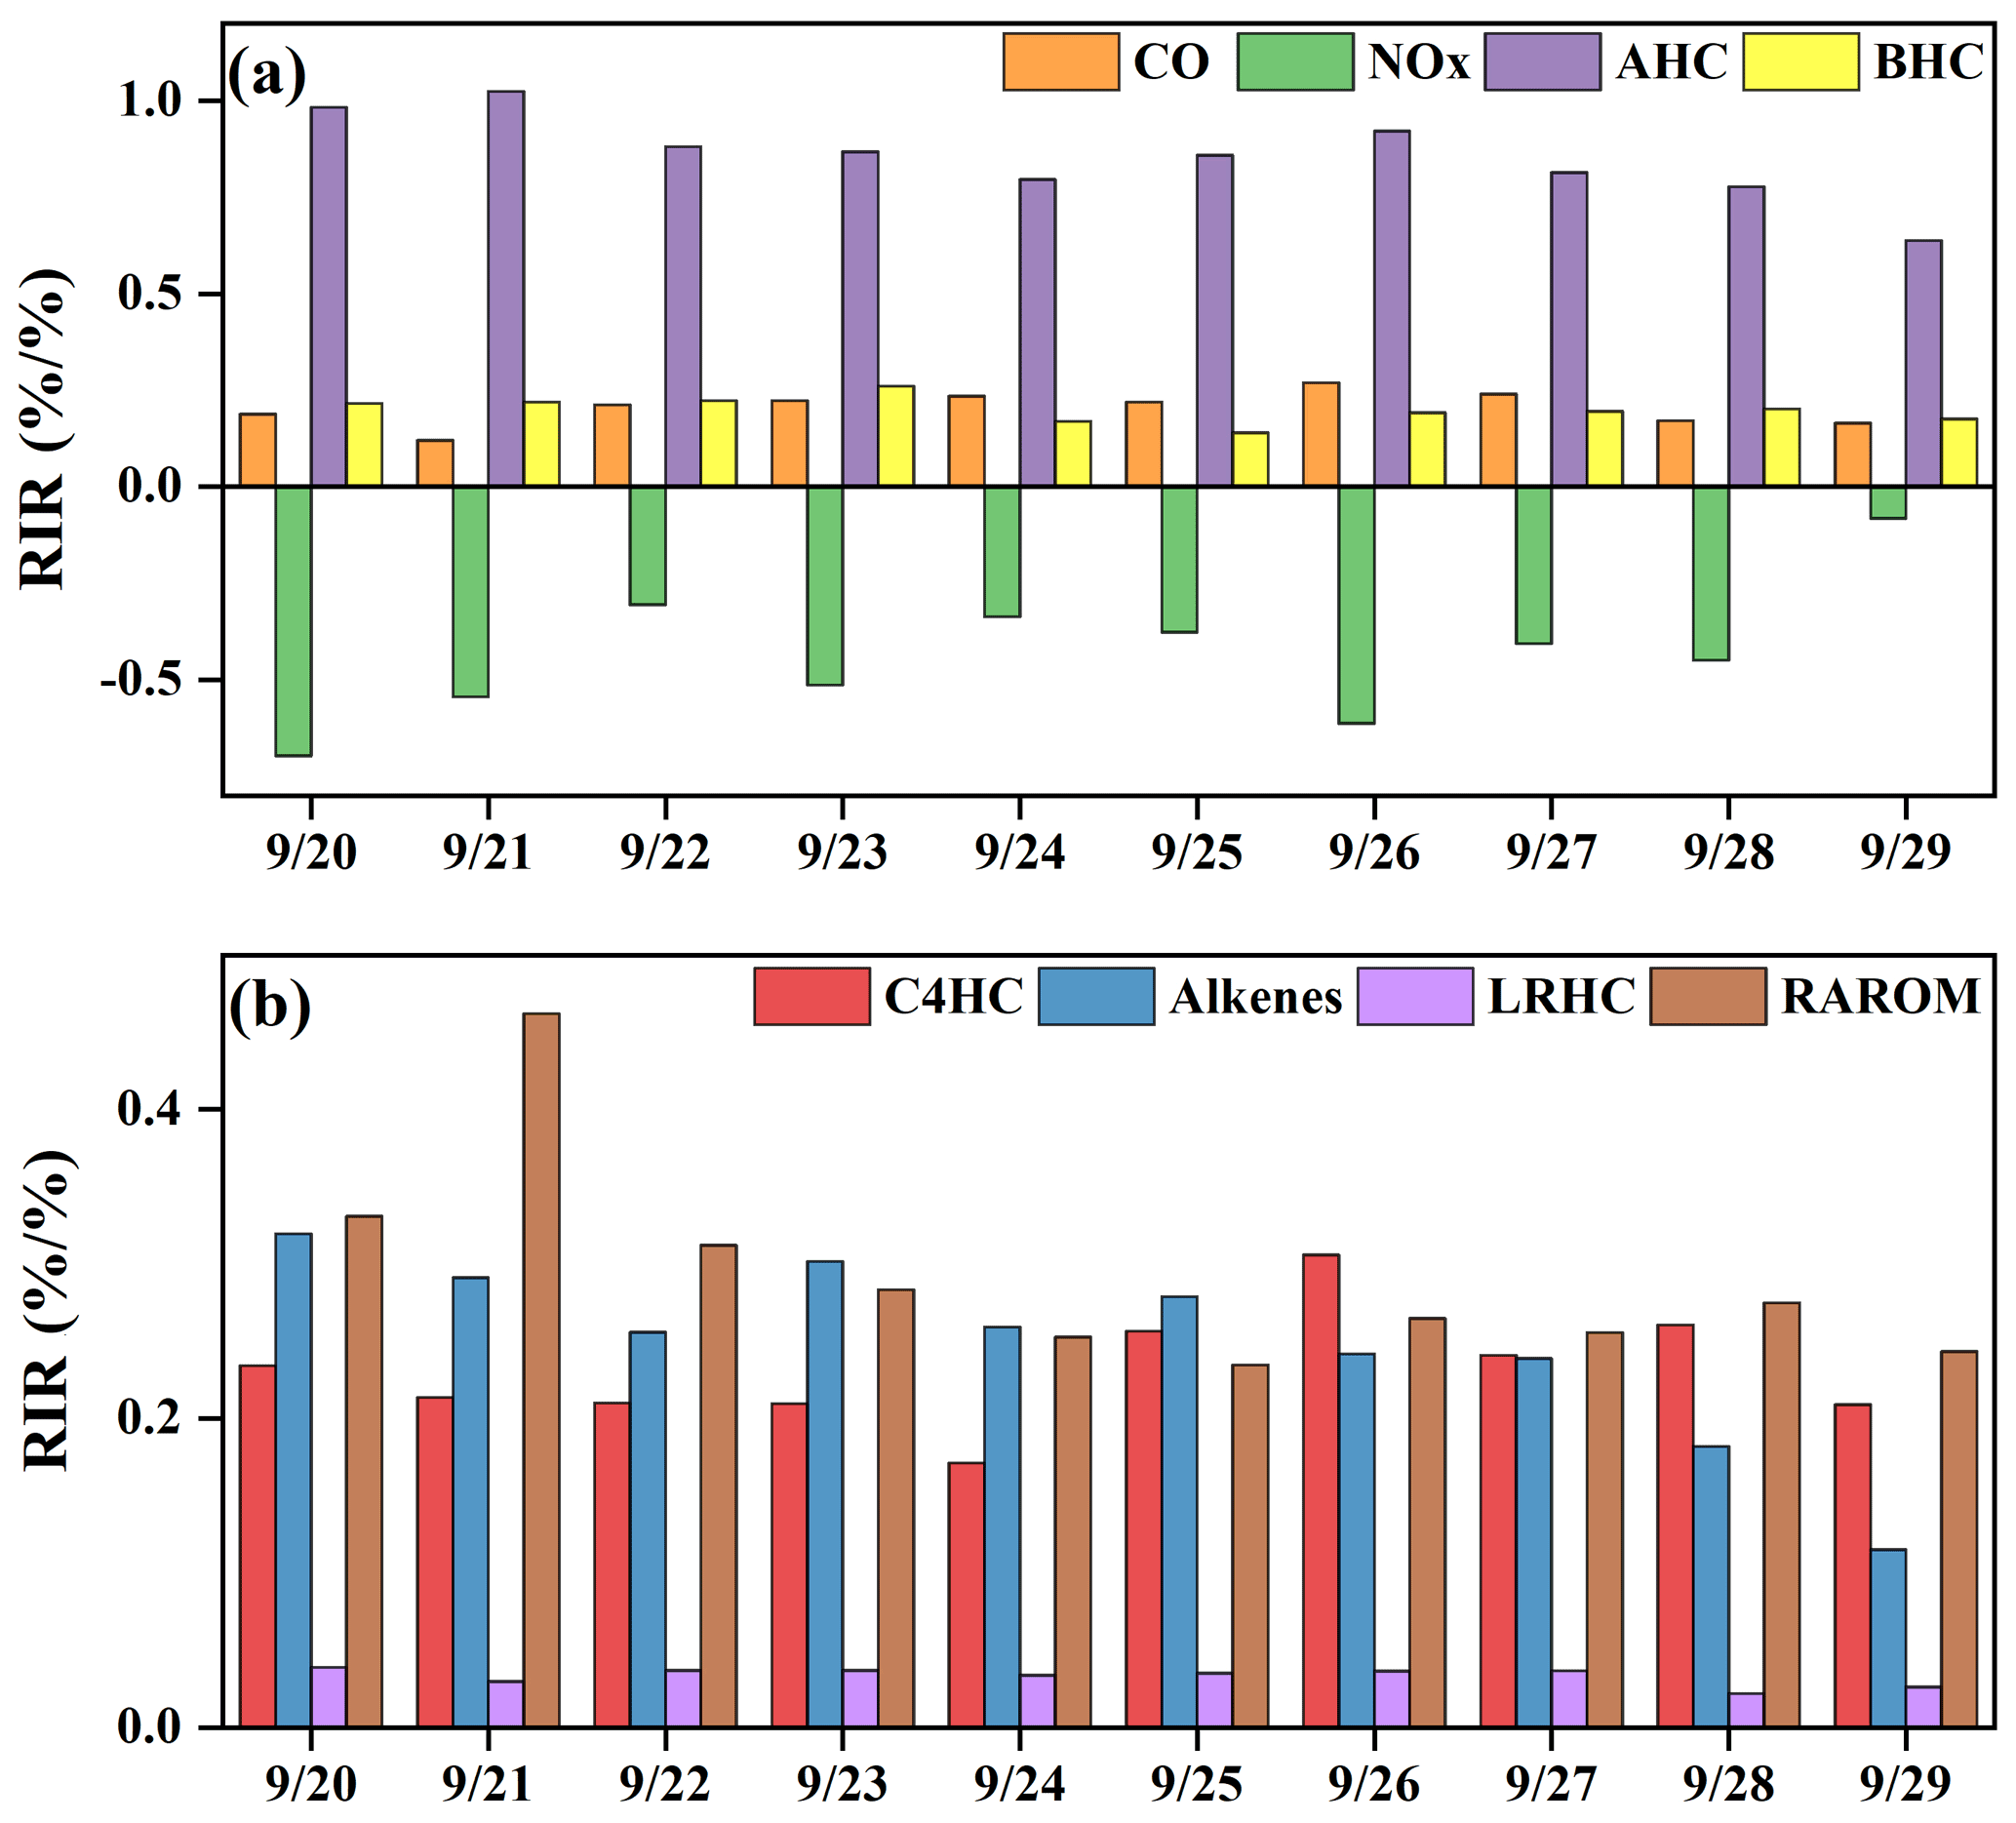
Figure 9The model-calculated RIRs for (a) major O3 precursor groups and (b) the AHC sub-groups during high-O3 daytime (06:00–18:00 LT) (AHCs: anthropogenic hydrocarbons; BHCs: biogenic hydrocarbons; RAROM: reactive aromatics except for benzene; LRHCs: low-reactivity hydrocarbons; C4HC: alkanes with ≥4 carbons; and alkenes).
In this study, we also calculated the relative incremental reactivity (RIR) to diagnose the sensitivity of O3 formation to its precursors. Figure 9 shows the RIR values for major groups of O3 precursors. Around 50 types of VOCs were classified as anthropogenic hydrocarbons (AHCs), and the isoprene was categorized into biogenic hydrocarbons (BHCs). Moreover, AHCs were further divided into four groups of reactive aromatics (RAROM, including aromatics except for benzene), low-reactivity hydrocarbons (LRHCs, including ethane, acetylene, propane, and benzene), alkenes, and alkanes with ≥4 carbons (C4HC). The in situ O3 production was highly VOC-sensitive, especially AHC-sensitive (RIR: 0.63–1.02), followed by CO (0.17–0.27) and BHCs (0.14–0.26), indicating the impacts from anthropogenic activities and flourishing vegetation emissions (T. Liu et al., 2020a; Lin et al., 2020). The RIRs were NOx-negative, ranging from −0.70 to −0.08. As shown in Fig. 9b, the contributors of AHC sub-groups to RIRs were RAROM (RIR: 0.24–0.46), C4HC (0.17–0.30), alkenes (0.11–15 0.32), and LRHCs (0.03–0.04). Therefore, the reduction of aromatics, alkenes, and alkanes with ≥4 carbons effectively decreased O3 production, and the reduction of NOx might aggravate O3 pollution.
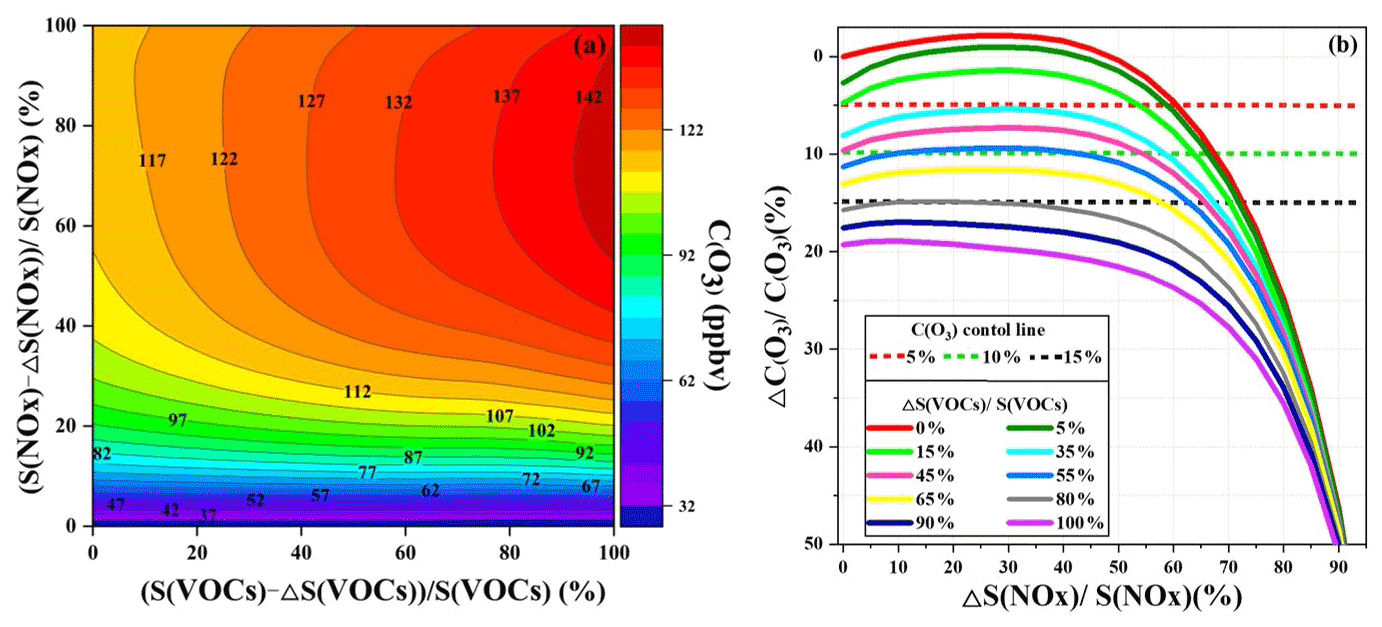
Figure 10(a) Isopleth diagrams of modeled O3 production potential (C(O3)) on S(VOC) and S(NOx) remaining percentages (i.e., and ). (b) Relationship of C(O3) increment percentage () with S(NOx) and S(VOC) reduction percentages ( and ΔS(VOCs) S(VOCs)). Note that C(O3), S(NOx), and S(NOx) represent the concentrations of corresponding pollutants.
In order to investigate the O3 control strategies during this multi-day O3 pollution event, the scenario analysis with reduction by 0 %–100 % at intervals of 5 % for the reduction of anthropogenic VOCs (ΔS(VOCs) S(VOCs)) and NOx (ΔS(NOx) S(NOx)) was conducted using the OBM-MCM. According to the Empirical Kinetic Modeling Approach (EKMA) and scenario analysis, O3 formation was in the NO titration regime (Fig. 10), in accordance with the RIR analysis results, which meant VOCs should be reduced to effectively control O3 during the O3 pollution event. The maximum value of MDA8h O3 during the monitoring period was 85 ppbv, exceeding the national air quality standard of 75 ppbv for O3 by 13 %. Hence, the O3 reductions of 5 %, 10 %, and 15 % were set to discuss the reduction schemes of anthropogenic VOCs and NOx. As shown in Fig. 10b, the 5 % control target is achieved as follows: (1) S(VOCs) are reduced by 15 %, while S(NOx) remain unchanged; (2) S(VOCs) are reduced by more than 35 %; and (3) S(NOx) reduction is higher than 60 %. The first scenario of just reducing VOC emission was the most cost-efficient way for short-term or emergency control of O3. However, NOx, as important precursors of PM2.5, need to be reduced according to the long-term multi-pollutant control air quality improvement plan in China; thus the second scenario is a more practical and reasonable way to control air pollution. The 10 % O3 control target was achieved by the 45 % reduction of S(VOCs) and the S(NOx) keeping the original emission. In view of the long-term control strategy of NOx and VOCs, reduction of S(VOCs) by 55 % and 80 % could decrease O3 concentrations by 10 % and 15 %, respectively. Although VOC and NOx control measures were drastically implemented, it is still challenging to achieve the 15 % O3 control goals in urban areas with relatively low precursor emissions. As the episode is a typical pollution process in the coastal region, the research results might act as a reference for the policy makers. Meanwhile, as the O3 sensitivity changed under the implementation of control measures, it is necessary to adjust the reduction of VOC and NOx policies in a timely manner.
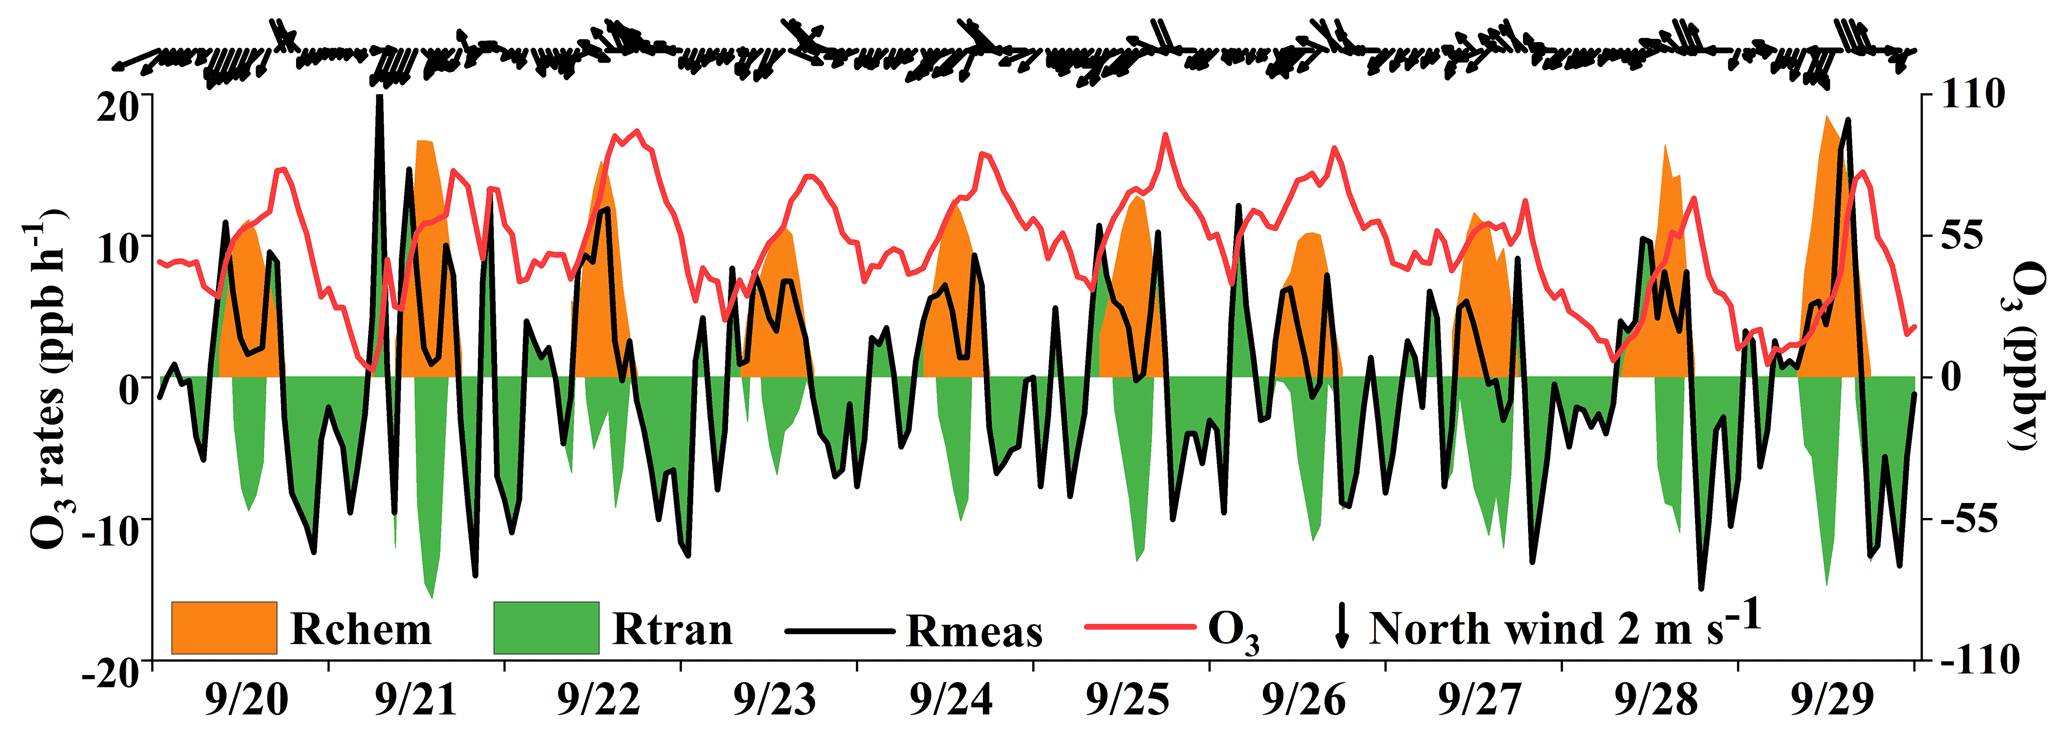
Figure 11O3 accumulation and contributions from local photochemical production and regional transport. Rchem, Rtran, and Rmeas in the legend represent local O3 photochemical production, regional transport, and observed O3 formation rate, respectively.
3.3.2 O3 from local photochemical production and regional transport
Previous studies have found that the variation of O3 mixing ratios was mainly influenced by chemical and physical processes (Xue et al., 2014; Tan et al., 2018). Figure 11 shows the time series of O3 accumulation and contributions from local photochemical production and regional transport. The observed rate of change in O3 (Rmeas) was calculated by the derivative of the observed O3 concentrations (). The local O3 production (Rchem) was calculated by Eq. (3) and computed hourly by the OBM as described in Sect. 2.2. The physical processes (Rtran) were calculated by the equation of , including horizontal and/or vertical transport and dry deposition dilution mixing. Many studies showed that the impacts of dry deposition were minor; thus the differences between observed O3 changes and local O3 production were mainly caused by the regional transport (note that the effect of atmospheric mixing was also included in this term) and could reasonably quantify the contributions of regional transport at our observation site (Zhang et al., 2021; Chen et al., 2020). The positive values of Rtran represented the O3 import of regional transport, while the negative values indicated the O3 export and deposition. We quantified the contributions of local photochemical formation and regional transport to the observed O3 and figured out the reasons for the O3 pollution process.
As shown in Fig. 11, two regular O3 import phenomena with positive values of Rtran were observed, and the curve of the Rmeas showed the “M” trend during the daytime. The first transient intense O3 import happened in the early morning (at around 06:00–09:00), leading to a rapid increase in O3 concentration, which was mainly attributed to the residual ozone from the day before. The O3 export was remarkable at around 10:00–16:00, indicating the potential impacts on air quality in downwind areas. Generally, the maximum daily value of O3 at this observation site appeared at around 15:00 LT without regional transport (Wu et al., 2019). In Fig. 11, we found that the O3 concentrations showed two peaks at around 15:00 and 17:00 LT, and O3 concentrations rose slowly or even decreased firstly and then increased between the two peaks. Under these circumstances, the local photochemical production kept producing O3, but the decreased O3 concentrations could be attributed to the favorable atmospheric conditions in diluting pollutants (O3 export). When the near-surface wind direction changed from northeast to southeast, the second O3 import phenomenon occurred in the afternoon (16:00–19:00 LT) on 4 d (20, 25, 27, and 29 September). Due to the persistence of Rtran in the afternoon, the daily maximum O3 values appeared at around 17:00 LT. The conditions of a southeast wind direction in the downtown area with a high density of vehicles would cause O3 and its precursors to be transmitted to our observation site, consistent with the diurnal patterns of NO2, OVOCs, alkanes, and aromatics in the early morning and afternoon (Fig. 2) and matching with the “M” trend of Rmeas. This result indicated that the sudden changes of near-surface winds corresponded to the variation in the transport of the urban plume.
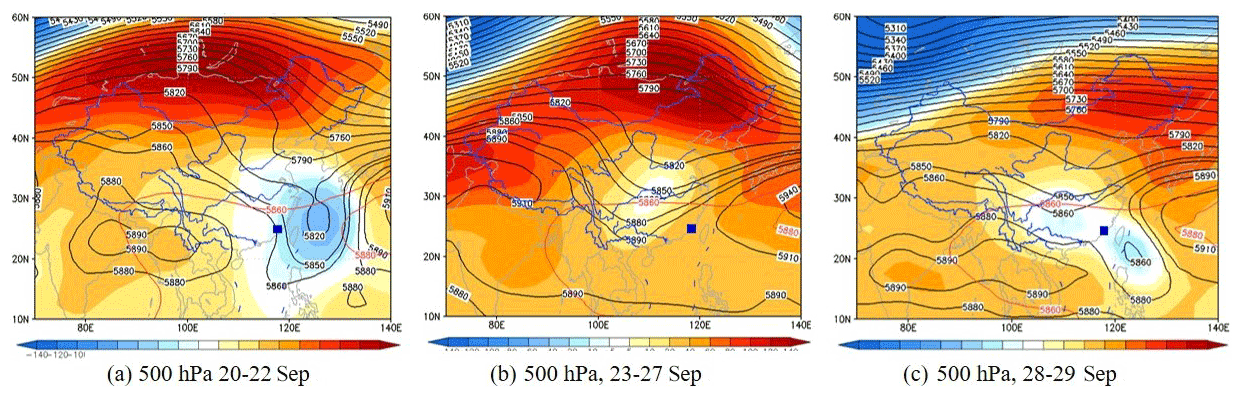
Figure 12Synoptic situations of continental high pressure from 20 to 29 September 2019. The gradient color area indicates the WPSH over the map, and the contour line is from the characteristic isoline of 5880 gpm to the center isoline of 5920 gpm. The blue square is the study site.
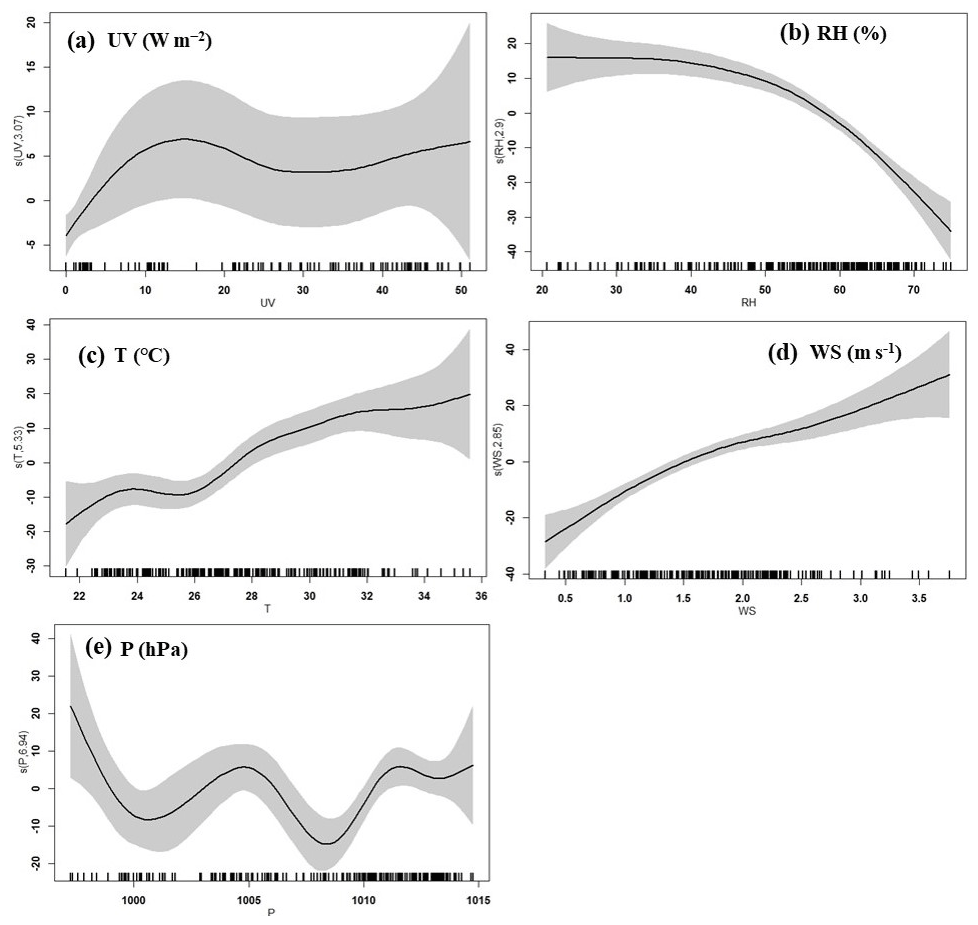
Figure 13Response curves in the GAM of O3 concentration to changes in (a) ultraviolet radiation (UV), (b) relative humidity (RH), (c) temperature (T), (d) wind speed (WS), and (e) pressure (P). The y axis shows the smoothing function values. The x axis shows the influencing factor; the vertical short lines represent the concentration distribution characteristics of the explanatory variables, and the shaded area around the solid line indicates the 95 % confidence interval of O3 concentration.
According to the synoptic situations and meteorological parameters (Figs. 1, S4 and 12), the environmental conditions also favored the O3 pollution process during the observation periods. The contribution of Rchem (daily maximum: ranged from 10.2 to 19.1 ppb h−1) during the daytime was observed (Fig. 11). In Fig. S4a–c, the monitoring site was continuously affected by the northerly airflow with high O3 and its precursors (from an industrial city adjacent to Xiamen, Quanzhou, or polluted regions of the Yangtze River Delta), due to Typhoon Tapah from 20 to 22 September 2019. The transport of O3 import appeared on 21 September (7.1 ± 7.0 ppb h−1), which resulted in the accumulation of O3 (MDA8h O3: 85 ppbv) on 22 September. When the influence of typhoon disappeared, the direction of airflow turned from northerly into southwesterly with humid and warm conditions at 500 hPa (Fig. S4d), and the surface wind on 23 September was affected by the control of the cold northerly airflow (Fig. S4e and f). Meteorological conditions including continental high pressure during 23 to 27 September were favorable to the accumulation of air pollutants (Fig. 12). The isoline of 5880 gpm moving from north to the Yangtze River (Fig. 12a and b) indicated the strengthened subtropical high pressure during 23–27 September 2019, which carried high temperature, low RH, and stagnant weather conditions, and the transport rate of O3 export (5.4 ± 3.4 ppb h−1) on 24–26 September was lower than that on other days (6.3 ± 4.0 ppb h−1). Favorable meteorological conditions significantly affected the formation and accumulation of O3, and we chose five meteorological parameters (i.e. UV, T, RH, P and WS) to quantify the complex nonlinear relationships between O3 and its influencing factors based on a generalized additive model (GAM) (Hua et al., 2021). Table S3 showed that the factors had significant nonlinear impacts on O3 concentration changes at the level of P value <0.01 and degrees of freedom >1, indicating that each influencing factor has statistical significance as an explanatory variable. According to the F values reflecting the importance of the influencing factors, the order of the explanatory variables was RH (40.1) > WS (26.9) >T (10.9) >P (3.9) > UV (3.0). Response curves of O3 concentration to explanatory factors are presented in Fig. 13. The O3 concentration showed a remarkable upward trend until the UV increased to 17 W m−2, then it changed little with the fluctuation of UV (Fig. 13a). In previous studies, UV had a significant positive correlation with O3 concentrations (Ma et al., 2020), and these results showed the regional transport impacts on O3 formation in our study. The RH and T had negative and positive correlations with O3 concentrations, respectively (Fig. 13b and c). The increase of wind speed was favorable for O3 regional transport (Fig. 13d). The influence of atmospheric pressure on O3 seemed to be irregular and minor, which could be ignored (Fig. 13e). Hence, under the combined effects of favorable photochemical reaction conditions and strengthened WPSH, the MDA8h O3 exceeded the standard of 75 ppbv during 24–26 September. Previous studies had found that severe multi-day O3 pollution appeared under the WPSH control (H. Wang et al., 2018). Overall, the results indicate that the three conditions of local photochemical production, synoptic situations, and regional transport played very important roles in the pollution event.
In the present study, we analyzed a typical high-O3 event during 20–29 September 2019 in a coastal city of southeastern China. We clarified the characteristics of AOC, OH reactivity, and radical chemistry, as well as O3 formation mechanisms using the OBM-MCM model. The predominant oxidant for AOC during the daytime and nighttime was the OH and NO3, respectively. During the period of O3 pollution process, OVOCs, NO2,, and CO consumed OH the most. Meanwhile, the photolysis of HONO, O3, HCHO, and other OVOCs was a major source of ROx, which played the initiation role in atmospheric oxidation processes. The radical termination reactions were governed by cross-reactions between ROx and NOx. The RIR and EKMA results showed that the O3 formation in autumn in the coastal city was VOCs-sensitive, and the VOCs were the limited factor of radical recycling and O3 formation. The reduced emissions of aromatics, alkenes, and alkanes with ≥4 carbons were benefit for ozone pollution control. The three conditions of local photochemical production, synoptic situations, and regional transport played very important roles in the pollution event. Overall, the results clarified the O3 pollution process with relatively low local precursor emissions and implied the fact that O3 pollution control in coastal cities needs to be studied further.
The observation data at this site are available from the authors upon request.
The supplement related to this article is available online at: https://doi.org/10.5194/acp-22-2173-2022-supplement.
TL and YH contributed equally to this work. JC and LikX designed and revised the manuscript. TL collected the data and contributed to the data analysis. TL and YH performed chemical modeling analyses of OBM-MCM and wrote the paper. JC supported funding of observation and research. LinX, ML, CY, YD, YZ, and MZ contributed to discussions of results. ZH and HW provided meteorological conditions in Xiamen.
The contact author has declared that neither they nor their co-authors have any competing interests.
Publisher's note: Copernicus Publications remains neutral with regard to jurisdictional claims in published maps and institutional affiliations.
This study was funded by the Cultivating Project of Strategic Priority Research Program of Chinese Academy of Sciences (XDPB1903), the FJIRSM&IUE Joint Research Fund (RHZX-2019-006), the Center for Excellence in Regional Atmospheric Environment, CAS (E0L1B20201), the Xiamen Youth Innovation Fund Project (3502Z20206094), the foreign cooperation project of Fujian Province (2020I0038), and Xiamen Atmospheric Environment Observation and Research Station of Fujian Province.
This research has been supported by the CAS Center for Excellence in Regional Atmospheric Environment (grant no. E0L1B20201), the Cultivating Project of Strategic Priority Research Program of Chinese Academy of Sciences (grant no. XDPB1903), the FJIRSM&IUE Joint Research Fund (grant no. RHZX-2019-006), the Xiamen Youth Innovation Fund Project (grant no. 3502Z20206094), the foreign cooperation project of Fujian Province (grant no. 2020I0038), and Xiamen Atmospheric Environment Observation and Research Station of Fujian Province.
This paper was edited by Timothy Bertram and reviewed by two anonymous referees.
Acker, K., Möller, D., Wieprecht, W., Auel, R., Kalaß, D., and Tscherwenka, W.: Nitrous and nitric acid measurements inside and outside of clouds at Mt. Brocken, Water Air Soil Pollut., 130, 331–336, 2001.
Chang, L., Xu, J., Tie, X., and Gao, W.: The impact of Climate Change on the Western Pacific Subtropical High and the related ozone pollution in Shanghai, China, Sci. Rep.-UK, 9, 16998, https://doi.org/10.1038/s41598-019-53103-7, 2019.
Chen, T., Xue, L., Zheng, P., Zhang, Y., Liu, Y., Sun, J., Han, G., Li, H., Zhang, X., Li, Y., Li, H., Dong, C., Xu, F., Zhang, Q., and Wang, W.: Volatile organic compounds and ozone air pollution in an oil production region in northern China, Atmos. Chem. Phys., 20, 7069–7086, https://doi.org/10.5194/acp-20-7069-2020, 2020.
Deng, J., Guo, H., Zhang, H., Zhu, J., Wang, X., and Fu, P.: Source apportionment of black carbon aerosols from light absorption observation and source-oriented modeling: an implication in a coastal city in China, Atmos. Chem. Phys., 20, 14419–14435, https://doi.org/10.5194/acp-20-14419-2020, 2020.
Edwards, P. M., Young, C. J., Aikin, K., deGouw, J., Dubé, W. P., Geiger, F., Gilman, J., Helmig, D., Holloway, J. S., Kercher, J., Lerner, B., Martin, R., McLaren, R., Parrish, D. D., Peischl, J., Roberts, J. M., Ryerson, T. B., Thornton, J., Warneke, C., Williams, E. J., and Brown, S. S.: Ozone photochemistry in an oil and natural gas extraction region during winter: simulations of a snow-free season in the Uintah Basin, Utah, Atmos. Chem. Phys., 13, 8955–8971, https://doi.org/10.5194/acp-13-8955-2013, 2013.
Edwards, P. M., Brown, S. S., Roberts, J. M., Ahmadov, R., Banta, R. M., Degouw, J. A., Dubé, W. P., Field, R. A., Flynn, J. H., Gilman, J. B., and Graus, M.: High winter ozone pollution from carbonyl photolysis in an oil and gas basin, Nature, 514, 351, https://doi.org/10.1038/nature13767, 2014.
Eisele, F. L., Mount, G. H., Tanner, D., Jefferson, A., Shetter, R., Harder, J. W., and Williams, E. J.: Understanding the production and interconversion of the hydroxyl radical during the Tropospheric OH Photochemistry Experiment, J. Geophys. Res., 102, 6457–6465, 1997.
Elshorbany, Y. F., Kurtenbach, R., Wiesen, P., Lissi, E., Rubio, M., Villena, G., Gramsch, E., Rickard, A. R., Pilling, M. J., and Kleffmann, J.: Oxidation capacity of the city air of Santiago, Chile, Atmos. Chem. Phys., 9, 2257–2273, https://doi.org/10.5194/acp-9-2257-2009, 2009.
Emmerson, K. M., Carslaw, N., and Pilling, M. J.: Urban Atmospheric Chemistry During the PUMA Campaign 2: Radical Budgets for OH, HO2 and RO2, J. Atmos. Chem., 52, 165–183, https://doi.org/10.1007/s10874-005-1323-2, 2005.
Fowler, D., Pilegaard, K., Sutton, M. A., Ambus, P., Raivonen, M., Duyzer, J., Simpson, D., Fagerli, H., Fuzzi, S., Schjoerring, J. K., Granier, C., Neftel, A., Isaksen, I. S. A., Laj, P., Maione, M., Monks, P. S., Burkhardt, J., Daemmgen, U., Neirynck, J., Personne, E., Wichink-Kruit, R., Butterbach-Bahl, K., Flechard, C., Tuovinen, J. P., Coyle, M., Gerosa, G., Loubet, B., Altimir, N., Gruenhage, L., Ammann, C., Cieslik, S., Paoletti, E., Mikkelsen, T. N., Ro-Poulsen, H., Cellier, P., Cape, J. N., Horváth, L., Loreto, F., Niinemets, Ü., Palmer, P. I., Rinne, J., Misztal, P., Nemitz, E., Nilsson, D., Pryor, S., Gallagher, M. W., Vesala, T., Skiba, U., Brüggemann, N., Zechmeister-Boltenstern, S., Williams, J., O'Dowd, C., Facchini, M. C., de Leeuw, G., Flossman, A., Chaumerliac, N., and Erisman, J. W.: Atmospheric composition change: Ecosystems–Atmosphere interactions, Atmos. Environ., 43, 5193–5267, https://doi.org/10.1016/j.atmosenv.2009.07.068, 2009.
George, L. A., Hard, T. M., and O'Brien, R. J.: Measurement of free radicals OH and HO2 in Los Angeles smog, J. Geophys. Res., 104, 11643–11655, 1999.
Geyer, A., Alicke, B., Konrad, S., Schmitz, T., Stutz, J., and Platt, U.: Chemistry and oxidation capacity of the nitrate radical in the continental boundary layer near Berlin, J. Geophys. Res., 106, 8013–8025, https://doi.org/10.1029/2000jd900681, 2001.
Gong, C. and Liao, H.: A typical weather pattern for ozone pollution events in North China, Atmos. Chem. Phys., 19, 13725–13740, https://doi.org/10.5194/acp-19-13725-2019, 2019.
Hansen, R. F., Griffith, S. M., Dusanter, S., Gilman, J., Graus, M., Kuster, W., Veres, P., Gouw, J. D., Warneke, C., Washenfelder, R., Young, C. J., Brown, S. S., Alvarez, S., Flynn, J. H., Grossberg, N., Lefer, B., Rappenglueck, B., and Stevens, P.: Measurements of Total OH Reactivity During CalNex-LA, J. Geophys. Res.-Atmos., 126, e2020JD032988, https://doi.org/10.1029/2020JD032988, 2021.
Hofzumahaus, A., Rohrer, F., Lu, K. D., Bohn, B., Brauers, T., Chang, C. C., Fuchs, H., Holland, F., Kita, K., Kondo, Y., Li, X., Lou, S. R., Shao, M., Zeng, L. M., Wahner, A., and Zhang, Y. H.: Amplified Trace Gas Removal in the Troposphere, Science, 324, 1702–1704, 2009.
Hu, B., Liu, T., Hong, Y., Xu, L., Li, M., Wu, X., Wang, H., Chen, J., and Chen, J.: Characteristics of peroxyacetyl nitrate (PAN) in a coastal city of southeastern China: Photochemical mechanism and pollution process, Sci. Total Environ., 719, 137493, https://doi.org/10.1016/j.scitotenv.2020.137493, 2020.
Hu, B., Duan, J., Hong, Y., Xu, L., Li, M., Bian, Y., Qin, M., Fang, W., Xie, P., and Chen, J.: Exploration of the atmospheric chemistry of nitrous acid in a coastal city of southeastern China: results from measurements across four seasons, Atmos. Chem. Phys., 22, 371–393, https://doi.org/10.5194/acp-22-371-2022, 2022.
Hua, J., Zhang, Y., de Foy, B., Shang, J., Schauer, J. J., Mei, X., Sulaymon, I. D., and Han, T.: Quantitative estimation of meteorological impacts and the COVID-19 lockdown reductions on NO2 and PM2.5 over the Beijing area using Generalized Additive Models (GAM), J. Environ. Manage., 291, 112676, https://doi.org/10.1016/j.jenvman.2021.112676, 2021.
Jenkin, M. E., Saunders, S. M., Wagner, V., and Pilling, M. J.: Protocol for the development of the Master Chemical Mechanism, MCM v3 (Part B): tropospheric degradation of aromatic volatile organic compounds, Atmos. Chem. Phys., 3, 181–193, https://doi.org/10.5194/acp-3-181-2003, 2003.
Jiang, Y., Xue, L., Gu, R., Jia, M., Zhang, Y., Wen, L., Zheng, P., Chen, T., Li, H., Shan, Y., Zhao, Y., Guo, Z., Bi, Y., Liu, H., Ding, A., Zhang, Q., and Wang, W.: Sources of nitrous acid (HONO) in the upper boundary layer and lower free troposphere of the North China Plain: insights from the Mount Tai Observatory, Atmos. Chem. Phys., 20, 12115–12131, https://doi.org/10.5194/acp-20-12115-2020, 2020.
Kanaya, Y., Matsumoto, J., Kato, S., and Akimoto, H.: Behavior of OH and HO2 radicals during the Observations at a Remote Island of Okinawa (ORION99) field campaign 2. Comparison between observations and calculations, J. Geophys. Res., 106, 24209–24223, 2001.
Kanaya, Y., Cao, R. Q., Akimoto, H., Fukuda, M., Komazaki, Y., Yokouchi, Y., Koike, M., Tanimoto, H., Takegawa, N., and Kondo, Y.: Urban photochemistry in central Tokyo: 1. Observed and modeled OH and HO2 radical concentrations during the winter and summer of 2004, J. Geophys. Res., 112, D21312, https://doi.org/10.1029/2007JD008670, 2007.
Kovacs, T. A., Brune, W. H., Harder, H., Martinez, M., Simpas, J. B., Frost, G. J., Williams, E., Jobson, T., Stroud, C., Young, V., Fried, A., and Wert, B.: Direct measurements of urban OH reactivity during Nashville SOS in summer 1999, J. Environ. Monitor., 5, 68–74, https://doi.org/10.1039/b204339d, 2003.
Li, Z., Xue, L., Yang, X., Zha, Q., Tham, Y. J., Yan, C., Louie, P. K. K., Luk, C. W. Y., Wang, T., and Wang, W.: Oxidizing capacity of the rural atmosphere in Hong Kong, Southern China, Sci. Total Environ., 612, 1114–1122, https://doi.org/10.1016/j.scitotenv.2017.08.310, 2018.
Lin, H., Wang, M., Duan, Y., Fu, Q., Ji, W., Cui, H., Jin, D., Lin, Y., and Hu, K.: O3 Sensitivity and Contributions of Different NMHC Sources in O3 Formation at Urban and Suburban Sites in Shanghai, Atmosphere, 11, 295, https://doi.org/10.3390/atmos11030295, 2020.
Ling, Z., Zhao, J., Fan, S., and Wang, X.: Sources of formaldehyde and their contributions to photochemical O3 formation at an urban site in the Pearl River Delta, southern China, Chemosphere, 168, 1293–1301, https://doi.org/10.1016/j.chemosphere.2016.11.140, 2017.
Liu, J., Wang, L., Li, M., Liao, Z., Sun, Y., Song, T., Gao, W., Wang, Y., Li, Y., Ji, D., Hu, B., Kerminen, V.-M., Wang, Y., and Kulmala, M.: Quantifying the impact of synoptic circulation patterns on ozone variability in northern China from April to October 2013–2017, Atmos. Chem. Phys., 19, 14477–14492, https://doi.org/10.5194/acp-19-14477-2019, 2019.
Liu, T., Hu, B., Xu, X., Hong, Y., Zhang, Y., Wu, X., Xu, L., Li, M., Chen, Y., Chen, X., and Chen, J.: Characteristics of PM2.5-bound secondary organic aerosol tracers in a coastal city in Southeastern China: Seasonal patterns and pollution identification, Atmos. Environ., 237, 117710, https://doi.org/10.1016/j.atmosenv.2020.117710, 2020a.
Liu, T., Hu, B., Yang, Y., Li, M., Hong, Y., Xu, X., Xu, L., Chen, N., Chen, Y., Xiao, H., and Chen, J.: Characteristics and source apportionment of PM2.5 on an island in Southeast China: Impact of sea-salt and monsoon, Atmos. Res., 235, 104786, https://doi.org/10.1016/j.atmosres.2019.104786, 2020b.
Liu, X., Lyu, X., Wang, Y., Jiang, F., and Guo, H.: Intercomparison of O3 formation and radical chemistry in the past decade at a suburban site in Hong Kong, Atmos. Chem. Phys., 19, 5127–5145, https://doi.org/10.5194/acp-19-5127-2019, 2019.
Liu, X., Wang, N., Lyu, X., Zeren, Y., Jiang, F., Wang, X., Zou, S., Ling, Z., and Guo, H.: Photochemistry of ozone pollution in autumn in Pearl River Estuary, South China, Sci. Total Environ., 754, 141812, https://doi.org/10.1016/j.scitotenv.2020.141812, 2020.
Liu, Z., Wang, Y., Gu, D., Zhao, C., Huey, L. G., Stickel, R., Liao, J., Shao, M., Zhu, T., Zeng, L., Amoroso, A., Costabile, F., Chang, C.-C., and Liu, S.-C.: Summertime photochemistry during CAREBeijing-2007: ROx budgets and O3 formation, Atmos. Chem. Phys., 12, 7737–7752, https://doi.org/10.5194/acp-12-7737-2012, 2012.
Lou, S., Holland, F., Rohrer, F., Lu, K., Bohn, B., Brauers, T., Chang, C. C., Fuchs, H., Häseler, R., Kita, K., Kondo, Y., Li, X., Shao, M., Zeng, L., Wahner, A., Zhang, Y., Wang, W., and Hofzumahaus, A.: Atmospheric OH reactivities in the Pearl River Delta – China in summer 2006: measurement and model results, Atmos. Chem. Phys., 10, 11243–11260, https://doi.org/10.5194/acp-10-11243-2010, 2010.
Lu, X., Hong, J., Zhang, L., Copper. O. R., Schultz, M. G., Xu, X., Wang, T., Gao, M., Zhao, Y., and Zhang, Y.: Severe Surface Ozone Pollution in China: A Global Perspective, Environ. Sci. Technol. Lett., 5, 487–494, 2018.
Ma, Y., Ma, B., Jiao, H., Zhang, Y., Xin, J., and Yu, Z.: An analysis of the effects of weather and air pollution on tropospheric ozone using a generalized additive model in Western China: Lanzhou, Gansu, Atmos. Environ., 224, 117342, https://doi.org/10.1016/j.atmosenv.2020.117342, 2020.
Mao, J., Ren, X., Chen, S., Brune, W. H., Chen, Z., Martinez, M., Harder, H., Lefer, B., Rappenglück, B., Flynn, J., and Leuchner, M.: Atmospheric oxidation capacity in the summer of Houston 2006: Comparison with summer measurements in other metropolitan studies, Atmos. Environ., 44, 4107–4115, https://doi.org/10.1016/j.atmosenv.2009.01.013, 2010.
Martinez, M., Harder, H., Kovacs, T., Simpas, J., Bassis, J., Lesher, R., Brune, W., Frost, G., Williams, E., Stroud, C., Jobson, B. T., Roberts, J. M., Hall, S., Shetter, R., Wert, B., Fried, A., Alicke, B., Stutz, J., Young, V., White, A., and Zamora, R.: OH and HO2 concentrations, sources, and loss rates during the Southern Oxidants Study in Nashville, Tennessee, summer 1999, J. Geophys. Res., 108, 108, 4617, https://doi.org/10.1029/2003jd003551, 2003.
Michoud, V., Kukui, A., Camredon, M., Colomb, A., Borbon, A., Miet, K., Aumont, B., Beekmann, M., Durand-Jolibois, R., Perrier, S., Zapf, P., Siour, G., Ait-Helal, W., Locoge, N., Sauvage, S., Afif, C., Gros, V., Furger, M., Ancellet, G., and Doussin, J. F.: Radical budget analysis in a suburban European site during the MEGAPOLI summer field campaign, Atmos. Chem. Phys., 12, 11951–11974, https://doi.org/10.5194/acp-12-11951-2012, 2012.
Nakashima, Y., Kato, S., Greenberg, J., Harley, P., Karl, T., Turnipseed, A., Apel, E., Guenther, A., Smith, J., and Kajii, Y.: Total OH reactivity measurements in ambient air in a southern Rocky mountain ponderosa pine forest during BEACHON-SRM08 summer campaign, Atmos. Environ., 85, 1–8, 2014.
Ren, X., Brune, W. H., Cantrell, C. A., Edwards, G. D., Shirley, T., Metcalf, A. R., and Lesher, R. L.: Hydroxyl and peroxy radical chemistry in a rural area of Central Pennsylvania: Observations and model comparisons, J. Atmos. Chem., 52, 231–257, https://doi.org/10.1007/s10874-005-3651-7, 2005.
Rollins, A. W., Browne, E. C., Min, K. E., Pusede, S. E., Wooldridge, P. J., Gentner, D. R., Goldstein, A. H., Liu, S., Day, D. A., Russell, L. M., and Cohen, R. C.: Evidence for NOx Control over Nighttime SOA Formation, Science, 337, 1210–1212, 2012.
Saunders, S. M., Jenkin, M. E., Derwent, R. G., and Pilling, M. J.: Protocol for the development of the Master Chemical Mechanism, MCM v3 (Part A): tropospheric degradation of non-aromatic volatile organic compounds, Atmos. Chem. Phys., 3, 161–180, https://doi.org/10.5194/acp-3-161-2003, 2003.
Sheehy, P. M., Volkamer, R., Molina, L. T., and Molina, M. J.: Oxidative capacity of the Mexico City atmosphere – Part 2: A ROx radical cycling perspective, Atmos. Chem. Phys., 10, 6993–7008, https://doi.org/10.5194/acp-10-6993-2010, 2010.
Simon, H., Reff, A., Wells, B., Xing, J., and Frank, N.: Ozone trends across the United States over a period of decreasing NOx and VOC emissions, Environ. Sci. Technol., 49, 186–195, https://doi.org/10.1021/es504514z, 2015.
Smith, S. C., Lee, J. D., Bloss, W. J., Johnson, G. P., Ingham, T., and Heard, D. E.: Concentrations of OH and HO2 radicals during NAMBLEX: measurements and steady state analysis, Atmos. Chem. Phys., 6, 1435–1453, https://doi.org/10.5194/acp-6-1435-2006, 2006.
Tan, Z., Lu, K., Jiang, M., Su, R., Dong, H., Zeng, L., Xie, S., Tan, Q., and Zhang, Y.: Exploring ozone pollution in Chengdu, southwestern China: A case study from radical chemistry to O3-VOC-NOx sensitivity, Sci. Total Environ., 636, 775–786, https://doi.org/10.1016/j.scitotenv.2018.04.286, 2018.
Tan, Z., Lu, K., Jiang, M., Su, R., Wang, H., Lou, S., Fu, Q., Zhai, C., Tan, Q., Yue, D., Chen, D., Wang, Z., Xie, S., Zeng, L., and Zhang, Y.: Daytime atmospheric oxidation capacity in four Chinese megacities during the photochemically polluted season: a case study based on box model simulation, Atmos. Chem. Phys., 19, 3493–3513, https://doi.org/10.5194/acp-19-3493-2019, 2019.
Volkamer, R., Sheehy, P., Molina, L. T., and Molina, M. J.: Oxidative capacity of the Mexico City atmosphere – Part 1: A radical source perspective, Atmos. Chem. Phys., 10, 6969–6991, https://doi.org/10.5194/acp-10-6969-2010, 2010.
Wang, H., Tan, S., Wang, Y., Jiang, C., Shi, G., Zhang, M., and Che, H.: A multisource observation study of the severe prolonged regional haze episode over eastern China in January 2013, Atmos. Environ., 89, 807–815, 2014.
Wang, H., Lyu, X., Guo, H., Wang, Y., Zou, S., Ling, Z., Wang, X., Jiang, F., Zeren, Y., Pan, W., Huang, X., and Shen, J.: Ozone pollution around a coastal region of South China Sea: interaction between marine and continental air, Atmos. Chem. Phys., 18, 4277–4295, https://doi.org/10.5194/acp-18-4277-2018, 2018.
Wang, M., Chen, W., Zhang, L., Qin, W., Zhang, Y., Zhang, X., and Xie, X.: Ozone pollution characteristics and sensitivity analysis using an observation-based model in Nanjing, Yangtze River Delta Region of China, J. Environ. Sci. (China), 93, 13–22, https://doi.org/10.1016/j.jes.2020.02.027, 2020.
Wang, Y., Guo, H., Zou, S., Lyu, X., Ling, Z., Cheng, H., and Zeren, Y.: Surface O3 photochemistry over the South China Sea: Application of a near-explicit chemical mechanism box model, Environ. Pollut., 234, 155–166, https://doi.org/10.1016/j.envpol.2017.11.001, 2018.
Whalley, L. K., Stone, D., Bandy, B., Dunmore, R., Hamilton, J. F., Hopkins, J., Lee, J. D., Lewis, A. C., and Heard, D. E.: Atmospheric OH reactivity in central London: observations, model predictions and estimates of in situ ozone production, Atmos. Chem. Phys., 16, 2109–2122, https://doi.org/10.5194/acp-16-2109-2016, 2016.
Wu, X., Xu, L., Hong, Y., Chen, J., Qiu, Y., Hu, B., Hong, Z., Zhang, Y., Liu, T., Chen, Y., Bian, Y., Zhao, G., Chen, J., and Li, M.: The air pollution governed by subtropical high in a coastal city in Southeast China: Formation processes and influencing mechanisms, Sci. Total Environ., 692, 1135–1145, https://doi.org/10.1016/j.scitotenv.2019.07.341, 2019.
Wu, X., Li, M., Chen, J., Wang, H., Xu, L., Hong, Y., Zhao, G., Hu, B., Zhang, Y., Dan, Y., and Yu, S.: The characteristics of air pollution induced by the quasi-stationary front: Formation processes and influencing factors, Sci. Total Environ., 707, 136194, https://doi.org/10.1016/j.scitotenv.2019.136194, 2020.
Xue, L. K., Wang, T., Gao, J., Ding, A. J., Zhou, X. H., Blake, D. R., Wang, X. F., Saunders, S. M., Fan, S. J., Zuo, H. C., Zhang, Q. Z., and Wang, W. X.: Ground-level ozone in four Chinese cities: precursors, regional transport and heterogeneous processes, Atmos. Chem. Phys., 14, 13175–13188, https://doi.org/10.5194/acp-14-13175-2014, 2014.
Xue, L., Gu, R., Wang, T., Wang, X., Saunders, S., Blake, D., Louie, P. K. K., Luk, C. W. Y., Simpson, I., Xu, Z., Wang, Z., Gao, Y., Lee, S., Mellouki, A., and Wang, W.: Oxidative capacity and radical chemistry in the polluted atmosphere of Hong Kong and Pearl River Delta region: analysis of a severe photochemical smog episode, Atmos. Chem. Phys., 16, 9891–9903, https://doi.org/10.5194/acp-16-9891-2016, 2016.
Zeren, Y., Guo, H., Lyu, X., Jiang, F., Wang, Y., Liu, X., Zeng, L., Li, M., and Li, L.: An Ozone “Pool” in South China: Investigations on Atmospheric Dynamics and Photochemical Processes Over the Pearl River Estuary, J. Geophys. Res., 124, 12340–12355, https://doi.org/10.1029/2019jd030833, 2019.
Zhang, K., Duan, Y., Huo, J., Huang, L., Wang, Y., Fu, Q., Wang, Y., and Li, L.: Formation mechanism of HCHO pollution in the suburban Yangtze River Delta region, China: A box model study and policy implementations, Atmos. Environ., 267, 118755, https://doi.org/10.1016/j.atmosenv.2021.118755, 2021a.
Zhang, L., Brook, J. R., and Vet, R.: A revised parameterization for gaseous dry deposition in air-quality models, Atmos. Chem. Phys., 3, 2067–2082, https://doi.org/10.5194/acp-3-2067-2003, 2003.
Zhang, Y., Hong, Z., Chen, J., Xu, L., Hong, Y., Li, M., Hao, H., Chen, Y., Qiu, Y., Wu, X., Li, J.-R., Tong, L., and Xiao, H.: Impact of control measures and typhoon weather on characteristics and formation of PM2.5 during the 2016 G20 summit in China, Atmos. Environ., 224, 117312, https://doi.org/10.1016/j.atmosenv.2020.117312, 2020a.
Zhang, Y., Xu, L., Zhuang, M., Zhao, G., Chen, Y., Tong, L., Yang, C., Xiao, H., Chen, J., Wu, X., Hong, Y., Li, M., Bian, Y., and Chen, Y.: Chemical composition and sources of submicron aerosol in a coastal city of China: Results from the 2017 BRICS summit study, Sci. Total Environ., 741, 140470, https://doi.org/10.1016/j.scitotenv.2020.140470, 2020b.
Zhang, Y., Xue, L., Carter, W. P. L., Pei, C., Chen, T., Mu, J., Wang, Y., Zhang, Q., and Wang, W.: Development of ozone reactivity scales for volatile organic compounds in a Chinese megacity, Atmos. Chem. Phys., 21, 11053–11068, https://doi.org/10.5194/acp-21-11053-2021, 2021.
Zhu, J., Wang, S., Wang, H., Jing, S., Lou, S., Saiz-Lopez, A., and Zhou, B.: Observationally constrained modeling of atmospheric oxidation capacity and photochemical reactivity in Shanghai, China, Atmos. Chem. Phys., 20, 1217–1232, https://doi.org/10.5194/acp-20-1217-2020, 2020.