the Creative Commons Attribution 4.0 License.
the Creative Commons Attribution 4.0 License.
 | 15 Feb 2022
Using carbon-14 and carbon-13 measurements for source attribution of atmospheric methane in the Athabasca oil sands region
Regina Gonzalez Moguel
Felix Vogel
Sébastien Ars
Hinrich Schaefer
Jocelyn C. Turnbull
Peter M. J. Douglas
The rapidly expanding and energy-intensive production from the Canadian oil sands, one of the largest oil reserves globally, accounts for almost 12 % of Canada's greenhouse gas emissions according to inventories. Developing approaches for evaluating reported methane (CH4) emission is crucial for developing effective mitigation policies, but only one study has characterized CH4 sources in the Athabasca oil sands region (AOSR). We tested the use of 14C and 13C carbon isotope measurements in ambient CH4 from the AOSR to estimate source contributions from key regional CH4 sources: (1) tailings ponds, (2) surface mines and processing facilities, and (3) wetlands. The isotopic signatures of ambient CH4 indicate that the CH4 enrichments measured at the site were mainly influenced by fossil CH4 emissions from surface mining and processing facilities (56 ± 18 %), followed by fossil CH4 emissions from tailings ponds (34 ± 18 %) and to a lesser extent modern CH4 emissions from wetlands (10 ± <1 %). Our results confirm the importance of tailings ponds in regional CH4 emissions and show that this method can successfully distinguish wetland CH4 emissions. In the future, the isotopic characterization of CH4 sources and measurements from different seasons and wind directions are needed to provide a better source attribution in the AOSR.
- Article
(3793 KB) - Full-text XML
- BibTeX
- EndNote


Methane (CH4) is an important greenhouse gas that has 32 times the global warming potential (mass basis) of carbon dioxide (CO2) on a 100-year timescale and which contributes to the production of ozone, water vapour (in the stratosphere), and CO2 in the atmosphere (Myhre et al., 2013; Etminan et al., 2016). Global CH4 concentration in the atmosphere has almost tripled compared to pre-industrial values (Rubino et al., 2019), largely due to increased anthropogenic activities that include fossil fuel production and use and agriculture (Jackson et al., 2020; Turner et al., 2019). Since most fossil fuel emissions originate from coal, oil, and natural gas exploitation, transportation, and use (Jackson et al., 2020; Saunois et al., 2020), mitigating CH4 emissions from these activities is necessary to fulfil governmental CH4 emissions reduction goals. Furthermore, a fast CH4 mitigation from the oil and gas sector is projected to have a key role in slowing the rate of global warming over the next few decades (Ocko et al., 2021).
Canada contains approximately 10 % of the world's proven crude oil reserves, with 82 % of these reserves located in the Athabasca oil sands region (AOSR) in Alberta (Alberta Energy Regulator, 2015). Oil sand deposits, composed of a mixture of sand grains, water, bitumen, and clay minerals (Mossop, 1980; Takamura, 1982), are extracted through two methods. Shallow deposits (< 75 m) are recovered through surface mining, and the bitumen is subsequently separated from sands with alkaline warm water, concentrated, upgraded, and refined (Larter and Head, 2014). Residual water, solids, and diluents used to separate the bitumen are then stored in tailings, which depending on their age and composition emit volatile organic compounds (VOCs), reduced sulfur compounds, CO2, and CH4 (Small et al., 2015). In contrast, the recovery of deeper deposits requires the use of in situ techniques that involve lowering the viscosity of bitumen by injecting steam into the reservoir to extract it (Bergerson et al., 2012). Although only around 20 % of the oil sands deposits are recoverable using surface mining (Alberta Energy Regulator, 2015), surface mining accounts for 45 %–65 % of the annual crude oil production from oil sands (Holly et al., 2016). Each of these methods has greenhouse gas (GHG) emissions associated with it, and it is estimated that the oil sands account for 12 % of Canada's total GHG emissions (Government of Canada, 2018). In the AOSR, an aircraft-based study attributed CH4 emissions to three main sources: microbial methanogenesis in tailings ponds (45 % of total CH4 emissions), disturbance of mine faces in open-pit mines (50 % of total CH4 emissions), and facility activities such as venting, cogeneration, and natural gas leakage (5 % of total emissions) (Baray et al., 2018).
Methane emissions from the oil sands are reported annually to Environment and Climate Change Canada (ECCC) through the Greenhouse Gas Reporting Program (GHGRP), based on inventories of facilities that emit more than 1×10⁷ kg CO2-eq. yr−1 (Government of Canada, 2018). The GHGRP and other inventory approaches have varying degrees of accuracy and are vulnerable to uncertainty in the “emission factors” used to calculate the GHG emission rates. Top-down approaches are used to verify inventory-based GHG emission estimates, and aircraft-based top-down estimates in the AOSR have shown that inventories underestimate GHG emissions (Liggio et al., 2019), with an aircraft-based estimate reporting 48 % higher CH4 emissions than in the inventories (Baray et al., 2018). However, these aircraft measurements were limited to a short period of time (summer 2013), and there have not been other studies confirming and updating these findings. Given these limitations, additional measurements of CH4 and source specific tracers are needed to reconcile differences amongst methods, to generate data at different times of the year, and to generate long-term data for monitoring the evolution of AOSR emissions.
We can use 13C and 14C carbon isotopes to determine the sources of CH4 emissions because different CH4 sources have distinct isotopic compositions (Sherwood et al., 2017; Whalen et al., 1989). δ13C denotes the ratio of 13C relative to 12C compared to the Vienna Pee Dee Belemnite (VPDB) standard and reported in parts per thousand. The δ13C of CH4 depends strongly on how CH4 is produced: by microbial activity (−61.7 ± 6.2 ‰), by the thermal breakdown of organic molecules (−44.8 ± 10.7 ‰), and by incomplete combustion (−26.2 ± 15 ‰) (Sherwood et al., 2017). Δ14C reports the ratio of 14C relative to 12C compared to a decay-corrected standard and normalized to a δ13C of −25 ‰ to account for fractionation (Stuiver and Polach, 1977). Fossil fuels, including CH4 in natural gas, as well as CH4 produced from fossil fuel precursors, lack 14C and have a Δ14C value of −1000 ‰. In contrast, CH4 produced from other substrates has a Δ14C signal close to the contemporary atmospheric Δ14CO2 value (Whalen et al., 1989), which was approximately −5 ‰ in 2019 in the Northern Hemisphere, estimated from trends reported by Hammer and Levin (2017). CH4 produced from contemporary substrates does not approximate the atmospheric Δ14CH4 value (estimated to be 340 ‰ from the available data), which is determined by the ratio of modern biogenic to fossil methane emissions, as well as the 14C enrichment due to global nuclear power plant 14CH4 emissions (Lassey et al., 2007). The implication is that in the AOSR, δ13C can be used to separate thermogenic CH4 from surface mine emissions, and microbial CH4 from tailings ponds, local wetlands, and landfill emissions, while Δ14C can further separate the fossil microbial CH4 from tailings ponds from the modern microbial CH4 from landfills and wetlands.
Previous studies have shown that δ13C can be successfully used for regional CH4 source attribution in urban, natural, and fossil fuel industrial settings (Eisma et al., 1994; Lowry et al., 2001; Fisher et al., 2011; Townsend-Small et al., 2012; Lopez et al., 2017; Maazallahi et al., 2020), and current instruments allow for relatively cheap and precise δ13C determinations in small atmospheric samples using gas-source mass spectrometers or cavity ring-down spectrometers. Conversely, Δ14C measurements have been successful in CO2 source attribution (Lopez et al., 2013; Zimnoch et al., 2012; Turnbull et al., 2015b; Miller et al., 2020) but less successful in CH4 source attribution (Eisma et al., 1994; Townsend-Small et al., 2012). Additionally, Δ14C measurements are rarely used as analyzing 14C requires larger samples than 13C analysis, a more demanding extraction of methane from air, and more expensive measurements using accelerator mass spectrometry. Furthermore, Δ14C regional source attribution can become complicated in places such as continental Europe where there is a large influence of nuclear power plants with poorly constrained 14CH4 emissions (Eisma et al., 1994). Improvements in the atmospheric methane collection and processing are currently being developed, which could increase the use of 14CH4 measurements in the near future (Zazzeri et al., 2021), and at the same time there have been improvements in constraining the influence of nuclear power in Δ14CH4 measurements (Graven et al., 2019).
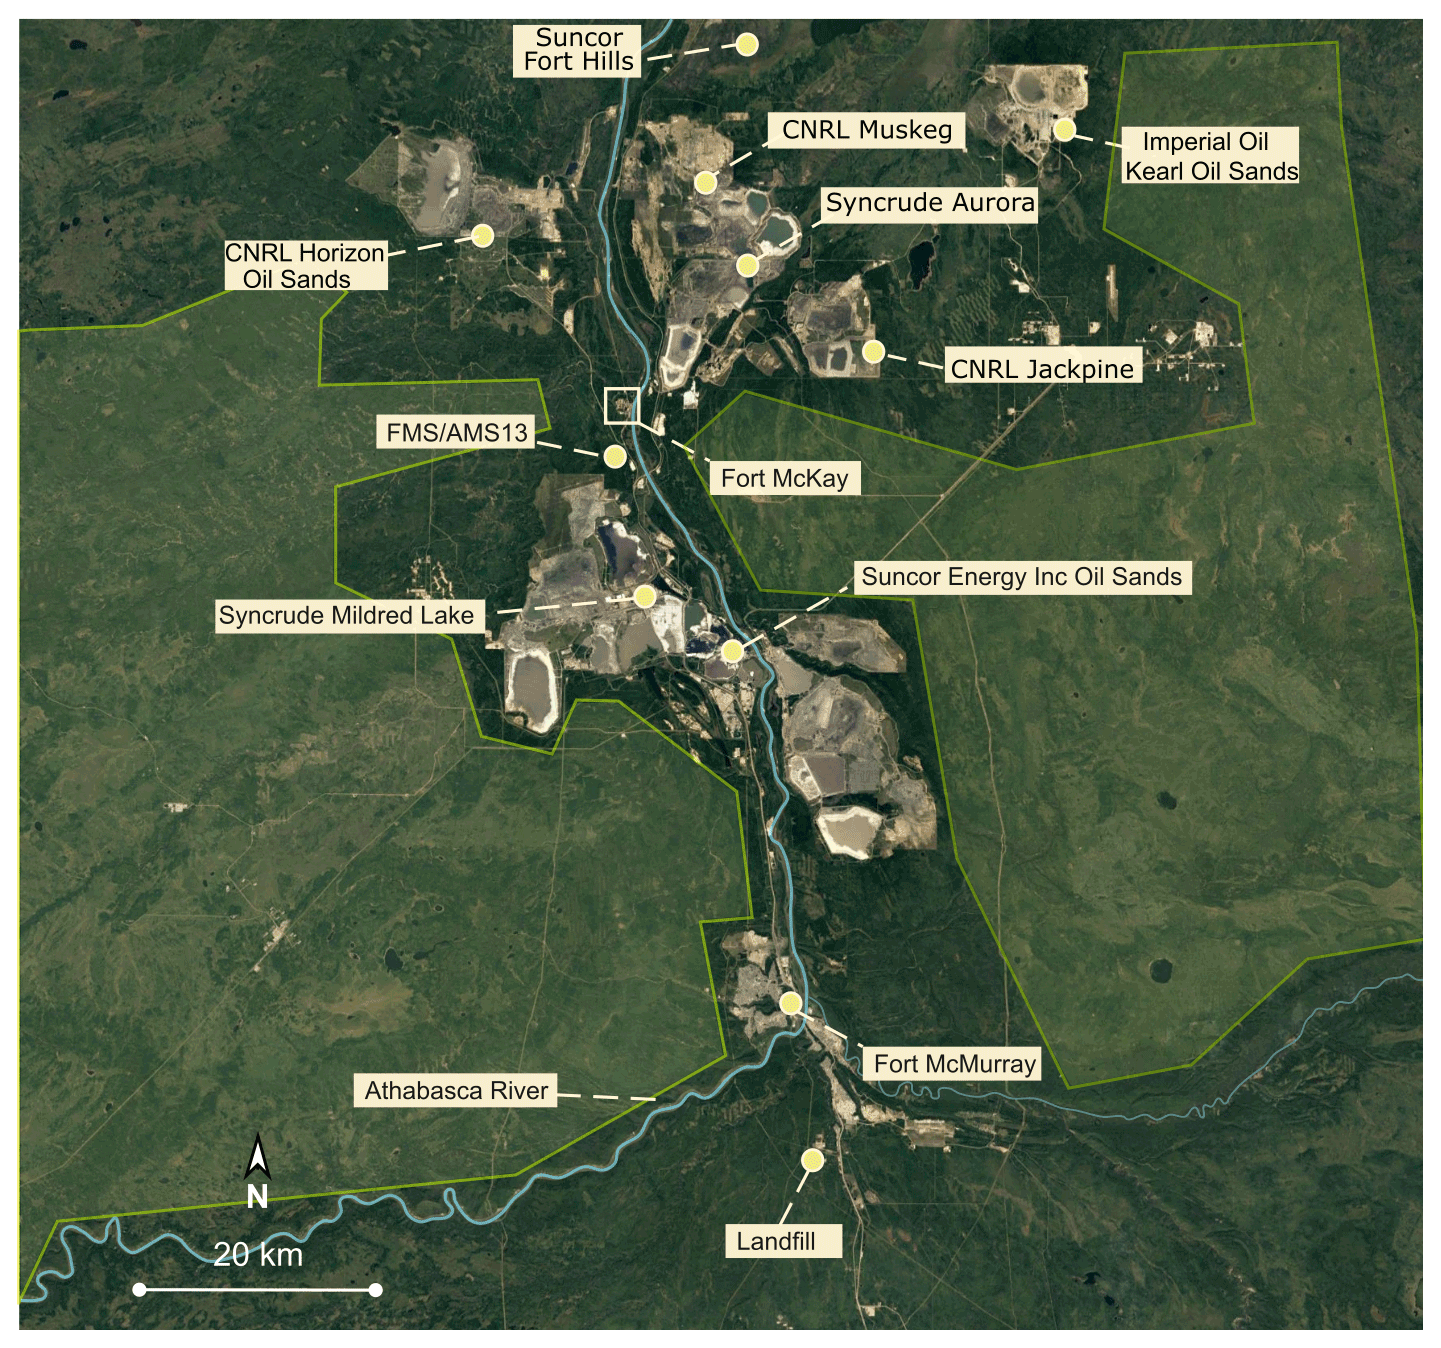
Figure 1Satellite view of the Athabasca oil sands region (satellite image: Google Landsat/Copernicus) showing the location of oil sands mining and processing facilities and the FMS/AMS13 site from which samples described in this paper were collected (57∘08′57.54′′ N, 111∘38′32.66′′ W). The light green polygons show the approximate area of the forest–wetland complexes in the region (based on data from Golder Associates Ltd., 2002).
In this study, our main goal is to test the use of combined Δ14C and δ13C measurements in ambient CH4 to estimate contributions from the largest CH4 sources in the AOSR region including wetlands, surface mines, and tailings ponds. We expect to provide a new and practical proof-of-concept method for the long-term monitoring of key CH4 emissions in regions with multiple CH4 sources like the AOSR, which is crucial to developing effective CH4 mitigation policies and, in the specific case study, to fulfil Canada's goal of reducing CH4 emissions from the oil and gas sector by 40 %–45 % below 2012 levels by 2025 (Government of Canada, 2016).
2.1 Sampling campaign
The sampling campaign took place between 16 and 23 August 2019 at the Environment Canada atmospheric monitoring site Fort McKay South (FMS), adjacent to the Wood Buffalo Environmental Association Air Monitoring Station 13 (AMS13). The monitoring station is located in the AOSR (57∘08′57.54′′ N, 111∘38′32.66′′ W), surrounded to the east and west by boreal forest and wetland complexes and to the north and south by oil sands mining and processing facilities (Fig. 1). Air pollution levels at the site depend on the wind direction, and the principal wind directions in Fort McKay are northerly and southerly (Bari and Kindzierski, 2015).
To the north, facilities include the Canadian Natural Resources Limited (CNRL) Horizon Processing Plant and Mine and Muskeg River and Jackpine mines, the Fort Hills Oil Sands Mine, Syncrude Aurora North Mine Site, and the Imperial Oil Kearl Processing Plant and Mine (Government of Canada, 2017). CH4 emissions from CNRL Horizon facilities, Muskeg River and Jackpine mines, and the Syncrude Aurora North Mine have been primarily attributed to open-pit mining (5200 ± 1200 kg h−1), but significant CH4 emissions originating from the CNRL Horizon main plant facility (1000 ± 300 kg h−1) have also been detected (Baray et al., 2018). To the south, the main facilities are Syncrude Canada Mildred Lake and Suncor Energy Inc. oil sands (Government of Canada, 2017). CH4 emissions from these two facilities have been mainly attributed to tailings ponds (8800 ± 1100 kg h−1) followed by open mining (4600 ± 600 kg h−1) (Baray et al., 2018).
We collected air samples in 70 L cylinder tanks by filling the tank for around 10 min to a pressure of 13.8 MPa using a Bauer PE-100 compressor with a magnesium perchlorate water trap. We aimed to sample CH4 peaks coming from different wind directions. Before the field campaign, the new Bauer PE-100 compressor was tested at the ECCC laboratories and compared to an existing oil-free RIX compressor system, used to fill reference gases (“laboratory standards”) for ECCC. The difference in methane dry air mole fraction in the cylinders when using the Bauer PE-100 and RIX compressor was found to be within 10 ppb when consecutively filling tanks using ambient air. During the sampling campaign, we flushed the cylinders two times by filling the tank with air until it reached 13.8 MPa and subsequently purging the air by opening the tank valve before collecting the air sample.
We performed continuous measurements of methane (CH4), carbon dioxide (CO2), and carbon monoxide (CO) dry air mole fractions for the whole sampling campaign using a Picarro G2401 gas analyzer, which has a 5 min average precision of 1.5 ppb for CO, 20 ppb for CO2, and 0.5 ppb for CH4. Results were reported as 1 h averages of the dry air mole fractions. The intake lines of all the instruments were attached at the rooftop of the air monitoring station, approximately 3 m above ground level (m a.g.l.).
2.2 CH4 isotopic analyses
Methane was extracted from the gas samples at the National Institute of Water and Atmospheric Research (NIWA) in Wellington, New Zealand, following the methods described in Lowe et al. (1991), with updates as described in the following. In summary, a mass flow controller set at 1 L min−1 was connected to the tanks. Air was drawn from the tanks using a 170 L min−1 rotary pump and pumped through two cryogenic traps to remove CO2, H2O, N2O, and other specific hydrocarbons. Each of these cryogenic traps is made of four 350 mm long loops passing in and out of liquid nitrogen. The loops are made of 12 mm ID Pyrex tubing and are kept at pressures lower than 10 kPa. After these first two traps, the sample passed through a third trap containing a Sofnocat reagent (containing platinum and palladium on a tin oxide support) which acts as a catalyst in the conversion of CO to CO2. This CO2 was subsequently removed using two additional cryogenic traps. Next, CH4 was combusted at 750 ∘C to CO2 and H2O using an alumina-supported platinum catalyst. The resulting CO2 was collected and purified in three additional cryogenic traps. Last, H2O was removed using alcohol dry ice traps at −80 ∘C, and CO2 was vacuum distilled into glass vials or break seals for mass spectrometry. Separate extractions were carried out for each 13C and 14C analysis, processing 26 L of air for 13C and 230–290 L for 14C (depending on CH4 content of the sample).
Analysis of 13C was performed on a Thermo MAT-253 isotope ratio mass spectrometer (IRMS) in dual inlet mode. Samples were analyzed against a pure CO2 working reference gas derived from a 13C-depleted barium carbonate standard (NZCH). The standard deviation for a δ13C determination is 0.02 ‰. The results were reported relative to PDB-CO2. For 14C analysis, the methane-derived CO2 was reduced to graphite using H2 and an iron catalyst at 550 ∘C (Turnbull et al., 2015a) and measured for 14C content by accelerator mass spectrometry (Zondervan et al., 2015). The results were reported as fraction modern carbon and Δ14C age corrected to the date of sample collection following internationally agreed upon conventions (Stuiver and Polach, 1977, Donahue et al., 1990, Reimer et al., 2004). The measurement precision for this dataset is 2.2 ‰ to 2.6 ‰ in Δ14C.
2.3 Back-trajectory modelling using HYSPLIT-5
We generated hourly 12 h backward trajectories for the duration of the sampling campaign using HYSPLIT-5. HYSPLIT is a model for computing atmospheric transport and dispersion of air masses developed by NOAA's Air Resources Laboratory, and a more complete description of the system can be found in Stein et al. (2015). In this model, a back-trajectory is calculated from a particle that represents a gas being moved by the mean wind field. To calculate the concentration of the trace gas (air concentrations), a number of particles are released from the receptor, and dispersion equations are applied to the upwind trajectory calculation. Then, the mass of the computed particles is added and divided by the volume of their horizontal and vertical distribution. We configured the model to start 3 from the location of the FMS site and to use meteorological parameters from the NAM 12 km (hybrid sigma pressure US 2010-Present) database.
2.4 Estimating source contributions using keeling plots
The Keeling plot approach is based on the conservation of mass in the lower planetary boundary layer (Keeling, 1958, 1961). It assumes that the atmospheric CH4 is the result of a simple mixing between two components, background CH4 and the sum of all CH4 sources, and that the isotope ratio of the two components does not change substantially over time, as in this study. As a result, the intercept of a linear regression between and δ13CH4 or Δ14CH4 from atmospheric samples is interpreted as the mean isotopic signature of the CH4 sources (Eqs. 1 and 2). Here, we calculated the slope and intercept of the linear regression and their uncertainties after York et al. (2004).
Because the source isotopic signature represents the weighted sum of all the CH4 sources, a mixing model can be used to determine the individual CH4 source contributions from the mean CH4 source isotopic signature if the individual source isotope signatures are known. We used MixSIAR, a Bayesian isotope mixing model framework implemented as an open-source R package (see Stock et al., 2018), to estimate the contribution of potential CH4 sources to the “mixture mean” (mean source signature in air samples). The base of the MixSIAR framework is a mixing model in which the tracer value of the mixture (e.g., δ13C) is the sum of the mean tracer value of each source component multiplied by its proportional contribution to the mixture (p) as in Eq. (3). The assumptions for this model are that all the sources are known, tracers are conserved through the mixing process, tracer values do not vary over time, the tracer values differ between sources, and the sum of the proportional contributions (p) is 1 (Stock et al. 2018).
To account for source uncertainty, MixSIAR incorporates error structures using the summary statistics of the source isotopic values (mean, variance, and sample size), and source parameters are fitted as in Ward et al. (2010). The mixing system can then be solved analytically for multiple tracers simultaneously if the number of sources does not exceed the number of tracers plus one. In this case, we used two tracers, δ13C and Δ14C, and three sources. The source isotopic values used in the mixing model were derived from the literature and are described in the following section.
3.1 Isotopic signature of CH4 sources in the AOSR
To estimate the proportion of CH4 emitted from different potential sources, the isotopic signatures of these potential sources must be known. However, specifying the δ13CH4 from these sources can be especially challenging because δ13CH4 signatures can have wide ranges and vary locally (Sherwood et al., 2017), and there are no studies isotopically characterizing CH4 from different sources in the AOSR. Based on the previous aircraft source attribution study (Baray et al., 2018), we identified two main CH4 source categories: CH4 emissions related to the mining and processing of bitumen (e.g., leaking and venting) and tailings pond CH4 emissions. Furthermore, we added wetlands as a third source of regional CH4 emissions as they are estimated to cover approximately 60 % of the Athabasca oil sands region (Rooney et al., 2012), and the wetland CH4 emissions in the province of Alberta have been estimated to be roughly half of the total anthropogenic emissions (Baray et al., 2021).
Table 1Estimated values of δ13CH4 and Δ14CH4 for the three source categories used in the source attribution.
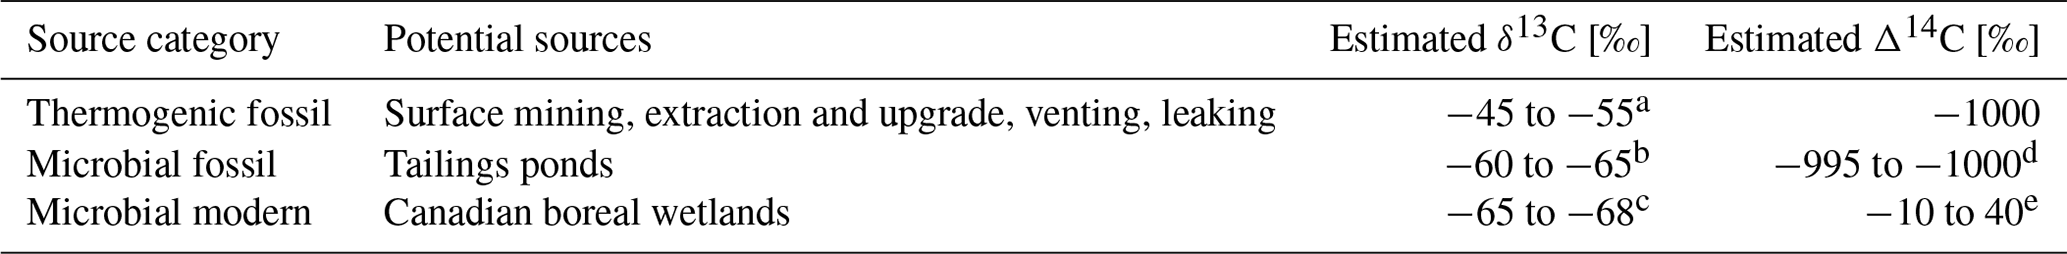
a δ13CH4 associated with heavily degraded oils from Head et al. (2003). b Hypolimnetic δ13CH4 values from Base Mine Lake from Goad (2017). c Canadian boreal wetland δ13CH4 from Ganesan et al. (2018). d Tailings pond substrate signature from Ahad and Pakdel (2013). e Range of atmospheric Δ14CO2 values from 2010 to 2019 extrapolated from Hammer and Levin (2017).
Thermogenic CH4 associated with Alberta's Lower Cretaceous oils varies between −42 ‰ and −48 ‰ (Jha, Gray and Strausz, 1979; Tilley and Muehlenbachs, 2007), but the prevalence of anaerobic biodegradation in shallow subsurface petroleum reservoirs changes the δ13CH4 composition of heavily degraded oils to between −45 ‰ and −55 ‰, in particular by hydrogenotrophic CH4 production (Head et al., 2003; Jones et al., 2008). This biogenically over-printed thermogenic CH4 is present in the mined material of the AOSR, which is potentially released when oil sands are mined, but also during transport, ore preparation, and extraction of bitumen (Johnson et al., 2016). Thus, we used this δ13C range to represent CH4 emissions derived from the bitumen mining and processing (Table 1).
Residual water generated from the surface mining process is stored in tailings ponds where aerobic and anaerobic degradation are mainly fuelled by certain naphtha components in the diluents, in specific short-chain n-alkanes (C6 to C10), BTEX compounds (i.e., toluene and xylenes), and long-chain n-alkanes (C14 to C18) (Siddique et al., 2006, 2007, 2011, 2012). Radiocarbon measurements of tailings pond components, including total organic carbon (TOC), total lipid extract (TLE), and phospholipid fatty acids (PLFAs), have yielded Δ14C signatures of approximately −995 ‰ (Ahad and Pakdel, 2013). We infer that CH4 is most likely produced from these substrates and therefore has the same Δ14C signature (Table 1). The chemical composition of the tailings ponds – determined by mineralogy of the oil sands, extraction techniques and additives used, and age of the ponds – influences the microbial communities involved in the substrate degradation (Small et al., 2015), which are likely dominated by syntrophic communities as well as both acetoclastic methanogens, previously associated with short n-alkane degradation, and hydrogenotrophic methanogens, associated with the metabolism of long-chain alkanes and BTEX (Penner and Fogth, 2010; Shahimin et al., 2016; Siddique et al., 2012; Zhou et al., 2012). Measurements of the dissolved δ13CH4 from the hypolimnion of Base Mine Lake, a dimictic end pit lake, range between −60 ‰ and −65 ‰ and to our knowledge are the only available δ13CH4 measurements associated with oil sands lakes (Goad, 2017). However, variations in the microbial community composition between ponds result in variations in the rate of CH4 production (Small et al., 2015) and might also result in differences in the δ13CH4 due to different fractionation in acetoclastic and hydrogenotrophic methanogenesis (Whiticar, 1999; Whiticar et al., 1986). Moreover, the Base Mine Lake δ13CH4 value should be regarded as a minimum, because methanotrophic communities are active in the surface of the tailings ponds, most likely shifting the δ13CH4 towards more positive values during partial oxidation of methane before emission to the atmosphere (Saidi-Mehrabad et al., 2013).
Boreal wetland CH4 emissions are estimated to have a mean δ13C value of −67.8 ‰, based on atmospheric measurements (Ganesan et al., 2018). In terms of Δ14C, wetland CH4 emissions are most likely predominantly modern and close to the atmospheric Δ14CO2 value, even in wetlands associated with permafrost collapse (Cooper et al., 2017; Estop-Aragonés et al., 2020). Because the residence time of carbon released as CH4 in wetlands is likely decadal (Whalen et al., 1989; Chanton et al., 1995), we used a Δ14C signature ranging from approximately 40 ‰, corresponding to the atmospheric Δ14CO2 value in the Northern Hemisphere in 2010 (Hammer and Levin, 2017), to approximately −10 ‰, which is the lower limit when using that same dataset to extrapolate for the atmospheric Δ14CO2 value in 2019 (Table 1).
Additional CH4 potential regional sources that were not included in this analysis to avoid having an underdetermined mixing model were forest fires and landfills, both of which would emit CH4 with a modern Δ14CO2 signature. Three major wildfire events occurred in 2019 in Alberta: the Battle complex (Peace River area), Chuckegg Creek wildfire (High Level area), and the McMillan complex (Slave Lake area). The three events started in May and were declared under control on 26 June, 1 July, and 18 August, respectively (MNP LLP 2020), with the third event briefly overlapping with some of the sampling dates (16 to 18 August). However, the event was 290 km southwest of the sampling site, while the air in the sampling site originated from the northwest (see Sect. 3.2), and therefore it is unlikely that this was a significant source of CH4 in the air samples. In the case of the landfill, some back trajectories show air masses coming from the general Fort McMurray direction, where the municipal landfill is (Fig. 1). We speculated that between these two sources, wetlands are the most prominent CH4 source because at a provincial level (Alberta), CH4 wetland emissions are estimated to be 2.5 to 3.5 × 10⁹ kg a−1 while solid waste disposal accounts for 5.2 × 10⁴ kg a−1 (Baray et al., 2021; Environment Climate Change Canada, 2018). If we were to add a landfill component, assuming a δ13C value of −55 ‰ for landfills (Lopez et al., 2017), the revised estimation would result in a slightly larger contribution of microbial fossil CH4 relative to thermogenic CH4. For example, if 10 % of the microbial modern emissions were derived from landfills and 90 % from wetlands, our model estimate of the contribution from tailings ponds increases by 2 % (see Sect. 3.3).

Figure 2(a) Hourly CH4 dry air mole fraction measurements at the FMS13 station (Fort McKay South), with the CH4 mole fraction of the collected air samples in red circles. (b) HYSPLIT 12 h back-trajectories associated with hourly measurements, with the colour scale representing CH4 dry air mole fractions in both panels.
3.2 Isotopic signature of ambient CH4
Analyses of the 12 h back trajectories for the 7 d sampling campaign showed that air masses arriving at the FMS station during this time period primarily originated from two general directions (Fig. 2b): from the northwest between 16 and 19 August and from the southwest and southeast between 20 and 23 August. The CH4 mole fraction time series for this time period indicated that most CH4 enrichments were associated with trajectories originating from the west and south, in particular from air masses that transit over the Syncrude Mildred Lake facilities and CNRL Horizon oil sands facilities (Fig. 2).
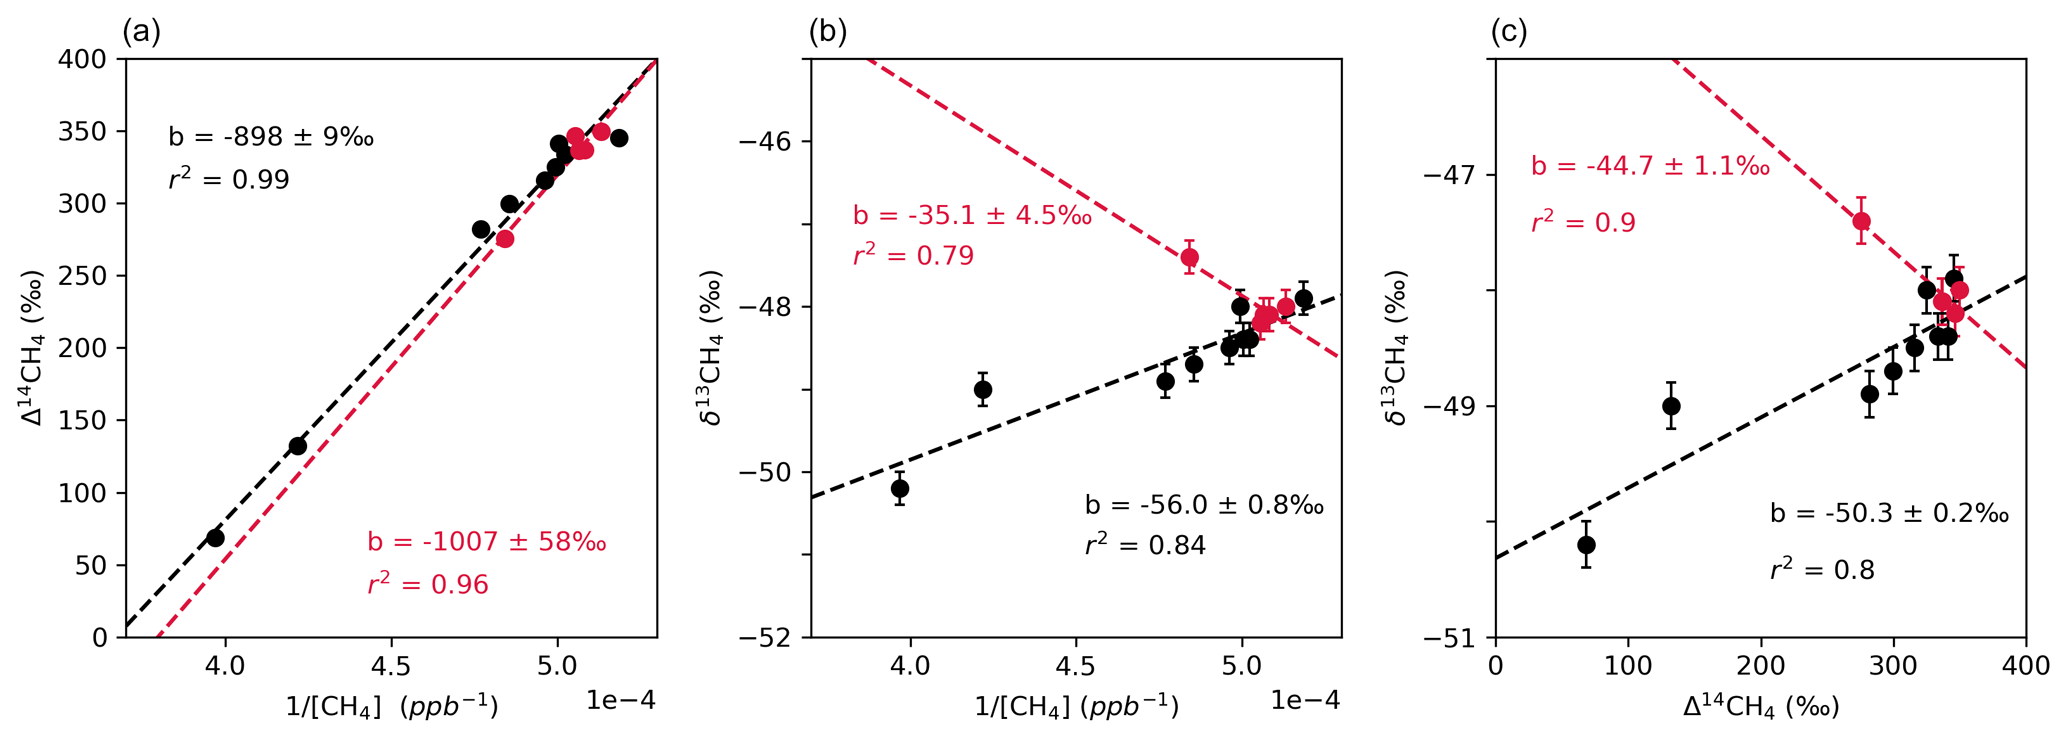
Figure 3Keeling plots of (a) CH4 and Δ14CH4, (b) CH4 and δ13CH4, and (c) plot of δ13CH4 and Δ14CH4 in air samples collected from 20 to 23 August (south) in black (n=9) and from 16 to 20 August (north) in red (n=5). In (a) and (b), the intercept of the Keeling plot b indicates the isotopic signature of the CH4 source. In panel (c), the intercept b is interpreted as the δ13C value of fossil CH4.
The CH4 mole fraction [CH4], δ13CH4, and Δ14CH4 of the air samples are shown in Table 2. There were significant correlations between and Δ14CH4 (r2 = 0.99; black lines in Fig. 3a), between and δ13CH4 (r2 = 0.84; black lines in Fig. 3b), and between Δ14CH4 and δ13CH4 (r2 = 0.8; black lines in Fig. 3c) in the air samples associated with back-trajectories originating from the south and southwest, corresponding to 20 to 23 August. The intercept of the Δ14C Keeling plot for these samples showed a source signature of −898 ± 9 ‰ (Fig. 3a), while the intercept of the δ13C Keeling plot yielded a source value of −56 ± 0.8 ‰ (Fig. 3b).
Table 2Methane mole fraction [CH4], δ13CH4, and Δ14CH4 of air samples collected in the Athabasca oil sands region in August 2019. Note that local time of sampling (mountain time, MDT) is 6 h behind UTC universal time.

There were also significant correlations between all variables in the samples associated with back-trajectories originating from the north, corresponding to 16 to 19 August (red lines in Fig. 3). However, there were only five data points, and four of them had very similar values, which could artificially strengthen the correlation. When building the Δ14C and a δ13CH4 Keeling plot with these five samples, the intercepts yielded source values of Δ14C ≈ −1000 ‰ and δ13C = −35.1 ± 4.5 ‰, which points to a thermogenic source of CH4 originating in the northern mines.
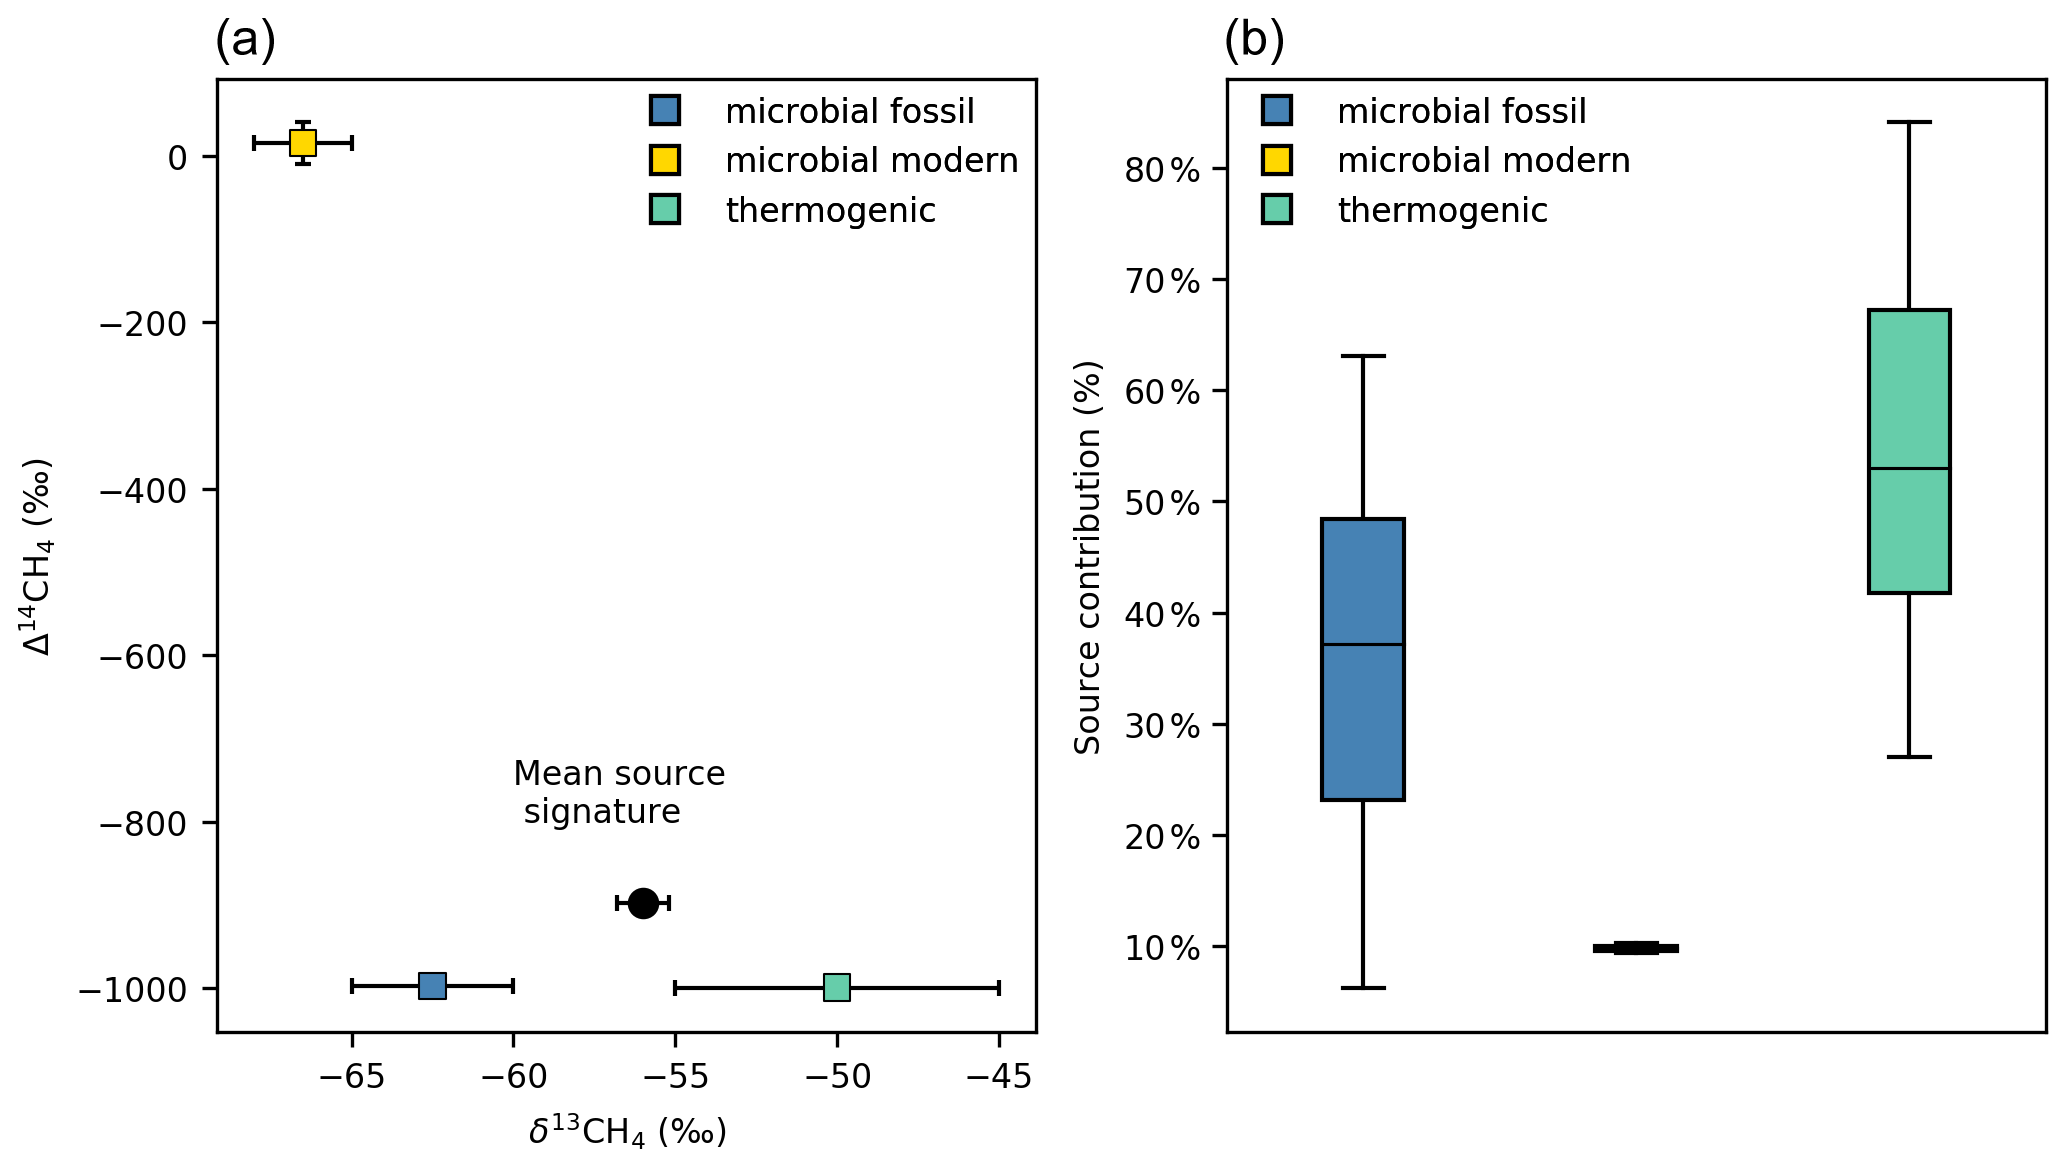
Figure 4(a) δ13C and Δ14C signatures of potential CH4 sources used to estimate source contribution using MixSIAR and mean δ13CH4 and Δ14CH4 source signatures of the samples associated with south trajectories derived from Keeling plots. (b) Boxplot of the estimated source contributions from microbial fossil CH4 (tailings ponds), thermogenic CH4 (surface mines and processing facilities), and microbial modern CH4 (wetlands) for these samples. The line inside the boxes represents the median, boxes indicate the 25th and 75th percentiles, and whiskers show the 5th and 95th percentiles.
3.3 Source contributions
The approximate contributions from each source category to samples associated with back-trajectories originating from the south were calculated with MixSIAR and are shown in Fig. 4. The microbial and thermogenic fossil enrichment observed in the CH4 air samples (∼ 90 %) indicates that most of the CH4 enrichment observed at the site was influenced by CH4 emissions from the oil sands mines and processing facilities. Specifically, the contribution from thermogenic CH4 was estimated to be 56 ± 18 % while the contribution from fossil microbial CH4 from tailings ponds was estimated to be 34 ± 18 %, with a large uncertainty associated with both estimates (Fig. 4b). The results also indicate an influence of approximately 10 ± < 1 % from modern microbial sources (Fig. 4b), most likely from wetlands. If most of the modern microbial enrichment is derived from wetlands, it is likely that the contribution from this source is near the annual maximum, as CH4 wetland emissions typically peak in the summer (Baray et al., 2021).
Analyses of the back-trajectories indicated that the air masses from which these sample were collected originated from the south, and therefore the samples are likely predominantly influenced by the Syncrude and Suncor facilities and tailings ponds (Fig. 1). This would explain the substantial enrichment of fossil microbial CH4 in our samples, as measurements of CH4 emissions have shown that the largest CH4-emitting tailings management areas are Syncrude's Mildred Lake settling basin and the Base Mine Lake (Small et al., 2015; You et al., 2021). In comparison to the oil sands facilities in the south (Syncrude Mildred Lake and Suncor), the facilities to the north of the air monitoring site have been shown to have much larger CH4 contributions from surface mining and natural gas leaking and venting (Baray et al., 2018), as tailings pond emissions are minimal (below 0.1 ) (Small et al., 2015). This was reflected in the few air samples originating from the north that show a δ13CH4 of −35 ‰ and a Δ14CH4 of −1000 ‰, which is consistent with the isotopic signature of thermogenic CH4 (Fig. 3b).
Compared to the only previous CH4 source attribution study available (Baray et al., 2018), our results implied a lower contribution from tailings ponds and a larger contribution from surface mines and processing facilities. Baray et al. (2018) estimated that 65 % of CH4 emissions from the Syncrude Mildred Lake and Suncor mines and facilities originated from tailings ponds and 34 % from surface mines, but there have not been studies updating these estimates since this study was performed in summer 2013. We suggest that differences between studies can be attributed to changes in bitumen production in the different sites from 2013 and from the large uncertainties in our estimates. The uncertainty in our estimates is mainly due to the uncertainty in the δ13CH4 signatures of CH4 sources. For example, a change of 5 ‰ towards more positive values in the tailings pond δ13CH4 signature due to microbial oxidation of CH4 in the epilimnion would increase the calculated contribution from tailings ponds to 52 ± 23 % and decrease the thermogenic contribution to 38 ± 23 %. This example illustrates the need to reduce the uncertainty in the source isotopic signatures with an extensive δ13C characterization of CH4 sources in the AOSR, in particular from tailings ponds and surface mines. Furthermore, the use of additional tracers such as methane ethane () ratios and δ2H in CH4 could help constrain emissions from source categories since biogenic and thermogenic processes yield distinctive ratios and δ2H in CH4 (Townsend-Small et al., 2016; Lopez et al., 2017; Douglas et al., 2021).
While an exhaustive δ13C characterization of CH4 sources is needed to improve source estimates using carbon isotopes, the clear correlations in our air samples show that this method is useful for estimating CH4 source contributions in regions with multiple CH4 sources like the AOSR. Moreover, the collection of air in cylinders is less costly and easier to do on a regular basis compared to techniques such as aircraft measurements and therefore is well suited for monitoring how source emissions change with time (seasonally and annually). The use of an instrument for continuous δ13CH4 measurement such as a Picarro G2201-I isotope analyzer could make this process even easier and more evenly distributed through the year.
We conducted a sampling campaign in the Athabasca oil sands region in summer 2019 with the objective of evaluating the potential of using combined Δ14C and δ13C measurements in ambient CH4 for source attribution. While tracers such as δ13C, δD, and can separate thermogenic from microbially produced CH4, the use of Δ14C indicates if CH4 is produced from a fossil source regardless of the pathway of CH4 formation. We demonstrated the use combined Δ14C and δ13C measurements for separating emissions from three sources: mines and processing facilities, tailings ponds, and regional wetlands. Our results confirm the importance of tailings ponds in regional CH4 emissions (Baray et al., 2018), which we estimated to be approximately 34 % of all the emissions in the region. Furthermore, the addition of Δ14C in the measurements allowed us to separate wetland CH4 emissions, which are a major provincial source of CH4 (Baray et al., 2021) and therefore have the potential to interfere in the accuracy of top-down CH4 estimates. In general, this method proved to be a suitable tool for CH4 source attribution in the AOSR and potentially other oil-producing regions as there are clear correlations between δ13C and Δ14C, isotopic measurements are cheap relative to other approaches such as aircraft measurements, and the instrumentation set-up allows for continuous year-round measurements.
Although this study is one of the first to provide a conclusive source attribution using combined Δ14C and δ13C measurements in ambient CH4, there are still large uncertainties associated with this method, mainly due to the lack of δ13C data from key CH4 sources. These uncertainties can be addressed with a characterization of δ13C and Δ14C in the main CH4 sources and using additional tracers such as methane-to-ethane ratios and δ2H signatures. Moreover, future work should focus on adding measurements at different times of the year and in consecutive years, as seasonal and annual variations in CH4 emissions are currently not well constrained. At a seasonal scale, temperature changes in the winter probably reduce microbial methanogenesis, decreasing tailings pond and wetland emissions, and snow cover in open mining areas could affect CH4 emissions. At an annual scale, changes in mine and processing facilities operations, the development of in situ mining over surface mining, and changes in the age-dependent tailings pond emission profile could also result in CH4 emission variations. Consequently, implementing isotopic measurements for long-term CH4 emission monitoring is essential to have a complete understanding of CH4 emissions in the AOSR and for developing effective mitigation policies.
The CH4 mole fraction data for the length of the sampling campaign is available at https://doi.org/10.6084/m9.figshare.17217542.v1 (Gonzalez Moguel et al., 2021).
PMJD, FV, and RGM designed the research study and collected the samples. HS and JCT analyzed the samples. RGM conducted the data analysis and modelling with contributions from SA. RGM prepared the manuscript with contributions from all the co-authors.
The contact author has declared that neither they nor their co-authors have any competing interests.
Publisher's note: Copernicus Publications remains neutral with regard to jurisdictional claims in published maps and institutional affiliations.
We thank Lauriant Giroux for the compressor testing and support in the field. We thank Tony Bromley, Sally Gray, Rowena Moss, and Ross Martin for sample processing and GC and IRMS analyses. We thank the Rafter Radiocarbon Lab team for 14C analyses and Ralf Staebler and Doug Worthy for the ECCC internal review of the manuscript.
This project was supported by the Trottier Institute for Science and Public Policy and by NIWA funding under the Climate and Atmosphere Research Programme CAAC2104 (2021/21 SCI).
This paper was edited by Eliza Harris and reviewed by Eric Saboya and one anonymous referee.
Ahad, J. M. E. and Pakdel, H.: Direct evaluation of in situ biodegradation in Athabasca oil sands tailings ponds using natural abundance radiocarbon, Environ. Sci. Technol., 47, 10214–10222, https://doi.org/10.1021/es402302z, 2013.
Alberta Energy Regulator: ST98-2015: Alberta's Energy Reserves 2014 and Supply/Demand, Alberta Energy Regulator, available at: https://static.aer.ca/prd/documents/sts/ST98/ST98-2015.pdf (last access: 19 January 2022), 2015.
Baray, S., Darlington, A., Gordon, M., Hayden, K. L., Leithead, A., Li, S.-M., Liu, P. S. K., Mittermeier, R. L., Moussa, S. G., O'Brien, J., Staebler, R., Wolde, M., Worthy, D., and McLaren, R.: Quantification of methane sources in the Athabasca Oil Sands Region of Alberta by aircraft mass balance, Atmos. Chem. Phys., 18, 7361–7378, https://doi.org/10.5194/acp-18-7361-2018, 2018.
Baray, S., Jacob, D. J., Maasakkers, J. D., Sheng, J.-X., Sulprizio, M. P., Jones, D. B. A., Bloom, A. A., and McLaren, R.: Estimating 2010–2015 anthropogenic and natural methane emissions in Canada using ECCC surface and GOSAT satellite observations, Atmos. Chem. Phys., 21, 18101–18121, https://doi.org/10.5194/acp-21-18101-2021, 2021.
Bari, M. and Kindzierski, W. B.: Fifteen-year trends in criteria air pollutants in oil sands communities of Alberta, Canada, Environ. Int., 74, 200–208, https://doi.org/10.1016/J.ENVINT.2014.10.009, 2015.
Bergerson, J. A., Kofoworola, O., Charpentier, A. D., Sleep, S., and MacLean, H. L.: Life Cycle Greenhouse Gas Emissions of Current Oil Sands Technologies: Surface Mining and In Situ Applications, Environ. Sci. Technol., 46, 7865–7874, https://doi.org/10.1021/ES300718H, 2012.
Chanton, J. P., Bauer, J. E., Glaser, P. A., Siegel, D. I., Kelley, C. A., Tyler, S. C., Romanowicz, E. H., and Lazrus, A.: Radiocarbon evidence for the substrates supporting methane formation within northern Minnesota peatlands, Geochim. Cosmochim. Ac., 59, 3663–3668, 1995.
Cooper, M. D. A., Estop-Aragonés, C., Fisher, J. P., Thierry, A., Garnett, M. H., Charman, D. J., Murton, J. B., Phoenix, G. K., Treharne, R., Kokelj, S. V., Wolfe, S. A., Lewkowicz, A. G., Williams, M., and Hartley, I. P.: Limited contribution of permafrost carbon to methane release from thawing peatlands, Nat. Clim. Change, 7, 507–511, https://doi.org/10.1038/nclimate3328, 2017.
Donahue, D. J., Linick, T. W., and Jull, A. J. T.: Isotope-Ratio and Background Corrections for Accelerator Mass Spectrometry Radiocarbon Measurements, Radiocarbon, 32, 135–142, https://doi.org/10.1017/S0033822200040121, 1990.
Douglas, P. M. J., Stratigopoulos, E., Park, S., and Phan, D.: Geographic variability in freshwater methane hydrogen isotope ratios and its implications for global isotopic source signatures, Biogeosciences, 18, 3505–3527, https://doi.org/10.5194/bg-18-3505-2021, 2021.
Eisma, R., van der Borg, K., de Jong, A. F. M., Kieskamp, W. M., and Veltkamp, A. C.: Measurements of the 14C content of atmospheric methane in The Netherlands to determine the regional emissions of 14CH4, Nucl. Instrum. Meth. B, 92, 410–412, https://doi.org/10.1016/0168-583X(94)96044-5, 1994.
Estop-Aragonés, C., Olefeldt, D., Abbott, B. W., Chanton, J. P., Czimczik, C. I., Dean, J. F., Egan, J. E., Gandois, L., Garnett, M. H., Hartley, I. P., Hoyt, A., Lupascu, M., Natali, S. M., O'Donnell, J. A., Raymond, P. A., Tanentzap, A. J., Tank, S. E., Schuur, E. A. G., Turetsky, M., and Anthony, K. W.: Assessing the Potential for Mobilization of Old Soil Carbon After Permafrost Thaw: A Synthesis of 14C Measurements From the Northern Permafrost Region, Global Biogeochem. Cy., 34, 1–26, https://doi.org/10.1029/2020GB006672, 2020.
Etminan, M., Myhre, G., Highwood, E. J., and Shine, K. P.: Radiative forcing of carbon dioxide, methane, and nitrous oxide: A significant revision of the methane radiative forcing, Geophys. Res. Lett., 43, 12614–12623, https://doi.org/10.1002/2016GL071930, 2016.
Fisher, R. E., Sriskantharajah, S., Lowry, D., Lanoisellé, M., Fowler, C. M. R., James, R. H., Hermansen, O., Myhre, C. L., Stohl, A., Greinert, J., Nisbet-Jones, P. B. R., Mienert, J., and Nisbet, E. G.: Arctic methane sources: Isotopic evidence for atmospheric inputs, Geophys. Res. Lett., 38, L2180, https://doi.org/10.1029/2011GL049319, 2011.
Ganesan, A. L., Stell, A. C., Gedney, N., Comyn-Platt, E., Hayman, G., Rigby, M., Poulter, B., and Hornibrook, E. R. C.: Spatially Resolved Isotopic Source Signatures of Wetland Methane Emissions, Geophys. Res. Lett., 45, 3737–3745, https://doi.org/10.1002/2018GL077536, 2018.
Goad, C.: Methane biogeochemical cycling over seasonal and annual scales in an oil sands tailings end pit lake, MS thesis, McMaster University, McSphere Institutional Repository, available at: http://hdl.handle.net/11375/21956 (last access: January 2022), 2017.
Golder Associates Ltd.: Terrestrial vegetation and wetlands resources environmental setting report for the Suncor voyageur south project, 50–55, Sect. 3.1, Golder associates Ltd., available at: https://open.alberta.ca/dataset/ea88e773-42b6-4d92-ba28-40aa636996c7/resource/e11c9cdb-293a-4776-af7d-3d609db70aba/download/vegetation.pdf (last access: 19 January 2022), 2002.
Gonzalez Moguel, R., Douglas, P., Vogel, F., Ars, S., Schaefer, H., and Turnbull, J.: Fort McKay South CH4 and CO2 mole fractions August 2019, figshare [data set], https://doi.org/10.6084/m9.figshare.17217542.v1, 2021.
Government of Canada: Pan-Canadian Framework on clean Growth and Climate Change, Government of Canada, available at: http://publications.gc.ca/collections/collection_2017/eccc/En4-294-2016-eng.pdf (last access: 19 January 2022), 2016.
Government of Canada: National pollutant Release Inventory's (NPIR) Sector Overview Series, Government of Canada, available at: https://maps.canada.ca/journal/content-en.html?lang= en&appid=703d9327d99d445eb4c1e94a47c1933e&appidalt=6d f630d9067240059ccc7cb33a68e188 (last access: May 2021), 2017.
Government of Canada: National Inventory Report 1990–2015: Greenhouse Gas Sources and Sinks in Canada, Canada's Submission to the United Nations Framework Convention on Climate Change, Part 1. Environment and Climate Change Canada, available at: http://publications.gc.ca/collections/collection_2020/eccc/En81-4-2018-1-eng.pdf (last access: 19 January 2022), 2018.
Graven, H., Hocking, T., and Zazzeri, G.: Detection of fossil and biogenic methane at regional scales using atmospheric radiocarbon, Earths Future, 7, 283–299 https://doi.org/10.1029/2018EF001064, 2019.
Hammer, S. and Levin, I.: Monthly mean atmospheric D14CO2 at Jungfraujoch and Schauinsland from 1986 to 2016, V2, heiDATA [data set], https://doi.org/10.11588/data/10100, 2017.
Head, I., Jones, D., and Larter, S.: Biological activity in the deep subsurface and the origin of heavy oil, Nature, 426, 344–352, https://doi.org/10.1038/nature02134, 2003.
Holly, C., Mader, M., Soni S., and Toor, J.: Alberta Energy: Oil sands production profile 2004-2014, Government of Alberta, available at: https://open.alberta.ca/dataset/cd892173-c37f-4c68-bf5d-f79ef7d49e72/resource/ebd6b451-dfda-4218-b855-1416d94306fd/download/initiativeospp.pdf (last access: January 2022), 2016.
Jackson, R. B., Saunois, M., Bousquet, P., Canadell, J. G., Poulter, B., Stavert, A. R., Bergamaschi, P., Niwa, Y., Segers, A., and Tsuruta, A.: Increasing anthropogenic methane emissions arise equally from agricultural and fossil fuel sources, Environ. Res. Lett., 15, 071002, https://doi.org/10.1088/1748-9326/ab9ed2, 2020.
Jha, K. N., Gray, J., and Strausz, O. P.: The isotopic composition of carbon in the Alberta oil sand, Geochim. Cosmochim. Ac., 43, 1571–1573, https://doi.org/10.1016/0016-7037(79)90150-9, 1979.
Johnson, M. R., Crosland, B. M., McEwen, J. D., Hager, D. B., Armitage, J. R., Karimi-Golpayegani, M., and Picard, D. J.: Estimating fugitive methane emissions from oil sands mining using extractive core samples, Atmos. Environ., 144, 111–123, https://doi.org/10.1016/J.ATMOSENV.2016.08.073, 2016.
Jones, D. M., Head, I. M., Gray, N. D., Adams, J. J., Rowan, A. K., Aitken, C. M., Bennett, B., Huang, H., Brown, A., Bowler, B. F. J., Oldenburg, T., Erdmann, M., and Larter, S. R.: Crude-oil biodegradation via methanogenesis in subsurface petroleum reservoirs, Nature, 451, 176–180, https://doi.org/10.1038/nature06484, 2008.
Keeling, C. D.: The concentration and isotopic abundances of atmospheric carbon dioxide in rural areas, Geochim. Cosmochim. Ac., 13, 322–334, https://doi.org/10.1016/0016-7037(58)90033-4, 1958.
Keeling, C. D.: The concentration and isotopic abundance of carbon dioxide in rural and marine air, Geochim. Cosmochim. Acta, 24, 277–298, 1961.
Larter, S. R. and Head, I. M.: Oil sands and heavy oil: Origin and exploitation, Elements, 10, 277–283, https://doi.org/10.2113/gselements.10.4.277, 2014.
Lassey, K. R., Lowe, D. C., and Smith, A. M.: The atmospheric cycling of radiomethane and the “fossil fraction” of the methane source, Atmos. Chem. Phys., 7, 2141–2149, https://doi.org/10.5194/acp-7-2141-2007, 2007.
Liggio, J., Li, S.-M., Staebler, R. M., Hayden, K., Darlington, A., Mittermeier, R. L., O'Brien, J., McLaren, R., Wolde, M., Worthy, D., and Vogel, F.: Measured Canadian oil sands CO2 emissions are higher than estimates made using internationally recommended methods, Nat. Commun., 101, 1–9, https://doi.org/10.1038/s41467-019-09714-9, 2019.
Lopez, M., Schmidt, M., Delmotte, M., Colomb, A., Gros, V., Janssen, C., Lehman, S. J., Mondelain, D., Perrussel, O., Ramonet, M., Xueref-Remy, I., and Bousquet, P.: CO, NOx and 13CO2 as tracers for fossil fuel CO2: results from a pilot study in Paris during winter 2010, Atmos. Chem. Phys., 13, 7343–7358, https://doi.org/10.5194/acp-13-7343-2013, 2013.
Lopez, M., Sherwood, O. A., Dlugokencky, E. J., Kessler, R., Giroux, L., and Worthy, D. E. J.: Isotopic signatures of anthropogenic CH4 sources in Alberta, Canada, Atmos. Environ., 164, 280–288, https://doi.org/10.1016/j.atmosenv.2017.06.021, 2017.
Lowe, D. C., Brenninkmeijer, C. A. M., Tyler, S. C., and Dlugkencky, E. J.: Determination of the isotopic composition of atmospheric methane and its application in the Antarctic, J. Geophys. Res.-Atmos., 96, 15455–15467, https://doi.org/10.1029/91JD01119, 1991.
Lowry, D., Holmes, C. W., Rata, N. D., O'Brien, P., and Nisbet, E. G.: London methane emissions: Use of diurnal changes in concentration and δ13C to identify urban sources and verify inventories, J. Geophys. Res.-Atmos., 106, 7427–7448, https://doi.org/10.1029/2000JD900601, 2001.
Maazallahi, H., Fernandez, J. M., Menoud, M., Zavala-Araiza, D., Weller, Z. D., Schwietzke, S., von Fischer, J. C., Denier van der Gon, H., and Röckmann, T.: Methane mapping, emission quantification, and attribution in two European cities: Utrecht (NL) and Hamburg (DE), Atmos. Chem. Phys., 20, 14717–14740, https://doi.org/10.5194/acp-20-14717-2020, 2020.
Miller, J. B., Lehman, S. J., Verhulst, K. R., Miller, C. E., Duren, R. M., Yadav, V., Newman, S., and Sloop, C. D.: Large and seasonally varying biospheric CO2 fluxes in the Los Angeles megacity revealed by atmospheric radiocarbon, P. Natl. Acad. Sci. USA, 117, 26681–26687, https://doi.org/10.1073/pnas.2005253117, 2020.
Myhre, G., Shindell, D., Bréon, F.-M., Collins, W., Fuglestvedt, J., Huang, J., Koch, D., Lamarque, J.-F., Lee, D., Mendoza, B., Nakajima, T., Robock, A., Stephens, G., Takemura, T., and Zhang, H.: 2013: Anthropogenic and Natural Radiative Forcing, in: Climate Change 2013: The Physical Science Basis. Contribution of Working Group I to the Fifth Assessment Report of the Intergovernmental Panel on Climate Change, vol. 9781107057, edited by: Stocker, T. F., Qin, D., Plattner, Q.-K., Tignor, M. M. B., Allen, S. K., Boschung, J., Nauels, A., Xia, Y., Bex, V., and Midgley, P. M., Cambridge University Press, 659–740, https://doi.org/10.1017/CBO9781107415324.018, 2013.
MNP LLP: Spring 2019 Wildfire review, Government of Alberta, available at: https://wildfire.alberta.ca/resources/reviews/documents/af-spring-2019-wildfire-review-final-report.pdf (last access: 19 January 2022), 2020.
Mossop, G. D.: Geology of the Athabasca Oil Sands, Science, 207, 145–152, https://doi.org/10.1126/SCIENCE.207.4427.145, 1980.
Ocko, I. B., Sun, T., Shindell, D., Oppenheimer, M., Hristov, A. N., Pacala, S. W., Mauzerall, D. L., Xu, Y., and Hamburg, S. P.: Acting rapidly to deploy readily available methane mitigation measures by sector can immediately slow global warming, Environ. Res. Lett., 16, 054042, https://doi.org/10.1088/1748-9326/ABF9C8, 2021.
Penner, T. J. and Foght, J. M.: Mature fine tailings from oil sands processing harbour diverse methanogenic communities, Can. J. Microbiol., 56, 459–470, https://doi.org/10.1139/W10-029, 2010.
Reimer, P. J., Brown, T. A., and Reimer, R. W.: Discussion: Reporting and Calibration of Post-Bomb 14C Data, Radiocarbon, 46, 1299–1304, https://doi.org/10.1017/S0033822200033154, 2004.
Rooney, R. C., Bayley, S. E., and Schindler, D. W.: Oil sands mining and reclamation cause massive loss of peatland and stored carbon, P. Natl. Acad. Sci. USA, 109, 4933–4937, 2012.
Rubino, M., Etheridge, D. M., Thornton, D. P., Howden, R., Allison, C. E., Francey, R. J., Langenfelds, R. L., Steele, L. P., Trudinger, C. M., Spencer, D. A., Curran, M. A. J., van Ommen, T. D., and Smith, A. M.: Revised records of atmospheric trace gases CO2 , CH4, N2O, and δ13C-CO2 over the last 2000 years from Law Dome, Antarctica, Earth Syst. Sci. Data, 11, 473–492, https://doi.org/10.5194/essd-11-473-2019, 2019.
Saidi-Mehrabad, A., He, Z., Tamas, I., Sharp, C. E., Brady, A. L., Rochman, F. F., Bodrossy, L., Abell, G. C., Penner, T., Dong, X., Sensen, C. W., and Dunfield, P. F.: Methanotrophic bacteria in oilsands tailings ponds of northern Alberta, ISME J., 75, 908–921, https://doi.org/10.1038/ismej.2012.163, 2013.
Saunois, M., Stavert, A. R., Poulter, B., Bousquet, P., Canadell, J. G., Jackson, R. B., Raymond, P. A., Dlugokencky, E. J., Houweling, S., Patra, P. K., Ciais, P., Arora, V. K., Bastviken, D., Bergamaschi, P., Blake, D. R., Brailsford, G., Bruhwiler, L., Carlson, K. M., Carrol, M., Castaldi, S., Chandra, N., Crevoisier, C., Crill, P. M., Covey, K., Curry, C. L., Etiope, G., Frankenberg, C., Gedney, N., Hegglin, M. I., Höglund-Isaksson, L., Hugelius, G., Ishizawa, M., Ito, A., Janssens-Maenhout, G., Jensen, K. M., Joos, F., Kleinen, T., Krummel, P. B., Langenfelds, R. L., Laruelle, G. G., Liu, L., Machida, T., Maksyutov, S., McDonald, K. C., McNorton, J., Miller, P. A., Melton, J. R., Morino, I., Mëller, J., Murguia-Flores, F., Naik, V., Niwa, Y., Noce, S., O'Doherty, S., Parker, R. J., Peng, C., Peng, S., Peters, G. P., Prigent, C., Prinn, R., Ramonet, M., Regnier, P., Riley, W. J., Rosentreter, J. A., Segers, A., Simpson, I. J., Shi, H., Smith, S. J., Steele, L. P., Thornton, B. F., Tian, H., Tohjima, Y., Tubiello, F. N., Tsuruta, A., Viovy, N., Voulgarakis, A., Weber, T. S., van Weele, M., van der Werf, G. R., Weiss, R. F., Worthy, D., Wunch, D., Yin, Y., Yoshida, Y., Zhang, W., Zhang, Z., Zhao, Y., Zheng, B., Zhu, Q., Zhu, Q., and Zhuang, Q.: The Global Methane Budget 2000–2017, Earth Syst. Sci. Data, 12, 1561–1623, https://doi.org/10.5194/essd-12-1561-2020, 2020.
Shahimin, M. F. M., Foght, J. M., and Siddique, T.: Preferential methanogenic biodegradation of short-chain n-alkanes by microbial communities from two different oil sands tailings ponds, Sci. Total Environ., 553, 250–257, https://doi.org/10.1016/j.scitotenv.2016.02.061, 2016.
Sherwood, O. A., Schwietzke, S., Arling, V. A., and Etiope, G.: Global Inventory of Gas Geochemistry Data from Fossil Fuel, Microbial and Burning Sources, version 2017, Earth Syst. Sci. Data, 9, 639–656, https://doi.org/10.5194/essd-9-639-2017, 2017.
Siddique, T., Fedorak, P. M., and Foght, J. M.: Biodegradation of short-chain n-alkanes in oil sands tailings under methanogenic conditions, Environ. Sci. Technol., 40, 5459–5464, https://doi.org/10.1021/es060993m, 2006.
Siddique, T., Fedorak, P. M., Mackinnon, M. D., and Foght, J. M.: Metabolism of BTEX and naphtha compounds to methane in oil sands tailings, Environ. Sci. Technol., 41, 2350–2356, https://doi.org/10.1021/es062852q, 2007.
Siddique, T., Penner, T., Semple, K., and Foght, J. M.: Anaerobic Biodegradation of Longer-Chain n-Alkanes Coupled to Methane Production in Oil Sands Tailings, Environ. Sci. Technol., 45, 5892–5899, https://doi.org/10.1021/ES200649T, 2011.
Siddique, T., Penner, T., Klassen, J., Nesbø, C., and Foght, J. M.: Microbial communities involved in methane production from hydrocarbons in oil sands tailings, Environ. Sci. Technol., 46, 9802–9810, https://doi.org/10.1021/es302202c, 2012
Small, C. C., Cho, S., Hashisho, Z., and Ulrich, A. C.: Emissions from oil sands tailings ponds: Review of tailings pond parameters and emission estimates, J. Petrol. Sci. Eng., 127, 490–501, https://doi.org/10.1016/j.petrol.2014.11.020, 2015.
Stein, A. F., Draxler, R. R., Rolph, G. D., Stunder, B. J. B., Cohen, M. D., and Ngan, F.: NOAA's HYSPLIT Atmospheric Transport and Dispersion Modeling System, B. Am. Meteorol. Soc., 96, 2059–2077, https://doi.org/10.1175/BAMS-D-14-00110.1, 2015.
Stock, B. C., Jackson, A. L., Ward, E. J., Parnell, A. C., Phillips, D. L., and Semmens, B. X.: Analyzing mixing systems using a new generation of Bayesian tracer mixing models, PeerJ, 6, e5096, https://doi.org/10.7717/PEERJ.5096, 2018.
Stuiver, M. and Polach, H. A.: Discussion Reporting of 14C Data, Radiocarbon, 19, 355–363, https://doi.org/10.1017/S0033822200003672, 1977.
Takamura, K.: Microscopic structure of athabasca oil sand, Can. J. Chem. Eng., 60, 538–545, https://doi.org/10.1002/CJCE.5450600416, 1982.
Tilley, B. and Muehlenbachs, K.: Isotopically Determined Mannville Group Gas Families, in: CSPG/CSEG Convention 2007, 14–17 May 2007, Calgary, Alberta, Canada, 2007.
Townsend-Small, A., Tyler, S. C., Pataki, D. E., Xu, X., and Christensen, L. E.: Isotopic measurements of atmospheric methane in Los Angeles, California, USA: Influence of “fugitive” fossil fuel emissions, J. Geophys. Res.-Atmos., 117, 1–11, https://doi.org/10.1029/2011JD016826, 2012.
Townsend-Small, A., Botner, E. C., Jimenez, K. L., Schroeder, J. R., Blake, N. J., Meinardi, S., Blake, D. R., Sive, B. C., Bon, D., Crawford, J. H., Pfister, G., and Flocke, F. M.: Using stable isotopes of hydrogen to quantify biogenic and thermogenic atmospheric methane sources: A case study from the Colorado Front Range, Geophys. Res. Lett., 43, 11462–11471, https://doi.org/10.1002/2016GL071438, 2016.
Turnbull, J. C., Zondervan, A., Kaiser, J., Norris, M., Dahl, J., Baisden, T., and Lehman, S.: High-Precision Atmospheric 14CO2 Measurement at the Rafter Radiocarbon Laboratory, Radiocarbon, 57, 377–388, https://doi.org/10.2458/AZU_RC.57.18390, 2015a.
Turnbull, J. C., Sweeney, C., Karion, A., Newberger, T., Lehman, S. J., Tans, P. P., Davis, K. J., Lauvaux, T., Miles, N. L., Richardson, S. J., Cambaliza, M. O., Shepson, P. B., Gurney, K., Patarasuk, R., and Razlivanov, I.: Toward quantification and source sector identification of fossil fuel CO2 emissions from an urban area: Results from the INFLUX experiment, J. Geophys. Res.-Atmos., 120, 292–312, https://doi.org/10.1002/2014JD022555, 2015b.
Turner, A. J., Frankenberg, C., and Kort, E. A.: Interpreting contemporary trends in atmospheric methane, P. Natl. Acad. Sci. USA, 116, 2805–2813, https://doi.org/10.1073/PNAS.1814297116, 2019.
Ward, E. J., Semmens, B. X., and Schindler, D. E.: Including Source Uncertainty and Prior Information in the Analysis of Stable Isotope Mixing Models, Environ. Sci. Technol., 44, 4645–4650, https://doi.org/10.1021/ES100053V, 2010.
Whalen, M., Tanaka, N., Henry, R., Deck, B., Zeglen, J., Vogel, J. S., Southon, A., Shemesh, A., Fairbanks, R., and Broecker, W.: Carbon-14 in Methane Sources in Atmospheric Methane: The contribution from fossil carbon, Science, 245, 286–290, https://doi.org/10.1126/science.245.4915.286, 1989.
Whiticar, M. J.: Carbon and hydrogen isotope systematics of bacterial formation and oxidation of methane, Chem. Geol., 161, 291–314, https://doi.org/10.1016/S0009-2541(99)00092-3, 1999.
Whiticar, M. J., Faber, E., and Schoell, M.: Biogenic methane formation in marine and freshwater environments: CO2 reduction vs. acetate fermentation—Isotope evidence, Geochim. Cosmochim. Acta, 50, 693–709, https://doi.org/10.1016/0016-7037(86)90346-7, 1986.
You, Y., Staebler, R. M., Moussa, S. G., Beck, J., and Mittermeier, R. L.: Methane emissions from an oil sands tailings pond: a quantitative comparison of fluxes derived by different methods, Atmos. Meas. Tech., 14, 1879–1892, https://doi.org/10.5194/amt-14-1879-2021, 2021.
York, D., Evensen, N. M., Lopez Martinez, M., and De Basabe Delgado, J.: Unified equations for the slope, intercept, and standard errors of the best straight line, Am. J. Phys., 72, 367–375, 2004.
Zazzeri, G., Xu, X., and Graven, H.: Efficient Sampling of Atmospheric Methane for Radiocarbon Analysis and Quantification of Fossil Methane, Environ. Sci. Technol., 55, 8541, https://doi.org/10.1021/ACS.EST.0C03300, 2021.
Zhou, L., Li, K. P., Mbadinga, S. M., Yang, S. Z., Gu, J. D., and Mu, B. Z.: Analyses of n-alkanes degrading community dynamics of a high-temperature methanogenic consortium enriched from production water of a petroleum reservoir by a combination of molecular techniques, Ecotoxicology, 21, 1680–1691, https://doi.org/10.1007/s10646-012-0949-5, 2012.
Zimnoch, M., Jelen, D., Galkowski, M., Kuc, T., Necki, J., Chmura, L., Gorczyca, Z., Jasek, A., and Rozanski, K.: Partitioning of atmospheric carbon dioxide over Central Europe: insights from combined measurements of CO2 mixing ratios and their carbon isotope composition, Isot. Environ. Healt. S., 48, 421–433, https://doi.org/10.1080/10256016.2012.663368, 2012.
Zondervan, A., Hauser, T. M., Kaiser, J., Kitchen, R. L., Turnbull, J. C., and West, J. G.: XCAMS: The compact 14C accelerator mass spectrometer extended for 10Be and 26Al at GNS Science, New Zealand, Nucl. Instrum. Meth. B, 361, 25–33, https://doi.org/10.1016/J.NIMB.2015.03.013, 2015.