the Creative Commons Attribution 4.0 License.
the Creative Commons Attribution 4.0 License.
 | 14 Feb 2022
Bimodal distribution of size-resolved particle effective density: results from a short campaign in a rural environment over the North China Plain
Yaqing Zhou
Nan Ma
Qiaoqiao Wang
Zhibin Wang
Chunrong Chen
Jiangchuan Tao
Juan Hong
Long Peng
Yao He
Linhong Xie
Shaowen Zhu
Yuxuan Zhang
Guo Li
Wanyun Xu
Peng Cheng
Uwe Kuhn
Guangsheng Zhou
Pingqing Fu
Qiang Zhang
Yafang Cheng
Effective density is one of the most important physical properties of atmospheric particles. It is closely linked to particle chemical composition and morphology and could provide special information on particle emissions and aging processes. In this study, size-resolved particle effective density was measured with a combined differential mobility analyzer–centrifugal particle mass analyzer–condensation particle counter (DMA–CPMA–CPC) system in autumn 2019 as part of the Multiphase chemistry experiment in Fogs and Aerosols in the North China Plain (McFAN). With a newly developed flexible Gaussian fit algorithm, frequent (77 %–87 %) bimodal distribution of particle effective density is identified, with a low-density mode (named sub-density mode) accounting for 22 %–27 % of the total number of observed particles. The prevalence of the sub-density mode is closely related to fresh black carbon (BC) emissions. The geometric mean for the main density mode () increases from 1.18 ± 0.10 g cm−3 (50 nm) to 1.37 ± 0.12 g cm−3 (300 nm) due to a larger fraction of high-density components and a more significant restructuring effect at large particle sizes but decreases from 0.89 ± 0.08 g cm−3 (50 nm) to 0.62 ± 0.12 g cm−3 (300 nm) for the sub-density mode (), which could be mainly ascribed to the agglomerate effect of BC. and show similar diurnal cycles with peaks in the early afternoon, mainly attributed to the increasing mass fraction of high material density components associated with secondary aerosol production, especially of secondary inorganic aerosol (SIA). To investigate the impact of chemical composition, bulk particle effective density was calculated based on measured chemical composition (ρeff,ACSM) and compared to the average effective density at 300 nm (). The best agreement between the two densities is achieved when assuming a BC effective density of 0.60 g cm−3. The particle effective density is highly dependent on SIA and BC mass fractions. The influence of BC on the effective density is even stronger than SIA, implying the importance and necessity of including BC in the estimate of effective density for ambient particles.
- Article
(4815 KB) - Full-text XML
-
Supplement
(3909 KB) - BibTeX
- EndNote


Atmospheric aerosol has a significant impact on air quality, climate change and public health (Dockery and Pope, 1994; IPCC, 2007; Laden et al., 2000; Su et al., 2020). This is determined by a combination of various particle physical and chemical properties. Density, as one of important physical properties of aerosol particles, is intimately associated with optical, chemical and dynamic properties of particles (Ditas et al., 2018; Nosko and Olofsson, 2017; Park et al., 2003). It serves as a link between particle mass and mobility size (McMurry et al., 2002; Schmid et al., 2007) and is usually used to infer particle morphology, chemical composition, and associated atmospheric processes such as emission and aging (Abegglen et al., 2015; Levy et al., 2013; Olfert et al., 2007, 2017; Park et al., 2003; Wang et al., 2018; Wu et al., 2019; Zhang et al., 2018). Owing to an inability to directly measure the density of atmospheric particles, effective density is usually applied practically in aerosol research.
The effective density is closely linked to particle chemical composition and morphology. It is generally observed within the range of 1.06–1.81 g cm−3 in the ambient atmosphere (Cha and Olofsson, 2018; Geller et al., 2006; Hu et al., 2012; Levy et al., 2014; Lin et al., 2018; Rissler et al., 2014; Zamora et al., 2019), and these high values are attributed to the dominant of ammonium sulfate ((NH4)2SO4), ammonium nitrate (NH4NO3), and metals (Zhai et al., 2017; G. Zhang et al., 2016). In contrast, the effective density of particles dominated by black carbon (BC) or organic aerosol (OA) is relatively low (Zhai et al., 2017). While the effective densities of inorganic components are well recognized, there exists large uncertainties in the effective densities of both BC and OA (Li et al., 2016; Malloy et al., 2009; Zhang et al., 2008), leading to significant variations in the effective densities of ambient bulk particles.
The variability of OA density primarily originates from the diversity of organic species, formation mechanisms, and aging processes. For instance, the effective density of secondary organic aerosol (SOA) oxidized from m-xylene, terpenes, and cycloalkenes was estimated to be around 1.10 g cm−3 for those generated with inorganic seeds but around 1.40 g cm−3 without seeds (Bahreini et al., 2005). Malloy et al. (2009) determined effective densities of 1.24 and 1.35 g cm−3 for SOA from ozonolysis of α-pinene and photo-oxidation of m-xylene, respectively. An increase of 10 % in effective density caused by the oxidative aging process was also observed for SOA (George and Abbatt, 2010). Little information is found for effective density of primary organic aerosol (POA), but its value is usually lower than that of SOA due to closely related to fresh emissions (Nakao et al., 2011). Generally, a simplified average value around 1.20–1.40 g cm−3 is commonly applied for ambient OA in numerous studies (e.g., Hallquist et al., 2009; Hu et al., 2012; Levy et al., 2013).
A more dramatic variation is observed for the effective density of BC, ranging from 0.10 to 1.80 g cm−3 (Pagels et al., 2009; Peng et al., 2016). The lower end of the range is generally found for freshly emitted BC, owing to the presence of non-spherical morphology. For example, Zhang et al. (2008) found that soot particles generated under incomplete combustion conditions could have an effective density as low as 0.10 and 0.56 g cm−3 for particle sizes of 360 and 50 nm, respectively. Soot particles emitted from car brake materials, representing a typical traffic-related source, were also found to be at a low effective density of 0.75 g cm−3 (Nakao et al., 2011; Nosko and Olofsson, 2017). The effective density increases immediately with aging, as a more compact morphology of BC is formed (Ghazi and Olfert, 2013; Pagels et al., 2009). For instance, a 3–10-fold increment was found for the effective density of coated soot particles compared to fresh ones, attributed to the morphology compaction verified by transmission electron microscopy (TEM) technique (Zhang et al., 2008).
Currently, there are several techniques for the measurement of particle effective density. One commonly used method is measure particle mobility size and mass simultaneously based on a differential mobility analyzer (DMA) coupled with centrifugal particle mass analyzer (CPMA) or aerosol particle mass analyzer (APM) (Geller et al., 2006; McMurry et al., 2002; Rissler et al., 2014; Wang et al., 2018) and calculate the effective density assuming a spherical morphology. Another alternative technique is based on the relationship between aerodynamic diameter and mobility diameter, measured by a scanning mobility particle sizer–electrical low-pressure impactor (SMPS–ELPI) or a DMA–micro-orifice uniform deposit impactor (DMA–MOUDI) (Kelly and McMurry, 1992; Nosko and Olofsson, 2017). Other techniques, such as connecting a mass spectrometer in series with a DMA, are also applied in field studies and laboratory experiments, which can directly provide particle chemical composition information in addition to effective density (Spencer et al., 2007; G. Zhang et al., 2016). Among the above approaches, the first one (the mass–volume-based method) is the most widely used in ambient measurements (Peng et al., 2021).
Measured effective densities of ambient particles with a certain diameter usually present as a broad frequency distribution. To quantify the average and diversity of the measured effective densities, a Gaussian-based unimodal fit is commonly used. However, a bimodal effective density distribution with a second density mode occurring at density below 1.00 g cm−3 is sometimes observed when the air is strongly affected by primary emissions (Levy et al., 2013; Ma et al., 2020). The contribution of the second density mode can reach as high as 92 % (Rissler et al., 2014). It has been suggested that the second density mode is dominated by soot and that it can be used to infer the contribution of fresh emissions and the morphology of freshly emitted particles (Kuwata et al., 2009). To date, only a few works have performed a bimodal fit on measured effective density distribution, resulting in information about the second density mode for ambient particles being scarce. In addition, most studies reported values of effective density by taking the peak of the distribution (Ma et al., 2017; Qiao et al., 2018), which hides the information about the variability of the density distribution.
In this study, size-resolved effective density of ambient particles was measured with a combined differential mobility analyzer–centrifugal particle mass analyzer–condensation particle counter (DMA–CPMA–CPC) system during the Multiphase chemistry experiment in Fogs and Aerosols in the North China Plain (McFAN) in Hebei province in October–November, 2019. A newly developed flexible Gaussian fit approach is applied to separate two different density modes, and a comprehensive information of each density mode is given to fully characterize variations of effective density for ambient particles. Furthermore, measured effective density is compared with the calculated density to investigate the connections between particle effective density and chemical composition.
2.1 Sampling site and instrumentation
Observation of particle effective density, chemical composition, and number size distribution were performed from 18 October to 1 November of 2019 at Gucheng (39∘09′ N, 115∘44′ E) inside the Ecological and Agricultural Meteorological Test Station of the Chinese Academy of Meteorological Sciences in Hebei province in China. This site is located to the southwest of Beijing (∼ 100 km) and northeast of Baoding, Hebei province (∼ 35 km). As shown in Fig. S1 in the Supplement, the green area in the right panel is farmland and the faint yellow areas are scattered villages. The sampling site (red circle in Fig. S1) is surrounded by agricultural fields (mainly for corn cultivation) and is ∼ 1.5 km away from the No. 107 National Way. There are no significant emission sources such as large factories and power plants within 20 km. The main anthropogenic sources are biomass and coal combustion for domestic heating and cooking, as well as traffic in the country roads connecting different villages. It should be noted that the heating season in China normally starts from 15 November to 15 March of the following year, which is not covered by our sampling period. Besides, the temperature during the measurement period varies from 0 to 25∘ (Fig. S2). The emissions from heating are therefore considered to be limited. Moreover, source apportionment results also imply that the sampling site is not significantly affected by coal combustion during the observation period (Fig. S2). As shown in Fig. S1, one of the prevailing winds at the site is from the southwest with relatively high wind speed, possibly indicating the influence of regional transport from southern Hebei province. Overall, the sampling site is influenced by both local emissions from nearby villages and regional transport and can represent the average pollution conditions of the rural area of the North China Plain (NCP) well (G. Li et al., 2021).
During the observation, all aerosol instruments were settled inside an air-conditioned container with a constant temperature around 24 ∘C. The schematic of our measurement settings is shown in Fig. S3. Ambient particles were sampled with a PM10 inlet and then passed through a 1.2 m long Nafion dryer and a 0.4 m long silica gel drying tube in series to reduce the relative humidity (RH) to < 30 %. A constant flow rate of 16.7 L min−1 in the main inlet line was maintained by a mass flow controller and an extra pump to ensure the accuracy of the inlet cut-off size. There could be some possible influences from the pre-sampling treatment of ambient aerosols. One is the drying process in the sampling line since the evaporation of particle water content may affect its morphology. To date, only a few studies have investigated the influence of the drying process on particle effective density. Pagels et al. (2009) found that the influence of drying from 80 % to 5 % RH could be negligible for 150 nm soot particles coated with (NH4)2SO4. Yuan et al. (2020) concluded that the effective density of 240 nm BC particles coated with NH4NO3 decreased by 5 % and 16 % for thickly and thinly coated particles, respectively, when the particles were dried from 70 % to 5 % RH. According to these studies, the influence of the drying process on our effective density measurement is assumed to be negligible. Another possible influencing factor is the particle losses in the sampling line. The measurements were conducted for aerosol particles in the size range from 50 to 500 nm, which are not very sensitive to the three main loss mechanisms (i.e., diffusion loss, sedimentation loss, and impaction loss) (Baron and Willeke, 2001; Von Der Weiden et al., 2009). Furthermore, the particle losses mainly affect the absolute particle number concentration. The influence of these particle losses on the measurement of particle effective density is therefore considered to be negligible.
A combined DMA–CPMA–CPC system was employed to measure the size-resolved effective density of particles with mobility diameter of 50, 100, 150, 220, and 300 nm. Aerosol particles firstly passed through a DMA (Model 3081, TSI Inc.) operated at a sample flow rate of 1.0 L min−1 and a sheath flow rate of 5.0 L min−1 for size classification. The output semi-monodisperse charged particles were then introduced into a CPMA (Cambustion Ltd.) followed by a CPC (Model 3772, TSI Inc.) to measure their mass distribution. It takes about 1 h for a complete measurement cycle, in which frequency distributions of effective density with 22–38 bins for the five selected diameters were obtained. The measurement uncertainty of the DMA–CPMA–CPC system could come from two aspects: the size classification of DMA and the mass classification of CPMA. Based on the test using polystyrene latex (PSL) particles with diameters of 150, 220, and 300 nm, an average sizing uncertainty of ±2 % was determined for our DMA (Fig. S4). This uncertainty is similar to the value of ±1 % (±1 nm) reported by Mulholland et al. (1999) for the size range of 100–300 nm at an aerosol–sheath flow rate ratio of 0.1. The uncertainty of the mass classification of CPMA is estimated as 1.4 % according to the results of Taylor and Kuyatt (1994) and Symonds et al. (2013). The overall measurement uncertainty of the DMA–CPMA–CPC system was also evaluated using PSL particles with diameters of 150, 220, and 300 nm before and after the field campaign. An uncertainty within ∼ 5 % was found by comparing the measured effective densities with PSL material density (1.05 g cm−3) (Fig. S5).
Particle size distribution between 13–700 nm was measured by a scanning mobility particle sizer (SMPS, Model 3938, TSI Inc.). The mass concentrations of non-refractory submicrometer aerosol (NR-PM1) composition, including OA, nitrate (NO), sulfate (SO), ammonium (NH), and chloride (Cl−), were acquired using a quadrupole aerosol chemical speciation monitor (Q-ACSM, Aerodyne Research Inc.) with a time resolution of 30 min. The setup and calibration procedures followed those described in Ng et al. (2011). Source apportionment for OA was conducted using a positive matrix factorization (PMF) algorithm and four factors, including one SOA (oxidized OA, OOA) and three POA, i.e., biomass burning OA (BBOA), cooking OA (COA), and hydrocarbon-like OA (HOA), were determined. BC mass concentration was measured with a seven-wavelength Aethalometer (Model AE33, Magee Scientific) based on the attenuation at λ=880 nm and a corresponding mass absorption cross section of 7.77 m2 g−1 (Drinovec et al., 2015).
It should be noted that the effective density and size distribution data presented in our work range from 18 October to 1 November, while chemical data are available between 18 and 27 October. The effective density characterization discussed in Sects. 3.1–3.4 is based on the data covering the entire observation period, and the combined analysis of density and chemical composition (Sect. 3.5) only covers the shorter period mentioned above.
2.2 Calculation of effective density
The mass–volume-based method was applied in our study. Particle effective density can be calculated as follows:
where m is the particle mass measured by CPMA and dme is the particle mobility size measured by DMA. It can be speculated that ρeff is equal to the material density for compact spherical particles, while ρeff is smaller than the material density for non-spherical, irregular particles or spherical but porous particles.
In contrast to previous studies, which mostly use a unimodal Gaussian fit to process raw data of DMA–CPMA–CPC measurements, a flexible Gaussian fit algorithm with either a unimodal or bimodal fit, combined with a corresponding classification standard, was developed in our study to better characterize the frequency distribution of particle effective density. The algorithm includes two steps.
The first step is to remove doubly charged particles. It has been shown that doubly charged particles are ubiquitous and unavoidable for DMA-based mobility-selected methods, especially for particle sizes over 100 nm (Park et al., 2003). Nonetheless, doubly charged particles can be cleanly separated from singly charged particles with the same mobility size after penetrating through CPMA (McMurry et al., 2002). The theoretical masses of doubly charged particles for the five selected mobility sizes were estimated based on the Boltzmann equilibrium charge distribution (Fuchs, 1963; Wiedensohler, 1988) and are listed in Table S1. For instance, doubly charged particles present a 2.8-fold higher mass value than the singly charged particles with a DMA selected size of 300 nm. For each acquired particle mass distribution, the modes of doubly charged particles were discarded for the following analysis. Note that other multiply charged particles are not considered here since their mass is beyond the CPMA mass setting range.
The second step is to determine the number of modes and perform a unimodal or bimodal Gaussian fit. For each effective density distribution, a bimodal Gaussian fit (Eq. 2 with Nmode = 2) was implemented first. If the height ai of the mode located at the lower-density mode exceeds 5 % of that of the other mode, the fitting was terminated. Otherwise, a unimodal Gaussian fit (Eq. 2 with Nmode = 1) was performed.
where f is the frequency distribution of effective density, ρbin is the effective density of each measured bin and is equally spaced in logarithm scale, Nmode is the number of modes used in the fit, is the geometric mean effective density of mode i, ai is the height at of mode i, and σi is the standard deviation of mode i. The uncertainty of each individual Gaussian fit could be estimated based on the variation of the fitted in each mode at the 95 % confidence level. The overall uncertainty is estimated by averaging the uncertainties of all the fits, which gives averages within 2.5 % and 7.0 % for and at the five measured sizes, respectively. This uncertainty range is similar to the measurement uncertainty discussed in Sect. 2.1.
The bulk particle effective density (ρeff,ACSM) was also calculated with the aerosol chemical composition measured by ACSM based on Eq. (3), assuming that ambient particles were composed of (NH4)2SO4, NH4NO3, ammonium chloride (NH4Cl), OA, and BC.
where fm,i represents the mass fraction of chemical component i and ρi is the assumed effective density of chemical component i. Densities of (NH4)2SO4, NH4NO3, and NH4Cl are 1.76, 1.73, and 1.53 g cm−3, respectively. The density of OA usually ranges from 1.20 to 1.60 g cm−3 (Dinar et al., 2006; Kostenidou et al., 2007; Turpin and Lim, 2001). In this study a fixed value of 1.30 g cm−3 was used in the calculation. A sensitivity test was conducted regarding the uncertainties associated with the range of OA density. Considering the large range of observed BC effective density (0.30–1.80 g cm−3), a sensitivity analysis was applied to identify the optimal value of BC effective density. More discussion on OA and BC effective density can be found in Sect. 3.5.
For the comparison with ρeff,ACSM, we also estimated the average effective density based on the measured frequency distribution of effective density as follows:
where is the measured frequency distribution of effective density.
2.3 Calculation of fractal dimension
With the identification of the sub-density mode in Sect. 2.2, the geometric mean of the measured mass distribution of the sub-density mode () can be used to characterize the mass–mobility relationship in the size range of 50–300 nm. The relationship could be expressed as (Park et al., 2003) follows:
where C is a constant and Df is the fractal dimension, which reflects the morphology of particles. Df varies from 1 to 3, increasing as particle morphology becomes less fractal and with the value of 3 for spherical particle. By fitting and dme at the five measured particle sizes, C and Df can be determined. The measurement cycles containing less than four sizes with an identified sub-density mode were excluded in the calculation to ensure accuracy.
3.1 Size-resolved particle effective densities
Figure 1 depicts the statistical results after averaging all effective density distributions for 50, 100, 150, 220 and 300 nm particle sizes. Based on the flexible Gaussian fit, a considerable amount (77 %–87 %) of bimodal distribution condition occurred for all size particles. The first peak is found to be located below 0.90 g cm−3, and the second is higher than 1.20 g cm−3. For a compositional mixed compact spherical particle, particle density speculated from the material density of each individual component is supposed to be higher than 1.20 g cm−3 (the lowest material density among all components is 1.20 g cm−3, Ma et al., 2017; Xie et al., 2017). However, a low-density mode with peak density less than 1.00 g cm−3 usually exists for freshly emitted particles, indicating the presence of particles with highly agglomerated or porous morphology (Park et al., 2003; Rissler et al., 2013). Therefore, the two density modes observed in this study are defined as (1) “sub-density”, referring to a low effective density mode that implies fractally aggregated particles, and (2) “main density”, referring to a relatively high effective density mode with a dense or compact particle structure.
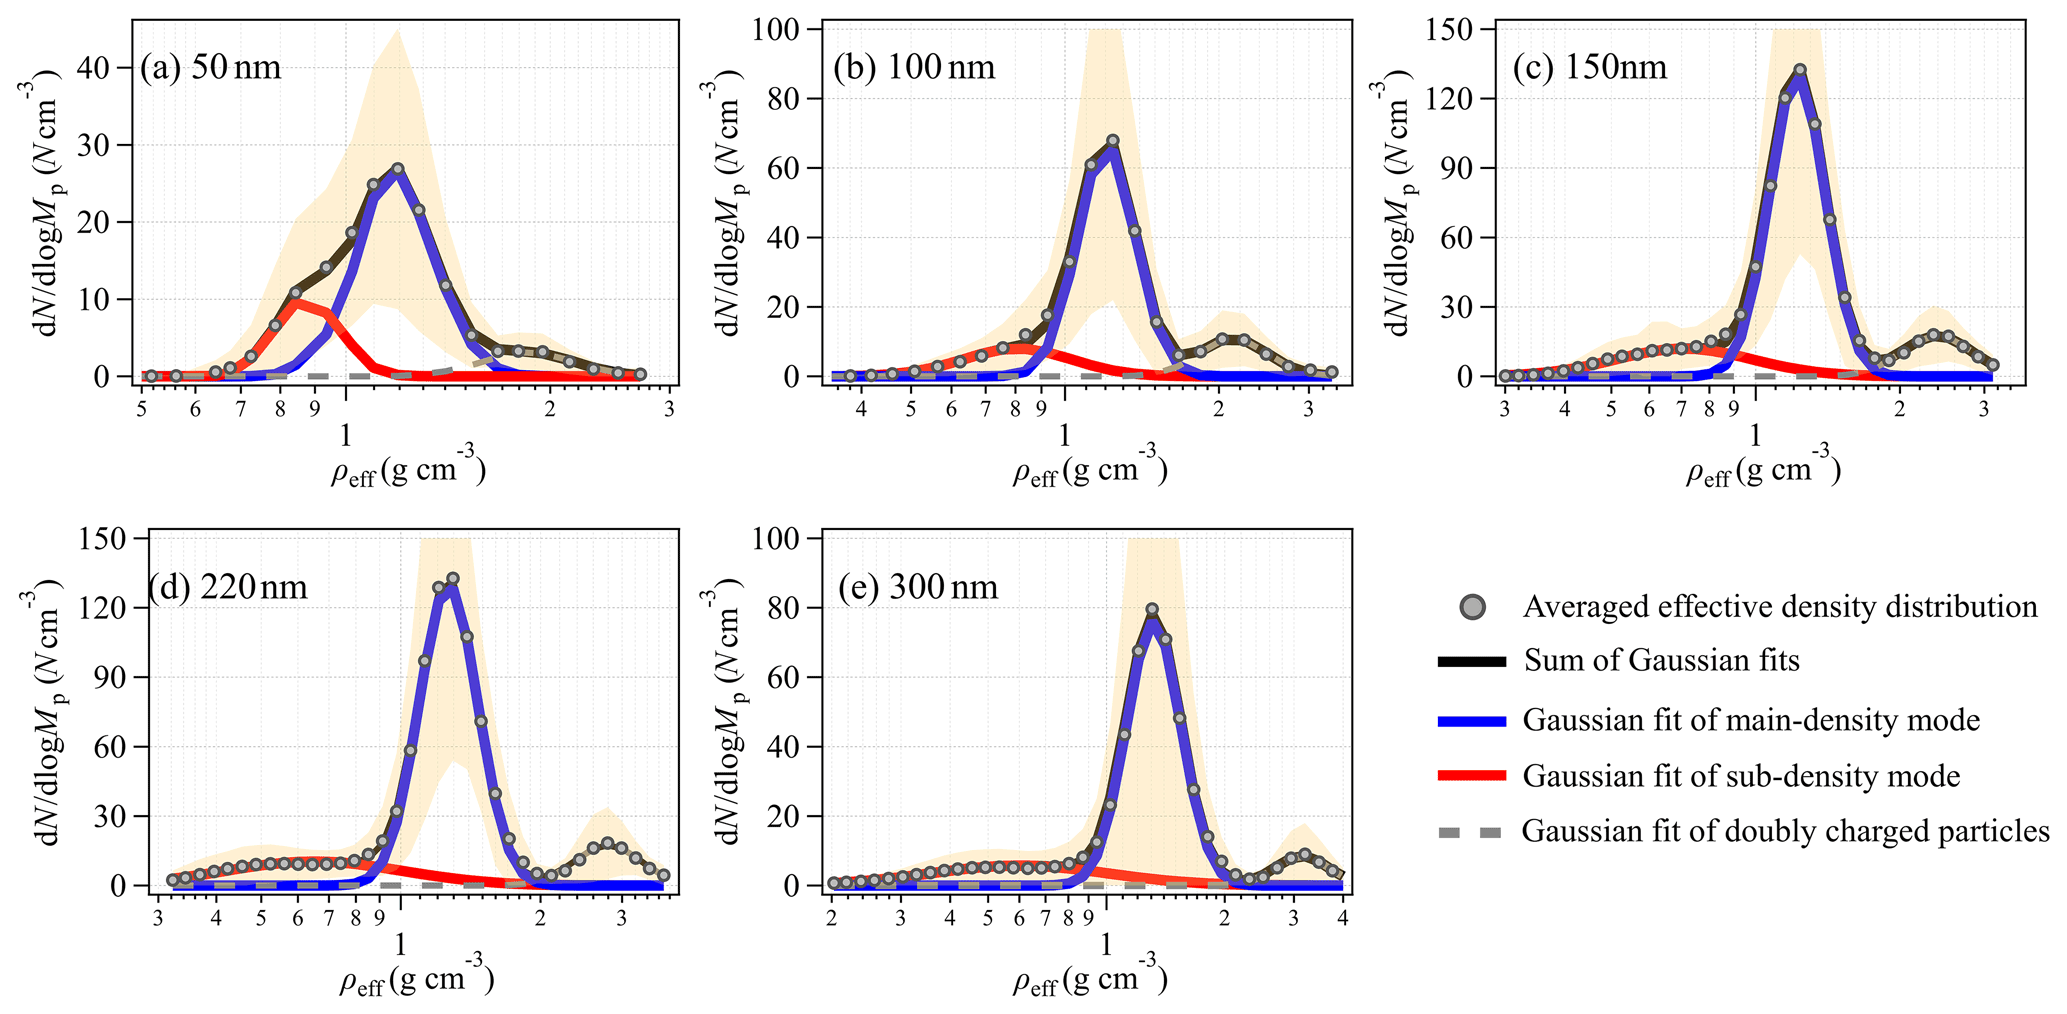
Figure 1Averaged particle effective density (ρeff) distribution for (a) 50 nm, (b) 100 nm, (c) 150 nm, (d) 220 nm, and (e) 300 nm particles during the entire sampling period. The grey points represent the measured average effective density distribution, and the yellow shaded area represents the standard deviation of the averaged data. The blue line and red line are the Gaussian fit of the main density mode and sub-density mode at each size, respectively, and the dashed grey line represents Gaussian fit of doubly charged particles. The black line is the sum of the main density mode, sub-density mode, and doubly charged particles.
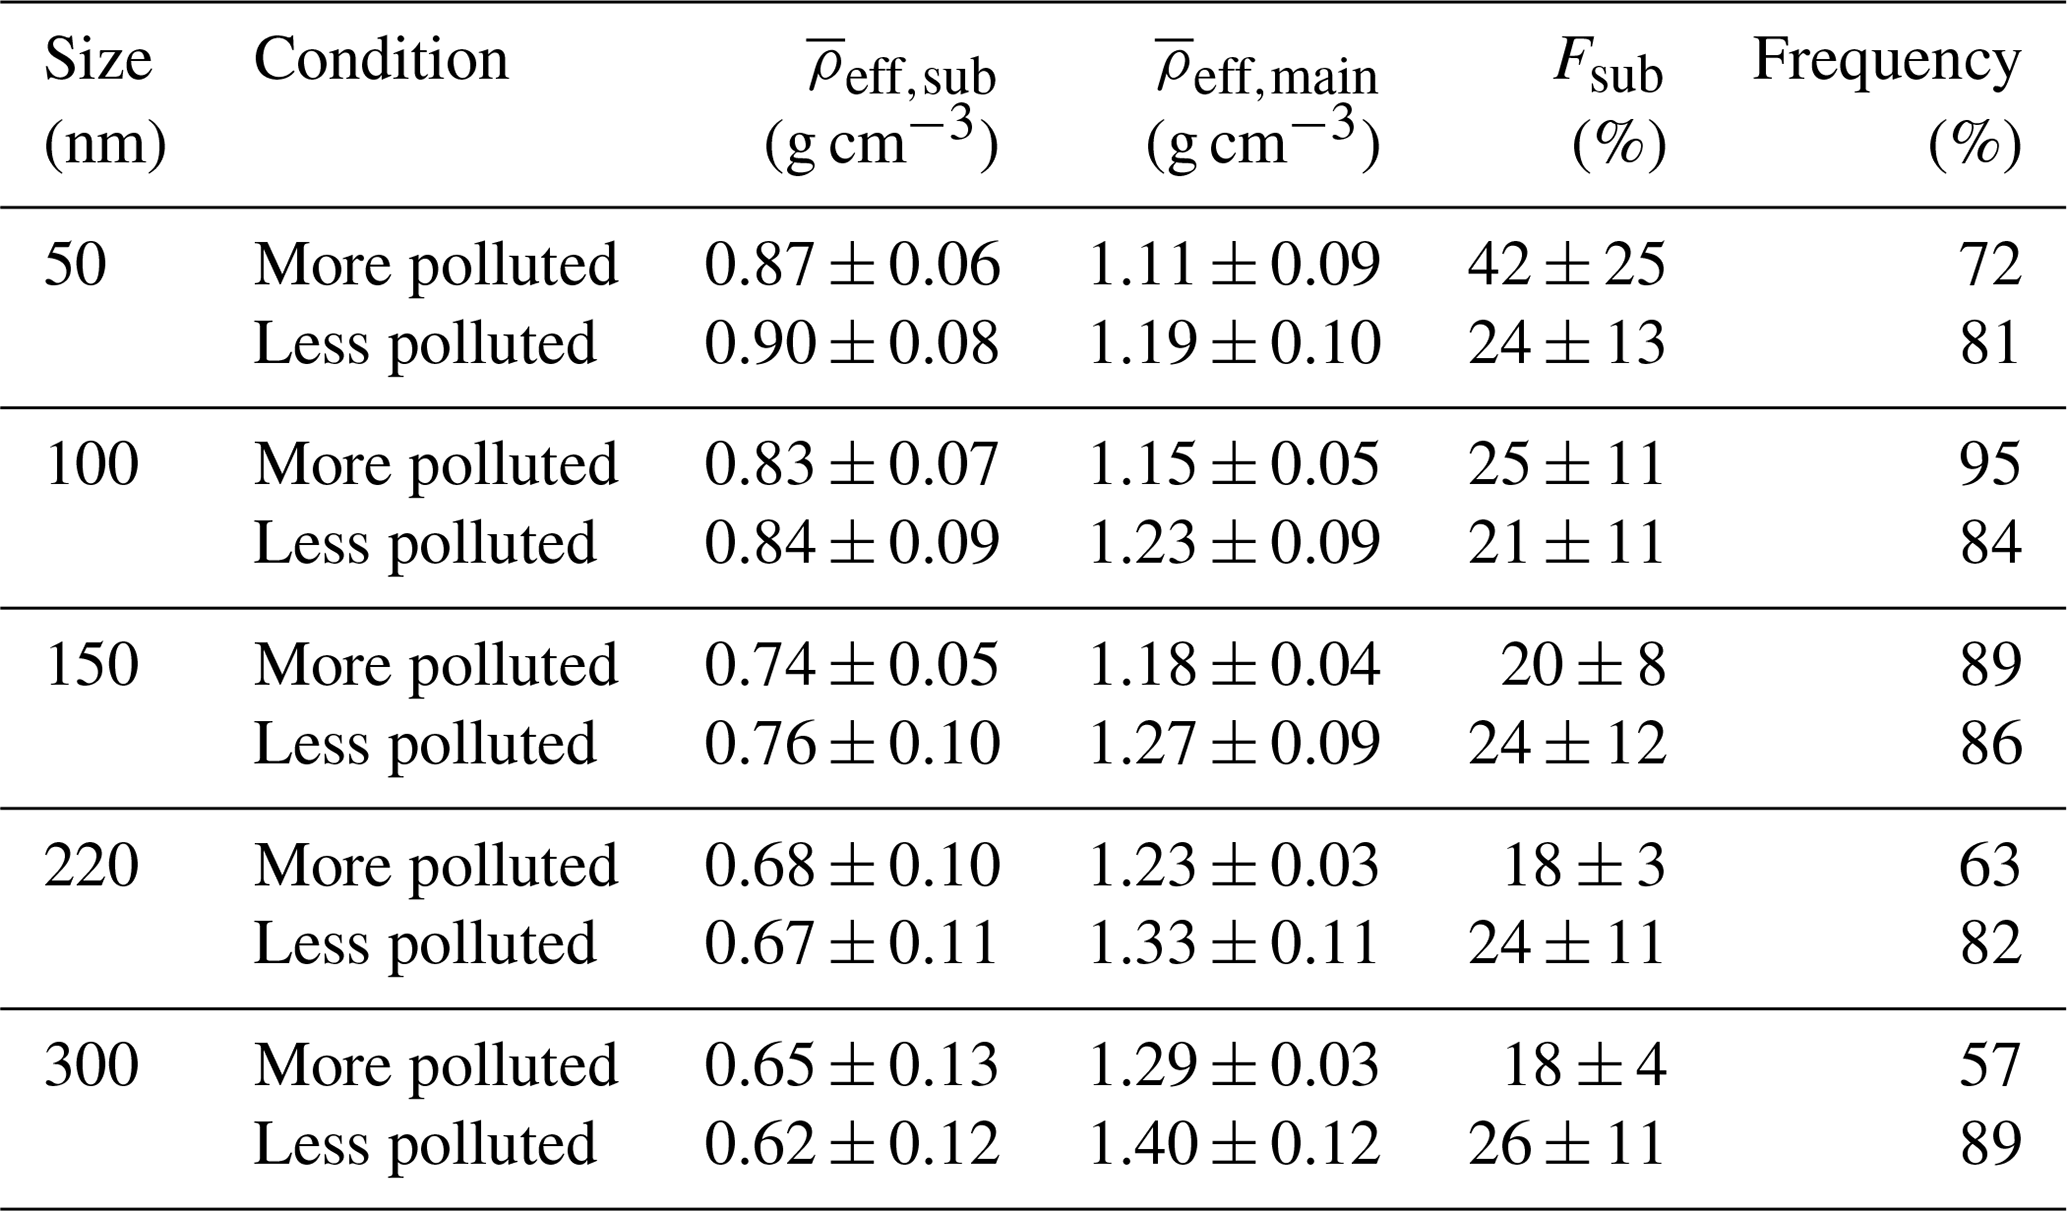
Table 1The geometric mean effective density ( and ) and standard deviation (σsub and σmain) of the sub-density mode and main density mode and the number fraction (Fsub) and occurrence frequency of the sub-density mode during the entire sampling period.
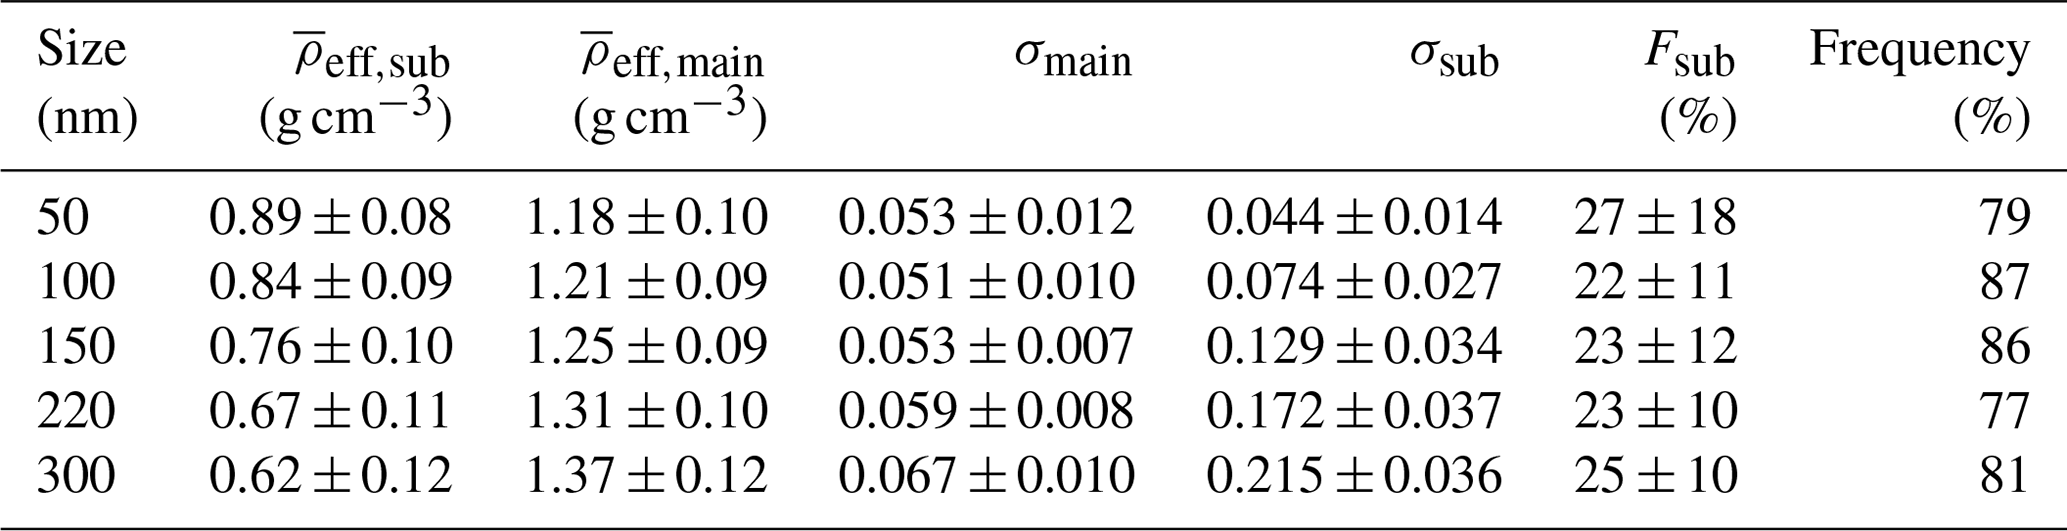
As listed in Table 1, the occurrence frequencies of the sub-density mode are 79 %, 87 %, 86 %, 77 %, and 81 % for particle diameters of 50, 100, 150, 220, and 300 nm, respectively. These frequencies are significantly higher than those reported in Levy et al. (2013), which only reach up to 32 % for 150 nm particles in inner-city Houston (Texas, US). It is also different from another study conducted in suburban environment of Nanjing, China (Ma et al., 2017), where they observed a dominant unimodal distribution of effective density with only < 10 % occurrence with bimodal distribution. On the other hand, a low effective density mode (density < 1.20 g cm−3) exists or even dominates in the measurements near emission sources, which is ascribed to freshly emitted particles and non-uniformly mixed particles (Nosko and Olofsson, 2017; Olfert and Rogak, 2019; Park et al., 2003). Numerous studies have found low effective densities of freshly emitted BC, with a minimum of 0.10 g cm−3 (Pagels et al., 2009). While the density of OA is usually assumed to be 1.2–1.3 g cm−3 in most cases (Hallquist et al., 2009), some studies have found it could be as low as 0.6–1.1 g cm−3 (Nakao et al., 2011; Li et al., 2016). To elucidate the role of these two components in the sub-density mode, we further analyze the correlation between the number fraction of the sub-density mode (Fsub) and the mass fractions of BC and OA. As seen in Figs. S6–S7, the mass fraction of BC shows significant correlation with Fsub at 150, 220, and 300 nm (R2 = 0.46–0.57), whereas barely any correlation is observed between OA and Fsub (R2 = 0.02–0.09), implying that the sub-density mode at these three sizes could mainly be attributed to freshly emitted BC and that the quantity of the sub-density mode is closely related to the variation of BC mass fraction. However, Fsub at 50–100 nm shows little correlation with either BC or OA mass fraction, which could be explained by the difference between the PM1 bulk chemical composition and the chemical composition of particles smaller than 100 nm. In addition, the discrepancy in observed frequencies of the sub-density mode with other studies can be explained to some extent by the different thresholds used in the studies to identify bimodal distribution of effective density. In our study, we aim to identify as many bimodal cases as possible with a low threshold of 5 % as mentioned in Sect. 2.2.
The mean (min., max.) values of Fsub are 27 % (4 %, 88 %), 22 % (5 %, 63 %), 23 % (6 %, 64 %), 23 % (9 %, 85 %), and 25 % (5 %, 78 %) for 50, 100, 150, 220, and 300 nm particle size, respectively (Table 1), showing no obvious trend with particle size. The results in our study are lower than those (11 %–92 %, with most cases exceeding 50 %) in traffic-emission-influenced sites (Geller et al., 2006; Rissler et al., 2014), as the number fraction of the sub-density mode is tightly related to the influence of fresh BC emission sources (Geller et al., 2006; Levy et al., 2014; Ma et al., 2020). Interestingly, when we classify the measured particle number size distribution according to the measured Fsub and use the 25th and 75th percentiles of Fsub at each measured particle size as a threshold, we found a more prominent Aitken mode with higher Fsub (Fsub > 75th Fsub) (Fig. S8). The initial burst of Aitken mode particles may be attributable to the enhanced traffic-related emissions (Xie et al., 2017). Previous studies showed that the effective density of 50 nm traffic-emitted particles could be below 1.0 g cm−3 (Olfert et al., 2007; Park et al., 2003; Momenimovahed and Olfert, 2015). Therefore, the observed higher Aitken mode in our study may stem from the higher contribution of traffic emission and subsequently lead to an increase in particles in the sub-density mode. This finding also provides good support for the idea that there are connections between Fsub and fresh emission sources.
During the entire campaign, the geometric mean for the main density mode () varies from 0.94 to 1.42, 1.01 to 1.47, 1.09 to 1.48, 1.16 to 1.59, and 1.22 to 1.73 g cm−3 for particles at 50, 100, 150, 220, and 300 nm, respectively, and for the sub-density mode () the geometric mean varies from 0.74 to 1.20, 0.59 to 1.25, 0.55 to 1.14, 0.36 to 0.99, and 0.34 to 1.00 g cm−3 for particles at 50, 100, 150, 220, and 300 nm, respectively. Although the temporal variations are similar for the five measured sizes, densities of particles at 50 and 100 nm show greater variability than larger particles (Fig. S9).
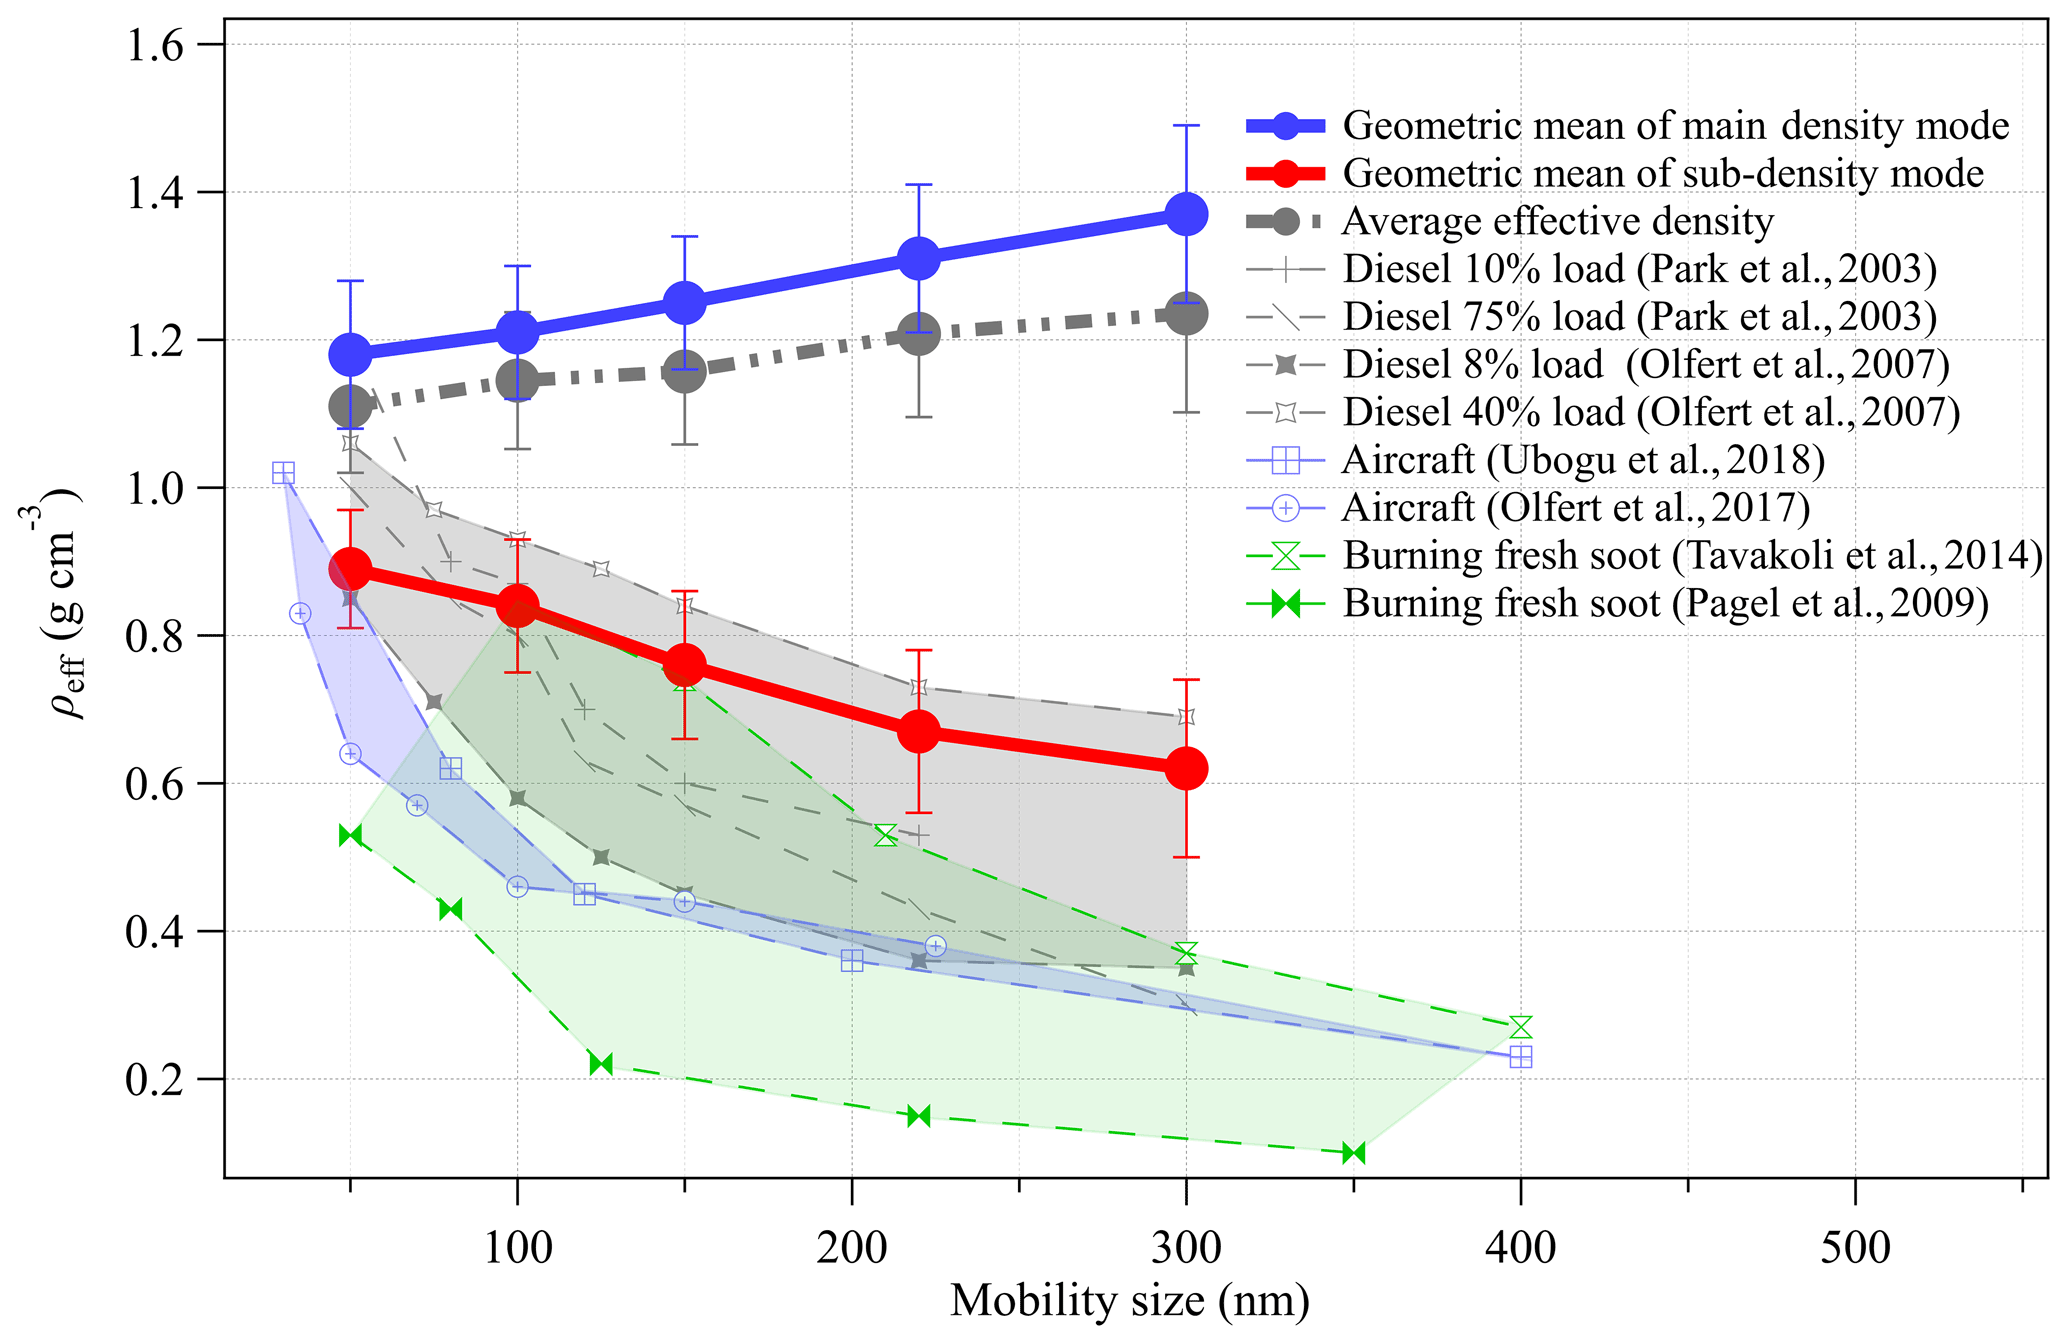
Figure 2Size dependency of effective density (ρeff) in this study and from selected laboratory experiments for comparison.
exhibits an evident ascending trend with particle size (Fig. 2), similar to the pattern reported in Shanghai (Yin et al., 2015). This is probably affected by two aspects. One is the increase in the proportion of high-density components with increasing particle size, from being OA dominant to secondary inorganic aerosol (SIA) dominant. Although size-resolved chemical composition was not measured in this study, it can be inferred from J. Li et al. (2021) that the mass fraction of SIA increased from 49 % (49 %) to 55 % (61 %), with particle size increasing from 150 to 300 nm in autumn (winter) in the NCP. The other is the collapse and restructuring effect occurred for soot-containing particles during aging processes (Ghazi and Olfert, 2013; Pagels et al., 2009), leading to a more sphere-like particles or a more dense morphology of large particles.
However, decreases from 0.89 to 0.62 g cm−3 as particle size increases from 50 to 300 nm. This can be ascribed to the agglomerate effect that fresh soot particles with larger sizes are more agglomerated and hence have a larger fractal dimension and lower effective density. This has been confirmed by TEM images for diesel engine exhaust particles (Park et al., 2003) and traffic-related environmental samples (Rissler et al., 2014). Figure 2 also shows the results for fresh soot from previous studies. All the reported densities of freshly emitted particles from diesel combustion, aircraft, and other burning sources show decreasing trends with particle size that have much steeper slopes than our results. This is because after being emitted into the atmosphere fresh soot is rapidly coated with (NH4)2SO4, NH4NO3, and OA (Kuwata et al., 2009), leading to an increasing and less pronounced decline trend compared with observations for primary sources (Olfert et al., 2007; Tavakoli and Olfert, 2014; Ubogu et al., 2018).
Most previous studies did not differentiate between the two modes and reported either an overall increasing (Levy et al., 2014; Ma et al., 2020; Yin et al., 2015) or decreasing trend (Geller et al., 2006; Qiao et al., 2018) of with particle size. A unimodal distribution implies an assumption of an internal mixing of particles, which is not true since most surface atmosphere is affected by fresh emissions. Therefore, the feature of the sub-density mode may be missed if a unimodal fit is used. As shown in Fig. 2, only a slightly monotonically increasing trend of average effective density () with particle size is observed (dotted grey line in Fig. 2). Therefore, sub-density modes need to be isolated to reflect the detailed features of effective density of ambient particles. Furthermore, bimodal fits can also provide additional information on the mixing state of fresh and aged particles.
In addition to the size dependence of and , σ of different effective density modes also varies with particle size. The mean σ of the main density mode is similar for particles in the size range of 50 to 150 nm (∼ 0.053) and gradually increases to 0.067 at 300 nm (Table 1). The mean σ of the sub-density mode reaches the highest value (∼ 0.215) at 300 nm and decreases to ∼ 0.044 at 50 nm. Since particles usually appear morphologically more dense in the main density mode (Rissler et al., 2014), the variation of σ probably originates from the differences in particle chemical composition. For the sub-density mode, soot is the main component of particles (approximately over 80 %, Kuwata et al., 2009). It has been found that the morphology of freshly emitted soot is more chain-like at large particle sizes than at small sizes (e.g., Park et al., 2003). We therefore speculate that the chain-like morphology enables a higher degree of morphological variation of larger particles, resulting in a broader sub-density distribution.
3.2 Evolution of effective density with meteorology conditions
Weather conditions play a crucial role in the formation, aging, and emission transportation of aerosol and may therefore affect the distribution, composition, mixing state, and (consequently) the effective density of ambient aerosol. As seen in Fig. S2, the pollution level at the sampling site is sensitive to the variations of wind speed and direction during the observation period. Low PM0.7 concentrations were usually presented with strong northerly winds, while high PM0.7 concentrations were associated with calm winds or southwesterly winds.

Figure 3Wind rose analysis of (a) geometric mean of the main density mode (), (b) geometric mean of the sub-density mode (), and (c) number fraction of the sub-density mode (Fsub) for 150 nm particles. Bold black lines represent the wind frequency during the entire sampling period.
Figures 3 and S10 show the average , and Fsub at each specific wind speed and direction. Obvious high values of and appear with a southwesterly wind direction and wind speed of > 2 m s−1. This pattern clearly indicates the influence of regional transport from southern Hebei province, an area greatly affected by emissions from industrial and residential sources (Huang et al., 2019; Li et al., 2017). Air masses from this direction may bring pollutants with a sufficient aging process, leading to changes in particle chemical composition and morphology, and consequently an increase in the fraction of particles closer to spherical with higher effective densities. Accordingly, Fsub also shows distinctly low values (Figs. 3c and S10). It is worth mentioning that and do not show any obvious difference for a northwesterly wind direction. This implies that the influence of the traffic emissions from the No. 107 National Way, which is approximately 1.5 km away from the sampling site (Fig. S1), on our measurements is somehow limited. We also noticed that an increasing trend of is presented with increasing wind speed (Fig. S11). This increase could be interpreted by the antagonism between well-aged particles from long-range transport and fresh particles from local emissions. High wind speed is usually accompanied by the long-range transport of particles with sufficient aging and consequently high effective density, whereas low wind speed generally implies higher contribution of local fresh emissions, resulting in more particles with non-spherical morphology.
3.3 Effective density at different pollution levels
Given that the particle effective density varies dramatically with time (Fig. S9), the entire sampling period is classified into two pollution levels to elucidate the evolution of effective density under different pollution conditions. As mentioned in Sect. 2.1, particle mass concentration data only cover a part of the sampling period, and thus PM0.7 volume concentration calculated based on SMPS measurement (size range of 13–700 nm) is applied to separate the sampling period into two groups: a more polluted group with PM0.7 volume concentration higher than 50 µm3 cm−3 and a less polluted group corresponding to PM0.7 volume concentration lower than 50 µm3 cm−3. It should be mentioned that the threshold of PM0.7 volume concentration is comparable to PM1 mass concentration of 60 µg m−3 (R2 = 0.97; slope = 0.84; see Fig. S12). The difference mainly stems from the size truncation of SMPS, as well as the time-dependent and size-dependent variations of the particle effective density (Morawska et al., 1999). Since particles are assumed to be spherical (i.e., fractal dimension = 3.0) in the calculation of PM0.7, the obtained PM0.7 may be overestimated.
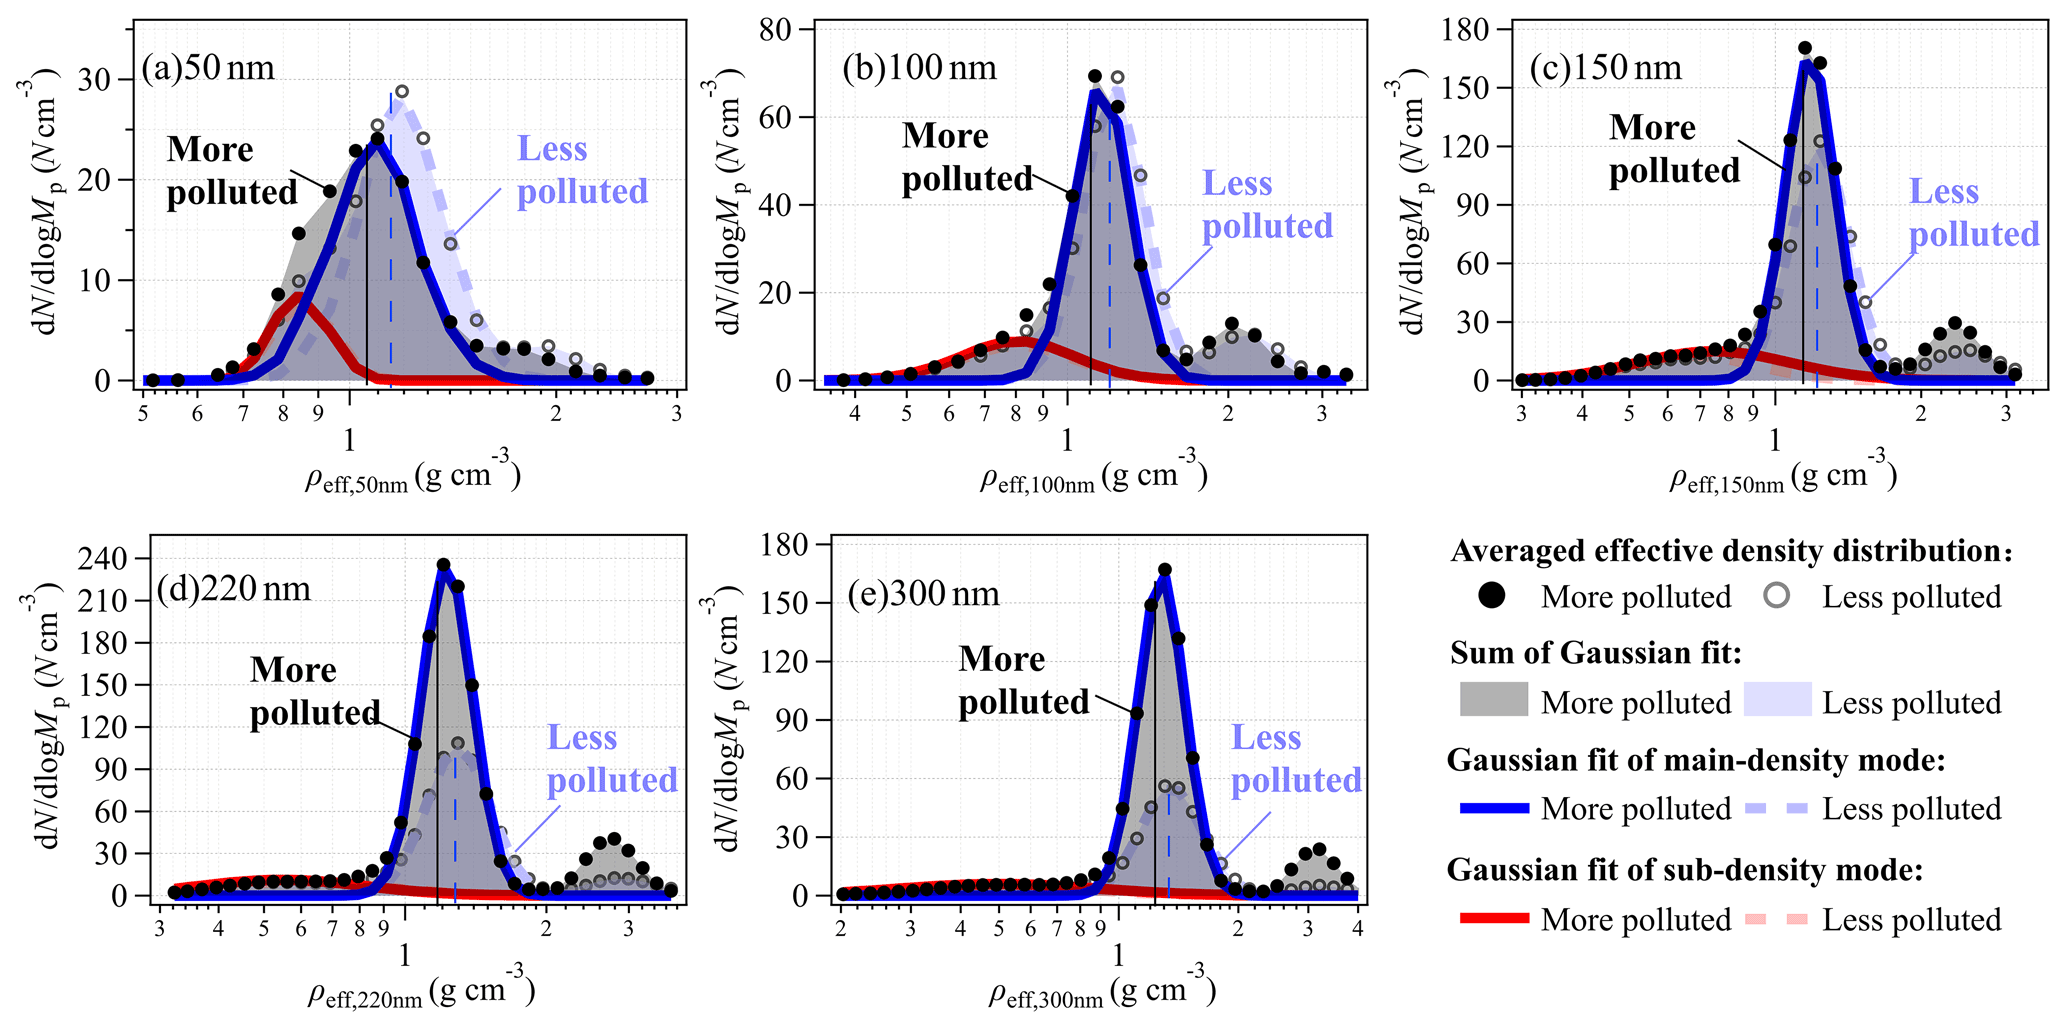
Figure 4Averaged particle effective density (ρeff) distribution for (a) 50 nm, (b) 100 nm, (c) 150 nm, (d) 220 nm, and (e) 300 nm particles under the more polluted and less polluted conditions.
Table 2The geometric mean effective density ( and ) of the sub-density and main density modes and the number fraction (Fsub) and occurrence frequency of the sub-density mode under the more polluted and the less polluted conditions.
The average effective density distributions of the two groups are depicted in Fig. 4, and the statistics of , , and Fsub and the occurrence frequency of the sub-density mode are given in Table 2. The value of in the more polluted group for each particle size is 0.08–0.11 g cm−3 lower than that in the less polluted group. In contrast, the difference in is insignificant, with a maximum discrepancy of 0.03 g cm−3, which is only one-third of the maximum discrepancy for . The size dependence of and follows a similar pattern under all conditions (Fig. S13).
It can be noted from Table 2 that Fsub varies with pollution levels. In the less polluted group, Fsub mainly distributes over a small range of 21 %–26 % with little size dependence, while in the more polluted group Fsub gradually decreases from 42 % at 50 nm to 18 % at 300 nm. This is consistent with the observations conducted by Rissler et al. (2014) in Copenhagen, which showed a decrease of around 50 % in the number fraction of fresh soot particles (equivalent to Fsub in our study) from 75 to 350 nm under heavily polluted conditions. Since the integrated area of the sub-density mode at each particle size is stable in the more polluted group, the size dependence of Fsub is mainly driven by the increase in the integrated area of the main density mode with particle size. As a result, Fsub for particles at 50–100 nm is higher in the more polluted group than the less polluted group, but it is the opposite for particles at 150–300 nm.
Similarly, the occurrence frequency of the sub-density mode decreases with particle size (with an exception of 50 nm) in the more polluted group, i.e., 72 %, 95 %, 89 %, 63 %, and 57 % at 50, 100, 150, 220, and 300 nm, respectively. In contrast, the variation with particle size in the less polluted group is no more than 10 %. One possible explanation is that the sub-density mode inherently diminishes due to a higher aging degree for larger particles under the more polluted conditions. Xie et al. (2017) found that the effective density distribution was more inclined to a unimodal distribution for particles at 220 nm than 40 nm during episodes at PM1 volume concentrations above 50 µm3 cm−3. Hence, the occurrence probability of bimodal distribution was expected to be higher for smaller particles with respect to large particles, similar to the results in this study. In addition, it is difficult to identify the sub-density mode as it falls below the threshold defined in Sect. 2.2 due to the increasing contribution of the main density mode for larger particles, which consequently reduces the corresponding occurrence frequency of the sub-density mode.
3.4 Diurnal variations of effective density
Figure 5 describes the diurnal cycle of and at the five measured particle sizes. increases in the morning and gradually decreases in the late afternoon and early evening for all particle sizes. The upward tendency in the morning and early afternoon is associated with the increasing intensity of secondary aerosol production, resulting in an increment of high material density components, such as SIA and OOA mass fraction (especially NH4NO3; Fig. S14). Besides, with the increase in the fraction of internally mixed particles and coating thickness (Cheng et al., 2012; Ma et al., 2012), particles gradually approach sphere-like morphology (Ghazi and Olfert, 2013; Pagels et al., 2009), which also leads to the increase in . In the late afternoon, starts to decline, attributed to elevated mass fractions of BC and POA (Fig. S14) due to enhanced emissions from traffic, biomass burning, and cooking identified by PMF.
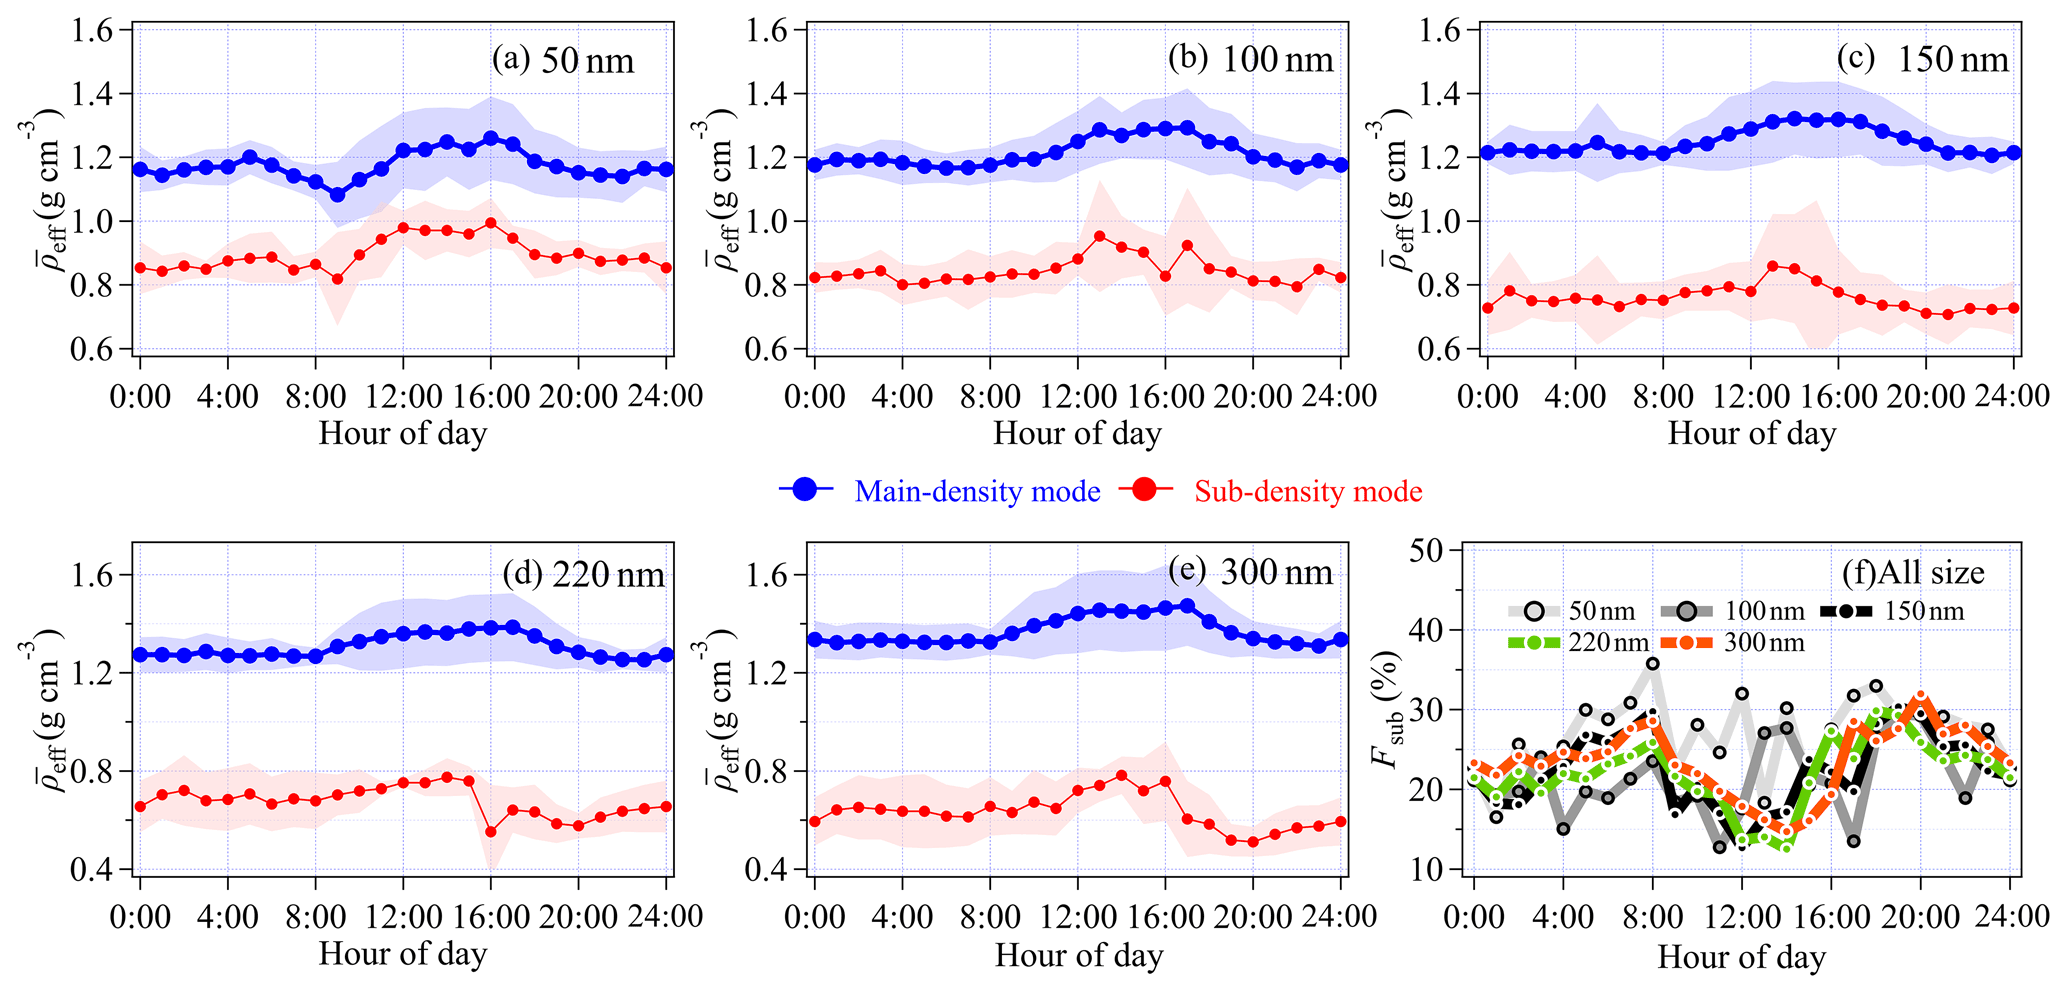
Figure 5Diurnal cycle of the geometric mean effective density () of the main density mode and sub-density mode for (a) 50 nm, (b) 100 nm, (c) 150 nm, (d) 220 nm, and (e) 300 nm particles. (f) Number fraction of the sub-density mode (Fsub).
The diurnal cycle of is similar to that of for each particle size, with a daily maximum observed in the early afternoon and a relatively low level observed at night. One difference between the two modes is that drops more rapidly before sunset compared with , especially for large particles (≥ 150 nm). This is because the sub-density mode is more directly related to freshly emitted particles than the main density mode.
The diurnal cycle of Fsub is different from the pattern of and . As shown in Fig. 5f, Fsub exhibits insignificant daily variability for particles at 50–100 nm, while double peaks are observed in the morning and evening for particles at 150–300 nm associated with large amount of fresh BC emissions. The minimum Fsub for particles at 150–300 nm is generally found during the mid-afternoon, e.g., 15 % at 14:00 China Standard Time (CST) for 300 nm. This is consistent with the pattern of the occurrence frequency of the sub-density mode, which drops remarkably during 12:00–16:00 CST (Fig. S15). The drop of both Fsub and occurrence frequency could be explained by the transition of particles from the sub-density mode to the main density mode associated with aging processes.
Table 3Comparison of the fractal dimension (Df) of the sub-density mode particles at noon and at night under the more polluted and less polluted conditions.
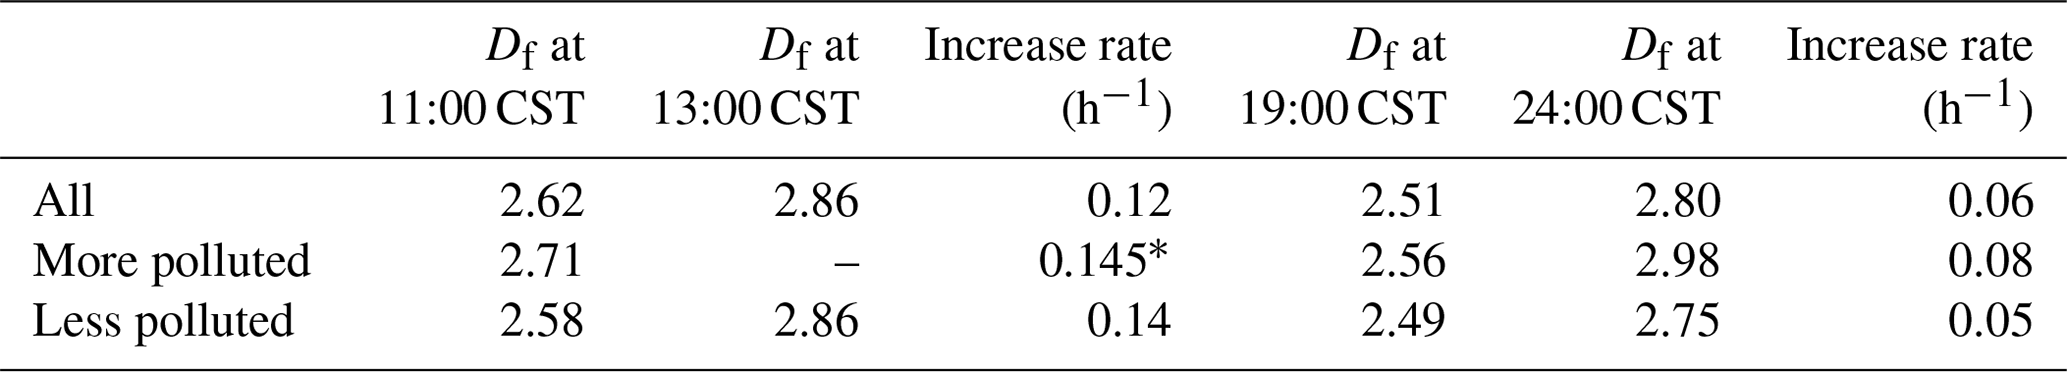
∗ Calculated by assuming Df at 13:00 CST is 3.0.
As shown in Fig. 6, Df shows a distinct diurnal variation. There are two decreasing trends, i.e., from 06:00 to 11:00 CST and from 17:00 to 19:00 CST, corresponding to the morning and evening rushing hours, with Df falling into the range of particles from vehicle emissions (2.22–2.84) reported in previous studies (Wu et al., 2019; Olfert et al., 2007; Park et al., 2003). The rapid increase in Df from 2.62 (11:00 CST) to 2.86 (13:00 CST) at noon could be attributed to photochemical aging, resulting in more compact particles (Ghazi and Olfert, 2013). During early afternoon (14:00–16:00 CST), there are no Df values due to a sharp reduction in the occurrence frequency of the sub-density mode (Fig. S15), as discussed above. Df gradually increases from 2.51 at 19:00 CST to 2.81 at 24:00 CST, probably associated with aging processes during the night. It is worth noting that the increase rate of Df differs between noon and night, being ∼ 0.12 h−1 at noon, which is twice the nighttime increase rate (0.06 h−1). To minimize the influence of pollution level on the transiting particles from fractal to compact morphology, the variations of Df under the more polluted and the less polluted periods were further examined separately. As shown in Fig. S16, similar diurnal variations were observed at two different pollution levels, with a higher Df increase rate at noon than at nighttime (Table 3), implying that photochemical aging process at noon is very efficient in transiting particles from fractal to compact morphology. It should be pointed out that there are no Df data during 12:00–17:00 CST under the more polluted conditions, likely due to the transition of the sub-density mode particles to the main density mode that is associated with active aging processes. Given that the Df of the more polluted period is consistently 0.20 higher than the less polluted conditions (Fig. S16) and that aerosol the aging process at noon is very active, the Df increase rate from 11:00 to 13:00 CST under the more polluted conditions is calculated by assuming a Df of 3.0 at 13:00 CST.

Figure 6Diurnal cycle of fractal dimension (Df) of the sub-density mode particles. The dotted line is Df with a value of 3.0, indicating particles with a spherical morphology. The blue arrows represent Df with a decreasing trend, and the orange arrows represent Df with an increasing trend.
3.5 Influence of chemical composition on effective density
Chemical composition is one of the key factors affecting particle density. Inorganic components, including NH4NO3 and (NH4)2SO4, have higher density than OA and BC. Therefore, the variation in aerosol chemical composition can to some extent explain the wide range of observed effective density. Since 300 nm is the closest size to the peak position of particle volume distribution (Fig. S17) among the five measured sizes, the average effective density of particles at 300 nm () is used for comparison with the ACSM-derived bulk effective density (ρeff,ACSM) based on Eq. (3) to explain the connection between particle effective density and chemical composition.
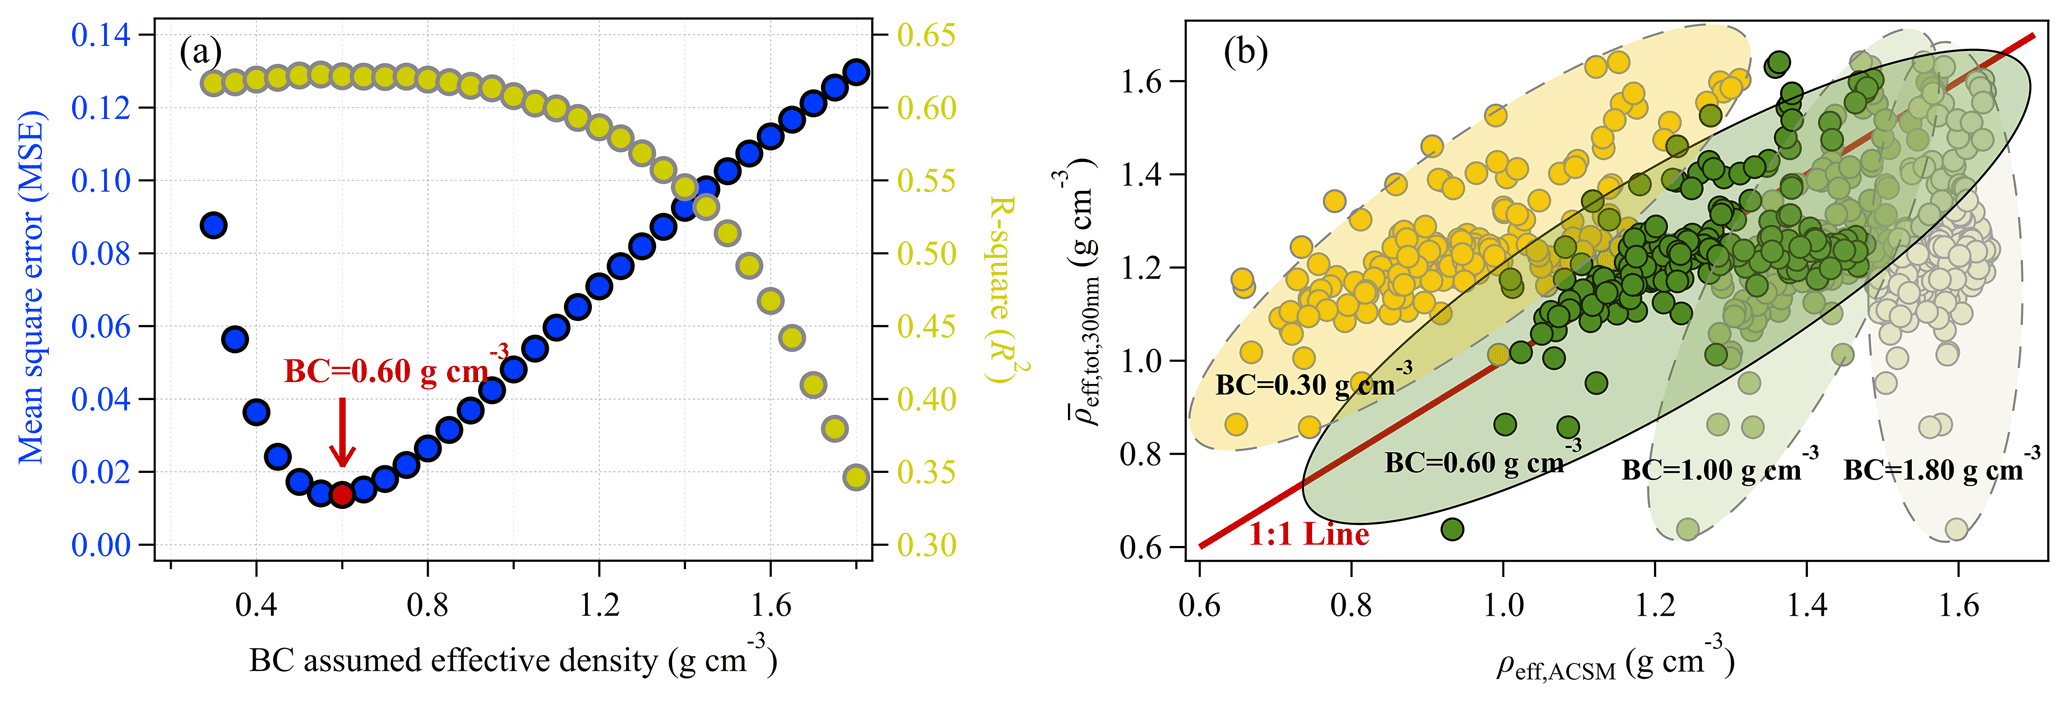
Figure 7(a) Mean squared error (MSE) and R-squared (R2) results from a BC effective density sensitivity test. (b) Comparison of the average effective density of particles at 300 nm observed by DMA–CPMA–CPC () and ACSM-derived bulk effective density (ρeff,ACSM). The shaded areas represent ρeff,ACSM based on different BC effective density assumptions. The red line shows a slope of 1.
As mentioned earlier, there exists large variation in BC effective density due to the influence of morphology, but most studies have ignored the influence of BC effective density or have just used a material density of 1.80 g cm−3 for BC (Lee et al., 2013; Levy et al., 2013; Lin et al., 2018). Assuming a dense spherical BC with density of 1.80 g cm−3 may even lead to ∼ 17 % overestimation of absorption enhancement (Y. Zhang et al., 2016). To analyze the influence of BC effective density on ρeff,ACSM, a sensitivity test with BC effective density ranging from 0.30 to 1.80 g cm−3 and a step size of 0.05 g cm−3 is performed in this study. The minimum value (0.30 g cm−3) is the lowest effective density of BC at 300 nm observed in the atmosphere (Olfert et al., 2017), while the maximum effective density (1.80 g cm−3) is the material density of BC. The mean squared error (MSE) and R square (R2) between and ρeff,ACSM at each BC density step are shown in Fig. 7a. In addition, Fig. 7b shows the comparison between and ρeff,ACSM with an assumed BC effective density of 0.30, 0.60, 1.00, and 1.80 g cm−3, respectively.
We find that ρeff,ACSM can be decreased on average by 40 % if the applied BC effective density changes from 1.80 to 0.30 g cm−3. In addition, 34 % of observed has a value below 1.20 g cm−3, which could only be explained by low BC effective density. Therefore, applying a proper BC effective density is crucial for accurate estimates of the effective density of ambient particles. Among all tested values, ρeff,ACSM with assumed BC effective density of 0.60 g cm−3 matches best with measured (R2 = 0.62 and MSE = 0.014). Good correlation with R2 of 0.62 (0.61) is found for BC effective density of 0.30 g cm−3 (1.00 g cm−3), but the MSE reaches up to 0.088 (0.048). In contrast, when using a BC effective density of 1.80 g cm−3, the derived ρeff,ACSM is much higher than the measured , and there is barely any correlation between them. Since strong diurnal variation was observed for BC mass fraction (Fig. S14) driven by the changes in primary source emissions, we also conduct a sensitivity analysis to retrieve BC effective density every 3 h over the course of a day. The retrieved BC effective density indeed shows a diurnal pattern (Fig. S18), with high values in the afternoon and night and relatively low values during the morning and evening, which matches well with the diurnal pattern of Fsub (Fig. 5). However, the range of the diurnal variation (0.52–0.64 g cm−3) is relatively small. When applying this diurnal pattern of BC effective density in the calculation of ρeff,ACSM, only a marginal increase was found in the R2 of the correlation between and ρeff,ACSM (R2 increased from 0.62 to 0.65, Fig. S19), probably due to the limited amount of data in each time interval and the use of bulk chemical composition in the calculation. Therefore, a fixed BC effective density of 0.60 g cm−3 is used for the ρeff,ACSM calculation in the following analysis.
Additionally, a sensitivity test for OA densities ranging from 1.20 to 1.60 g cm−3 (Dinar et al., 2006; Kostenidou et al., 2007; Turpin and Lim, 2001) is conducted to evaluate the uncertainties associated with the variability of OA density. As seen in Fig. S20, the changes in OA density have little influence on ρeff,ACSM (difference within 8 %) for the test OA density range. The MSE associated with OA densities is an order of magnitude lower than that with BC densities and reaches a minimum with an OA density of ∼ 1.20–1.30 g cm−3. The R2 at each OA density remains around 0.62. The results suggest insignificant influence associated with the variation of OA density (in contrast to BC), and the selection of OA density of 1.30 g cm−3 is appropriate for the effective density calculation of ambient particles.
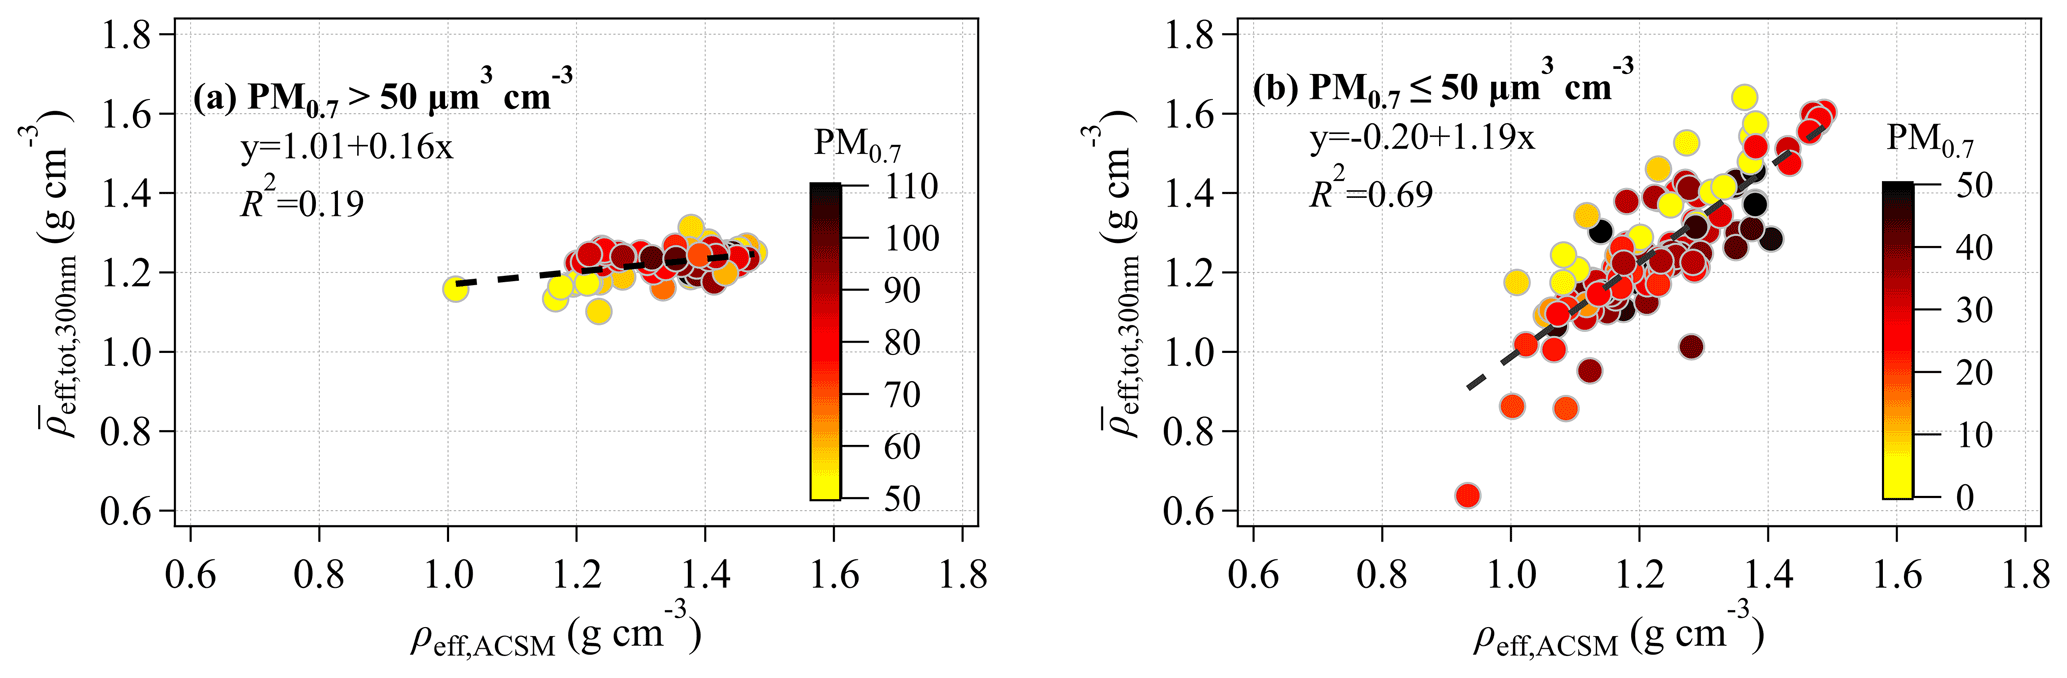
Figure 8Comparison of the average effective density of particles at 300 nm observed by DMA–CPMA–CPC () and ACSM-derived bulk effective density (ρeff,ACSM) under (a) more polluted (corresponding to PM0.7 > 50 µm3 cm−3) and (b) less polluted (corresponding to PM0.7 ≤ 50 µm3 cm−3) conditions. Colored circles represent PM0.7 volume concentrations.
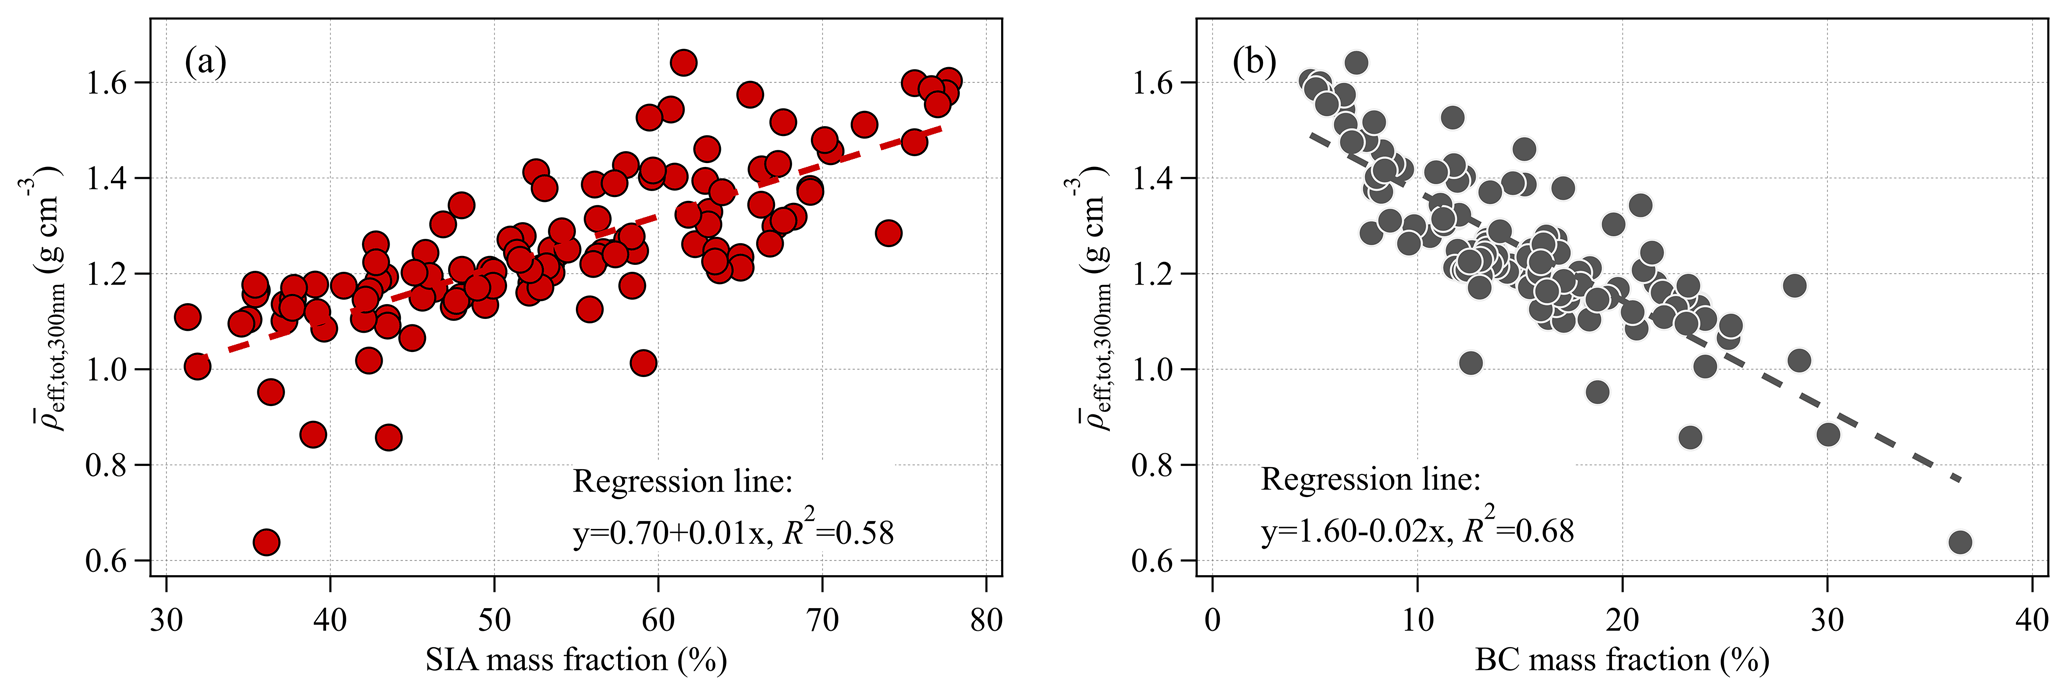
Figure 9Correlation between (a) SIA and (b) BC mass fraction with under the less polluted conditions.
As shown in Fig. 7b, while the majority of data points are clustered near the 1 : 1 line, there are some anomalous points that deviate from the 1 : 1 line. Applying the same PM0.7 threshold in Sect. 3.3 (PM0.7 volume concentration of 50 µm3 cm−3), the data sets can be separated into two groups: (i) a consistent pair with a slope of 1.16 and R2 of 0.69 for the less polluted conditions and (ii) an uncorrelated set with R2 of 0.19 for the more polluted conditions (Fig. 8). This implies that could be used as a proxy for bulk effective density under the less polluted conditions but not the more polluted conditions. A correlation analysis is then conducted to further evaluate the influence of chemical composition on the under the less polluted conditions. As shown in Fig. 9a, there is an obvious positive correlation (R2 = 0.58 and slope = 0.01) between and SIA mass fraction, indicating that particle densities are largely dependent on SIA, consistent with Yin et al. (2015) and G. Zhang et al. (2016). On the contrary, a notable negative correlation is observed between and BC mass fraction with R2 of 0.68 and slope of −0.02 (Fig. 9b). The magnitude of both the correlation coefficient and the slope for BC are higher than SIA, implying a stronger influence of BC on the effective density compared with SIA. This further confirms the importance and necessity of including BC in the estimates of effective density for ambient particles. In addition, the correlation is poor between and other chemical components.
To better indicate the variation of effective density with particle chemical composition, a sensitivity test is conducted based on arbitrarily assumed mass fractions for each component. Considering the major contribution of NH4NO3 in SIA, only one density of 1.73 g cm−3 is used for total SIA, and the test is thus performed with a three-component (SIA, BC, and OA) parameterization. The results are presented in Fig. 10, with the fractions of BC and SIA labeled on the x axis and y axis, respectively, whereas the fractions of OA could be deduced as the remainder. Calculated ρeff spreads from 0.60 to 1.73 g cm−3, corresponding to 100 % of BC and SIA, respectively, similar to the measured range of 0.64–1.64 g cm−3 for . In general, ρeff increases as the BC fraction decreases or SIA fraction increases. It is interesting to note that ρeff is more sensitive to BC as the fraction of BC decreases. In addition, when the BC fraction < 30 %, as is generally observed in ambient conditions (Ding et al., 2016; Yang et al., 2011), ρeff is much more sensitive to the changes in BC fractions rather than SIA fractions, consistent with the results based on the correlation analysis under the less polluted conditions.
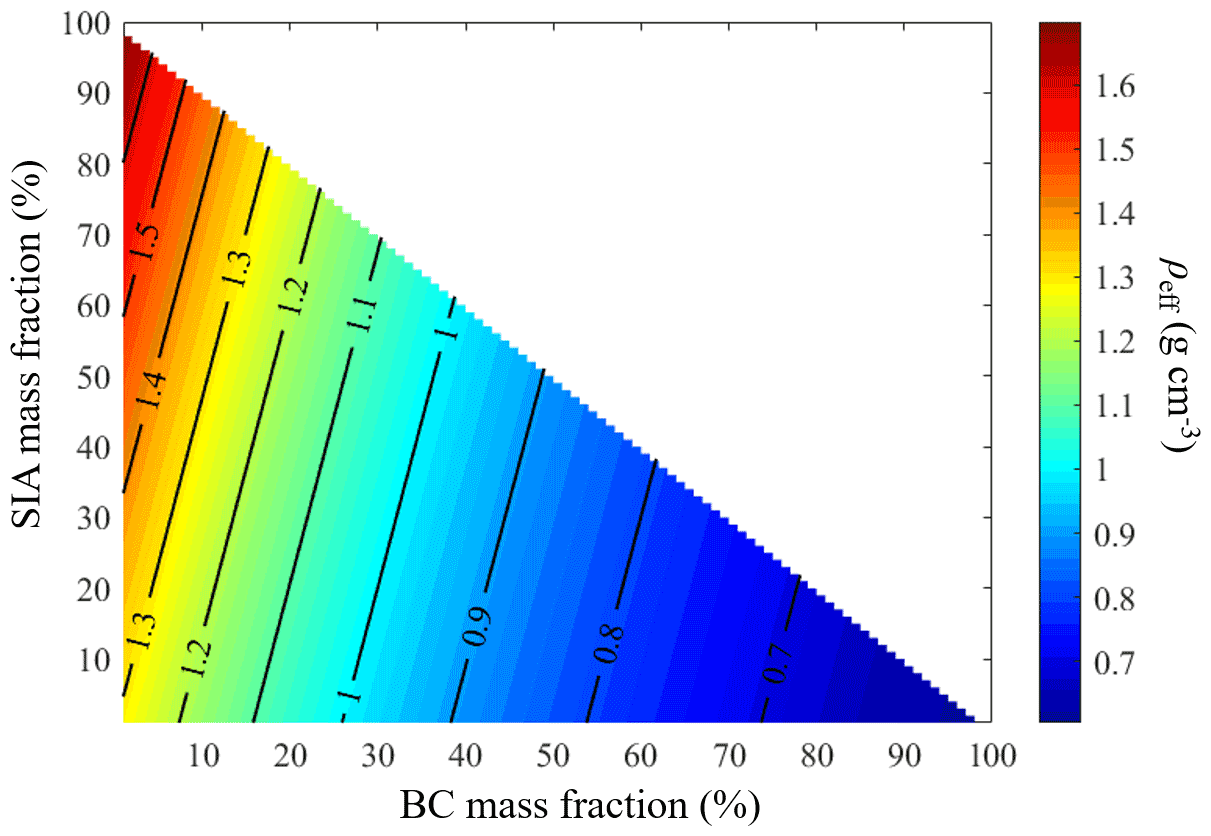
Figure 10Particle effective density (ρeff) calculation based on assumed chemical composition.
In the case of the more polluted conditions, is concentrated close to 1.20 g cm−3 with a standard deviation of 0.04, while ρeff,ACSM varies in the range of 1.17–1.47 g cm−3 (∼ 0 %–22 % higher than ). The difference can be attributed to the discrepancies in chemical composition between bulk PM1 and particles with size of 300 nm. Compared with the less polluted conditions, an increase of 12.8 % in SIA mass fraction (dominated by NH4NO3) and a decrease of 4.6 % in BC mass fraction in bulk PM1 are observed during the more polluted periods (Fig. S21). The mass concentration of SIA increased from 16 to 50 µg m−3, and most of the additional mass might be added to particles with size larger than 300 nm (Yan et al., 2021). This could be indicated by the change in particle volume size distribution (Fig. S17), which shows a decrease in volume fraction for particles with size < 300 nm in PM0.7 from 43 % under the less polluted conditions to 29 % under the more polluted conditions. This shift towards larger particles under the more polluted conditions makes the difference in chemical composition between PM1 and particles that are 300 nm in size noticeable and thus results in the inconsistency between and ρeff,ACSM.
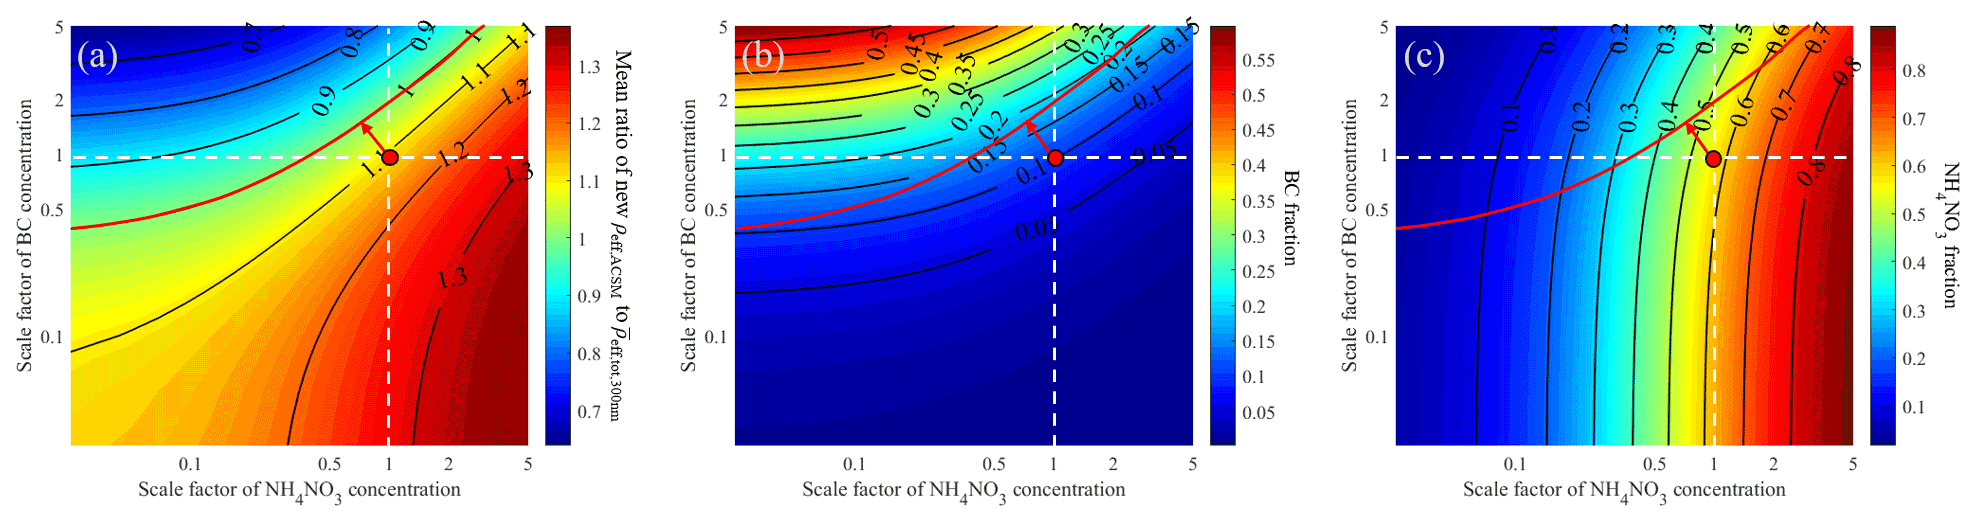
Figure 11(a) Mean ratio of new calculated ρeff,ACSM versus measured based on a scale factor of NH4NO3 and BC mass concentrations ranging from 0.01 to 5 (at logarithmic scale), (b) the corresponding BC mass fraction, and (c) the corresponding NH4NO3 mass fraction under the more polluted conditions. The black lines represent contours with the same values. The vertical and horizonal dotted white lines represent NH4NO3 and BC mass concentration at the scale factor of 1, respectively, and the red circles are the original mass concentrations of BC and NH4NO3.
Since NH4NO3 and BC exhibit the largest difference between the more polluted and the less polluted conditions (Fig. S21), a sensitivity study with scale factors ranging from 0.01 to 5 applied for the two components is performed for the more polluted conditions to help explain the discrepancy between and ρeff,ACSM (Fig. 8a). Figure 11 shows the ratios of new calculated ρeff,ACSM versus and the new fractions of NH4NO3 and BC in bulk PM1 obtained with different scale factors. The original mean fractions of NH4NO3 and BC in bulk PM1 under the more polluted conditions are 56.3 % and 11.2 %, respectively (shown as red circles in Fig. 11). Assuming the increase in NH4NO3 occurs mainly in particles with sizes larger than 300 nm, the “true” fraction of NH4NO3 in particles with size of 300 nm would decrease while that of BC would increase (a shift toward the top left of the plots from the original position in Fig. 11). Consequently, the discrepancy between ρeff,ACSM and would be reduced, with the ratios of newly derived ρeff,ACSM versus being close to 1.
Effective density, as one of the most important physical properties of atmospheric aerosol particles, is closely related with particle morphology and chemical composition. Here we report size-resolved particle effective densities observed during McFAN in autumn 2019 at a rural site over the North China Plain area and their evolution associated with emissions and aging processes.
With a newly developed flexible Gaussian fit algorithm, frequent bimodal distribution of particle effective density is identified, including a sub-density mode and a main density mode, accounting for 77 %–87 % of total observations. The number fraction of the sub-density mode particles (Fsub) is 22 %–27 % for particle sizes from 50 to 300 nm. The prevalence of the sub-density mode is mainly related to freshly emitted black carbon (BC). Opposite size-dependent trends are found for the geometric mean of the main and sub-density modes ( and ). increasing from 1.18 g cm−3 (50 nm) to 1.37 g cm−3 (300 nm) is attributed to a larger fraction of high-density components in particles and a more significant restructuring effect at large particle sizes, while decreasing from 0.89 g cm−3 (50 nm) to 0.62 g cm−3 (300 nm) is mainly ascribed to the agglomerate effect of BC. There are also obvious diurnal cycles for both and , with a maximum in the early afternoon and a relatively low level at night. The high effective density in the afternoon could be attributed to the increased mass fraction of high material density components associated with secondary aerosol production. Both meteorological conditions and pollution levels may affect particle effective density. Air masses with sufficient aging processes leading to higher and and lower Fsub. in the more polluted periods are lower than those in the less polluted periods, while the difference in is insignificant.
To investigate the impact of chemical composition, the average effective density of particles at 300 nm () is compared with the ACSM-derived bulk effective density (ρeff,ACSM). The best agreement between and ρeff,ACSM is achieved with an assumed BC effective density of 0.6 g cm−3. The comparison between ρeff,ACSM and is different for the more polluted conditions and the less polluted conditions. Under the less polluted conditions, is well correlated with ρeff,ACSM with a slope close to 1, while is concentrated at 1.20 g cm−3 but ρeff,ACSM varies from 1.17 to 1.47 g cm−3 under the more polluted conditions. The poor comparison under the more polluted conditions is likely to stem from the relatively large discrepancy in chemical composition between bulk PM1 and 300 nm particles. Based on the correlation between and individual particle chemical components, the mass fractions of secondary inorganic aerosol (SIA) and BC are found to be the major factors determining particle effective densities. Moreover, the influence of BC on the effective density is even stronger than that of SIA, implying the importance of including BC in the estimate of ambient particle effective densities.
The data used in this study are available from the corresponding author upon reasonable request.
The supplement related to this article is available online at: https://doi.org/10.5194/acp-22-2029-2022-supplement.
NM and QW designed this research. YC, HS, QZ, PF, NM, and QW planned the McFAN campaign. YaZ, CC, JT, JH, LX, SZ, LP, YH, YuZ, and GL conducted the field measurements with support from ZW, PC, WX, UK, and GZ. YaZ performed the data analysis. NM and QW contributed to the data analysis and interpretation. The written article was prepared by YaZ, NM, QW, and ZW with input from all other co-authors.
The contact author has declared that neither they nor their co-authors have any competing interests.
Publisher's note: Copernicus Publications remains neutral with regard to jurisdictional claims in published maps and institutional affiliations.
This research has been supported by the National Natural Science Foundation of China (grant nos. 41877303 and 41907182); the Foundation of State Key Laboratory of Loess and Quaternary Geology, Institute of Earth Environment, CAS (grant no. SKLLOG2029); the Guangdong Innovative and Entrepreneurial Research Team Program (research team on atmospheric environmental roles and effects of carbonaceous species, grant no. 2016ZT06N263); and the Special Fund Project for Science and Technology Innovation Strategy of Guangdong Province (grant no. 2019B121205004).
This paper was edited by Tuukka Petäjä and reviewed by two anonymous referees.
Abegglen, M., Durdina, L., Brem, B., Wang, J., Rindlisbacher, T., Corbin, J., Lohmann, U., and Sierau, B.: Effective density and mass–mobility exponents of particulate matter in aircraft turbine exhaust: Dependence on engine thrust and particle size, J. Aerosol Sci., 88, 135–147, https://doi.org/10.1016/j.jaerosci.2015.06.003, 2015.
Bahreini, R., Keywood, M. D., Ng, N. L., Varutbangkul, V., Gao, S., Flagan, R. C., Seinfeld, J. H., Worsnop, D., and Jimenez, J.: Measurements of secondary organic aerosol from oxidation of cycloalkenes, terpenes, and m-xylene using an Aerodyne aerosol mass spectrometer, Environ. Sci. Technol., 39, 5674–5688, https://doi.org/10.1021/es048061a, 2005.
Baron, P. A. and Willeke, K.: Aerosol measurement: Principles, techniques and applications, 2nd edn., John Wiley and Sons, New York, ISBN 0471356360, 2001.
Cha, Y. and Olofsson, U.: Effective density of airborne particles in a railway tunnel from field measurements of mobility and aerodynamic size distributions, Aerosol Sci. Tech., 52, 886–899, https://doi.org/10.1080/02786826.2018.1476750, 2018.
Cheng, Y. F., Su, H., Rose, D., Gunthe, S. S., Berghof, M., Wehner, B., Achtert, P., Nowak, A., Takegawa, N., Kondo, Y., Shiraiwa, M., Gong, Y. G., Shao, M., Hu, M., Zhu, T., Zhang, Y. H., Carmichael, G. R., Wiedensohler, A., Andreae, M. O., and Pöschl, U.: Size-resolved measurement of the mixing state of soot in the megacity Beijing, China: diurnal cycle, aging and parameterization, Atmos. Chem. Phys., 12, 4477–4491, https://doi.org/10.5194/acp-12-4477-2012, 2012.
Dinar, E., Mentel, T. F., and Rudich, Y.: The density of humic acids and humic like substances (HULIS) from fresh and aged wood burning and pollution aerosol particles, Atmos. Chem. Phys., 6, 5213–5224, https://doi.org/10.5194/acp-6-5213-2006, 2006.
Ding, A., Huang, X., Nie, W., Sun, J., Kerminen, V. M., Petäjä, T., Su, H., Cheng, Y., Yang, X. Q., Wang, M., Chi, X., Wang, J., Virkkula, A., Guo, W., Yuan, J., Wang, S., Zhang, R., Wu, Y., Song, Y., Zhu, T., Zilitinkevich, S., Kulmala, M., and Fu, C.: Enhanced haze pollution by black carbon in megacities in China, Geophys. Res. Lett., 43, 2873–2879, https://doi.org/10.1002/2016GL067745, 2016.
Ditas, J., Ma, N., Zhang, Y., Assmann, D., Neumaier, M., Riede, H., Karu, E., Williams, J., Scharffe, D., Wang, Q., Saturno, J., Schwarz, J. P., Katich, J. M., McMeeking, G. R., Zahn, A., Hermann, M., Brenninkmeijer, C. A. M., Andreae, M. O., Poschl, U., Su, H., and Cheng, Y.: Strong impact of wildfires on the abundance and aging of black carbon in the lowermost stratosphere, P. Natl. Acad. Sci. USA, 115, E11595–E11603, https://doi.org/10.1073/pnas.1806868115, 2018.
Dockery, D. W. and Pope, C. A.: Acute respiratory effects of particulate air pollution, Annu. Rev. Publ. Health., 15, 107–132, https://doi.org/10.1146/annurev.pu.15.050194.000543, 1994.
Drinovec, L., Močnik, G., Zotter, P., Prévôt, A. S. H., Ruckstuhl, C., Coz, E., Rupakheti, M., Sciare, J., Müller, T., Wiedensohler, A., and Hansen, A. D. A.: The “dual-spot” Aethalometer: an improved measurement of aerosol black carbon with real-time loading compensation, Atmos. Meas. Tech., 8, 1965–1979, https://doi.org/10.5194/amt-8-1965-2015, 2015.
Fuchs, N.: On the stationary charge distribution on aerosol particles in a bipolar ionic atmosphere, Pure. Appl. Geophys., 56, 185–193, https://doi.org/10.1007/BF01993343, 1963.
Geller, M., Biswas, S., and Sioutas, C.: Determination of particle effective density in urban environments with a differential mobility analyzer and aerosol particle mass analyzer, Aerosol Sci. Tech., 40, 709–723, https://doi.org/10.1080/02786820600803925, 2006.
George, I. J. and Abbatt, J. P. D.: Chemical evolution of secondary organic aerosol from OH-initiated heterogeneous oxidation, Atmos. Chem. Phys., 10, 5551–5563, https://doi.org/10.5194/acp-10-5551-2010, 2010.
Ghazi, R. and Olfert, J.: Coating mass dependence of soot aggregate restructuring due to coatings of oleic acid and dioctyl sebacate, Aerosol Sci. Tech., 47, 192–200, https://doi.org/10.1080/02786826.2012.741273, 2013.
Hallquist, M., Wenger, J. C., Baltensperger, U., Rudich, Y., Simpson, D., Claeys, M., Dommen, J., Donahue, N. M., George, C., Goldstein, A. H., Hamilton, J. F., Herrmann, H., Hoffmann, T., Iinuma, Y., Jang, M., Jenkin, M. E., Jimenez, J. L., Kiendler-Scharr, A., Maenhaut, W., McFiggans, G., Mentel, Th. F., Monod, A., Prévôt, A. S. H., Seinfeld, J. H., Surratt, J. D., Szmigielski, R., and Wildt, J.: The formation, properties and impact of secondary organic aerosol: current and emerging issues, Atmos. Chem. Phys., 9, 5155–5236, https://doi.org/10.5194/acp-9-5155-2009, 2009.
Hu, M., Peng, J., Sun, K., Yue, D., Guo, S., Wiedensohler, A., and Wu, Z.: Estimation of size-resolved ambient particle density based on the measurement of aerosol number, mass, and chemical size distributions in the winter in Beijing, Environ. Sci. Technol., 46, 9941–9947, https://doi.org/10.1021/es204073t, 2012.
Huang, R.-J., Wang, Y., Cao, J., Lin, C., Duan, J., Chen, Q., Li, Y., Gu, Y., Yan, J., Xu, W., Fröhlich, R., Canonaco, F., Bozzetti, C., Ovadnevaite, J., Ceburnis, D., Canagaratna, M. R., Jayne, J., Worsnop, D. R., El-Haddad, I., Prévôt, A. S. H., and O'Dowd, C. D.: Primary emissions versus secondary formation of fine particulate matter in the most polluted city (Shijiazhuang) in North China, Atmos. Chem. Phys., 19, 2283–2298, https://doi.org/10.5194/acp-19-2283-2019, 2019.
IPCC: Climate Change 2007: Synthesis Report. Contribution of Working Groups I, II and III to the Fourth Assessment Report of the Intergovernmental Panel on Climate Change, Core Writing Team, edited by: Pachauri, R. K. and Reisinger, A., IPCC, Geneva, Switzerland, 104 pp., ISBN 92-9169-122-4, 2007.
Kelly, W. and McMurry, P. H.: Measurement of particle density by inertial classification of differential mobility analyzer–generated monodisperse aerosols, Aerosol Sci. Tech., 17, 199–212, https://doi.org/10.1080/02786829208959571, 1992.
Kostenidou, E., Pathak, R. K., and Pandis, S. N.: An algorithm for the calculation of secondary organic aerosol density combining AMS and SMPS data, Aerosol Sci. Tech., 41, 1002–1010, https://doi.org/10.1080/02786820701666270, 2007.
Kuwata, M., Kondo, Y., and Takegawa, N.: Critical condensed mass for activation of black carbon as cloud condensation nuclei in Tokyo, J. Geophys. Res.-Atmos., 114, D20202, https://doi.org/10.1029/2009JD012086, 2009.
Laden, F., Neas, L. M., Dockery, D. W., and Schwartz, J.: Association of fine particulate matter from different sources with daily mortality in six US cities, Environ. Health. Persp., 108, 941–947, https://doi.org/10.1289/ehp.00108941, 2000.
Lee, B. P., Li, Y. J., Flagan, R. C., Lo, C., and Chan, C. K.: Sizing characterization of the fast-mobility particle sizer (FMPS) against SMPS and HR-ToF-AMS, Aerosol Sci. Tech., 47, 1030–1037, https://doi.org/10.1080/02786826.2013.810809, 2013.
Levy, M. E., Zhang, R., Khalizov, A. F., Zheng, J., Collins, D. R., Glen, C. R., Wang, Y., Yu, X. Y., Luke, W., Jayne, J. T., and Olaguer, E.: Measurements of submicron aerosols in Houston, Texas during the 2009 SHARP field campaign, J. Geophys. Res.-Atmos., 118, 10518–10534, https://doi.org/10.1002/jgrd.50785, 2013.
Levy, M. E., Zhang, R., Zheng, J., Tan, H., Wang, Y., Molina, L. T., Takahama, S., Russell, L., and Li, G.: Measurements of submicron aerosols at the California–Mexico border during the Cal–Mex 2010 field campaign, Atmos. Environ., 88, 308–319, https://doi.org/10.1016/j.atmosenv.2013.08.062, 2014.
Li, C., Hu, Y., Chen, J., Ma, Z., Ye, X., Yang, X., Wang, L., Wang, X., and Mellouki, A.: Physiochemical properties of carbonaceous aerosol from agricultural residue burning: Density, volatility, and hygroscopicity, Atmos. Environ., 140, 94–105, https://doi.org/10.1016/j.atmosenv.2016.05.052, 2016.
Li, G., Su, H., Ma, N., Tao, J., Kuang, Y., Wang, Q., Hong, J., Zhang, Y., Kuhn, U., Zhang, S., Pan, X., Lu, N., Tang, M., Zheng, G., Wang, Z., Gao, Y., Cheng, P., Xu, W., Zhou, G., Zhao, C., Yuan, B., Shao, M., Ding, A., Zhang, Q., Fu, P., Sun, Y., Poschl, U., and Cheng, Y.: Multiphase chemistry experiment in Fogs and Aerosols in the North China Plain (McFAN): integrated analysis and intensive winter campaign 2018, Faraday Discuss., 226, 207–222, https://doi.org/10.1039/d0fd00099j, 2021.
Li, H., Zhang, Q., Zhang, Q., Chen, C., Wang, L., Wei, Z., Zhou, S., Parworth, C., Zheng, B., Canonaco, F., Prévôt, A. S. H., Chen, P., Zhang, H., Wallington, T. J., and He, K.: Wintertime aerosol chemistry and haze evolution in an extremely polluted city of the North China Plain: significant contribution from coal and biomass combustion, Atmos. Chem. Phys., 17, 4751–4768, https://doi.org/10.5194/acp-17-4751-2017, 2017.
Li, J., Cao, L., Gao, W., He, L., Yan, Y., He, Y., Pan, Y., Ji, D., Liu, Z., and Wang, Y.: Seasonal variations in the highly time-resolved aerosol composition, sources and chemical processes of background submicron particles in the North China Plain, Atmos. Chem. Phys., 21, 4521–4539, https://doi.org/10.5194/acp-21-4521-2021, 2021.
Lin, Y., Bahreini, R., Zimmerman, S., Fofie, E. A., Asa-Awuku, A., Park, K., Lee, S.-B., Bae, G.-N., and Jung, H. S.: Investigation of ambient aerosol effective density with and without using a catalytic stripper, Atmos. Environ., 187, 84–92, https://doi.org/10.1016/j.atmosenv.2018.05.063, 2018.
Ma, N., Zhao, C. S., Müller, T., Cheng, Y. F., Liu, P. F., Deng, Z. Z., Xu, W. Y., Ran, L., Nekat, B., van Pinxteren, D., Gnauk, T., Müller, K., Herrmann, H., Yan, P., Zhou, X. J., and Wiedensohler, A.: A new method to determine the mixing state of light absorbing carbonaceous using the measured aerosol optical properties and number size distributions, Atmos. Chem. Phys., 12, 2381–2397, https://doi.org/10.5194/acp-12-2381-2012, 2012.
Ma, Y., Li, S., Zheng, J., Khalizov, A., Wang, X., Wang, Z., and Zhou, Y.: Size-resolved measurements of mixing state and cloud-nucleating ability of aerosols in Nanjing, China, J. Geophys. Res.-Atmos., 122, 9430–9450, https://doi.org/10.1002/2017JD026583, 2017.
Ma, Y., Huang, C., Jabbour, H., Zheng, Z., Wang, Y., Jiang, Y., Zhu, W., Ge, X., Collier, S., and Zheng, J.: Mixing state and light absorption enhancement of black carbon aerosols in summertime Nanjing, China, Atmos. Environ., 222, 117141, https://doi.org/10.1016/j.atmosenv.2019.117141, 2020.
Malloy, Q. G., Nakao, S., Qi, L., Austin, R., Stothers, C., Hagino, H., and Cocker III, D. R.: Real-time aerosol density determination utilizing a modified scanning mobility particle sizer–aerosol particle mass analyzer system, Aerosol Sci. Tech., 43, 673–678, https://doi.org/10.1080/02786820902832960, 2009.
McMurry, P. H., Wang, X., Park, K., and Ehara, K.: The relationship between mass and mobility for atmospheric particles: A new technique for measuring particle density, Aerosol Sci. Tech., 36, 227–238, https://doi.org/10.1080/027868202753504083, 2002.
Momenimovahed, A. and Olfert, J. S.: Effective Density and Volatility of Particles Emitted from Gasoline Direct Injection Vehicles and Implications for Particle Mass Measurement, Aerosol Sci. Tech., 49, 1051–1062, https://doi.org/10.1080/02786826.2015.1094181, 2015.
Morawska, L., Johnson, G., Ristovski, Z. D., and Agranovski, V.: Relation between particle mass and number for submicrometer airborne particles, Atmos. Environ., 33, 1983–1990, https://doi.org/10.1016/S1352-2310(98)00433-6, 1999.
Mulholland, G. W., Bryner, N. P., and Croarkin, C.: Measurement of the 100 nm NIST SRM 1963 by Differential Mobility Analysis, Aerosol Sci. Tech., 31, 39–55, https://doi.org/10.1080/027868299304345, 1999.
Nakao, S., Shrivastava, M., Nguyen, A., Jung, H., and Cocker III, D.: Interpretation of secondary organic aerosol formation from diesel exhaust photooxidation in an environmental chamber, Aerosol Sci. Tech., 45, 964–972, https://doi.org/10.1080/02786826.2011.573510, 2011.
Ng, N. L., Herndon, S. C., Trimborn, A., Canagaratna, M. R., Croteau, P., Onasch, T. B., Sueper, D., Worsnop, D. R., Zhang, Q., Sun, Y., and Jayne, J.: An Aerosol Chemical Speciation Monitor (ACSM) for routine monitoring of the composition and mass concentrations of ambient aerosol, Aerosol Sci. Tech., 45, 780–794, https://doi.org/10.1080/02786826.2011.560211, 2011.
Nosko, O. and Olofsson, U.: Effective density of airborne wear particles from car brake materials, J. Aerosol Sci., 107, 94–106, https://doi.org/10.1016/j.jaerosci.2017.02.014, 2017.
Olfert, J. and Rogak, S.: Universal relations between soot effective density and primary particle size for common combustion sources, Aerosol Sci. Tech., 53, 485–492, https://doi.org/10.1080/02786826.2019.1577949, 2019.
Olfert, J., Symonds, J., and Collings, N.: The effective density and fractal dimension of particles emitted from a light-duty diesel vehicle with a diesel oxidation catalyst, J. Aerosol Sci., 38, 69–82, https://doi.org/10.1016/j.jaerosci.2006.10.002, 2007.
Olfert, J. S., Dickau, M., Momenimovahed, A., Saffaripour, M., Thomson, K., Smallwood, G., Stettler, M. E., Boies, A., Sevcenco, Y., and Crayford, A.: Effective density and volatility of particles sampled from a helicopter gas turbine engine, Aerosol Sci. Tech., 51, 704–714, https://doi.org/10.1080/02786826.2017.1292346, 2017.
Pagels, J., Khalizov, A. F., McMurry, P. H., and Zhang, R. Y.: Processing of soot by controlled sulphuric acid and water condensation – nMass and mobility relationship, Aerosol Sci. Tech., 43, 629–640, https://doi.org/10.1080/02786820902810685, 2009.
Park, K., Cao, F., Kittelson, D. B., and McMurry, P. H.: Relationship between particle mass and mobility for diesel exhaust particles, Environ. Sci. Technol., 37, 577–583, https://doi.org/10.1021/es025960v, 2003.
Peng, J., Hu, M., Guo, S., Du, Z., Zheng, J., Shang, D., Zamora, M. L., Zeng, L., Shao, M., Wu, Y.-S., Zheng, J., Wang, Y., Glen, C., Collins, D., Molina, M., and Zhang, R.: Markedly enhanced absorption and direct radiative forcing of black carbon under polluted urban environments, P. Natl. Acad. Sci. USA, 113, 4266–4271, https://doi.org/10.1073/pnas.1602310113, 2016.
Peng, L., Li, Z., Zhang, G., Bi, X., Hu, W., Tang, M., Wang, X., and Sheng, G.: A review of measurement techniques for aerosol effective density, Sci. Total Environ., 778, 146248, https://doi.org/10.1016/j.scitotenv.2021.146248, 2021.
Qiao, K., Wu, Z., Pei, X., Liu, Q., Shang, D., Zheng, J., Du, Z., Zhu, W., Wu, Y., Lou, S., Guo, S., Chan, C. K., Pathak, R. K., Hallquist, M., and Hu, M.: Size-resolved effective density of submicron particles during summertime in the rural atmosphere of Beijing, China, J. Environ. Sci., 73, 69–77, https://doi.org/10.1016/j.jes.2018.01.012, 2018.
Rissler, J., Messing, M. E., Malik, A. I., Nilsson, P. T., Nordin, E. Z., Bohgard, M., Sanati, M., and Pagels, J. H.: Effective density characterization of soot agglomerates from various sources and comparison to aggregation theory, Aerosol Sci. Tech., 47, 792–805, https://doi.org/10.1080/02786826.2013.791381, 2013.
Rissler, J., Nordin, E. Z., Eriksson, A. C., Nilsson, P. T., Frosch, M., Sporre, M. K., Wierzbicka, A., Svenningsson, B., Löndahl, J., Messing, M. E., Sjogren, S., Hemmingsen, J. G., Loft, S., Pagels, J. H., and Swietlicki, E.: Effective density and mixing state of aerosol particles in a near-traffic urban environment, Environ. Sci. Technol., 48, 6300–6308, https://doi.org/10.1021/es5000353, 2014.
Schmid, O., Karg, E., Hagen, D. E., Whitefield, P. D., and Ferron, G. A.: On the effective density of non-spherical particles as derived from combined measurements of aerodynamic and mobility equivalent size, J. Aerosol Sci., 38, 431–443, https://doi.org/10.1016/j.jaerosci.2007.01.002, 2007.
Spencer, M. T., Shields, L. G., and Prather, K. A.: Simultaneous measurement of the effective density and chemical composition of ambient aerosol particles, Environ. Sci. Technol., 41, 1303–1309, https://doi.org/10.1021/es061425+, 2007.
Su, H., Cheng, Y., and Poschl, U.: New multiphase chemical processes influencing atmospheric aerosols, air quality, and climate in the anthropocene, Accounts. Chem. Res., 53, 2034–2043, https://doi.org/10.1021/acs.accounts.0c00246, 2020.
Symonds, J. P. R., Reavell, K. S. J., and Olfert, J. S.: The CPMA-Electrometer System – A Suspended Particle Mass Concentration Standard, Aerosol Sci. Tech., 47, i–iv, https://doi.org/10.1080/02786826.2013.801547, 2013.
Tavakoli, F. and Olfert, J. S.: Determination of particle mass, effective density, mass–mobility exponent, and dynamic shape factor using an aerodynamic aerosol classifier and a differential mobility analyzer in tandem, J. Aerosol Sci., 75, 35–42, https://doi.org/10.1016/j.jaerosci.2014.04.010, 2014.
Taylor, B. N. and Kuyatt, C. E.: Guidelines for evaluating and expressing the uncertainty of NIST measurement results, US Department of Commerce, National Institute of Standards and Technology, Gaithersburg, https://www.nist.gov/pml/nist-technical-note-1297 (last access: 9 February 2022), 1994.
Turpin, B. J. and Lim, H.-J.: Species contributions to PM2.5 mass concentrations: Revisiting common assumptions for estimating organic mass, Aerosol Sci. Tech., 35, 602–610, https://doi.org/10.1080/02786820119445, 2001.
Ubogu, E. A., Cronly, J., Khandelwal, B., and Roy, S.: Determination of the effective density and fractal dimension of PM emissions from an aircraft auxiliary power unit, J. Environ. Sci., 74, 11–18, https://doi.org/10.1016/j.jes.2018.01.027, 2018.
von der Weiden, S.-L., Drewnick, F., and Borrmann, S.: Particle Loss Calculator – a new software tool for the assessment of the performance of aerosol inlet systems, Atmos. Meas. Tech., 2, 479–494, https://doi.org/10.5194/amt-2-479-2009, 2009.
Wang, M., Tang, Q., Mei, J., and You, X.: On the effective density of soot particles in premixed ethylene flames, Combust. Flame, 198, 428–435, https://doi.org/10.1016/j.combustflame.2018.10.004, 2018.
Wiedensohler, A.: An approximation of the bipolar charge distribution for particles in the submicron size range, J. Aerosol Sci., 19, 387–389, https://doi.org/10.1016/0021-8502(88)90278-9, 1988.
Wu, Y., Xia, Y., Huang, R., Deng, Z., Tian, P., Xia, X., and Zhang, R.: A study of the morphology and effective density of externally mixed black carbon aerosols in ambient air using a size-resolved single-particle soot photometer (SP2), Atmos. Meas. Tech., 12, 4347–4359, https://doi.org/10.5194/amt-12-4347-2019, 2019.
Xie, Y., Ye, X., Ma, Z., Tao, Y., Wang, R., Zhang, C., Yang, X., Chen, J., and Chen, H.: Insight into winter haze formation mechanisms based on aerosol hygroscopicity and effective density measurements, Atmos. Chem. Phys., 17, 7277–7290, https://doi.org/10.5194/acp-17-7277-2017, 2017.
Yan, Y., Liu, Z., Gao, W., Li, J., Zhang, X., Chai, W., Bai, J., Hu, B., and Wang, Y.: Physiochemistry characteristics and sources of submicron aerosols at the background area of North China Plain: Implication of air pollution control in heating season, Atmos. Res., 249, 105291, https://doi.org/10.1016/j.atmosres.2020.105291, 2021.
Yang, F., Tan, J., Zhao, Q., Du, Z., He, K., Ma, Y., Duan, F., Chen, G., and Zhao, Q.: Characteristics of PM2.5 speciation in representative megacities and across China, Atmos. Chem. Phys., 11, 5207–5219, https://doi.org/10.5194/acp-11-5207-2011, 2011.
Yin, Z., Ye, X., Jiang, S., Tao, Y., Shi, Y., Yang, X., and Chen, J.: Size-resolved effective density of urban aerosols in Shanghai, Atmos. Environ., 100, 133–140, https://doi.org/10.1016/j.atmosenv.2014.10.055, 2015.
Yuan, C., Zheng, J., Ma, Y., Jiang, Y., Li, Y., and Wang, Z.: Significant restructuring and light absorption enhancement of black carbon particles by ammonium nitrate coating, Environ. Pollut., 262, 114172, https://doi.org/10.1016/j.envpol.2020.114172, 2020.
Zamora, M. L., Peng, J., Hu, M., Guo, S., Marrero-Ortiz, W., Shang, D., Zheng, J., Du, Z., Wu, Z., and Zhang, R.: Wintertime aerosol properties in Beijing, Atmos. Chem. Phys., 19, 14329–14338, https://doi.org/10.5194/acp-19-14329-2019, 2019.
Zhai, J., Lu, X., Li, L., Zhang, Q., Zhang, C., Chen, H., Yang, X., and Chen, J.: Size-resolved chemical composition, effective density, and optical properties of biomass burning particles, Atmos. Chem. Phys., 17, 7481–7493, https://doi.org/10.5194/acp-17-7481-2017, 2017.
Zhang, G., Bi, X., Qiu, N., Han, B., Lin, Q., Peng, L., Chen, D., Wang, X., Peng, P., Sheng, G., and Zhou, Z.: The real part of the refractive indices and effective densities for chemically segregated ambient aerosols in Guangzhou measured by a single-particle aerosol mass spectrometer, Atmos. Chem. Phys., 16, 2631–2640, https://doi.org/10.5194/acp-16-2631-2016, 2016.
Zhang, R., Khalizov, A. F., Pagels, J., Zhang, D., Xue, H., and McMurry, P. H.: Variability in morphology, hygroscopicity, and optical properties of soot aerosols during atmospheric processing, P. Natl. Acad. Sci. USA, 105, 10291–10296, https://doi.org/10.1073/pnas.0804860105, 2008.
Zhang, Y., Zhang, Q., Cheng, Y., Su, H., Kecorius, S., Wang, Z., Wu, Z., Hu, M., Zhu, T., Wiedensohler, A., and He, K.: Measuring the morphology and density of internally mixed black carbon with SP2 and VTDMA: new insight into the absorption enhancement of black carbon in the atmosphere, Atmos. Meas. Tech., 9, 1833–1843, https://doi.org/10.5194/amt-9-1833-2016, 2016.
Zhang, Y., Su, H., Ma, N., Li, G., Kecorius, S., Wang, Z., Hu, M., Zhu, T., He, K., Wiedensohler, A., Zhang, Q., and Cheng, Y.: Sizing of Ambient particles from a single-particle soot photometer measurement to retrieve mixing state of black carbon at a regional site of the North China Plain, J. Geophys. Res.-Atmos., 123, 12778–12795, https://doi.org/10.1029/2018JD028810, 2018.