the Creative Commons Attribution 4.0 License.
the Creative Commons Attribution 4.0 License.
 | 09 Feb 2022
The impact of atmospheric blocking on the compounding effect of ozone pollution and temperature: a copula-based approach
Oscar E. Jurado
Tim Butler
Henning W. Rust
Ozone pollution and high temperatures have adverse health impacts that can be amplified by the combined effects of ozone and temperature. Moreover, changes in weather patterns are expected to alter ozone pollution episodes and temperature extremes. In particular, atmospheric blocking is a high-impact, large-scale phenomenon at mid-high latitudes that has been associated with temperature extremes. This study examines the impact of atmospheric blocking on the ozone and temperature dependence among measurement stations over Europe during the period 1999–2015. We use a copula-based method to model the dependence between the two variables under blocking and non-blocking conditions. This approach allows us to examine the impact of blocks on the joint probability distribution. Our results showed that blocks lead to increasing strength in the upper tail dependence of ozone and temperature extremes (> 95th percentile) in north-west and central Europe (e.g. the UK, Belgium, Netherlands, Luxembourg, Germany and the north-west of France). The analysis of the probability hazard scenarios revealed that blocks generally enhance the probability of compound ozone and temperature events by 20 % in a large number of stations over central Europe. The probability of ozone or temperature exceedances increases 30 % (on average) under the presence of atmospheric blocking. Furthermore, we found that, in a number of stations over north-western Europe, atmospheric blocking increases the probability of ozone exceedances by 30 % given high temperatures. Our results point out the strong influence of atmospheric blocking on the compounding effect of ozone and temperature events, suggesting that blocks might be considered a relevant predicting factor when assessing the risks of ozone-heat-related health effects.
- Article
(3330 KB) - Full-text XML
-
Supplement
(1807 KB) - BibTeX
- EndNote


Air pollution and heat waves pose a serious risk to health globally (Analitis et al., 2014; WHO, 2015) and evidence suggests that when extreme weather and air pollution episodes occur in coincidence, their health effects are nonlinearly amplified beyond the sum of their individual effects (Willers et al., 2016). Climate change is expected to increase the probability of heat extremes (Seneviratne et al., 2014) and alter air quality (Doherty et al., 2018). Tropospheric ozone is recognised as a harmful pollutant, with negative impacts not just on human health but also on ecosystems (EEA, 2019). Tropospheric ozone is a secondary pollutant formed from complex photochemical reactions of nitrogen oxides (NOx), carbon monoxide (CO) and volatile organic compounds (VOCs) (Seinfeld and Pandis, 2006). The combination of emissions of ozone precursors and specific weather conditions, such as high temperatures, low wind and persistent, slow-moving, high-pressure systems, favour high ozone pollution episodes (Jacob et al., 1993). Temperature has been identified as one of the main meteorological drivers of high ozone episodes in polluted regions over the USA (Porter et al., 2015) and most of central Europe (Otero et al., 2016).
Several studies examined the relationship between ozone and temperature extremes and their joint occurrences over the USA (Shen et al., 2016; Phalitnonkiat et al., 2018). Phalitnonkiat et al. (2018) measured the joint extremal dependence of ozone and temperature using the spectral dependence of their extremes. They found that temperature and ozone were, overall, well correlated across many areas across the USA, but noted a reduced correlation when examining the tail of the distribution. Schnell and Prather (2017) examined the co-occurrence of extreme temperatures and air pollution (ozone and fine particulate matter) and found temperature extremes to be consistently associated in space and time with high levels of ozone over the contiguous USA. Sun et al. (2017) estimated a 50 % conditional probability of high ozone levels given the high temperatures in the north-eastern USA, whereas less than 20 % was found in the western USA. Zhang et al. (2017) compared ozone levels during extreme and non-extreme weather events and reported higher ozone levels during extreme weather events, including heat waves, atmospheric stagnation and their compound extremes over the USA. Specifically, they pointed out an enhancement of ozone concentrations when heat waves and atmospheric stagnation events occur simultaneously. Recently, Hertig et al. (2020) analysed combined episodes of heat and ozone pollution waves in two European regions (Germany and Portugal) and their association with mortality rates. This study confirmed the strong impact of compounded heat–ozone waves on excess mortality rates in those regions.
The co-occurrence of extremes is known as a combination of extreme events, which can potentially have a greater impact than independent hazard events (Zscheischler and Seneviratne, 2017). The compounding effects from high temperature and ozone pollution levels greatly increase the risk to human health (Hertig et al., 2020). Furthermore, the extremes of temperature and high ozone episodes might be exacerbated by underlying climatological drivers (Schnell and Prather, 2017). Large-scale atmospheric circulation is a key driving factor of the variability of surface meteorological variables, including air temperature and extreme temperature events (Pfahl, 2014) and plays an important role in air quality (Russo et al., 2014; Hertig et al., 2020). Extreme weather events are closely linked to anomalies of the atmospheric circulation that can be categorised as “weather regimes”, such as cyclones and atmospheric blocking (Pfahl, 2014). For instance, the extreme temperatures and lack of precipitation during the summer of 2003 in Europe have been related to the persistent anticyclonic conditions over central Europe (Fink et al., 2004; Solberg et al., 2008). This particular episode led to exceptionally long-lasting and spatially extensive periods of high levels of ozone pollution over Europe (Fiala et al., 2003). Dole et al. (2011) suggested that the persistent blocking of westerly flow was essential during the 2010 heatwave in Russia that killed tens of thousands of people.
Atmospheric blocking is a large-scale phenomenon defined by persistent anticyclones that interrupt the westerly flow in mid-latitudes (Barriopedro et al., 2006), and has been associated with extreme temperature events (Sillmann et al., 2011; Brunner et al., 2017). Pfahl and Wernli (2012) showed that warm temperature extremes often co-occur with atmospheric blocking at the same location and, recently, Röthlisberger and Martius (2019) found that atmospheric blocking also increases the persistence of periods with hot and dry weather conditions that occur concomitantly during summer. A few studies have examined the impact of blocks on air pollution. Ordóñez et al. (2017) focused on the regional responses of the maximum daily average of 8 h ozone (MDA8O3) to the persistence of blocks and ridges over Europe. They showed that blocks within the European sector (defined as 0–30∘ E) led to positive anomalies of MDA8O3 over central Europe in spring and summer and found that a considerable proportion of the variability of MDA8O3 exceedances could be explained by blocking patterns. Cai et al. (2020) analysed the influence of persistent blocking conditions on several high pollution episodes of fine particulate matter over northern China. They showed that blocking structures lead to 62.5 % of persistent air pollution events in that location during winter and pointed out that blocks might be used as an indication of persistent heavy air pollution.
The significant linkage between warm extremes and blocking and the strong temperature dependence of ozone motivates the present work, which is aimed at assessing the impact of persistent blocks on the compounding effect of ozone and temperature over Europe. Although previous studies have examined the relationship between extremes of surface ozone and temperature (Schnell and Prather, 2017) and have provided a comprehensive analysis of seasonal impacts of blocks on European surface ozone pollution (e.g. Ordóñez et al., 2017), we present, for the first time (to the authors' knowledge), a quantification of the effect of blocks on the co-occurrence of temperature and ozone exceedances over Europe. To do so we propose a copula-modelling approach in order to (i) model the dependence structure between high ozone concentrations and high temperatures under blocking and non-blocking conditions and (ii) quantify the impact atmospheric blocking on the joint probabilities of exceedances derived from the copulas. In the context of multivariate processes that may lead to compound events, the application of copula-based probability has been widely used recently (e.g. Hao et al., 2018, and references therein). Copula-based methods have been extensively applied in hydrological extremes (Salvadori and Michelle, 2010; Hao et al., 2018) and provide a flexible method of construction for a joint distribution with arbitrary marginal distributions (AghaKouchak et al., 2014). Copulas describe the dependence between random variables (Nelsen, 2006) and, besides characterising the overall dependence structure, certain copula families allow the upper tail dependence to be measured, which is particularly important for assessing extreme events (Zscheischler and Seneviratne, 2017; Serinaldi, 2016). Therefore, with the main goal of estimating the effects of atmospheric blocking on the relationship between ozone and temperature, we apply a copula-based approach that allows us to quantify the influence of atmospheric blocking on the upper tail of the joint distribution of ozone and temperature.
Daily maxima of the 8 h average (MDA8O3) of ozone concentrations were extracted from the European Environment Agency's air quality database (AirBase) (https://www.eea.europa.eu/data-and-maps/data/, last access: October 2019) during the period 1999–2015 focusing on the ozone season that spans from April to September. The ozone season refers to a period of time in which surface ozone levels typically reach the highest concentrations (e.g. Schnell and Prather, 2017; Otero et al., 2018). A total of 300 background monitoring stations, including rural, urban and suburban, with altitude < 1000 m and with at least 75 % valid data available for each ozone season, were used. The number of stations for which measurements are available vary greatly in space, with the major density of stations being over central Europe. However, a representative number of stations over northern and southern Europe are also included (Fig. S1 in the Supplement).
The daily maximum temperature was derived from the 6-hourly 2 m temperature values extracted from the ERA-Interim (Dee et al., 2011) reanalysis of the European Centre for Medium-range Weather Forecasts (ECMWF) for the same period, 1999–2015. The temperature dataset was available at 1∘ × 1∘ regular (latitude/longitude) resolution. The daily 500 hPa geopotential height (Z500) field was obtained from the ERA-Interim reanalysis at a coarser horizontal resolution of 2.5∘ × 2.5∘ (latitude/longitude), which is appropriate for characterising large-scale atmospheric circulation.
2.1 Blocking detection
A two-dimensional blocking index (BI) derived from daily Z500 was used to identify instantaneously blocked grid points. This blocking index is calculated according to the one-dimensional index proposed by Tibaldi and Molteni (1990) but expanded to every latitude and longitude (Scherrer et al., 2006). Similar to Barnes et al. (2012), we apply a spatio-temporal filter that allows the exclusion of small-scale and short-term blocking situations accounting for large-scale and persistent systems between 35 and 80∘N. Thus, we select contiguously blocked regions with a minimum zonal and meridional extension of 15∘ and an area of at least 1.5 × 10×106 km2. A persistent blocking event is considered if the duration of the blocking system lasts a minimum of 4 d. In addition, the tracking algorithm includes possible merging and splittings of the blocking event in time by adopting a blocking overlap area criterion of 7.5 × 10⁶ km2 between 2 consecutive days and a maximum distance between blocking centres of 1000 km (Schuster et al., 2019). The blocking index was calculated using the “Free Evaluation System Framework” (Kadow et al., 2021), which is a framework for scientific data processing designed for atmospheric applications that includes (among other features) software for the calculation of the BI; details about this method are given in Richling et al. (2015).
2.2 Joint distribution analysis
Recently, copula-based approaches have become very popular for assessing interrelations between several random variables (Ribeiro et al., 2019; Salvadori et al., 2016; Hao et al., 2018). A copula is a joint distribution function in which the marginal distributions are independent of the dependence structure and can be modelled separately (Nelsen, 2006). For two random variables X (temperature) and Y (MDA8O3) with marginal distributions and respectively, a copula function allows their joint cumulative distribution to be constructed as follows:
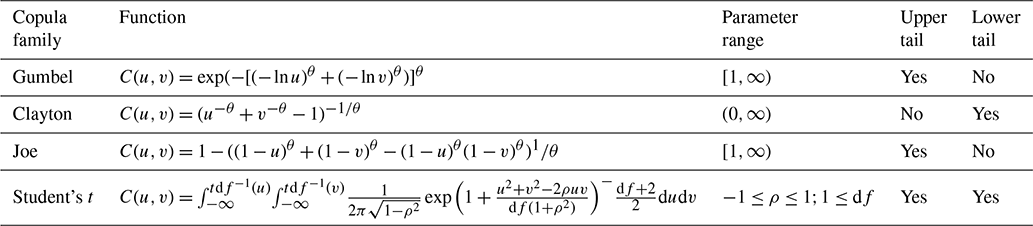
where FXY is the joint distribution function of X and Y, C is the copula function and u=FX and v=FY are the uniformly distributed marginals. According to Sklar's theorem, if the marginal distributions are continuous, then the copula function C is unique (Sklar, 1996). The main advantage then of using copula functions is the flexibility to model the dependence between multiple random variables that follow arbitrary univariate marginal distributions. For each station, we use bivariate copulas to model the dependence between temperature and ozone and estimate their joint probability distribution under two different synoptic situations: (1) when there is a co-located block in the same location of MDA8O3 and temperature (i.e. BI =1), (2) without the presence of blocking (i.e. BI =0). We fit a total of four commonly used copulas: Student t (from the Archimedean family), Clayton, Gumbel and Joe (from the elliptical family) (Table 1). The Archimedean copulas are able to describe asymmetric tail behaviour, whereas elliptical copulas capture symmetric dependence (Tilloy et al., 2019). Among the different copulas, we selected the structures that are able to capture tail dependence; Gumbel and Joe copulas model upper tail dependence, whereas Clayton can capture lower tail dependence (Salvadori and Michelle, 2010). The Student t copula allows dependence in both upper and lower tails. Before modelling the joint probability distribution, we fit the most appropriate marginal distribution for both temperature and MDA8O3, including Gaussian, gamma, Weibull and lognormal distributions. The parameters for the marginal distribution were obtained by the maximum likelihood method separately for each site. The marginal distributions were selected using the Kolmogorov–Smirnov goodness-of-fit test. Then, for each station and synoptic case (BI =1 and BI =0), the bivariate copulas were selected based on Akaike's Information Criteria (AIC) (Akaike, 1974) and the copula parameters were estimated via maximum likelihood estimation (MLE). The copula analyses were carried out with the VineCopula and the copula R packages (Schepsmeier et al., 2016; Hofert et al., 2020).
Table 1Equations of the copula functions, where u and v are univariate variables (uniformly distributed), θ and ρ are the dependence parameters and df is the degree of freedom.
The copula models were used to assess the relationship between temperature and ozone exceedances under blocking (BI =1) and non-blocking (BI =0) conditions by constructing the corresponding joint probability distribution (P(X≤x, Y≤y)). Apart from the general dependence structure, some copulas can measure the dependence of the extremes through the tail dependence parameter (λu) (Nelsen, 2006). As linear or rank dependence measures might not be accurate when focusing on extremes (Hao and Singh, 2016), we have further assessed the upper tail dependence of ozone and temperature extremes derived from the copulas under blocking (BI =1) and non-blocking (BI =0). We estimate the probability of a compound event at each station, in which Tmax and MDA8O3 exceed the 95th percentile of their respective distributions. It is important to note that the 95th percentile for each variable is calculated over the whole distribution of the ozone season, from April to September, for the period of study, i.e. 1999–2015. Therefore, the compound extremes at each station are defined based on a relative threshold value, defined for each station as a function of the 95th percentile over the whole distribution (i.e. including non-blocked and blocked days) of the corresponding variable (i.e. temperature and ozone). This choice was made in order to quantify the impact of blocks on the probability of exceedances, for which the definition of extreme changes depending on the station. Precisely, the use of absolute thresholds allows us to quantify the impact of blocks on the probability of exceedances. The probability of exceedances over a certain multivariate threshold was examined based on three different hazard scenarios described by the following joint and conditional joint probabilities, which can be expressed using copula notation (see further details in Serinaldi, 2015):
The probabilities in Eqs. (2) and (3) have been widely applied in the literature to assess compound extremes (Zscheischler and Seneviratne, 2017; Hao et al., 2018). Equation (2) represents the scenario in which both variables, temperature (Tmax) and ozone (MDA8O3), exceed the 95th percentile, whereas Eq. (3) considers a situation wherein the events occurred when temperature or ozone or both exceed their respective threshold (95th). As blocks normally lead to persistent positive surface temperature anomalies during summer over Europe (Pfahl and Wernli, 2012), it is of interest to evaluate the influence of blocking on the probability of ozone exceedances given high temperatures, which is assessed in the COND scenario.
To quantify the significant impact of blocks on the compound ozone and temperature events, we estimated the differences between the probabilities derived from the copulas (i.e. ). Then, we assessed whether the difference between the probabilities when BI =1 and BI =0 are significantly different from zero. To do so, we apply a bootstrap procedure for each probability scenario (i.e. AND, OR, COND) in which we drew 100 bootstrapped samples and derived the respective probabilities P1 and P0 when BI =1 and BI =0, respectively. For the null hypothesis (H0), there is no difference between the probabilities obtained from the cases BI =1 and BI =0, while the alternative hypothesis indicates that the probability of an extreme event conditioned to a blocking situation is significantly different from the probability under non-blocking conditions.
We begin our analysis by examining the frequency of atmospheric blocking over Europe for the period of study. Afterwards, we analyse the effect of atmospheric blocking separately for MDA8O3 and Tmax in order to analyse the impact of blocks on the margins. In addition, we examine the influence of blocking on the statistical correlations between MDA8O3 and Tmax before modelling the dependence structure using the copula approach. Thus, we first provide exploratory analysis and then continue with the risk assessment through the joint probability derived from the copulas.
3.1 Impact of atmospheric blocking on ozone and temperature
For the period of study (1999–2015) a total of 3111 d were analysed during the ozone season (April–September). The blocking frequency (% of days) ranges between 5 % in the southern latitudes (30–45∘ N) and 14 % in the northern latitudes (60–70∘ N) (Fig. S1). In central Europe, where the density of stations is higher, the frequency of blocked days is ∼ 8 %. Typically, blocking presents a well-established climatology in terms of frequency in the North Hemisphere, being more frequent in winter and spring, and less frequent in autumn (Barnes et al., 2012; Wollings et al., 2018). During summer, blocking events have shown a tendency to occur at high latitudes over continental areas (Barriopedro et al., 2010). In contrast to previous related studies analysing the seasonal responses of air pollution to blocks (Ordóñez et al., 2017; Garrido-Perez et al., 2017), our study focuses on the whole ozone season during which the compounding effect of ozone and temperature is particularly relevant for human health (Hertig et al., 2020). Moreover, atmospheric blocking events are likely to have a major impact owing to their connection with heatwaves in spring and summer (Brunner et al., 2017).
We start by examining the individual impacts of blocks on the anomalies of ozone and temperature, in order to establish a comparison of anomalies across different stations. MDA8O3 anomalies were calculated as the difference between MDA8O3 values and the average of MDA8O3 over all the days in April–September during the period of study, i.e. 1999–2015. This average is obtained individually for every station. Tmax anomalies were similarly calculated with respect to the average value over all Tmax values from April to September during the same period. It is important to highlight that all calculations were applied separately for each station, and therefore, the number of blocking days might differ across the different stations. Figure 1 illustrates the composites of the anomalies of both MDA8O3 and Tmax during blocking days (BI =1). In general, most of the stations show positive anomalies of MDA8O3 under blocking days (Fig. 1a). The strongest positive anomalies > 30 µg m−3 are observed over the south of Germany, north-east of France and north-west of Italy, whereas weaker anomalies are found over Scandinavia, the west of the UK and the north of Spain. Similarly, Ordóñez et al. (2017) reported strong positive anomalies over large areas of central and northern Europe in spring and summer respectively. In the case of temperature anomalies, blocks led to positive anomalies of Tmax over all of the stations included in this study (Fig. 1b). The largest values of temperature anomalies (> 7 ∘C) are observed over the central and western stations (north-east of France, Austria and the south of Germany). This is consistent with the radiative heating due to enhanced clear sky conditions over continental areas under atmospheric blocking conditions, especially in summertime (Brunner et al., 2017).
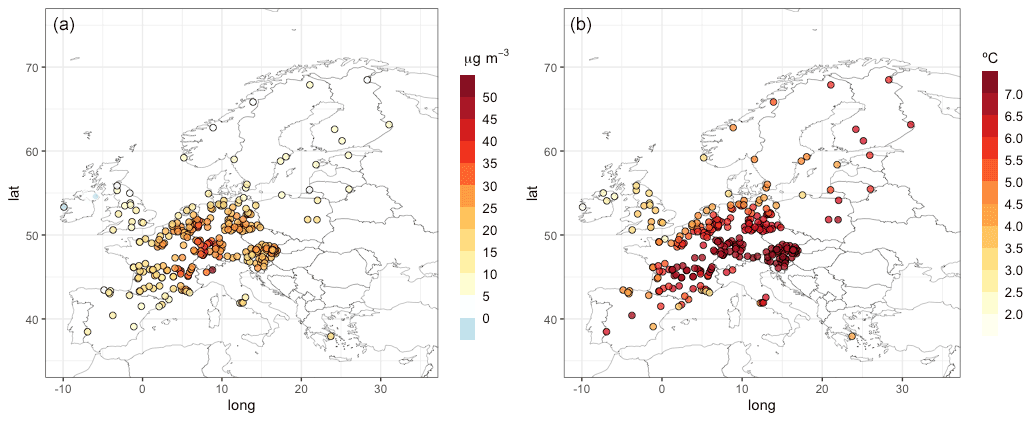
Figure 1Anomalies of MDAO3 (a) and Tmax (b) for blocking days (i.e. BI =1). Anomalies of MDAO3 were calculated with respect to the MDAO3 concentrations over the whole period 1999–2015 during the ozone season, April–September. Similarly, anomalies of temperature were obtained with respect to the temperature over the whole period of study (as for MDAO3). Black contour indicates statistically significant anomalies at the 95 % confidence level of a two-sided t test.
We further examined the impact of blocking on individual extremes of ozone and temperature. To this end, we do not work with anomalies but, instead, fix a threshold for MDA8O3 as well as Tmax. The absolute values for these thresholds vary among stations. A transparent way to set these thresholds are quantiles, i.e. values with a specified non-exceedance probability. For each station, we use the 0.95 quantile (or 95th percentile) from the sample restricted to April to September and thus get individual thresholds for all stations reflecting their local climatology. Thus, we define days with MDA8O3 exceeding this threshold as extreme days. Then, we obtain relative frequencies by dividing the number of extreme days with a simultaneous blocking by the number of total days in the data set restricted to April to September (i.e. . A similar approach was applied in Ordóñez et al. (2017) and calculated the percentage of blocking days with MDA8O3 values above the 90th percentile. It must be noted that the spatial variability of high levels of ozone is very heterogeneous (Fig. S2). The 95th percentile of MDA8O3 exceeds the European target value of MDA8O3 (120 µg m−3, EEA, 2019) in a large number of stations in central and southern Europe. Only in the case of northern stations (UK and Scandinavia), would MDA8O3 not often exceed the mentioned target value (Fig. S2).
The same procedure using the 95th percentile was applied to identify days of Tmax exceedances and days above the 95th percentile of the Tmax (Fig. S2) were classified as exceedances. We acknowledge that, in the case of Tmax, the number of exceedances above the 95th percentile might not be equally distributed across the ozone season (i.e. this threshold is more likely to be exceeded in July and August than it is in April and September). Although this could be corrected by either using a threshold that varies seasonally or by removing the seasonal trend in the data, we would like to stress that the main goal of this study is to quantify the impacts of blocking on the upper-tail dependence between MDA8O3 and Tmax over the entire ozone season. Our main interest is in the physiological effects of such compound events, for which only absolutely high temperatures (as they tend to occur in July or August) are relevant. Similar to other studies (e.g. Schnell and Prather, 2017), we use the 95th percentile over the period between April and September. A lower threshold, e.g. the 90th percentile, would lead to many temperature values not being physiologically relevant; a higher threshold, e.g. the 99th percentile, on the other hand, would lead to a strong reduction in the data available for the subsequent copula modelling. The 95th percentile-based definition for examining the individual impacts of blocks on MDA8O3 and Tmax is also justified to be consistent with the joint probability analysis, for which the 95th percentile is applied for the risk assessment (see below). Moreover, earlier studies used a similar threshold percentile-based definition to assess the links between temperature extremes and atmospheric blocking (Pfahl and Wernli, 2012).
Figure 2 illustrates the frequency of blocked single extremes of ozone and temperature (i.e. the percentage of exceedances of MDA8O3 and Tmax with respect to the total number of blocked days). More than 40 % of MDA8O3 extremes coincide with blocked days over most of the central stations. The frequency of blocked days of MDA8O3 extremes is generally lower in the southern stations. The percentage of Tmax extremes coincident with blocks increases northwards and eastwards, which is consistent with subsidence processes and the clear-sky radiative forcing associated with summer blocking events (Pfahl and Wernli, 2012; Sousa et al., 2018). Moreover, as stated above, the strong seasonal variability of the blocking activity in the Northern Hemisphere must be noted with a reduced number of occurrences late in summer and autumn but being considerably more frequent in eastern Europe than in the Euro-Atlantic region (Barriopedro et al., 2006). This pattern is also reflected in our results that show the largest number of blocked temperature extremes north and eastwards.
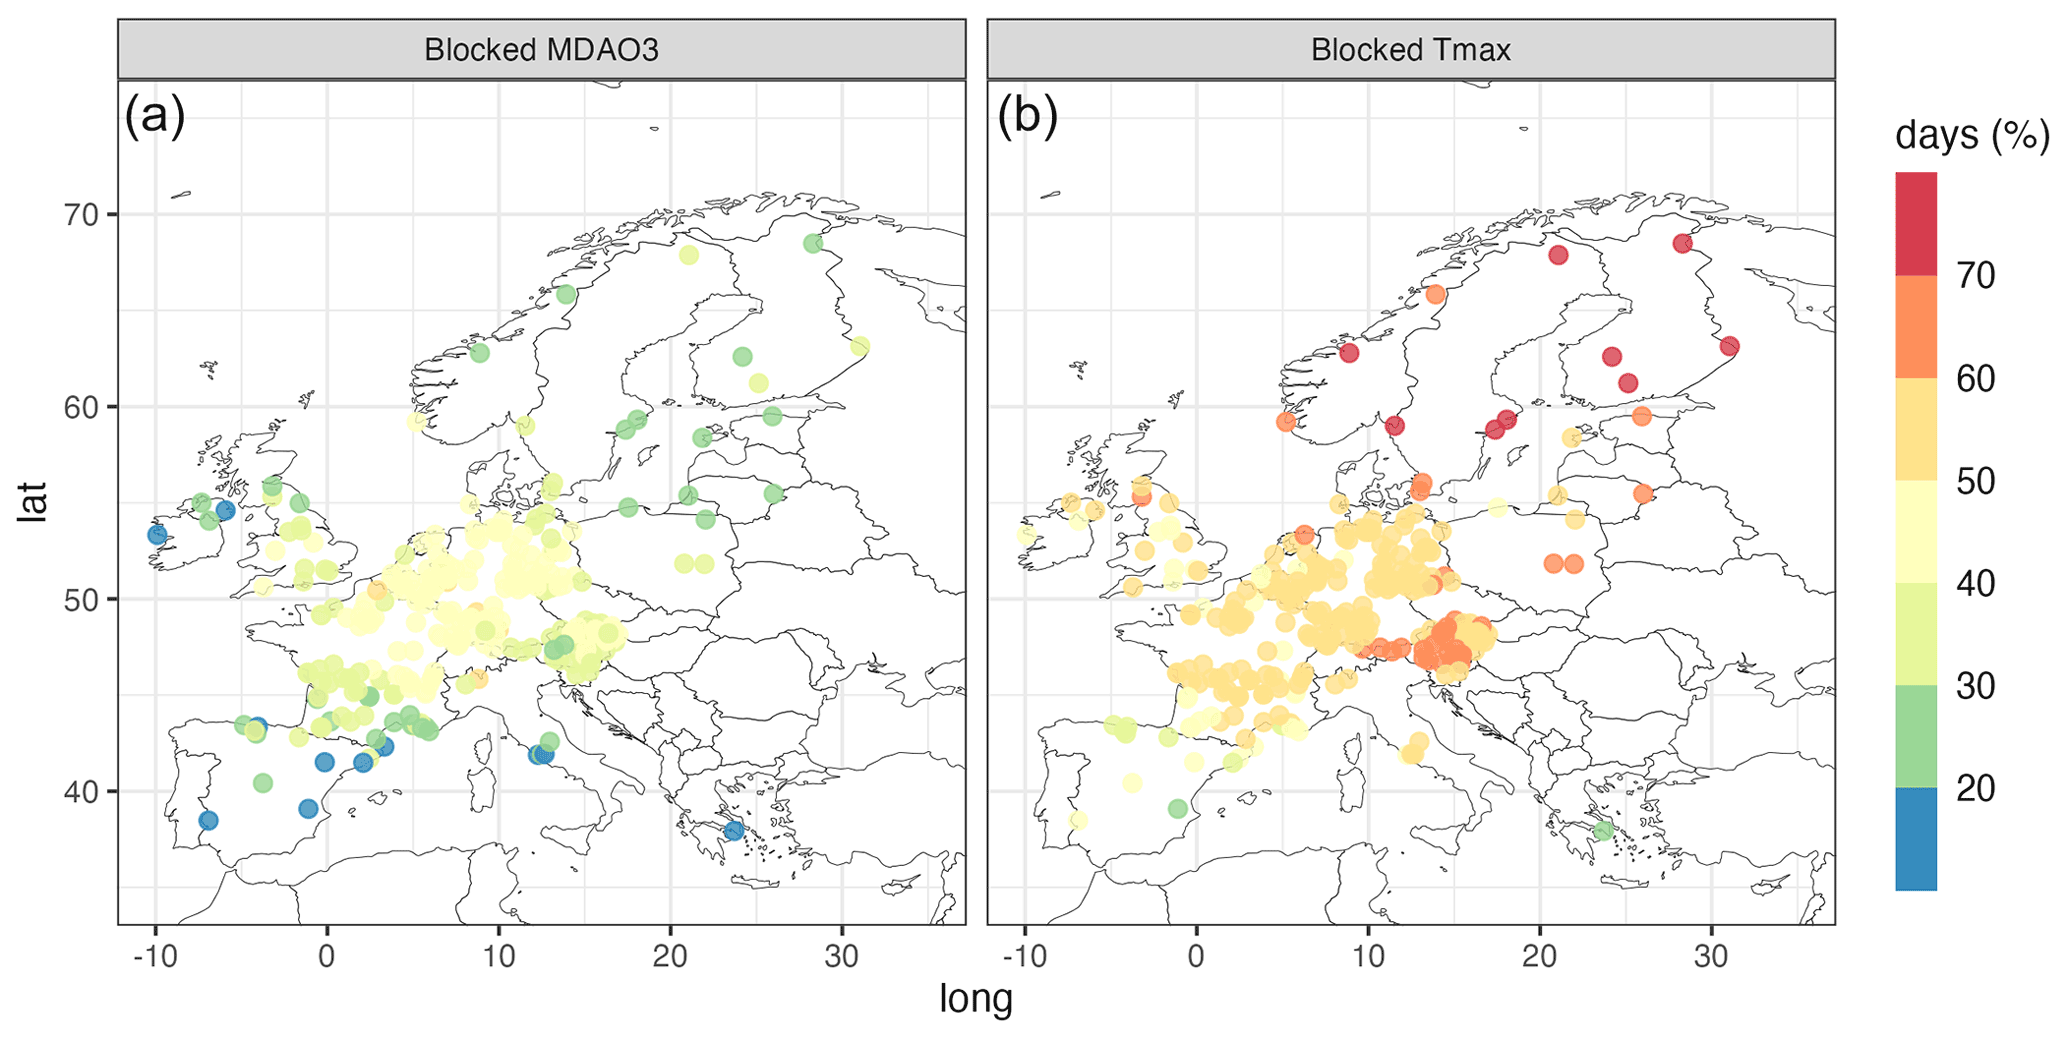
Figure 2Percentage of days with MDA8O3 (a) and Tmax (b) exceedances (> 95th) that are blocked days.
To investigate the impact of blocks on the relationship between MDA8O3 and Tmax, Kendall's tau coefficient (τ) was calculated during blocking and non-blocking days as well as the difference between the correlations obtained when BI =1 and BI =0 (Fig. 3a and b). The correlations are weaker under non-blocking days (BI =0) and a few northern stations show negative values (Fig. 3a). In general, the dependence between MDA8O3 and Tmax is higher under the influence of blocks. The positive differences between the correlation values (Fig. 3b) clearly reflect the strong impact of blocks at most of the stations. The largest differences are found over the north-west of Europe. Consistent with previous work, the central stations show the strongest relationship between ozone and temperature (Otero et al., 2016), which significantly increases when BI =1 with the largest correlation values (> 0.6). Blocks seem to have a great influence over the north-west of Europe in particular, the UK, the north of France and the Benelux countries (i.e. Belgium, Netherlands and Luxembourg), where the correlations are higher and mostly positive under blocking conditions, whereas negative correlations are found under non-blocking conditions. A similar pattern was found when calculating the correlations for the respective extremes based on the 95th percentile that showed the strongest relationship under the influence of blocks over a large number of stations of France, Germany and the UK (Fig. S3). The impact of blocks in the relationship between MDA8O3 and Tmax is smaller in the south and north-east, which is reflected by non-significant and weaker correlations that show similar magnitude values when BI =1 and BI =0.
The results from the individual impacts of atmospheric blocking on MDA8O3 and Tmax are consistent with previous studies that showed the impacts of blocking on ozone (Ordóñez et al., 2017) and the association between blocking and temperature (e.g. Sousa et al., 2018; Sillmann et al., 2011; Pfahl and Wernli, 2012). Consistent with these works, we found notable spatial differences, with the largest blocking effects on the north-western and central stations and weaker impacts on the southern stations. Ordóñez et al. (2017) showed that sub-tropical ridges, an extension of the sub-tropical high pressure belt extending northwards (Sousa et al., 2018), had a major impact on surface ozone in the central-southern European sectors, especially in summer, whereas blocks showed a stronger impact in central and northern Europe in spring and summer, respectively. Nevertheless, they pointed out that the influence of ridges for the build-up of ozone pollution is not as clear as in the case of blocks, and its impact is more sensitive to the location. Using a similar catalogue to detect blocks and sub-tropical ridges, Sousa et al. (2018) showed that blocks play an important role in warm temperature anomalies in spring and summer over central Europe, whereas the impact is generally lower over the south, mostly because of the position of the block (Sousa et al., 2018). It must be noted that our detection method only focuses on blocks and, unlike the cited works, sub-tropical ridges were not included in this analysis. Despite this, our results are in good agreement with Sousa et al.'s findings and they also point out the spatial variability of the blocking effects on both MDA8O3 and Tmax. Previous work has shown a strong effect of NOx levels on the temperature sensitivity of ozone (Pusede et al., 2014; Coates et al., 2016; Otero et al., 2021). Owing to the relatively short atmospheric lifetime of NOx (order of hours), the combined effect of blocking and high temperature on ozone would be larger in areas close to strong NOx sources, such as large urban areas. Thus, we might anticipate spatial differences in the impact of blocks on the compound extremes of ozone and temperature and their joint distribution.
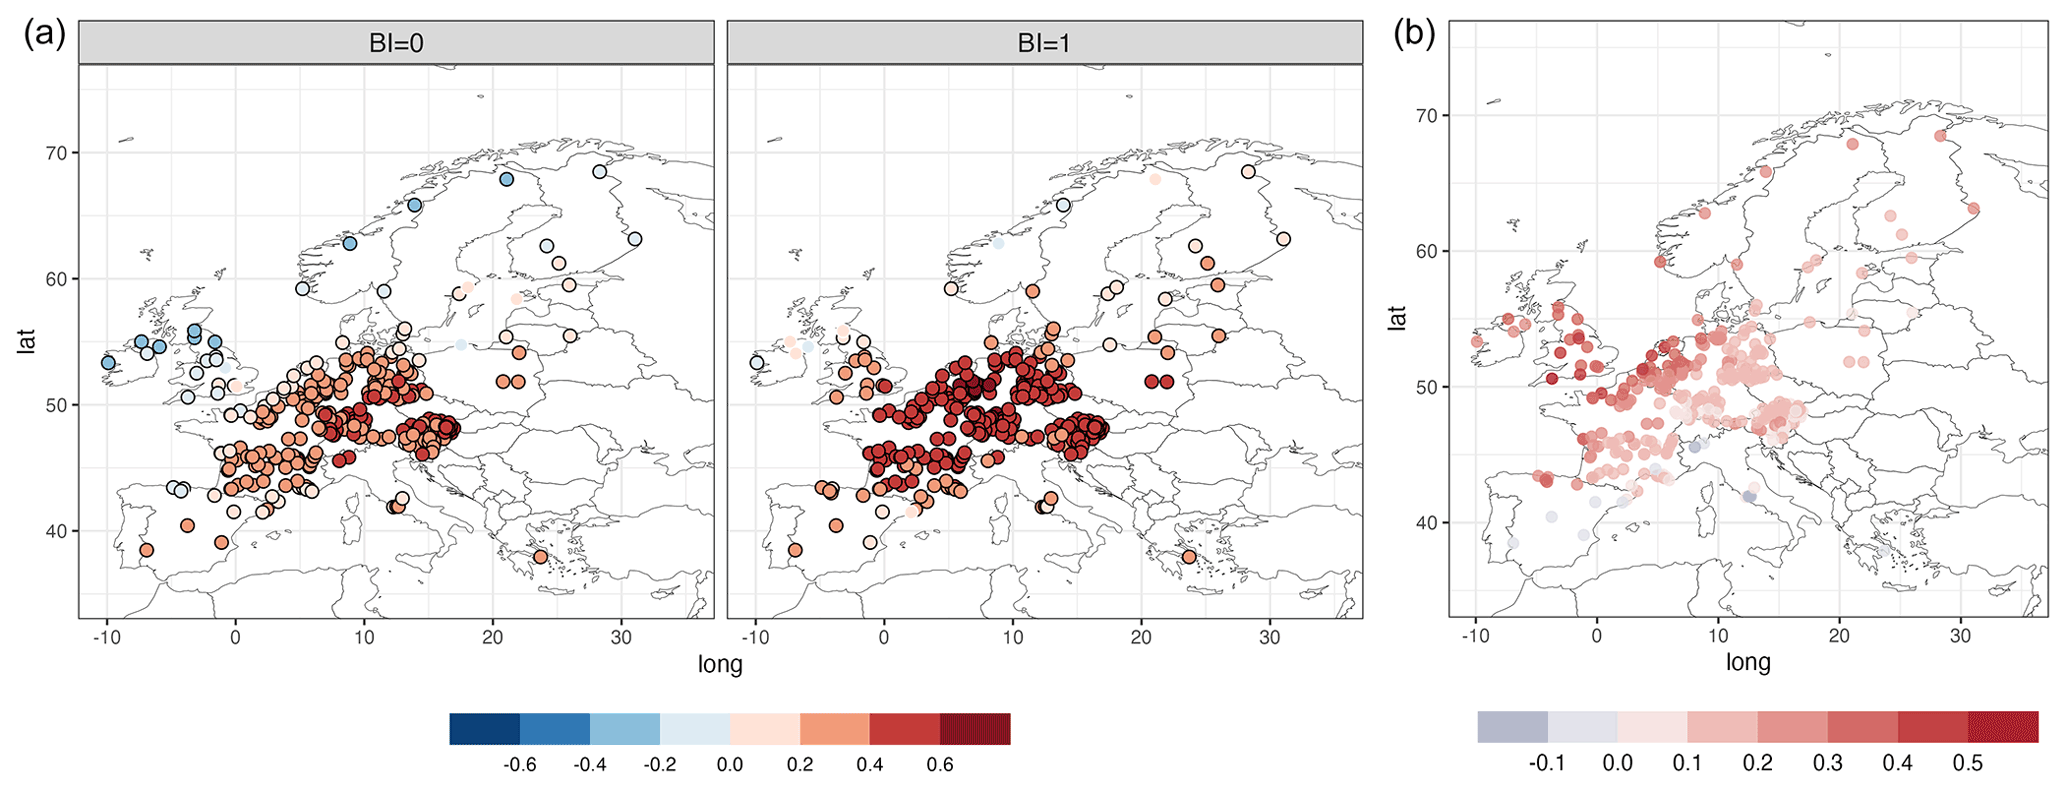
Figure 3(a) Spatial distribution of Kendall's correlation coefficient between MDA8O3 and Tmax under non-blocking conditions (i.e. BI =0) and blocking conditions (i.e. BI =1). Black contour indicates statistically significant anomalies at the 95 % confidence level of a two-sided t test. (b) Differences between the correlation values obtained when BI =1 minus the correlations when BI =0.
3.2 Copula results
In the previous section, we have shown, separately, the effects of atmospheric blocking on both MDA8O3 and Tmax, as well as the influence on their relationship through the correlation coefficients. Here, we present the results from the copula modelling analysis, which allow us not just to confirm the impacts of blocks on the structure dependence between MDA8O3 and Tmax previously shown but also to quantify the impacts of blocks on the compounding effect of both variables by estimating the joint probability of exceedances.
Among the different types of copulas presented in the literature, a total of four copulas (Table 1) were tested to find the most appropriate fit that characterises the relationship between MDA8O3 and Tmax at each station. Our copula choice was mainly motivated by their ability to represent joint tail dependence (upper and/or lower). After modelling the dependence between the two variables, when BI =1 and BI =0 separately, we quantify the effect of atmospheric blocking on compound extremes of ozone and temperature through the differences between probabilities derived from the cases mentioned above (BI =1 and BI =0) for each probability scenario. The impact of blocks on the joint behaviour between MDA8O3 and Tmax is reflected in the selected copula (Fig. S4). When BI =0, a large number of stations are characterised by an asymmetric dependence structure, as is the case of Joe and Gumbel copulas. The Gumbel copula is also selected in a number of stations when BI =1, but, in this case, the t copula is representative of a major number of stations. Contrary to the Gumbel and Joe copulas, the t copula belongs to the elliptical and radially symmetric copulas, but captures dependence in the extremes in both the lower and the upper tail (Nelsen, 2006). We further investigated the influence of blocks on the upper tail dependence parameter,λu, obtained from the chosen copulas. λu measures the tendency of concurrent extremes of MDA8O3 and Tmax exceeding the 95th percentile. According to Fig. 4, the strongest upper tail dependence occurs under the influence of blocks over north-west and central Europe (e.g. the UK, France, the Benelux countries and the north of Germany). The impact of blocks is particularly noticeable over the UK and the Benelux countries with an increase in the dependence of extremes when BI =1, which is well observed when plotting the differences between the values of λu obtained for both cases (Fig. 4b). This pattern is in agreement with the relationship obtained by Kendall's τ (Fig. S3), which shows a stronger relationship of extremes under the influence of blocking conditions.
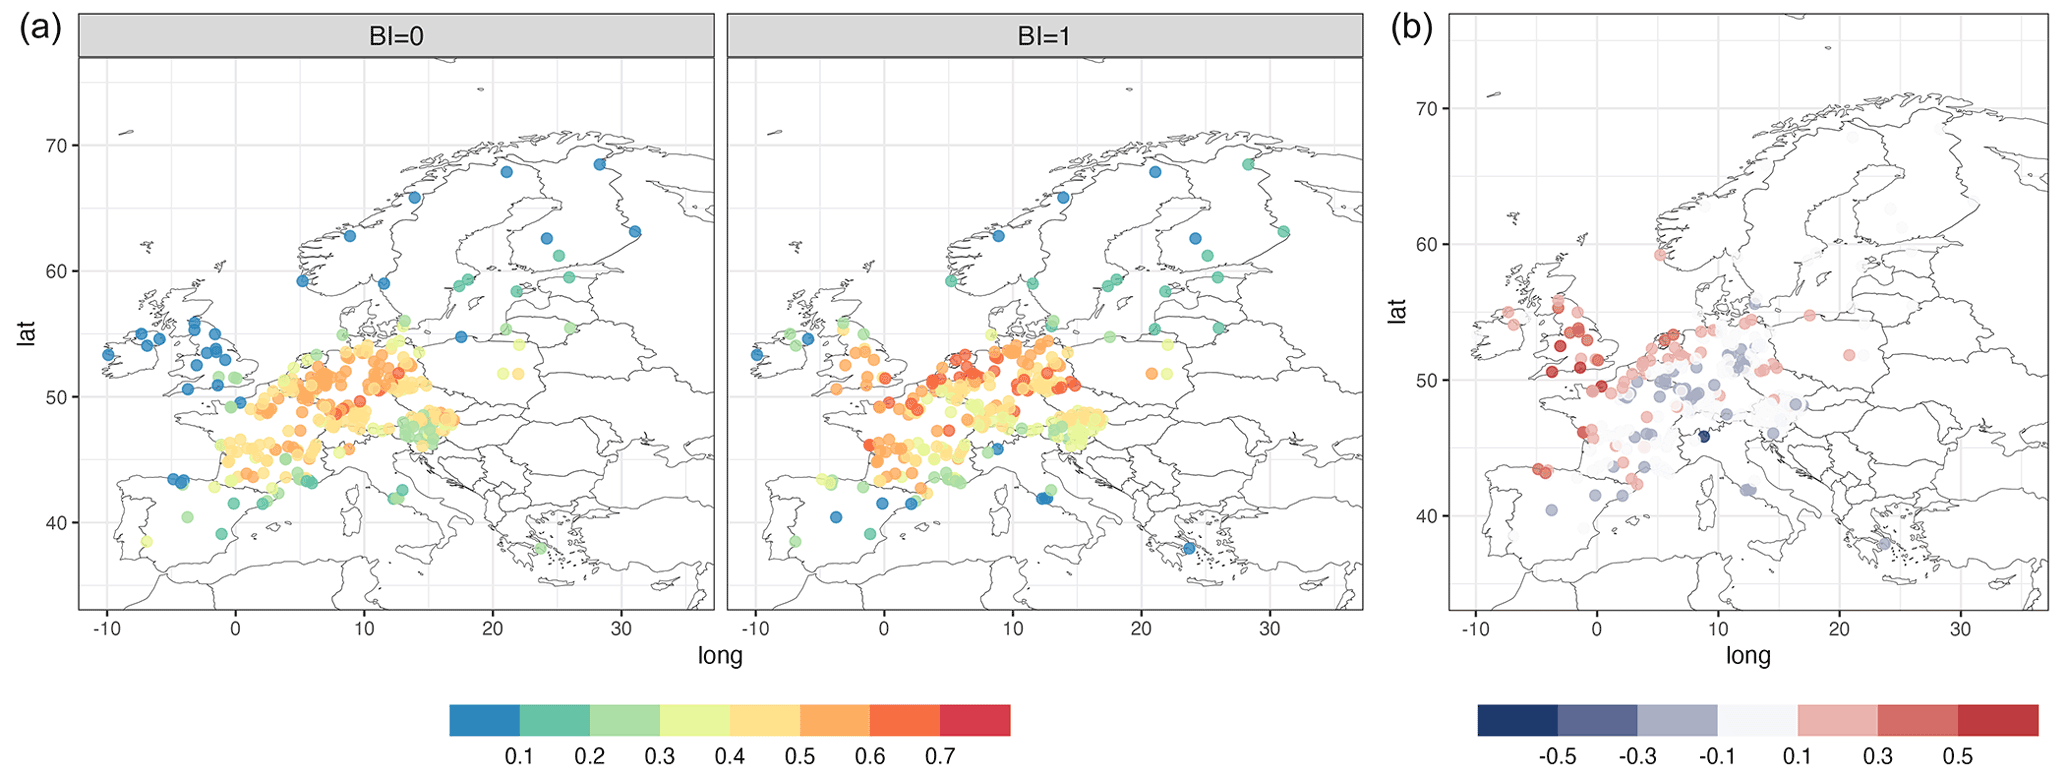
Figure 4(a) Spatial distribution of the upper tail dependence parameter derived from the copulas when BI =0 and BI =1. (b) Differences between the values of the upper tail dependence parameter when BI =1 minus the values when BI =0.
We use three hazard scenarios (AND, OR, COND) to quantify the impacts of blocks on compound extremes of MDA8O3 and Tmax. The probabilities associated with each type of hazard scenario are defined based on the domain where they are estimated and the critical region related to the probability type (see Fig. 5 for an illustrative example as shown in Serinaldi, 2016).
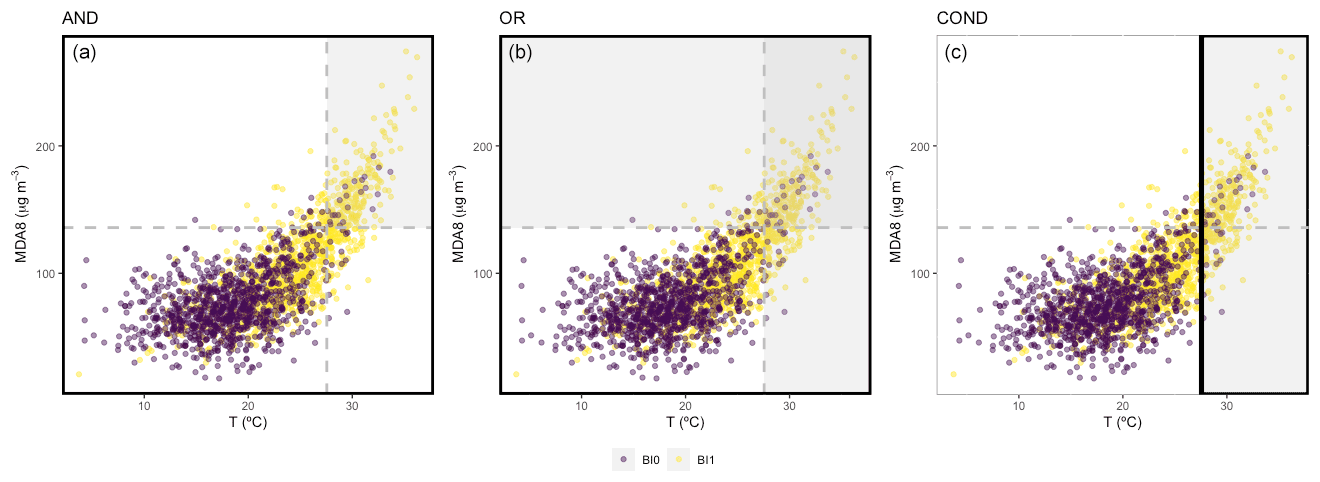
Figure 5Illustrative example with the probability scenarios used in the study: AND (a), OR (b), and COND (c). Bold black boxes identify the domain where each probability is estimated and the grey areas represent the critical regions associated with the corresponding probability. The legend colours correspond to days with blocking (BI =1, yellow) and without blocking (BI =0, purple).
We start analysing the impacts of blocks in the probability of concurrent events of high ozone pollution and hot days using the scenario AND (Fig. 6a and b). Although there is a very low probability of the co-occurrence of extremes when BI =0 (< 2.5 %), the presence of blocking generally increases the probability of compound events of MDA8O3 and Tmax (Fig. 6a). Under blocking conditions (BI =1), the probability of co-occurrent extremes is ∼ 20 % in most of the stations over central Europe, and ∼ 10 % over the UK (Fig. 6a). The probability of occurrence of compound events of MDA8O3 and Tmax significantly increases by more than 18 % in a large number of stations over Europe, as shown by the ΔP (Fig. 6b). Despite ozone concentrations being generally lower over the UK (Fig. S2) than over other regions, it is interesting to note that blocks seem to play a significant role in the compounding effect ozone and temperature over the UK. Kalisa et al. (2018) analysed the influence of heatwaves on air pollution in the UK, specifically Birmingham, and found that ozone levels increased by more than 50 % with high temperature. Here, we consistently show the combined effect ozone and temperature. Our results also indicate that such a combination mainly occurs under blocks, which might be due to the clear-sky radiative forcing, as pointed out by earlier work, and subsidence processes associated with the anticyclonic circulation (Brunner et al., 2017; Pfahl, 2014). The stations over the north-eastern and south-western stations (i.e. Scandinavia and Spain respectively) exhibit the lowest probability of compound of extremes of MDA8O3 and Tmax. As shown in Fig. 4, those stations are characterised by low or null upper tail dependence, which already indicates a weak relationship between the extremes. In addition, the distinct response of heatwaves to blocking found in northern and southern Europe is noteworthy, especially in summer (Brunner et al., 2017; Sousa et al., 2018). An increasing frequency of heatwaves linked to blocks has been observed over northern Europe in summer, whereas an opposite response has been seen in southern Europe (Sousa et al., 2018). Therefore, one could expect a smaller impact of blocks on the compounding effect of ozone pollution and high temperatures in the case of the southern regions. Our results are in agreement with the study carried out by Hertig et al. (2020), which found a lower number of compound ozone-heat wave events in Portugal compared with the compound identified in Germany (Bavaria).
We examine the OR scenario under the assumption that blocks might enhance the probability of either high ozone pollution levels or hot temperatures, both being relevant for health impacts (Analitis et al., 2014; Bell et al., 2004). As shown in Fig. 6c, the probability obtained for the OR scenario is considerably higher when BI =1, reflecting the strong impact of blocks on single extreme events. Atmospheric blocking conditions enhance the probability that either MDA8O3 or Tmax exceeded the 95th percentile by more than 40 % in a large number of stations mostly concentrated in Germany, Austria and the east of France. For the rest of the stations, the probability of extremes in the OR scenario increases by 20 %–30 % under blocking conditions (Fig. 6d). Consistent with previous works that showed the strong association of warm temperature extremes and blocking (Pfahl and Wernli, 2012; Brunner et al., 2017), as well as the impact of blocks on ozone pollution over some European sectors (Ordóñez et al., 2017), our results show the increasing probability of temperature OR ozone pollution extremes under atmospheric blocking.
From a risk assessment perspective, the scenario COND is also of interest as it quantifies the impact of blocks of ozone pollution extremes events conditioned on high temperature. For the COND probability, both the computation domain (i.e. the joint space where the probability of exceedances is calculated) and the critical region (i.e. the region of exceedances of ozone conditioned by temperature) evolve when moving along higher temperatures; then, the probability is computed over a reduced subset (e.g. conditioned on temperature extremes) (see Fig. 5 and Serinaldi, 2016, for further details). As illustrated in Fig. 6e and f, blocks generally enhance the probability of extremes of ozone pollution conditioned on temperature exceedances. Blocks significantly influence the compound events in the stations over north-western and central-eastern Europe, which show positive and large values of ΔP (Fig. 6f), suggesting a higher probability of ozone pollution extremes when temperature exceeds the 95th percentile. In particular, blocks lead to an increasing probability of ozone extremes given high temperatures in the UK (> 40 %). In a few number of stations over southern and north-eastern Europe, blocks did not show a significant influence in the conditional probability of extremes, with low and non-significant values of ΔP. For some of these stations, the copula selected when BI =1 is the Clayton copula (Fig. S4), which indicates a greater probability of joint extreme low values (lower tail dependence), but not in the upper tail, as shown in Fig. 6e and f. Thus, the presence of blocks is not relevant for ozone pollution exceedances that seem to occur independently of temperature extremes. In such situations, high ozone levels are less likely to be due to the enhanced local ozone production from locally emitted precursors that comes with higher temperatures (Coates et al., 2016), and are more likely to be due to residual ozone left over from previous episodes of enhanced local ozone production (Haman et al., 2014), or long-range transport of ozone produced elsewhere (Lupaşcu and Butler, 2019).
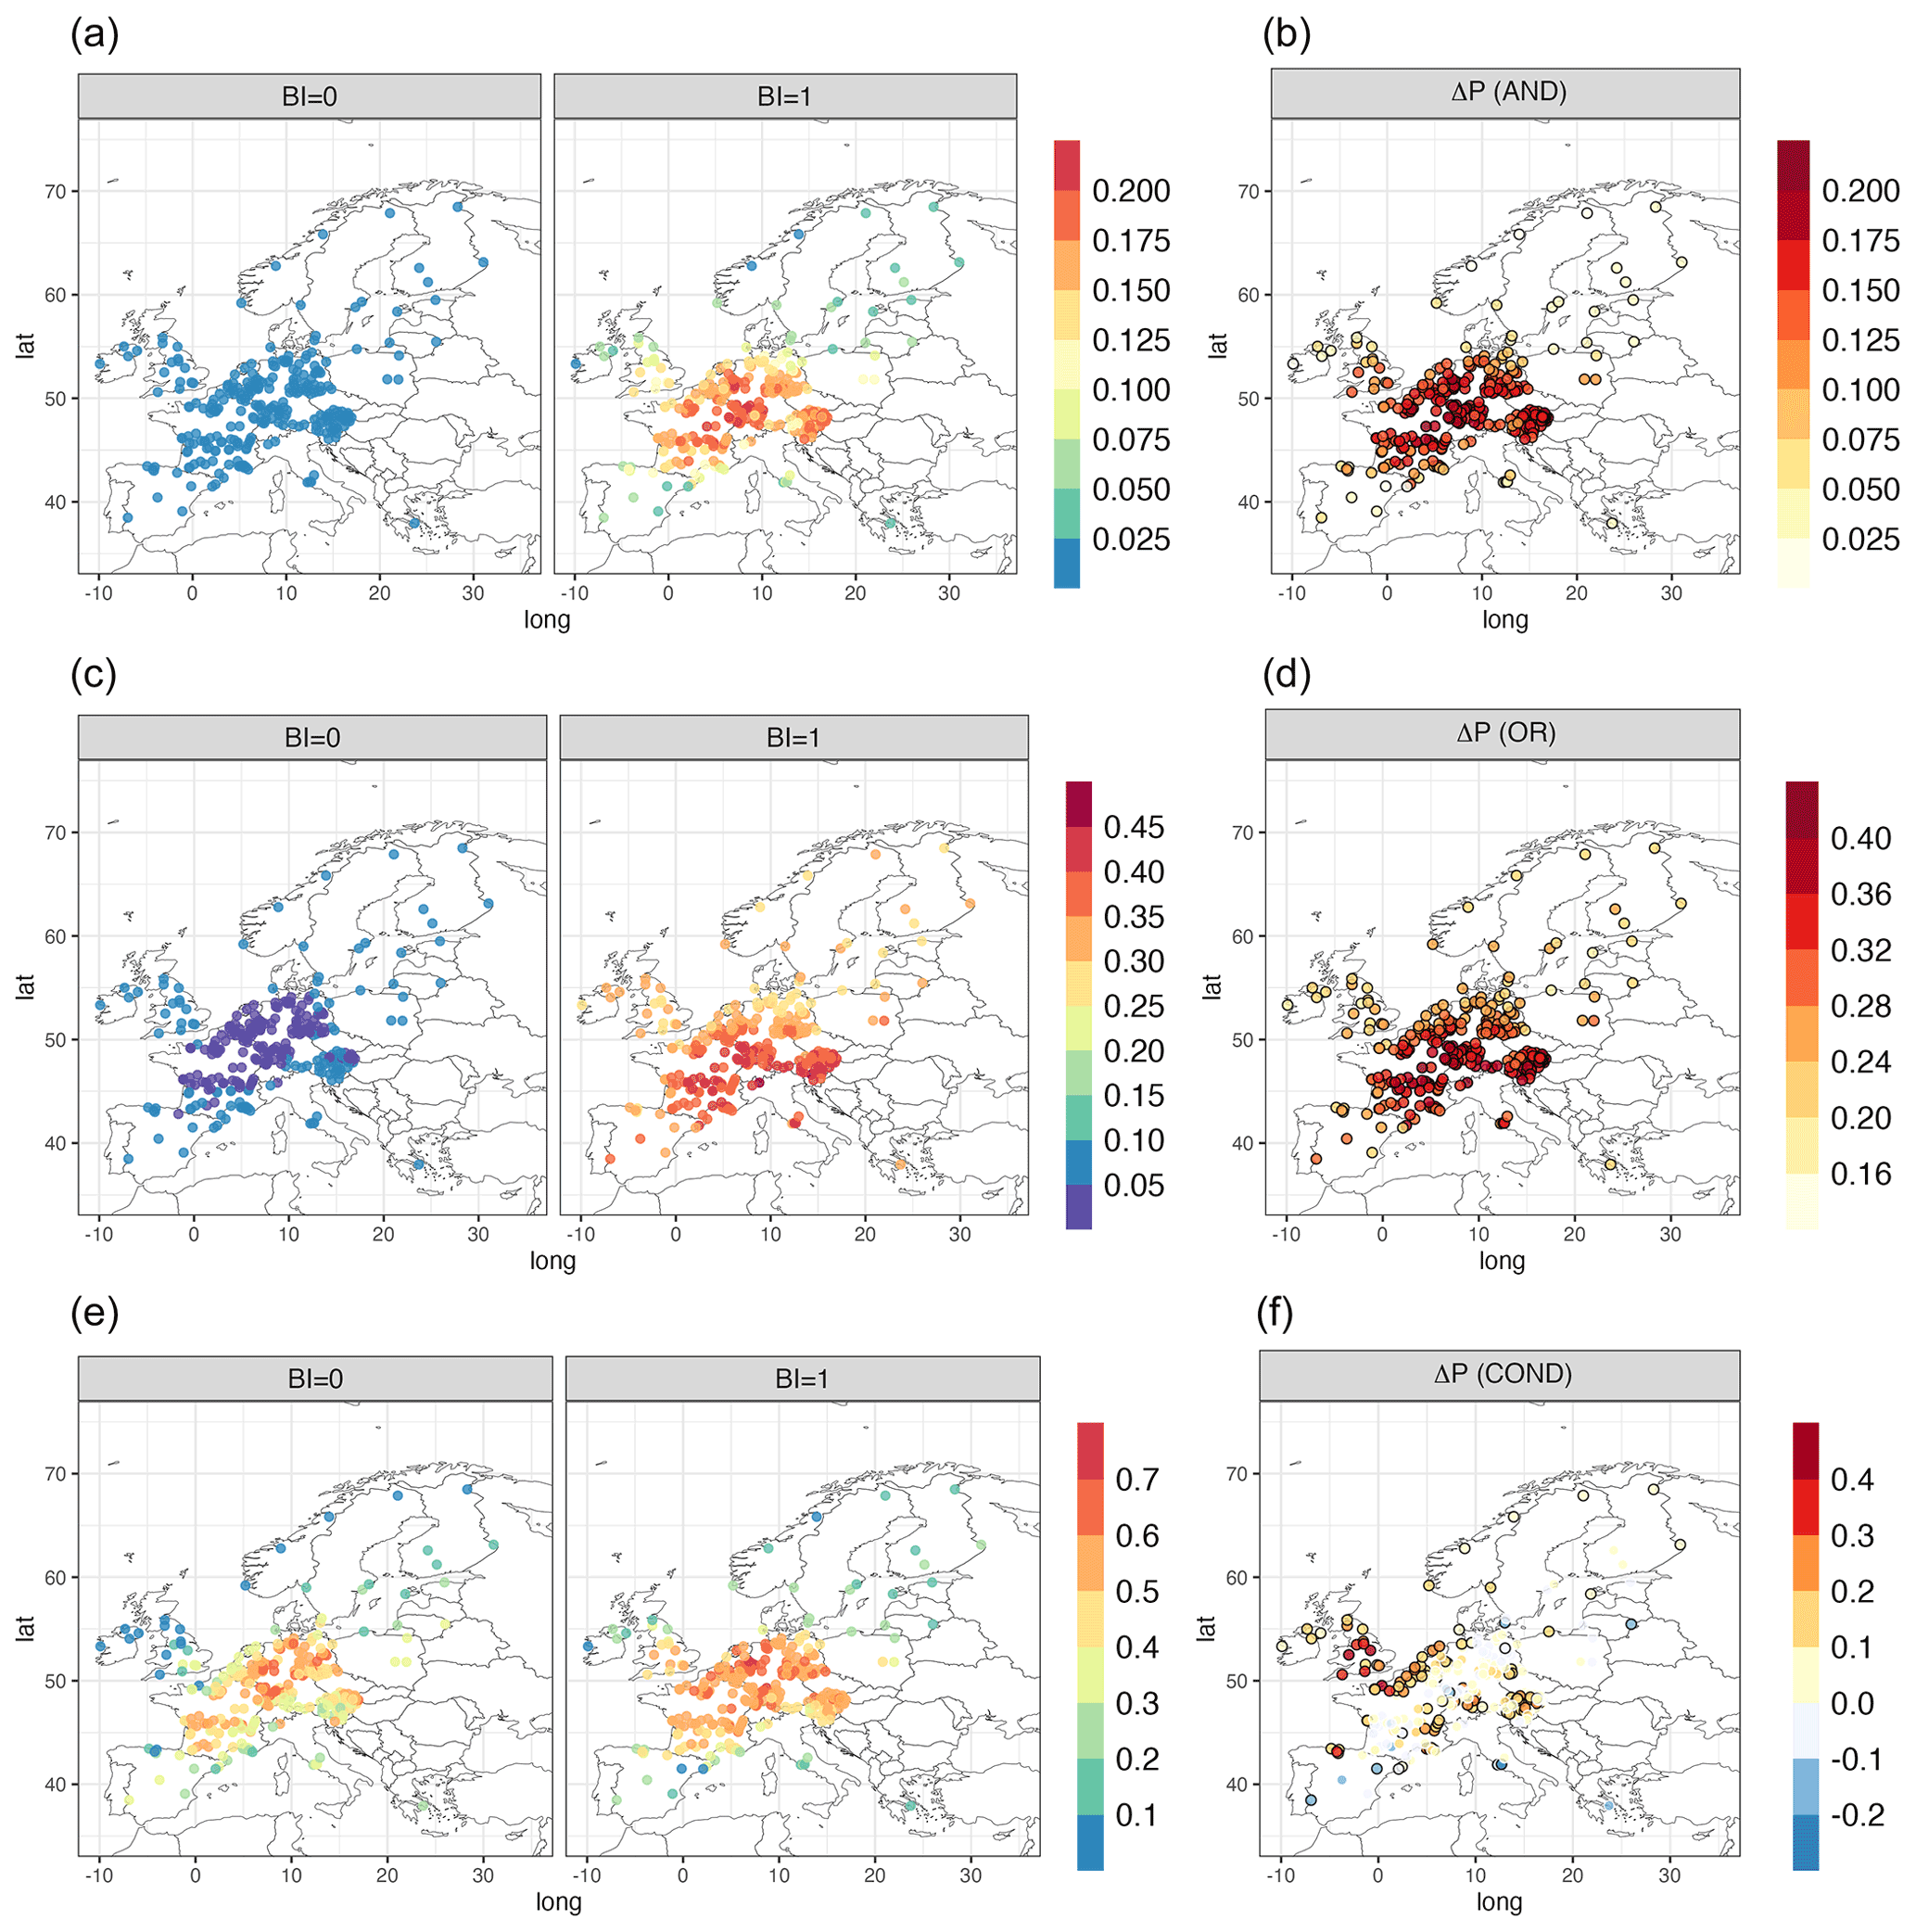
Figure 6Probability scenarios AND (a, b), OR (c, d) and COND (e, f) derived from the copula analysis when BI =1 and BI =0 (a, c, e). ΔP (b, d, f) shows the difference between the probabilities when BI =1 and BI =0. Black contours in (b), (d) and (f) represent locations with statistically significant differences at the confidence level of 95 %.
The results from the joint probabilities derived from the copulas pointed out notable spatial differences that were consistent with the analysis presented above. The impacts of blocks on the joint probabilities corresponding to the AND and OR scenarios is significant at all stations, with a major effect (in terms of the magnitude of ΔP) in those located in central Europe. The smallest impact was found at the southern and north-eastern stations for the conditional case, COND, which did not show a significant impact of blocking. Despite not considering the sub-tropical ridge in our methodology, the results from the copula analysis are in line with those of previous studies, which showed the spatial variability in the impacts of blocking.
The present study has assessed the influence of atmospheric blocking on the dependence between daily maximum of 8 h average ozone (MDA8O3) and daily maximum temperature (Tmax) for the period 1999–2015 during the ozone season (April–September). A total of 300 monitoring stations distributed over Europe were included. First, we examined the blocking influence on single extreme events of ozone pollution and temperature, defined on the basis of the 95th percentile of their respective distribution at each station. Using a copula-based approach, we evaluated the impacts of blocks on compound ozone pollution and temperature events taking into account their dependence. For each station, the dependence between ozone and temperature was modelled independently under blocking (BI =1) and non-blocking (BI =0) conditions. The selected copulas described the dependence structure and the joint behaviour of ozone and temperature. We investigated the impacts of blocks on the risks of compound ozone and temperature events under three different hazard scenarios of probability: AND, OR and COND, which are commonly used to study multivariate events.
Our results showed that, during the ozone season, more than 40 % of ozone exceedances (> 95th) are coincident with blocked days over the central stations (including Germany, eastern France and the Benelux countries). The rest of the stations showed a lower frequency (∼ 25 %) of ozone exceedances during blocking conditions. The frequency of temperature extremes is larger than ozone extremes under blocking conditions and, on average, 55 % of hot days occur under blocking conditions. The highest frequency is observed in northern Europe (Scandinavia) with more than 70 % of temperature-blocked extremes, whereas the lowest frequency is observed in southern Europe. It is worth noting that in the case of temperature, the number of exceedances above the 95th percentile of the total distribution (i.e. April–September) might not be equally distributed throughout the ozone season. However, we consider that the use of a fixed 95th percentile for the whole distribution to define individual extremes is also consistent with the 95th percentile threshold used to estimate the joint probabilities of exceedances derived from the copulas. Moreover, our results were in agreement with the literature, which showed similar patterns of temperature-blocked exceedances (Brunner et al., 2018; Sousa et al., 2018).
The analysis of the dependence between ozone and temperature revealed that atmospheric blocking is of key importance in some regions that showed a strong relationship between ozone and temperature under blocking conditions (e.g. central and eastern Europe). In particular, we found a great impact over the stations in the UK and Benelux countries, where the blocks lead to positive and higher correlation values, whereas a weaker relationship is observed under non-blocking conditions. The copula-based approach confirms the dependence between ozone and temperature under the influence of atmospheric blocking. Moreover, the copulas showed that blocks have a major effect on the upper tail dependence in some stations over the UK, north-western and western France, the Benelux countries and northern Germany, which suggests that compound ozone and temperature extremes are highly associated and influenced by atmospheric blocking.
Overall, we found that blocks enhanced the probability of occurrence of compound ozone and temperature extremes in a large number of stations included in this study. Our results showed that blocking significantly increased by ∼ 15 %–20 % (i.e. ΔP>0.15) the probability of co-occurrent ozone and temperature exceedances at the stations over central, north-western and eastern Europe. In fact, the probability of combined ozone and temperature extremes under non-blocking conditions is rather small everywhere (P0<0.025). Blocks significantly increase the probability that ozone or temperature (or both) exceeds the 95th percentile. The highest probability values are observed over central and eastern stations in which blocking increases the probability of extreme events in ozone or temperature by more than 35 %. The analysis of the joint distribution considering the conditional hazard scenario (COND) showed a smaller impact of blocks in some stations where the probability of ozone pollution extremes conditioned on high temperatures did not show significant differences in terms of magnitude under non-blocking conditions. However, we found a significant increase in the conditional probability over the north-west stations and a slight increase over the central-east stations. This suggests that, over such regions, ozone extremes tend to occur conditioned on high temperatures, which are strongly connected to atmospheric blocking. This is likely due to the position of the block (i.e. the location of the centre of the identified block) during the ozone season covering spring and summertime, when the increased solar radiation leads to warm temperature in the blocked regions (Brunner et al., 2017; Sousa et al., 2018), which can also explain the high levels of ozone pollution in the blocked regions. As described in Sect. 2, we used a blocking detection algorithm based on the instantaneous blocking index developed by Tibaldi and Molteni (1990) and applied an additional spatio-temporal filter. It must be noted that, unlike earlier studies, we considered the blocks within the Atlantic and European sectors, mainly motivated by the location of the stations, but we did not explicitly analyse other properties of blocks, such as blocking centre, blocking duration, or blocking extension, which might have an effect on the compounding response of ozone and temperature. Future directions from this work might assess the role of the blocking properties on the probability of co-occurrence of temperature and ozone extremes.
Our study showed a clear influence of blocks in local compound ozone and temperature extremes over a large number of stations. Blocks have a significant impact over the central regions, where peaks of ozone pollution usually exceed the European target value of 120 µg m−3 (set for the protection of human health, EEA, 2019) and warm temperature extremes are strongly connected to atmospheric blocking (Brunner et al., 2017). Ozone levels are normally lower over north-western Europe (e.g. the UK), as well as temperature, than over the rest of the stations (Fig. 2); however, our findings showed that blocking leads to an increased strength of the general dependence between ozone and temperature, particularly in the tail dependence of extremes. This points out that blocks have a significant impact in the compounding effect of ozone and temperature over north-western Europe, leading to greater health risks.
As discussed in the introduction, atmospheric blocking can lead to extreme weather conditions (Sillmann et al., 2011; Barnes et al., 2012), which would affect air quality. In addition, early studies have associated the Arctic sea ice loss with an increasing frequency of atmospheric blocking due to a slowed-down flow (Liu et al., 2012). However, the link between the Arctic amplification and weather extremes is complex and no significant trends have been reported (Wollings et al., 2018; Barnes et al., 2014). It must also be acknowledged that the trends of the respective variables, ozone and temperature, were not taken into account. Although maximum temperatures have shown upwards trends for decades (Jacob, 2013), the trends of surface ozone concentrations over Europe are not clear. Previous trend analysis showed a clearer decreasing trend of ozone peaks during the period 2000–2008 over most of the European sites, but no significant trends were found for the recent period, 2009–2018 (EEA, 2019). As our main objective focuses on the dependence between ozone and temperature, we might expect changes in their relationship to be reflected in the impacts of atmospheric blocking too. However, owing to the complexity in the temperature dependence of ozone (Pusede et al., 2014; Otero et al., 2021) and the changing emissions of ozone precursors, further analysis should be required to investigate the influence of persistent atmospheric conditions while accounting for changes in the temperature–ozone relationship. In spite of this limitation, our results are in a good agreement with those of previous works that examined the individual effects of blocking on either temperature (Sousa et al., 2018; Pfahl and Wernli, 2012) or ozone (Ordóñez et al., 2017). Moreover, we provide here a first quantification of the impacts of blocks on compound events of ozone and temperature extremes.
Therefore, an important implication of our findings is the significant influence of atmospheric blocking in the co-occurrence of ozone and temperature extremes in certain European regions. Given the strong linkage between atmospheric blocking and the compounding effect of ozone and temperature extremes, the frequency of blocking events might be used as a key predicting factor for assessing the health-related risks of the combined effects of ozone pollution and temperature extremes.
Observational ozone data used in this study are available at the AirBase database of the European Environment Agency (EEA) data service: https://www.eea.europa.eu/data-and-maps/data/aqereporting-8 (EEA, 2019).
The ERAInterim reanalysis products are available on the Climate Data Store (CDS) cloud server: https://cds.climate.copernicus.eu (Dee et al., 2011).
The code applied is available on reasonable request from the corresponding author.
The supplement related to this article is available online at: https://doi.org/10.5194/acp-22-1905-2022-supplement.
NO designed the study and performed the statistical analyses with input from HWR and OEJ. NO drafted the paper with the contribution of TB, OEJ and HR.
The contact author has declared that neither they nor their co-authors has any competing interests.
Publisher's note: Copernicus Publications remains neutral with regard to jurisdictional claims in published maps and institutional affiliations.
We acknowledge Andy Richling for providing the Blocking Index data. The authors would like to sincerely thank the two anonymous reviewers whose comments led to the improvement of this paper.
This publication was financially supported by Geo.X, the Research Network for Geosciences in Berlin and Potsdam (grant no. SO_087_GeoX). This work was hosted by IASS Potsdam, with financial support provided by the Federal Ministry of Education and Research of Germany (BMBF) and the Ministry for Science, Research and Culture of the State of Brandenburg (MWFK).
This paper was edited by Jason West and reviewed by two anonymous referees.
AghaKouchak, A., Cheng, L., Mazdiyasni, O., and Farahmand, A.: Global warming and changes in risk of concurrent climate extremes: insights from the 2014 California drought, Geophys. Res. Lett., 41, 8847–8852, 2014. a
Akaike, H.: A new look at the statistical model identification, IEEE T. Automat. Contr., 19, 716–723, 1974. a
Analitis, A., Michelozzi, P., D'Ippoliti, D., De'Donato, F., Menne, B., Matthies, F., Atkinson, R., Iñiguez, C., Basagaña, X., Schneider, A., Lefranc, A., Paldy, A., Bisanti, L., and Katsouyanni, K.: Effects of heat waves on mortality: effect modification and confounding by air pollutants, Epidemiology, 25, 15–22, 2014. a, b
Barnes, E., Slingo, J., and Woollings, T.: A methodology for the comparison of blocking climatologies across indices, models and climate scenarios, Clim. Dynam. 38, 2467–2481, https://doi.org/10.1007/s00382-011-1243-6, 2012. a, b, c
Barnes, E. A., Dunn-Sigouin, E., Masato, G., and Woollings, T.: Exploring recent trends in Northern Hemisphere blocking, Geophys. Res. Lett., 41, 638–644, https://doi.org/10.1002/2013GL058745, 2014. a
Barriopedro, D., García-Herrera, R., Lupo, A., and Herández, E. R.: A climatology of northern hemisphere blocking, J. Climate, 19, 1042–1063, https://doi.org/10.1175/JCLI3678.1, 2006. a, b
Barriopedro, D., Garcí-Herrera, R., and Trigo, R.: Application of blocking diagnosis methods to General Circulation Models. Part I: A novel detection scheme, Clim. Dynam., 35, 1373–1391, https://doi.org/10.1007/s00382-010-0767-5, 2010. a
Bell, M., McDermott, A., Zeger, S., Samet, J., and Dominici, F.: Ozone and short-term mortality in 95 US urban communities, 1987–2000, JAMA, 17, 2372-8, https://doi.org/10.1001/jama.292.19.2372, 2004. a
Brunner, L., Hegerl, G., and Steiner, A.: Connecting atmospheric blocking to European temperature extremes in springs, J. Climate, 30, 585–594, https://doi.org/10.1175/JCLI-D-16-0518.1, 2017. a, b, c, d, e, f, g, h
Brunner, L., Schaller, N., Anstey, J., Sillmann, J., and Steiner, A.: Dependence of present and future European temperature extremes on the location of atmospheric blocking, Geophys. Res. Lett., 45, 6311–6320, https://doi.org/10.1029/2018GL077837, 2018. a
Cai, W., Xu, X., Cheng, X., Wei, F., Qiu, X., and Zhu, W.: Impact of blocking structure in the troposphere on the wintertime persistent heavy air pollution in northern China, Sci. Total Environ., 1, 140325, https://doi.org/10.1016/j.scitotenv.2020.140325, 2020. a
Coates, J., Mar, K. A., Ojha, N., and Butler, T. M.: The influence of temperature on ozone production under varying NOx conditions – a modelling study, Atmos. Chem. Phys., 16, 11601–11615, https://doi.org/10.5194/acp-16-11601-2016, 2016. a, b
Dee, D., Uppala, S., and Simmons, A.: The ERA-Interim reanalysis: configuration and performance of the data assimilation system, Q. J. Roy. Meteor. Soc., 137, 553–597, https://doi.org/10.1002/qj.828, 2011. a, b
Doherty, R., Heal, M., and Connor, F.: Climate change impacts on human health over Europe through its effect on air quality, Environ. Health, 16, 118, https://doi.org/10.1186/s12940-017-0325-2, 2018. a
Dole, R., Hoerling, M., Perlwitz, J., Eischeid, J., Pegion, P., Zhang, T., Quan, X. W., Xu, T., and Murray, D.: Was there a basis for anticipating the 2010 Russian heat wave?, Geophys. Res. Lett., 38, L06702, https://doi.org/10.1029/2010GL046582, 2011. a
European Environment Agency (EEA): Air quality in Europe – 2019 report, EEA Technical Report No 10/2019, https://doi.org/10.2800/822355, 2019. a, b, c, d, e
Fiala, J., Cernikovsky, L., de Leeuw, F., and Kurfuerst, P.: Air pollution by ozone in Europe in summer 2003, Overview of exceedances of EC ozone threshold values during the summer season April–August 2003 and comparisons with previous years, EEA Topic Rep. 3/2003, Eur. Environ. Agency, Copenhagen, 2003. a
Fink, A., Brücher, T., Krüger, A., Leckebush, G., Pinto, J., and Ulbrich, U.: The 2003 European summer heatwaves and drought-synoptic diagnosis and impacts, Weather, 59, 209–216, https://doi.org/10.1256/wea.73.04, 2004. a
Garrido-Perez, J., Ordóñez, C., and García-Herrera, R.: Strong signatures of high-latitude blocks and subtropical ridges in winter PM10 over Europe, Atmos Environ., 167, 49–60, 2017. a
Haman, C. L., Couzo, E., Flynn, J. H., Vizuete, W., Heffron, B., and Lefer, B. L.: Relationship between boundary layer heights and growth rates with ground-level ozone in Houston, Texas, J. Geophys. Res.-Atmos., 119, 6230–6245, https://doi.org/10.1002/2013JD020473, 2014. a
Hao, Z. and Singh, V.: Review of dependence modeling in hydrology and water resources, Prog. Phys. Geogr., 40, 549–578, 2016. a
Hao, Z., Singh, V., and Hao, F.: Compound extremes in hydroclimatology: a review, Water, 6, 718, https://doi.org/10.3390/w10060718, 2018. a, b, c, d
Hertig, E., Russo, A., and Trigo, R. M.: Heat and ozone pollution waves in Central and South Europe – characteristics, weather types, and association with mortality, Atmosphere, 11, 1271, https://doi.org/10.3390/atmos11121271, 2020. a, b, c, d, e
Hofert, M., Kojadinovic, I., Maechler, M., and Yan, J.: Copula: multivariate dependence with copulas, r package version 1.0-1, available at: https://CRAN.R-project.org/package=copula (last access: January 2021), 2020. a
Jacob, D.: EURO-CORDEX: new high-resolution climate change projections for European impact research, Reg. Environ. Change, 14, 563–578, https://doi.org/10.1007/s10113-013-0499-2, 2013. a
Jacob, D., Logan, J., Yevich, R., Gardner, G., Spivakovsky, C., Wofsy, S., Munger, J., Sillman, S., Prather, M., Rodgers, M., Westberg, H., and Zimmerman, P.: Simulation of summertime ozone over North America, J. Geophys. Res., 98, 14797e14816, https://doi.org/10.1007/0-387-28678-0, 1993. a
Kadow, C., Illing, S., Lucio-Eceiza, E. E., Bergemann, M., Ramadoss, M., Sommer, P., Kunst, O., Schartner, T., Pankatz, K., Grieger, J., Schuster, M., Richling, A., Thiemann, H., Kirchner, I., Rust, H., Ludwig, T., Cubasch, U., and Ulbrich, U.: Introduction to Freva – a free evaluation system framework for earth system modeling, J. Open Res. Softw., 9, 13, https://doi.org/10.5334/jors.253, 2021. a
Kalisa, E., Fadlallah, S., Amani, M., Nahayo, L., and Habiyaremye, G.: Temperature and air pollution relationship during heatwaves in Birmingham, UK, Sustain. Cities Soc., 43, 111–120, https://doi.org/10.1016/j.scs.2018.08.033, 2018. a
Liu, J., Curry, J., and Wang, H.: Impact of declining Arctic sea ice on winter snowfall, Proc. Natl. Acad. Sci. (USA), 2012. a
Lupaşcu, A. and Butler, T.: Source attribution of European surface O3 using a tagged O3 mechanism, Atmos. Chem. Phys., 19, 14535–14558, https://doi.org/10.5194/acp-19-14535-2019, 2019. a
Nelsen, R. B.: An introduction to copulas, Springer Science and Business Media, 2nd Edn., Springer Publishing Company, https://doi.org/10.1007/0-387-28678-0, 2006. a, b, c, d
Ordóñez, C., Barriopedro, D., García-Herrera, R., Sousa, P. M., and Schnell, J. L.: Regional responses of surface ozone in Europe to the location of high-latitude blocks and subtropical ridges, Atmos. Chem. Phys., 17, 3111–3131, https://doi.org/10.5194/acp-17-3111-2017, 2017. a, b, c, d, e, f, g, h, i
Otero, N., Sillmann, J., Schnell, J. L., Rust, H., and Butler, T.: Synoptic and meteorological drivers of extreme ozone concentrations over Europe, Environ. Res. Lett., 11, 024005, https://doi.org/10.1088/1748-9326/11/2/024005, 2016. a, b
Otero, N., Sillmann, J., Mar, K. A., Rust, H. W., Solberg, S., Andersson, C., Engardt, M., Bergström, R., Bessagnet, B., Colette, A., Couvidat, F., Cuvelier, C., Tsyro, S., Fagerli, H., Schaap, M., Manders, A., Mircea, M., Briganti, G., Cappelletti, A., Adani, M., D'Isidoro, M., Pay, M.-T., Theobald, M., Vivanco, M. G., Wind, P., Ojha, N., Raffort, V., and Butler, T.: A multi-model comparison of meteorological drivers of surface ozone over Europe, Atmos. Chem. Phys., 18, 12269–12288, https://doi.org/10.5194/acp-18-12269-2018, 2018. a
Otero, N., Rust, H., and Butler, T.: Temperature dependence of tropospheric ozone under NOx reductions over Germany, Atmos. Environ., 253, 1352–2310, https://doi.org/10.1016/j.atmosenv.2021.118334., 2021. a, b
Pfahl, S.: Characterising the relationship between weather extremes in Europe and synoptic circulation features, Nat. Hazards Earth Syst. Sci., 14, 1461–1475, https://doi.org/10.5194/nhess-14-1461-2014, 2014. a, b, c
Pfahl, S. and Wernli, H.: Quantifying the relevance of atmospheric blocking for co-located temperature extremes in the Northern Hemisphere on (sub-)daily time scales, Geophys. Res. Lett., 39, L12807, https://doi.org/10.1029/2012GL052261, 2012. a, b, c, d, e, f, g
Phalitnonkiat, P., Hess, P. G. M., Grigoriu, M. D., Samorodnitsky, G., Sun, W., Beaudry, E., Tilmes, S., Deushi, M., Josse, B., Plummer, D., and Sudo, K.: Extremal dependence between temperature and ozone over the continental US, Atmos. Chem. Phys., 18, 11927–11948, https://doi.org/10.5194/acp-18-11927-2018, 2018. a, b
Porter, W. C., Heald, C. L., Cooley, D., and Russell, B.: Investigating the observed sensitivities of air-quality extremes to meteorological drivers via quantile regression, Atmos. Chem. Phys., 15, 10349–10366, https://doi.org/10.5194/acp-15-10349-2015, 2015. a
Pusede, S. E., Gentner, D. R., Wooldridge, P. J., Browne, E. C., Rollins, A. W., Min, K.-E., Russell, A. R., Thomas, J., Zhang, L., Brune, W. H., Henry, S. B., DiGangi, J. P., Keutsch, F. N., Harrold, S. A., Thornton, J. A., Beaver, M. R., St. Clair, J. M., Wennberg, P. O., Sanders, J., Ren, X., VandenBoer, T. C., Markovic, M. Z., Guha, A., Weber, R., Goldstein, A. H., and Cohen, R. C.: On the temperature dependence of organic reactivity, nitrogen oxides, ozone production, and the impact of emission controls in San Joaquin Valley, California, Atmos. Chem. Phys., 14, 3373–3395, https://doi.org/10.5194/acp-14-3373-2014, 2014. a, b
Ribeiro, A., Russo, A., Gouveia, C., and Páscoa, P.: Copula-based agricultural drought risk of rainfed cropping systems, Agr. Water Manage., 223, 105689, https://doi.org/10.1016/j.agwat.2019.105689, 2019. a
Richling, A., Kadow, C., Illing, S., and Kunst, O.: Freie Universitat Berlin evaluation system (Freva) – blocking, documentation of the blocking plugin, available at: https://freva.met.fu-berlin.de/about/blocking/ (last access: October 2019), 2015. a
Russo, A., Trigo, R., Martins, H., and Mendes, M.: NO2, PM10 and O3 urban concentrations and its association with circulation weather types in Portugal, Atmos. Environ., 89, 768–785, https://doi.org/10.1016/j.atmosenv.2014.02.010, 2014. a
Röthlisberger, M. and Martius, O.: Quantifying the local effect of Northern Hemisphere atmospheric blocks on the persistence of summer hot and dry spells, Geophys. Res. Lett., 46, 10101–10111, https://doi.org/10.5194/acp-18-2601-2018, 2019. a
Salvadori, G. and Michelle, C. D.: Multivariate multiparameter extreme value models and return periods: a copula approach, Geophys. Res. Lett., 46, W10501, https://doi.org/10.1029/2009WR009040, 2010. a, b
Salvadori, G., Durante, F., Michelle, C. D., Bernardi, M., and Petrella, L.: A multivariate copula-based framework for dealing with hazard scenarios and failure probabilities, Water Resour., 52, 3701–3721, 2016. a
Schepsmeier, U., Stoeber, J., Brechmann, E. C., Graeler, B., Nagler, T., and Erhardt, T.: VineCopula: statistical inference of vine copulas, R package version 2.0.5, available at: https://CRAN.R-project.org/package=VineCopula (last access: January 2021), 2016. a
Scherrer, S., Croci-Maspoli, M., Schwierz, C., and Appenzeller, C.: Two-dimensional indices of atmospheric blocking and their statistical relationship with winter climate patterns in the Euro-Atlantic region, Int. J. Climatol., 26, 233–249, https://doi.org/10.1002/joc.1250, 2006. a
Schnell, J. L. and Prather, M. J.: Co-occurrence of extremes in surface ozone, particulate matter, and temperature over eastern North America, Proc. Natl. Acad. Sci. USA, 114, 2854–2859, https://doi.org/10.1073/pnas.1614453114, 2017. a, b, c, d, e
Schuster, M., Grieger, J., Richling, A., Schartner, T., Illing, S., Kadow, C., Müller, W. A., Pohlmann, H., Pfahl, S., and Ulbrich, U.: Improvement in the decadal prediction skill of the North Atlantic extratropical winter circulation through increased model resolution, Earth Syst. Dynam., 10, 901–917, https://doi.org/10.5194/esd-10-901-2019, 2019. a
Seinfeld, J. and Pandis, S.: Atmospheric chemistry and physics: from air pollution to climate change, 2nd Edn., Wiley, ISBN: 978-1-118-94740-1, 2006. a
Seneviratne, S., Donat, M., Mueller, B., and Alexander, L.: No pause in the increase of hot temperature extremes, Nat. Clim. Change, 4, 161–163, https://doi.org/10.1038/nclimate2145, 2014. a
Serinaldi, F.: Dismissing return periods!, Stoch. Environ. Res. Risk Assess., 29, 1179–1189, 2015. a
Serinaldi, F.: Can we tell more than we can know? The limits of bivariate drought analyses in the United States, Stoch. Environ. Res. Risk Assess., 30, 1691–1704, 2016. a, b, c
Shen, L., Mickley, L., and Gilleland, E.: Impact of increasing heat waves on U.S. ozone episodes in the 2050s: results from a multimodel analysis using extreme value theory, Geophys. Res. Lett., 43, 4017–4025, 2016. a
Sillmann, J., Croci-Maspoli, M., Kallache, M., and Katz, R.: Extreme cold winter temperatures in Europe under the influence of north Atlantic atmospheric blocking, J. Climate, 24, 5899–5913, https://doi.org/10.1175/2011JCLI4075.1, 2011. a, b, c
Sklar, A.: Random variables, distribution functions, and copulas – a personal look backward and forward, distributions with fixed marginals and related topics, edited by: Rüschendorf, L., Schweizer, B., and Taylor, M. D., Institute of Mathematical Statistics, Hayward, CA, 1–14, https://doi.org/10.1214/lnms/1215452606, 1996. a
Solberg, S., Hov, Ø., Søvde, A., Isaken, I. S. A., Coddeville, P., Backer, H. D., Forster, C., Orsolini, Y., and Uhse, K.: European surface ozone in the extreme summer 2003, J. Geophys. Res., 113, D07307, https://doi.org/10.1029/2007JD009098, 2008. a
Sousa, P., Barriopedro, J. D., Soares, P., and Santos, J.: European temperature responses to blocking and ridge regional patterns, Clim. Dynam., 50, 457–477, https://doi.org/10.1007/s00382-017-3620-2, 2018. a, b, c, d, e, f, g, h, i, j
Sun, W., Hess, P., and Liu, C.: The impact of meteorological persistence on the distribution and extremes of ozone, Geophys. Res. Lett., 44, 1545–1553, https://doi.org/10.1002/2016GL071731, 2017. a
Tibaldi, S. and Molteni, F.: On the operational predictability of blocking, Dyn. Meteorol. Ocean., 42, 343–365, 1990. a, b
Tilloy, A., Malamud, B., Winter, H., and Joly-Laugel, A.: A review of quantification methodologies for multi-hazard interrelationships, Earth-Sci. Rev., 196, 102881, https://doi.org/10.1016/j.earscirev.2019.102881, 2019. a
WHO: Reducing global health risks through mitigation of short-lived climate pollutants: scoping report for policymakers, https://apps.who.int/iris/handle/10665/189524 (last access: October 2020), 2015. a
Willers, S., Jonker, M. F., Klok, L., Keuken, M., Odink, J., van den Elshout, S., Sabel, C. E., Mackenbach, J., and Burdorf, A.: High-resolution exposure modelling of heat and air pollution and the impact on mortality, Environ. Int., 89–90, 102–109, https://doi.org/10.1016/j.envint.2016.01.013, 2016. a
Wollings, T., Barriopedro, D., Methven, D., Son, S., Martius, O., Harvey, B., Sillmann, J., Lupo, A. R., and Seneviratne, S.: Blocking and its Response to Climate Change, Curr. Clim. Change Rep., 4, 287–300, https://doi.org/10.1007/s40641-018-0108-z, 2018. a, b
Zhang, H., Wand, Y., Park, T., and Deng, Y.: Quantifying the relationship between extreme air pollution events and extreme weather events, Atmos. Res., 188, 64–79, https://doi.org/10.1016/j.atmosres.2016.11.010, 2017. a
Zscheischler, J. and Seneviratne, S.: Dependence of drivers affects risks associated with compound event, Sci. Adv., 3, 1–11, https://doi.org/10.1126/sciadv.1700263, 2017. a, b, c