the Creative Commons Attribution 4.0 License.
the Creative Commons Attribution 4.0 License.
 | 08 Feb 2022
Simulated impacts of vertical distributions of black carbon aerosol on meteorology and PM2.5 concentrations in Beijing during severe haze events
Donglin Chen
Hong Liao
Yang Yang
Lei Chen
Delong Zhao
Deping Ding
Vertical profiles of black carbon (BC) play a critical role in modifying the meteorological conditions such as temperature, planetary boundary layer height (PBLH), and regional circulation, which influence surface layer concentrations of PM2.5 (particulate matter with a diameter of 2.5 µm or less; the surface layer covers from 0 to 79.5 m). However, BC vertical profiles in current models usually have large uncertainties. In this study, by using measurements of BC vertical profiles in Beijing collected by King Air 350 aircraft and the Weather Research and Forecasting with Chemistry model (WRF-Chem) coupled with an improved integrated process (IPR) analysis scheme, we investigated the direct radiative effect (DRE) of BC with different vertical profiles on meteorology and PM2.5 concentrations in Beijing during two severe haze events (11–12 and 16–19 December 2016). Compared with measurements in Beijing, the model overestimated BC concentrations by 87.4 % at the surface and underestimated BC mass by 14.9 % at altitudes of 300–900 m as averaged over the two pollution events. The BC DRE with the default vertical profiles from the model heated the air around 300 m altitude, but the warming would be stronger when BC vertical profiles were modified for each day using the observed data during the two severe haze events. Accordingly, compared to the simulation with the default vertical profiles of BC, PBLH was reduced further by 24.7 m (6.7 %) and 6.4 m (3.8 %) in Beijing in the first and second haze events, respectively, with the modified vertical profiles, and hence the surface layer PM2.5 concentrations were higher by 9.3 µg m−3 (4.1 %) and 5.5 µg m−3 (3.0 %) over central Beijing, owing to increased positive contributions of vertical mixing and chemical processes. Furthermore, we quantified by sensitivity experiments the roles of BC vertical profiles with six exponential decline functions ( and hs = 0.35, 0.48, 0.53, 0.79, 0.82, and 0.96) parameterized on the basis of the observations. A larger hs means less BC at the surface and more BC in the upper atmosphere, resulting in less solar radiation reaching the ground and consequently a stronger cooling at the surface (+0.21 with hs of 0.35 vs. −0.13∘ with hs of 0.96). Our results indicate that it is very important to have accurate vertical profiles of BC in simulations of meteorology and PM2.5 concentrations during haze events.
- Article
(9976 KB) - Full-text XML
-
Supplement
(1960 KB) - BibTeX
- EndNote


With the rapid economic development and large increases in fossil energy consumption, haze pollution has become one of the most serious challenges in China, especially in the Beijing–Tianjin–Hebei (BTH) region (H. Wang et al., 2015; Zhang et al., 2019). In 2014 and 2015, the numbers of extremely serious PM2.5 (particulate matter with an aerodynamic equivalent diameter of 2.5 µm or less) pollution days (with daily mean PM2.5 > 150 µg m−3) in Beijing reached 45 and 54, respectively (He et al., 2017). The real-time hourly average concentration of PM2.5 in Beijing even reached 1000 µg m−3 during the severe haze events in January 2013, far exceeding the Chinese Ambient Air Quality Grade I Standards (35 µg m−3 for daily mean PM2.5) (Liu et al., 2017). With the implementation of the toughest-ever clean air policy since 2013, the observed annual mean PM2.5 concentrations averaged over 74 cities in China fell from 61.8 µg m−3 in 2013 to 42.0 µg m−3 in 2017 (Zhang et al., 2016; Wang et al., 2017; K. Li et al., 2019; Zhang et al., 2019). However, severe haze events still occurred in Beijing during the COVID-19 lockdown period (January–February 2020) (Huang et al., 2020; Zhu et al., 2020). Therefore, understanding the mechanisms responsible for the occurrence of severe haze is important for air quality management planning.
BC, an important component of PM2.5, is emitted mainly from the incomplete combustion of fossil fuel, biofuel, and biomass burning. BC particles can strongly absorb solar radiation in the atmosphere, which alters the Earth's radiation balance (Bond et al., 2013; Huang et al., 2015; Hu et al., 2020). In recent years, researchers have found that the radiative effect of BC significantly affects the structure of the planetary boundary layer (PBL) during severe haze pollution events (Ding et al., 2016; Huang et al., 2018; Wang et al., 2018; Liu et al., 2019). By using the Weather Research and Forecasting model coupled with Chemistry (WRF-Chem), Ding et al. (2016) illustrated that BC suppressed the development of PBL by heating the air in the upper PBL and reducing the solar radiation at the surface in Beijing in December 2013. This process was defined as the “dome effect” of BC by Ding et al. (2016). This dome effect was also found over the Indian Ocean (Wilcox et al., 2016). BC can also change the land–sea thermal contrast and induce circulation anomalies during severe haze events (Gao et al., 2016b; Qiu et al., 2017; Q. Ding et al., 2019; Chen et al., 2021). By using the WRF-Chem model, Q. Ding et al. (2019) showed that, during a haze event in December 2013, the direct radiative effect (DRE) of BC enhanced advection between land and sea by causing a cooling (−1.0∘) in air temperature over land and a warming (+0.8∘) in air temperature over sea, which transported moist air from the sea to the Yangtze River delta region. By using the WRF-Chem model, Qiu et al. (2017) and Chen et al. (2021) also reported that the radiative effect of BC induced strong anomalous northeasterly winds from the sea during a haze event in the North China Plain (NCP) in February 2014.
BC can influence concentrations of PM2.5 during haze events because of its impact on PBL and other meteorological fields (Gao et al., 2016b; Wilcox et al., 2016; Miao et al., 2017; Qiu et al., 2017; Gao et al., 2018; Wang et al., 2019; Chen et al., 2021). Gao et al. (2016b) used the WRF-Chem model to simulate the haze event that occurred in the NCP in January 2010 and found a maximum increase in PM2.5 of 14.4 µg m−3 (5.1 %) due to the DRE of BC. Qiu et al. (2017) also analysed the impact of BC on surface layer PM2.5 during haze pollution in NCP in February of 2014 by using the WRF-Chem model and found that the average PM2.5 concentration increased by 2.1 µg m−3 (1.0 %) owing to the DRE of BC. Chen et al. (2021) analysed, by using the WRF-Chem model, the DRE from the ageing of BC and its impact on PM2.5 concentration over the BTH region during a haze event in February 2014. They found that the near-surface PM2.5 concentration average over BTH increased by 9.6 µg m−3 (7.0 %) due to the ageing of BC.
So far few studies examined the impacts of vertical distributions of BC aerosol on meteorology and PM2.5 concentrations. Wang et al. (2018) examined the role of BC at different altitudes in influencing PBL height (PBLH) by considering a single column using WRF-Chem version 3.6.1. They divided the height from 150 to 2250 m evenly into seven layers and increased BC concentrations from 0 to 30 µg m−3 with an increment of 2 µg m−3 at one of the layers, with the BC concentrations at the other layers fixed to 0 µg m−3. Model results showed that the near-surface BC could increase PBLH by 0 %–4 %, while BC aloft would decrease PBLH by 2 %–16 % due to the warming of the atmosphere by BC. Current chemistry–climate models were reported not to be able to represent the BC vertical profiles accurately, so sensitivity studies were carried out to adjust vertical profiles of BC in the model by changing the vertical resolution, aerosol microphysical scheme, and emission height (Wang et al., 2019; Yang et al., 2019; Watson-Parris et al., 2019).
In recent years, measurements of BC vertical distribution have been conducted by aircraft during the severe haze events in Beijing, using a single-particle soot photometer (SP2) (Zhao et al., 2018; Tian et al., 2019; Zhao et al., 2019; Tian et al., 2020; Liu et al., 2020). During the period of severe pollution from 11 to 19 December 2016, Zhao et al. (2019) collected BC vertical profiles over Beijing by Air350 aircraft and found that the vertical profiles can be classified into two types. The first type was characterized by decreases in BC concentration with altitude, which was the case mainly controlled by local emissions. The second type had maximum BC concentration around 900 hPa, which was mainly affected by regional transport from the polluted south-southwest region. Generally, the first type occurred more frequently than the second type during haze events in Beijing. Observations of vertical profiles of BC in severe haze events over Beijing in 2018 by a King Air 350 aircraft by S. Ding et al. (2019) also obtained the same types of profiles.
In this work, we use the BC vertical profiles observed during two severe haze events (11–12 and 16–19 December 2016) over Beijing and the online-coupled WRF-Chem model to investigate the DRE of BC vertical profiles on meteorology and PM2.5 concentrations. Compared with previous studies that examined the impact of BC on meteorology and PM2.5, our study is the first to pay attention to the role of BC vertical profile as well as the underlying mechanism. The description of the model, observational datasets, and numerical experiments are presented in Sect. 2. Section 3 evaluates simulated meteorological and chemical variables by comparing with observations. Section 4 compares the DRE of BC with the original and modified vertical profiles, and Sect. 5 discusses the role of BC vertical profiles in influencing meteorological parameters and PM2.5 concentrations. The conclusions of this study are given in Sect. 6.
2.1 Model configuration
A fully coupled online Weather Research and Forecasting with Chemistry model (WRF-Chem version 3.7.1) (Grell et al., 2005; Chapman et al., 2009) was employed to simulate the two severe haze events in Beijing from 7 to 20 December 2016, and the initial 4 d are spin-up. This model adopts Lambert projection and two nested domains with grid resolutions of 30 km (domain 01) and 10 km (domain 02). Figure 1 shows that the outer domain covers most of China with 100 (west–east) × 100 (south–north) grid cells, and the second domain covers the BTH region with 58 (west–east) × 76 (south–north) grid cells. The number of vertical layers is 29, with the first 15 layers below 2 km for finer resolution in the PBL. Meteorological initial and boundary conditions in this model were derived from National Centers for Environmental Prediction (NCEP) Final (FNL) Operational Model Global Tropospheric Analyses (ds083.2) with a spatial resolution of 1∘ × 1∘. MOZART-4 (Model for Ozone And Related chemical Tracers-4) simulation results provided the initial and lateral boundary conditions for the concentrations of chemical species in our model (Emmons et al., 2010).
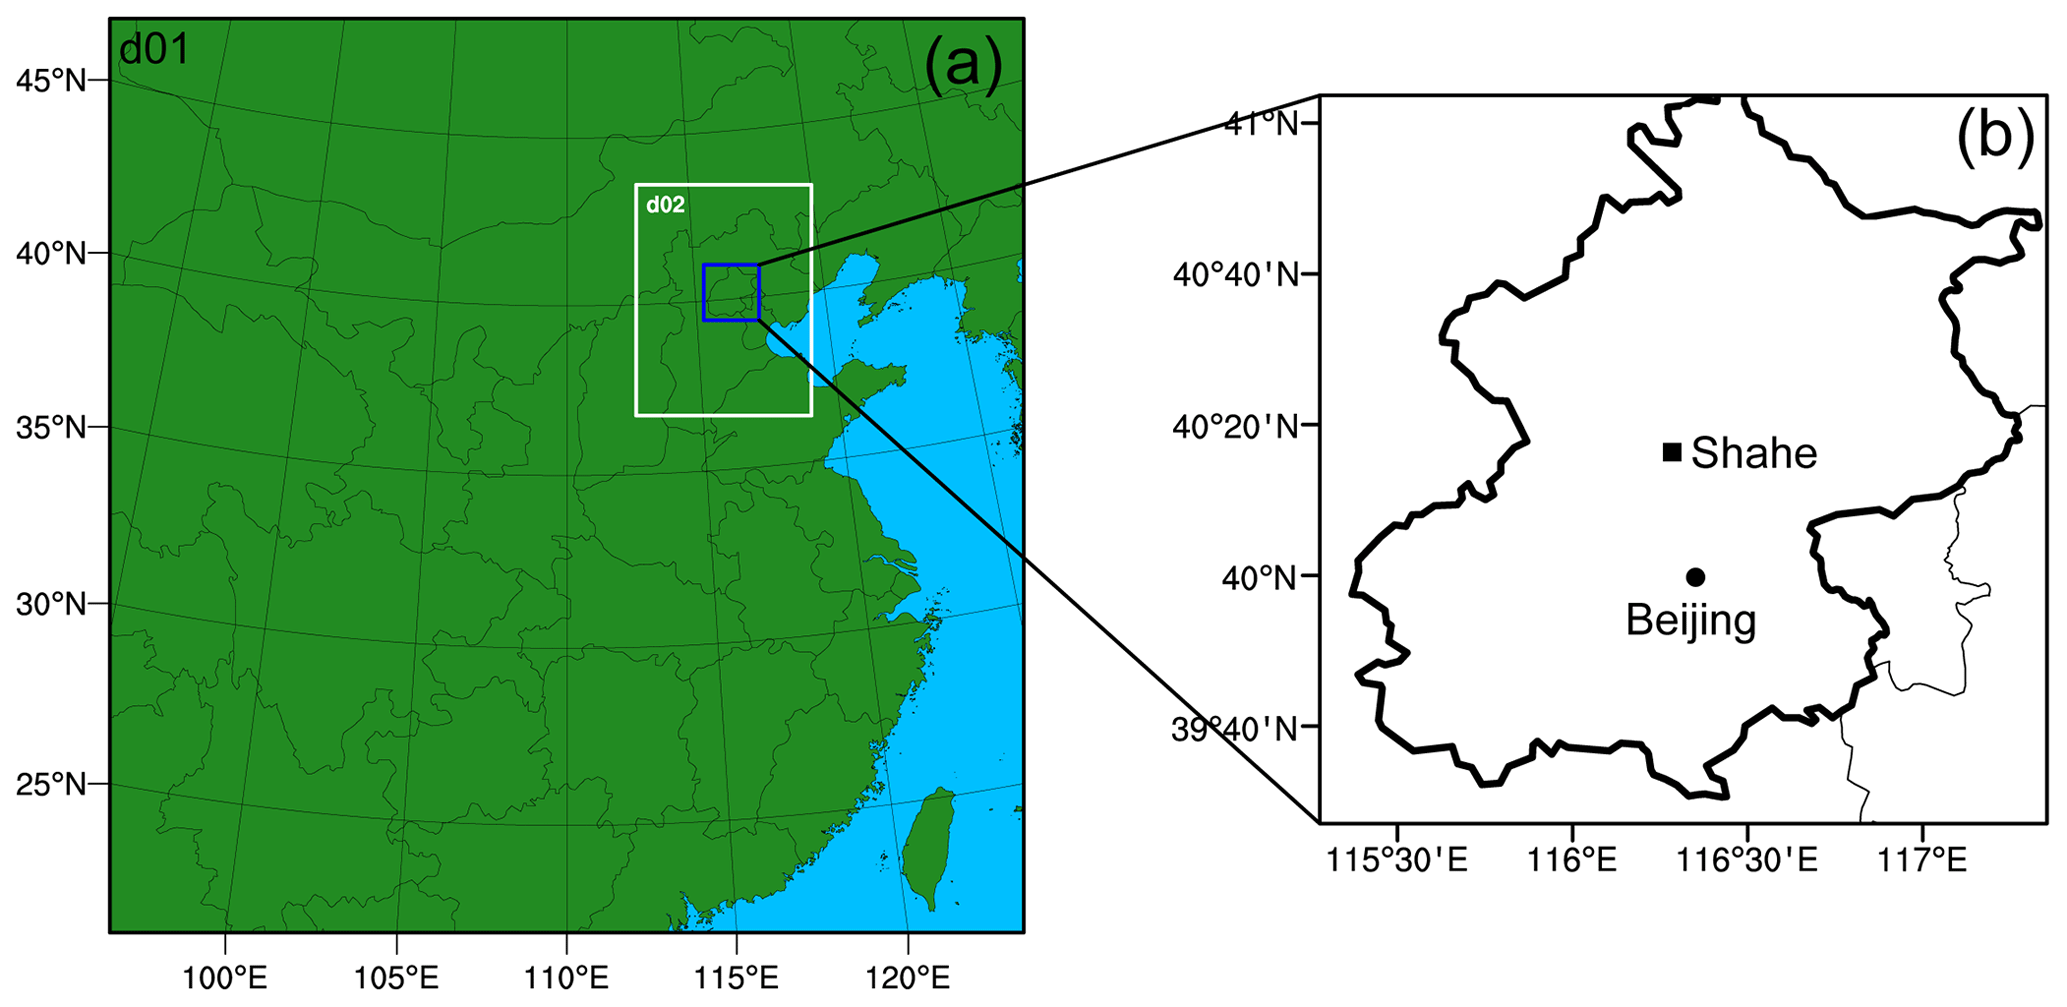
Figure 1(a) Two nested domains with grid resolutions of 30 km (d01) and 10 km (d02). (b) The BC vertical profiles were modified for the blue box, which covers all of Beijing.
Anthropogenic emission data in the year 2016 were obtained from the MEIC inventory with a spatial resolution of 0.25∘ × 0.25∘ (Zheng et al., 2018). This inventory includes sulfur dioxide (SO2), nitrogen oxides (NOx), carbon monoxide (CO), non-methane volatile organic compounds (NMVOCs), ammonia (NH3), BC, organic carbon (OC), PM2.5, PM10, and carbon dioxide (CO2), which were categorized into agriculture, industry, residence, transport, and power generation sectors (Li et al., 2017). The biogenic emissions were calculated online using MEGAN (Model of Emissions of Gases and Aerosol from Nature), including isoprene, terpene, and other substances emitted by plants (Guenther et al., 2006). Biomass burning emissions were taken from the Fire INventory from NCAR (FINNv1.5), which provides daily emissions at a horizontal resolution of ∼ 1 km2 (Wiedinmyer et al., 2011).
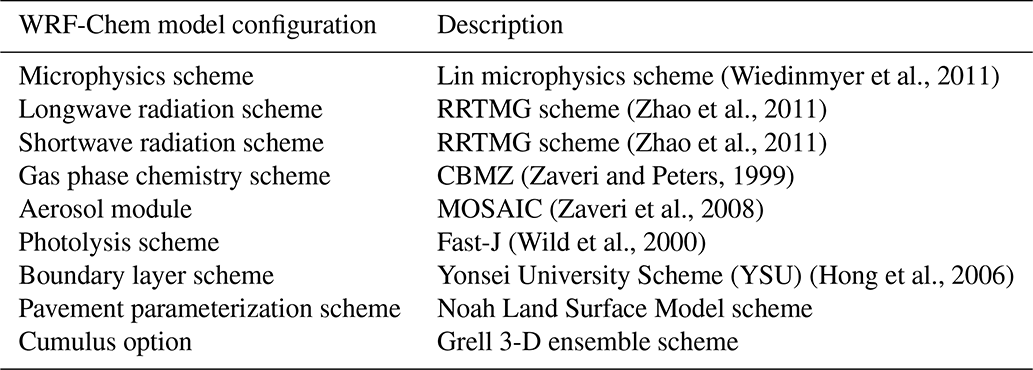
The parameterization schemes of physical and chemical processes of the WRF-Chem model adopted in the study are summarized in Table 1. The Carbon-Bond Mechanism version Z (CBMZ) is chosen to simulate the gas-phase chemistry. The aerosol scheme is the Model for Simulating Aerosol Interactions and Chemistry (MOSAIC), which includes sulfate, nitrate, ammonium, chloride, sodium, BC, OC, and other inorganic aerosol, and the aerosol particles are divided into eight particle size segments. However, the formation of secondary organic aerosol is not considered in this scheme (Zhang et al., 2012; Gao et al., 2016a). In MOSAIC, the aerosol particles are assumed to be an internal mixture, and aerosol optical properties are calculated by the volume averaging mixing method (Barnard et al., 2010; Stelson, 1990). The choice for photolysis schemes is the Fast-J photolysis scheme.
2.2 Integrated process rate (IPR) analysis
The IPR analysis has been widely applied to illustrate the impacts of each physical and chemical process on the variations in O3 concentrations (Zhang and Rao, 1999; Jiang et al., 2012; Gao et al., 2017, 2018). The improved IPR analysis method developed by Chen et al. (2019) in the WRF-Chem model is used in this work to quantitatively analyse the contributions of physical and chemical processes to PM2.5 concentrations, including the contributions from the sub-grid convection (CONV), vertical mixing (VMIX), chemistry (CHEM), regional transport (TRA), wet scavenging (WET), emission source (EMI), and other processes (OTHER). CONV refers to the transport within the sub-grid wet convective updrafts, downdrafts, and precipitation (Chen et al., 2019), and VMIX is affected by atmospheric turbulence and vertical distribution of PM2.5 concentrations (Zhang and Rao, 1999; Gao et al., 2018). CHEM represents PM2.5 production and loss including gas-phase, cloud, and aerosol chemistry. TRA is caused by advection, which is highly related to wind and horizontal distribution of PM2.5 concentrations (Gao et al., 2018; Chen et al., 2019). WET represents the wet removal processes of aerosols by in-cloud scavenging and below-cloud washout. EMI is controlled by emission source. OTHER represents the processes other than the above six processes in the model. The NET is the sum of all physical and chemical processes, which matches the variations in PM2.5 concentrations. It is worth noting that each IPR variable is an accumulated value which is the sum of each time step.
2.3 Observational data
To evaluate the model performance in simulating near-surface meteorological fields, the observed hourly temperature at 2 m (T2), relative humidity at 2 m (RH2), wind speed at 10 m (WS10), and wind direction at 10 m (WD10) at Beijing Capital International Airport station (40.08∘ N, 116.58∘ E) are collected from NOAA's National Climatic Data Center (http://gis.ncdc.noaa.gov/maps/ncei/cdo/hourly, last access: 3 February 2022). Due to the limited observations of planetary boundary layer heights (PBLHs), shortwave downward radiation flux (SWDOWN), and total cloud cover in Beijing, the reanalysis data of 3-hourly PBLH, SWDOWN, and total cloud cover for Beijing from the Global Data Assimilation System (GDAS) with a spatial resolution of 1∘ × 1∘ (http://ready.arl.noaa.gov/READYamet.php, last access: 3 February 2022) were used for model evaluation. More details about the GDAS dataset can be found in Rolph (2013) and Kong et al. (2015). The radiosonde data (temperature and relative humidity profiles) in Beijing were obtained from the University of Wyoming, Department of Atmospheric Science (http://weather.uwyo.edu/upperair/sounding.html, last access: 3 February 2022). Hourly concentrations of PM2.5, CO, NO2, SO2, and O3 at Beijing station were obtained from the China National Environmental Monitoring Center (CNEMC, http://www.cnemc.cn/, last access: 3 February 2022), which were used to evaluate the model performance in simulating pollutants at the surface. Aerosol optical depth (AOD) at 550 nm over China retrieved from the MODIS (Moderate Resolution Imaging Spectroradiometer) satellite was used to evaluate the horizontal distribution of simulated optical properties of aerosols in this study (https://ladsweb.modaps.eosdis.nasa.gov/, last access: 3 February 2022). The MYD03 (Level-1A) product with 1 km spatial resolution from the Aqua platform and the MOD03 (Level-1A) product with 1 km spatial resolution from the Terra platform were used in this study. The values of daily aerosol optical depth (AOD) at 500 and 675 nm in Beijing were obtained from the AERONET dataset (https://aeronet.gsfc.nasa.gov/, last access: 3 February 2022).
The vertical profiles of BC mass concentrations in Beijing were collected by King Air 350 aircraft using SP2 from 11–12 and 16–19 December 2016. The aircraft departed from Shahe (∼ 20 km to central Beijing) (Fig. 1) at 12:00–13:00 local time (LT) and returned around 15:00–16:00 LT, which avoided the possible diurnal variation in the PBL among flights. Most flights could reach 2.5 km. Zhao et al. (2019) reported that these vertical profiles of BC could be expressed as an exponential decline function except 11 December 2016, where C(h) (µg m−3) is BC concentration at altitude h (km), C0 (µg m−3) is BC concentration at the surface, and each hs value is calculated for each flight of BC vertical profile using nonlinear regression (Table S1 in the Supplement). Tian et al. (2019) observed a regional transport of pollution in Beijing from 10 to 12 December 2016 using SP2, and they found a different vertical structure of BC from that of Zhao et al. (2019), with the BC concentration at the altitudes of 400–900 m being 1.5 times higher than the near-surface BC concentration on 11 December 2016. More detailed information about the King Air 350 aircraft dataset can be found in Zhao et al. (2019), S. Ding et al. (2019), and Tian et al. (2019).
2.4 Numerical experiments
To compare the DRE of BC with the original and corrected vertical profiles and quantify the role of BC vertical profiles in influencing meteorological conditions and air pollutants, we performed the following numerical experiments as summarized in Table 2.
-
CTRL. This is the control simulation with the direct and indirect radiative effects of all aerosols (BC, OC, sulfate, nitrate, ammonium, Na+, Cl−, and other inorganics – OIN) included for the time period of 11–20 December 2016. The vertical profiles of BC were the default ones simulated by the model.
-
NoBCrad. This is the same as the CTRL simulation, except that the DRE of BC was turned off.
-
VerBC_obs. This is the same as the CTRL simulation, except that the BC vertical profiles in the model were modified according to the observed ones. The specific method will be discussed below.
-
VerBC_hs1-6. This is the same as the CTRL simulation, except that the vertical profiles of BC in the model were modified according to the exponential decline function (). The values of hs in VerBC_hs1 to VerBC_hs6 were 0.35 to 0.96 (from small to large), respectively.
-
VerBC_RT. This is the same as the VerBC_hs1-6 simulations, except that the BC vertical profiles in the model were modified according to the observed transport BC vertical profile on 11 December 2016, which was affected by regional transport.
Table 2Numerical experiments. Y indicates “on”, and N indicates “off”.
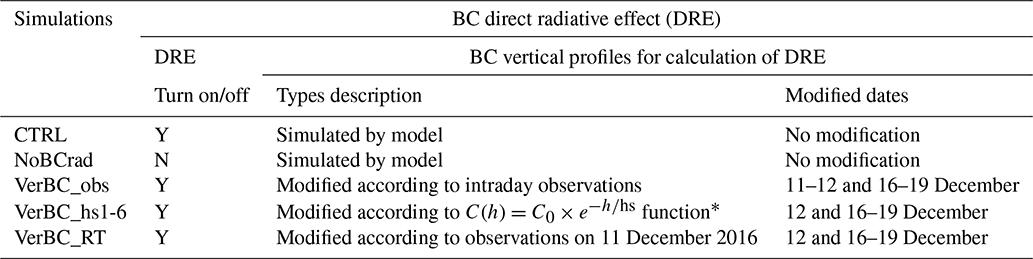
∗ The values of hs in VerBC_hs1, VerBC_hs2, VerBC_hs3, VerBC_hs4, VerBC_hs5, and VerBC_hs6 are 0.35, 0.48, 0.53, 0.79, 0.82, and 0.96, respectively.
In the case of NoBCrad, the BC DRE was turned off by setting the BC mass concentration equal to zero when calculating the optical properties of BC, following the studies of Qiu et al. (2017) and Chen et al. (2021). In the VerBC_obs experiment, we modified the simulated BC vertical profile online using the observed BC vertical profile on the corresponding day. Firstly, we interpolated the observed BC concentrations to the height of each layer in the model as Cobs_int(i). Each layer in the model has a top height and a bottom height, and we selected the middle height of this layer for interpolation. Secondly, we used Cobs_int(i) to calculate the BC mass column burden in each layer (Mobs_int(i)) in the model, and Pobs_int(i) is the percentage of BC mass column burden in each layer to the total BC mass column burden (Fig. S1) calculated by
where Hsim_top(i) is the top height of layer i and Hsim_bot(i)is the bottom height of layer i.
In the VerBC_obs simulation, the simulated BC mass column burden was redistributed to each layer below 2.5 km according to the calculated Pobs_int(i). These procedures ensure that the modification of the BC vertical profile for each day in the model by using the observed data does not change the total BC mass column burden. Since the aircraft measured only BC concentrations below 2.5 km, we modify the BC profile up to the 16th model layer (about 2.5 km in Beijing).
In the experiment of VerBC_hs1∼6, we also used the above method to modify the BC vertical profile by an exponential decline function, which is . However, in cases of VerBC_hs1∼6, we modified for the dates of 12 and 16–19 December. On 11 December, BC did not show an exponential decline with height due to the regional transport. In the simulation of VerBC_RT, the method and setting were the same as VerBC_hs1∼6, except that the BC vertical profile in the model was modified according to the observed one on 11 December 2016. In the VerBC_obs, VerBC_hs1∼6, and VerBC_RT cases, the modifications of BC vertical profiles were performed only when the direct radiative forcing of BC was calculated. All other physical and chemical processes in these experiments still used the original BC vertical profiles simulated by the model. The BC vertical profiles were only modified in the blue square shown in Fig. 1a.
3.1 Near-surface air pollutants and BC vertical profiles
Figure 2a–i show the horizontal distributions of simulated surface layer PM2.5 concentrations at 14:00 LT from 11 to 19 December 2016. In Beijing, high PM2.5 concentrations of 234.1 and 165.9 µg m−3 occurred on 11 and 12 December, respectively. The severe pollution in Beijing on 11 December was caused by regional transport from the heavily polluted southern area under a prevailing southerly air flow (Tian et al., 2019). From 16 December, PM2.5 started to accumulate in eastern China, and the concentrations of PM2.5 reached the highest value of 217.8 µg m−3 on 19 December in Beijing. The daily PM2.5 concentrations (Fig. 2j) in Beijing had low values from 13–15 December 2016. The model results for Beijing in this paper are the averages over the region of the blue square shown in Fig. 1a unless stated otherwise. The severe pollution from 16–19 December 2016 was mainly affected by local emissions. We are mainly focused on the two heavy pollution incidents (11–12 and 16–19 December 2016) in the following sections.
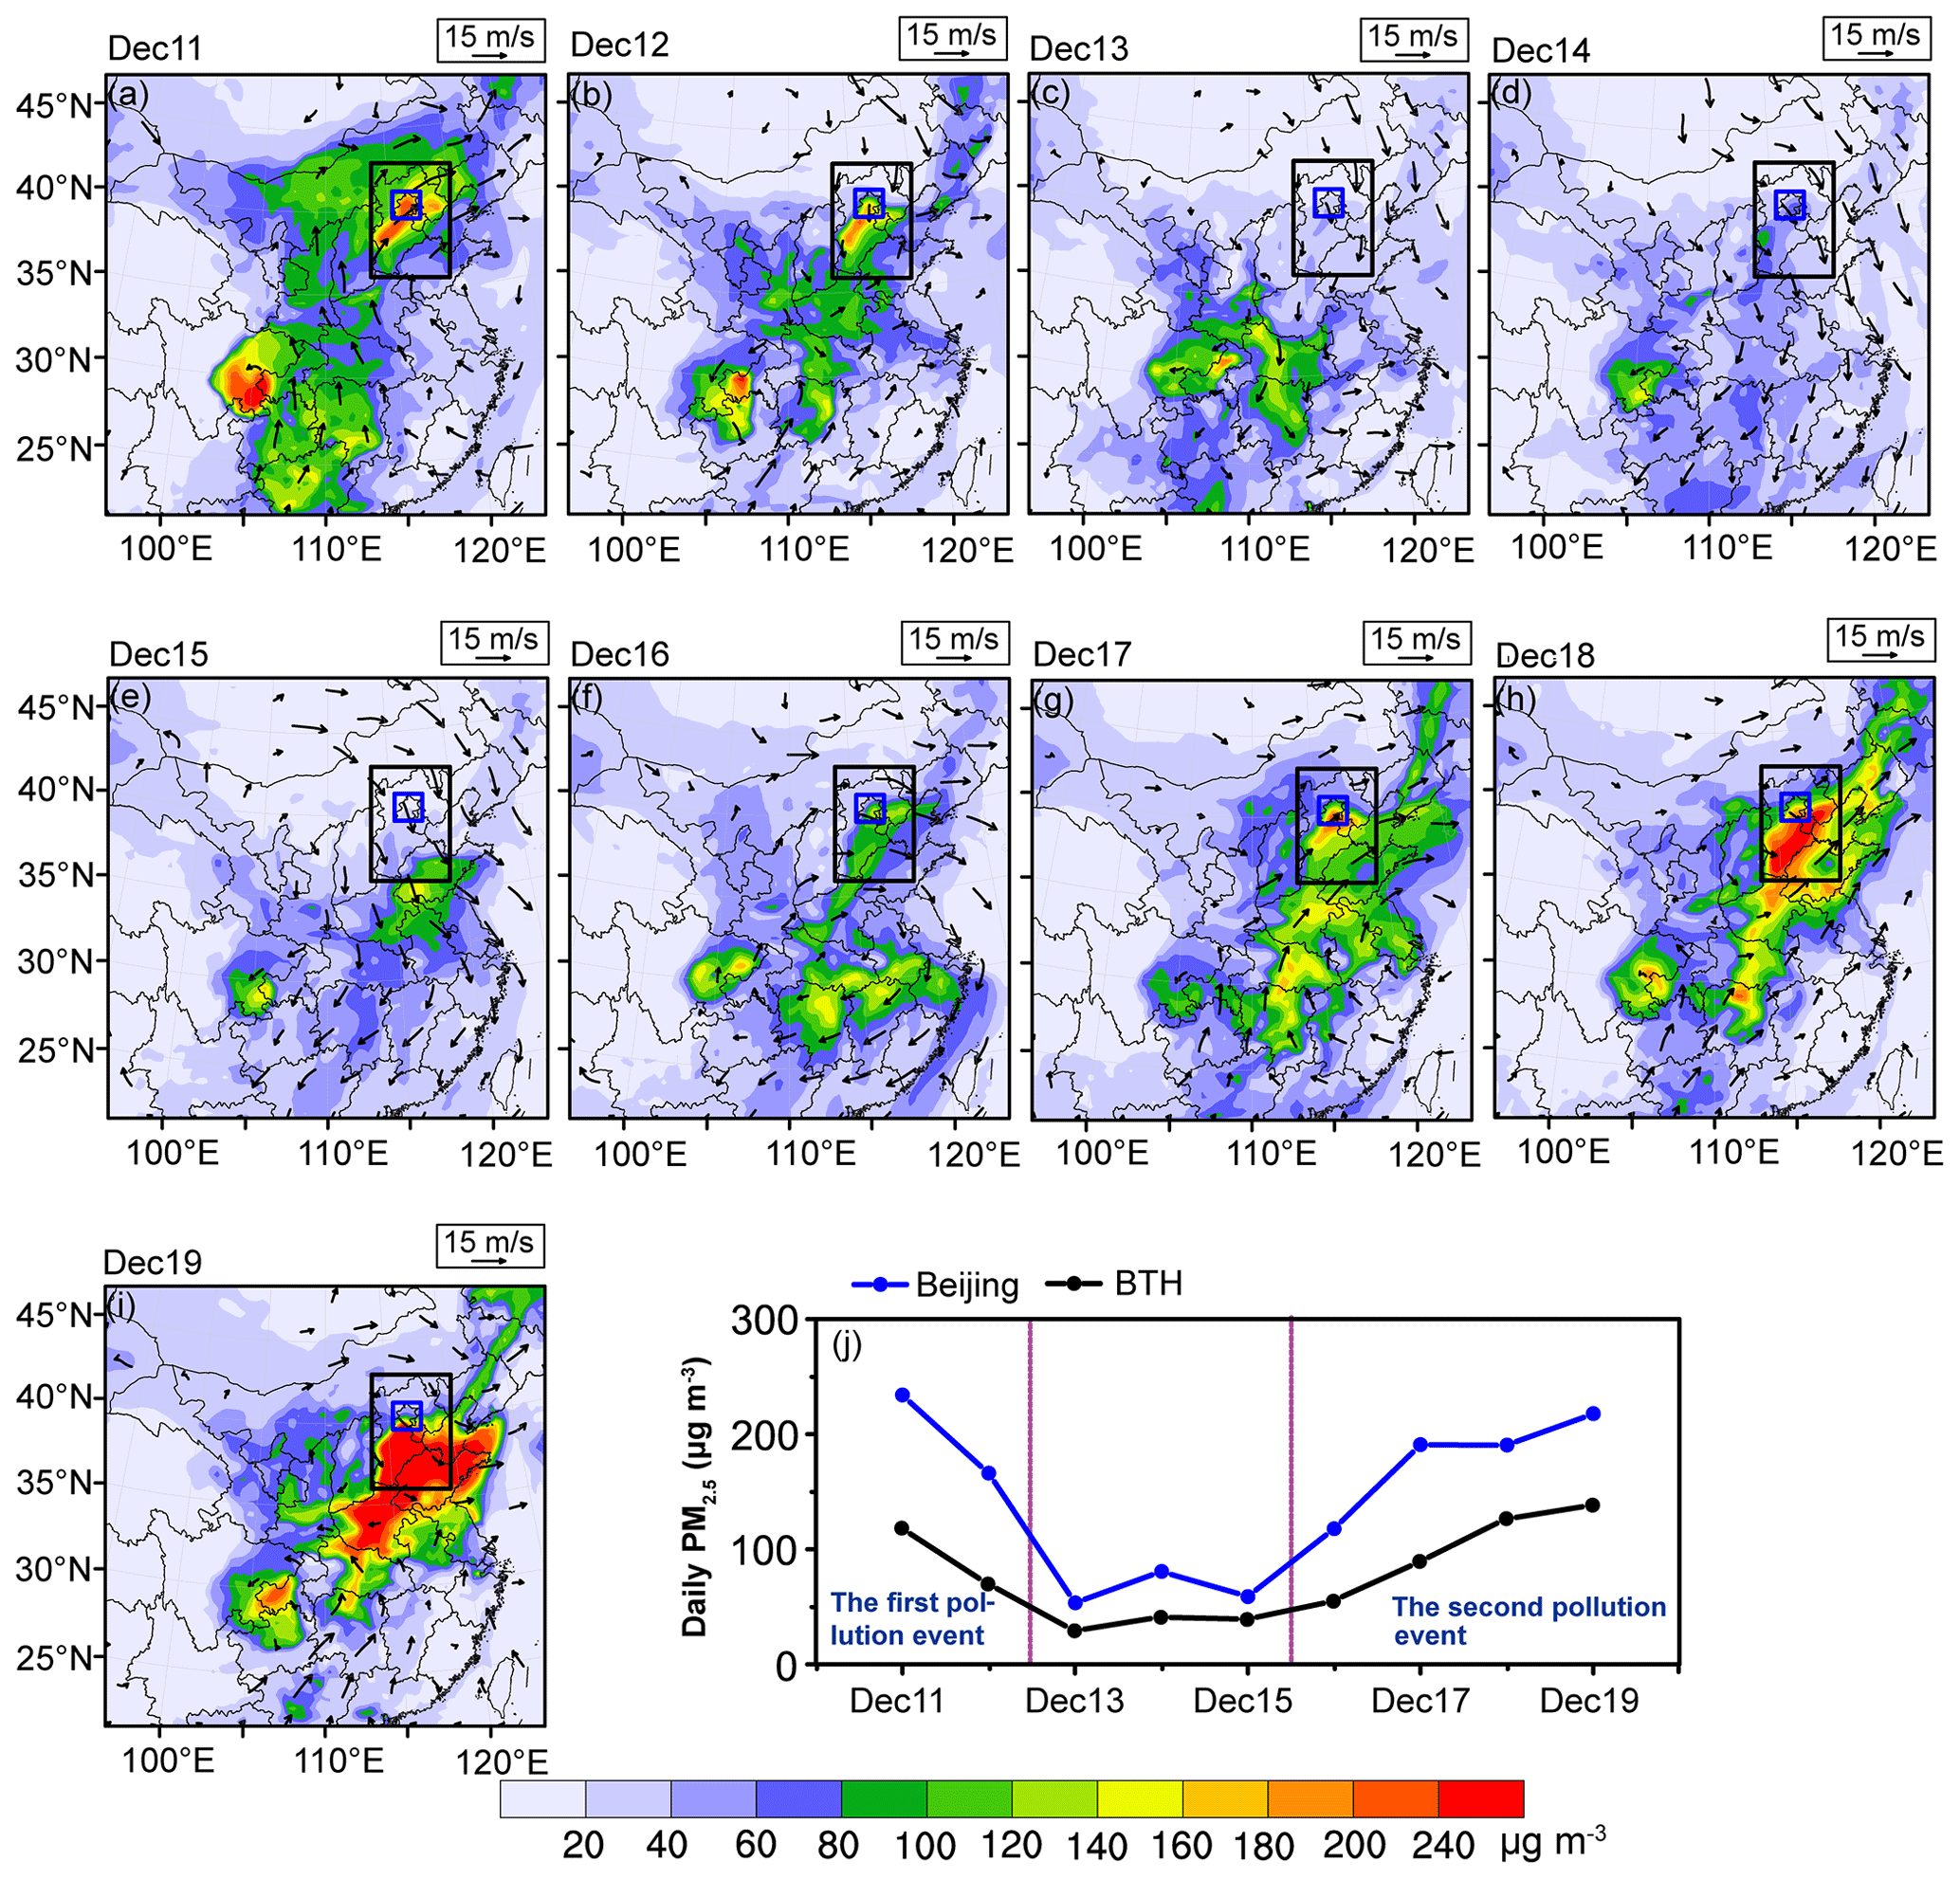
Figure 2(a–i) Simulated spatial distributions of surface layer PM2.5 concentrations (µg m−3) and winds (m s−1) at 850 hPa at 14:00 LT from 11 to 19 December 2016. Black and blue squares in each panel denote the regions of Beijing–Tianjin–Hebei and Beijing, respectively. (j) Time series of simulated mean daily PM2.5 concentration from 11 to 19 December 2016 averaged over Beijing (blue square) and BTH (black square).
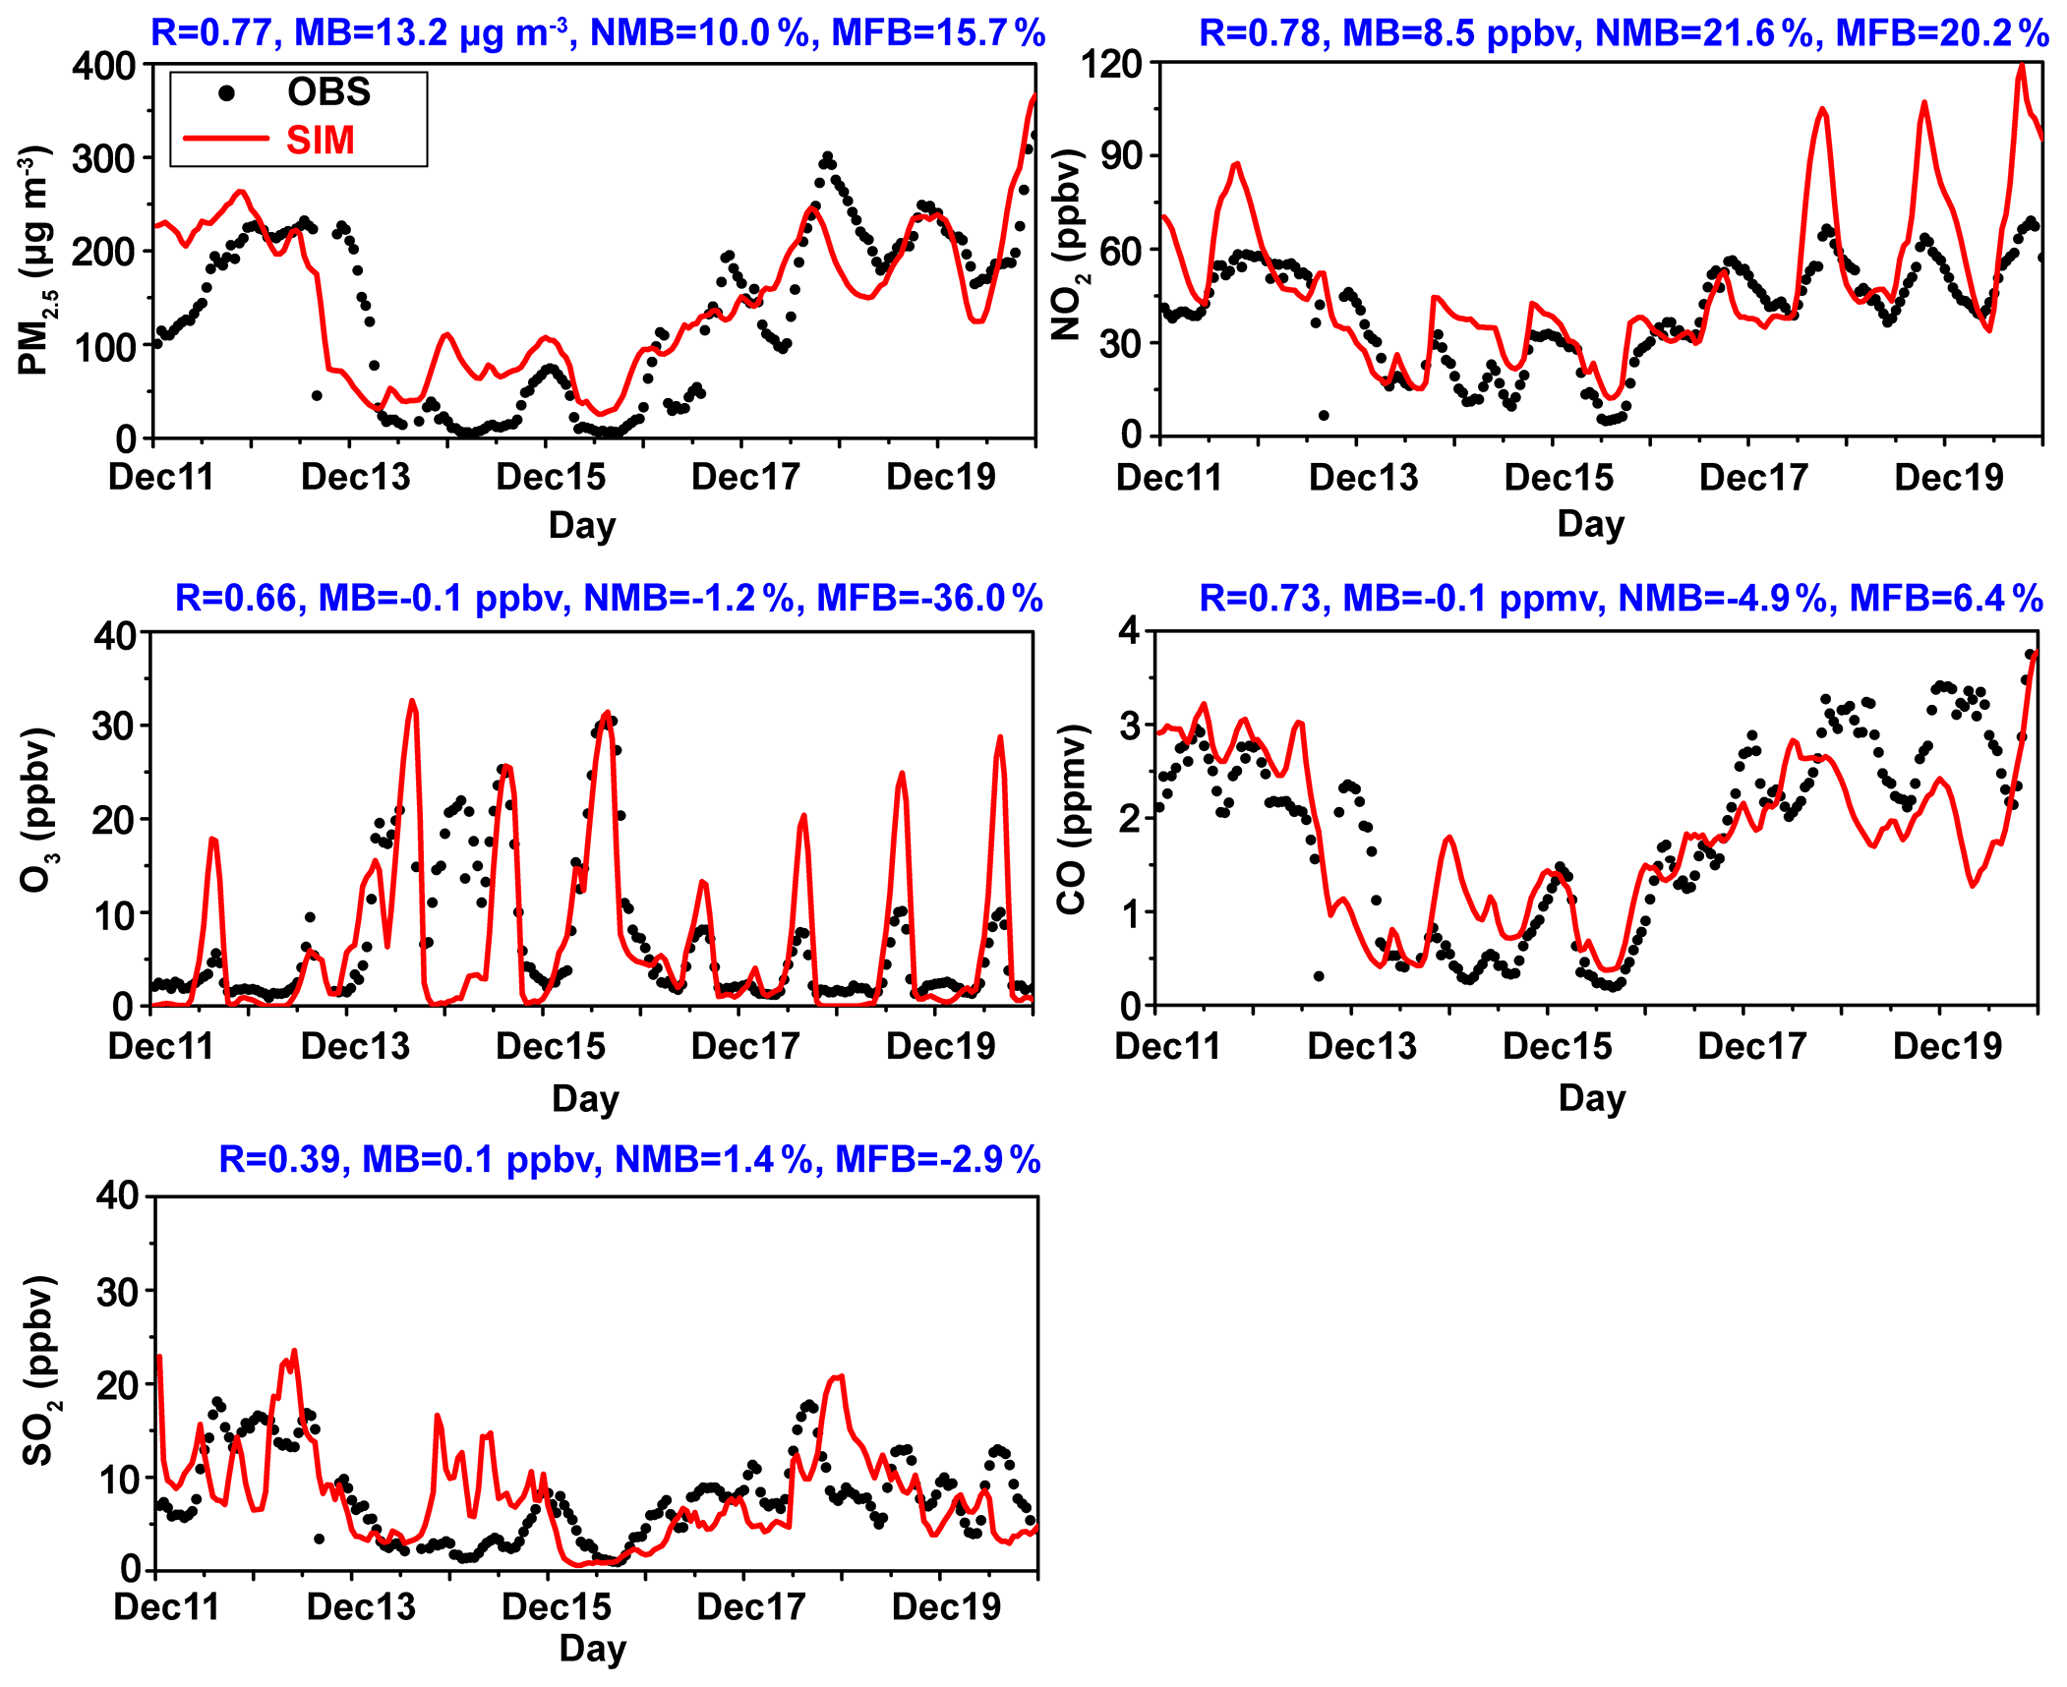
Figure 3Time series of the observed (black dots) and simulated (red lines) hourly concentrations of PM2.5 (µg m−3), NO2 (ppbv), O3 (ppbv), CO (ppmv), and SO2 (ppbv) in Beijing from 11 to 19 December 2016. The observations and simulations in Beijing were averaged over 12 observational sites and corresponding grid points, respectively.
Table 3Statistical metrics for temperature at 2 m (T2; ∘), relative humidity at 2 m (RH2; %), wind speed at 10 m (WS10; m s−1), wind direction at 10 m (WD10, ∘), PBLH (m), SWDOWN (W m−2), PM2.5 (µg m−3), SO2 (ppbv), NO2 (ppbv), CO (ppmv), and O3 (ppbv).
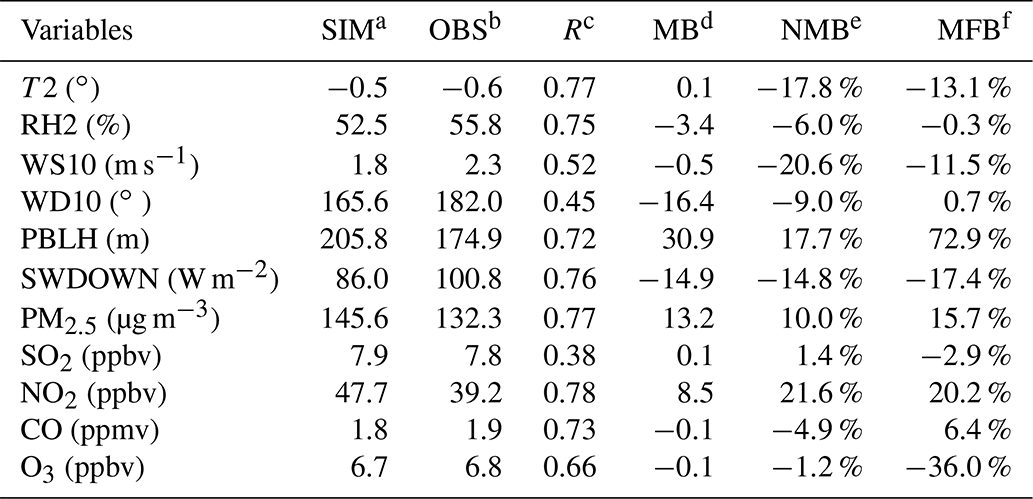
a,b SIM and OBS represent the averaged model results and observations in Beijing from 11 to 19 December 2016.
c R is the correlation coefficient, which is calculated between hourly observations and simulations in Beijing from 11 to 19 December 2016, ,
where OBSi and SIMi are the hourly observed and simulated data in
Beijing and n is the total number of hours.
d MB is the mean bias,
.
e NMB is the normalized mean bias,
.
f MFB is the mean fraction bias,
.
Results from the CTRL simulation were compared with the observed hourly surface concentrations of PM2.5, NO2, O3, CO, and SO2 from 11–19 December 2016 in Beijing in Fig. 3. The observed maximum PM2.5 concentration of 219.5 µg m−3 occurred on 18 December, far exceeding the national air quality standard for daily PM2.5 of 75 µg m−3 (Wang et al., 2017). The correlation coefficient (R), mean bias (MB), normalized mean bias (NMB), and mean fraction bias (MFB) are summarized in Table 3. The model can reasonably reproduce the temporal variations in PM2.5, NO2, O3, and CO; the correlation coefficients between simulated and observed hourly concentrations are 0.77, 0.78, 0.66, and 0.73, respectively. The correlation coefficient for SO2 is lower (0.38). Gao et al. (2016b) explained that the WRF-Chem model cannot represent the SO2 concentration and its change with time well due to the uncertainty in SO2 emissions and missing heterogeneous oxidation. Compared with observations, the model overestimates the concentrations of PM2.5 and NO2 in Beijing with the MBs and NMBs of 13.2 µg m−3 and 10.0 % and 8.5 ppbv and 21.6 %, respectively, and underestimates the concentrations of O3 (−0.1 ppbv, −1.2 %) and CO (−0.1 ppmv, −4.9 %). It should be noted that the model performance in simulating PM2.5, SO2, CO, and O3 is better during the two haze events than on clean days. For hourly PM2.5, for example, the MBs (NMBs) are 29.1 µg m−3 (82.5 %) on clean days and 6.3 µg m−3 (3.5 %) during the two haze events. The possible reasons for the overall overestimation of PM2.5 are as follows: (1) the model biases in underestimating WS10 and daytime PBLH and (2) the uncertainties in anthropogenic emission data (e.g. the overestimation in the BC emissions) (Qiu et al., 2017; Chen et al., 2021). Overall, the model can capture the two severe pollution events in Beijing from 11–19 December 2016 fairly well.
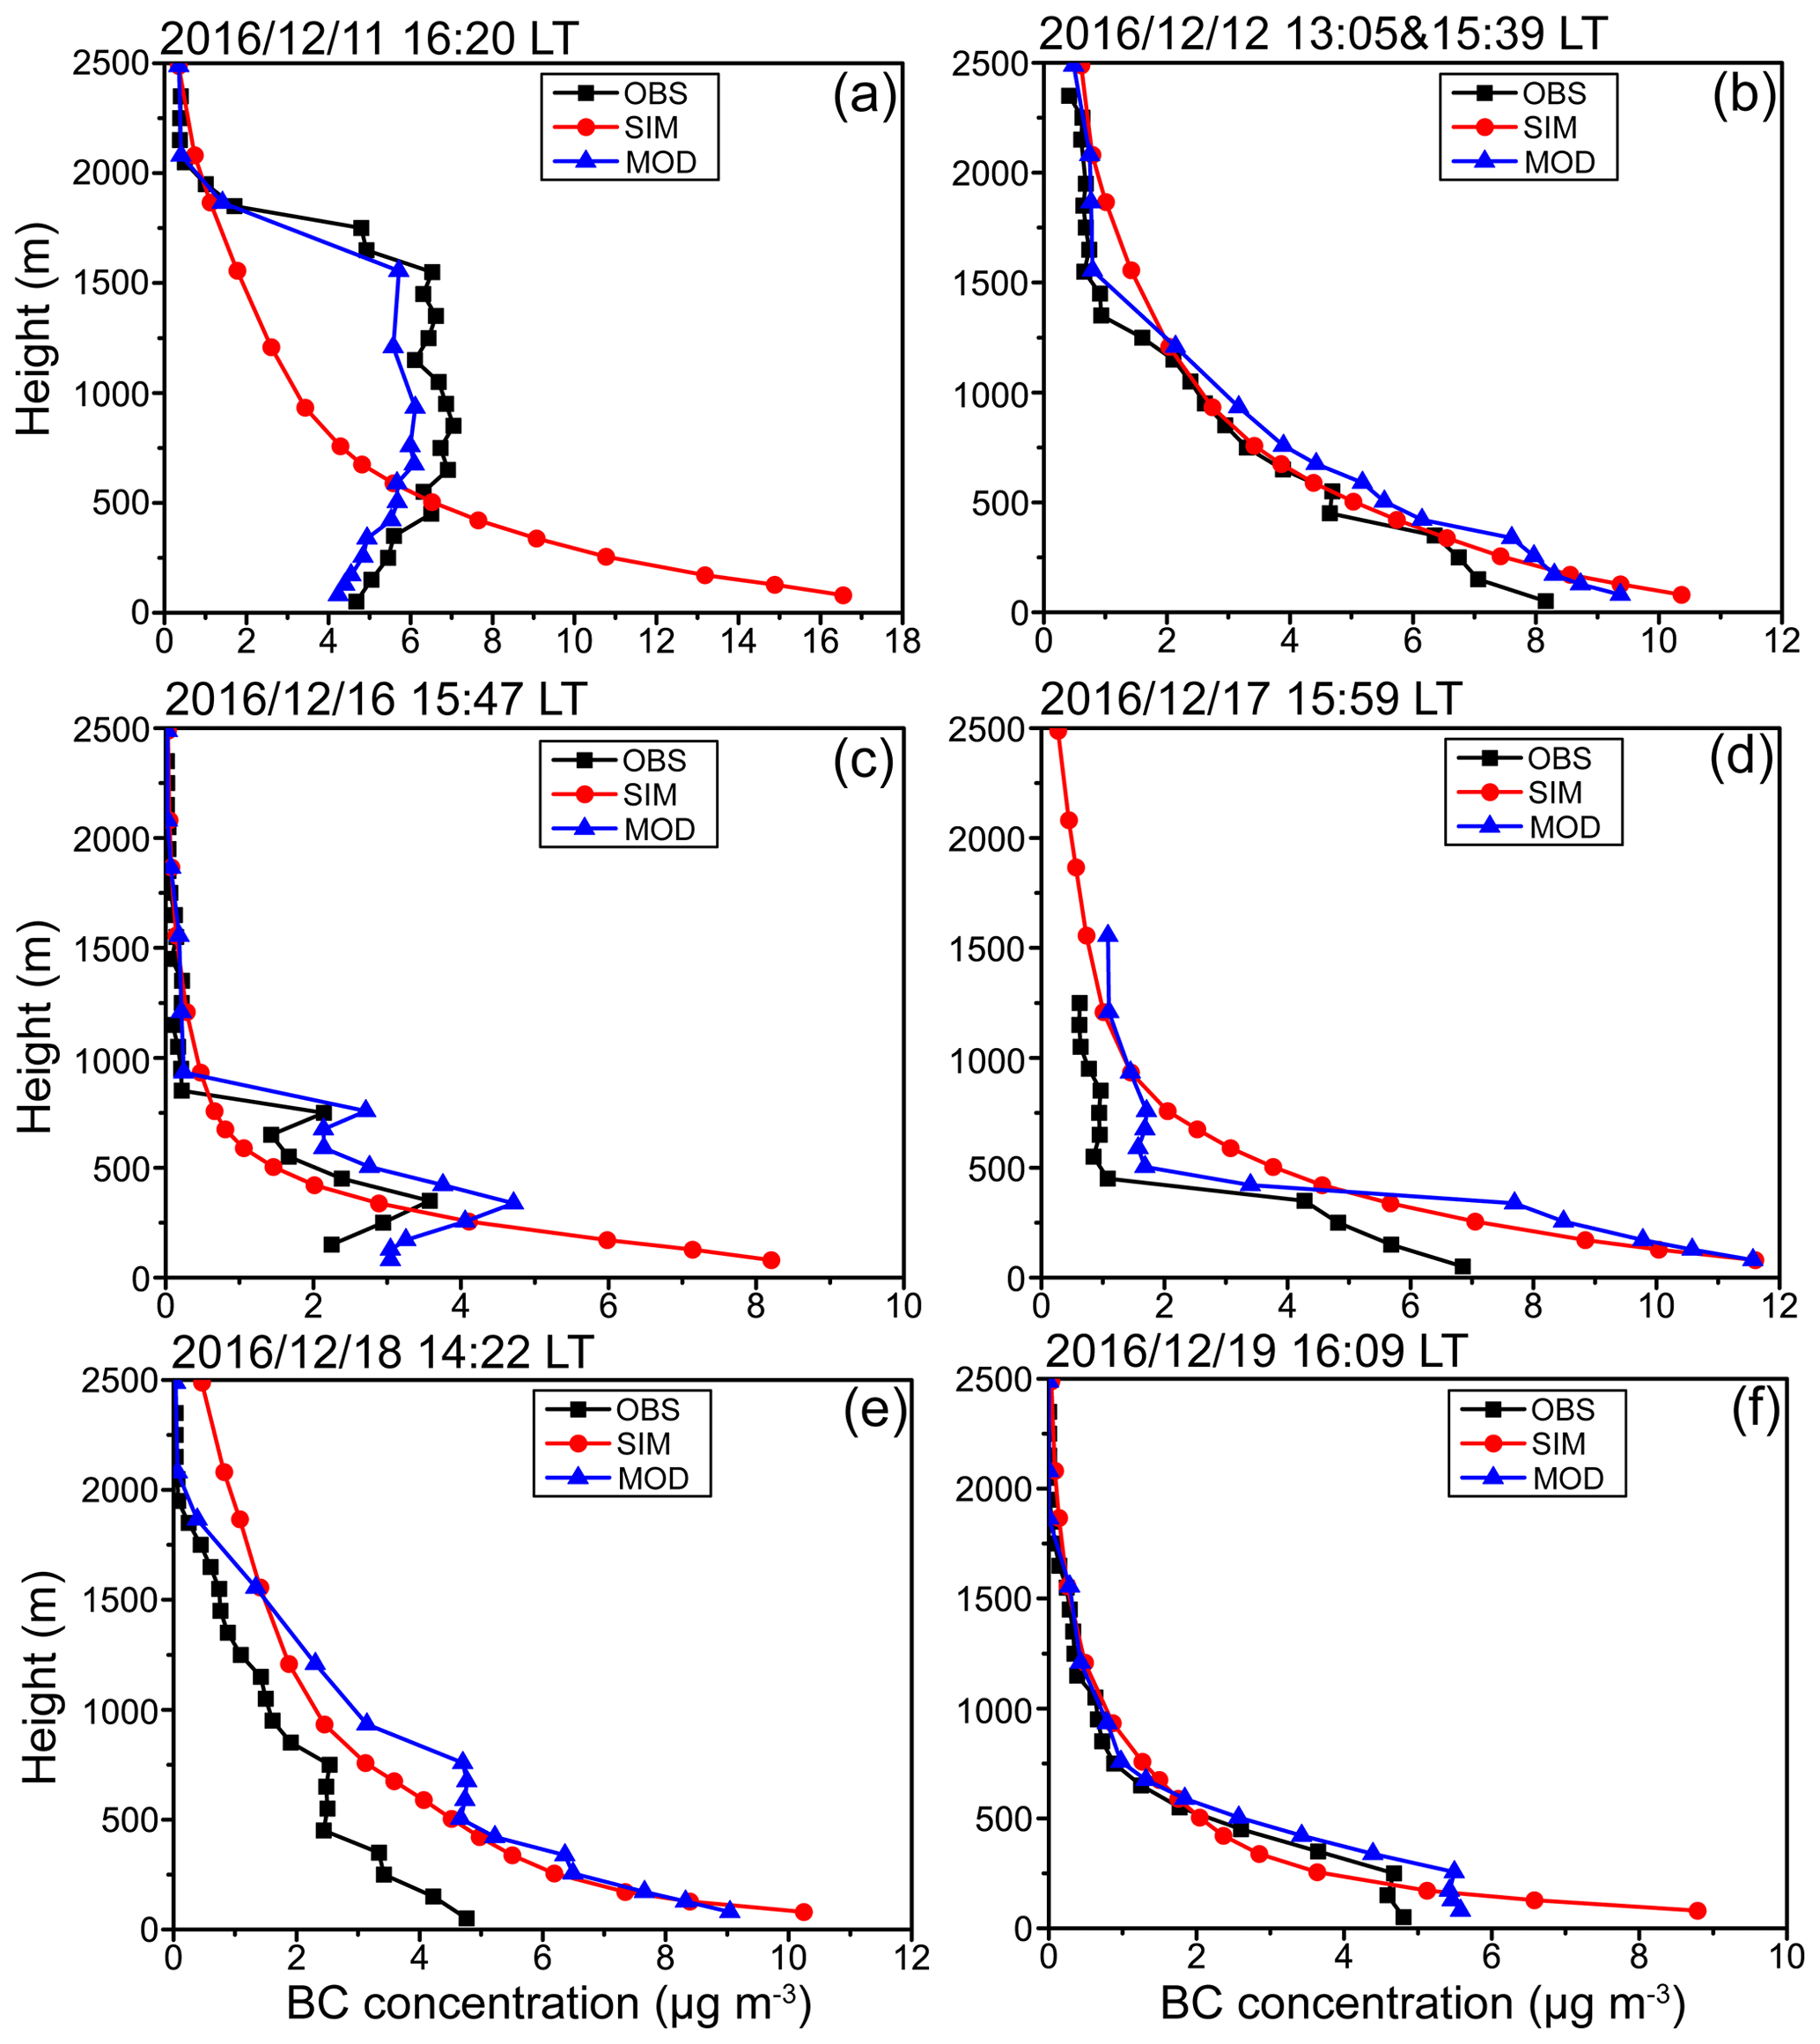
Figure 4Observed (black line), simulated (red line), and modified (blue line) BC vertical profiles in Beijing on 11–12 and 16–19 December 2016. The time of observation is indicated on top of each panel. The model results are 2 h averages around the observation time.
Because of the lack of measured BC vertical profiles from 13–15 December 2016 in Beijing, Fig. 4 compares only the simulated vertical profiles of BC with observations for the two polluted events (11–12 and 16–19 December 2016). Observed mass concentrations of BC decreased exponentially with altitude on all days except for 11 December when regional transport of pollution dominated. On 11 December, the observed maximum mass concentration of BC (7.0 µg m−3) occurred at 850 m altitude, which was much higher than the surface layer concentration of 4.7 µg m−3. Compared with the observed vertical profiles of BC, the model can represent the decreases in BC mass concentration with height on 12 and 16–19 December well but cannot reproduce the vertical profile on 11 December. Possible reasons for the model's failing to represent the BC vertical profile on 11 December are as follows: (1) the model cannot capture the wind at high altitudes and does not reproduce the high-altitude BC concentrations in the surrounding areas of Beijing, and (2) the model underestimates the daily maximum PBLH in Beijing, which inhibits the upward transport of surface layer BC. Averaged over the two pollution events, the simulated BC mass concentration was overestimated by 87.4 % on the ground and underestimated by 33.1 % at an altitude of 1000 m compared with the observations in Beijing. The inaccuracy of the vertical distribution of BC would lead to inaccurate representation of the interactions between BC and PBL, especially in heavily polluted events.
3.2 Meteorological parameters
The first haze event started on 11 December when southeasterlies transported polluted air from southern BTH to Beijing (Fig. 2a). Although the southeasterlies turned into northeasterlies in Beijing on 12 December, PM2.5 concentrations were still high because of the high relative humidity (63.2 %) that was conductive to the formation of secondary aerosols. With the relatively high wind speed of 3.6 m s−1 and low relative humidity of 37.2 % in Beijing from 13–15 December, the haze pollution gradually disappeared (Fig. 2c–e). From 16 to 19 December, PM2.5 began to accumulate again with unfavourable diffusion conditions (WS10 of 1.4 m s−1) and enhanced formation of secondary aerosols under high relative humidity of 67.1 % (J. Li et al., 2019; Dai et al., 2021). Throughout the simulated period of 11–19 December 2016, Beijing had no precipitation and was partly cloudy (Fig. 5g–h). Figure 5 shows the hourly simulated and observed T2, RH2, WS10, WD10, PBLH, SWDOWN, precipitation, and total cloud cover in Beijing from 11 to 19 December 2016. The statistical metrics are summarized in Table 3. In the two severe haze events, the observed maximum RH2 on each day exceeded 70.0 %, which accelerated the formation of secondary aerosols (Sun et al., 2006; Wang et al., 2014). Compared with the observations, the model can represent the temporal variation in T2 and RH2 well with correlation coefficients of 0.77 and 0.75, respectively, but slightly overestimates T2 with a MB of 0.1∘ and underestimates RH2 with a MB of 3.4 %. For WS10, observations and simulated results both show low wind speed with the mean values of 1.5 and 1.4 m s−1 in Beijing during the two periods of haze events. Such a meteorological condition was very beneficial to the accumulation of near-surface pollution. The WRF-Chem model also captures the high values of WS10 from 14 to 15 December. For wind direction at 10 m, the NMB is −9.0 % and the R is 0.45, which indicates that the model can simulate the change of wind direction during the period of heavy pollution. For PBL, the reanalysis PBL was 118.7 m during the two severe haze events, compared to 287.5 m during the clean period. The model can represent the change of PBLH in Beijing from 11 to 19 December 2016 with R of 0.72. The model overestimates PBLH by 30.9 m (17.7 %) in Beijing as averaged over 11–19 December 2016. The overestimation is mainly in the hours of 00:00–08:00 and 17:00–23:00 LT. It is noted that the reanalysis PBLH values provided by GDAS of NOAA were mostly 50–60 m at 00:00–08:00 and 17:00–23:00 LT in Beijing, far below the simulated mean value of 154.5 m in these hours. There might be biases in the PBLH from GDAS. Several previous studies showed that the values of observed PBLH from lidar measurements were about 200 m at night during haze events (Wang et al., 2012; Luan et al., 2018; Chu et al., 2019). The simulated SWDOWN in CTRL experiment agrees well with the observations with R and MB of 0.76 and −14.9 W m−2. Due to the limitation of the model outputs, the model provides only information of whether there is cloud in the grid or not. The model can reproduce the presence of cloud from 11–19 December 2016 well. Both observations and model results show no precipitation in the studied time period.

Figure 5Comparisons of simulated meteorological parameters from CTRL simulation with measurements. The black dots and red lines are the observed (reanalysis) and simulated hourly data of T2 (∘), RH2 (%), precipitation (mm), and 3-hourly data of PBL height (m), SWDOWN (W m−2), total cloud cover (%), 6-hourly data of WS10 (m s−1), and daily data of WD10 (∘) in Beijing from 11 to 19 December 2016. PBLH, SWDOWN, and total cloud cover are taken from GDAS. The WRF-Chem model output shows only whether a grid has cloud (Y) or no cloud (N).
The simulated and observed vertical profiles of temperature in Beijing from 11–19 December 2016 are shown in Fig. S2. The observed vertical temperature profiles are available only at 08:00 and 20:00 LT. During the two severe pollution events, strong temperature inversions below 1500 m were observed in Beijing, which inhibited vertical mixing and caused the accumulation of pollutants near the ground. The model captures these temperature inversions well but overestimates the inversion layer height on 11 December and underestimates the inversion layer height from 16 to 19 December. The inaccuracy of the simulated inversion layer height may be due to the fact that the model cannot correctly represent the vertical profiles of BC (Fig. 4).
3.3 AOD and AAOD
AOD (AAOD) is the measure of aerosols (absorbing aerosols) distributed within a column of air from the surface to the top of the atmosphere (Khor et al., 2014). Figure S3 shows the horizontal spatial distributions of observed and simulated AOD at 550 nm over the NCP averaged over 11–19 December 2016. The model can generally reproduce the horizontal distribution of AOD, with a spatial correlation coefficient of 0.89. However, the model underestimates AOD over the NCP region. Many previous studies have shown that MODIS retrieval tends to overestimate AOD over NCP (Li et al., 2016; Qiu et al., 2017). We also compared the simulated hourly AAOD at 550 nm with AERONET AAOD at Beijing and Xianghe stations in Fig. 6. The correlation coefficient between simulations and observations is 0.85. Compared with AERONET AAOD, simulated AAOD values at Beijing and Xianghe are overestimated by 0.02 (33.3 %) and 0.02 (39.9 %), respectively.

Figure 6Comparison of simulated absorption aerosol optical depth (AAOD) at 550 nm with observations at Beijing (39.98∘ N, 116.38∘ E) and Xianghe (39.75∘ N, 116.96∘ E) stations from 11 to 19 December 2016.
As shown in Fig. 4, the model does not represent the vertical distribution of BC concentrations well during the two heavily polluted events, especially on 11 December. So, in this section, we examine the differences in the BC DRE on meteorology and concentrations of pollutants with the original and modified vertical profiles.
4.1 Direct radiative effect of BC on meteorology
Figure 7 shows the atmospheric temperature and PBLH simulated from the CTRL simulation and their changes caused by BC DRE with the original profiles (CTRL minus NoBCrad) and modified profiles (VerBC_obs minus NoBCrad), over Beijing from 11 to 19 December 2016. Light-absorbing BC heated the air at around 300 m on 11 and 16–19 December, regardless of the original or modified BC vertical profiles (Fig. 7b and c). With the original and modified BC profiles, the maximum warming effects in the PBL were 0.8 and 0.9∘, respectively, at 14:00 LT on 18 December. Although BC concentration was the highest at the surface, the largest increase in temperature occurred in the upper layers because of the stronger shortwave absorption efficiency of BC at higher altitude (Ding et al., 2016; Wang et al., 2018). The warming at around 300 m resulted in a more stable stratification, thereby weakening convective motions (Gao et al., 2018). The largest reductions in PBLH were 133.8 m (28.0 %) at 14:00 LT on 12 December and 141.2 m (59.0 %) at 14:00 LT on 18 December in Beijing with the original and modified BC vertical profiles, respectively. On 11 December when regional transport of pollution dominated, relative to the simulation with the original BC profile, simulated air temperature with the modified profile was lower by about 0.5∘ within the PBL (Fig. 7d), which was caused by the observed maximum mass concentration of BC around 850 m altitude (Fig. 4a). Correspondingly, the maximum reduction in PBLH of 74.2 m was also simulated on 11 December. On 16–19 December when local emissions dominated, compared to the effects of the original BC profiles, the air temperatures at around 300 m were all higher with modified BC. The largest difference of +0.1∘ was simulated in the PBL on 18 December (Fig. 7d).

Figure 7(a) Simulated hourly vertical profiles of temperature (contour) and PBLH (red solid line) over Beijing at local time (LT) from 11 to 19 December 2016. (b–d) Time series of changes in vertical temperature (contour) and PBLH (ΔPBLH; red solid line) induced by BC DRE with the original (b; CTRL minus NoBCrad) and modified vertical profiles (c; VerBC_obs minus NoBCrad) and the difference between the effects of the modified and original BC profiles (d; VerBC_obs minus CTRL) over the Beijing region from 11 to 19 December 2016.
Figure 8 shows the spatial distributions of changes in T2, sea-level pressure (SLP), and wind at 10 m caused by BC DRE with the original and modified vertical profiles. BC DRE with both the original and modified vertical profiles produced anomalous northeasterlies in eastern BTH during the two haze events. The mechanism of such changes is that BC DRE induced a strong warming over the Bohai Sea in the east of BTH with a maximum warming of about 1.8∘, resulting in an anomalous low pressure here and consequently anomalous northeasterlies in eastern BTH (Fig. 8c–d). The similar changes in winds caused by the heating effect of BC were also reported in previous studies (Gao et al., 2016b; Qiu et al., 2017; Chen et al., 2021).
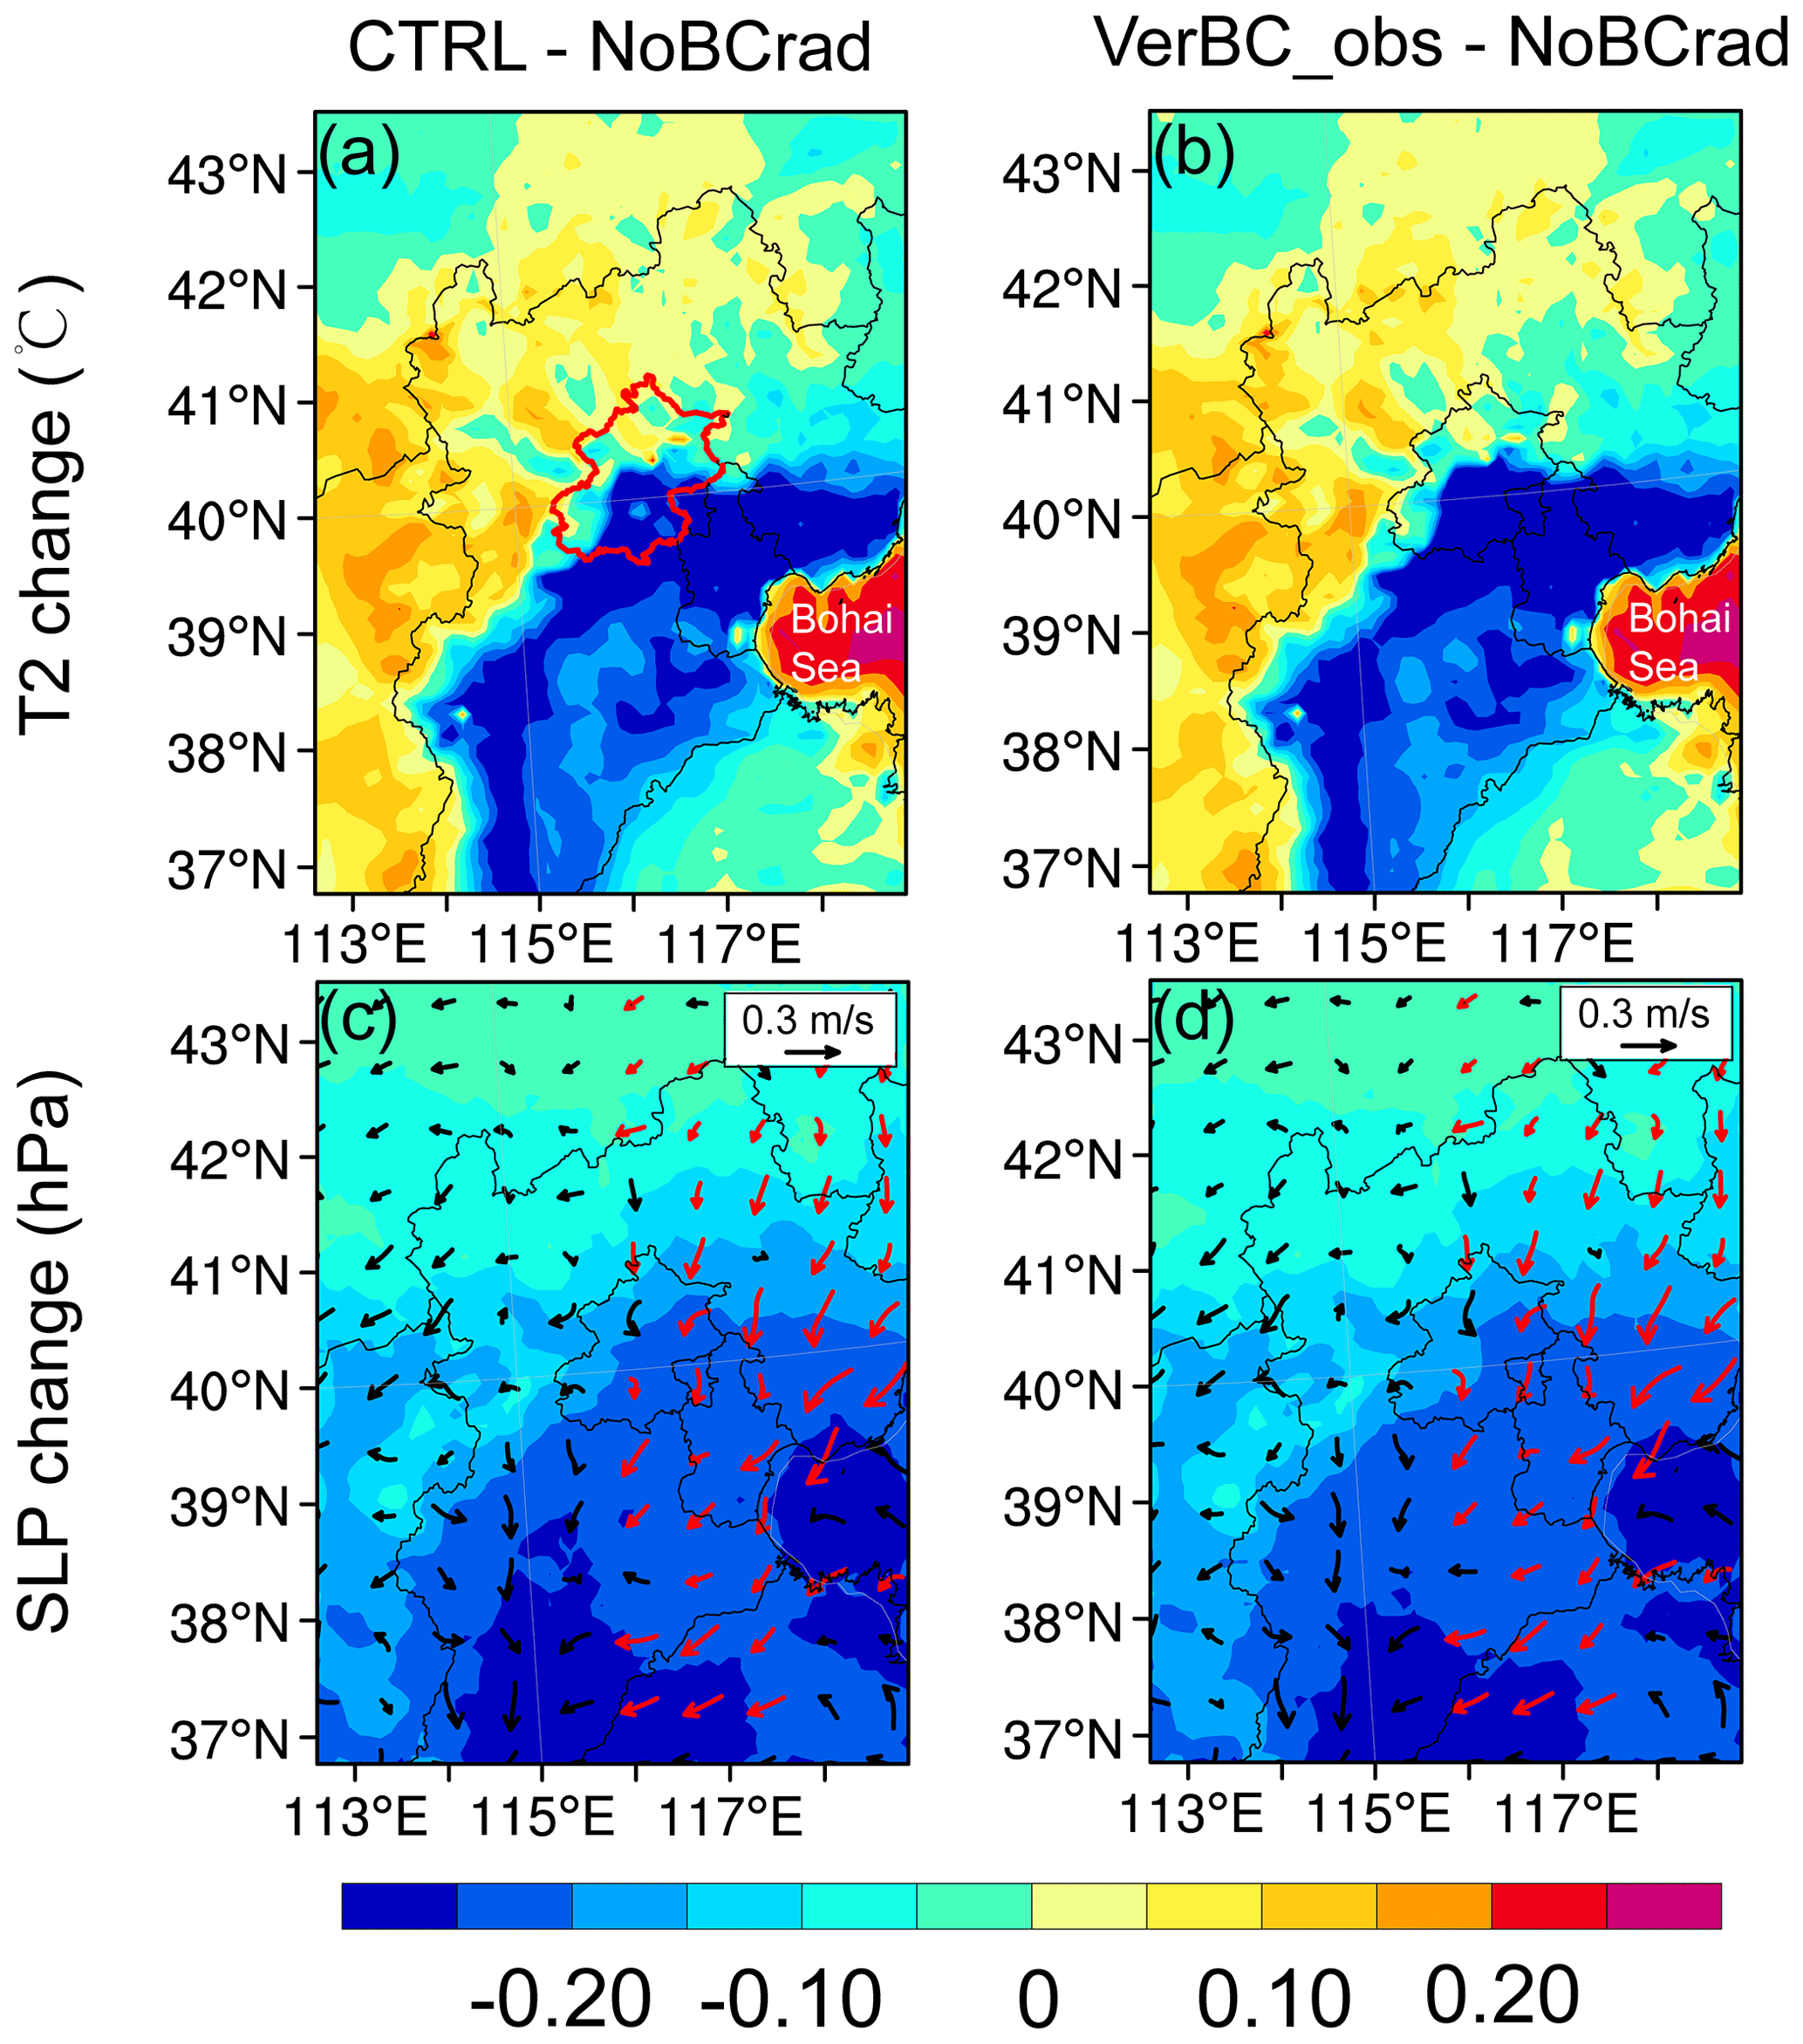
Figure 8The changes in T2, SLP, and wind at 10 m induced by BC DRE with the original (a, c; CTRL minus NoBCrad) and modified vertical profiles (b, d; VerBC_obs minus NoBCrad) averaged over the period of 12:00–18:00 LT of the two haze events, respectively. (c–d) The northeasterlies in the east of BTH are denoted in red.
4.2 Direct radiative effect of BC on PM2.5 concentration
By altering the meteorological conditions, BC exerts feedback onto PM2.5 concentrations. Figure 9 illustrates the impacts of BC DRE with the original and modified vertical profiles on surface layer PM2.5 as well as the differences in simulated surface layer PM2.5 between VerBC_obs and CTRL (VerBC_obs minus CTRL) in Beijing during the two haze events. Because of the differences in BC-induced changes in air temperature, wind field, and PBLH, changes in surface layer PM2.5 concentrations in northern and southern Beijing were different. In the first haze event of 11–12 December, although PBLH was reduced in northern Beijing due to BC DRE, enhanced northerlies brought in relatively clean air to northern Beijing, leading to decreases in surface layer PM2.5 concentrations with maximum values of 12.5 µg m−3 (9.4 %) and 10.6 µg m−3 (8.0 %) in this region with the original and modified BC vertical profiles, respectively. Nevertheless, PM2.5 concentrations increased by up to 17.8 µg m−3 (6.6 %) and 24.0 µg m−3 (9.3 %) in southern Beijing due to the BC effect with the original and modified vertical profiles, respectively. In the second haze event of 16–19 December, the surface layer PM2.5 concentrations increased in most areas of Beijing with both vertical profiles. Compared to the simulation with the original profiles, the modified profiles of BC led to larger increases in PM2.5 concentrations over Beijing, and the maximum differences in PM2.5 were simulated over central Beijing, which were 9.3 µg m−3 (3.6 %) and 5.5 µg m−3 (3.1 %) in the first and second haze events, respectively.
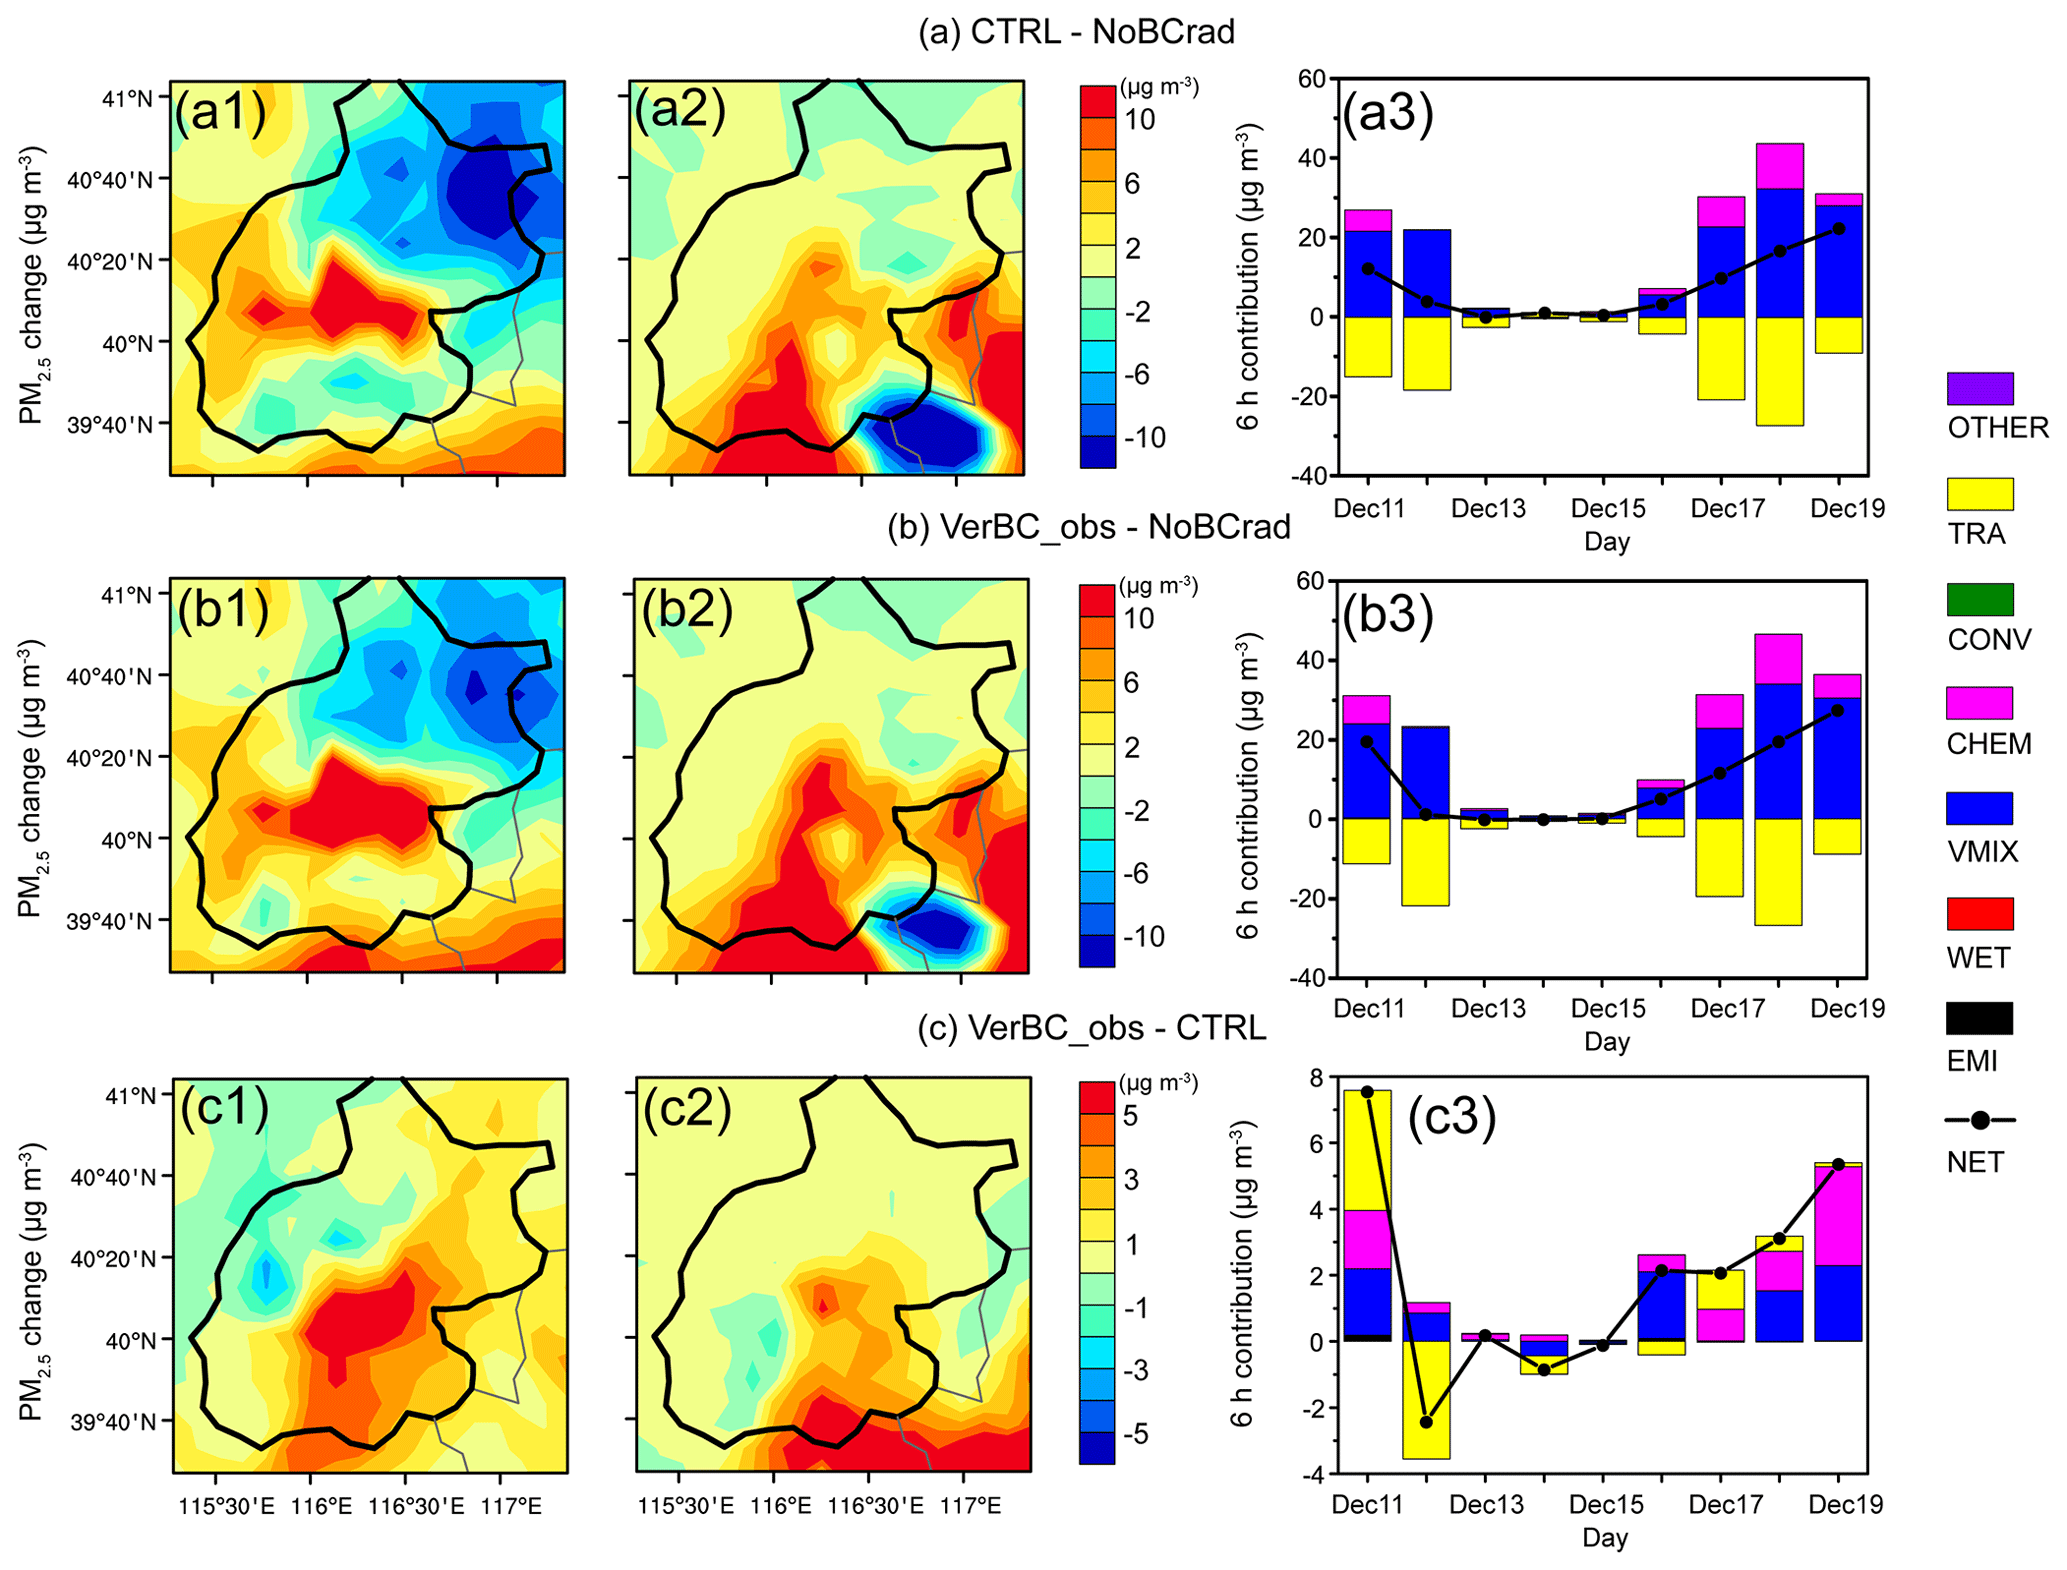
Figure 9The spatial distribution of changes in near-surface PM2.5 concentrations induced by BC DRE with the original (CTRL minus NoBCrad; a1, a2) and modified vertical profiles (VerBC_obs minus NoBCrad; b1, b2) and the difference between VerBC_obs and CTRL (VerBC_obs minus CTRL; c1, c2) over Beijing averaged over the period of 12:00–18:00 LT of the two haze events. Panels (a1)–(c1) represent the first pollution event of 11–12 December 2016, and (a2)–(c2) represent the second pollution event of 16–19 December 2016. (a3–c3) The daily 6 h contributions of each physical and chemical process (coloured bars, each of which is calculated as the concentration at 18:00 LT minus that at 12:00 LT) to the change in PM2.5 in Beijing from 11 to 19 December 2016. The black dotted line represents the 6 h net contribution to PM2.5 change by summing over all processes.
To explain the changes in surface layer PM2.5 concentrations in Beijing due to BC effects, we carried out process analysis for PM2.5 for 12:00–18:00 LT of each day when the DRE of BC is the largest (Fig. 9a3, b3, and c3). From 11 to 19 December 2016, VMIX had a dominant positive contribution to changes in PM2.5 concentration, which reached the maximum contributions of 32.4 and 33.9 µg m−3 on December 18 with the original and modified BC vertical profiles, respectively. The vertical mixing was strongly restrained by PBLH; therefore, the decreases in PBLH caused accumulation of PM2.5 in the lower layers. Meanwhile, CHEM contributed 4.8 and 6.1 µg m−3 to PM2.5 changes because more aerosol precursors restrained in the boundary layer led to the formation of secondary particles. TRA was the major process that had negative contribution to the changes in PM2.5, which can be explained by the enhanced northerlies in the central part of the NCP due to BC effects as shown in Fig. 8. Relative to the case with the original BC vertical profiles, VMIX and CHEM contributions increased largely with modified profiles, with increases of 8.6 µg m−3 (6.5 %) and 7.7 µg m−3 (26.8 %), respectively, as averaged over the two haze events, reflecting the further decreases in PBLH (Fig. 7d).

Figure 10Vertical profiles of the 6 h contributions of physical and chemical processes (coloured bars; each is calculated as the concentration at 18:00 LT minus that at 12:00 LT) to the changes in PM2.5 induced by BC DRE with the original (CTRL minus NoBCrad; a1, b1) and modified vertical profiles (VerBC_obs minus NoBCrad; a2, b2) and the difference between the original and modified BC profiles (VerBC_obs minus CTRL; a3, b3) over Beijing. The red dotted lines represent the 6 h net contributions to PM2.5 changes by summing over all processes.
Figure 10 shows the vertical profiles of the contributions of physical–chemical processes to changes in PM2.5 over Beijing due to BC DRE with the original (CTRL minus NoBCrad; Fig. 10a1 and b1) and modified vertical profiles (VerBC_obs minus NoBCrad; Fig. 10a2 and b2) in the two haze events. In the first haze event of 11–12 December when regional transport of pollution dominated, the NET contribution to PM2.5 was positive below 256 m, because the positive contribution of VMIX was larger than the negative contribution of TRA. However, in the upper layers (from 256 to 1555 m), the contributions of VMIX and CHEM became negative with both the original and modified vertical profiles, which can be explained by the decreases in PBLH inhibiting the transport of low-layer pollutants to the upper layer. Compared to the original BC vertical profiles, the modified BC vertical profiles increased PM2.5 in all the vertical layers below 2080 m, in which the positive contribution between 256–757 m was caused by TRA. These results agree with the observed high concentrations of BC at altitudes of 600–1500 m on 11 December (Fig. 4a). In the second haze event, the NET contribution to PM2.5 was positive below 127 m and negative at 127–504 m. However, the effects of BC on PM2.5 were small above 504 m because BC concentrations decreased rapidly with altitude.
4.3 Model performance in simulating meteorology and PM2.5 with the original and modified BC vertical profiles
It is of interest to compare the performance of CTRL (with the original BC vertical profiles) with that of VerBC_obs (with modified BC vertical profiles) in simulating meteorological parameters and PM2.5 during the two haze events. Figure S4 shows the comparisons between observed T2, RH2, WS10, WD10, and PBLH and the simulated values from the CTRL and VerBC_obs simulations in Beijing in the two haze events (11–12 and 16–19 December 2016). Relative to the CTRL simulation with the original BC vertical profiles, the VerBC_obs simulation with modified BC vertical profiles has better performance in simulating T2, WS10, and PBLH except for WD10 and RH2 in the first pollution event. While the MBs of T2, RH2, WS10, WD10, and PBLH are 0.2∘, 0.0 %, −0.4 m s−1, 3.8∘, and 45.0 m in CTRL, they are 0.0∘, 2.2 %, −0.1 m s−1, 10.9∘, and 29.0 m in VerBC_obs, respectively (Table S3). In the second pollution event, the positive bias in PBLH (MB = 43.7 m, NMB = 42.9 %) in CTRL is reduced to 33.9 m and 33.3 % in VerBC_obs.
Table S4 shows the statistical comparison between observed hourly surface layer PM2.5 and the model results from CTRL and VerBC_obs in Beijing for each day during the two haze events. The model with modified BC vertical profiles can enhance the capability in simulating the temporal variation in PM2.5 for each day; the correlation coefficient between simulated hourly concentrations and hourly observations in each day of the studied period increased from 0.04–0.84 in CTRL to 0.24–0.93 in VerBC_obs.
BC has higher light-absorbing efficiency at higher altitudes (Ding et al., 2016; Wang et al., 2018). As described in Sect. 2.3, the observed vertical profiles of BC on heavily polluted days (12 and 16–19 December) can be parameterized as exponential decline functions using nonlinear regression () with hs values of 0.35, 0.48, 0.53, 0.79, 0.82, and 0.96, and the profiles affected by regional transport had high concentrations of BC at high altitudes. We conducted seven sensitivity experiments which applied six exponential functions and one observed transport-dominated vertical profile, as described in Sect. 2.4, to examine the roles of BC vertical profiles in influencing meteorological conditions and PM2.5 during severe haze events. In these sensitivity experiments, we only modify the BC vertical profiles for the dates of 12 and 16–19 December. In the function of , a larger hs means less BC at the surface and more BC in the upper atmosphere, as shown in Fig. 11.
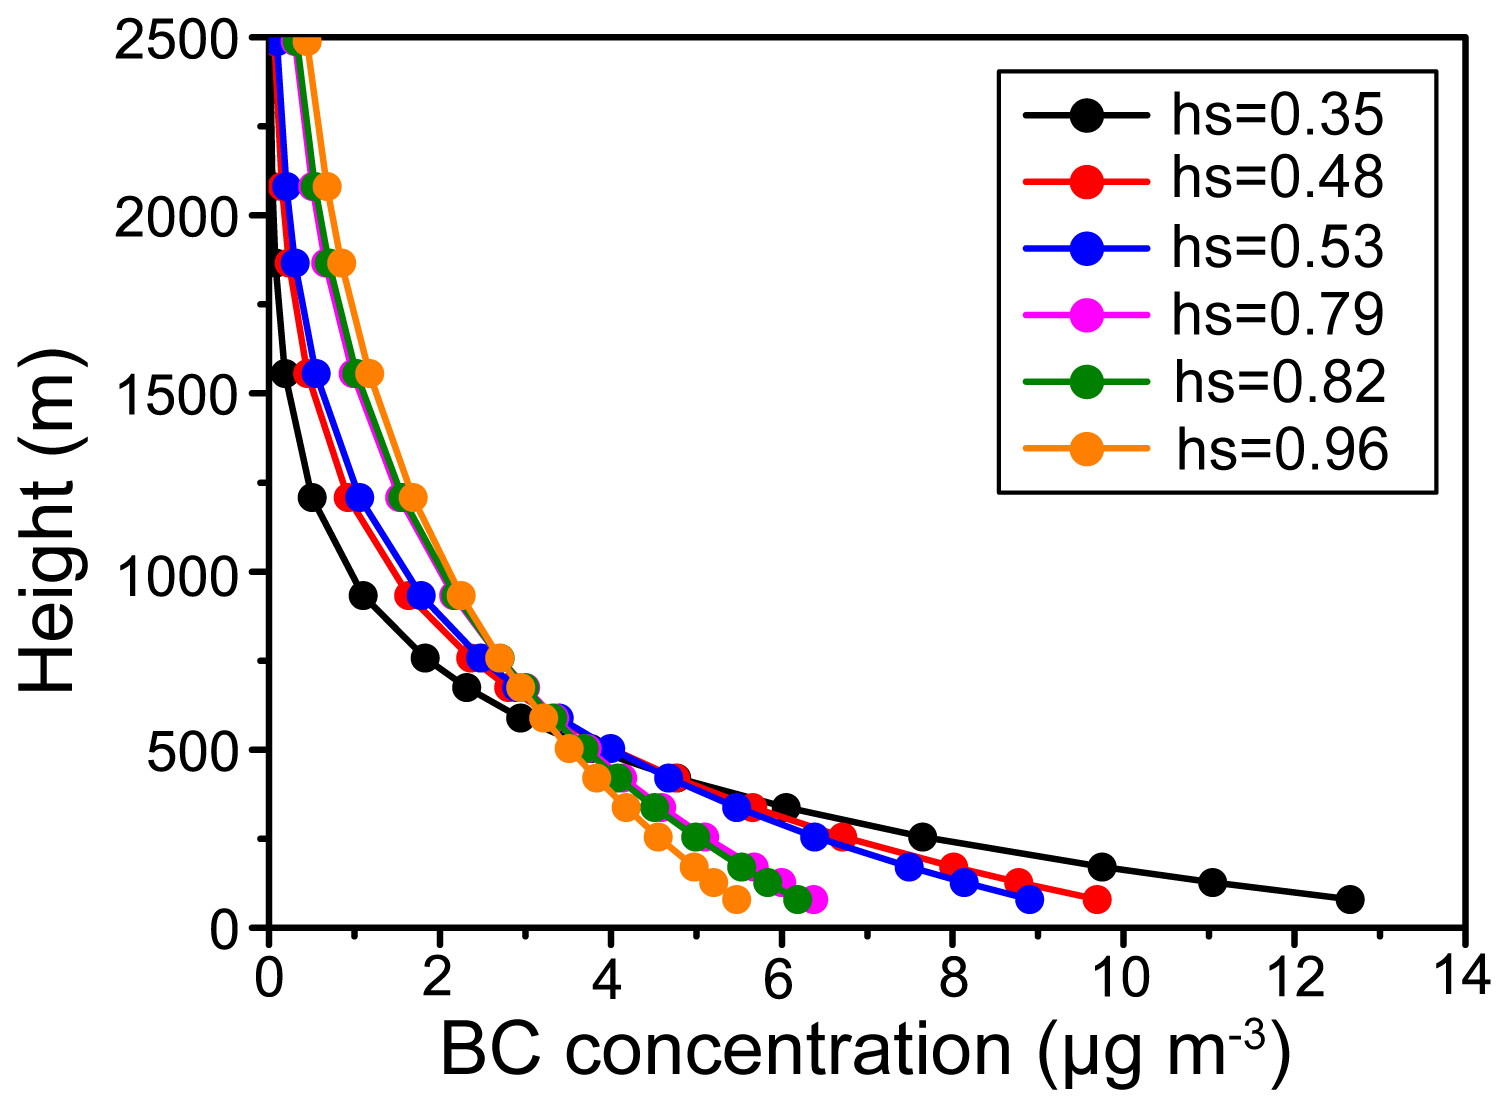
Figure 11Vertical profiles of BC concentrations parameterized as six exponential functions for 12 and 16–19 December 2016.
5.1 Impacts of BC vertical profiles on meteorology
Figure 12 shows the simulated changes in atmospheric temperature induced by BC DRE with exponential functions (VerBC_hs1-6 minus NoBCrad) and with the transport-dominated vertical profile (VerBC_RT minus NoBCrad). BC had a significant warming effect at altitudes of 256–421 m from 12:00 to 18:00 LT (Fig. 7). Generally, with the value of hs gradually increasing, the BC-induced warming in the afternoon around 300 m became smaller, which can be explained by the highest mass fraction of BC at the altitudes of 256–421 m to total BC column burden in VerBC_hs1 case (31.7 %) and the lowest percentage in the VerBC_hs6 case (21.7 %) among the six sensitivity experiments (Fig. S1). The maximum warming around 300 m was 0.42∘ in the VerBC_hs1 case and 0.19∘ in the VerBC_hs6 case. It should be noted that BC led to a significant cooling effect at the surface (below 80 m) when hs values were 0.79, 0.82, and 0.96, with changes in temperature by −0.08, −0.09, and −0.13∘, respectively. Because more BC mass was assigned to high altitudes (above 1000 m) with higher hs, less solar radiation could reach the ground (Fig. S5). These results are consistent with those found in previous modelling and observational studies (Cappa et al., 2012; Ferrero et al., 2014; Ding et al., 2016; Wang et al., 2018). Meanwhile, in the case of VerBC_RT, BC also had a cooling effect of −0.30∘ at the surface (Fig. 12g). In current regional air quality models, the uncertainties in BC profiles could influence the capability of a model to simulate a cooling effect of BC on surface air temperature (Wang et al., 2019).
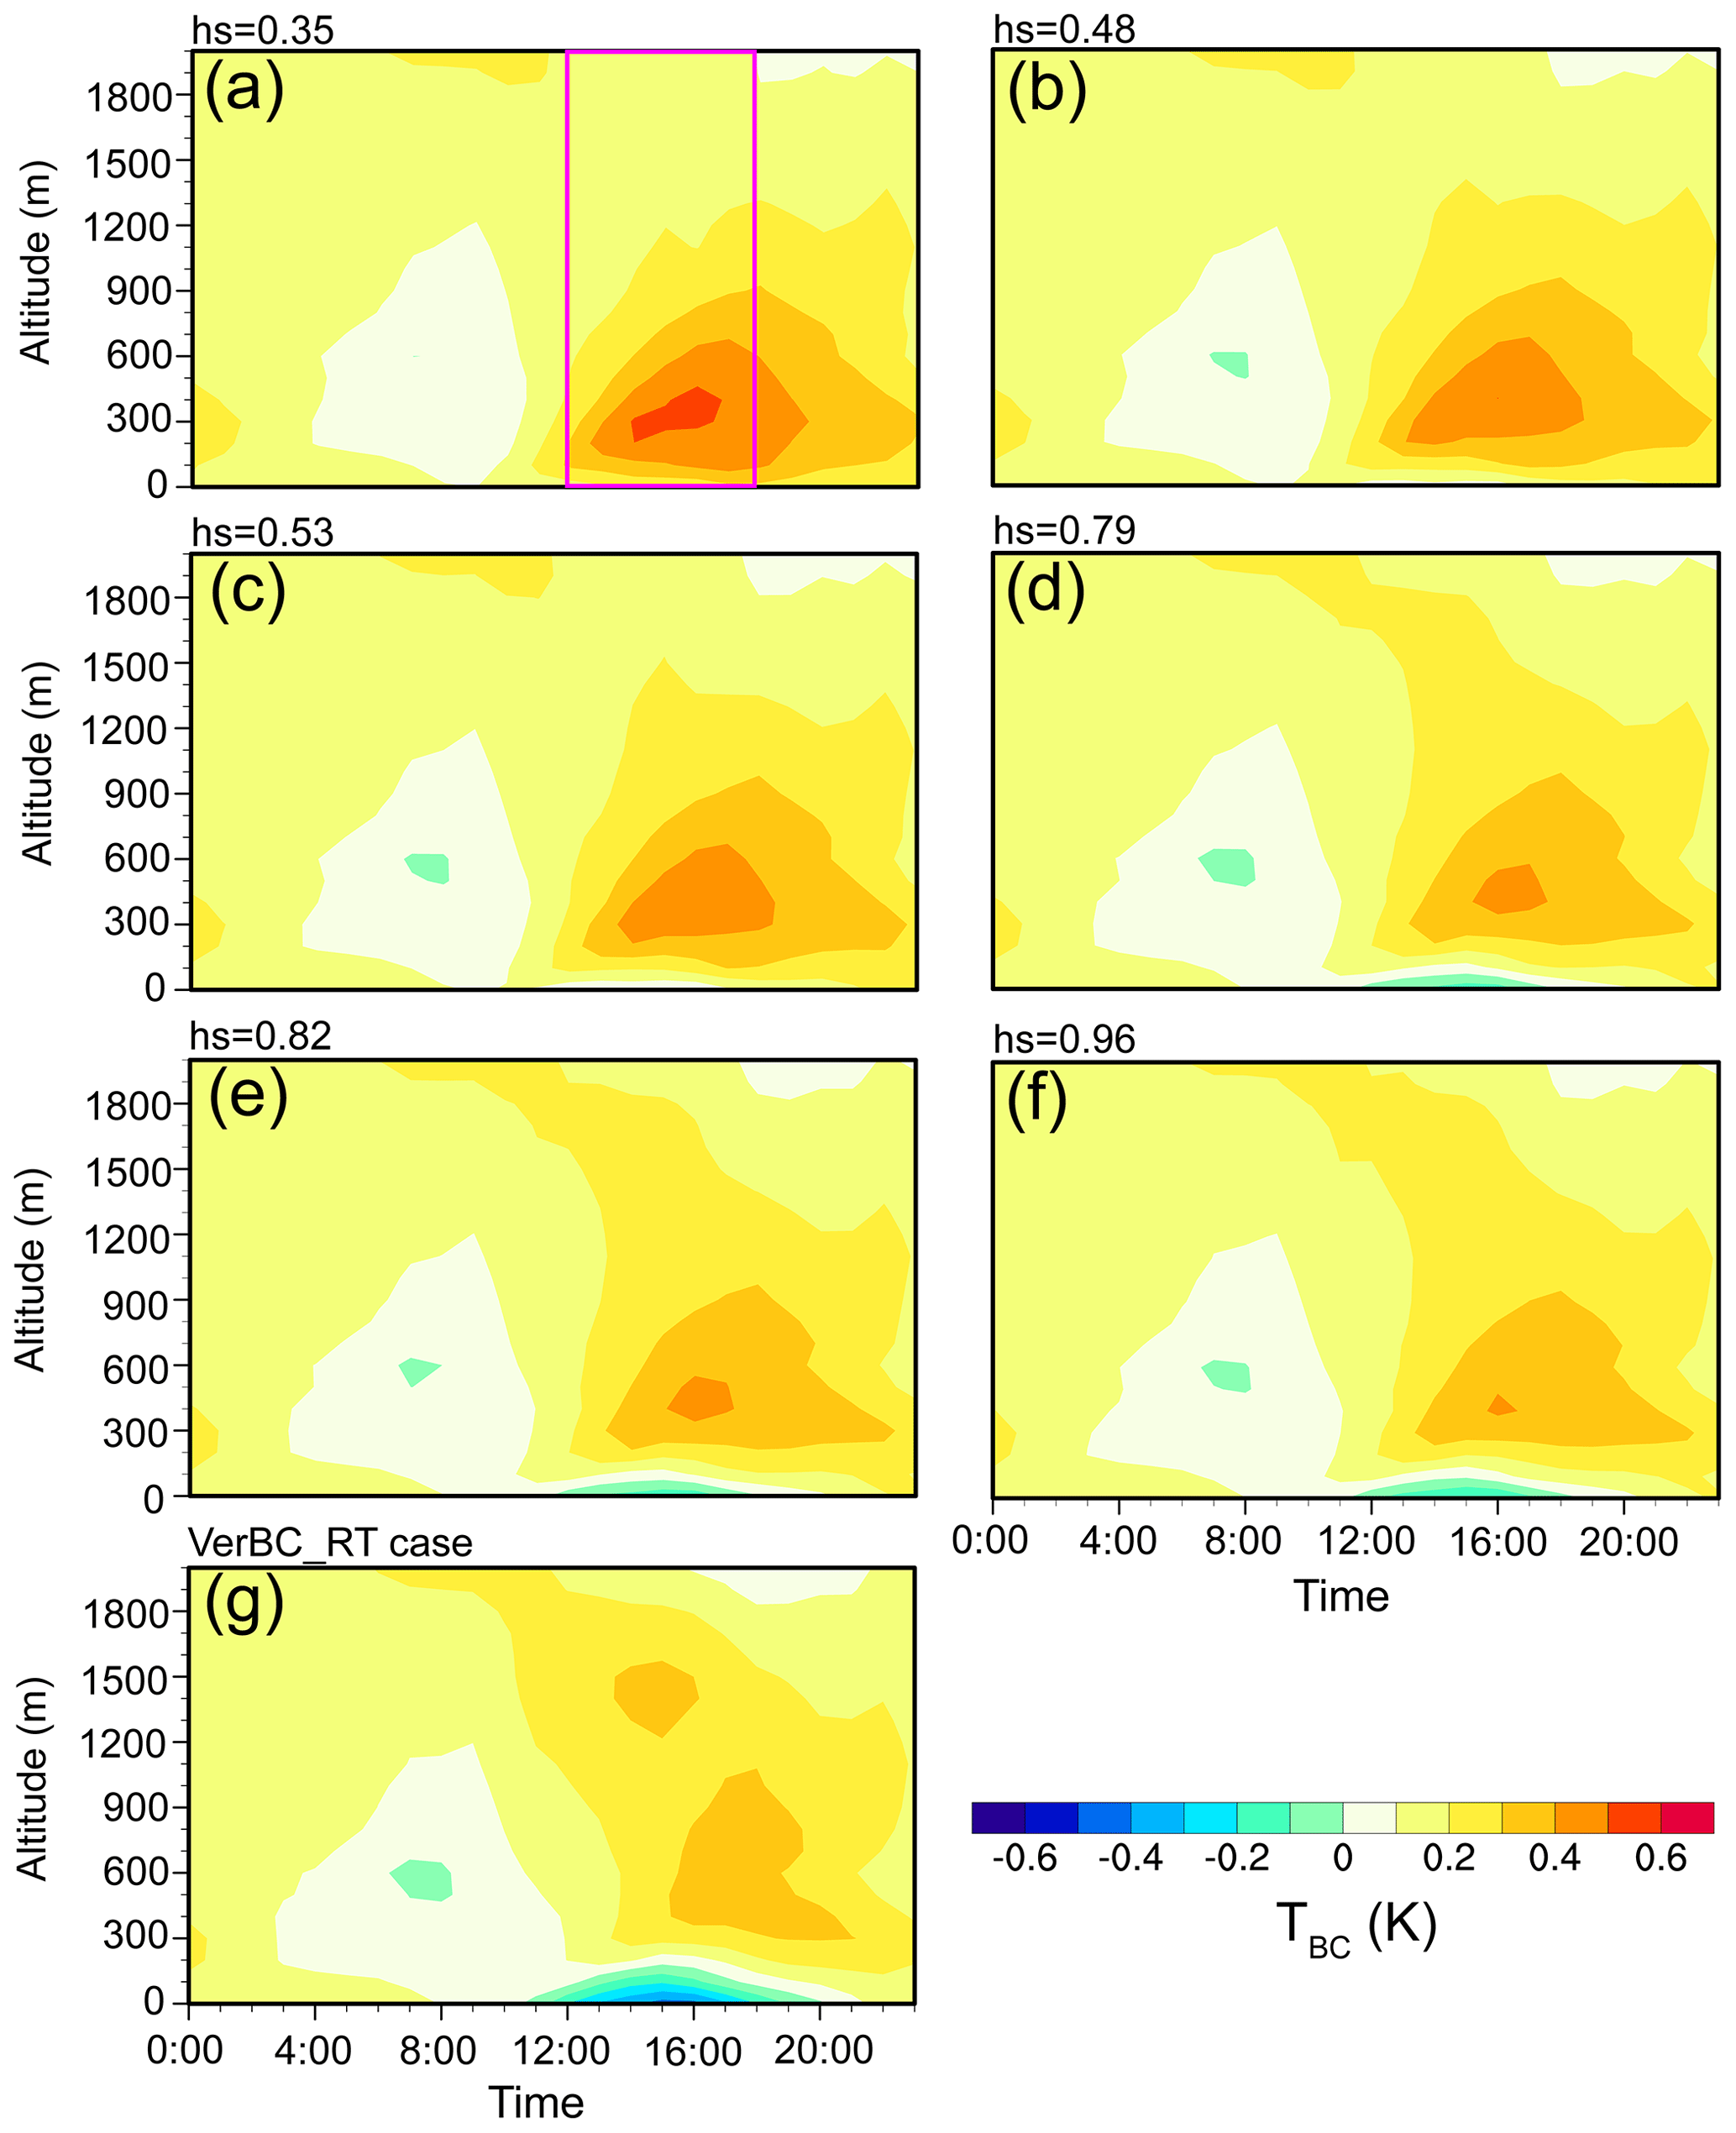
Figure 12Time series of changes in vertical temperature induced by BC DRE with six exponential functions (VerBC_hs1-6 minus NoBCrad) and one transport-dominated vertical profile (VerBC_RT minus NoBCrad) averaged over 12 and 16–19 December 2016.
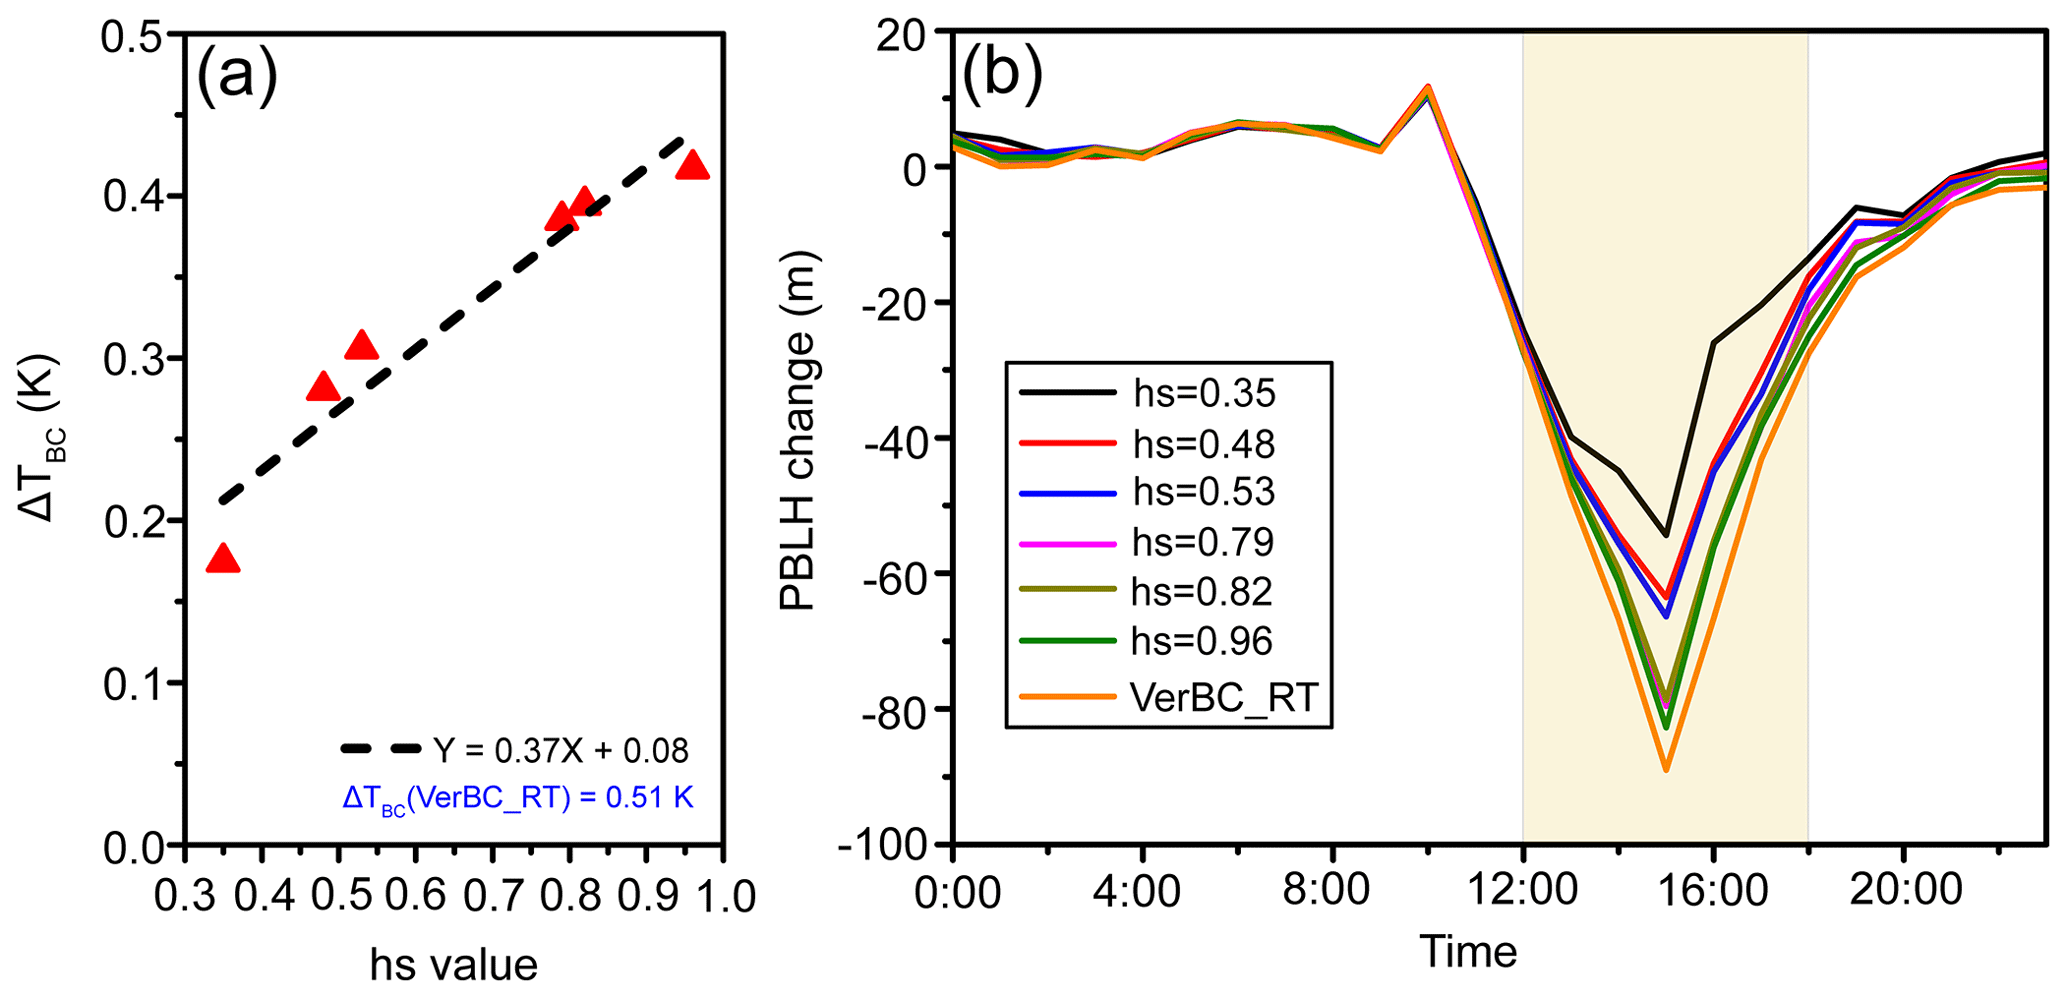
Figure 13(a) Variation in ΔTBC caused by BC DRE with increasing hs values averaged for 12 and 16–19 December. The black dashed line is the linear fit. (b) Time series of changes in PBLH in Beijing caused by different BC vertical profiles averaged for 12 and 16–19 December 2016.
We further use the difference in temperature between the upper PBL (TH; 256–421 m) and the ground (TL; 0–127 m) () averaged over 12:00–18:00 LT of 12 and 16–19 December to quantify temperature inversion caused by BC DRE. BC aerosol leads to cooling at the surface and warming in the upper PBL, both of which weaken the convection in the boundary layer and consequently reduce the PBLH (Ding et al., 2016; Wang et al., 2018; Chen et al., 2021). In our study, with hs values increasing from 0.35 to 0.96, ΔTBC increased from 0.17 to 0.42∘, and the ΔTBC value was 0.51∘ in the VerBC_RT case (Fig. 13a). The larger ΔTBC indicates stronger cooling at the surface. Such temperature inversion at 12:00–18:00 LT resulted in more stable stratification and further inhibited the development of PBL. The cooling at the surface also reduced sensible heat flux from the surface (Fig. S5), suppressing vertical turbulence and hence reducing PBLH (Wilcox et al., 2016). As a result, the reductions in PBLH were larger with higher hs (Fig. 13b). The minimum decrease in PBLH was −31.9 m (−14.3 %) with a hs value of 0.35, and the maximum decrease was 48.9 m (22.0 %) with a hs value of 0.96, as averaged over the period of 12:00–18:00 LT on 12 and 16–19 December. In the case of VerBC_RT, the mean PBLH was reduced by 56.9 m (25.6 %) during the period of 12:00–18:00 LT.
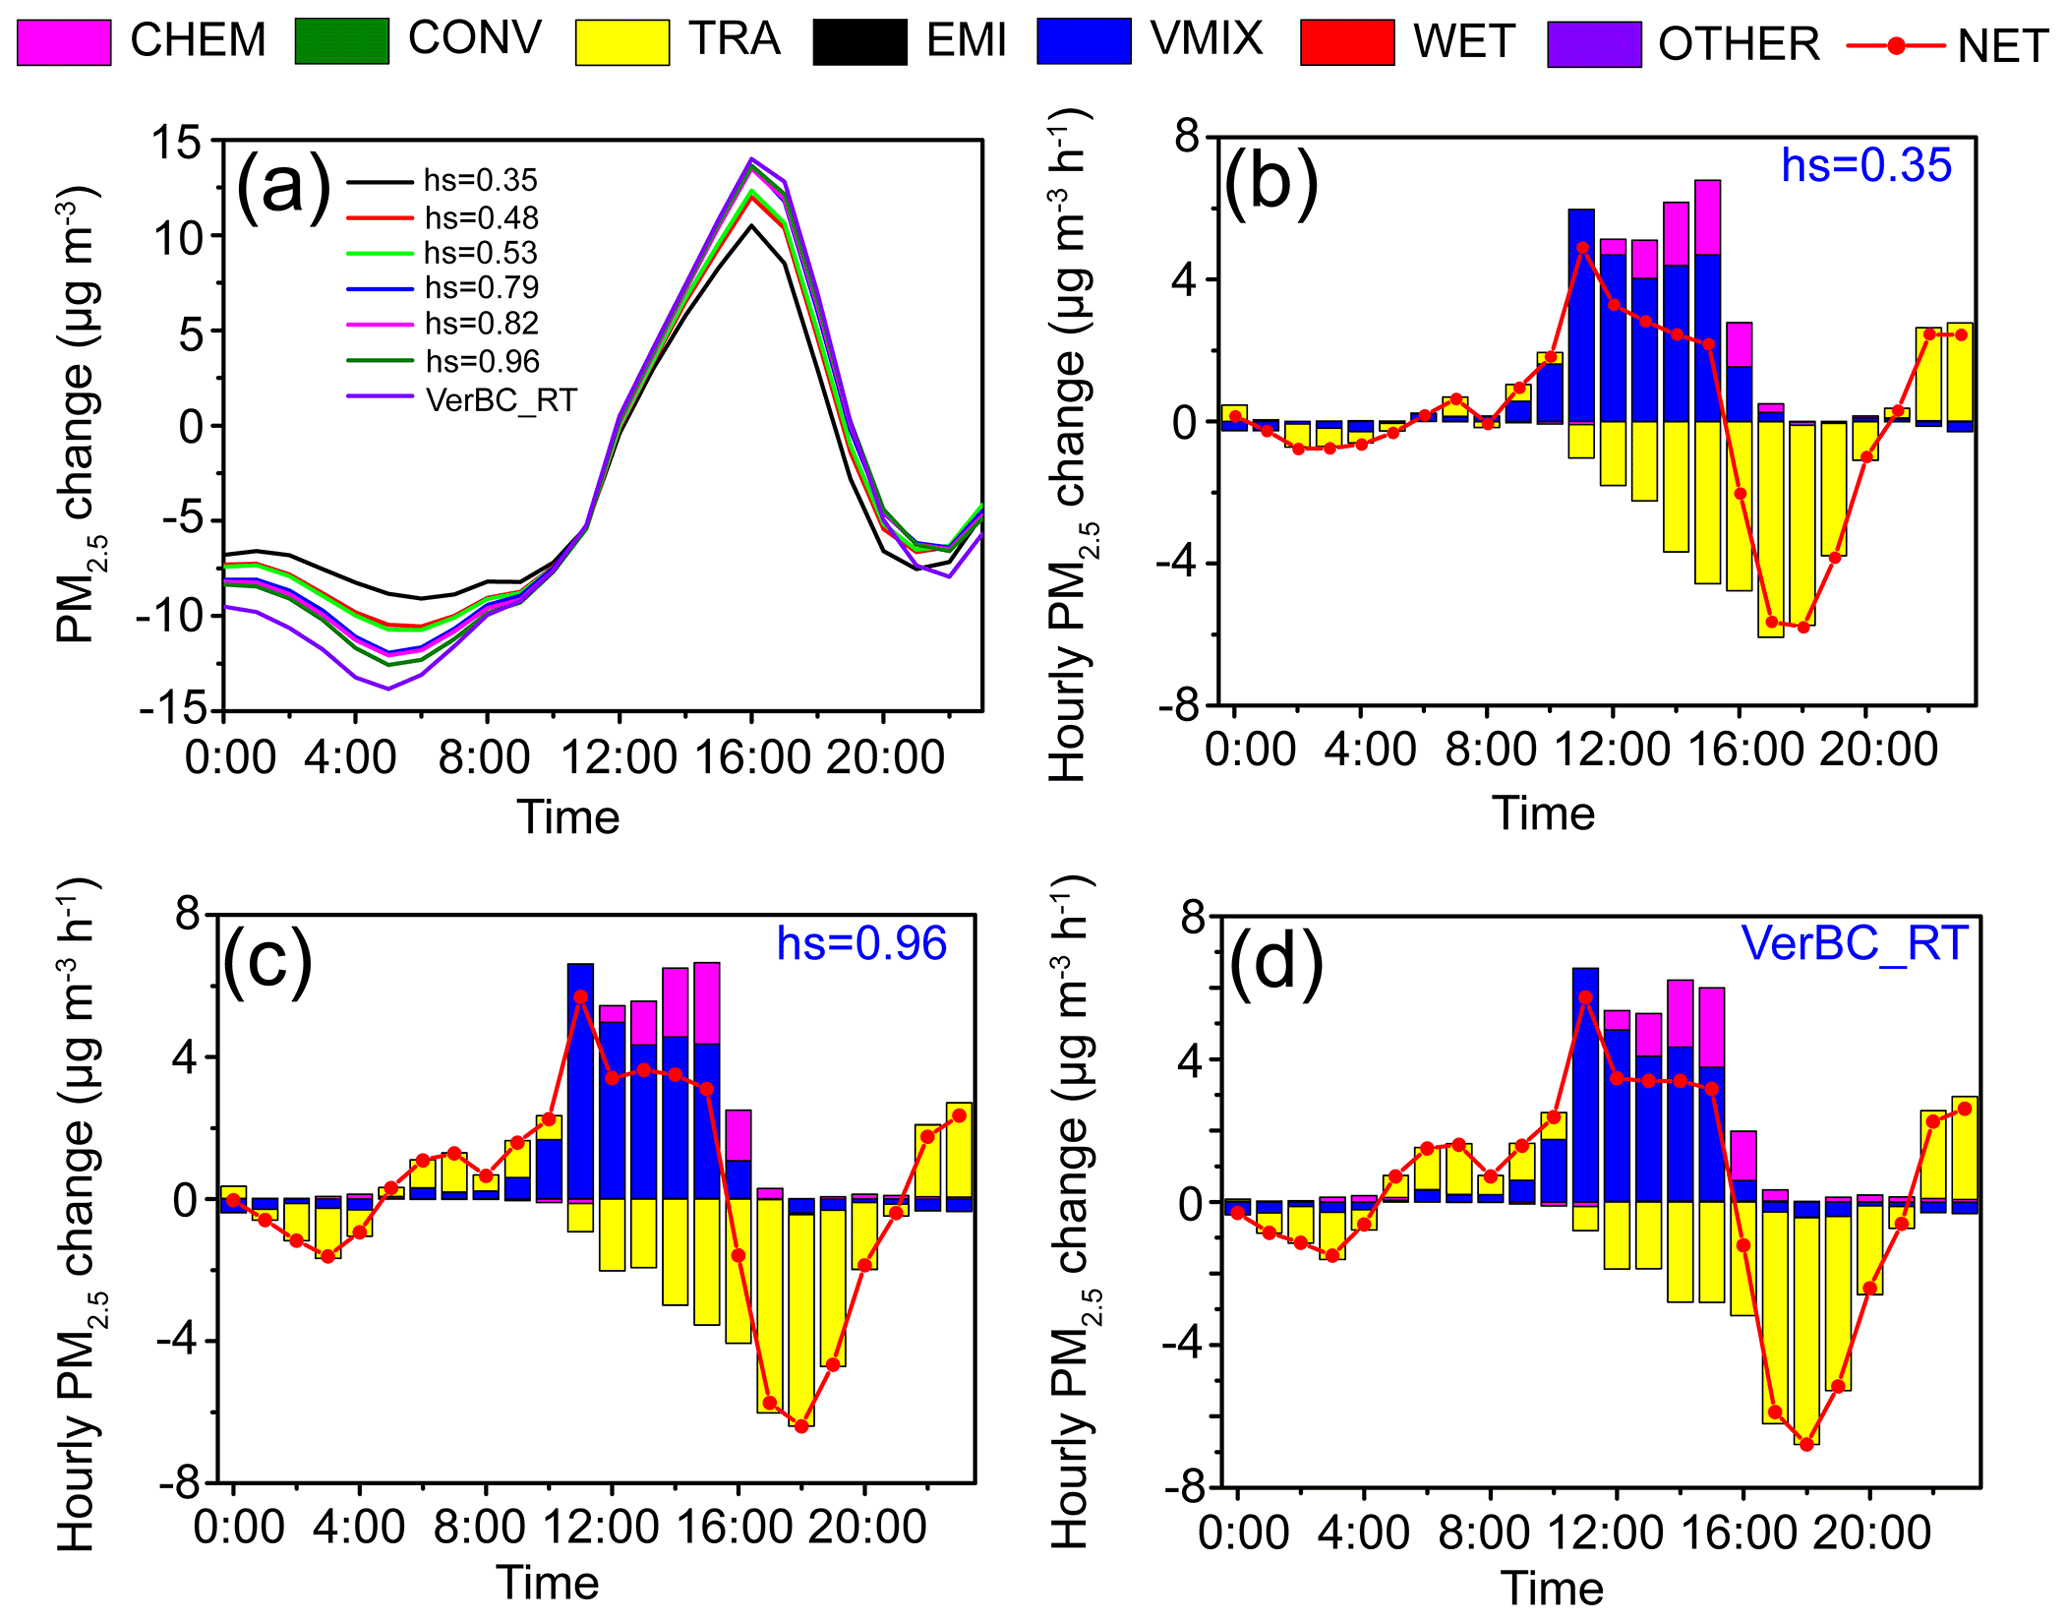
Figure 14(a) Time series of the changes in surface layer PM2.5 in Beijing caused by BC with six exponential functions (VerBC_hs1-6 minus NoBCrad) and one observed transport-dominated vertical profile (VerBC_RT minus NoBCrad) averaged for 12 and 16–19 December 2016. (b–d) The hourly contributions of each physical and chemical process to PM2.5 changes caused by BC DRE with two exponential functions (hs = 0.35 and 0.96) and one transport-dominated vertical profile.
5.2 Impacts of BC vertical profiles on PM2.5 concentration
Figure 14a shows the changes in surface layer PM2.5 concentration caused by BC DRE with six exponential functions (VerBC_hs1-6 minus NoBCrad) and the transport-dominated vertical profile (VerBC_RT minus NoBCrad) averaged over 12 and 16–19 December 2016. From 00:00 to 11:00 LT, the surface layer PM2.5 exhibited larger BC-induced decreases with a higher value of hs. This can be explained by the negative contribution of the TRA process that increased during the period of 00:00–05:00 LT (Fig. 14b and c) when the hs value changed from 0.35 to 0.96. The surface layer PM2.5 concentration was reduced by up to 9.1 µg m−3 (6.2 %) and 12.6 µg m−3 (8.6 %) at 05:00 LT with hs values of 0.35 and 0.96, respectively. Compared to the NoBCrad case, the surface layer PM2.5 concentrations were reduced by up to 13.8 µg m−3 (9.4 %) at 05:00 LT due to BC DRE in the VerBC_RT case. From 12:00 to 18:00 LT, the BC-induced increase in surface layer PM2.5 concentrations was larger as hs values were higher; relative to NoBCrad simulation, the mean PM2.5 concentrations were increased by 5.5 µg m−3 (3.4 %) and 7.9 µg m−3 (4.9 %) with the hs values of 0.35 and 0.96, respectively. Because the PBL was suppressed by BC DRE from 12:00 to 15:00 LT, the contributions of VMIX and CHEM to surface layer PM2.5 were positive and larger in magnitude than the negative contribution of TRA. The NET of all processes was negative from 16:00 to 18:00 LT due to the continuous growth of a negative contribution of TRA. The negative contribution of the TRA process from 12:00 to 18:00 LT can be explained by the enhanced northerlies in the central part of BTH caused by BC DRE, which transported cleaner air masses into Beijing (Fig. S6). From 19:00 to 23:00 LT, the surface layer PM2.5 concentrations were decreased by BC DRE, which can be explained by the dominant negative contribution of TRA from 19:00 to 21:00 LT. At 22:00 LT, the reduction in surface layer PM2.5 was 7.5 µg m−3 (4.0 %) when the hs value was 0.35 and 6.6 µg m−3 (3.5 %) when hs was 0.96.
In this study, a fully coupled online WRF-Chem model with an improved integrated process rate (IPR) analysis scheme is employed to investigate the direct radiative effects (DRE) of BC vertical profiles on meteorology and PM2.5 concentrations during two severe haze events (11–12 and 16–19 December 2016). Sensitivity experiments are conducted to compare the DRE of BC with the original and corrected vertical profiles and to quantify the role of BC vertical profiles in influencing meteorological conditions and air pollutants.
Compared to the measured vertical profiles of BC in Beijing, the default vertical profiles of BC from the WRF-Chem model can capture the decreases in BC mass concentration with altitude on 12 and 16–19 December when local emissions dominated, but they cannot reproduce the observed maximum mass concentration of BC around 850 m altitude on 11 December when regional transport of pollutants dominated. Averaged over the two severe pollution events, the model overestimated BC mass concentration by 87.4 % at the surface but underestimated BC by 33.1 % at 1000 m altitude compared with the observations in Beijing.
We carried out simulations with both the default original BC vertical profiles and the modified vertical profiles using the observations (keep the column burden of BC from WRF-Chem but distribute BC mass vertically according to the observed fractions of BC in individual model layers for each day). Comparing the simulation with original BC profiles, the warming by BC DRE around 300 m altitude was stronger with the modified profiles. Accordingly, the BC-induced reductions in PBLH in Beijing averaged over the two severe haze events were 43.4 m (18.4 %) and 55.4 m (23.5 %), respectively, with the original and modified profiles. As a result, relative to the simulation with the original profiles, the modified profiles of BC led to larger increases in PM2.5 concentrations by BC DRE, because VMIX and CHEM had the dominant positive contributions to the changes in surface layer PM2.5 due to the reductions in PBLH.
Seven sensitivity experiments were further carried out to understand the roles of BC vertical profiles. In six assumed exponential functions () with hs values of 0.35, 0.48, 0.53, 0.79, 0.82, and 0.96, a larger hs means less BC at the surface and more BC in the upper atmosphere. As a result, with higher hs, the surface had less warming or larger cooling, leading to stronger temperature inversion and hence larger BC-induced increases in PM2.5.
Results from our study highlight the importance of accurate representation of BC vertical profiles in models, which alter the radiation balance, BC-PBL interaction, and hence the simulated PM2.5 concentrations. Due to the limitation of observational data, this study was focused on the DRE of BC vertical profiles on meteorology and PM2.5 concentration in Beijing during severe haze events. However, the results from this study should be generally important for understanding severe haze for urban areas.
There are channels for further improvement in near-future research. We distribute BC mass vertically according to the observed fractions of BC in individual model layers for each day without considering the hourly variations in BC vertical profiles due to the lack of data. Such assumed distribution of BC based on observation may not be consistent with the dynamical (winds, temperature, etc.) and chemical processes of the atmosphere. Further efforts are needed to examine the roles of BC vertical profiles in coupled chemistry–weather models.
The WRF-Chem model is available at https://www2.mmm.ucar.edu/wrf/users/download/get_source.html (last access: 7 July 2020, Chen et al., 2019). The observations and simulation results are available upon request to the corresponding author (hongliao@nuist.edu.cn).
The supplement related to this article is available online at: https://doi.org/10.5194/acp-22-1825-2022-supplement.
DC and HL designed the study. DC wrote the first draft of manuscript, and DC and HL revised the paper together. DC performed model simulations and analysed the data. DZ and DD provided the observed data. YY and LC provided technical support.
The contact author has declared that neither they nor their co-authors have any competing interests.
Publisher's note: Copernicus Publications remains neutral with regard to jurisdictional claims in published maps and institutional affiliations.
We acknowledge the computing resources from the University-Industry Collaborative Education Program between the Ministry of Education and Huawei.
This research has been supported by the National Key Research and Development Program of China (grant no. 2019YFA0606804), the National Natural Science Foundation of China (grant no. 42021004), and the Major Research Plan (grant no. 18ZDA052).
This paper was edited by Stefania Gilardoni and reviewed by two anonymous referees.
Barnard, J. C., Fast, J. D., Paredes-Miranda, G., Arnott, W. P., and Laskin, A.: Technical Note: Evaluation of the WRF-Chem “Aerosol Chemical to Aerosol Optical Properties” Module using data from the MILAGRO campaign, Atmos. Chem. Phys., 10, 7325–7340, https://doi.org/10.5194/acp-10-7325-2010, 2010.
Bond, T. C., Doherty, S. J., Fahey, D. W., Forster, P. M., Berntsen, T., Deangelo, B., Flanner, M. G., Ghan, S. J., Karcher, B., and Koch, D.: Bounding the role of black carbon in the climate system: A scientific assessment, J. Geophys. Res.-Atmos., 118, 5380–5552, https://doi.org/10.1002/jgrd.50171, 2013.
Cappa, C. D., Onasch, T. B., Massoli, P., Worsnop, D. R., Bates, T. S., Cross, E. S., Davidovits, P., Hakala, J., Hayden, K. L., Jobson, B. T., Kolesar, K. R., Lack, D. A., Lerner, B. M., Li, S.-M., Mellon, D., Nuaaman, I., Olfert, J. S., Petäjä, T., Quinn, P. K., Song, C., Subramanian, R., Williams, E. J., and Zaveri, R. A.: Radiative absorption enhancements due to the mixing state of atmospheric black carbon, Science, 337, 1078–1081, https://doi.org/10.1126/science.1223447, 2012.
Chapman, E. G., Gustafson Jr., W. I., Easter, R. C., Barnard, J. C., Ghan, S. J., Pekour, M. S., and Fast, J. D.: Coupling aerosol-cloud-radiative processes in the WRF-Chem model: Investigating the radiative impact of elevated point sources, Atmos. Chem. Phys., 9, 945–964, https://doi.org/10.5194/acp-9-945-2009, 2009.
Chen, D., Liao, H., Yang, Y., Chen, L., and Wang, H.: Simulated aging processes of black carbon and its impact during a severe winter haze event in the Beijing-Tianjin-Hebei region, Sci. Total Environ., 755, 142712, https://doi.org/10.1016/j.scitotenv.2020.142712, 2021.
Chen, L., Zhu, J., Liao, H., Gao, Y., Qiu, Y., Zhang, M., Liu, Z., Li, N., and Wang, Y.: Assessing the formation and evolution mechanisms of severe haze pollution in the Beijing–Tianjin–Hebei region using process analysis, Atmos. Chem. Phys., 19, 10845–10864, https://doi.org/10.5194/acp-19-10845-2019, 2019 (data available at: https://www2.mmm.ucar.edu/wrf/users/download/get_source.html, last access: 7 July 2020).
Chu, Y., Li, J., Li, C., Tan, W., Su, T., and Li, J.: Seasonal and diurnal variability of planetary boundary layer height in Beijing: Intercomparison between MPL and WRF results, Atmos. Res., 227, 1–13, https://doi.org/10.1016/j.atmosres.2019.04.017, 2019.
Dai, H., Zhu, J., Liao, H., Li, J., Liang, M., Yang, Y., and Yue, X.: Co-occurrence of ozone and PM2.5 pollution in the Yangtze River Delta over 2013–2019: Spatiotemporal distribution and meteorological conditions, Atmos. Res., 249, 105363, https://doi.org/10.1016/j.atmosres.2020.105363, 2021.
Ding, A. J., Huang, X., Nie, W., Sun, J. N., Kerminen, V. M., Petäjä, T., Su, H., Cheng, Y. F., Yang, X. Q., Wang, M. H., Chi, X. G., Wang, J. P., Virkkula, A., Guo, W. D., Yuan, J., Wang, S. Y., Zhang, R. J., Wu, Y. F., Song, Y., Zhu, T., Zilitinkevich, S., Kulmala, M., and Fu, C. B.: Enhanced haze pollution by black carbon in megacities in China, Geophys. Res. Lett., 43, 2873–2879, https://doi.org/10.1002/2016gl067745, 2016.
Ding, Q., Sun, J., Huang, X., Ding, A., Zou, J., Yang, X., and Fu, C.: Impacts of black carbon on the formation of advection–radiation fog during a haze pollution episode in eastern China, Atmos. Chem. Phys., 19, 7759–7774, https://doi.org/10.5194/acp-19-7759-2019, 2019.
Ding, S., Liu, D., Zhao, D., Hu, K., Tian, P., Zhou, W., Huang, M., Yang, Y., Wang, F., and Sheng, J.: Size-Related Physical Properties of Black Carbon in the Lower Atmosphere over Beijing and Europe, Environ. Sci. Technol., 53, 11112–11121, https://doi.org/10.1021/acs.est.9b03722, 2019.
Emmons, L. K., Walters, S., Hess, P. G., Lamarque, J.-F., Pfister, G. G., Fillmore, D., Granier, C., Guenther, A., Kinnison, D., Laepple, T., Orlando, J., Tie, X., Tyndall, G., Wiedinmyer, C., Baughcum, S. L., and Kloster, S.: Description and evaluation of the Model for Ozone and Related chemical Tracers, version 4 (MOZART-4), Geosci. Model Dev., 3, 43–67, https://doi.org/10.5194/gmd-3-43-2010, 2010.
Ferrero, L., Castelli, M., Ferrini, B. S., Moscatelli, M., Perrone, M. G., Sangiorgi, G., D'Angelo, L., Rovelli, G., Moroni, B., Scardazza, F., Močnik, G., Bolzacchini, E., Petitta, M., and Cappelletti, D.: Impact of black carbon aerosol over Italian basin valleys: high-resolution measurements along vertical profiles, radiative forcing and heating rate, Atmos. Chem. Phys., 14, 9641–9664, https://doi.org/10.5194/acp-14-9641-2014, 2014.
Gao, J., Zhu, B., Xiao, H., Kang, H., Hou, X., Yin, Y., Zhang, L., and Miao, Q.: Diurnal variations and source apportionment of ozone at the summit of Mount Huang, a rural site in Eastern China, Environ. Pollut., 222, 513–522, https://doi.org/10.1016/j.envpol.2016.11.031, 2017.
Gao, J., Zhu, B., Xiao, H., Kang, H., Pan, C., Wang, D., and Wang, H.: Effects of black carbon and boundary layer interaction on surface ozone in Nanjing, China, Atmos. Chem. Phys., 18, 7081–7094, https://doi.org/10.5194/acp-18-7081-2018, 2018.
Gao, M., Carmichael, G. R., Wang, Y., Ji, D., Liu, Z., and Wang, Z.: Improving simulations of sulfate aerosols during winter haze over Northern China: the impacts of heterogeneous oxidation by NO2, Front. Environ. Sci. Technol., 10, 1–11, https://doi.org/10.1007/s11783-016-0878-2, 2016a.
Gao, M., Carmichael, G. R., Wang, Y., Saide, P. E., Yu, M., Xin, J., Liu, Z., and Wang, Z.: Modeling study of the 2010 regional haze event in the North China Plain, Atmos. Chem. Phys., 16, 1673–1691, https://doi.org/10.5194/acp-16-1673-2016, 2016b.
Grell, G. A., Peckham, S. E., Schmitz, R., Mckeen, S. A., Frost, G. J., Skamarock, W. C., and Eder, B.: Fully coupled “online” chemistry within the WRF model, Atmos. Environ., 39, 6957–6975, https://doi.org/10.1016/j.atmosenv.2005.04.027, 2005.
Guenther, A., Karl, T., Harley, P., Wiedinmyer, C., Palmer, P. I., and Geron, C.: Estimates of global terrestrial isoprene emissions using MEGAN (Model of Emissions of Gases and Aerosols from Nature), Atmos. Chem. Phys., 6, 3181–3210, https://doi.org/10.5194/acp-6-3181-2006, 2006.
He, J., Gong, S., Yu, Y., Yu, L., Wu, L., Mao, H., Song, C., Zhao, S., Liu, H., and Li, X.: Air pollution characteristics and their relation to meteorological conditions during 2014–2015 in major Chinese cities, Environ. Pollut., 223, 484–496, https://doi.org/10.1016/j.envpol.2017.01.050, 2017.
Hong, S., Noh, Y., and Dudhia, J.: A New Vertical Diffusion Package with an Explicit Treatment of Entrainment Processes, Mon. Weather Rev., 134, 2318–2341, https://doi.org/10.1175/MWR3199.1, 2006.
Hu, K., Zhao, D., Liu, D., Ding, S., Tian, P., Yu, C., Zhou, W., Huang, M., and Ding, D.: Estimating radiative impacts of black carbon associated with mixing state in the lower atmosphere over the northern North China Plain, Chemosphere, 252, 126455, https://doi.org/10.1016/j.chemosphere.2020.126455, 2020.
Huang, X., Song, Y., Zhao, C., Cai, X., Zhang, H., and Zhu, T.: Direct Radiative Effect by Multicomponent Aerosol over China, J. Climate, 28, 3472–3495, https://doi.org/10.1175/JCLI-D-14-00365.1, 2015.
Huang, X., Wang, Z., and Ding, A.: Impact of Aerosol-PBL Interaction on Haze Pollution: Multiyear Observational Evidences in North China, Geophys. Res. Lett., 45, 8596–8603, https://doi.org/10.1029/2018GL079239, 2018.
Huang, X., Ding, A., Gao, J., Zheng, B., Zhou, D., Qi, X., Tang, R., Wang, J., Ren, C., Nie, W., Chi, X., Xu, Z., Chen, L., Li, Y., Che, F., Pang, N., Wang, H., Tong, D., Qin, W., Cheng, W., Liu, W., Fu, Q., Liu, B., Chai, F., Davis, S. J., Zhang, Q., and He, K.: Enhanced secondary pollution offset reduction of primary emissions during COVID-19 lockdown in China, Natl. Sci. Rev., 8, nwaa137, https://doi.org/10.1093/nsr/nwaa137, 2020.
Jiang, F., Zhou, P., Liu, Q., Wang, T., Zhuang, B., and Wang, X.: Modeling tropospheric ozone formation over East China in springtime, J. Atmos. Chem., 69, 303–319, https://doi.org/10.1007/s10874-012-9244-3, 2012.
Khor, W. Y., Hee, W. S., Tan, F., San Lim, H., Jafri, M. Z. M., and Holben, B.: Comparison of Aerosol optical depth (AOD) derived from AERONET sunphotometer and Lidar system, IOP Conf. Ser.: Earth Environ. Sci., 20, 012058, https://doi.org/10.1088/1755-1315/20/1/012058, 2014.
Kong, S., Li, X., Li, L., Yin, Y., Chen, K., Yuan, L., Zhang, Y., Shan, Y., and Ji, Y.: Variation of polycyclic aromatic hydrocarbons in atmospheric PM2.5 during winter haze period around 2014 Chinese Spring Festival at Nanjing: Insights of source changes, air mass direction and firework particle injection, Sci. Total Environ., 520, 59–72, https://doi.org/10.1016/j.scitotenv.2015.03.001, 2015.
Li, J., Liao, H., Hu, J., and Li, N.: Severe particulate pollution days in China during 2013-2018 and the associated typical weather patterns in Beijing-Tianjin-Hebei and the Yangtze River Delta regions, Environ. Pollut., 248, 74–81, https://doi.org/10.1016/j.envpol.2019.01.124, 2019.
Li, K., Liao, H., Zhu, J., and Moch, J. M.: Implications of RCP emissions on future PM2.5 air quality and direct radiative forcing over China, J. Geophys. Res.-Atmos., 121, 12985–13008, https://doi.org/10.1002/2016JD025623, 2016.
Li, K., Jacob, D. J., Liao, H., Zhu, J., Shah, V., Shen, L., Bates, K. H., Zhang, Q., and Zhai, S.: A two-pollutant strategy for improving ozone and particulate air quality in China, Nat. Geosci., 12, 906–910, https://doi.org/10.1038/s41561-019-0464-x, 2019.
Li, M., Zhang, Q., Kurokawa, J.-I., Woo, J.-H., He, K., Lu, Z., Ohara, T., Song, Y., Streets, D. G., Carmichael, G. R., Cheng, Y., Hong, C., Huo, H., Jiang, X., Kang, S., Liu, F., Su, H., and Zheng, B.: MIX: a mosaic Asian anthropogenic emission inventory under the international collaboration framework of the MICS-Asia and HTAP, Atmos. Chem. Phys., 17, 935–963, https://doi.org/10.5194/acp-17-935-2017, 2017.
Liu, D., Zhao, D., Xie, Z., Yu, C., Chen, Y., Tian, P., Ding, S., Hu, K., Lowe, D., Liu, Q., Zhou, W., Wang, F., Sheng, J., Kong, S., Hu, D., Wang, Z., Huang, M., and Ding, D.: Enhanced heating rate of black carbon above the planetary boundary layer over megacities in summertime, Environ, Res, Lett., 14, 124003, https://doi.org/10.1088/1748-9326/ab4872, 2019.
Liu, Q., Liu, D., Gao, Q., Tian, P., Wang, F., Zhao, D., Bi, K., Wu, Y., Ding, S., Hu, K., Zhang, J., Ding, D., and Zhao, C.: Vertical characteristics of aerosol hygroscopicity and impacts on optical properties over the North China Plain during winter, Atmos. Chem. Phys., 20, 3931–3944, https://doi.org/10.5194/acp-20-3931-2020, 2020.
Liu, T., Gong, S., He, J., Yu, M., Wang, Q., Li, H., Liu, W., Zhang, J., Li, L., Wang, X., Li, S., Lu, Y., Du, H., Wang, Y., Zhou, C., Liu, H., and Zhao, Q.: Attributions of meteorological and emission factors to the 2015 winter severe haze pollution episodes in China's Jing-Jin-Ji area, Atmos. Chem. Phys., 17, 2971–2980, https://doi.org/10.5194/acp-17-2971-2017, 2017.
Luan, T., Guo, X., Guo, L., and Zhang, T.: Quantifying the relationship between PM2.5 concentration, visibility and planetary boundary layer height for long-lasting haze and fog–haze mixed events in Beijing, Atmos. Chem. Phys., 18, 203–225, https://doi.org/10.5194/acp-18-203-2018, 2018.
Miao, Y., Guo, J., Liu, S., Liu, H., Li, Z., Zhang, W., and Zhai, P.: Classification of summertime synoptic patterns in Beijing and their associations with boundary layer structure affecting aerosol pollution, Atmos. Chem. Phys., 17, 3097–3110, https://doi.org/10.5194/acp-17-3097-2017, 2017.
Qiu, Y., Liao, H., Zhang, R., and Hu, J.: Simulated impacts of direct radiative effects of scattering and absorbing aerosols on surface layer aerosol concentrations in China during a heavily polluted event in February 2014, J. Geophys. Res.-Atmos., 122, 5955–5975, https://doi.org/10.1002/2016JD026309, 2017.
Rolph, G. D.: Real-time Environmental Applications and Display System (READY), NOAA Air Resources Laboratory, Silver Spring, MD, available at: http://ready.arl.noaa.gov (last access: 3 February 2022), 2013.
Stelson, A. W.: Urban aerosol refractive index prediction by partial molar refraction approach, Environ. Sci. Technol., 24, 1676–1679, https://doi.org/10.1021/es00081a008, 1990.
Sun, Y., Zhuang, G., Tang, A., Wang, Y., and An, Z.: Chemical Characteristics of PM2.5 and PM10 in Haze–Fog Episodes in Beijing, Environ. Sci. Technol., 40, 3148–3155, https://doi.org/10.1021/es051533g, 2006.
Tian, P., Liu, D., Huang, M., Liu, Q., Zhao, D., Ran, L., Deng, Z. Z., Wu, Y., Fu, S., and Bi, K.: The evolution of an aerosol event observed from aircraft in Beijing: An insight into regional pollution transport, Atmos. Environ., 206, 11–20, https://doi.org/10.1016/j.atmosenv.2019.02.005, 2019.
Tian, P., Liu, D., Zhao, D., Yu, C., Liu, Q., Huang, M., Deng, Z., Ran, L., Wu, Y., Ding, S., Hu, K., Zhao, G., Zhao, C., and Ding, D.: In situ vertical characteristics of optical properties and heating rates of aerosol over Beijing, Atmos. Chem. Phys., 20, 2603–2622, https://doi.org/10.5194/acp-20-2603-2020, 2020.
Wang, H., Shi, G. Y., Zhang, X. Y., Gong, S. L., Tan, S. C., Chen, B., Che, H. Z., and Li, T.: Mesoscale modelling study of the interactions between aerosols and PBL meteorology during a haze episode in China Jing–Jin–Ji and its near surrounding region – Part 2: Aerosols' radiative feedback effects, Atmos. Chem. Phys., 15, 3277–3287, https://doi.org/10.5194/acp-15-3277-2015, 2015.
Wang, J., Zhao, B., Wang, S., Yang, F., Xing, J., Morawska, L., Ding, A., Kulmala, M., Kerminen, V., Kujansuu, J., Wang, Z., Ding, D., Zhang, X., Wang, H., Tian, M., Petäjä, T., Jiang, J., and Hao, J.: Particulate matter pollution over China and the effects of control policies, Sci. Total Environ., 584, 426–447, https://doi.org/10.1016/j.scitotenv.2017.01.027, 2017.
Wang, Y., Ying, Q., Hu, J., and Zhang, H.: Spatial and temporal variations of six criteria air pollutants in 31 provincial capital cities in China during 2013–2014, Environ. Int., 73, 413–422, https://doi.org/10.1016/j.envint.2014.08.016, 2014.
Wang, Z., Cao, X., Zhang, L., Notholt, J., Zhou, B., Liu, R., and Zhang, B.: Lidar measurement of planetary boundary layer height and comparison with microwave profiling radiometer observation, Atmos. Meas. Tech., 5, 1965–1972, https://doi.org/10.5194/amt-5-1965-2012, 2012.
Wang, Z., Huang, X., and Ding, A.: Dome effect of black carbon and its key influencing factors: a one-dimensional modelling study, Atmos. Chem. Phys., 18, 2821–2834, https://doi.org/10.5194/acp-18-2821-2018, 2018.
Wang, Z., Huang, X., and Ding, A.: Optimization of vertical grid setting for air quality modelling in China considering the effect of aerosol-boundary layer interaction, Atmos. Environ., 210, 1–13, https://doi.org/10.1016/j.atmosenv.2019.04.042, 2019.
Watson-Parris, D., Schutgens, N., Reddington, C., Pringle, K. J., Liu, D., Allan, J. D., Coe, H., Carslaw, K. S., and Stier, P.: In situ constraints on the vertical distribution of global aerosol, Atmos. Chem. Phys., 19, 11765–11790, https://doi.org/10.5194/acp-19-11765-2019, 2019.
Wiedinmyer, C., Akagi, S. K., Yokelson, R. J., Emmons, L. K., Al-Saadi, J. A., Orlando, J. J., and Soja, A. J.: The Fire INventory from NCAR (FINN): a high resolution global model to estimate the emissions from open burning, Geosci. Model Dev., 4, 625–641, https://doi.org/10.5194/gmd-4-625-2011, 2011.
Wilcox, E. M., Thomas, R., Praveen, P. S., Pistone, K., Bender, F. A. M., and Ramanathan, V.: Black carbon solar absorption suppresses turbulence in the atmospheric boundary layer, P. Natl. Acad. Sci. USA, 113, 11794–11799, https://doi.org/10.1073/pnas.1525746113, 2016.
Wild, O., Zhu, X., and Prather, M. J.: Fast-J: Accurate Simulation of In- and Below-Cloud Photolysis in Tropospheric Chemical Models, J. Atmos. Chem., 37, 245–282, https://doi.org/10.1023/A:1006415919030, 2000.
Yang, Y., Smith, S., Wang, H., Lou, S., and Rasch, P.: Impact of Anthropogenic Emission Injection Height Uncertainty on Global Sulfur Dioxide and Aerosol Distribution, J. Geophys. Res.-Atmos., 124, 4812–4826, https://doi.org/10.1029/2018JD030001, 2019.
Zaveri, R. A. and Peters, L. K.: A new lumped structure photochemical mechanism for large-scale applications, J. Geophys. Res.-Atmos., 104, 30387–30415, https://doi.org/10.1029/1999JD900876, 1999.
Zaveri, R. A., Easter, R. C., Fast, J. D., and Peters, L. K.: Model for Simulating Aerosol Interactions and Chemistry (MOSAIC), J. Geophys. Res., 113, D13204, https://doi.org/10.1029/2007JD008782, 2008.
Zhang, H., Wang, S., Hao, J., Wang, X., Wang, S., Chai, F., and Li, M.: Air pollution and control action in Beijing, J. Clean. Prod., 112, 1519–1527, https://doi.org/10.1016/j.jclepro.2015.04.092, 2016.
Zhang, J. and Rao, S. T.: The Role of Vertical Mixing in the Temporal Evolution of Ground-Level Ozone Concentrations, J. Appl. Meteorol., 38, 1674–1691, https://doi.org/10.1175/1520-0450(1999)038<1674:TROVMI>2.0.CO;2, 1999.
Zhang, Q., Zheng, Y., Tong, D., Shao, M., Wang, S., Zhang, Y., Xu, X., Wang, J., He, H., Liu, W., Ding, Y., Lei, Y., Li, J., Wang, Z., Zhang, X., Wang, Y., Cheng, J., Liu, Y., Shi, Q., Yan, L., Geng, G., Hong, C., Li, M., Liu, F., Zheng, B., Cao, J., Fu, Q., Huo, J., Liu, B., Liu, Z., Yang, F., He, K., and Hao, J.: Drivers of improved PM2.5 air quality in China from 2013 to 2017, P. Natl. Acad. Sci. USA, 116, 24463–24469, https://doi.org/10.1073/pnas.1907956116, 2019.
Zhang, Y., Chen, Y., Sarwar, G., and Schere, K.: Impact of gas-phase mechanisms on Weather Research Forecasting Model with Chemistry (WRF/Chem) predictions: Mechanism implementation and comparative evaluation, J. Geophys. Res.-Atmos., 117, D01301, https://doi.org/10.1029/2011JD015775, 2012.
Zhao, C., Liu, X., Ruby Leung, L., and Hagos, S.: Radiative impact of mineral dust on monsoon precipitation variability over West Africa, Atmos. Chem. Phys., 11, 1879–1893, https://doi.org/10.5194/acp-11-1879-2011, 2011.
Zhao, D., Huang, M., Liu, D., Ding, D., Tian, P., Liu, Q., Zhou, W., Sheng, J., Wang, F., Bi, K., Yang, Y., Li, X., Hu, Y., Guo, X., Gao, Y., He, H., Chen, Y., Kong, S., and Huang, J.: Aircraft measurements of black carbon in the boundary layer over the North China Plain, Atmos. Chem. Phys. Discuss. [preprint], https://doi.org/10.5194/acp-2017-1118, 2018.
Zhao, D., Huang, M., Tian, P., He, H., Lowe, D., Zhou, W., Sheng, J., Wang, F., Bi, K., Kong, S., Yang, Y., Liu, Q., Liu, D., and Ding, D.: Vertical characteristics of black carbon physical properties over Beijing region in warm and cold seasons, Atmos. Environ., 213, 296–310, https://doi.org/10.1016/j.atmosenv.2019.06.007, 2019.
Zheng, B., Tong, D., Li, M., Liu, F., Hong, C., Geng, G., Li, H., Li, X., Peng, L., Qi, J., Yan, L., Zhang, Y., Zhao, H., Zheng, Y., He, K., and Zhang, Q.: Trends in China's anthropogenic emissions since 2010 as the consequence of clean air actions, Atmos. Chem. Phys., 18, 14095–14111, https://doi.org/10.5194/acp-18-14095-2018, 2018.
Zhu, J., Chen, L., Liao, H., Yang, H., Yang, Y., and Yue, X.: Enhanced PM2.5 Decreases and O3 Increases in China during COVID-19 Lockdown by Aerosol-Radiation Feedback, Geophys. Res. Lett., 48, e2020GL090260, https://doi.org/10.1029/2020GL090260, 2020.
- Abstract
- Introduction
- Method
- Model evaluation
- A comparison of BC DRE with the original and modified vertical profiles
- Roles of BC vertical profiles
- Conclusions
- Data availability
- Author contributions
- Competing interests
- Disclaimer
- Acknowledgements
- Financial support
- Review statement
- References
- Supplement