the Creative Commons Attribution 4.0 License.
the Creative Commons Attribution 4.0 License.
 | 03 Feb 2022
Distinct evolutions of haze pollution from winter to the following spring over the North China Plain: role of the North Atlantic sea surface temperature anomalies
Linye Song
Shangfeng Chen
Wen Chen
Jianping Guo
Conglan Cheng
Yong Wang
This study reveals that haze pollution (HP) over the North China Plain (NCP) in winter can persist to the following spring during most years. The persistence of haze pollution over the NCP (HPNCP) is attributed to the maintenance of an anticyclonic anomaly (AA) over northeast Asia and southerly wind anomalies over the NCP. Southerly wind anomalies over the NCP reduce surface wind speed and increase relative humidity, which are conducive to above-normal HPNCP both in winter and spring. However, there exist several years when above-normal HPNCP in winter are followed by below-normal HPNCP in the following spring. The reversed HPNCP in winter and spring in these years is due to the inverted atmospheric anomalies over northeast Asia. In particular, AA over northeast Asia in winter is replaced by a cyclonic anomaly (CA) in the following spring. The resultant spring northerly wind anomalies over the NCP are conducive to below-normal HPNCP. These two distinctive evolutions of HPNCP and atmospheric anomalies over northeast Asia from winter to spring are attributed to the different evolutions of sea surface temperature anomalies (SSTAs) in the North Atlantic. In the persistent years, warm North Atlantic SSTAs in winter persist to the following spring via a positive air–sea interaction process and induce a negative spring North Atlantic Oscillation (NAO)-like pattern, which contributes to the AA over northeast Asia via an atmospheric wave train. By contrast, in the reverse years, cold SSTAs in the North Atlantic are maintained from winter to spring, which induce a positive spring NAO-like pattern and lead to a CA over northeast Asia via an atmospheric wave train. Hence, this study improves our understanding of the characteristics of haze pollution evolution from winter to the following spring and suggests the potential role of North Atlantic SSTAs to serve as an important preceding signal for haze pollution prediction one season ahead over the North China Plain.
- Article
(16063 KB) - Full-text XML
- BibTeX
- EndNote


Haze pollution has become a serious air quality issue in China accompanying rapid urbanization and fast economic development (e.g., Ding and Liu, 2004; Wang and Chen, 2016; Zhang et al., 2018). It has been well recognized that the occurrence of haze pollution events can exert substantial impacts on human health, air transportation, ground traffic, agriculture production, and regional climate change (e.g., Koren et al., 2012; Fu et al., 2014; F. Wang et al., 2014; Y. Wang et al., 2014; Wu et al., 2016; Tie et al., 2016; Cohen et al., 2017; Guo et al., 2018; Zhang et al., 2018; Lu et al., 2019). For example, Cohen et al. (2017) reported that nearly 4.2 million premature deaths in the world in 2015 were attributed to the overexposure to PM2.5. In addition, haze pollution is suggested to have resulted in a decrease of about 1.2 %–3.8 % of the annual gross national product (GNP; Zhang and Crooks, 2012). Furthermore, increasing concentration of anthropogenic aerosol, which is related to the enhanced haze pollution, could exert significant impacts on atmospheric circulation and regional precipitation change (Koren et al., 2012; F. Wang et al., 2014). Considering the notable impacts of haze pollution, it is of great scientific importance to improve our understanding of the factors contributing to haze pollution and the associated mechanisms.
A number of previous studies have investigated the factors responsible for the variations in haze pollution in China on multiple timescales. The long-term increasing trend of haze pollution in China is generally attributable to rapid increases in anthropogenic emissions (e.g., Che et al., 2009; Ding and Liu, 2014; Zhao et al., 2016; Cheng et al., 2019). For example, Zhao et al. (2016) showed that the notable increasing trend of haze pollution in winter over eastern China has a close relationship with the gross domestic product (GDP) in China. Several studies have suggested that changes in the meteorological conditions due to global warming also play a role in the long-term trend of haze pollution in China (e.g., Cai et al., 2017; Liu et al., 2017; Ding et al., 2017; Zhang et al., 2020).
On the interannual and interdecadal timescales, variations in the haze pollution in China are suggested to be mainly controlled by meteorological conditions. For instance, Dang and Liao (2019) reported that changes in meteorological conditions accounted for about 70 % of the variation in the annual haze days in the Beijing–Tianjin–Hebei region. Zhao et al. (2016) suggested that the Pacific Decadal Oscillation could exert marked impacts on the interdecadal variation in the haze pollution in eastern China via inducing large-scale atmospheric circulation anomalies over East Asia. The Pacific Decadal Oscillation is the first leading mode of sea surface temperature anomalies (SSTAs) in the North Pacific on the interdecadal timescale (Mantua et al., 1997; Zhang et al., 1997; Duan et al., 2013). Xiao et al. (2014) showed that the Atlantic Multidecadal Oscillation modulates haze pollution in China via triggering an atmospheric wave train over Eurasia. The Atlantic Multidecadal Oscillation is the dominant mode of SSTAs in the North Atlantic on the multidecadal timescale (Kerr, 2000). Compared to the interdecadal variation, many more studies have examined the factors for the interannual variation in haze pollution in China, mainly concentrating on boreal winter. It is shown that interannual variation in haze pollution in eastern China can be impacted by the Arctic Oscillation (Yin et al., 2015), East Asian winter monsoon (Li et al., 2016; Chen et al., 2020), El Niño–Southern Oscillation (ENSO) (Chang et al., 2016; Liu et al., 2017; Li et al., 2017; He et al., 2019), North Atlantic SSTAs (Xiao et al., 2014), Arctic sea ice (Wang et al., 2015; Yin and Wang, 2017), Eurasian snow cover (Yin and Wang, 2018), and the East Atlantic–Western Russian (EAWR) teleconnection pattern (Yin and Wang, 2017; Chen et al., 2020). A recent study has examined the factors modulating the interannual variation in springtime haze pollution in the North China Plain Region (NCPR) (Chen et al., 2019). Note that the NCPR is one of the most important regions in China with very dense population, high levels of traffic activity, and a highly developed economy. In addition, the NCPR is also the most polluted region in China (Yin et al., 2015). It is indicated that North Atlantic SSTAs and the North Atlantic Oscillation (NAO, the first leading mode of interannual atmospheric variability over the North Atlantic region; Hurrell, 1995) play important roles in determining the haze pollution over the NCPR via modulating atmospheric circulation anomalies over northeast Asia through triggering an atmospheric wave train extending from the North Atlantic across Europe to East Asia (Chen et al., 2019). However, Chen et al. (2019) mainly focused on investigating the physical mechanism and were limited to one season of spring. Although there are many previous studies investigating the interannual variations in haze pollution over the NCPR, they mainly separate winter and spring and view them independently. However, impacts of haze pollution may depend strongly on the time period of seasonal persistence. Hence, an important question is raised of whether there exists a relation between interannual variation in haze pollution over the NCPR in winter and the following spring. In particular, could the wintertime haze pollution persist from winter to the following spring? If so, what are the plausible factors contributing to the across-season persistence of haze pollution over the NCPR from winter to the succedent spring? Understanding the evolution features of the haze pollution from winter to spring and the associated mechanisms would have important implications for the seasonal prediction of haze pollution over the NCPR. In this study, the issues raised above will be investigated and addressed.
The remainder of this paper is organized as follows. Section 2 describes the data and methods used in this study. Section 3 examines relation of interannual variations between winter and spring haze pollution over the NCPR and compares the two distinct types of haze evolutions found in this paper. Section 4 examines the factors responsible for the different evolutions of haze pollution over the NCPR from winter to the following spring. A summary and discussion are provided in Sect. 5.
2.1 Data
Monthly mean horizontal winds, geopotential height, relative humidity, surface wind speed, and surface heat fluxes are obtained from the National Centers for Environmental Prediction–National Center for Atmospheric Research (NCEP–NCAR) reanalysis (Kalnay et al., 1996; https://psl.noaa.gov/data/gridded/data.ncep.reanalysis.html, last access: 6 February 2021), which are available from January 1948 to the present. Surface heat fluxes are the sum of the surface latent and sensible heat fluxes and surface shortwave and longwave radiation. Atmospheric data from the NCEP–NCAR reanalysis have a horizontal resolution of 2.5∘ × 2.5∘ in the longitude–latitude grids, while surface heat fluxes are on T62 Gaussian grids. Monthly mean sea surface temperature (SST) data are derived from the National Oceanic and Atmospheric Administration (NOAA) Extended Reconstructed SST version 5 (ERSSTV5) from January 1854 to the present (Huang et al., 2017; https://psl.noaa.gov/data/gridded/data.noaa.ersst.v5.html, last access: 6 February 2021), with a horizontal resolution of 2∘ × 2∘ in the longitude–latitude grids. Atmospheric teleconnection indices, including the EAWR index and NAO index, are provided by the NOAA Climate Prediction Center (https://www.cpc.ncep.noaa.gov/data/, last access: 6 February 2021).
Surface data of visibility and relative humidity observed at 748 meteorological stations are extracted from the National Meteorological Information Center of China from 1979 to 2012. These meteorological observations are measured daily at 02:00, 08:00, 14:00, and 20:00 Beijing time (UTC + 8). Following previous studies (Guo et al., 2017; Chen et al., 2019, 2020), a series of quality control techniques are applied to these meteorological data to ensure their quality and consistency. In particular, we exclude the observation station if it contains any missing values throughout the whole analysis period. In addition, the data have been removed when precipitation, snow events, and dust storms occurred. After the above quality control, there remain 218 stations over eastern China (Fig. 1a). Furthermore, following previous studies (Che et al., 2009; Guo et al., 2017; Chen et al., 2019, 2020), we only use the data at 14:00 Beijing time, as this time may be the most representative of the daily visibility compared to other times. It should be mentioned that the atmospheric visibility, which is traditionally measured by human visual observation, has been determined by the automatic visibility instruments since the year 2014. Due to the changes in the observation methods, large uncertainties have emerged due to the issues of heterogeneity as reported by Li et al. (2018). Thus, this study does not employ the visibility data after 2014.
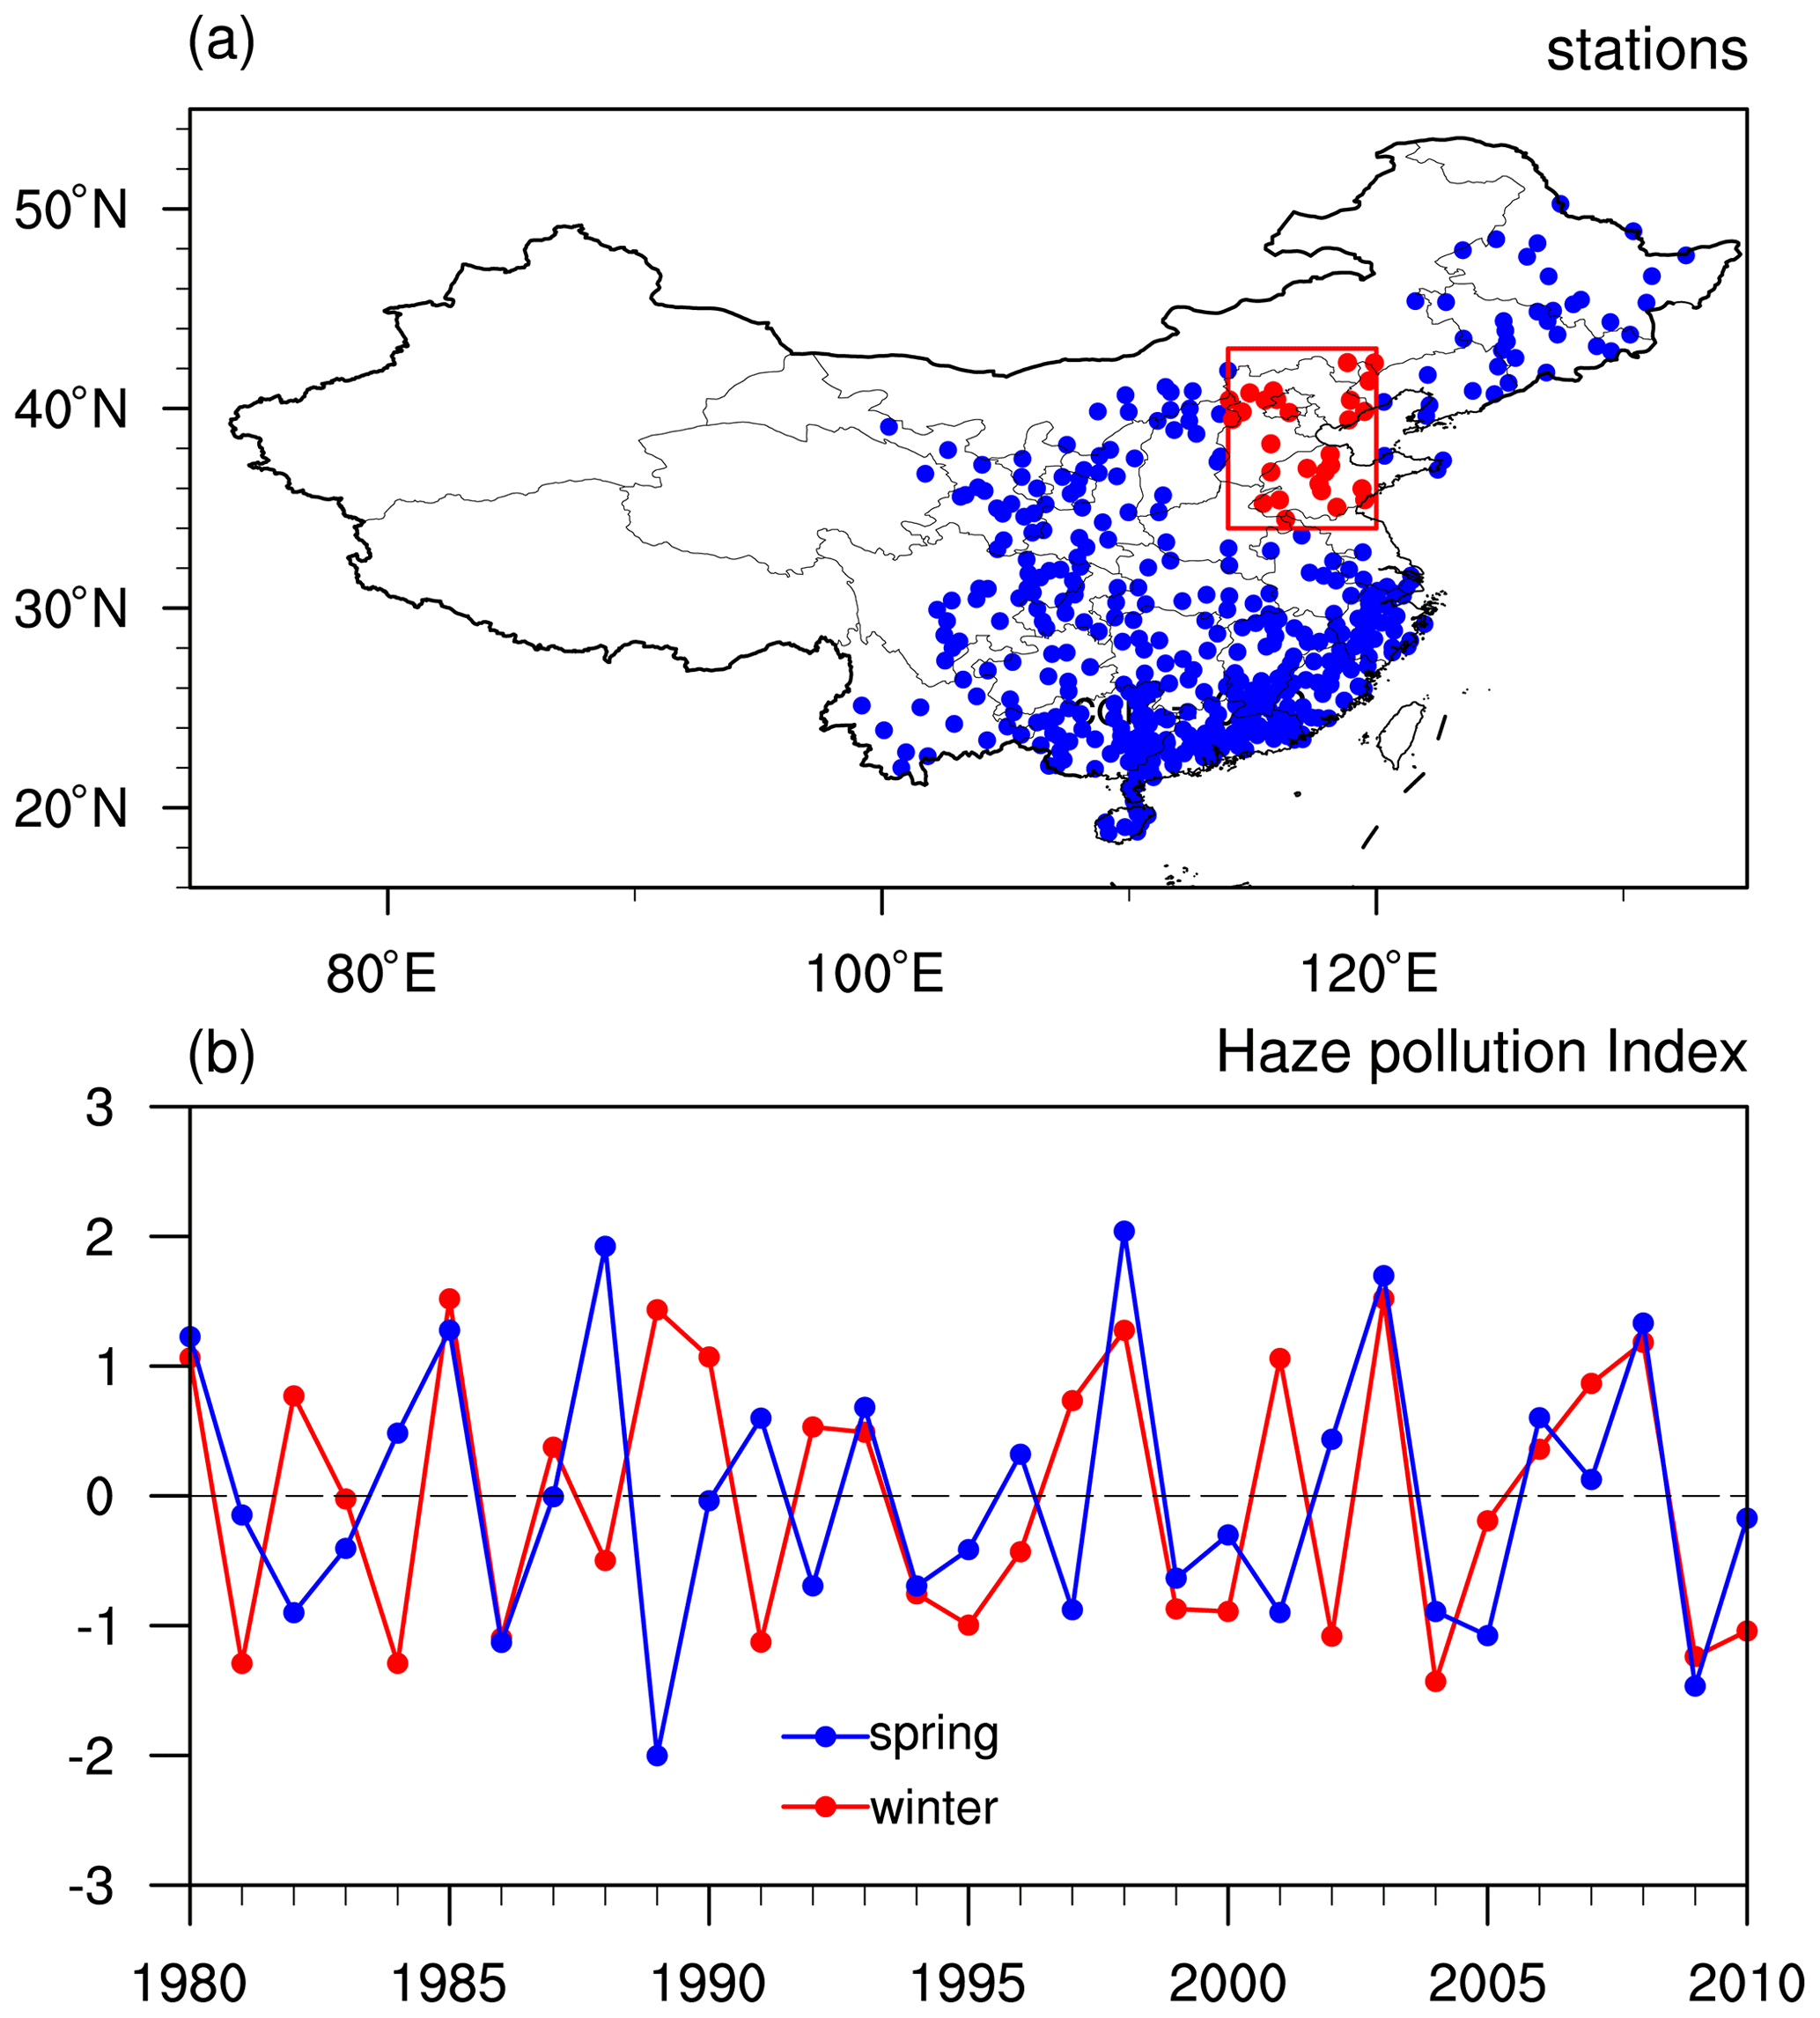
Figure 1(a) Geographical locations of the meteorological stations (denoted by dots) in China. Red dots represent the meteorological stations in the NCPR. (b) Standardized time series of the NDI in winter (December–January–February mean, DJF for short) and its following spring (March–April–May mean, MAM for short) over 1980–2010.
Long-term trends of all variables have been removed to avoid the impact of the global warming signal and to focus on the interannual variation in haze pollution. Anomalies are calculated by subtracting the monthly climatology from the original data. Significance levels of the correlation coefficient and composite differences are estimated based on the two-tailed Student's t test.
2.2 Dry extinction coefficient of aerosol
As in previous studies (Li et al., 2018; Guo et al., 2017; Chen et al., 2019, 2020), this study employs the dry extinction coefficient (DECC) of aerosol to represent the haze pollution. The DECC is defined based on the Koschmieder relationship (Koschmieder, 1926):
where K is equal to 3.912, Visdry indicates atmospheric visibility after removing the effect of relative humidity. It is noted that atmospheric visibility is not only impacted by the dry particles but also affected by the amount of water uptake. For instance, high humidity associated with fog could lead to a reduction in atmospheric visibility. Previous studies have suggested that the visibility needs to be corrected in the presence of relative humidity ranging from 40 % to 90 % (e.g., Rosenfeld et al., 2007), which is expressed as follows:
where Visobs indicates the observed visibility. Note that all visibility data are discarded when the relative humidity (RH) is higher than 90 % to remove the influence of fog events, non-linear aerosol, and water interactions (Craig and Faulkenberry, 1979; Guo et al., 2017; Chen et al., 2019, 2020).
2.3 Wave activity flux
We use the wave activity flux defined by Takaya and Nakamura (2001) to examine the stationary Rossby wave propagation, which can be expressed as follows:
where is the climatological wind vector. denotes geostrophic wind anomalies. ψ′ is geostrophic stream function anomalies. Ho, p, and N represent scale height, pressure normalized by 1000 hPa, and Brunt–Väisälä frequency, respectively. Ra, T′, and fo denote the gas constant of the dry air, air temperature anomalies, and the Coriolis parameter at 45∘ N, respectively. Subscripts x and y are the derivatives in the zonal and meridional directions, respectively. The climatological mean is calculated over the 1980–2010 period.
2.4 Barotropic model
The present study employs a linear barotropic model to investigate the role of the SST anomalies (SSTAs) over the subtropical and tropical North Atlantic in triggering atmospheric Rossby wave train over middle–high latitudes of Eurasia. Previous studies have demonstrated that cold (warm) SSTAs in the subtropical and tropical regions are able to induce convergence (divergence) anomalies in the upper troposphere that act as effective sources of atmospheric stationary Rossby waves (Hodson et al., 2010; Watanabe, 2004; Zuo et al., 2013; Wu et al., 2011; Chen et al., 2016, 2020). Based on a simple barotropic vorticity equation (Watanabe, 2004; Sardeshmukh and Hoskins, 1988; Chen et al., 2020), the barotropic model is established by
where ψ′ and are the perturbation stream function and basic state stream function, respectively. f and J represent the Coriolis parameter and Jacobian operator, respectively. S′ represents the vorticity source generated by the atmospheric divergence. The barotropic model consists in a biharmonic diffusion and a linear damping that indicate the Rayleigh friction. Note that solution of the above equation associated with the barotropic model is determined by the vorticity perturbation (S′) and the basic state. In the present analysis, the basic state is chosen at the 300 hPa level over 1979–2010 using the NCEP–NCAR reanalysis data. O'Reilly et al. (2018) reported that results of the barotropic model experiments are insensitive to the basic states chosen from the upper troposphere (e.g., from 350 to 200 hPa). It should be mentioned that the basic state is chosen from the upper troposphere because the strongest convergence/divergence anomalies generated by the tropical and subtropical SST cooling/warming tend to be observed in the upper troposphere (e.g., Sun et al., 2015; O'Reilly et al., 2018; Chen et al., 2020).
Following previous analyses (Yin and Wang, 2016; Chen et al., 2019, 2020), the NCPR corresponds to the region spanning 34–43∘ N and 114–120∘ E (Fig. 1a). Slight changes in the region to represent the NCPR do not affect the main results of this study. Figure 1a shows that there are a total of 28 meteorological observational stations in the NCPR (red dots in the box). As in previous studies (Yin and Wang, 2016; Chen et al., 2019, 2020), this analysis defines a NCPR DECC index (NDI for short) by averaging the DECC anomalies over the abovementioned 28 stations to describe variation in haze pollution over the NCPR (Fig. 1b). We have examined the first empirical orthogonal function mode (EOF1) of interannual variations in the DECC over the NCPR in winter and spring (Fig. 2a and b). Spatial patterns of the EOF1 in winter and spring are featured by same-sign DECC anomalies over the NCPR, except for a small patch of regions (Fig. 2a and b). In addition, the correlation coefficient between the principal component (PC) time series corresponding to the EOF1 of winter DECC anomalies (Fig. 2c, red line) and the winter NDI (Fig. 1b, red line) is as high as 0.86, significant at the 99.9 % confidence level. Similarly, the correlation coefficient between the PC1 time series of the spring DECC anomalies (Fig. 2c, blue line) and the spring NDI (Fig. 1b, blue line) reaches 0.93. The above evidence suggests that the 28 stations in the NCPR can generally be considered whole.
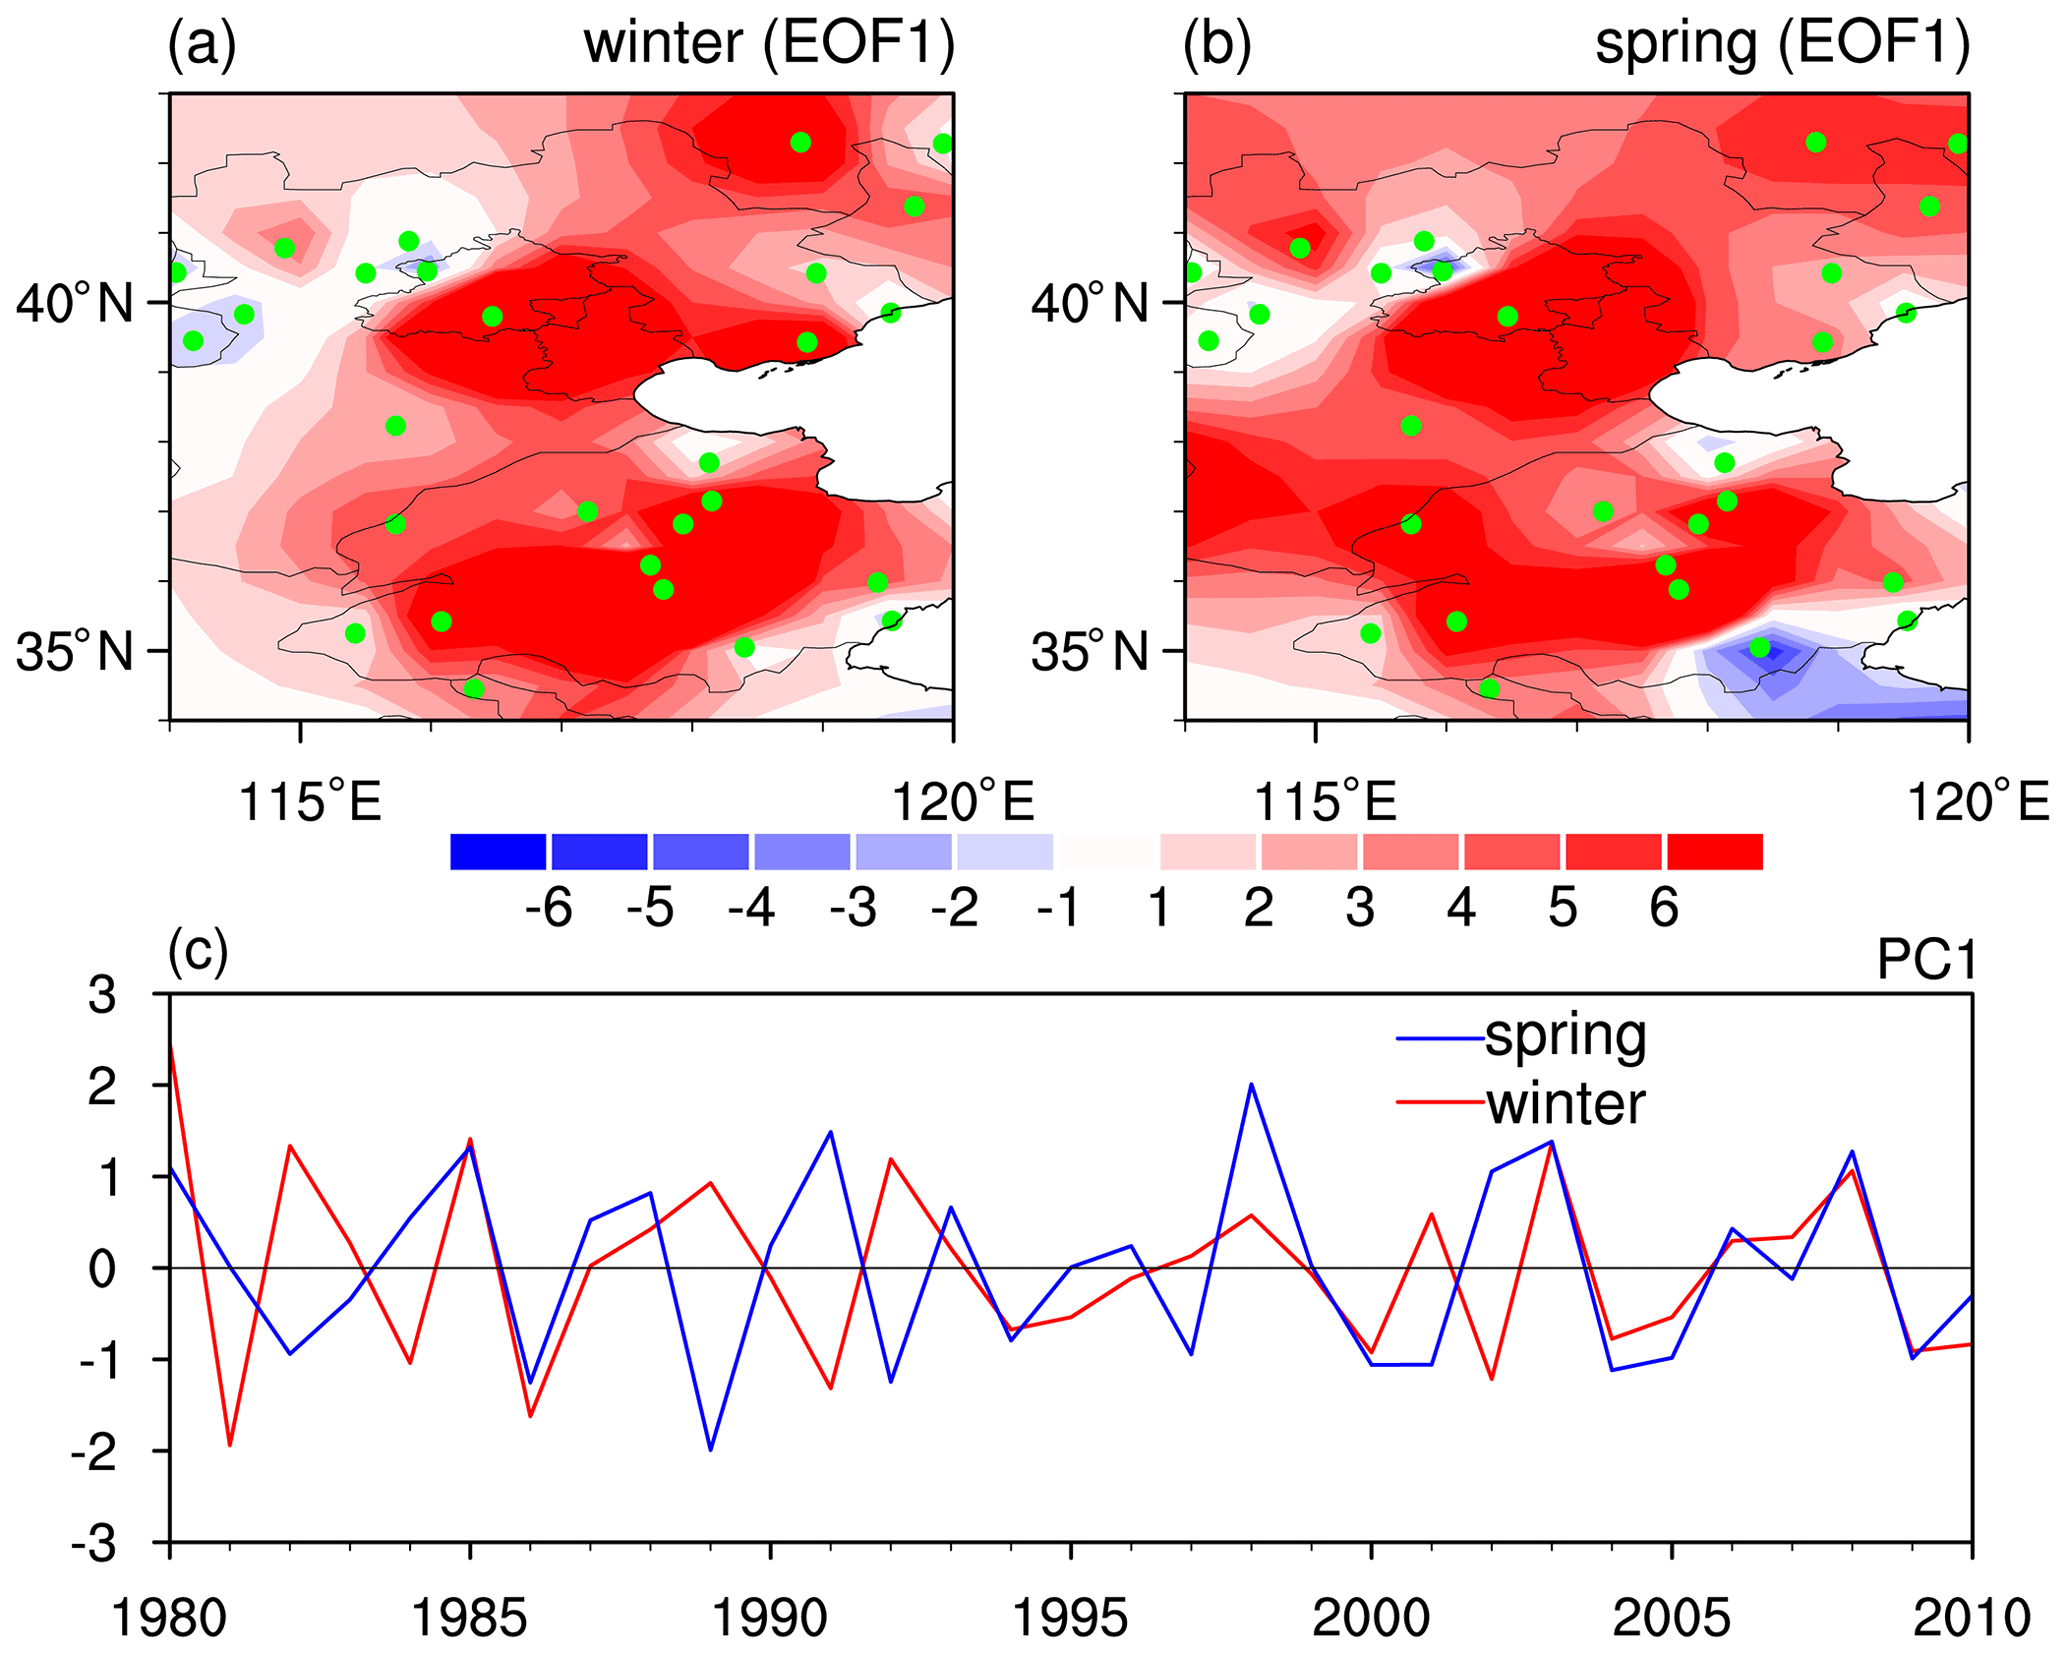
Figure 2The first EOF mode (EOF1) of interannual anomalies of the DECC in (a) winter and (b) spring over the NCPR (i.e., 34–43∘ N and 114–120∘ E) for the period of 1979–2010. (c) The corresponding PC time series of the EOF1 of interannual anomalies of the DECC in winter (red line) and spring (blue line). The green dots in (a–b) indicate the stations in the NCPR.
The correlation coefficient between the winter and spring NDI over 1980–2011 is 0.30, exceeding the 90 % confidence level according to the two-tailed Student's t test. Note that we have also employed the Monte Carlo method to evaluate the robustness of the winter–spring haze connection by constructing 10 000 random realizations of spring haze time series. The correlation coefficient with a permutation of 90 % (95 %) confidence is about 0.23 (0.3). Therefore, the Monte Carlo permutation tests demonstrate that the linkage between the winter and spring haze can pass the 95 % confidence level. From Fig. 1b, 20 out of 32 years with positive or negative winter haze pollution anomalies are followed by same-sign anomalies of haze pollution in the following spring over the North China Plain (Fig. 1b). This indicates that the portion is about 62.5 % for the persistent relationship between the winter and spring haze. In particular, most of the positive (negative) values of the winter NDI are followed by extremely large (small) values of the spring NDI (for example, years of 1980, 1985, 1986). The above evidence collectively suggests a close in-phase variation in the haze pollution in winter and the following spring. In particular, if haze pollution in winter is less (more) serious over the NCPR, air conditions over the NCPR in the following spring also tend to be better (worse) than normal.
From Fig. 1b, there also exist several years when values of the winter and following spring NDI are strongly opposed, showing out-of-phase variation. In these years, large negative (positive) values of the winter NDI are followed by large positive (negative) spring NDIs (Fig. 1b). For instance, in 1984 and 1991, the winter NDIs are significantly negative, while the following spring NDIs are significantly positive (Fig. 1b). In 1982 and 1989, large positive values of the winter NDI are followed by large negative values of the spring NDI (Fig. 1b). In the following, positive (negative) phases of the winter and spring NDIs are identified when the normalized NDIs are larger (less) than 0.43. Previous studies have indicated that a value of ±0.43 standard deviation can separate a time series into three portions (positive and negative phases and normal conditions) with nearly the same sample sizes. Note that the use of ±0.5 standard deviation as the threshold to define anomalous NDI years leads to similar results but with smaller sample sizes. Table 1 presents the years when winter and spring NDIs are in phase and out of phase. According to Table 1, there are a total of 11 (9) years for the in-phase (out-of-phase) years. In the following, out-of-phase (in-phase) years are called reverse (persistent) years for convenience of descriptions.

We employ composite analysis to compare evolutions of the DECC and atmospheric anomalies between the persistent and reverse years. Note that in performing the composite analysis, we reversed the anomalies when the winter NDI is negative since, to a large extent, the DECC and atmospheric circulation anomalies over the NCPR are symmetric between the positive and negative phases of the winter NDI. Hence, the descriptions below correspond to the positive phases of the winter NDI but also apply to the negative phases except with opposite signs.
Figure 3 shows composite anomalies of the DECC in winter and the following spring in the persistent and reverse years. For the persistent years, large positive DECC anomalies (indicating more serious haze pollution) are seen over the NCPR and surrounding regions (Fig. 3a). DECC anomalies in winter over southern China are weak, suggesting a weak relation of the haze pollution between northern and southern China, consistent with previous studies (e.g., Li et al., 2017; He et al., 2019). Large positive DECC anomalies over the NCPR are maintained to the succedent spring with comparable amplitude (Fig. 3a and c). For the reverse years, large positive DECC anomalies also appear over the NCPR in winter (Fig. 3b). However, in the following spring, the NCPR and surrounding regions are dominated by significantly negative values of the DECC (Fig. 3d) (indicating air conditions in spring become better), which is in sharp contrast to the persistent years (Fig. 3c).
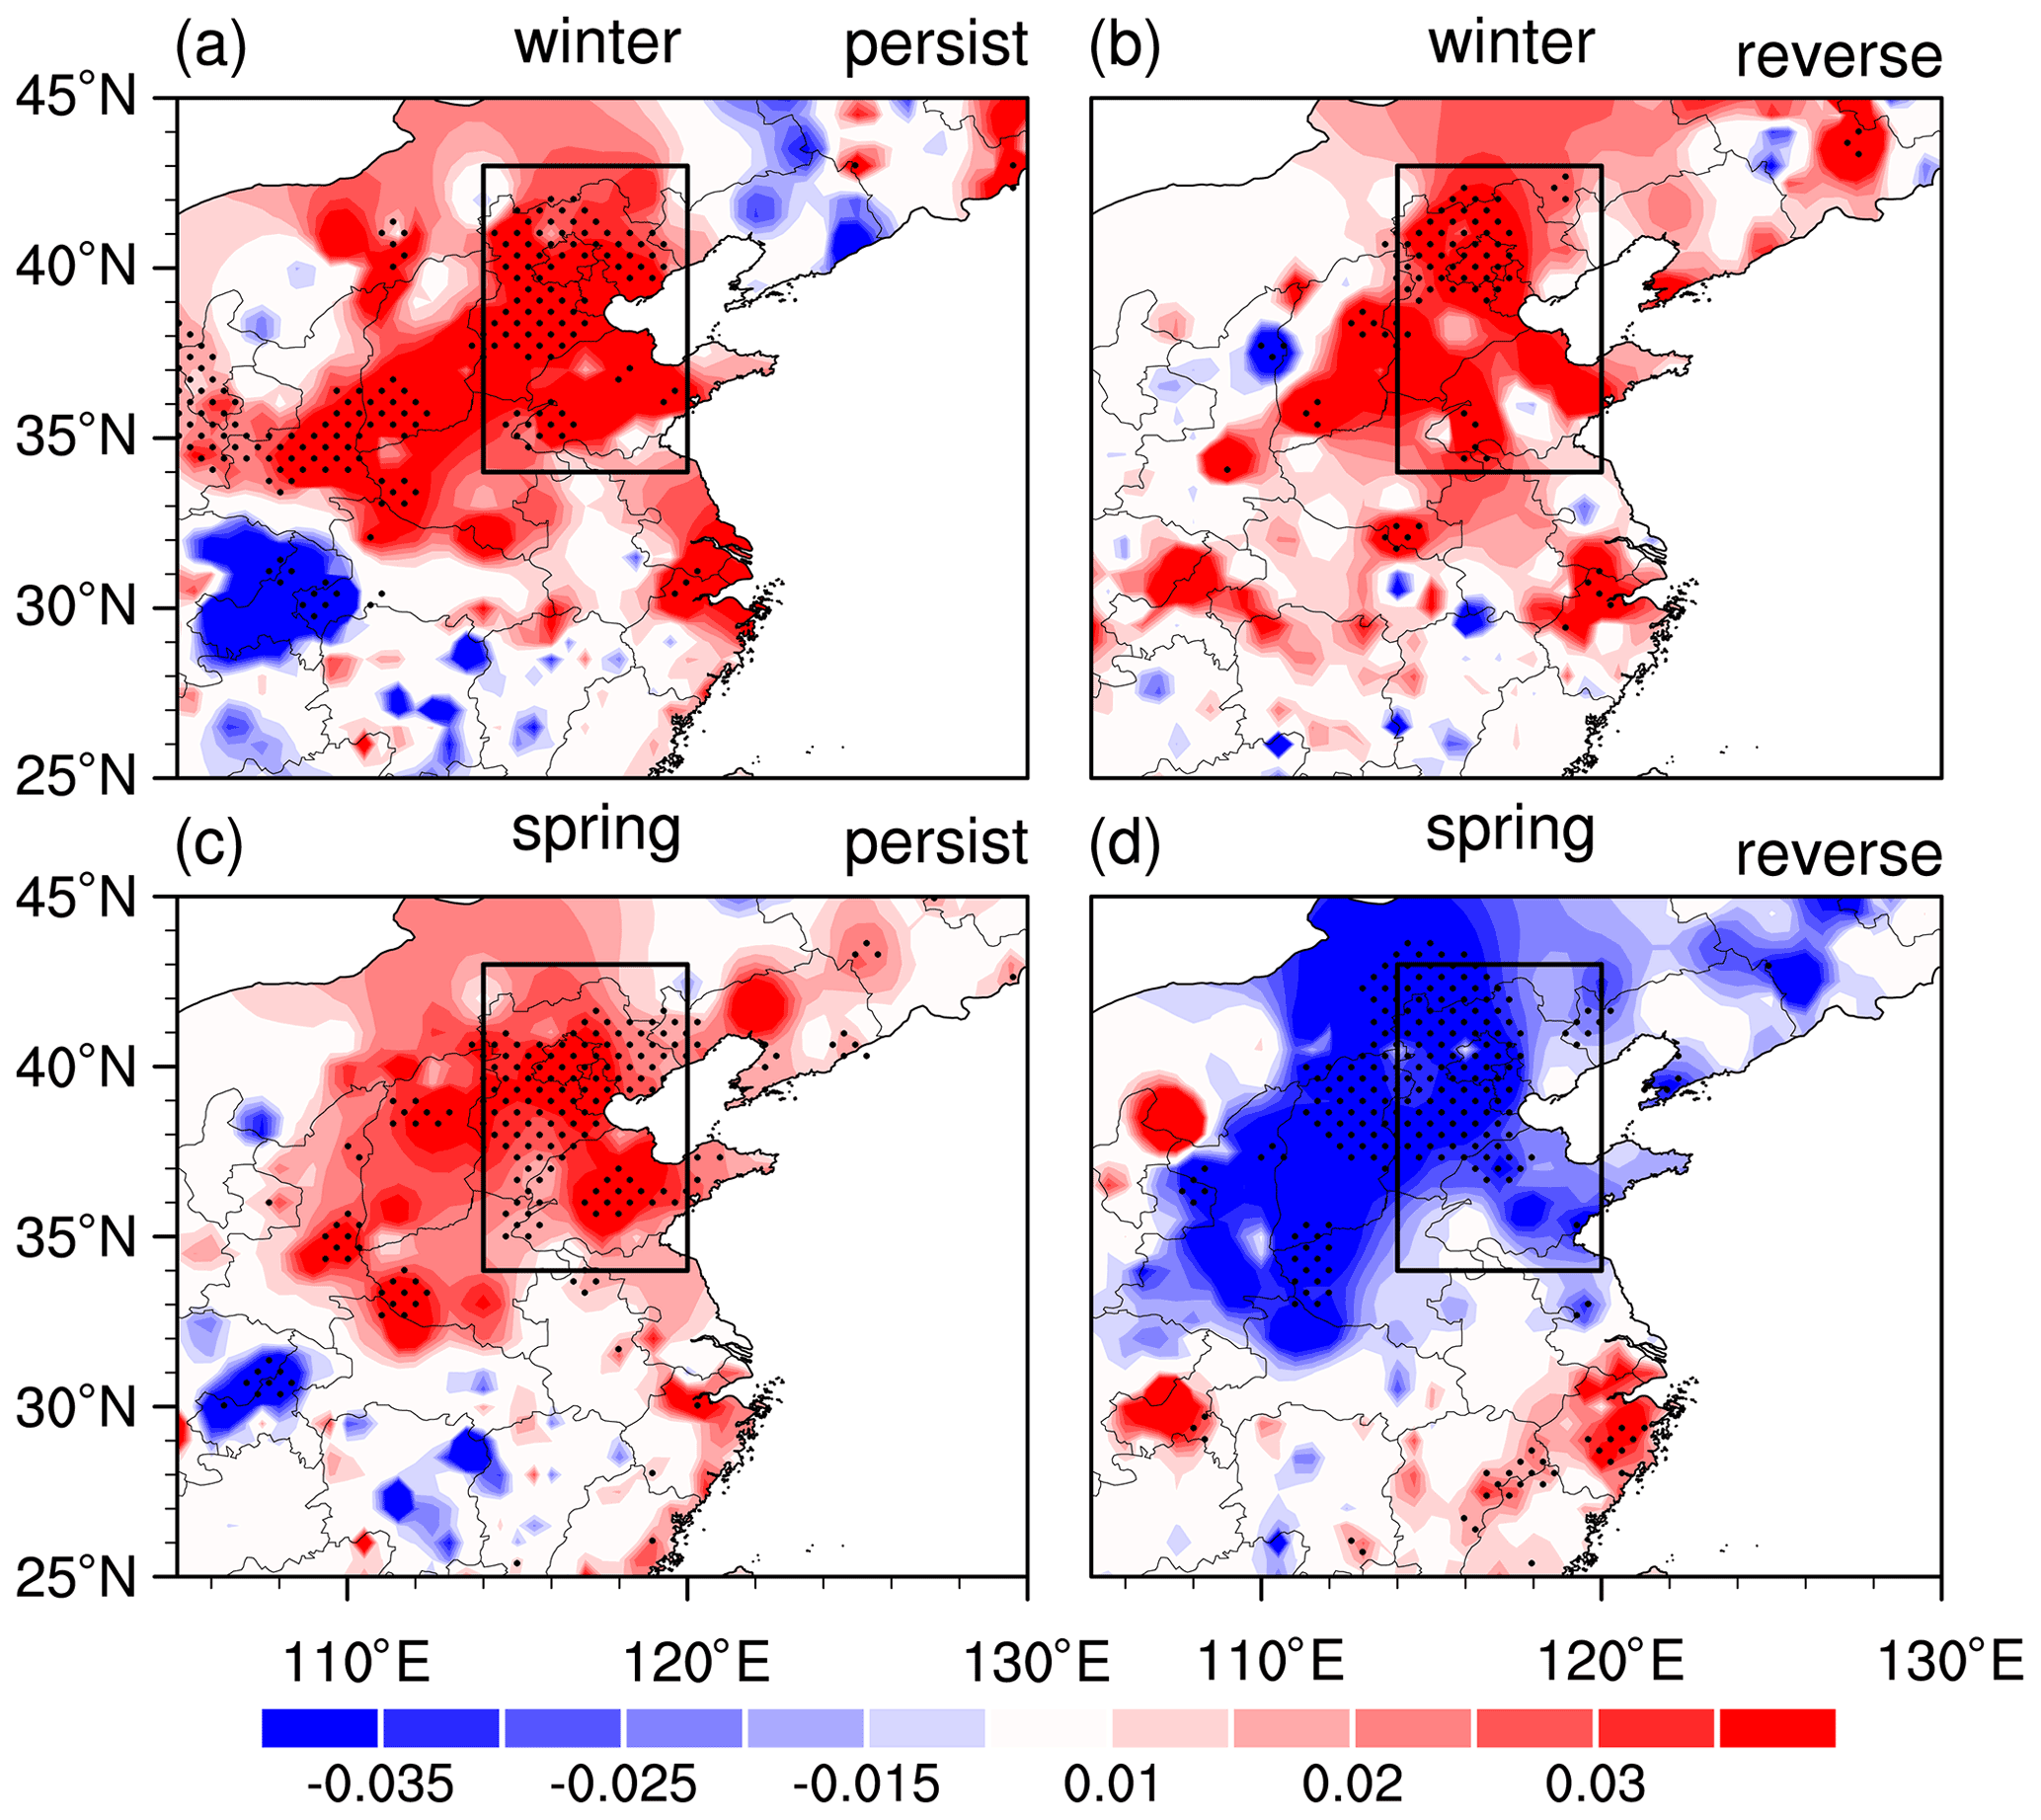
Figure 3Composite anomalies of the DECC (unit km−1) in (a, b) winter and (c, d) spring in the (a, c) persistent years and the (b, d) reverse years. Stippled regions indicate anomalies significant at the 5 % level.
Studies have demonstrated that meteorological conditions related to the atmospheric anomalies can explain above 66 % of interannual and interdecadal variations in haze pollution over most parts of eastern China (Zhang et al., 2013; Chen et al., 2019; He et al., 2019; Dang and Liao, 2019; Ma and Zhang, 2020). Hence, it is expected that different evolutions of the DECC anomalies from winter to the following spring over the NCPR may be associated with the distinct evolutions of atmospheric anomalies. Composite anomalies of winds and the streamfunction at 850 hPa in winter and the following spring for the persistent and reverse years are shown in Fig. 4. In the persistent years, a significant anticyclonic anomaly is seen over northeast Asia, accompanied by strong southerly wind anomalies over the NCPR and northerly wind anomalies over mid-latitudes of the North Pacific (Fig. 4a). In addition, another marked anticyclonic anomaly appears over the South China Sea and Philippine Sea, leading to strong southerly wind anomalies over southern China (Fig. 4a). The anomalous anticyclone over northeast Asia and associated southerly wind anomalies over the NCPR are maintained to the following spring (Fig. 4c).

Figure 4Composite anomalies of 850 hPa winds (vectors, unit m s−1) and streamfunction (shading, unit 105 m2 s−1) in (a, b) winter and (c, d) spring in the (a, c) persistent years and the (b, d) reverse years. Stippled regions indicate streamfunction anomalies that are statistically significant at the 5 % level.
For the reverse years, a strong anticyclonic anomaly also exists over northeast Asia but with a southeastward displacement (Fig. 4b) compared to that in the persistent years. Note that NCPR is also dominated by strong southerly wind anomalies (Fig. 4b). In contrast, the South China Sea and Philippine Sea are covered by an anomalous cyclone, together with northerly wind anomalies over southern China (Fig. 4b). Moreover, an anticyclonic anomaly occurs around the Russian Far East, accompanied by westerly wind anomalies to the north of Japan (Fig. 4b). In the following spring, the pronounced anticyclonic anomaly over northeast Asia and associated southerly wind anomalies over the NCPR are replaced by a marked cyclonic anomaly and northerly wind anomalies (Fig. 4d).
Hence, there appears a prominent difference in the atmospheric anomalies over northeast Asia between the persistent and reverse years. Specifically, in the persistent years, the anomalous anticyclone over northeast Asia and southerly wind anomalies over the NCPR are maintained from winter to the following spring. By contrast, in the reverse years, the wintertime anticyclonic anomaly is replaced by a cyclonic anomaly over northeast Asia, accompanied by a reversal of meridional wind anomalies over the NCPR from winter to the succedent spring.
The atmospheric anomalies can impact haze pollution over the NCPR in winter and spring via modulating surface wind speed, relative humidity, and boundary layer height (BLH) (e.g., Chen et al., 2019, 2020; He et al., 2019; Dang and Liao, 2019; Li et al., 2021). The increase (decrease) in the surface wind speed is (is not) conducive to the horizontal diffusion of pollutants, thus contributing to a below- (above-)normal DECC and less (more) serious haze pollution (Chen et al., 2019; Li et al., 2021). An increase (decrease) in the BLH tends to favor (suppress) vertical diffusion of pollutants and thus results in a below- (above-)normal DECC (Zhang et al., 2016; Wang et al., 2018). Furthermore, large (small) relative humidity is (is not) conducive to the generation of secondary organic compounds and secondary aerosol species (such as SO and NO), which contribute to more (less) serious haze pollution over the NCPR (Yu et al., 2005; Hennigan et al., 2008; Chen et al., 2019; Li et al., 2021; Ma and Zhang, 2020).
Composite anomalies of low-level (850 hPa) wind speed, relative humidity and the BLH in winter and spring are shown in Figs. 5–7, respectively. In winter, low-level wind speed is significantly decreased over the NCPR with a northwestward extension to Lake Baikal and an eastward extension to the western North Pacific for both the persistent and the reverse years (Fig. 5a and b). The southerly wind anomalies to the western side of the anticyclonic anomaly over northeast Asia (Fig. 4a and b) are opposed to the climatological northerly winds dominated by the East Asian winter monsoon (not shown) and lead to decreases in the total wind speed (Fig. 5a and b), which contributes to more serious haze pollution (Fig. 3a and b). In addition, southerly wind anomalies tend to bring more water vapor northward from the Southern Ocean and result in an increase in the relative humidity (Fig. 6a and b), which is conducive to the formation of secondary aerosol species (Yu et al., 2005; Hennigan et al., 2008; Chen et al., 2019) and contributes to more serious haze pollution over the NCPR in winter (Fig. 2a and b). Moreover, a large decrease in the BLH over the NCPR, which is associated with the anomalous anticyclone there, also contributes to an above-normal DECC via suppressing the vertical diffusion of pollutants (Fig. 7a and b) (Zhang et al., 2016; Wang et al., 2018). In the persistent years, sustenance of the anticyclonic anomaly over northeast Asia and southerly wind anomalies over the NCPR to the following spring (Fig. 4c) contribute to an above-normal DECC in spring (Fig. 3c) via reducing surface wind speed and the BLH (Figs. 5c and 7c) and increasing relative humidity (Fig. 6c). By contrast, in the reverse years, reversal of atmospheric anomalies over northeast Asia from an anticyclonic anomaly in winter (Fig. 4b) to a cyclonic anomaly in the following spring (Fig. 4d) results in the inverted DECC anomalies over the NCPR (Fig. 3b and d). In spring, the cyclonic anomaly over northeast Asia increase the low-level total wind speed (Fig. 5d) and BLH (Fig. 7d), which are conducive to the horizontal and vertical dispersion of pollutants and contribute to better air conditions. Additionally, the anomalous northerly winds (Fig. 4d) lead to a decrease in the relative humidity (Fig. 6d) via carrying colder and drier air from higher latitudes, suppressing the generation of secondary organic compounds and secondary aerosol species, and contributing to the mitigation of haze pollution (Fig. 3d). The above evidence suggests that the distinct evolutions of haze pollution over the NCPR between the persistent and reverse years are closely related to the different evolutions of atmospheric anomalies over northeast Asia.
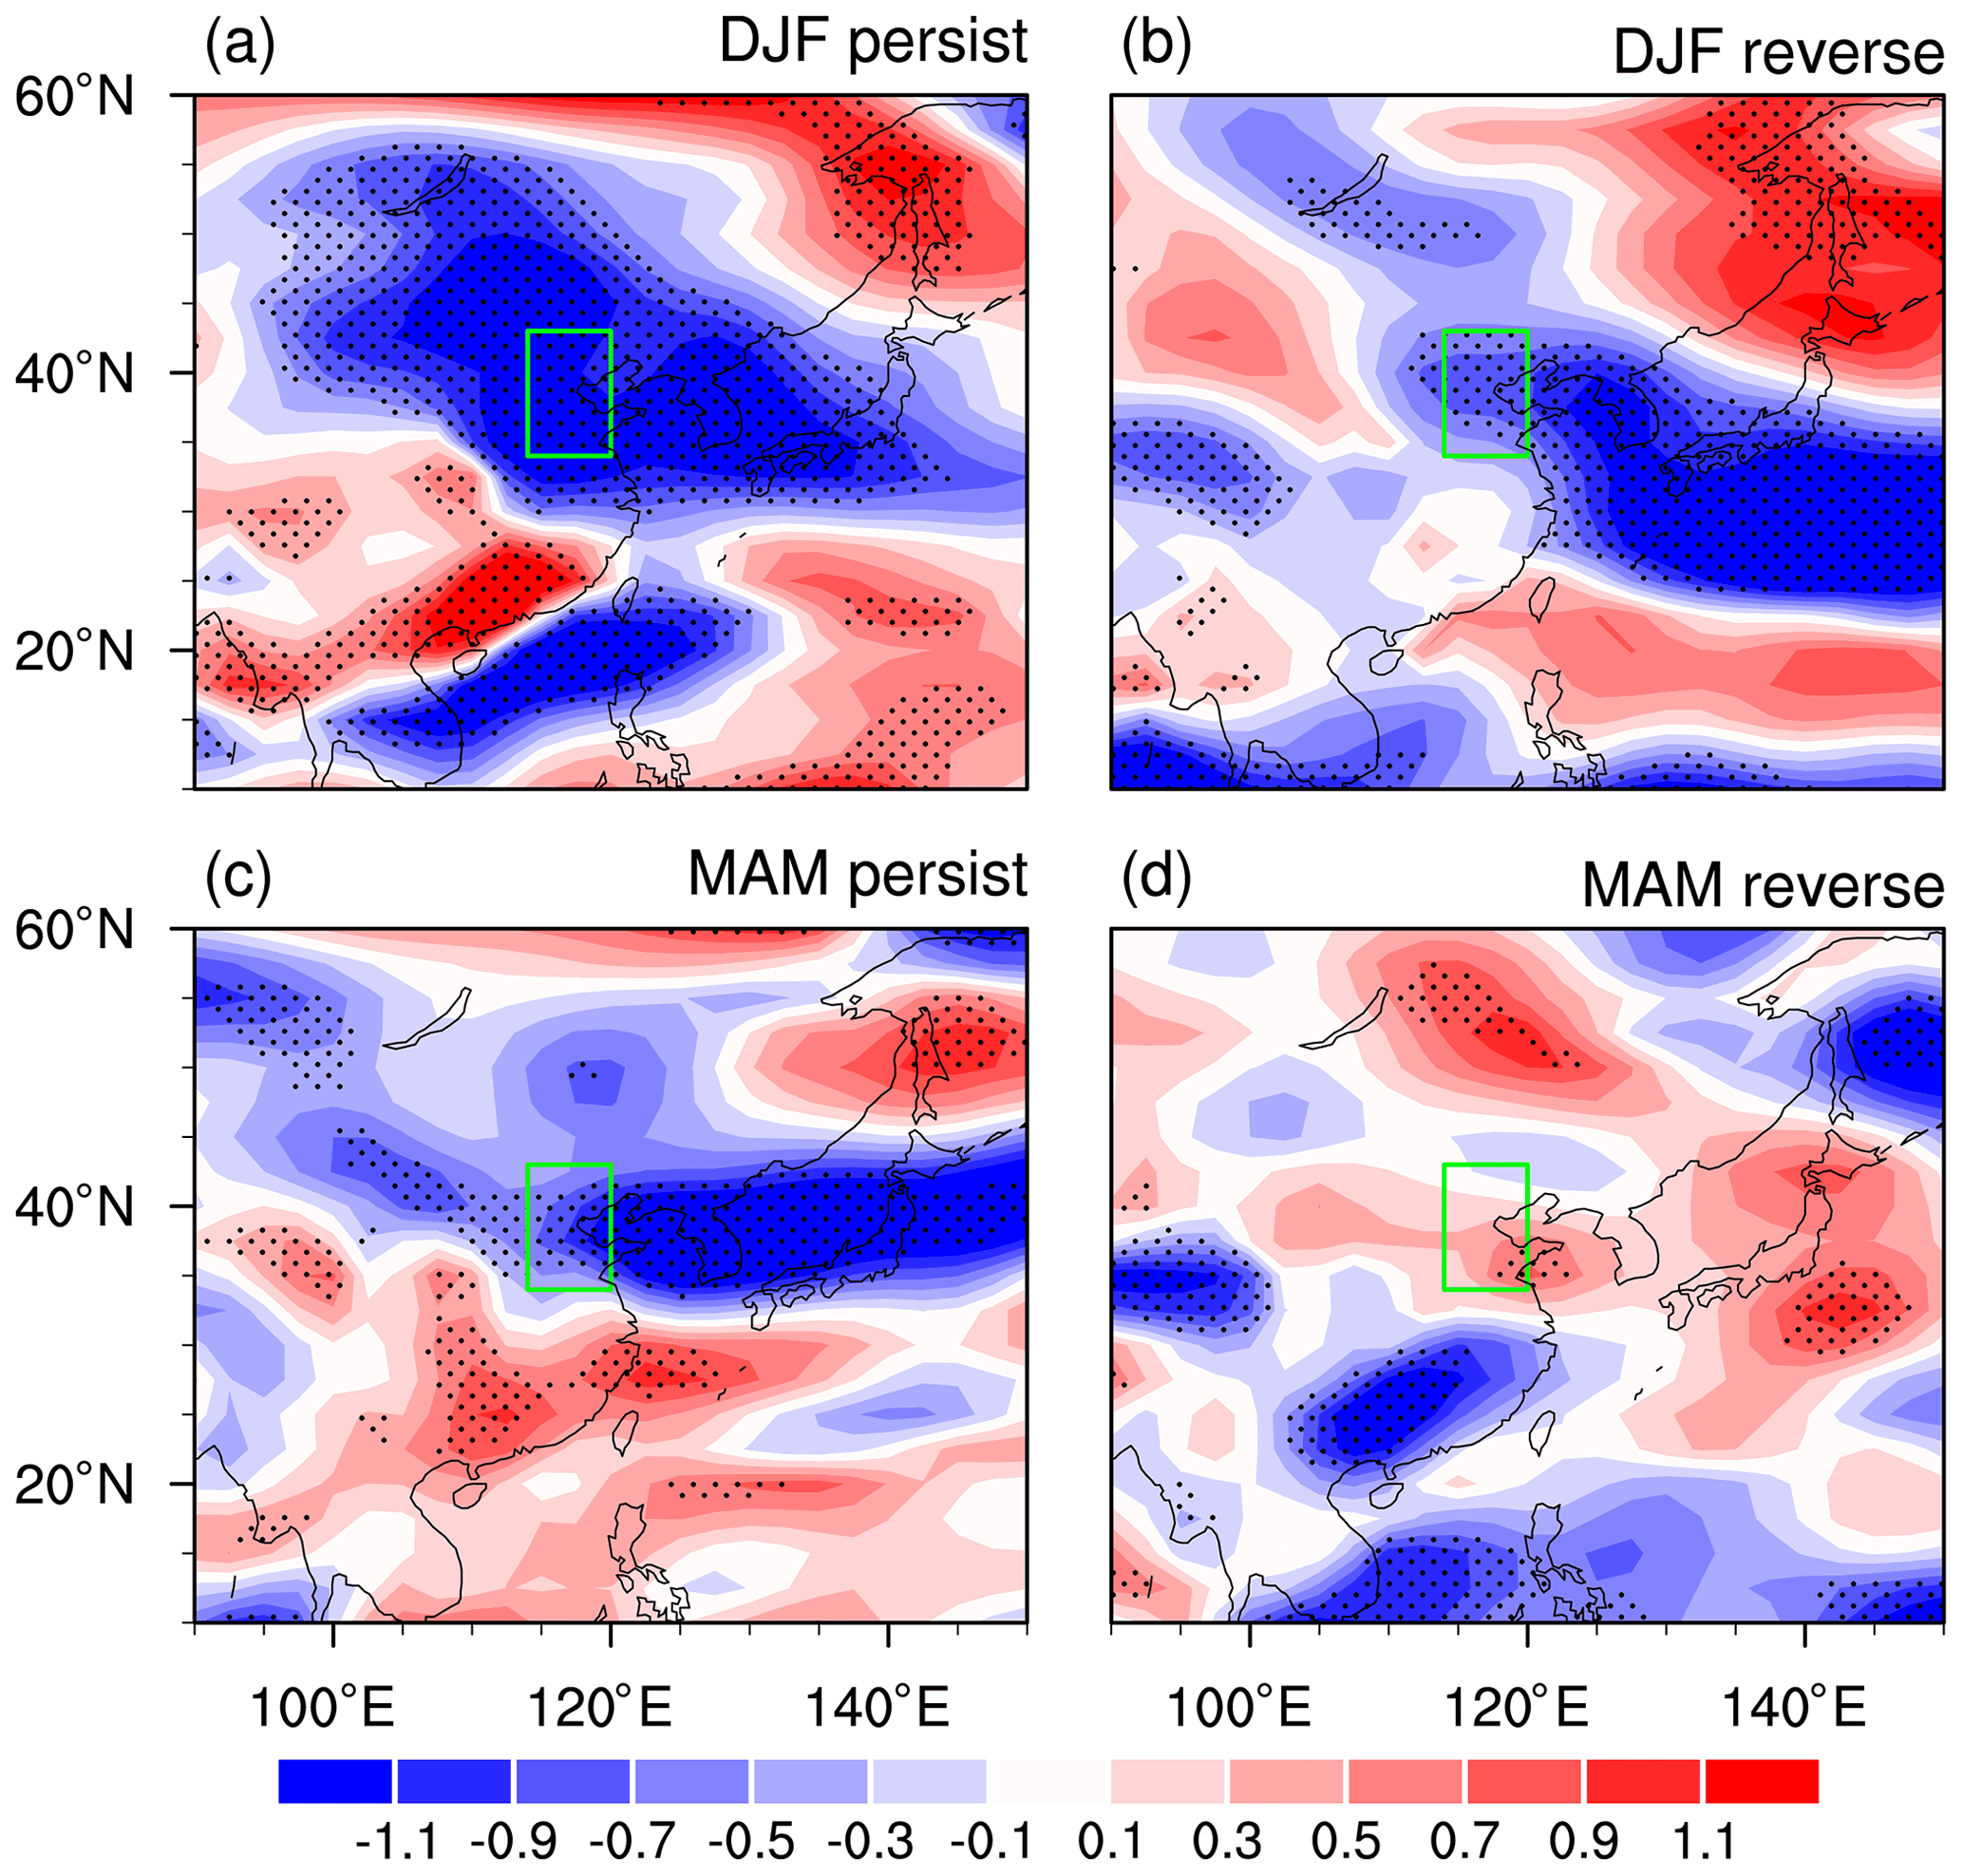
Figure 5Composite anomalies of 850 hPa wind speed (unit m s−1) in (a, b) winter and (c, d) spring in the (a, c) persistent years and the (b, d) reverse years. Stippled regions indicate anomalies that are statistically significant at the 5 % level.
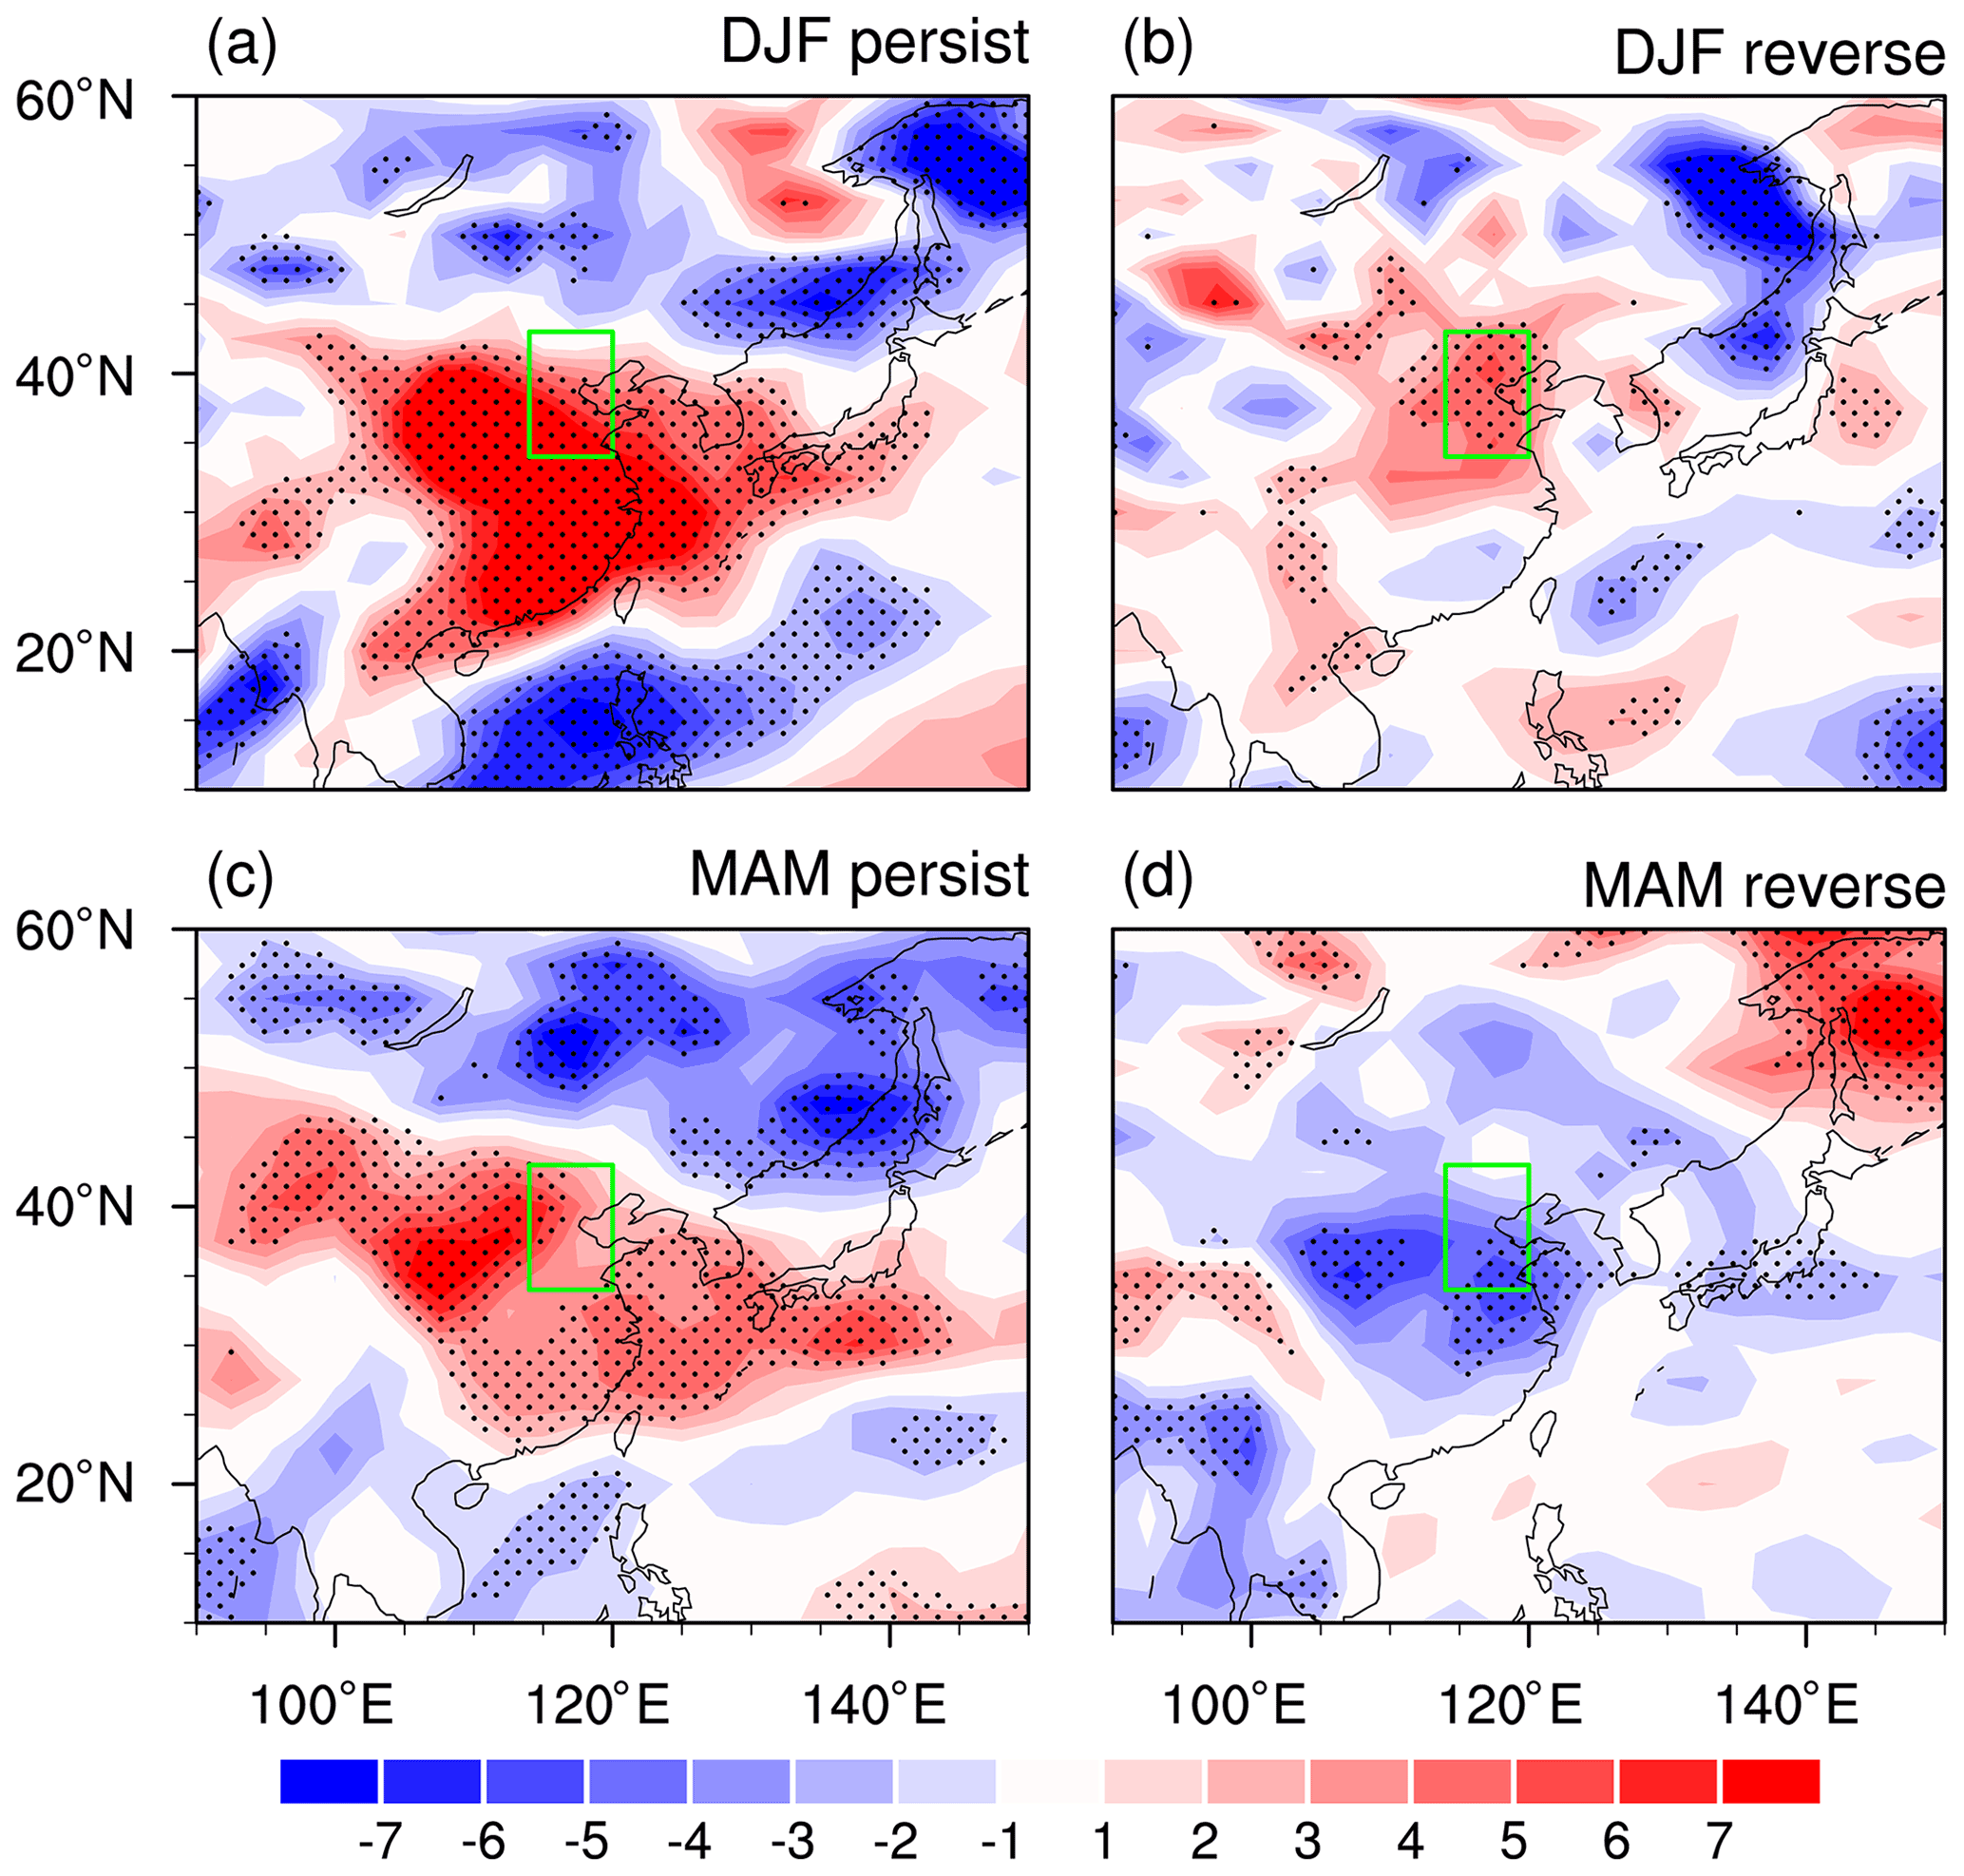
Figure 6Composite anomalies of 850 hPa relative humidity (unit %) in (a, b) winter and (c, d) spring in the (a, c) persistent years and the (b, d) reverse years. Stippled regions indicate anomalies that are statistically significant at the 5 % level.

Figure 7Composite anomalies of boundary layer height (BLH, unit m) in (a, b) winter and (c, d) spring in the (a, c) persistent years and the (b, d) reverse years. Stippled regions indicate anomalies that are statistically significant at the 5 % level.
Atmospheric anomalies over northeast Asia related to interannual variations in haze pollution over the NCPR are closely associated with an upstream atmospheric wave train over the North Atlantic and middle–high latitudes of Eurasia. Studies have demonstrated that atmospheric wave trains that originated from the North Atlantic across Eurasia to East Asia make a strong contribution to interannual variations in haze pollution and climate anomalies over North China (Yin and Wang, 2016, 2017; Zhao et al., 2019; Chen et al., 2019, 2020). Composite anomalies of geopotential height at 500 hPa over larger areas in winter and the succedent spring for the persistent and reverse years are presented in Fig. 8. To examine the possible sources of the atmospheric wave trains over Eurasia, we also present the wave activity fluxes in Fig. 8, which describe propagation directions of the atmospheric Rossby waves. Spatial structures of the geopotential height anomalies at 850 and 200 hPa (not shown) are highly similar to those at 500 hPa in Fig. 8, indicating a vertically barotropic structure of the atmospheric anomalies over middle–high latitudes of the North Atlantic and Eurasia.
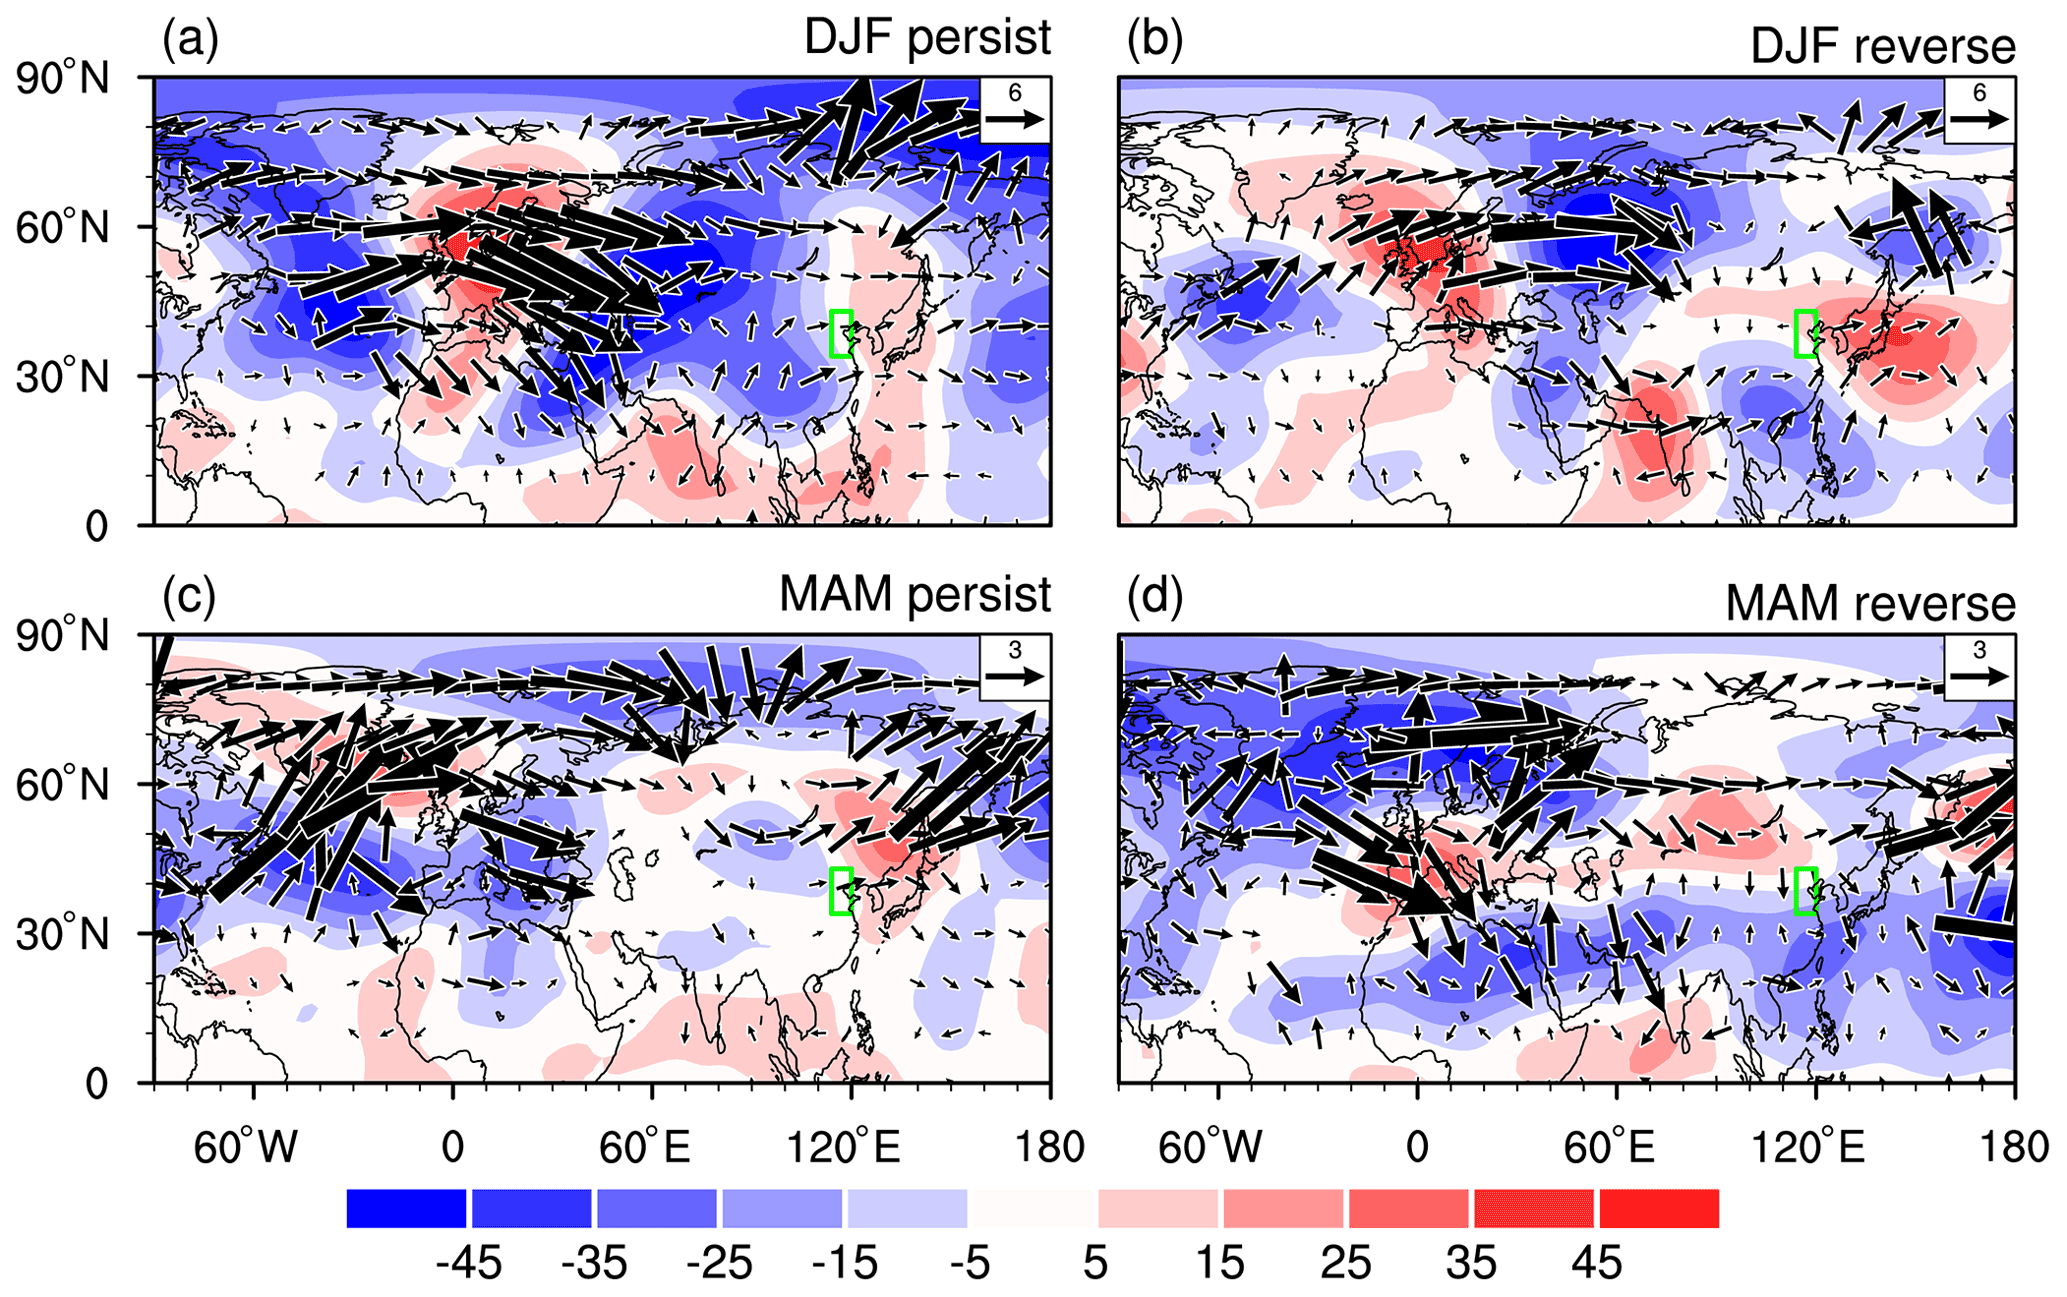
Figure 8Composite anomalies of 500 hPa geopotential height (shading, unit m) and wave activity fluxes (vectors, unit m2 s−2) in (a, b) winter and (c, d) spring in the (a, c) persistent years and the (b, d) reverse years.
In the persistent years, an EAWR-like teleconnection pattern is obviously observed extending from the North Atlantic across Europe to East Asia, with negative geopotential height anomalies (corresponding to cyclonic anomalies) over middle–high latitudes of the North Atlantic and central Eurasia and positive geopotential height anomalies (corresponding to anticyclonic anomalies) over western Europe and northeast Asia (Fig. 8a). The pattern correlation coefficient between the EAWR-related 500 hPa geopotential height anomalies and those in Fig. 8a over the North Atlantic and Eurasian regions (i.e., 20–90∘ N and 70∘ W–130∘ E) reaches 0.65, significant at the 99.9 % confidence level. Hence, in the persistent years, the EAWR teleconnection contributes largely to the formation of the anticyclonic anomaly over northeast Asia in winter. In the reverse years, the spatial structure of the 500 hPa geopotential height anomalies over middle–high latitudes of the North Atlantic and Eurasia (Fig. 8b) bears a close resemblance to that of the persistent years (Fig. 8a) and also resembles the EAWR teleconnection pattern. We have also calculated the pattern correlation coefficient between the 500 hPa geopotential height anomalies in Fig. 8b and those related to the winter EAWR over the same region of 20–90∘ N and 70∘ W–130∘ E. The pattern correlation coefficient is as high as 0.85, slightly higher than that in the persistent years (r=0.65), suggesting that the EAWR teleconnection pattern also makes a strong contribution to the formation of the wintertime anticyclonic anomaly over northeast Asia and haze pollution over the NCPR in the reverse years. The above results are consistent with Yin and Wang (2017) and Chen et al. (2020). Yin and Wang (2017) demonstrated that the EAWR teleconnection is the most important atmospheric wave train modulating haze pollution over North China. Chen et al. (2020) reported that the winter EAWR teleconnection has a stable and strong impact on the interannual variation in haze pollution over the NCPR via calculating the running correlation coefficients between the winter EAWR index and NDI. Note that there exist several differences in the spatial structure of the wintertime EAWR teleconnection between the persistent and reverse years (Fig. 8a and b). In particular, the center of negative geopotential height anomalies over central Eurasia in the persistent years (Fig. 8a) is stronger and shifts southward compared to that in the reverse years (Fig. 8b). In addition, negative geopotential height anomalies over the western North Atlantic extend more southwestward for the reverse years (Fig. 8a and b). Differences in the spatial structure of the winter EAWR between the persistent and reverse years may be partly due to differences in the background mean circulation (Chen et al., 2015; Wang et al., 2019). Detailed investigation of the factors for the changes in the spatial pattern of the winter EAWR is out of the scope of this study. Furthermore, it is interesting to note that an atmospheric Rossby wave exists over the subtropical region, propagating along the subtropical jet stream to extend from north Africa across south Asia and then turn northeastward to northeast Asia in the reverse years (Fig. 8b). This subtropical wave train also makes a contribution to the formation of the anticyclonic anomaly over northeast Asia and interannual variation in haze pollution over the NCPR as has been indicated by Chen et al. (2020).
In spring, a negative NAO-like pattern appears over the North Atlantic in the persistent years, featuring negative geopotential height anomalies around 40–50∘ N and positive anomalies over 60–70∘ N in the persistent years (Fig. 8c). The pattern correlation coefficient between the spring NAO-related 500 hPa geopotential height anomalies and the composited 500 hPa geopotential height anomalies in Fig. 6c over the North Atlantic region (30–80∘ N and 20–60∘ W) is as high as −0.75. This result is consistent with Chen et al. (2019), which indicates that the negative (positive) phase of the spring NAO contributes to the formation of an anomalous anticyclone (cyclone) over northeast Asia and leads to more (less) serious haze pollution over the NCPR via an eastward-propagating wave train. However, in the reverse years, there exists a positive NAO-like pattern over the North Atlantic (Fig. 8d), which is in sharp contrast to that in the persistent years (Fig. 8c). In particular, the pattern correlation between the 500 hPa geopotential height anomalies in Fig. 8c and spring NAO-related anomalies over 30–80∘ N and 20–60∘ W reaches 0.6. As indicated by Chen et al. (2019), the positive spring NAO would contribute to a below-normal DECC over the NCPR.
The distinct evolutions of the average NCPR DECC, surface wind speed, relative humidity, the winter EAWR index, and the spring NAO index are summarized in Fig. 9. In winter, the positive phase of the EAWR teleconnection contributes to anticyclonic anomalies over northeast Asia and associated southerly wind anomalies over the NCPR, which further lead to positive DECC anomalies in both the persistent and the reverse years via reducing surface wind speed and BLH and increasing relative humidity (Fig. 9a). In spring, the negative (positive) phase of the spring NAO contributes to the formation of the anomalous anticyclone (cyclone) over northeast Asia and results in positive (negative) DECC anomalies over the NCPR via increasing (decreasing) relative humidity and decreasing (increasing) surface wind speed and BLH in the persistent (reverse) years (Fig. 9b). The above evidence strongly indicates that different evolutions of atmospheric anomalies over the North Atlantic and middle–high-latitude Eurasia play a crucial role in the distinct evolutions of the haze pollution over the NCPR.
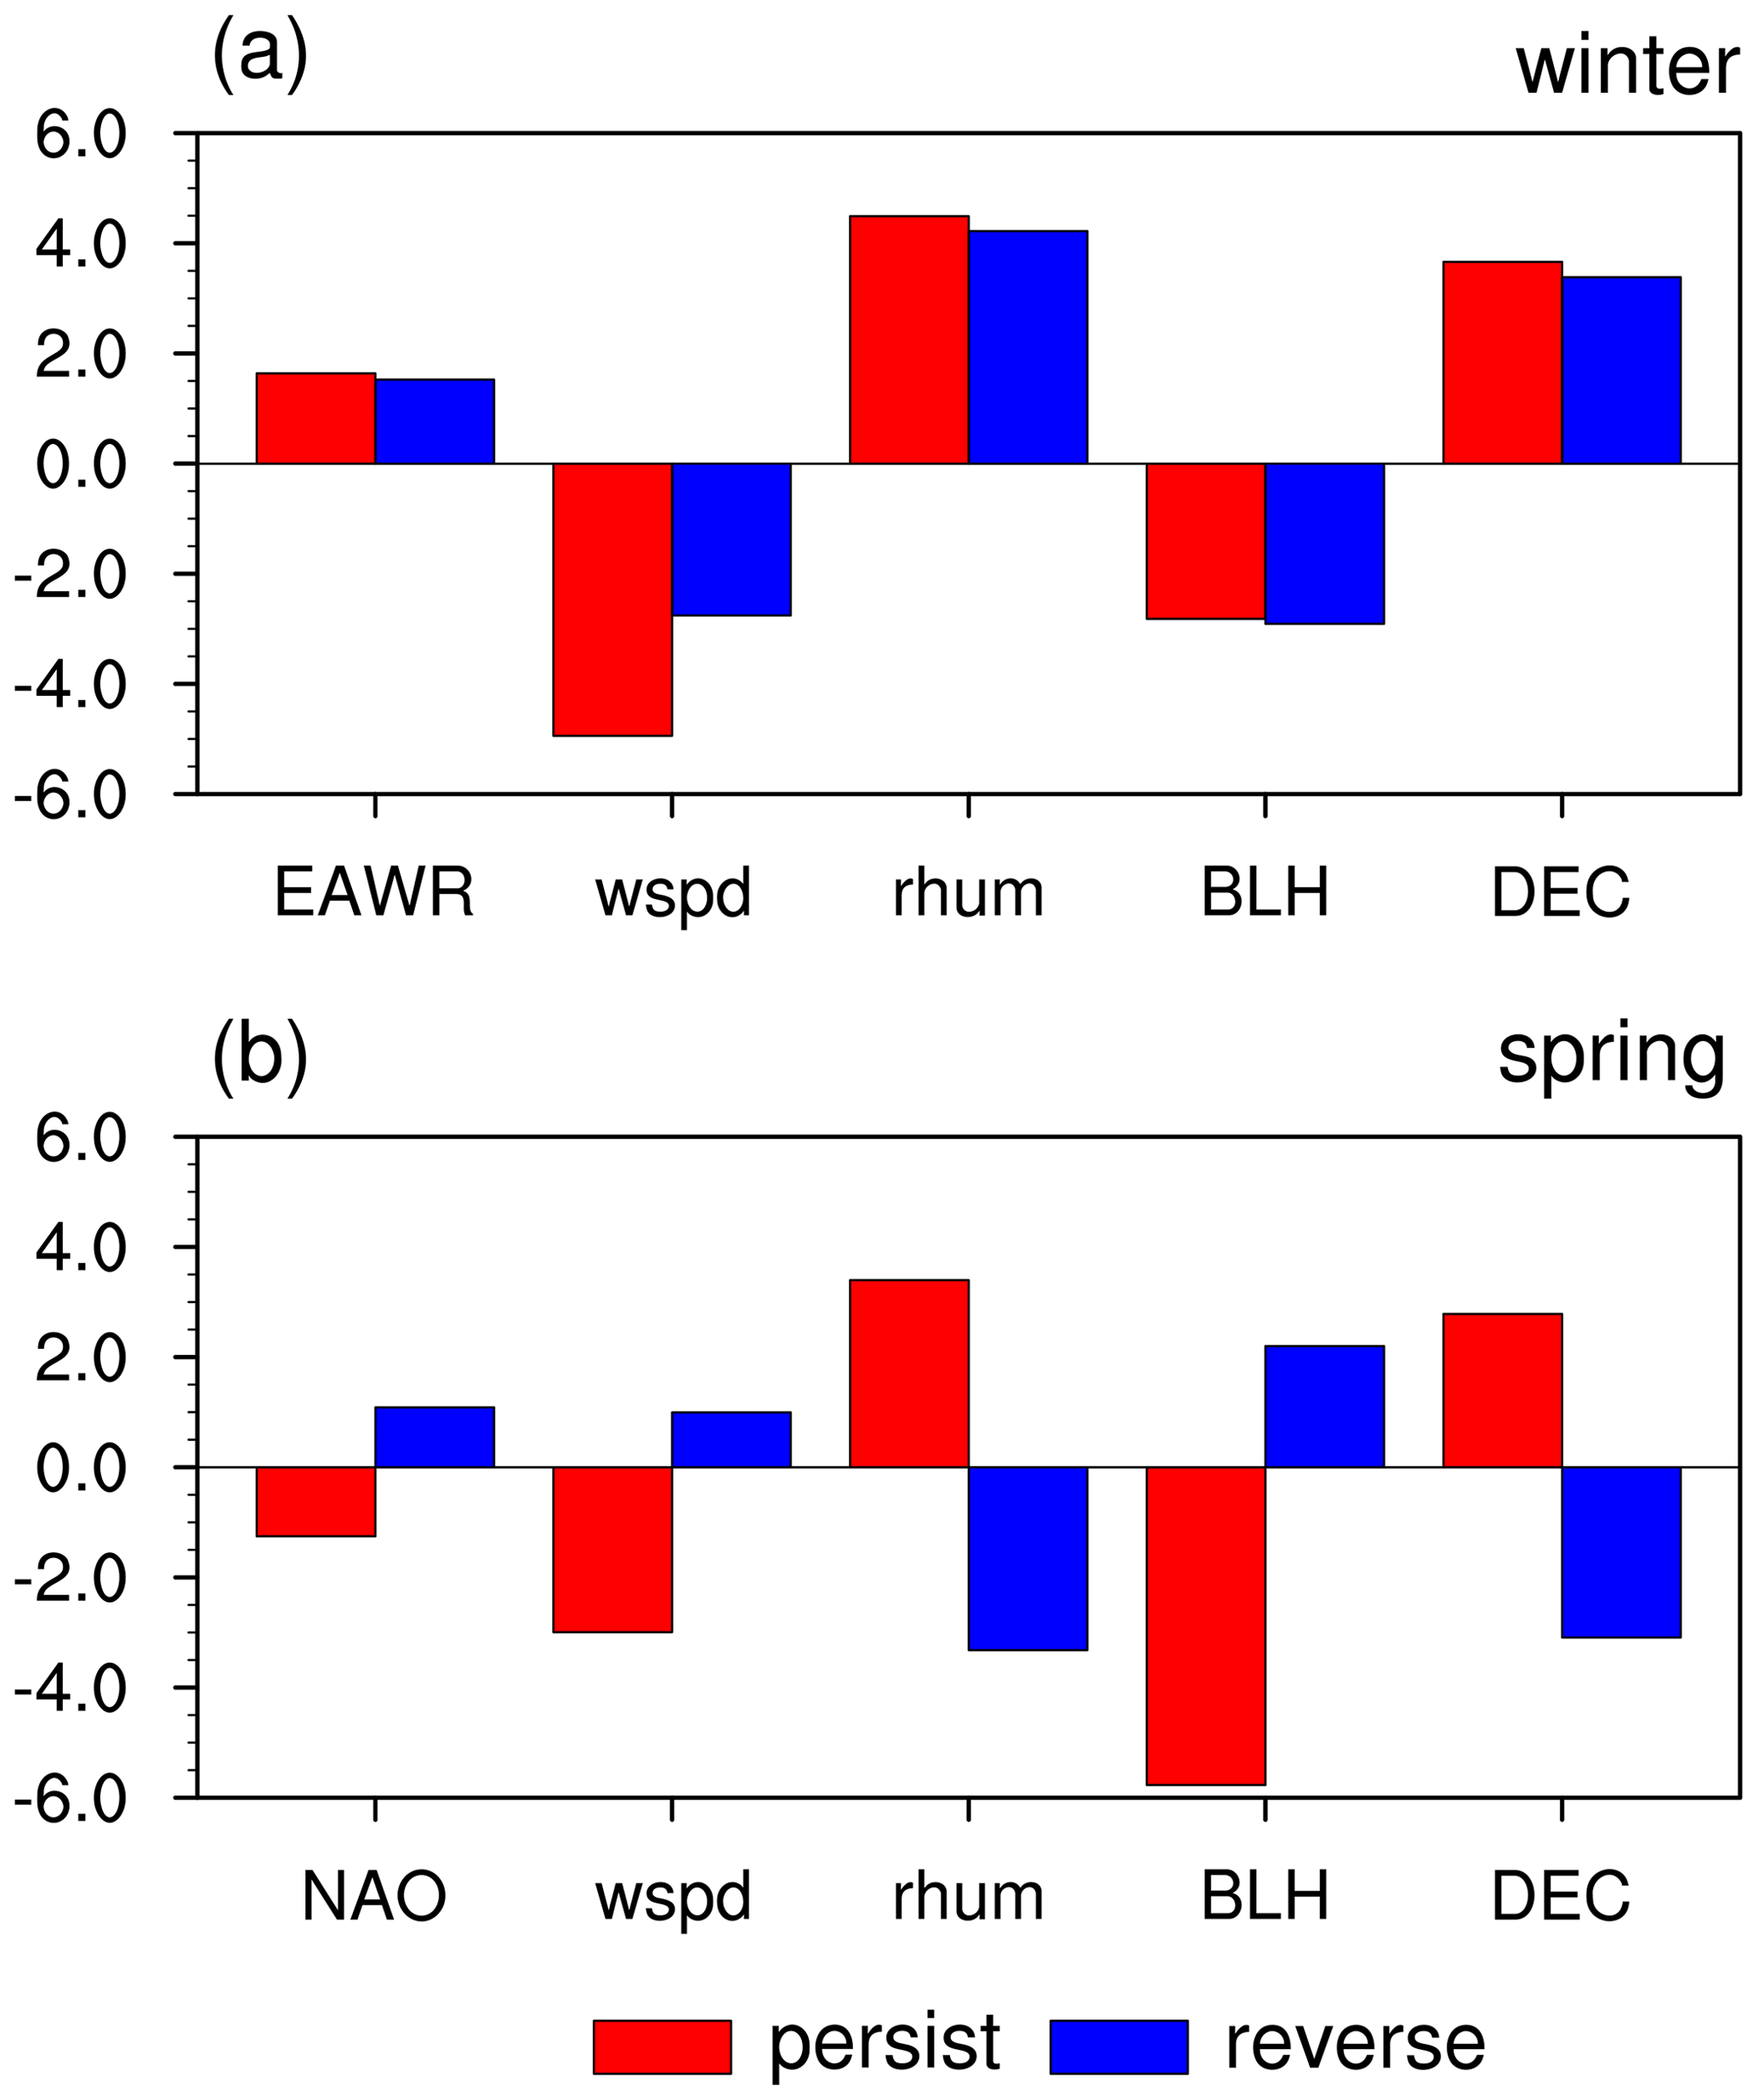
Figure 9(a) Composite anomalies of the EAWR index, wind speed (“wspd”) at 850 hPa (4−1 m s−1), relative humidity (“rhum”) at 850 hPa (%), BLH (101 m), and DECC (“DEC”) (10−2 km−1) averaged over the NCPR in winter for the persistent years (red bars) and the reverse years (blue bars). (b) Composite anomalies of the NAO index, wind speed at 850 hPa (m s−1), relative humidity at 850 hPa (%), BLH (101 m), and DECC (km−1) averaged over the NCPR in spring for the persistent years (red bars) and the reverse years (blue bars).
What is the possible mechanism for the different evolutions of atmospheric anomalies over the North Atlantic and Eurasia? Considering that the internal atmospheric process could not explain the connection of the atmospheric anomalies between two seasons, the evolution of atmospheric anomalies over the North Atlantic may be related to the underlying SSTAs. Previous studies have demonstrated that the North Atlantic is a region with strong air–sea interaction (Czaja et al., 2002; Czaja and Frankignoul, 2002; Huang and Shukla, 2005; Pan, 2005; Peng et al., 2003; Wu et al., 2009; Chen et al., 2016, 2019). On one hand, atmospheric anomalies over the North Atlantic could lead to SSTAs via modulating surface heat fluxes (Czaja et al., 2002; Huang and Shukla, 2005; Wu et al., 2009; Chen et al., 2015). The connection between the atmospheric anomalies and SSTAs over the North Atlantic is the closest when atmospheric anomalies lead SSTAs by about 1 month (Czaja and Frankignoul, 2002; Huang and Shukla, 2005). On the other hand, SSTAs in the North Atlantic have a strong feedback on the overlying atmospheric circulation via the heating-induced atmospheric Rossby wave response and the interaction between low-frequency mean flow and synoptic-scale eddies (Peng et al., 2003; Pan, 2005; Czaja and Frankignoul, 2002; Chen et al., 2020). In particular, a number of studies have suggested that the development and evolution of atmospheric anomalies and SSTAs over the North Atlantic can be attributed to the positive air–sea interaction process there (Czaja and Frankignoul, 1999; Rodwell and Folland, 2002; Visbeck et al., 2003; Czaja et al., 2003; Wu and Liu, 2005; Hu and Huang, 2006; Chen et al., 2019, 2020).
Evolutions of SSTAs in the North Atlantic are examined in Fig. 10. In the persistent years, significant cold SSTAs are seen in the central North Atlantic around 30∘ N and off the east coast of Canada, together with notable warm SSTAs in the subtropical eastern North Atlantic with a northeastward extension to the west coast of Europe (Fig. 10a). The warm SSTAs in the subtropical northeastern Pacific and the cold SSTAs in the central North Atlantic are maintained to the following spring with an increase in the amplitude. In addition, the high-latitude North Atlantic is covered by warm SSTAs in spring. This forms a significant tripolar SSTA pattern in spring. Note that the tripolar SSTA pattern is also the first EOF mode of interannual variation in SSTAs in the North Atlantic (not shown) (Chen et al., 2016, 2020). Studies have demonstrated that warm (cold) SSTAs in the tropical and subtropical North Atlantic related to the tripolar SST anomaly pattern could induce a negative NAO-like pattern via the Rossby wave type atmospheric response and wave–mean flow interaction process according to observational analysis and numerical experiments (Peng et al., 2003; Pan, 2005; Czaja and Frankignoul, 2002; Chen et al., 2016, 2020).
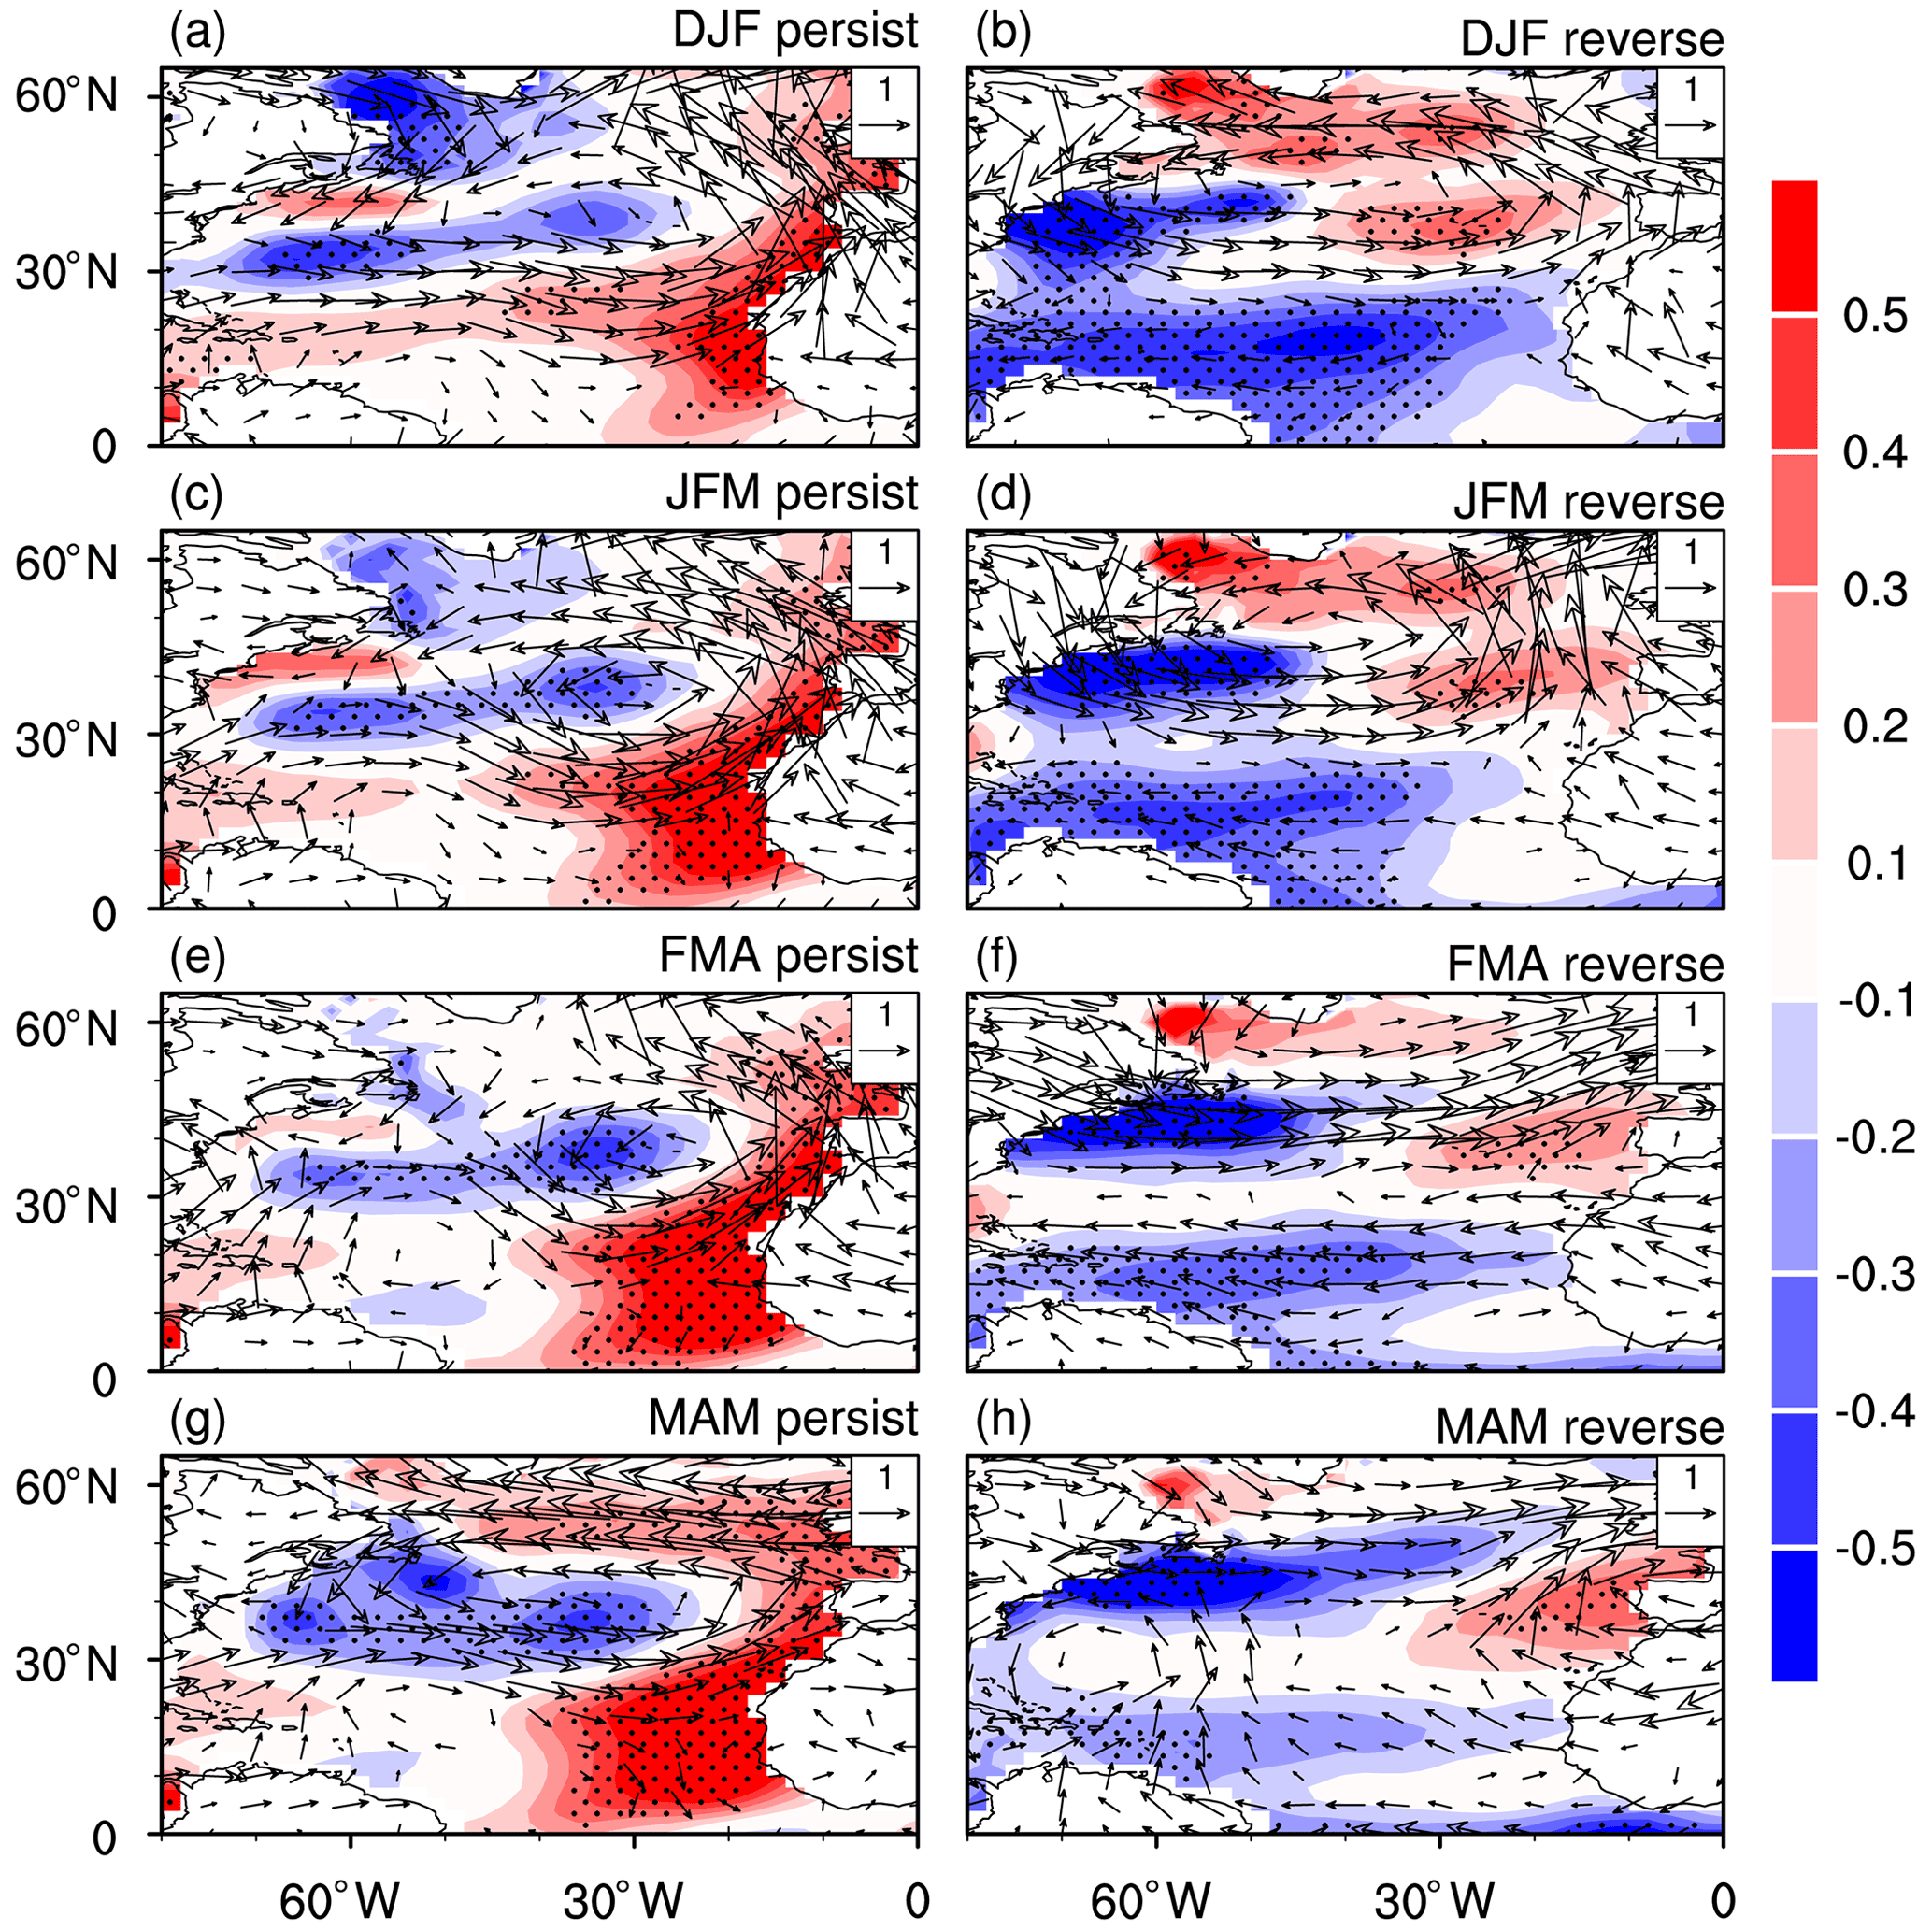
Figure 10Composite anomalies of SST (∘C) and 850 hPa winds (m s−1) in (a, b) DJF, (c, d) JFM, (e, f) FMA, and (g, h) MAM for (left column) the persistent years and (right column) the reverse years. Stippled regions in the figure indicate SST anomalies that are statistically significant at the 5 % level.
In the reverse years, significant cold SSTAs are seen in the tropical and subtropical western North Atlantic in winter (Fig. 10b), which can persist to the following spring with a decrease in the amplitude (Fig. 10h) and are in sharp contrast to those in the persistent years (Fig. 10a, c, e, and g). It is reasonable to speculate that the opposite SSTAs in the tropical and subtropical North Atlantic may be responsible for the opposite atmospheric anomalies over the North Atlantic, which will be confirmed later based on the linear barotropic model.
Evolutions of SSTAs in the North Atlantic from winter to the following spring are related to the air–sea interaction. Figure 11 shows composite anomalies of the surface net heat fluxes for the persistent and reverse years. Values of the surface heat fluxes have been taken to be positive (negative) when their directions are downward (upward) and contribute to warm (cold) SSTAs. We have also examined composite anomalies of the SST tendency (not shown). It shows that spatial patterns of anomalies of the SST tendency in most parts of the North Atlantic are similar to those of the surface net heat flux anomalies. This suggests that changes in the surface net heat fluxes can largely explain evolutions of SSTAs in the North Atlantic from winter to the following spring. For example, in the persistent years, significant positive net heat flux anomalies are seen over the subtropical northeastern Atlantic from winter to spring (Fig. 11a, c, e, and g), which could explain the formation and enhancement of the positive SSTAs there (Fig. 11a, c, e, and g). In addition, the negative surface net heat flux anomalies to the east of Canada explain the generation and maintenance of the negative SSTAs there. Moreover, the positive surface net heat flux anomalies over high latitudes contribute to warm SSTAs. In the reverse years, positive net heat flux anomalies appear off the west coast of western Europe (Fig. 11b, d, f, h), which explain the maintenance of the warm SSTAs (Fig. 10b, d, f, h). In addition, positive net surface heat flux anomalies over the subtropical western North Atlantic in February–March–April (FMA) and MAM (Fig. 11f and h) explain the decrease in the amplitude of the negative SSTAs there (Fig. 10f and h).
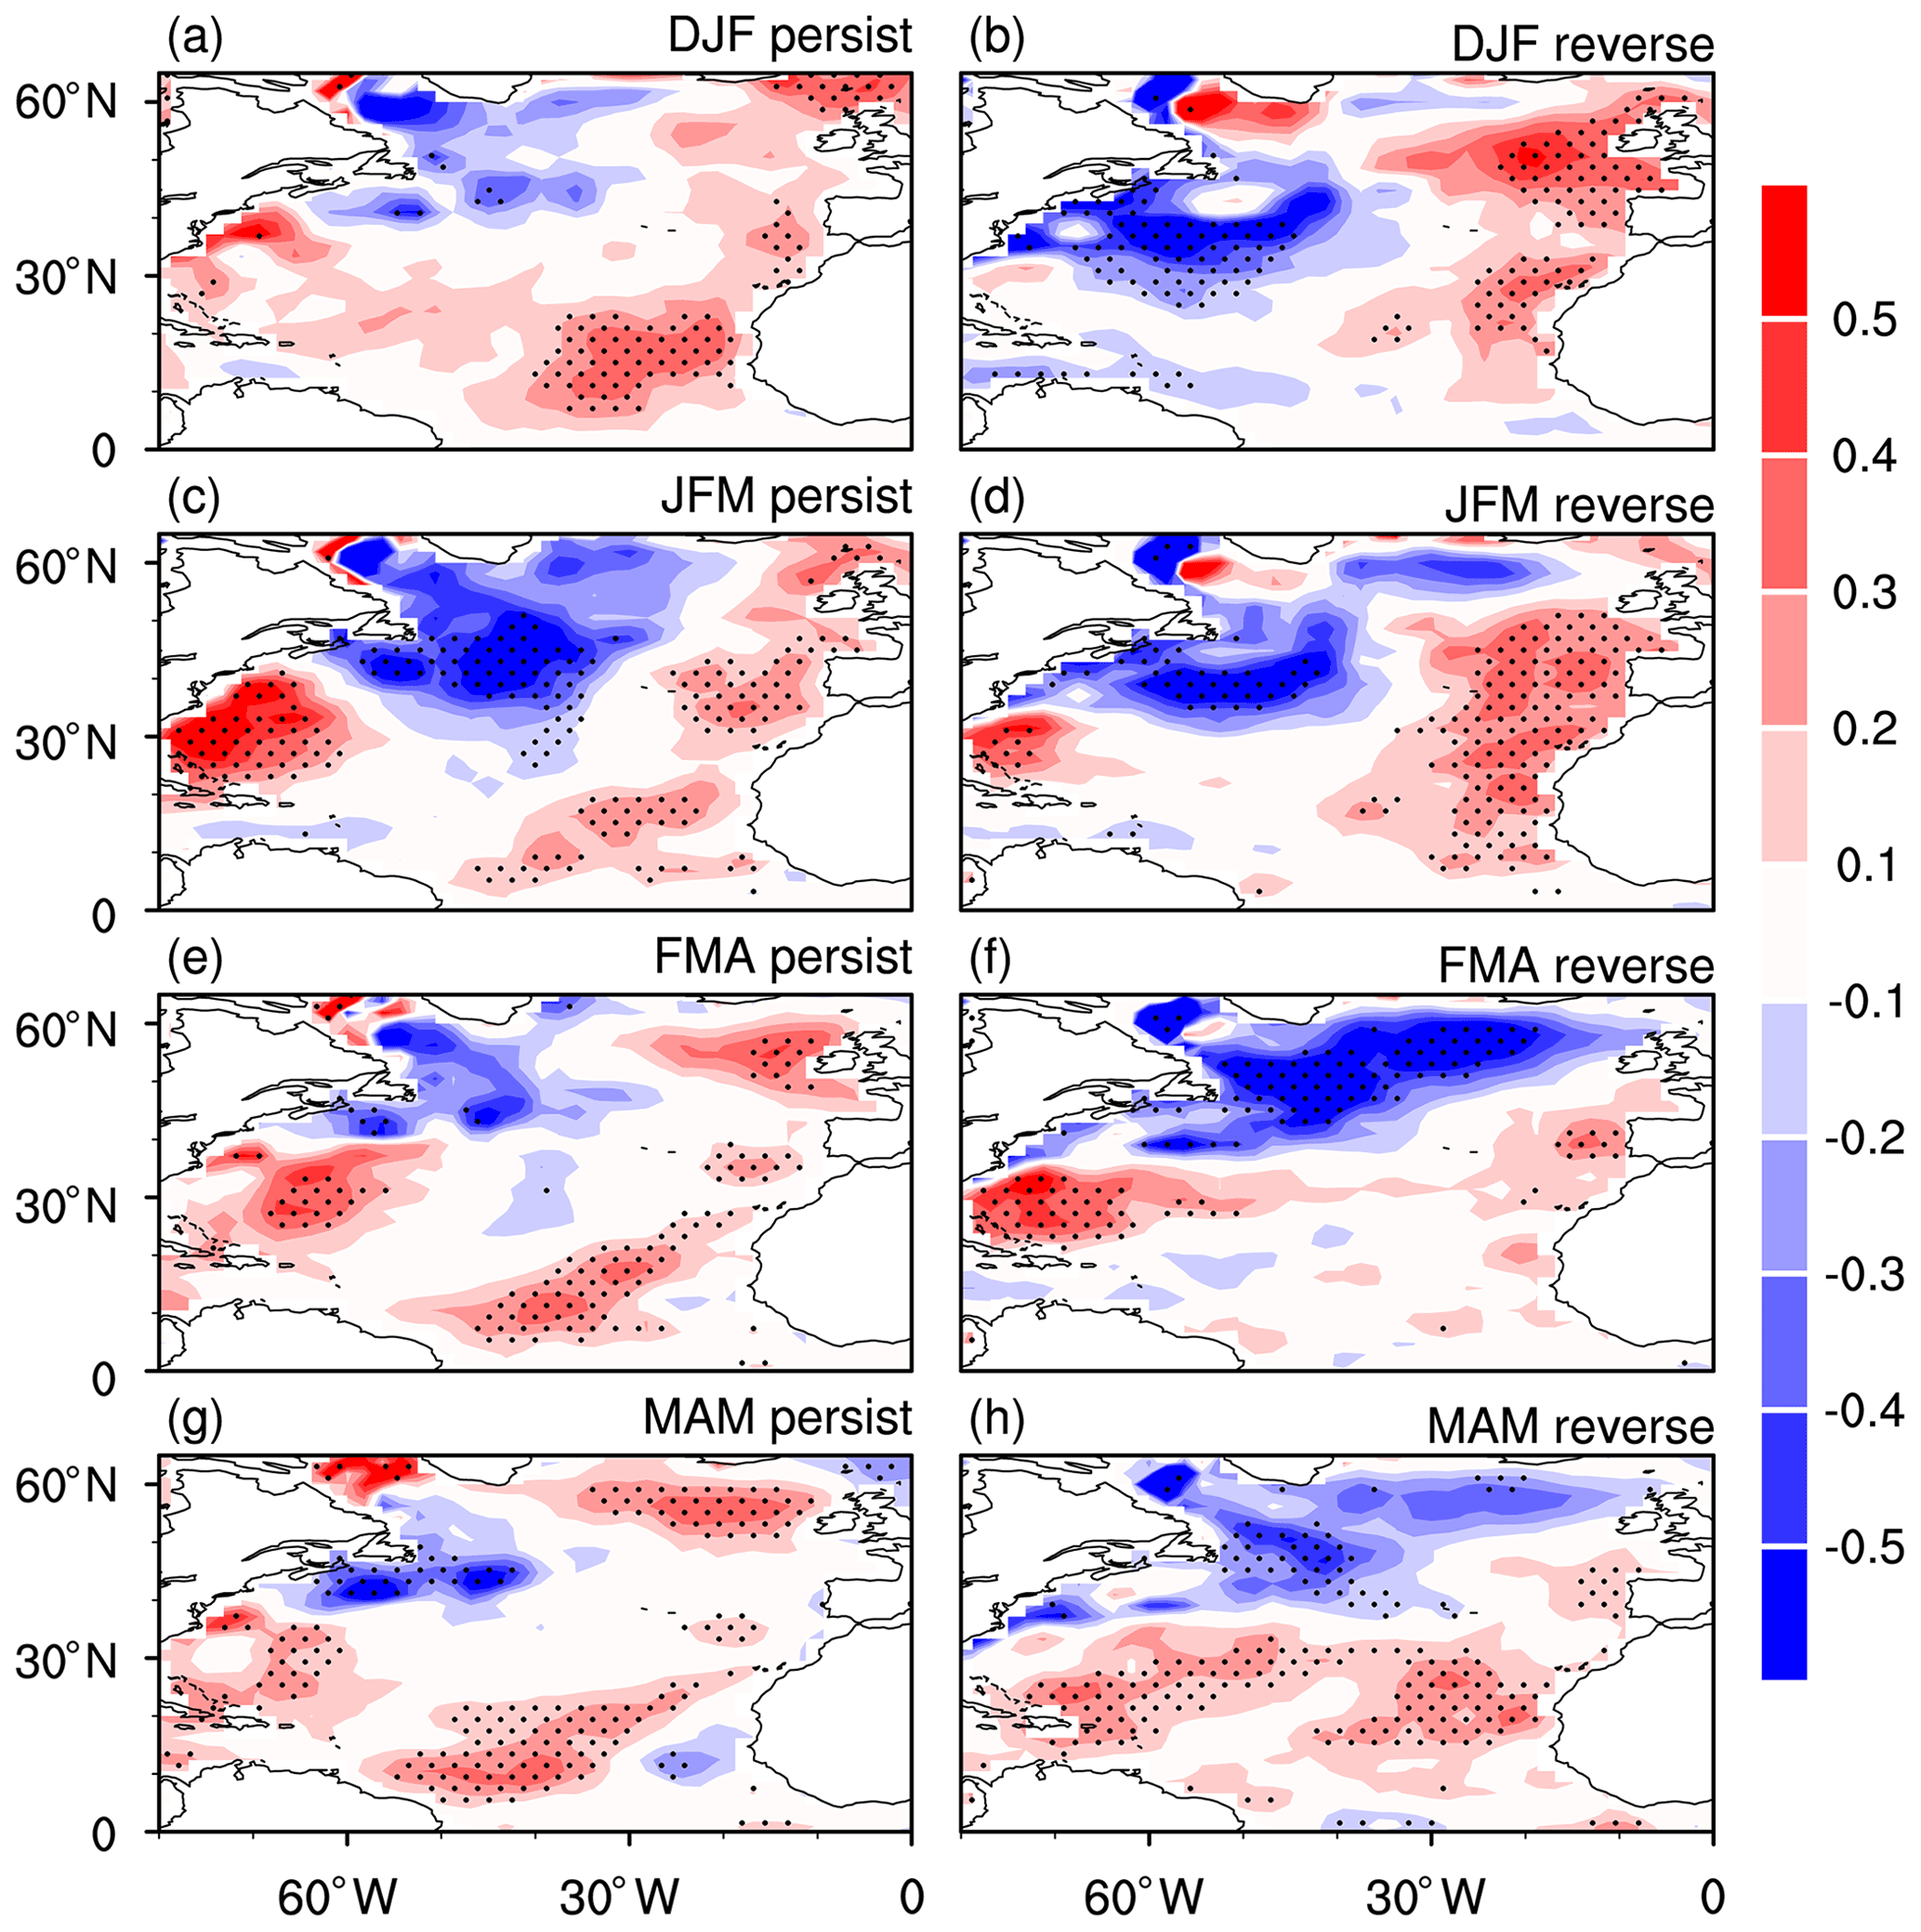
Figure 11Composite anomalies of surface net heat fluxes (W m−2) in (a, b) DJF, (c, d) JFM, (e, f) FMA, and (g, h) MAM for (left column) the persistent years and (right column) the reverse years. Stippled regions in the figure indicate anomalies that are statistically significant at the 5 % level.
Surface net heat flux anomalies are related to the overlying atmospheric circulation changes. Surface heat flux consists of four components, including the surface longwave and shortwave radiation and the surface latent and sensible heat fluxes. We find that surface net heat flux anomalies (Fig. 12) are dominated by changes in the surface latent heat flux (Fig. 12). Amplitudes of the surface sensible heat fluxes and surface longwave and shortwave radiation are much weaker compared to those of the surface latent heat flux and thus are not presented. In the persistent years, the anomalous southwesterly winds over subtropical northeastern Atlantic in winter and spring oppose the climatological northeasterly winds (Fig. 10a and g). This results in a decrease in the total wind speed and decrease in the upward latent heat flux (Fig. 12a and g) and thus contributes to warm SSTAs (Fig. 10a and g). Note that the warm SSTAs in the subtropical northeastern Atlantic could induce an anomalous cyclone to its northwest via a Rossby wave type atmospheric response (Czaja and Frankignoul, 1999, 2002; Huang and Shukla, 2005; Hu and Huang, 2006; Chen et al., 2016, 2020) and help maintain the anomalous cyclone over the mid-latitude North Atlantic from winter to spring (Fig. 10a and g). Similarly, the anomalous easterly winds along 60∘ N over the North Atlantic oppose the climatological westerly winds (Fig. 10a and g), which leads to warm SSTAs there via reduction in wind speed and upward latent heat fluxes (Fig. 12a and g). By contrast, the anomalous northerly winds to the western flank of the cyclonic anomaly bring colder and drier air from higher latitudes (Fig. 10a and g), which increases the upward latent heat flux and contributes to cold SSTAs (Fig. 12a and g). In the reverse years, southerly wind anomalies off the west coast of western Europe carry warmer and wetter air northward from lower latitudes and lead to warm SSTAs (Fig. 10b and h) via reduction in upward latent heat flux (Fig. 12b and h). In winter, northerly wind anomalies over the subtropical western North Atlantic increase the trade wind (Fig. 10b), which results in the enhancement of surface latent heat flux (Fig. 12b) and partly contributes to cold SSTAs (Fig. 10b). The above analyses suggest that the evolution of SSTAs in the North Atlantic from winter to the subsequent spring is closely related to the air–sea interaction over the North Atlantic.
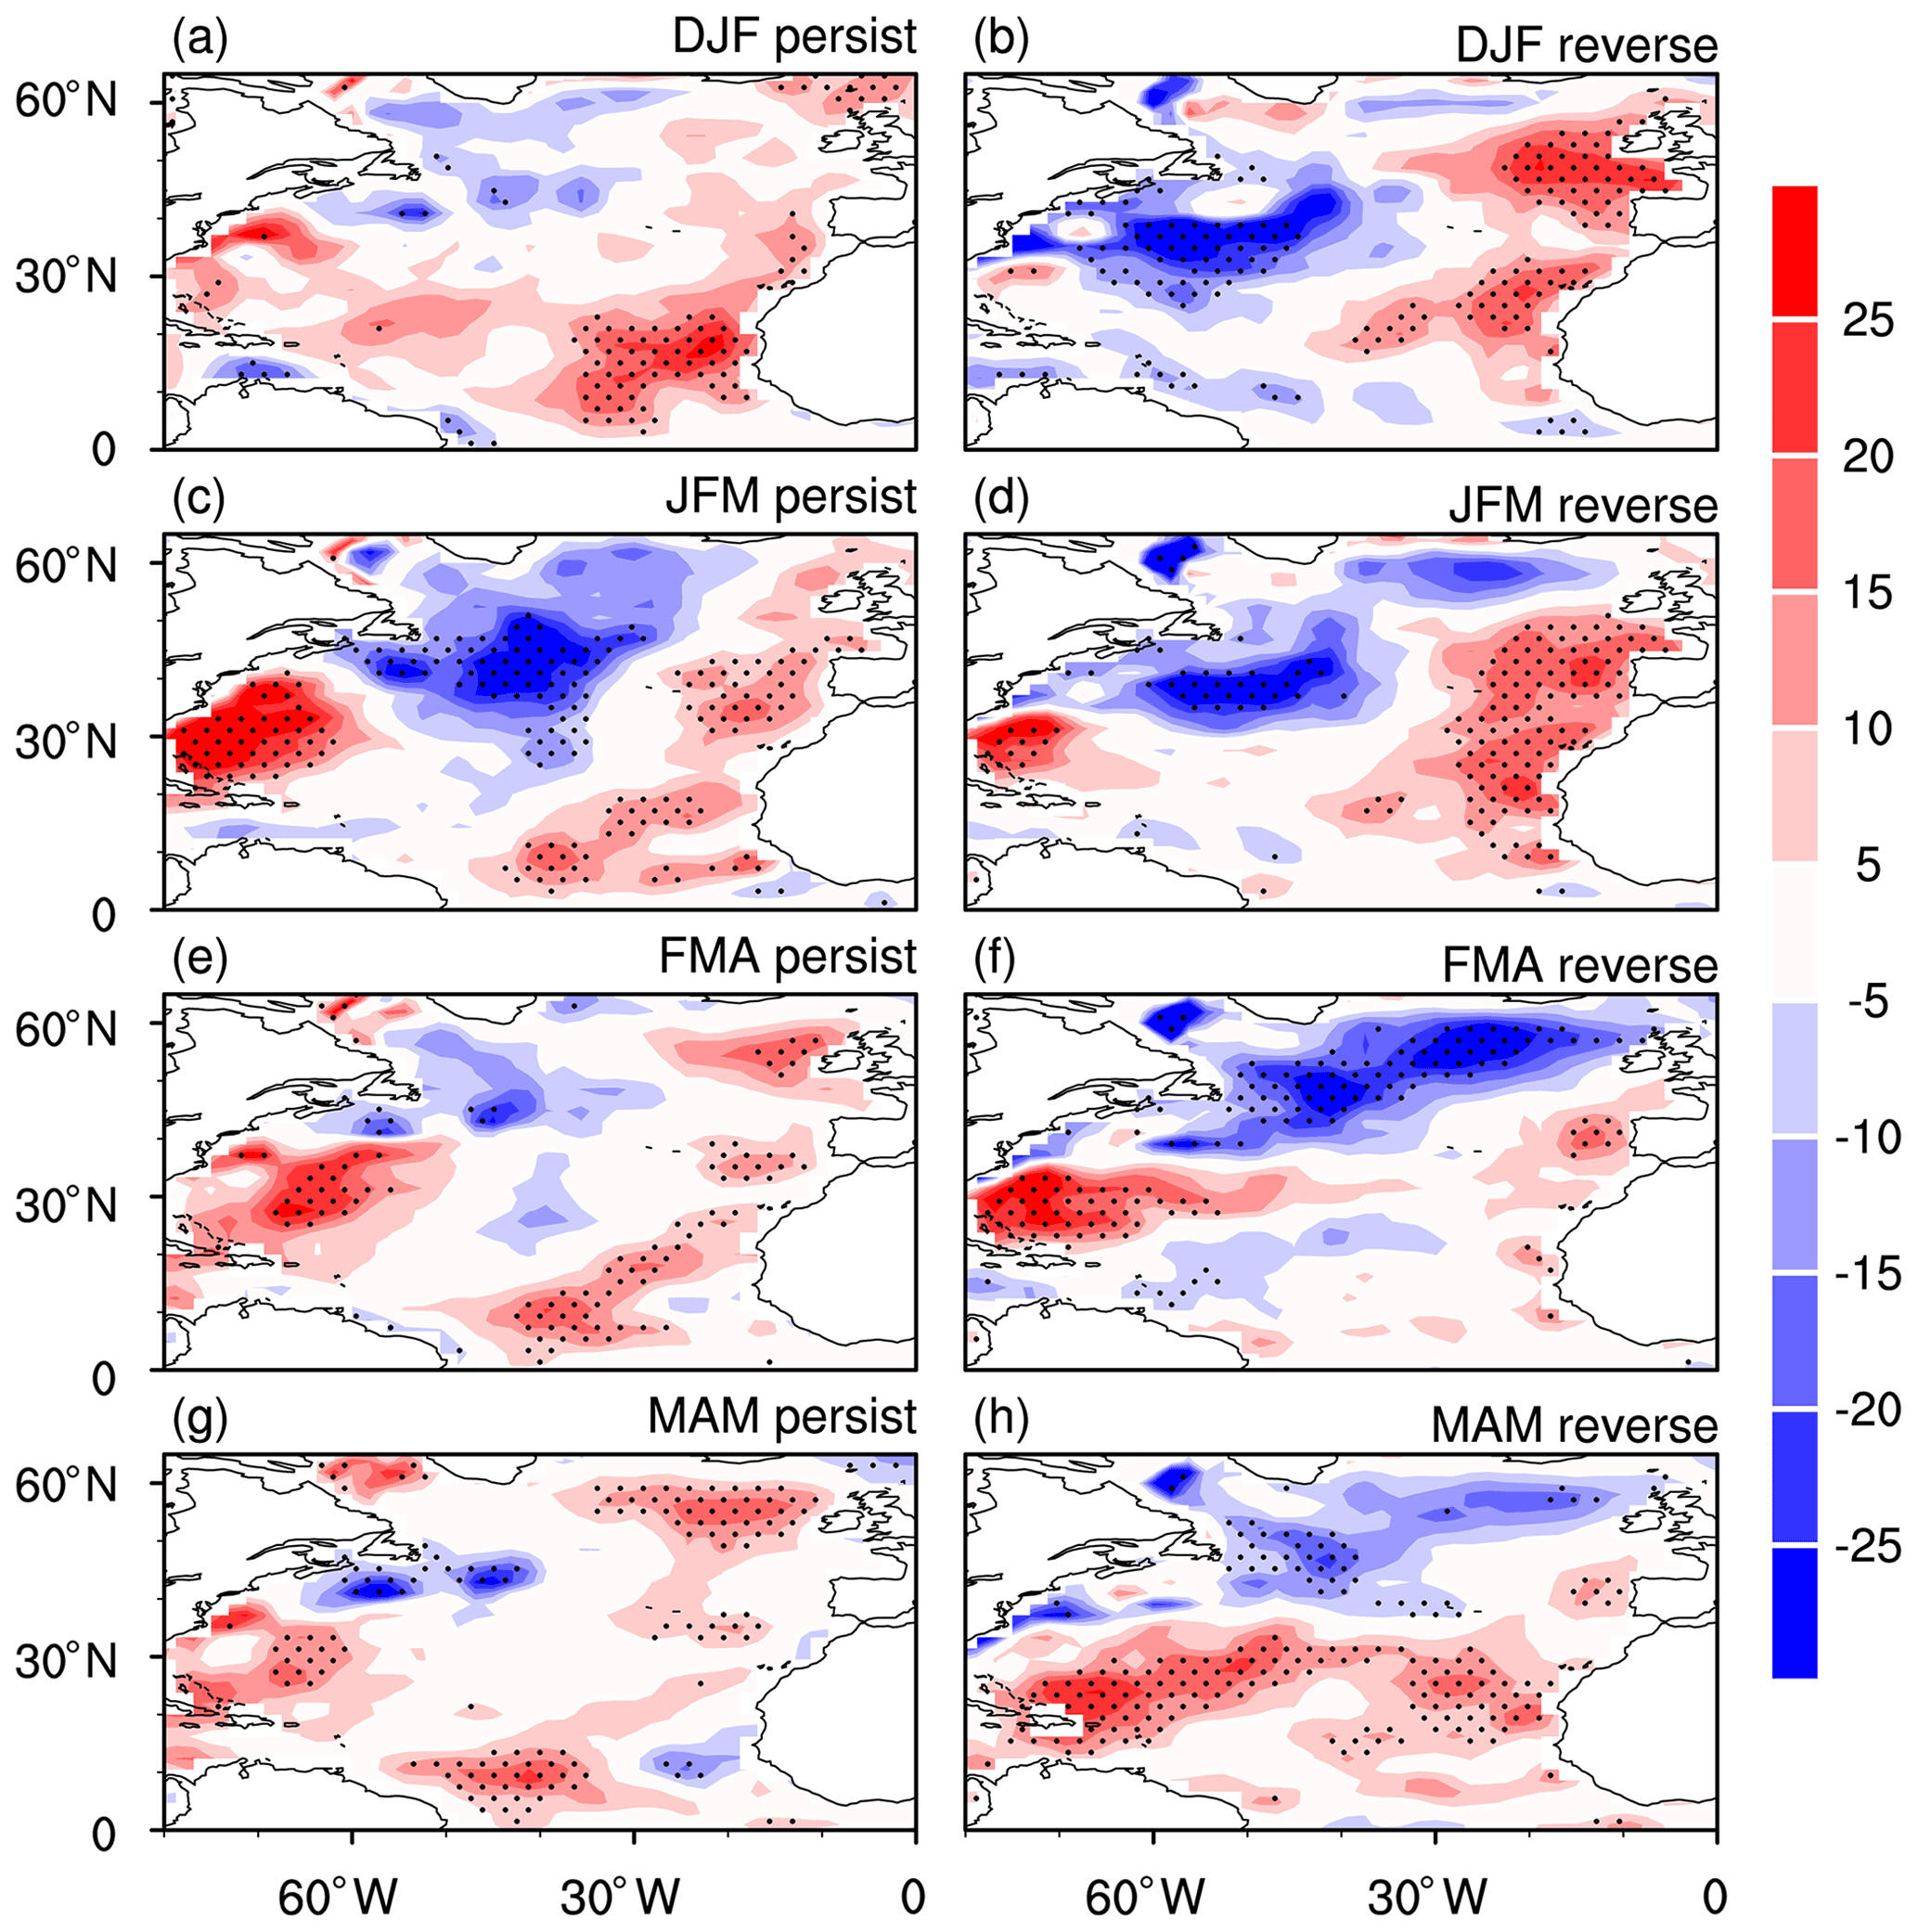
Figure 12Composite anomalies of surface latent heat fluxes (W m−2) in (a, b) DJF, (c, d) JFM, (e, f) FMA, and (g, h) MAM for (left column) the persistent years and (right column) the reverse years. Stippled regions in the figure indicate anomalies that are statistically significant at the 5 % level.
The notable differences in the SSTAs in the tropical and subtropical North Atlantic may explain the different atmospheric anomalies over the North Atlantic and Eurasia between the persistent and reverse years, with a negative (positive) spring NAO-like pattern and anticyclonic (cyclonic) anomaly over northeast Asia in the persistent (reverse) years. Studies have demonstrated that springtime SSTAs in the tropical and subtropical North Atlantic have a strong impact on the atmospheric circulation and associated climate anomalies over the North Atlantic and Eurasia (Wu et al., 2009, 2011; Chen et al., 2016, 2020). In particular, SSTAs in the tropical and subtropical regions could induce strong vertical motion and atmospheric heating anomalies reaching to the upper-level troposphere (Ting, 1996; Wu et al., 2009; Hodson et al., 2010; Wu et al., 2011; Sun et al., 2015; Chen et al., 2020). Then, the divergent/convergent anomalies at the upper-level troposphere induced by the SSTAs could be considered effective sources for the generation of the atmospheric Rossby wave (Watanabe, 2004; Chen and Huang, 2012; Zuo et al., 2013; Chen et al., 2020). Considering that the atmospheric wave trains extending from the North Atlantic to Eurasia in Fig. 6c and d resemble an atmospheric stationary Rossby wave with an equivalent barotropic vertical structure, the mechanism for their formation could be examined based on the barotropic vorticity equation (Wu et al., 2011; Zuo et al., 2013; Chen et al., 2016, 2020; O'Reilly et al., 2018). Hence, in the following, we perform model simulations with a barotropic model (Sardeshmukh and Hoskins, 1988; Watanabe, 2004; O'Reilly et al., 2018) to confirm the possible roles of the spring SSTAs in the North Atlantic in the formation of atmospheric anomalies over the North Atlantic and Eurasia. Studies indicate that the barotropic model has a good performance in capturing the key dynamics of the atmospheric response to the atmospheric heating associated with the SSTAs in the tropical and subtropical regions (Wu et al., 2011; Sun et al., 2015; Zuo et al., 2013; Chen et al., 2016, 2020). Three experiments are performed: the first experiment is forced by the spring climatological mean vorticity (denoted as EXP_Ctrl); the second experiment is forced by the spring climatological mean vorticity plus the given divergent anomalies over the subtropical northeastern Atlantic with a center at 20∘ N, 20∘ W and maximum intensity of according to the spatial pattern of spring SSTAs in Fig. 10g (denoted as EXP_persist); the third experiment is forced by the spring climatological mean vorticity plus the given convergent anomalies over the subtropical northwestern Atlantic with a center at 15∘ N, 60∘ W and maximum intensity of according to the spatial pattern of spring cold SSTAs in the tropical North Atlantic in Fig. 10h (denoted as EXP_reverse). The above three experiments are integrated for 40 d.
Figure 13a displays the difference in atmospheric responses averaged during model days 31–40 between EXP_persist and EXP_Ctrl with green contours representing the prescribed divergent anomalies. In addition, the difference in the responses between EXP_reverse and EXP_Ctrl is exhibited in Fig. 13b. It is noted that the barotropic model experiments can reach equilibrium state quickly within only a few days (Sardeshmukh and Hoskins, 1988; Zuo et al., 2013; Chen et al., 2016). Hence, the atmospheric responses averaged during model days 31–40 are highly similar to those averaged during other model days (not shown) (e.g., 25–35 and 20–40 d). In general, the barotropic model experiments can well reproduce the distinct atmospheric anomalies between the persistent and reverse years.
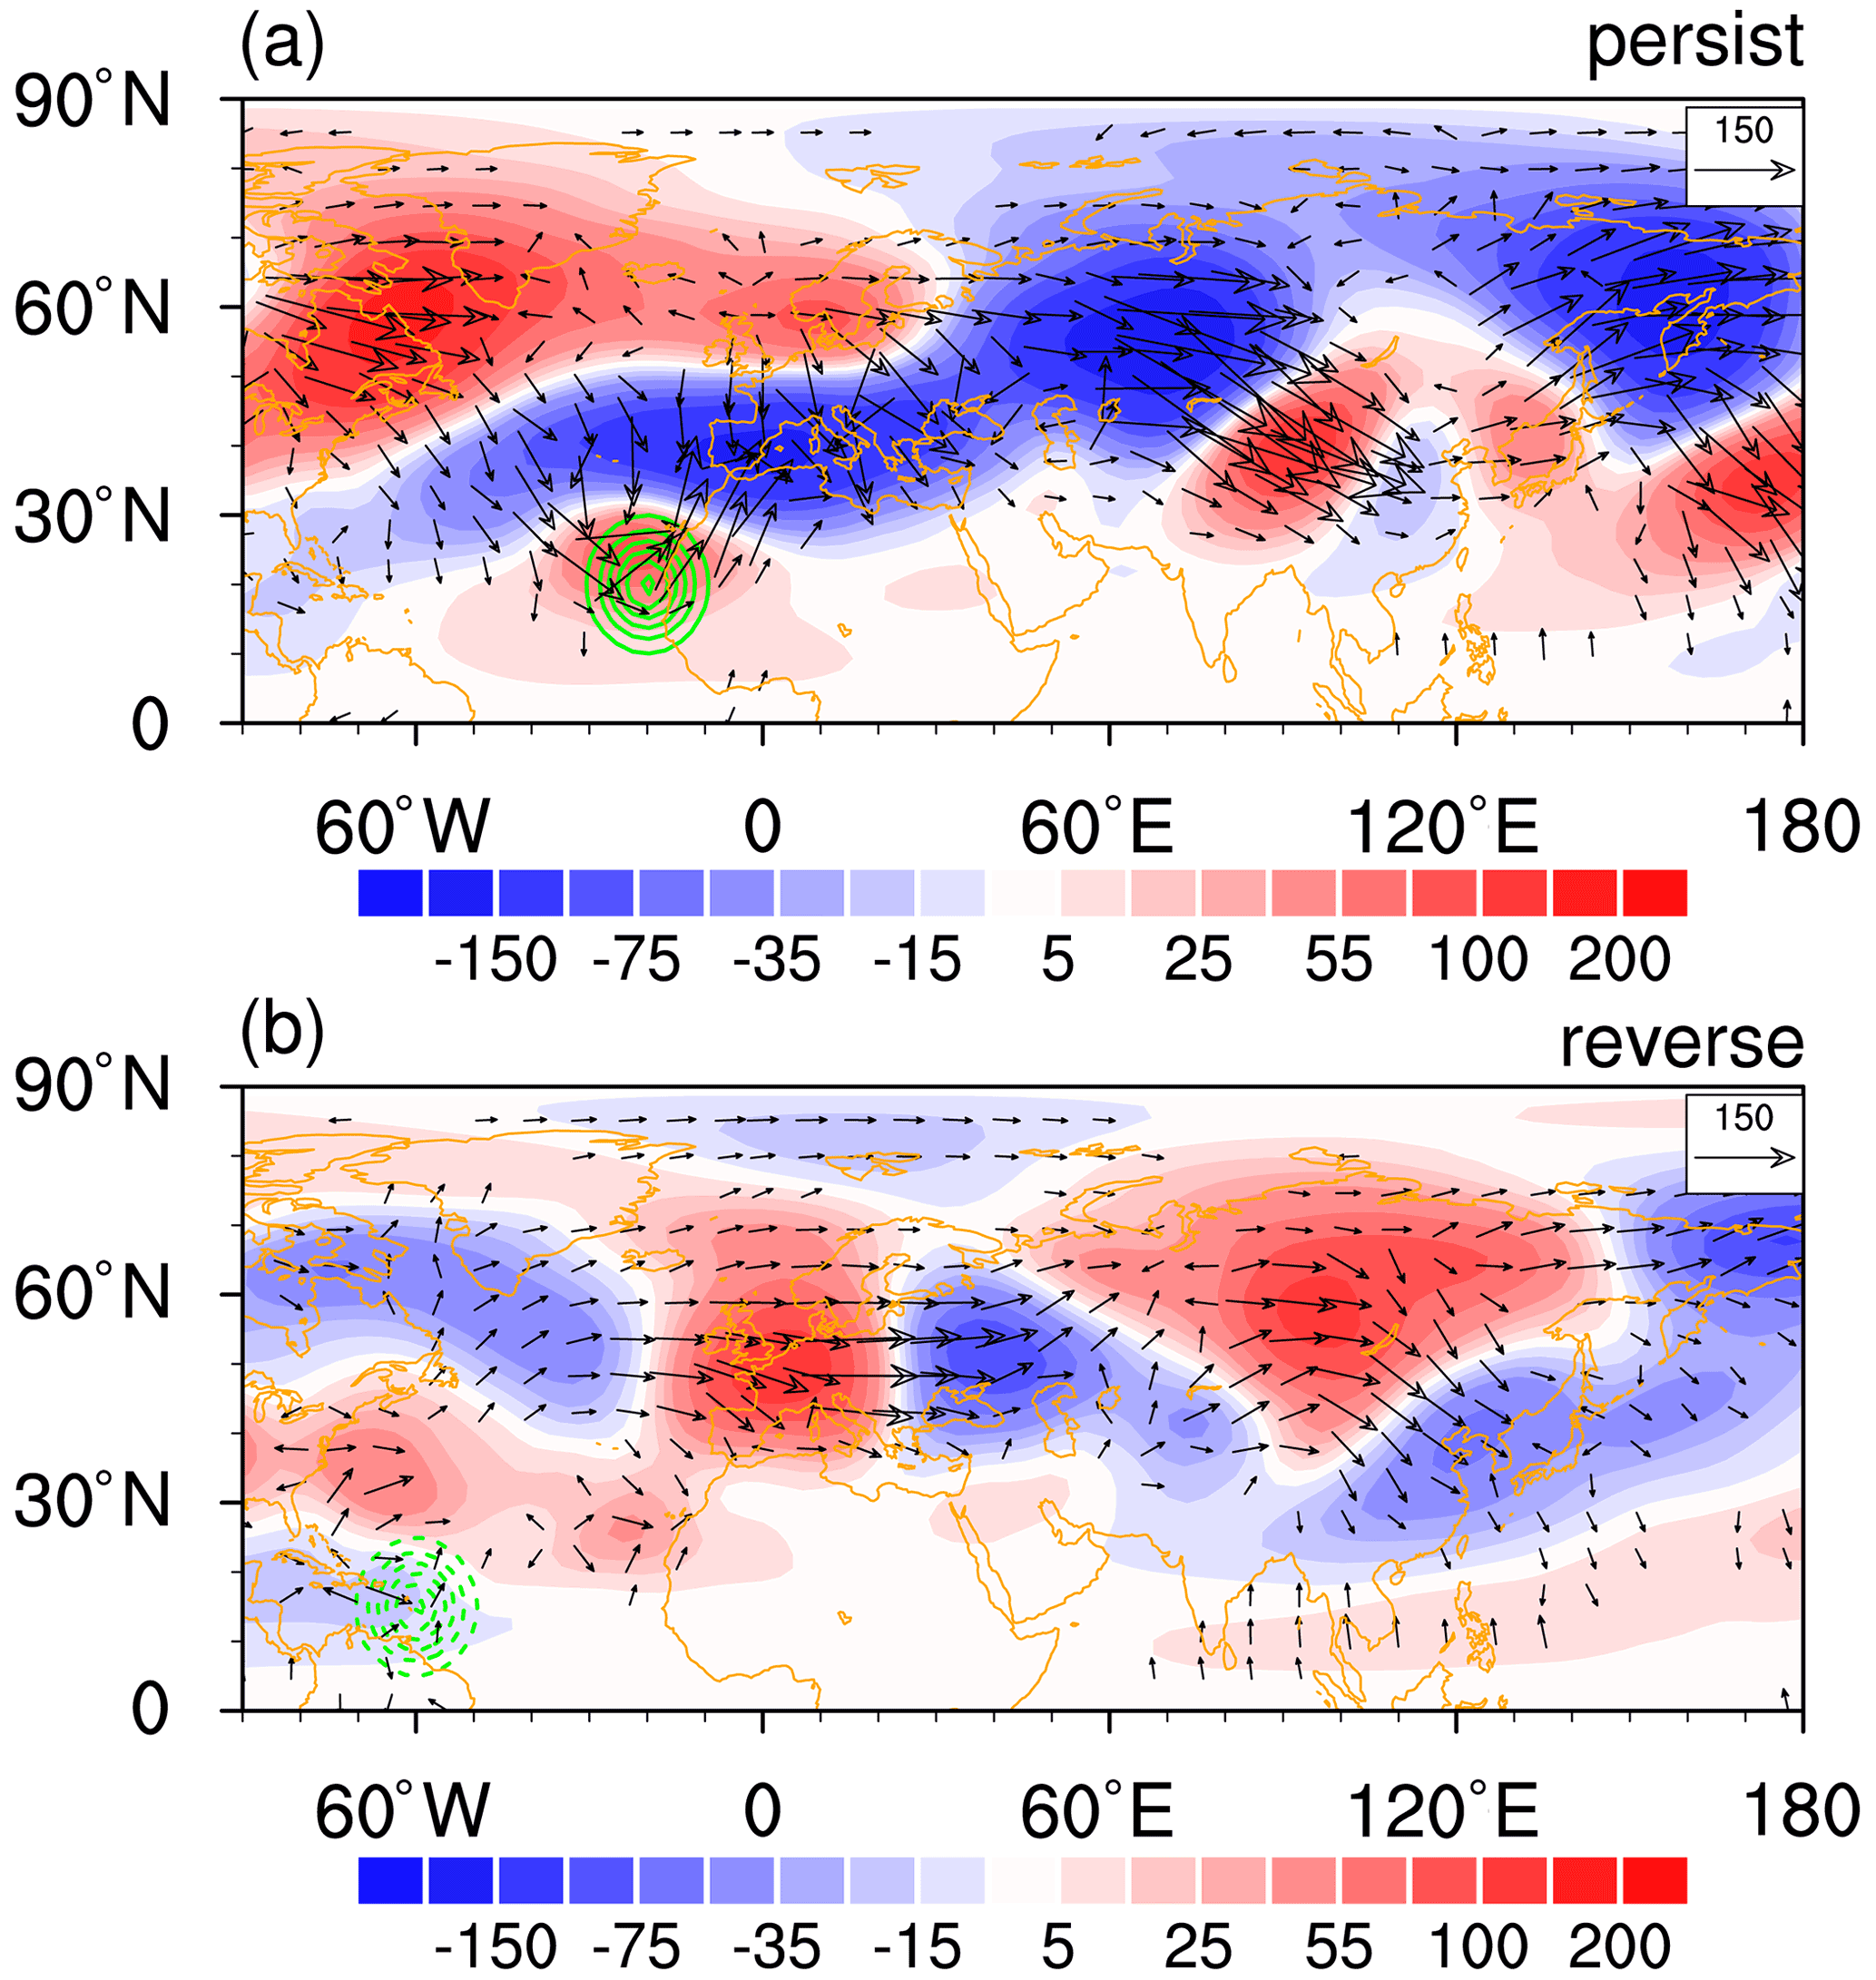
Figure 13(a) Barotropic model height perturbation (unit m) averaged from days 31 to 40 as a response to the given divergence anomaly (green contours with an interval of 10−6 s−1) over the subtropical eastern North Atlantic with the center at 20∘ N, 20∘ W. (b) Barotropic model height perturbation (unit m) averaged from days 31 to 40 as a response to the given convergence anomaly (green contours with an interval of 10−6 s−1) over the subtropical western North Atlantic with the center at 15∘ N, 60∘ W. Vectors in (a, b) indicate the corresponding wave activity fluxes.
In response to the prescribed divergent anomalies over the subtropical northeastern Atlantic related to the warm SSTAs there, there appears a positive NAO-like pattern with negative geopotential anomalies over mid-latitudes (along 30∘ N) and positive anomalies over high latitudes (along 60∘ N) of the North Atlantic (Fig. 13a), largely similar to the spatial pattern of spring atmospheric anomalies in the persistent years in Fig. 8c. By contrast, in response to the prescribed convergent anomalies over the subtropical northwestern Atlantic associated with the cold SSTAs, there exists a negative NAO-like pattern, with negative geopotential anomalies over high latitudes (along 60∘ N) and negative anomalies over mid-latitudes (along 30∘ N) of the North Atlantic (Fig. 13b), in concert with the spatial distribution of the atmospheric anomalies in the reverse years in Fig. 8d. In addition, it is surprising to see that the barotropic model experiment well simulates the anticyclonic (cyclone) anomaly over northeast Asia and related southerly (northerly) wind anomalies over the NCPR in response to the prescribed forcing in the subtropical northeastern (northwestern) Atlantic as indicated in Fig. 13a (b). This is consistent with the observed spring atmospheric anomalies over East Asia for the persistent (reverse) years, although the centers of the wave train over Eurasia in the barotropic experiments are not totally identical to those in the observations. In general, the above barotropic experiments further confirm the notion that the striking differences in the atmospheric anomalies over the North Atlantic and Eurasia (including northeast Asia) between the persistent and reverse years can be attributable to the distinct SST anomalies in the North Atlantic.
This study examines different evolutions of haze pollution over the NCPR from winter to the succedent spring according to the analyses based on observational data and reanalyses. It is found that interannual variation in haze pollution (as indicated by the DECC) over the NCPR in winter has a marginal positive relation with that in the following spring, with a correlation coefficient of about 0.3 over 1980–2011 between the haze pollution index in winter and spring, significant at the 90 % confidence level. This indicates that in most years when haze pollution over the NCPR is more (less) serious in winter, air conditions in the following spring are also worse (better) than normal. Additionally, it is found that there are some years when DECC anomalies in the following spring are significantly opposed to those in winter. We then focus on comparing atmospheric anomalies for the two types of year (i.e., persistent years and reverse years) to understand why there occur two completely different evolutions of haze pollution over the NCPR from winter to the following spring, as schematically summarized in Fig. 14.
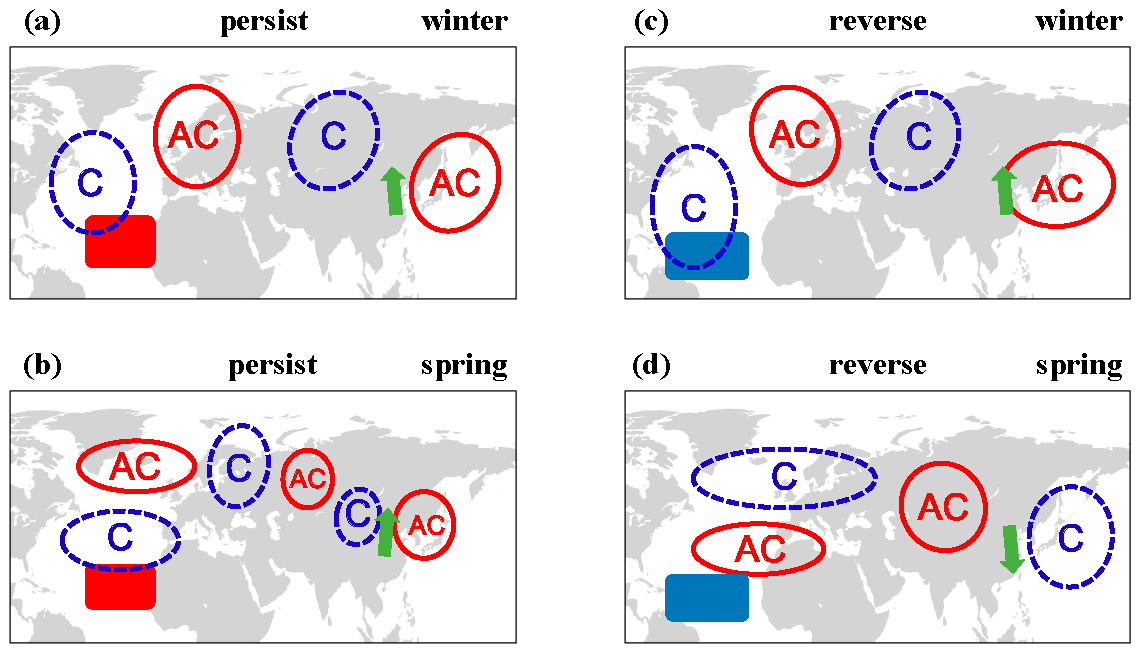
Figure 14Schematic diagram showing evolutions of DECC, SST, and atmospheric circulation anomalies from winter to spring for (a, b) the persistent cases and (c, d) the reverse cases. Solid red contours (dashed blue contours) indicate anticyclonic circulation anomalies (cyclonic circulation anomalies). Red (blue) shading in the North Atlantic indicates positive (negative) SST anomalies.
In the persistent years, an above-normal DECC (indicating more serious haze pollution) over the NCPR could be maintained to the succedent spring (Fig. 14a and b). This is attributable to the persistence of the anticyclonic anomaly over northeast Asia and associated southerly wind anomalies to its west side over the NCPR (Fig. 14a and b). The southerly wind anomalies over the NCPR oppose the climatological mean northerly winds, reduce the surface wind speed and BLH, and decrease the dispersion of the pollutants, which finally lead to more serious haze pollution in winter and spring. In addition, the southerly wind anomalies carry wetter and warmer air from lower latitudes and lead to an increase in the relative humidity, which is also conducive to haze pollution. As has been demonstrated by previous studies, the increase in the relative humidity is conducive to the generation of secondary organic compounds and secondary aerosol species, which also makes an important contribution to the occurrence of haze pollution events over the NCPR (Yu et al., 2005; Hennigan et al., 2008). Formation of the anticyclonic anomaly over northeast Asia in winter is closely related to the EAWR teleconnection pattern, while in spring it is related to the positive phase of the spring NAO and warm SSTAs in the subtropical northeastern Atlantic (Fig. 14a).
In the reverse years, an anticyclonic anomaly also appears over northeast Asia and associated southerly wind anomalies occur over NCPR in winter, which contribute to an above-normal DECC (Fig. 14c). In addition, formation of the anomalous anticyclone over northeast Asia is also related to the EAWR pattern (Fig. 14c). However, in the following spring, northeast Asia is covered by a cyclonic anomaly which is related to the positive phase of the NAO and cold SSTAs in the subtropical North Atlantic (Fig. 14d), which is in sharp contrast to the persistent years. The northerly wind anomalies over the NCPR to the west flank of the anomalous cyclone result in a decrease in the DECC over the NCPR via reduction in relative humidity and increasing surface wind speed (Fig. 14d).
The distinct evolutions of atmospheric anomalies over the North Atlantic and Eurasia (including northeast Asia) are found to be closely related to the different evolutions of SSTAs in the North Atlantic. In the persistent (reverse) years, positive (negative) SSTAs in the subtropical northeastern (northwestern) Atlantic are maintained to the following spring due to the positive air–sea interaction process. Then, positive (negative) spring SSTAs in the subtropical North Atlantic contribute to the formation of a negative (positive) NAO-like pattern over the North Atlantic, the generation of anticyclonic (cyclonic) anomaly over northeast Asia, and the occurrence of associated southerly (northerly) wind anomalies over the NCPR via an atmospheric Rossby wave train. Results of barotropic model simulations with three experiments further confirm the observed findings.
In this study, we find that negative SSTAs in the subtropical northwestern Atlantic play an important role in the formation of the positive NAO-like atmospheric anomaly in the reverse years. It seems that wintertime surface heat flux changes induced by the EAWR-related atmospheric anomalies cannot fully explain the formation of strong cold SSTAs in the subtropical northwestern Atlantic. This suggests that other factors, which remain to be explored, may also be important for the formation of the negative SST anomalies. Studies have indicated that ENSO-related SSTAs in the tropical Pacific also have a strong impact on atmospheric anomalies over East Asia and haze pollution over eastern China (Wang et al., 2000; Li et al., 2017; Zhang et al., 2017; He et al., 2019). We have examined evolutions of SSTAs in the tropical Pacific from winter to the subsequent spring in the persistent and reverse years. Results show that SSTAs in the tropical Pacific related to ENSO are weak in both the persistent and the reverse years (not shown). This suggests that ENSO-related SSTAs may not make a contribution to the interannual variation in haze pollution over the NCPR, which is consistent with a recent study by He et al. (2019). It is reported that ENSO-related SSTAs in the tropical Pacific have a significant impact on the haze pollution over southern China. By contrast, the impact of ENSO on the haze pollution over North China is weak (He et al., 2019). Furthermore, previous studies have indicated that Arctic sea ice anomalies over Eurasia may also be important for the formation of the atmospheric anomalies over East Asia in association with the haze pollution over north China (Wang et al., 2015; Yin and Wang, 2017). We have examined Arctic sea ice anomalies in winter and spring for the persistent and reverse years. We find that sea ice anomalies over most portions of the Arctic are weak and statistically insignificant (results not shown). This suggests that Arctic sea ice changes are not likely to have an important role in the distinct evolutions of haze pollution from winter to the subsequent spring over the NCPR for the persistent and reverse years.
Figures in this study were constructed with the NCAR Command Language (http://www.ncl.ucar.edu/, last access: 8 September 2019). All codes used in this study are available from the corresponding author (Shangfeng Chen).
Atmospheric data are derived from the NCEP–NCAR reanalysis (http://www.esrl.noaa.gov/psd/data/gridded/data.ncep.reanalysis.html, last access: 6 February 2021) (NCEP-NCAR, 2021). SST data are obtained from http://www.esrl.noaa.gov/psd/data/gridded/data.noaa.ersst.v5.html (last access: 6 February 2021) (NOAA, 2021). Atmospheric teleconnection indices are obtained from https://www.cpc.ncep.noaa.gov/data/teledoc/telecontents.shtml (last access: 6 February 2021) (CPC, 2021). Surface data of visibility and relative humidity can be obtained from the authors upon request.
LS and SC designed the research, performed the analysis, and wrote the paper. WC, JG, CC, and YW discussed the results and commented on the manuscript.
The contact author has declared that neither they nor their co-authors have any competing interests.
Publisher’s note: Copernicus Publications remains neutral with regard to jurisdictional claims in published maps and institutional affiliations.
We thank the three anonymous reviewers for their constructive suggestions and comments, which helped to improve the paper.
This research has been supported by the Beijing Natural Science Foundation (grant no. 8212025), the National Natural Science Foundation of China (grant nos. 41721004 and 41961144025), and the Chinese Academy of Sciences Key Research Program of Frontier Sciences (grant no. QYZDY-SSWDQC024).
This paper was edited by Ashu Dastoor and reviewed by three anonymous referees.
Cai, W. J., Li, K., Liao, H., Wang, H. J., and Wu, L. X.: Weather conditions conducive to Beijing severe haze more frequent under climate change, Nat. Clim. Change, 7, 257–263, 2017.
Chang, L., Xu, J., Tie, X., and Wu, J.: Impact of the 2015 El Niño event on winter air quality in China, Sci. Rep., 6, 34275, https://doi.org/10.1038/srep34275, 2016.
Che, H., Zhang, X., Li, Y., Zhou, Z., Qu, J., and Hao, X.: Haze trends over the capital cities of 31 provinces in China, 1981–2005, Theor. Appl. Climatol., 97, 235–242, 2009.
Chen, G. S. and Huang, R. H.: Excitation mechanisms of the teleconnection patterns affecting the July precipitation in Northwest China, J. Climate, 25, 7834–7851, 2012.
Chen, S., Wu, R., and Chen, W.: The changing relationship between interannual variations of the North Atlantic Oscillation and northern tropical Atlantic SST, J. Climate, 28, 485–504, 2015.
Chen, S., Wu, R., and Liu, Y.: Dominant modes of interannual variability in Eurasian surface air temperature during boreal spring, J. Climate, 29, 1109–1125, 2016.
Chen, S., Guo, J., Song, L., Li, J., Liu, L., and Cohen, J.: Interannual variation of the spring haze pollution over the North China Plain: Roles of atmospheric circulation and sea surface temperature, Int. J. Climatol., 39, 783–798, 2019.
Chen, S., Guo, J., Song, L., Cohen, J., and Wang, Y.: Temporal disparity of the atmospheric systems contributing to interannual variation of wintertime haze pollution in the North China Plain, Int. J. Climatol., 40, 128–144, 2020.
Cheng, J., Su, J., Cui, T., Li, X., Dong, X., Sun, F., Yang, Y., Tong, D., Zheng, Y., Li, Y., Li, J., Zhang, Q., and He, K.: Dominant role of emission reduction in PM2.5 air quality improvement in Beijing during 2013–2017: a model-based decomposition analysis, Atmos. Chem. Phys., 19, 6125–6146, https://doi.org/10.5194/acp-19-6125-2019, 2019.
Climate Prediction Center (CPC): Climate Prediction Center atmospheric teleconnections, CPC [data set], available at: https://www.cpc.ncep.noaa.gov/data/teledoc/telecontents.shtml, last access: 6 February 2021.
Cohen, A., Brauer, M., Burnett, R., Anderson, H., Frostad, J., Estep, K., Balakrishnan, K., Brunekreef, B., Dandona, L., Dandona, R., Feigin, V., Freedman, G., Hubbell, B., Jobling, A., Kan, H., Knibbs, L., Liu, Y., Martin, R., Morawska, L., Pope, C., Shin, H., Straif, K., Shaddick, G., Thomas, M., Dingenen, R., Donkelaar, A., Vos, T., Murray, C., and Forouzanfar, M.: Estimates and 25-year trends of the global burden of disease attributable to ambient air pollution: An analysis of data from the Global Burden of Diseases Study 2015, Lancet, 389, 1907–1918, 2017.
Craig, C. D. and Faulkenberry, G. D.: The application of ridit analysis to detect trends in visibility, Atmos. Environ., 13, 1617–1622, 1979.
Czaja, A. and Frankignoul, C.: Influence of the North Atlantic SST on the atmospheric circulation, Geophys. Res. Lett., 26, 2969–2972, 1999.
Czaja, A. and Frankignoul, C.: Observed impact of Atlantic SST anomalies on the North Atlantic oscillation, J. Climate, 15, 606–623, 2002.
Czaja, A., van der Vaart P., and Marshall, J.: A diagnostic study of the role of remote forcing in tropical Atlantic variability, J. Climate, 15, 3280–3290, https://doi.org/10.1175/1520-0442(2002)015<3280:ADSOTR>2.0.CO;2, 2002.
Czaja, A., Robertson, A. W., and Huck, T.: The role of Atlantic ocean–atmosphere coupling in affecting North Atlantic Oscillation variability. The North Atlantic Oscillation: Climatic Significance and Environmental Impact, edited by: Hurrell, J. W., Geophys. Monogr., vol. 134, Amer. Geophys. Union, 147–172, 2003.
Dang, R. and Liao, H.: Severe winter haze days in the Beijing–Tianjin–Hebei region from 1985 to 2017 and the roles of anthropogenic emissions and meteorology, Atmos. Chem. Phys., 19, 10801–10816, https://doi.org/10.5194/acp-19-10801-2019, 2019.
Ding, Y. H. and Liu, Y. J.: Analysis of long-term variations of fog and haze in China in recent 50 years and their relations with atmospheric humidity, Sci. China Earth Sci., 57, 36–46, 2014.
Ding, Y., Wu, P., Liu, Y., and Song, Y.: Environmental and dynamic conditions for the occurrence of persistent haze events in North China, Engineering, 3, 266–271, 2017.
Duan, W., Song, L., Li, Y., and Mao, J. Modulation of PDO on the predictability of the interannual variability of early summer rainfall over South China, J. Geophys. Res., 118, 13008–13021, https://doi.org/10.1002/2013JD019862, 2013.
Fu, G. Q., Xu, W. Y., Yang, R. F., Li, J. B., and Zhao, C. S.: The distribution and trends of fog and haze in the North China Plain over the past 30 years, Atmos. Chem. Phys., 14, 11949–11958, https://doi.org/10.5194/acp-14-11949-2014, 2014.
Guo, J., Liu, H., Li, Z., Rosenfeld, D., Jiang, M., Xu, W., Jiang, J. H., He, J., Chen, D., Min, M., and Zhai, P.: Aerosol-induced changes in the vertical structure of precipitation: a perspective of TRMM precipitation radar, Atmos. Chem. Phys., 18, 13329–13343, https://doi.org/10.5194/acp-18-13329-2018, 2018.
Guo, J. P., Su, T., Li, Z., Miao, Y., Li, J., Liu, H., Xu, H., Cribb, M., and Zhai, P.: Declining frequency of summertime local-scale precipitation over eastern China from 1970 to 2010 and its potential link to aerosols, Geophys. Res. Lett., 44, 5700–5708, 2017.
He, C., Liu, R., Wang, X., Liu, S. C., Zhou, T., and Liao, W.: How does El Niño-Southern Oscillation modulate the interannual variability of winter haze days over eastern China?, Sci. Total Environ., 651, 1892–1902, 2019.
Hennigan, C. J., Bergin, M. H., Dibb, J. E., and Weber, R. J.: Enhanced secondary organic aerosol formation due to water uptake by fine particles, Geophys. Res. Lett., 35, L18801, https://doi.org/10.1029/2008GL035046, 2008.
Hodson, D. L. R., Sutton, R. T., Cassou, C., Keenlyside, N., Okumura, Y., and Zhou, T. J.: Climate impacts of recent multidecadal changes in Atlantic Ocean sea surface temperature: A multimodel comparison, Clim. Dynam., 34, 1041–1058, 2010.
Hu, Z.-Z. and Huang, B.: On the significance of the relationship between the North Atlantic Oscillation in early winter and Atlantic sea surface temperature anomalies, J. Geophys. Res., 111, D12103, https://doi.org/10.1029/2005JD006339, 2006.
Huang, B. and Shukla, J.: Ocean–atmosphere interactions in the tropical and subtropical Atlantic Ocean. J. Climate, 18, 1652–1672, 2005.
Huang B., Thorne P. W., Banzon, V. F., Boyer, T., Chepurin, G., Lawrimore, J. H., Menne, M. J., Smith, T. M., Vose, R. S., and Zhang, H. M.: Extended reconstructed sea surface temperature, version 5 (ERSSTv5): Upgrades, validations, and intercomparisons, J. Climate, 30, 8179–8205, https://doi.org/10.1175/JCLI-D-16-0836.1, 2017.
Hurrell, J. W.: Decadal trends in the North Atlantic Oscillation, Science, 269, 676–679, 1995.
Kalnay, E., Kanamitsu, M., Kistler, R., Collins, W., Deaven, D., Gandin, L., Iredell, M., Saha, S., White, G., Woollen, J., Zhu, Y., Leetmaa, A., Reynolds, R., Chelliah, M., Ebisuzaki, W., Higgins, W., Janowiak, J., Mo, K. C., Ropelewski, C., Wang, J., Jenne, R., and Joseph, D.: The NCEP/NCAR 40-year reanalysis project, B. Am. Meteorol. Soc., 77, 437–471, 1996.
Kerr, R. A.: A North Atlantic climate pacemaker for the centuries, Science, 288, 1984–1986, 2000.
Koren, I., Altaratz, O., Remer, L. A., Feingold, G., Martins, J. V., and Heiblum, R. H.: Aerosol-induced intensification of precipitation from the Tropics to the mid-latitudes, Nat. Geosci., 5, 118–122, 2012.
Koschmieder, H.: Theorie der horizontalen Sichtweite Beit, Physics of the Atmosphere, 12, 33–55, 1926.
Li, J., Li, C., and Zhao, C.: Different trends in extreme and median surface aerosol extinction coefficients over China inferred from quality-controlled visibility data, Atmos. Chem. Phys., 18, 3289–3298, https://doi.org/10.5194/acp-18-3289-2018, 2018.
Li, Q., Zhang, R., and Wang, Y.: Interannual variation of the wintertime fog-haze days across central and eastern China and its relation with East Asian winter monsoon, Int. J. Climatol., 36, 346–354, 2016.
Li, T., Wang, B., Wu, B., and Zhou, T.: Theories on formation of an anomalous anticyclone in Western North Pacific during El Niño: a review, J. Meteorol. Res. 31, 987–1006, 2017.
Li, X., Yu, C., Deng, X., He, D., Zhao, Z., Mo, H., Mo, J., and Wu, Y.: Mechanism for synoptic and intra-seasonal oscillation of visibility in Beijing-Tianjin-Hebei region, Theor. Appl. Climatol., 143, 1005–1015, https://doi.org/10.1007/s00704-020-03466-z, 2021.
Liu, T., Gong, S., He, J., Yu, M., Wang, Q., Li, H., Liu, W., Zhang, J., Li, L., Wang, X., Li, S., Lu, Y., Du, H., Wang, Y., Zhou, C., Liu, H., and Zhao, Q.: Attributions of meteorological and emission factors to the 2015 winter severe haze pollution episodes in China's Jing-Jin-Ji area, Atmos. Chem. Phys., 17, 2971–2980, https://doi.org/10.5194/acp-17-2971-2017, 2017.
Lu, X., Lin, C., Li, W., Chen, Y., Huang, Y., Fung, J., and Lau, A.: Analysis of the adverse health effects of PM2.5 from 2001 to 2017 in China and the role of urbanization in aggravating the health burden, Sci. Total Environ., 652, 683–695, 2019.
Ma, J. and Zhang, R.: Opposite interdecadal variations of wintertime haze occurrence over North China Plain and Yangtze River Delta regions in 1980–2013, Sci. Total Environ., 732, 139240, https://doi.org/10.1016/j.scitotenv.2020.139240, 2020.
Mantua, N. J., Hare, S. R., Zhang, Y., Wallace, J. M., and Francis, R. C.: A Pacific interdecadal climate oscillation with impacts on salmon production, B. Am. Meteorol. Soc., 78, 1069–1079, 1997.
NCEP-NCAR: Monthly and daily mean atmospheric reanalysis data, NCEP-NCAR [data set], available at: http://www.esrl.noaa.gov/psd/data/gridded/data.ncep.reanalysis.html, last access: 6 February 2021.
NOAA: NOAA Extended Reconstructed Sea Surface Temperature (SST) V5 data sets, NOAA [data set], available at: http://www.esrl.noaa.gov/psd/data/gridded/data.noaa.ersst.v5.html, last access: 6 February 2021.
O'Reilly, C. H., Woollings, T., and Zanna, L.: The impact of tropical precipitation on summertime Euro-Atlantic circulation via a circumglobal wave train, J. Climate, 31, 6481–6504, 2018.
Pan, L.-L.: Observed positive feedback between the NAO and the North Atlantic SSTA tripole, Geophys. Res. Lett., 32, L06707, https://doi.org/10.1029/2005GL022427, 2005.
Peng, S., Robinson, W. A., and Li, S.: Mechanisms for the NAO responses to the North Atlantic SST tripole, J. Climate, 16, 1987–2004, 2003.
Rodwell, M. J. and Folland, C. K.: Atlantic air–sea interaction and seasonal predictability, Q. J. Roy. Meteor. Soc., 128, 1413–1443, 2002.
Rosenfeld, D., Dai, J., Yu, X., Yao, Z., Xu, X., Yang, X., and Du, C.: Inverse relations between amounts of air pollution and orographic precipitation, Science, 315, 1396–1398, 2007.
Sardeshmukh, P. D. and Hoskins, B. J.: The generation of global rotational flow by steady idealized tropical divergence, J. Atmos. Sci., 45, 1228–1251, 1988.
Sun, C., Li, J. P., and Zhao, S. Remote influence of Atlantic multidecadal variability on Siberian warm season precipitation, Sci. Rep., 5, 16853, https://doi.org/10.1038/srep16853, 2015.
Takaya, K. and Nakamura, H.: A formulation of a phaseindependent wave activity flux for stationary and migratory quasigeostrophic eddies on a zonally varying basic flow, J. Atmos. Sci., 58, 608–627, 2001.
Tie, X., Huang, R., and Dai, W.: Effect of heavy haze and aerosol pollution on rice and wheat productions in China, Sci. Rep., 6, 29612, https://doi.org/10.1038/srep29612, 2016.
Ting, M. F.: Steady linear response to tropical heating in barotropic and baroclinic models, J. Atmos. Sci., 53, 1698–1709, 1996.
Visbeck, M., Chassignet, E., Curry, R., and Delworth, T.: The ocean's response to North Atlantic variability. The North Atlantic Oscillation, edited by: Hurrell, J., Kushnir, Y., Ottersen, G., and Visbeck, M., Geophys. Monogr., 134, 113–145, 2003.
Wang, B., Wu, R. G., and Fu, X. H.: Pacific–East Asian teleconnection: how does ENSO affect East Asian climate?, J. Climate, 13, 1517–1536, 2000.
Wang, F., Guo, J., Wu, Y., Zhang, X., Deng, M., Li, X., Zhang, J., and Zhao, J.: Satellite observed aerosol-induced variability in warm cloud properties under different meteorological conditions over eastern China, Atmos. Environ., 84, 122–132, 2014.
Wang, H.-J. and Chen, H.-P.: Understanding the recent trend of haze pollution in eastern China: roles of climate change, Atmos. Chem. Phys., 16, 4205–4211, https://doi.org/10.5194/acp-16-4205-2016, 2016.
Wang, H.-J., Chen, H.-P., and Liu, J.-P.: Arctic sea ice decline intensified haze pollution in eastern China, Atmos. Ocean. Sci. Lett., 8, 1–9, https://doi.org/10.3878/AOSL20140081, 2015.
Wang, L., Liu, Y., Zhang, Y., Chen, W., and Chen, S.: Time-varying structure of the wintertime Eurasian pattern: Role of the North Atlantic sea surface temperature and atmospheric mean flow, Clim. Dynam., 52, 2467–2479, 2019.
Wang, X., Wei, W., Cheng, S., Li, J., Zhang, H., and Lv, Z.: Characteristics and classification of PM2.5 pollution episodes in Beijing from 2013 to 2015, Sci. Total Environ., 612, 170–179, 2018.
Wang, Y., Zhang, R., and Saravanan, R.: Asian pollution climatically modulates mid-latitude cyclones following hierarchical modeling and observational analysis, Nat. Commun., 5, 3098, https://doi.org/10.1038/ncomms4098, 2014.
Watanabe, M.: Asian jet waveguide and a downstream extension of the North Atlantic Oscillation, J. Climate, 17, 4674–4691, 2004.
Wu, G., Li, Z.-Q., Fu, C., Zhang, X., Zhang, R.-Y., Zhang, R., Zhou, T., Li, J., Li, J., Zhou, D., Wu, L., Zhou, L., He, B., and Huang, R.: Advances in studying interactions between aerosols and monsoon in China, Sci. China Earth Sci., 59, 1–16, https://doi.org/10.1007/s11430-015-5198-z, 2016.
Wu, L. and Liu, Z.: North Atlantic decadal variability: Air–sea coupling, oceanic memory, and potential Northern Hemisphere resonance, J. Climate, 18, 331–349, 2005.
Wu, R., Yang, S., Liu, S., Sun, L., Lian, Y., and Gao, Z.: Northeast China summer temperature and North Atlantic SST, J. Geophys. Res., 116, D16116, https://doi.org/10.1029/2011JD015779, 2011.
Wu, Z., Wang, B., Li, J., and Jin, F.-F.: An empirical seasonal prediction model of the East Asian summer monsoon using ENSO and NAO, J. Geophys. Res., 114, D18120, https://doi.org/10.1029/2009JD011733, 2009.
Xiao, D., Li, Y., Fan, S., Zhang, R., Sun, J., and Wang, Y.: Plausible influence of Atlantic Ocean SST anomalies on winter haze in China, Theor. Appl. Climatol., 122, 249–257, 2014.
Yin, Z. and Wang, H.: The relationship between the subtropical western Pacific SST and haze over north-central North China Plain, Int. J. Climatol., 36, 3479–3491, https://doi.org/10.1002/joc.4570, 2016.
Yin, Z. and Wang, H.: Role of atmospheric circulations in haze pollution in December 2016, Atmos. Chem. Phys., 17, 11673–11681, https://doi.org/10.5194/acp-17-11673-2017, 2017.
Yin, Z. and Wang, H.: The strengthening relationship between Eurasian snow cover and December haze days in central North China after the mid-1990s, Atmos. Chem. Phys., 18, 4753–4763, https://doi.org/10.5194/acp-18-4753-2018, 2018.
Yin, Z., Wang, H., and Guo, W.: Climatic change features of fog and haze in winter over North China and Huang-Huai Area, Sci. China Earth Sci., 58, 1370–1376, 2015.
Yu, J. Z., Huang, X. F., Xu, J., and Hu, M.: When aerosol sulfate goes up, so does oxalate: implication for the formation mechanisms of oxalate, Environ. Sci. Technol., 39, 128–133, 2005.
Zhang, J., Liu, J., Ren, L., Wei, J., Duan, J., Zhang, L., Zhou, X., and Sun, Z.: PM2.5 induces male reproductive toxicity via mitochondrial dysfunction, DNA damage and RIPK1 mediated apoptotic signaling pathway, Sci. Total Environ., 634, 1435–1444, 2018.
Zhang, R. H., Min, Q. Y., and Su, J. Z.: Impact of El Niño on atmospheric circulations over East Asia and rainfall in China: role of the anomalous western North Pacific anticyclone, Sci. China Earth Sci., 60, 1124–1132, 2017.
Zhang, X., Huang, Y., Zhu, W., and Rao, R.: Aerosol characteristics during summer haze episodes from different source regions over the coast city of North China Plain, J. Quant. Spectrosc. Ra., 122, 180–193, 2013.
Zhang, Y., Wallace, J. M., and Battisti, D. S.: ENSO-like interdecadal variability: 1900–93, J. Climate, 10, 1004–1020, 1997.
Zhang, Y., Yin, Z., and Wang, H.: Roles of climate variability on the rapid increases of early winter haze pollution in North China after 2010, Atmos. Chem. Phys., 20, 12211–12221, https://doi.org/10.5194/acp-20-12211-2020, 2020.
Zhang, Z., Zhang, X., Gong, D., Kim, S.-J., Mao, R., and Zhao, X.: Possible influence of atmospheric circulations on winter haze pollution in the Beijing–Tianjin–Hebei region, northern China, Atmos. Chem. Phys., 16, 561–571, https://doi.org/10.5194/acp-16-561-2016, 2016.
Zhao, S., Li, J., and Sun, C.: Decadal variability in the occurrence of wintertime haze in central eastern China tied to the Pacific Decadal Oscillation, Sci. Rep., 6, 27424, https://doi.org/10.1038/srep27424, 2016.
Zhao, W., Chen, S., Chen, W., Yao, S., Nath, D., and Yu, B.: Interannual variations of the rainy season withdrawal of the monsoon transitional zone in China, Clim. Dynam., 53, 2031–2046, 2019.
Zuo, J., Li, W., Sun, C., Xu, L., and Ren, H.: Impact of the North Atlantic sea surface temperature tripole on the East Asian summer monsoon, Adv. Atmos. Sci., 30, 1173–1186, 2013.
- Abstract
- Introduction
- Data and methods
- Connection of haze pollution over the NCPR in winter and spring
- Mechanism for the different evolutions of atmospheric anomalies over the North Atlantic and Eurasia
- Summary and discussions
- Code availability
- Data availability
- Author contributions
- Competing interests
- Disclaimer
- Acknowledgements
- Financial support
- Review statement
- References