the Creative Commons Attribution 4.0 License.
the Creative Commons Attribution 4.0 License.
 | 21 Dec 2022
Three dominant synoptic atmospheric circulation patterns influencing severe winter haze in eastern China
Shiyue Zhang
Gang Zeng
Tijian Wang
Xiaoye Yang
Vedaste Iyakaremye
Previous studies have indicated that, on a synoptic scale, severe haze in eastern China (EC) is affected by atmospheric circulation variations. However, it is still unclear what the dominant atmospheric circulation patterns influencing the severe winter haze conditions in EC and the differences between them are. To systematically determine the dominant synoptic atmospheric circulation patterns of severe haze in different regions of EC, we use the hierarchical clustering algorithm (HCA) to classify the local geopotential height anomalies at 500 hPa over stations with severe haze and obtained three dominant synoptic atmospheric circulation types based on observed particulate matter with an aerodynamic diameter less than 2.5 µm (PM2.5) concentrations and NCEP/NCAR reanalysis. Circulation Type1 is accompanied by significant northerly wind component anomalies over northern China and causes severe haze pollution over the Yangtze River valley. Although the local meteorological conditions are not conducive to haze formation and accumulation, the severe haze in the Yangtze River valley is related to the pollution transportation caused by the northerly wind anomalies. During the haze days with circulation Type2, the joint affection of the East Atlantic/West Russia teleconnection pattern and winter East Asia subtropical jet stimulate and maintain the anticyclonic anomalies over northeast Asia, which provides meteorological conditions conducive to the occurrence of severe haze over the whole EC. Circulation Type3 mainly caused severe haze events in northeast China through the establishment of blocking high over the Sea of Okhotsk. The results provide a basis for establishing haze prediction and management policies applicable to different regions in EC.
- Article
(13494 KB) - Full-text XML
-
Supplement
(692 KB) - BibTeX
- EndNote


Severe haze could increase the risk of traffic accidents by reducing visibility and could harm human health by causing respiratory diseases (Xie et al., 2014; Hu et al., 2015; Wang et al., 2016). Haze events in China are mainly caused by particulate matter with an aerodynamic diameter less than 2.5 µm (PM2.5; Cai et al., 2017; Shen et al., 2018; Wang et al., 2021). Research shows that the distribution of haze days in China has characteristics of uneven spatial distribution, with more spatial distribution in the economically developed eastern region and less in the economically underdeveloped region (Wu et al., 2013; Liu et al., 2015; Xu et al., 2015). With the rapid development of industrialization and an increase in urbanization and anthropogenic emission, eastern China (EC) has experienced more severe haze events with longer durations and larger spatial scales, causing serious harm in the past few decades (Monks et al., 2009; Qian et al., 2009; Wang et al., 2009). Since the beginning of the 21st century, the uneven spatial distribution of haze events in China has become more obvious (Sun et al., 2016), which has led to the increasing rate of mortality related to respiratory diseases in Beijing–Tianjin–Hebei, the Yangtze River valley (YRV), and the Pearl River Delta (Tsaia et al., 2014; Ding et al., 2016; Fan and Sun, 2019). Although haze pollution control in China has been improved to some extent with the strict implementation of energy conservation and emission reduction policies after 2013 (Wang et al., 2021), haze still affects various socio-economic sectors and human health.
In addition to human activities, meteorological conditions are also considered as one of the most important factors for determining regional air quality. Previous studies have indicated that, on a weather scale, the formation and maintenance of haze days in eastern China (HDEC) are closely related to favorable weather conditions (Niu et al., 2010; Cai et al., 2017), including a strong thermal inversion potential, high relative humidity, negative sea level pressure anomaly, and weak wind speed. Furthermore, the anticyclonic anomaly could lead to a sinking movement and a weaker thermal inversion potential, which inhibit the vertical diffusion of pollutants and affect the air quality of the local or larger region (Wu et al., 2013; Xu et al., 2015). Many studies have investigated the key circulation system affecting HDEC on an interannual scale or intraseasonal scale and suggested that the weak East Asian winter monsoon (Li et al., 2015; Yin et al., 2015; Zhang et al., 2022), the positive phase of Arctic Oscillation (Wang et al., 2015; Yin et al., 2015), and the positive phase of the East Atlantic/West Russia (EA/WR) teleconnection pattern (Yin et al., 2017) could result in more haze days in China. On a synoptic scale, meteorological conditions could also significantly regulate HDEC. The weak synoptic circulation with a high-pressure or continuous low-pressure system is beneficial for the accumulation of pollution, while the strong weather phenomena with a large pressure gradient encourage the diffusion of pollutants (Li et al., 2019; Cai et al., 2020). Furthermore, studies have shown that cold surges can dissipate and reduce local air pollutants by bringing dry and clean cold air (Wu et al., 2017; Leung et al., 2018; Zhang et al., 2021).
A recent study classified the daily winter circulation anomalies and suggested that there are two dominant climate drivers (i.e., the EA/WR teleconnection pattern and the Victoria mode of sea surface temperature anomalies) conducive to the severe haze occurrence in northern China (Li et al., 2022). Existing studies have also investigated the synoptic circulation patterns conducive to haze pollution in different regions of China (Chang and Zhan, 2017; Li et al., 2019; Liu et al., 2019; Liao et al., 2020; Sun et al., 2020; Yang et al., 2021; Gong et al., 2022). Most of these studies produced the classification based on low-level circulation anomalies, while the upper-level circulation also plays an important role in the generation and accumulation of haze (Wang et al., 2015; Yin and Wang, 2017; Zhong et al., 2019). In addition, due to the large spatial span in EC, if we assess the classification of synoptic circulation patterns in a fixed region, it may lead to different effects of the same classification pattern in different regions. Therefore, we classify the circulation anomalies with severe haze days of each station in EC, and finally obtain the dominant synoptic atmospheric circulation pattern of each station. In general, the present study addresses the following scientific questions: (1) what are the synoptic atmospheric circulation patterns that dominate severe haze pollution in EC? (2) What are the differences in the action ranges of each circulation pattern? (3) What are their possible mechanisms? These issues are addressed using a modified classification algorithm (hierarchical clustering algorithm, HCA) that is more suitable for studying the classification of synoptic patterns in a large spatial range.
The remaining sections of this paper are structured as follows: data and methods are introduced in Sect. 2. Section 3 shows the dominant synoptic circulation patterns of severe HDEC. In Sect. 4, we compare different circulation types associated with severe HDEC. Finally, the discussion and main conclusions are given in Sect. 5.
2.1 Data
In this study, the daily meteorological data and the observed PM2.5 concentrations from 2014 to 2021 are used to analyze the dominant circulation patterns and their main causes of severe haze in winter in EC. The daily NCEP/NCAR reanalysis was obtained from https://psl.noaa.gov/ (last access: 16 May 2022), which includes sea level pressure (SLP), surface air temperature (SAT), the temperature in multiple pressure levels, geopotential height (GPH), three-dimensional wind, relative humidity (RH) at 1000 hPa, and vertical velocity (omega) at 850 hPa (Kalnay et al., 1996). The dataset has a horizontal resolution of 2.5∘ × 2.5∘. In this study, we define the thermal inversion potential (TIP) as the air temperature at 850 hPa minus SAT, referring to Yin and Wang (2019). The daily PM2.5 concentrations for 935 meteorological stations in China (following Yin and Wang, 2016, and Yin et al., 2021; the stations with missing data of more than 5 % are dropped and the stations with data continuously lost for 3 d or more are also discarded) were obtained from the China National Environmental Monitoring Centre (https://quotsoft.net/air/, last access: 16 May 2022). The sporadic missing data (less than 3 d) were filled by cubic spline interpolation.
2.2 Definition of severe HDEC
In this study, severe HDEC is defined when PM2.5 concentration ≥150 µg m−3 (Cai et al., 2017; Zhong et al., 2019). We focus on the haze days in the cool season (November to February of the following year, abbreviated as NDJF), which accounts for more than 40 % of the total haze days in China in a year (Sun et al., 2013; Wang et al., 2015). Figure 1 shows the climatology of haze days in China from 2014 to 2021 in NDJF. The severe haze days are mainly concentrated in EC (east of 105∘ E and south of 54∘ N), which is selected as the target area in the present study. Thus, a subset of 853 stations is selected.
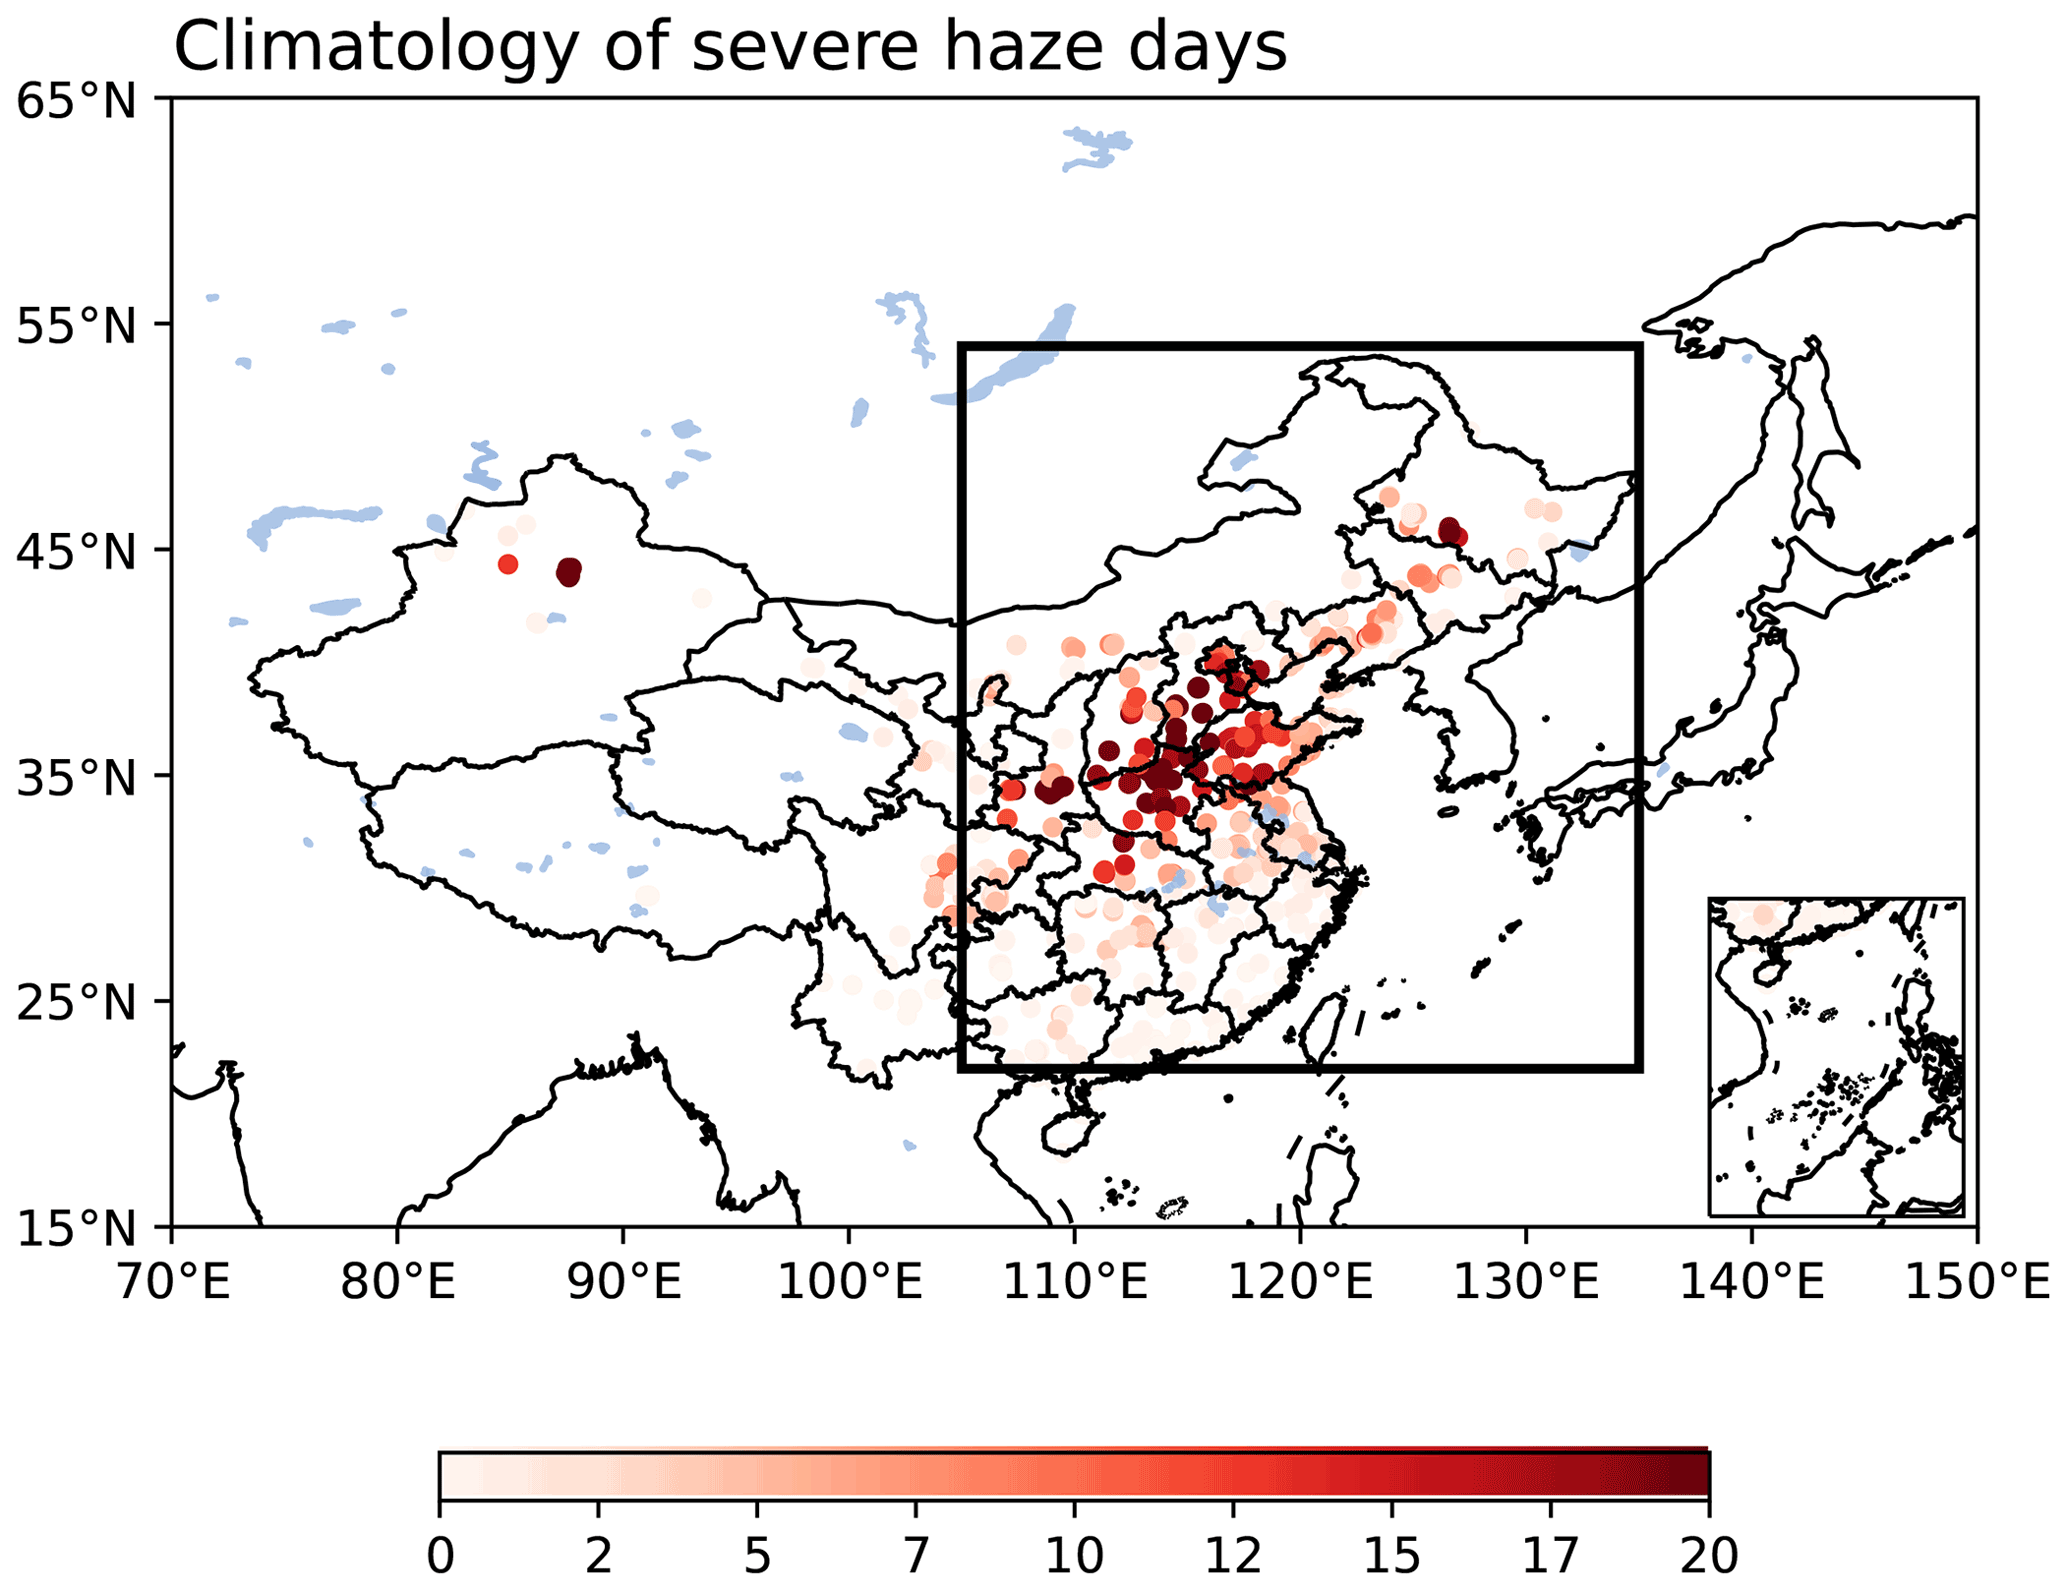
Figure 1Spatial distribution of the annual averaged severe haze days (unit: day) in China from 2014 to 2021 in NDJF. The black box represents EC.
2.3 Definition of blocking index
In winter, the anticyclonic anomaly over the Sea of Okhotsk, usually related to atmospheric blocking, may lead to haze accumulation (Yun and Yoo, 2019; Hwang et al., 2022). Thus, based on previous studies (Tibaldi and Molteni, 1990; Fang and Lu, 2020), here we identify the blocking by northward gradients (GHGN) and southward gradients (GHGS) of Z500 at each grid point:
where ϕ=35, 37.5, …, 75∘ N; λ=70, 72.5, …, 160∘ E; and Δϕ=15∘. A given longitude is defined as “blocked” at a particular time when it satisfies the following conditions:
Based on these conditions, we can identify whether any grid in the range of 35–70∘ N is blocked at any time.
2.4 Plumb's wave activity flux
Here we use the wave flux of Rossby to show the propagation of wave energy (Plumb, 1985). The two-dimensional Plumb’s wave activity flux (WAF) can be expressed by
In Eq. (3), Fs (unit: m−2 s−2) denotes the horizontal stationary wave activity flux; P means the pressure; P0 = 1000 hPa; u′ and v′ are the zonal and meridional wind deviation, respectively; ϕ′ is the geopotential height; φ (λ) represents the latitude (longitude); a is the radius of Earth; and Ω means Earth's rotation rate.
2.5 Classification algorithm of synoptic atmospheric circulation
This paper uses the hierarchical clustering algorithm (HCA) to classify the severe HDEC based on the associated circulation anomalies. Based on the HCA (Rokach and Maimon, 2005), we could create a clustering tree of data samples by calculating the Euclidean distance between different categories. The original data samples of different types are at the lowest level of the tree, and the root point of a cluster is at the top level of the tree.
Unlike Li et al. (2022), we only cluster the circulation anomalies of days with severe HDEC. It could ensure that the PM2.5 at least one station in EC of each sample exceeds the standard of severe haze pollution. Secondly, the circulation samples selected are not in a fixed region, but the rectangular regions of the same size are centered on each station with severe haze. Since the upper-level circulation represented by 500 hPa GPH anomalies play an important role in the generation and accumulation of haze (Wang et al., 2015; Yin and Wang, 2017; Zhong et al., 2019), the GPH anomalies at 500 hPa in a rectangular region of 30∘ from east, west, north, and south with each station as the center on the day of severe HDEC were taken as the samples to perform the HCA. It means that our classification results focus on the local circulation anomalies accompanied by haze, which can help us understand the impact of different local circulation patterns on different stations more accurately. Specifically, this clustering scheme can ensure that each station is located in the center of the circulation pattern when severe haze occurs and avoids the impact of circulation pattern movement. The final composite results of the same pattern can reflect the average statement of the current type of circulation anomaly, which is helpful to investigate its possible physical mechanism.
We use the silhouette coefficient to determine the optimal classification result (Rousseeuw, 1987). For any sample i, the silhouette coefficient s(i) is defined as
where a(i) means the average distance from sample i to all other samples in the cluster it belongs to, and b(i) means the lowest average distance from sample i to all samples in any other cluster. The silhouette coefficient of the clustering result is the average of the silhouette coefficients of all samples. The closer to 1, the better the classification results. Figure S1 shows the clustering tree and its associated silhouette coefficient of this study.
Figure 2a shows the composite anomalies of 500 hPa GPH during all severe HDEC in 853 stations. Generally, the stations with severe haze are located in the southwestern parts of the anticyclonic anomaly center, which is consistent with previous studies (Zhong et al., 2019; Wang and Zhang, 2020). We then performed the HCA as described in Sect. 2.5 and obtained three types of dominant local circulation anomalies associated with severe HDEC (Fig. 2b, c, d). Circulation Type1 shows a wave-train structure of “”, and the stations are located in the west of the anticyclonic anomaly and the south of the cyclonic anomaly. Circulation Type2 shows the circulation anomalies similar to Fig. 2a. Finally, circulation Type3 denotes that the stations are located south of the anticyclonic anomaly, and the intensity and range of the anticyclonic anomaly are significantly stronger than those of the other two patterns. The differences between the types imply that severe HDEC may be related to different causes.
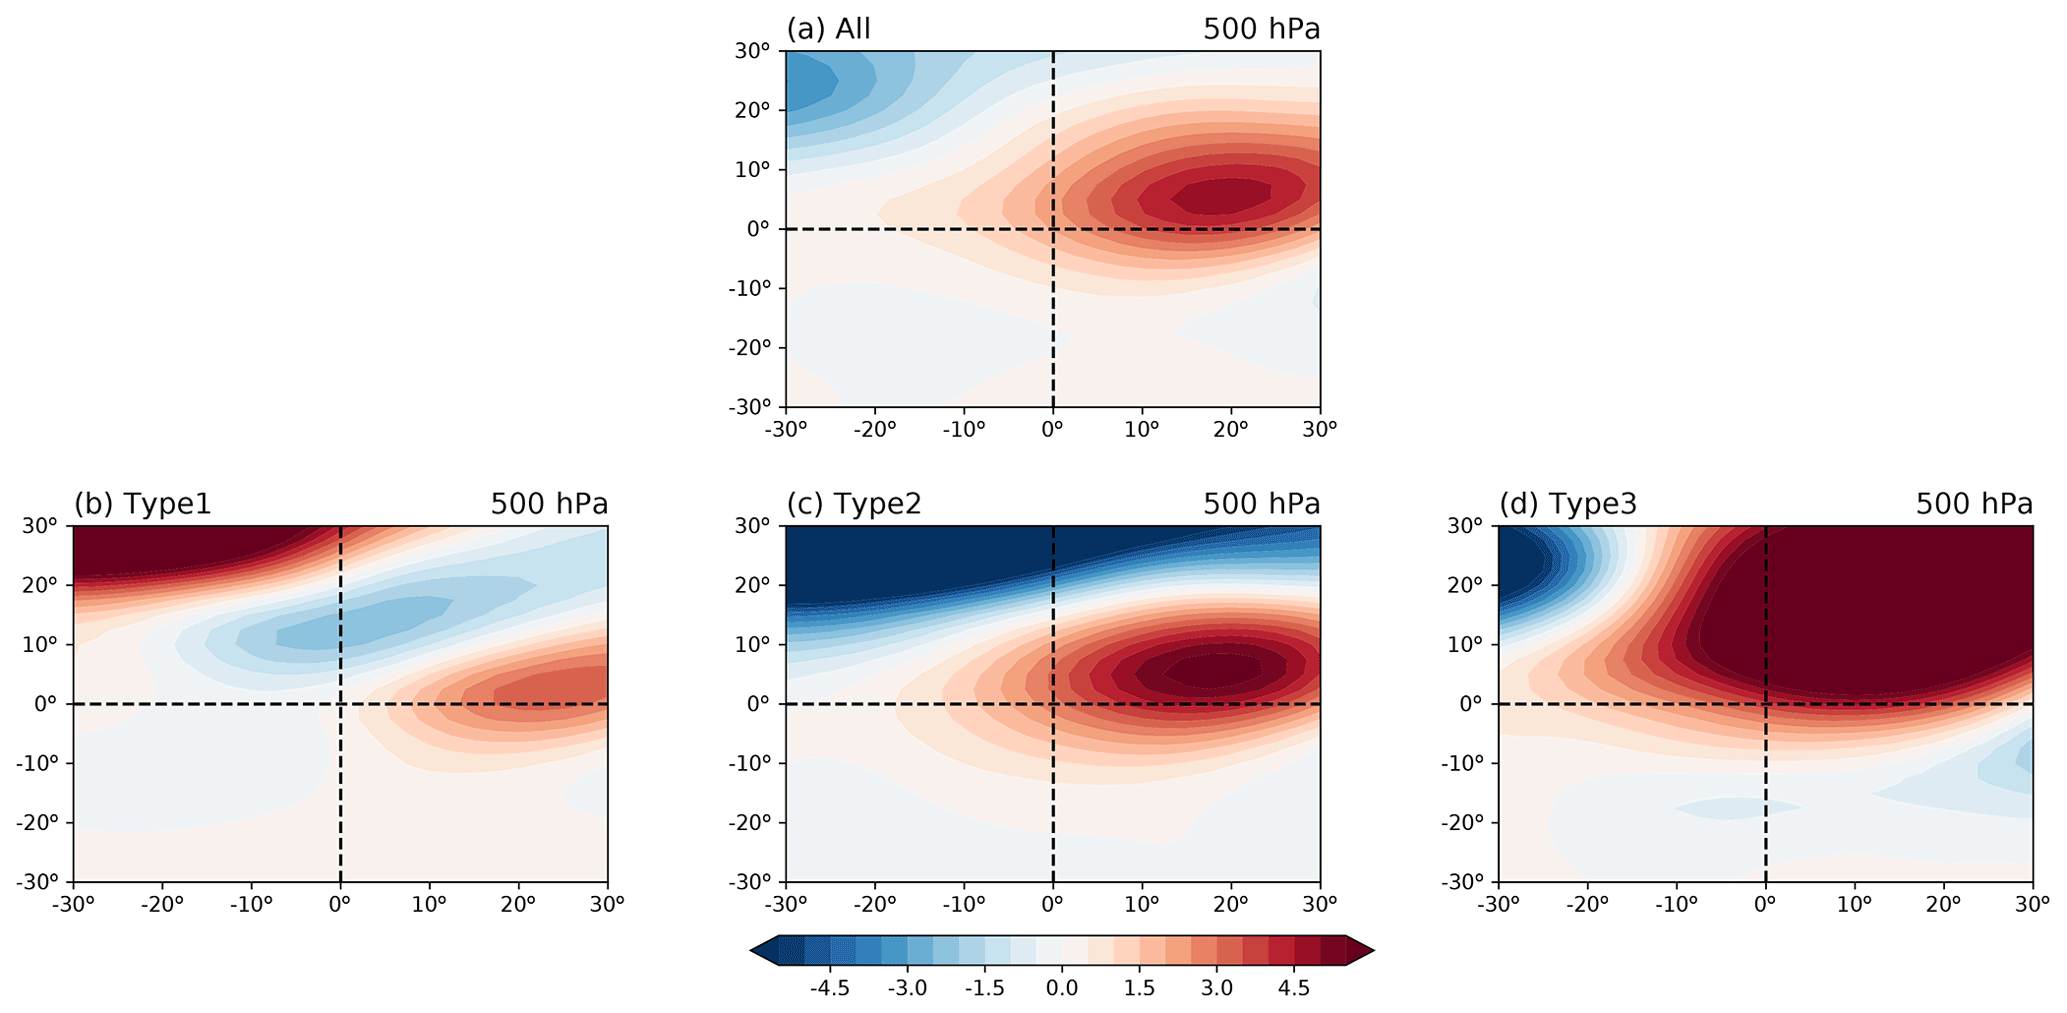
Figure 2(a) Composite anomalies of GPH at 500 hPa (units: gpm) during all severe HDEC in 853 stations. (0∘, 0∘) represents the location of stations. Panels (b), (c), and (d) are the same as (a) but for three sub-types.
For each station, when the probability of a certain circulation type is greater than the sum of the other two types, we define this as the dominant type of the station. Figure 3 shows the leading circulation types of severe HDEC for 853 stations and the weighted probability density distribution of three circulation types (the weight of each station is the probability of the corresponding dominant type occurring at the station). Stations dominated by circulation Type1 are mainly distributed in the Yangtze River valley (YRV). The stations dominated by circulation Type2 cover almost the whole EC, with two centers in south China (SC) and the Beijing–Tianjin–Hebei region. The stations dominated by circulation Type3 are mainly located in northeast China (NEC). In general, the stations in the north of EC are accompanied by higher PM2.5 concentrations and more haze days (Fig. S2). These results suggest significant differences in the circulation patterns of severe haze in different regions of EC.
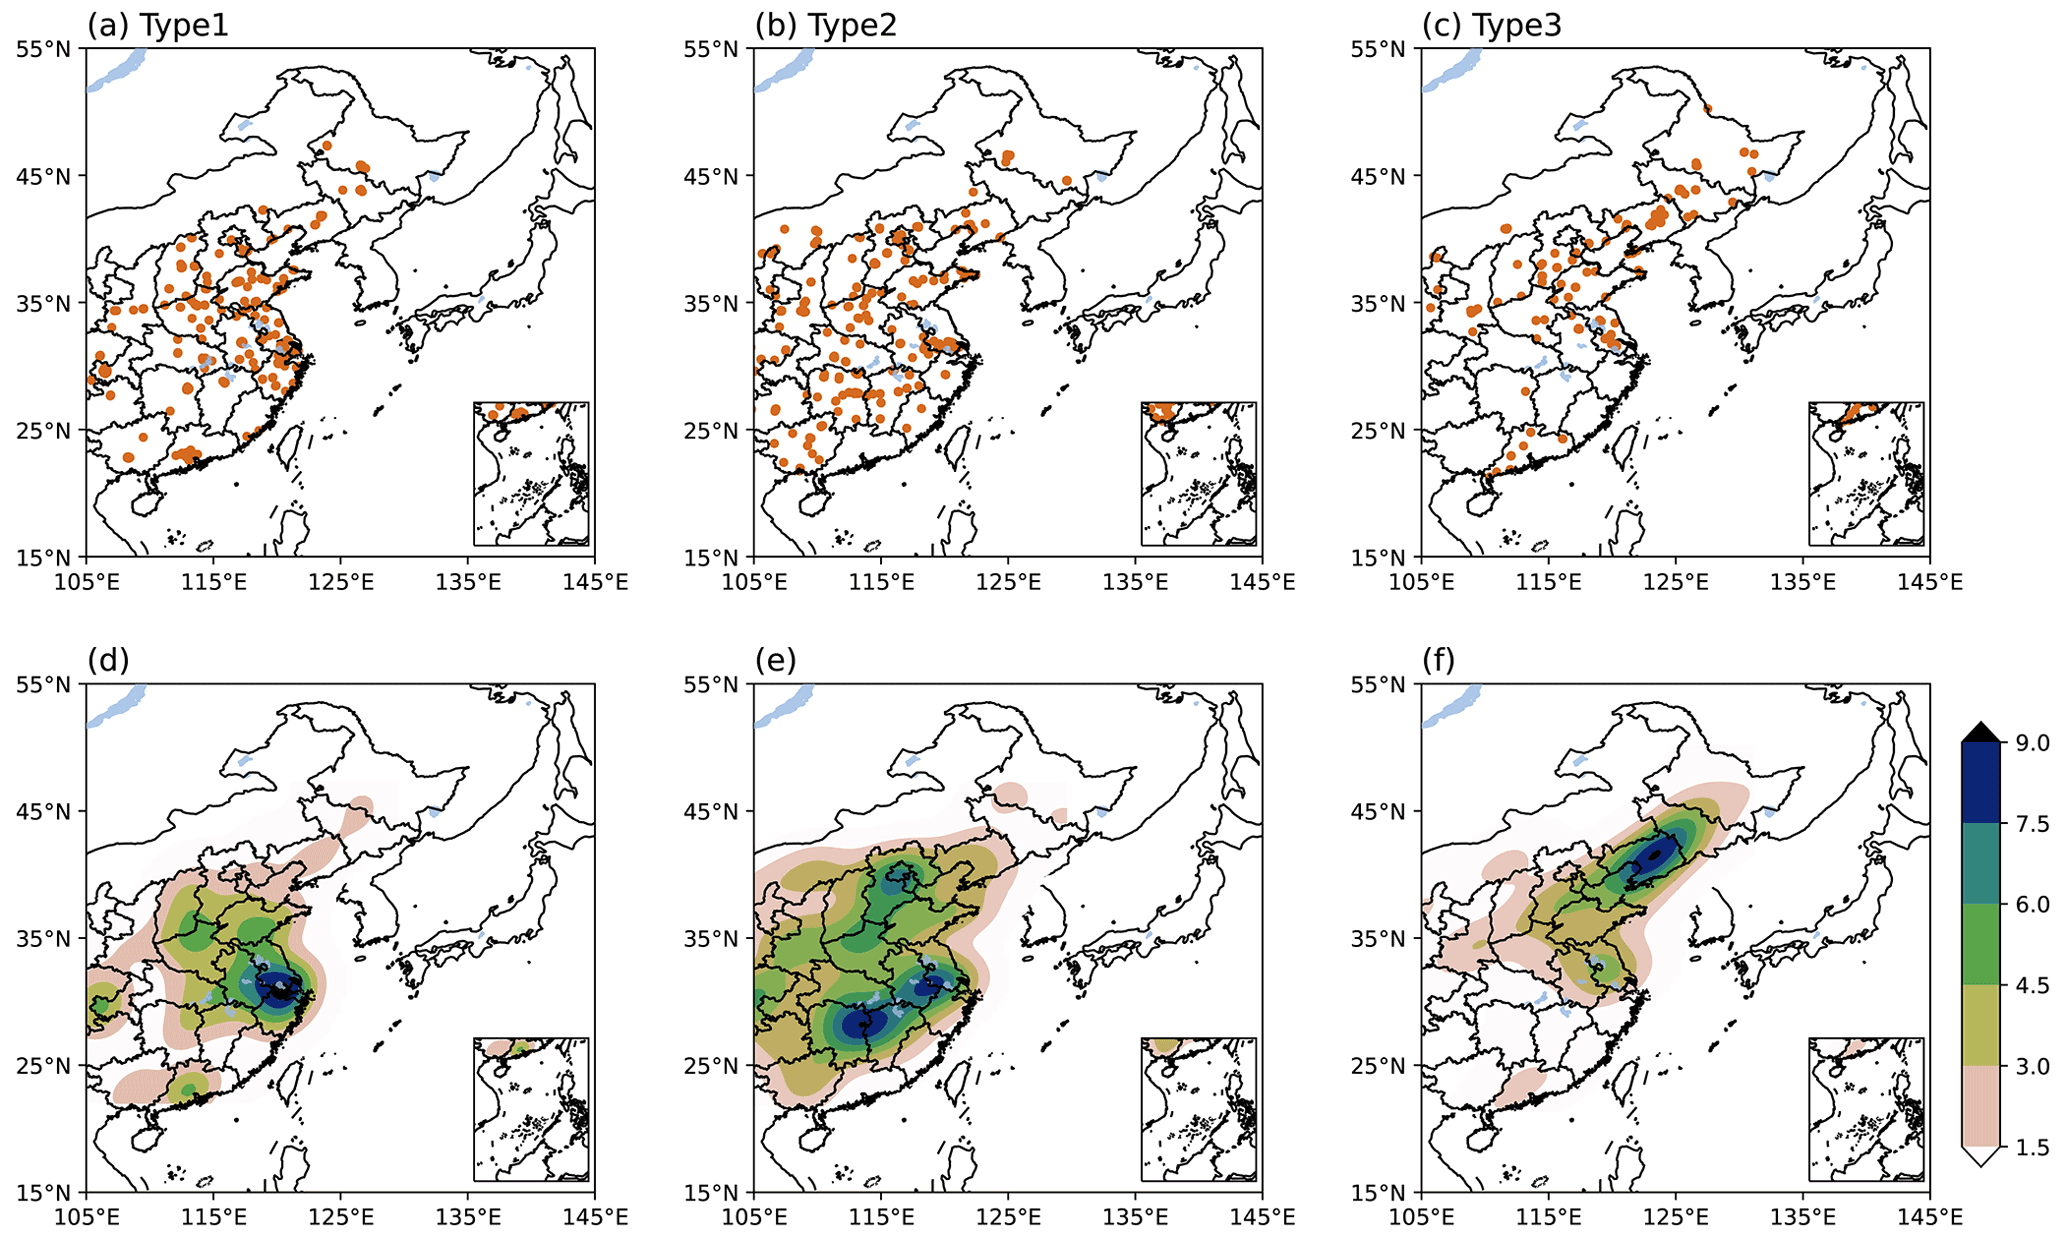
Figure 3Distribution of stations dominated by (a) Type1, (b) Type2, and (c) Type3 synoptic circulation patterns. Weighted probability density distribution of stations dominated by (d) Type1, (e) Type2, and (f) Type3 synoptic circulation patterns.
Figure 4a, b, and c show the composite anomalies of circulation Type1 at 500 and 850 hPa. Circulation Type1 is associated with the upper troposphere's wave-train structure of “”. Unlike previous studies (Zhong et al., 2019; Wang and Zhang, 2020), there are no significant anticyclonic anomalies in the mid-troposphere over the YRV, but there is a substantial northerly wind component in the lower troposphere over northern China. The TIP, sinking movement, and RH anomalies over the YRV are weak (Fig. 4d, e, f). Therefore, it can be inferred that it is not the local circulation anomalies that promote the formation and accumulation of haze pollution but the regional haze transportation caused by the northerly wind component anomalies that leads to the severe haze in the YRV.
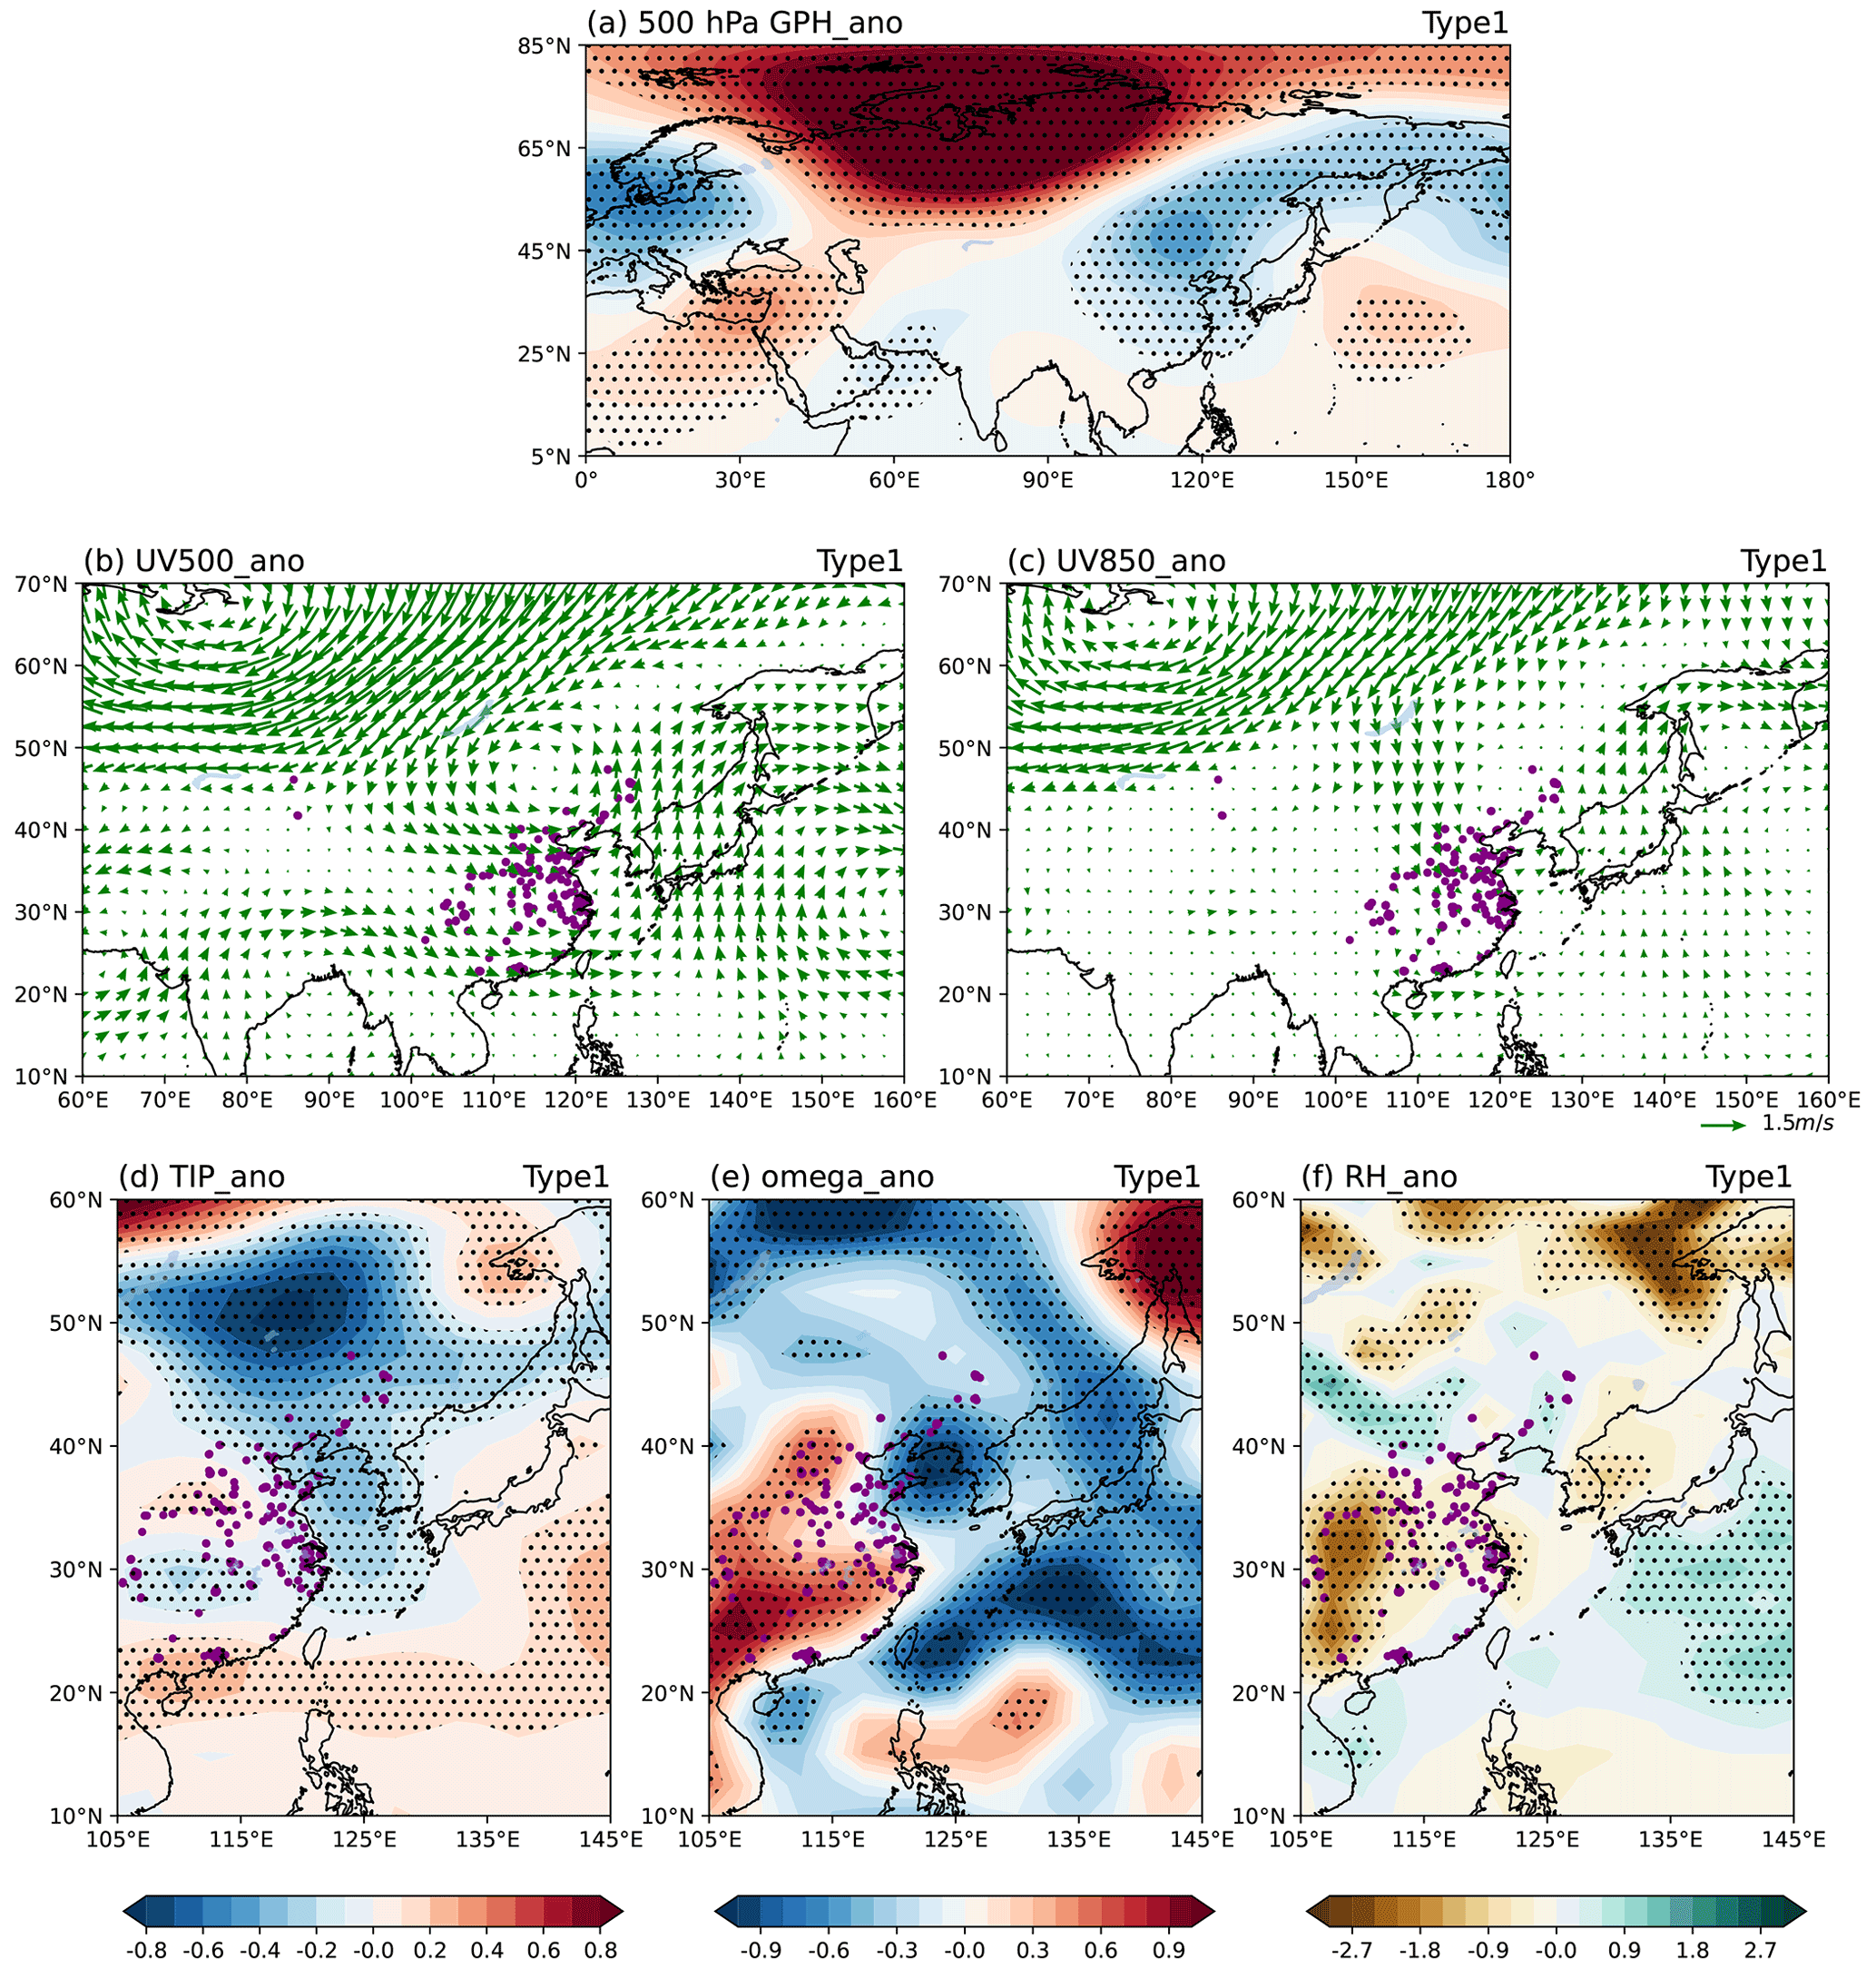
Figure 4Composite anomalies of (a) GPH at 500 hPa (unit: gpm), horizontal wind (unit: m s−1) at (b) 500 hPa and (c) 850 hPa, (d) TIP (unit: K), (e) omega (unit: 10−2 Pa s−1), and (f) RH (unit: %) for circulation Type1. Dotted areas are statistically significant at the 95 % confidence level. The purple dots represent the stations dominated by circulation Type1.
To further explore the relationship between Type1 severe HDEC and northerly wind component anomalies, we present the evolution of PM2.5 concentration variations (PM2.5 concentration on Dayi minus that on Dayi−1) from −3 to 2 d of Type1 severe HDEC occurrences (Fig. 5a, b, c, d, e) and the corresponding horizontal wind variations at 500 hPa (Fig. 5 f, g, h, i, j). PM2.5 concentrations tend to increase at first and then dissipate, showing an obvious transportation process from north to south. Accordingly, the horizontal wind changes from anticyclonic anomalies to cyclonic anomalies, with the south wind turning to the north wind. Here we average the PM2.5 concentration variations in Fig. 5a, b, c, d, e and meridional wind variations in Fig. 5f, g, h, i, j along latitudes (Fig. 5k, l, m, n, o). The result shows that PM2.5 concentrations gradually increased from north EC to south EC and began to decrease after severe HDEC occurred. With the variation in PM2.5 concentrations, the south wind in north EC gradually weakens and turns to a north wind when severe HDEC occurs. With the dry and cold air from the north invading southward, the haze dissipates rapidly, and EC can maintain high air quality weather. Therefore, although circulation Type1 will lead to severe haze in the YRV, its circulation anomalies do not match the conditions to maintain haze pollution.
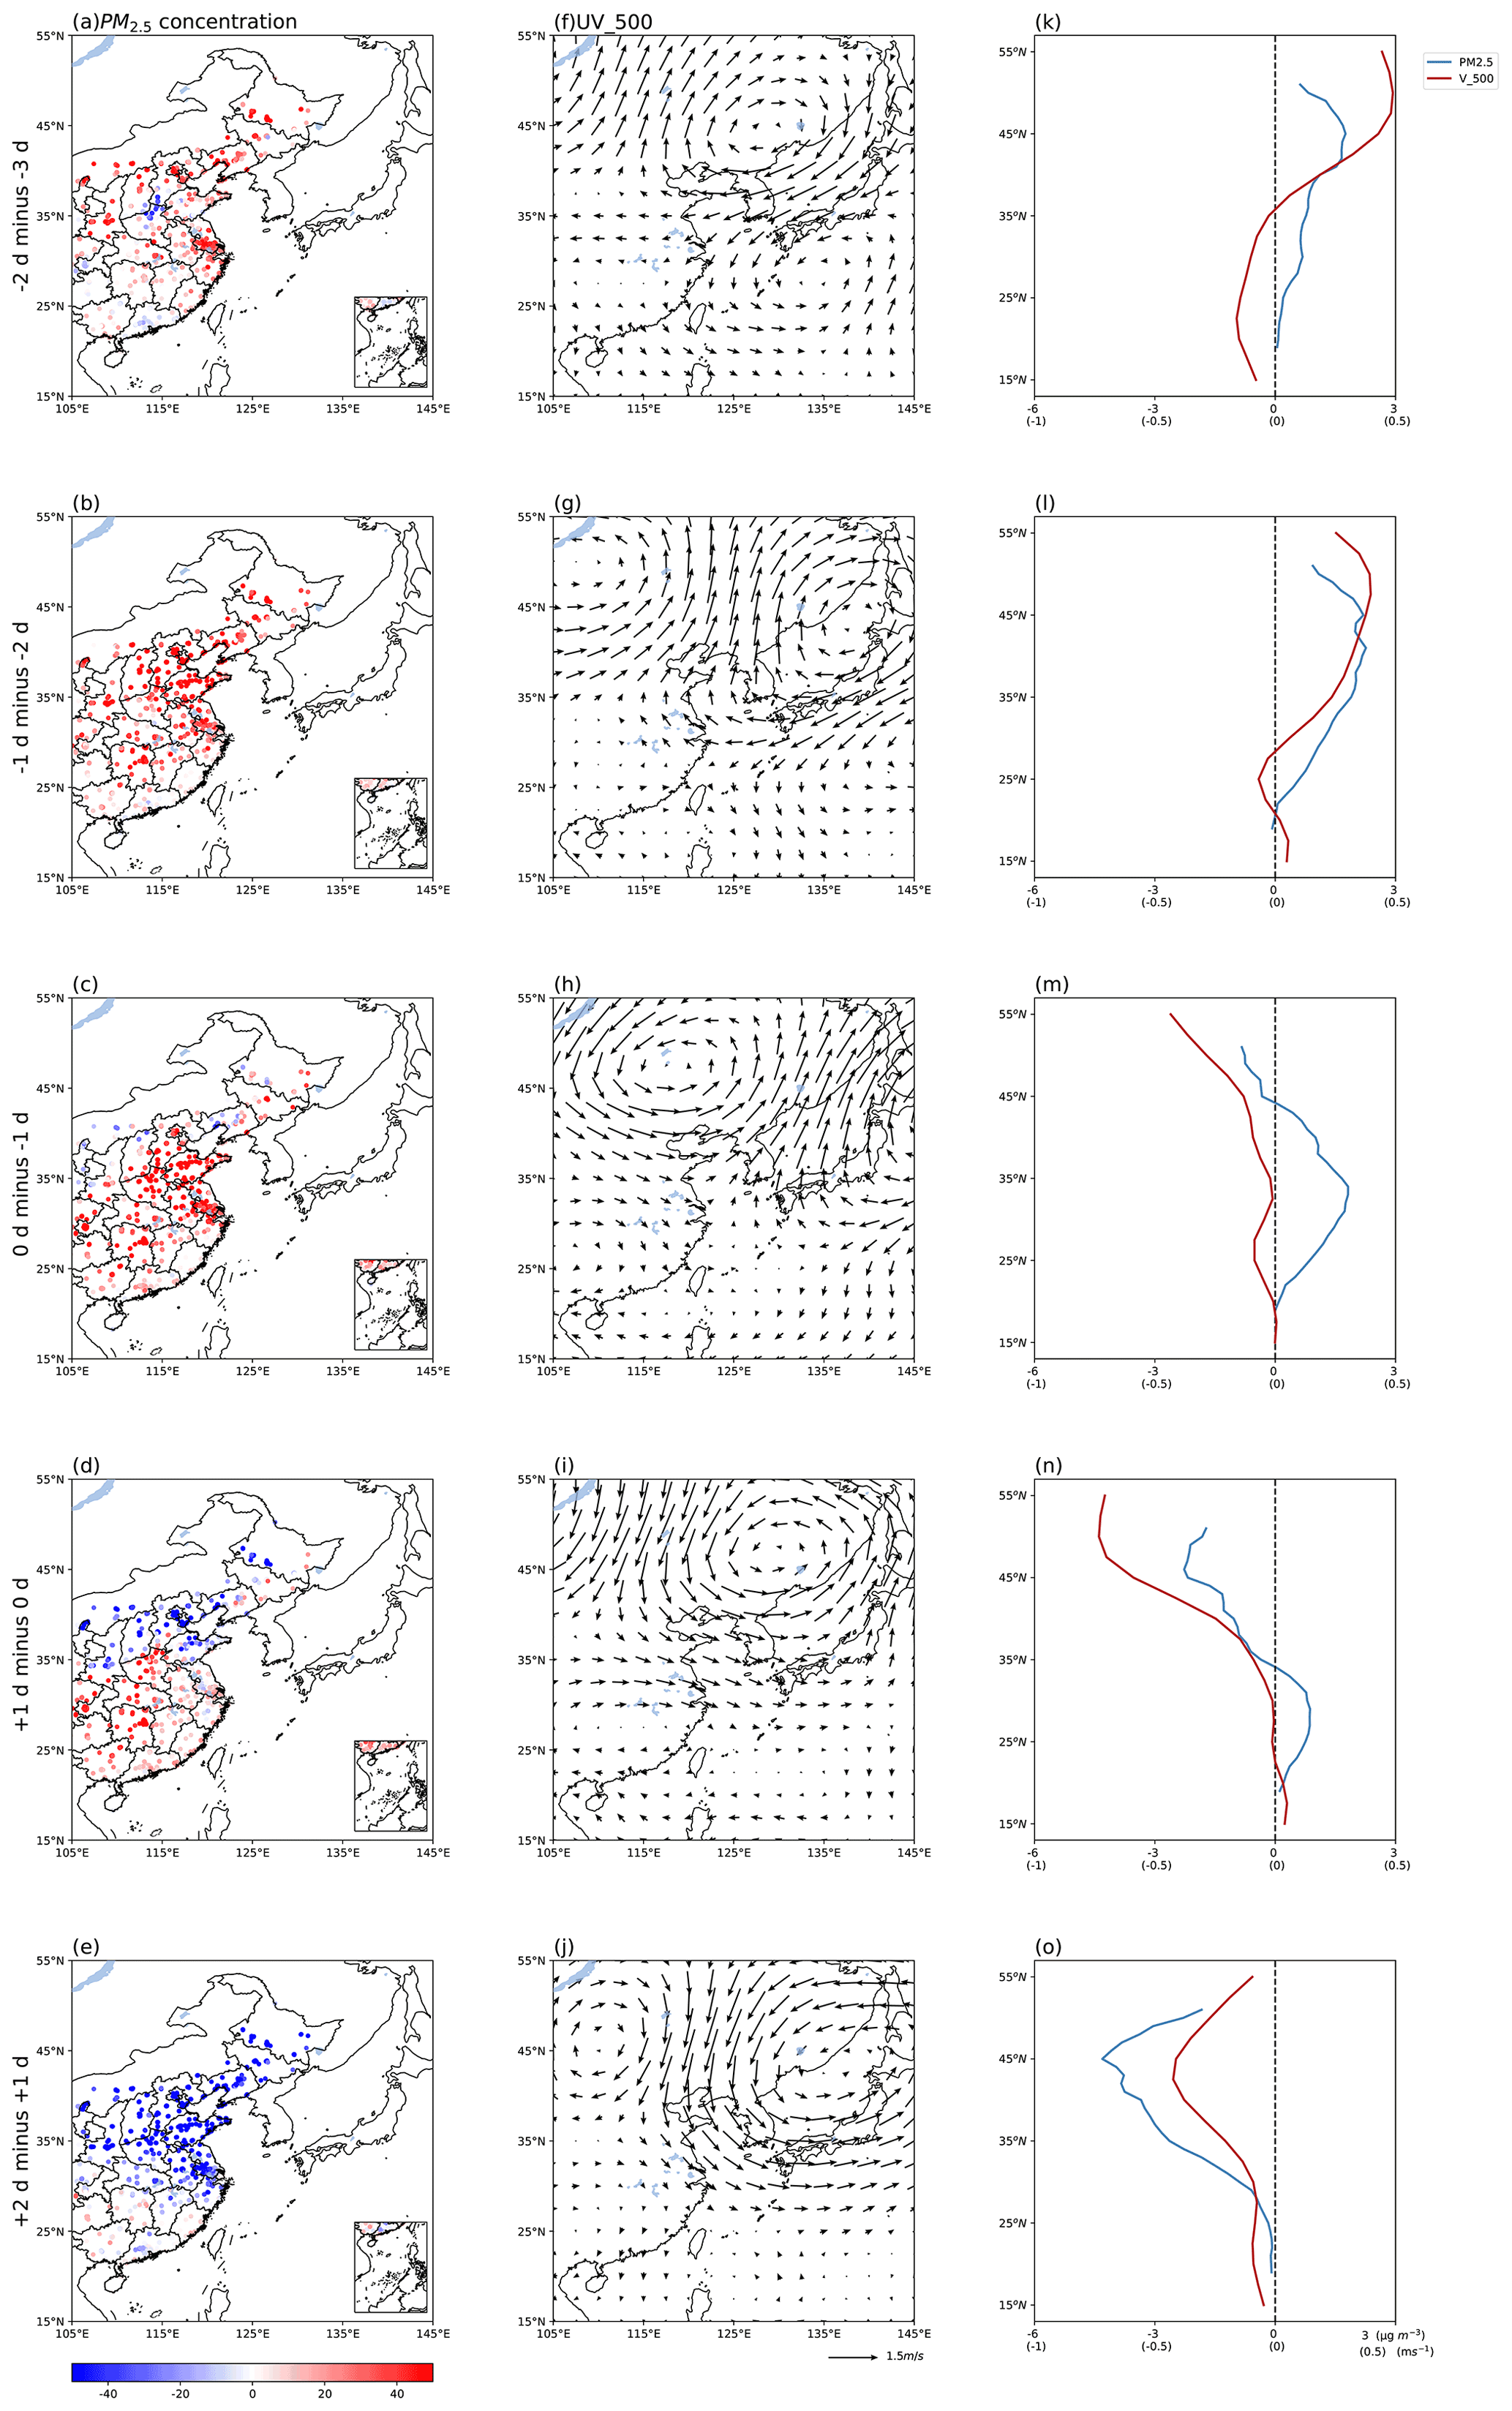
Figure 5Composite anomalies of (a–e) the spatial distribution of PM2.5 concentrations (unit: µg m−3) from −3 to 2 d related to Type1 severe HDEC occurrences and (f–j) the corresponding horizontal wind (unit: m s−1) at 500 hPa. Panels (k)–(o) show the zonal averaged PM2.5 concentration variations (unit: µg m−3) and meridional wind variations (unit: m s−1) in the range of 15–55∘ N, 105–135∘ E.
During the occurrence of circulation Type2, there was an anticyclonic anomaly with a quasi-barotropic structure over northeast Asia, and EC was located in the southwest of the anticyclone (Fig. 6a, b, c). The significant positive TIP, sinking movement, and positive RH anomalies control the region over EC (Fig. 6d, e, f). With the increase in TIP and the warm, humid air from the sea that is transported to EC, the horizontal and vertical dispersion of pollutants was restrained, while higher-surface RH exacerbated the formation of particulates. Such circulation anomalies are beneficial for the formation and maintenance of haze pollution.

Figure 6Composite anomalies of (a) GPH at 500 hPa (unit: gpm), horizontal wind (unit: m s−1) at (b) 500 hPa and (c) 850 hPa, (d) TIP (unit: K), (e) omega (unit: 10−2 Pa s−1), and (f) RH (unit: %) for circulation Type2. Dotted areas are statistically significant at the 95 % confidence level.
Here we investigate the dynamic mechanism of circulation Type2 by compositing the GPH and WAF anomalies in the upper troposphere. The circulation anomalies show two quasi-zonal wave trains over the mid–high latitudes. One is characterized by a “” pattern of GPH anomalies from the south of Greenland across Siberia to northeast China, with positive GPH anomalies in the second and fourth centers. Such anomalies are similar to the positive phase of EA/WR teleconnection, which can strengthen stable weather conditions over EC (Wu et al., 2016; Yin and Wang, 2016) by causing weak wind speed, higher RH, and strong TIP (Niu et al., 2010; Ding and Liu, 2014; Cai et al., 2017). Figure 7c shows the correlation coefficients between PM2.5 concentrations during the occurrence of circulation Type2 and the EA/WR index. (The EA/WR index was computed by the NOAA Climate Prediction Center according to the rotated principal component analysis used by Barnston and Livezey, 1987.) The results show significant positive correlations between the two in north EC and weak negative correlations in south EC. However, circulation Type2 caused severe HDEC for almost the whole EC, which is not completely consistent with the results of Fig. 7c. Therefore, we speculate that the other wave train may lead to haze pollution in south EC.

Figure 7Composite anomalies of (a) GPH (shading, gpm) and WAF (vectors, m2 s−2) at 300 hPa, and (b) GPH (shading, gpm) and horizontal wind (vectors, m s−1) at 850 hPa for Type2. Dotted areas are statistically significant at the 95 % confidence level. (c) Correlation coefficients between Type2 PM2.5 concentrations and the EA/WR index.
It was found that the second wave train reaches EC from Europe along with southern Asia, forming a “” pattern of GPH anomalies. The formation of such a wave train is closely related to the winter East Asia subtropical jet (EASJ) (Xiao et al., 2016; An et al., 2020; Zhang et al., 2022). Here we use an empirical orthogonal function (EOF) analysis of zonal wind from 1980 to 2021 to determine the leading modes of winter EASJ (Xiao et al., 2016). The variance of the first mode (EOF1) accounts for 57.4 % of the total variance and indicates the intensity of EASJ (Fig. 8a), which could significantly affect the haze pollution in EC (An et al., 2020; Zhang et al., 2022).
The correlation coefficients between daily PM2.5 concentrations and the first principle component (PC1_jet) during the occurrence of circulation Type2 are shown in Fig. 8b, which have significant positive correlations in south EC and negative correlations in north EC. It indicates that circulation Type2 may cause severe haze pollution in most areas of EC under the joint affection of EA/WR teleconnection and winter EASJ. The results suggest that when discussing the impact of an anticyclonic anomaly in northeast Asia on haze pollution in EC, we should comprehensively consider the joint affection of signals from high and middle latitudes.
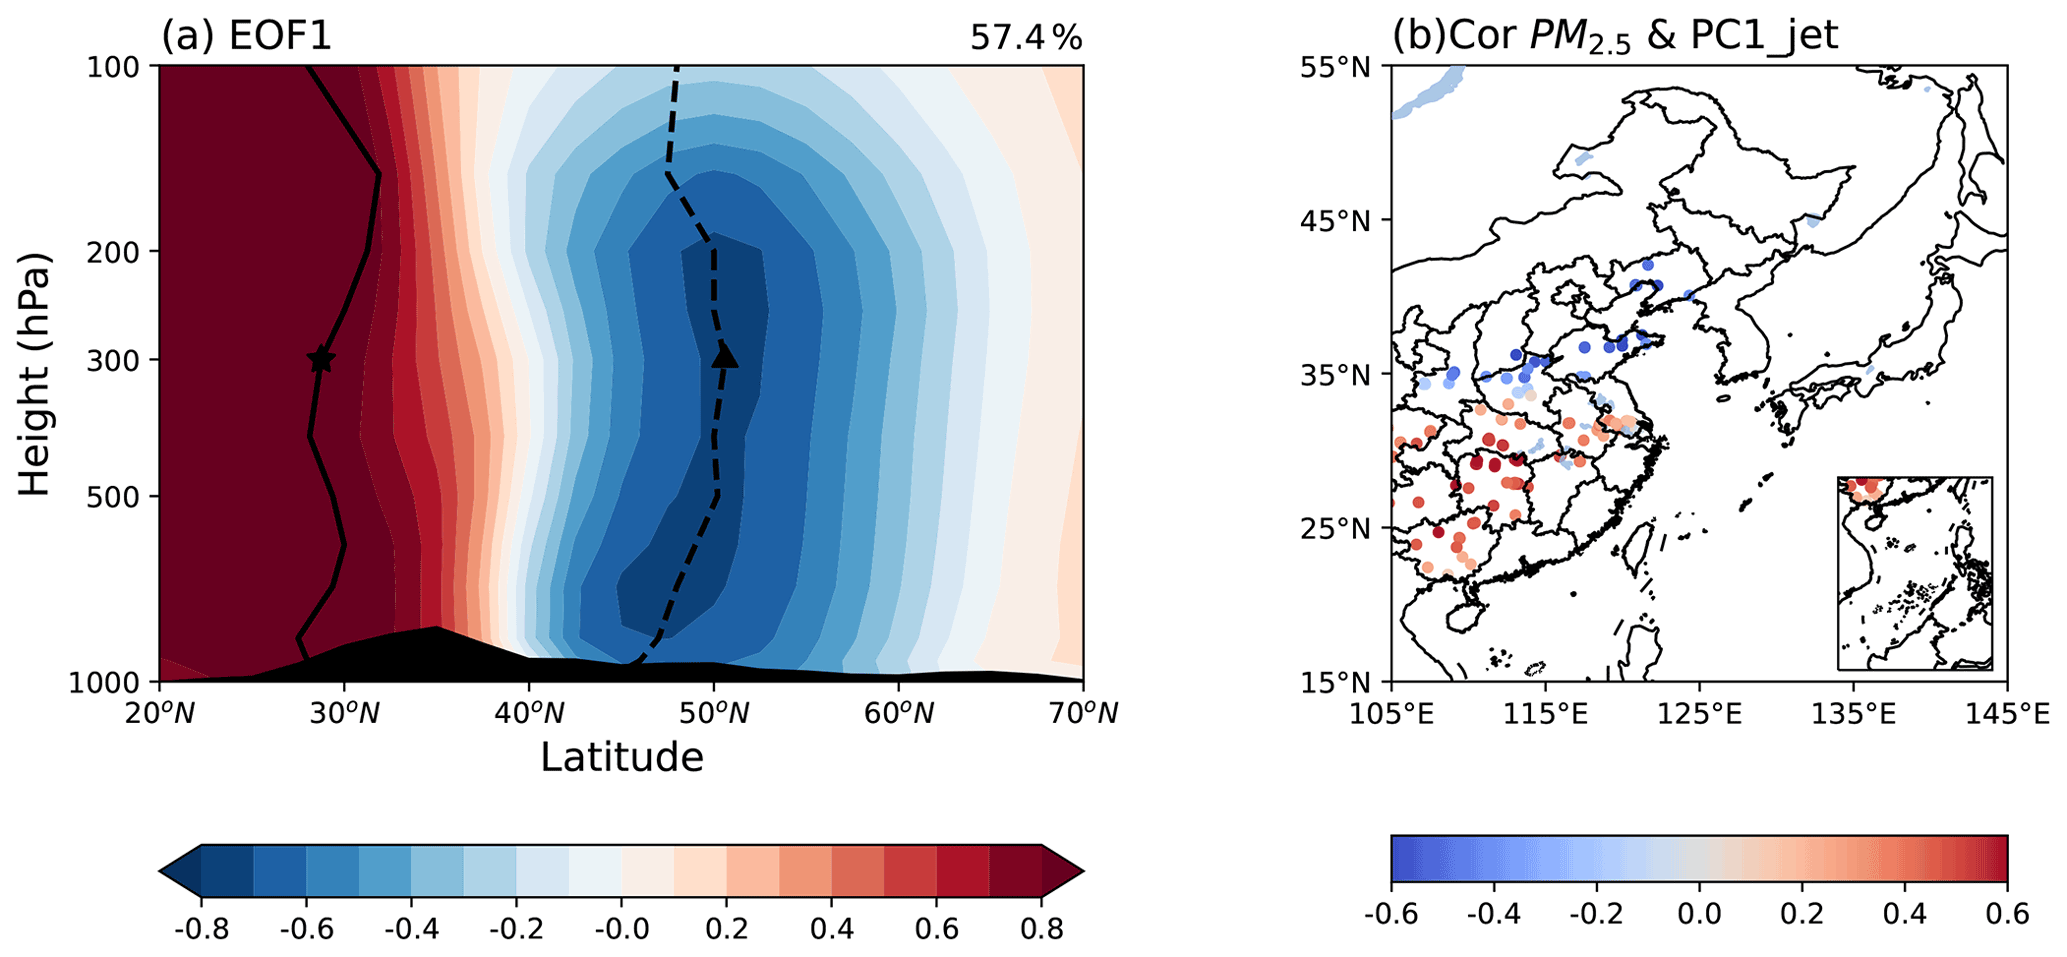
Figure 8(a) The first EOF mode of zonal wind (EOF1, m s−1) averaged from 60 to 160∘ E in NDJF. The star and triangle at 300 hPa denote the subtropical jet and polar-front jet cores, respectively. The zonal mean orography is dark-shaded. (b) Correlation coefficients between Type2 PM2.5 concentrations and PC1_jet.
Compared with circulation Type2, the range and intensity of anticyclonic anomalies in northeast Asia in circulation Type3 are more robust, and the location is more northerly (Fig. 9a). Such circulation anomalies lead to southeasterly wind anomalies at 850 hPa, strong TIP, and abundant moisture that induces severe haze over NEC (Fig. 9d, f). In addition, the ascending motion over south EC and the descending motion over the Beijing–Tianjin–Hebei region and NEC formed meridional circulation cell anomalies (Fig. 9e), which are conducive to the accumulation of severe HDEC over the NEC.

Figure 9Composite anomalies of (a) GPH at 500 hPa (unit: gpm), horizontal wind (unit: m s−1) at (b) 500 hPa and (c) 850 hPa, (d) TIP (unit: K), (e) omega (unit: 10−2 Pa s−1), and (f) RH (unit: %) for circulation Type3. Dotted areas are statistically significant at the 95 % confidence level.
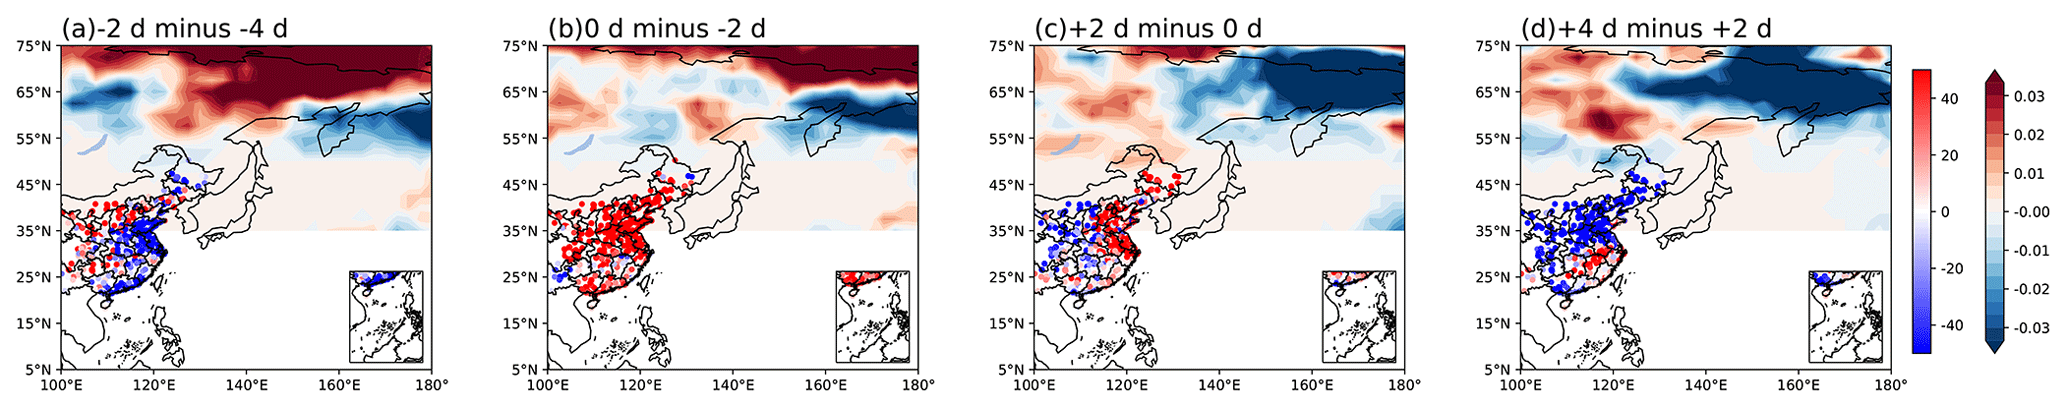
Figure 10Composite anomalies of (a–d) the spatial distribution of PM2.5 concentration variations (unit: µg m−3) and blocking from −4 to 4 d related to Type3 severe HDEC occurrences.
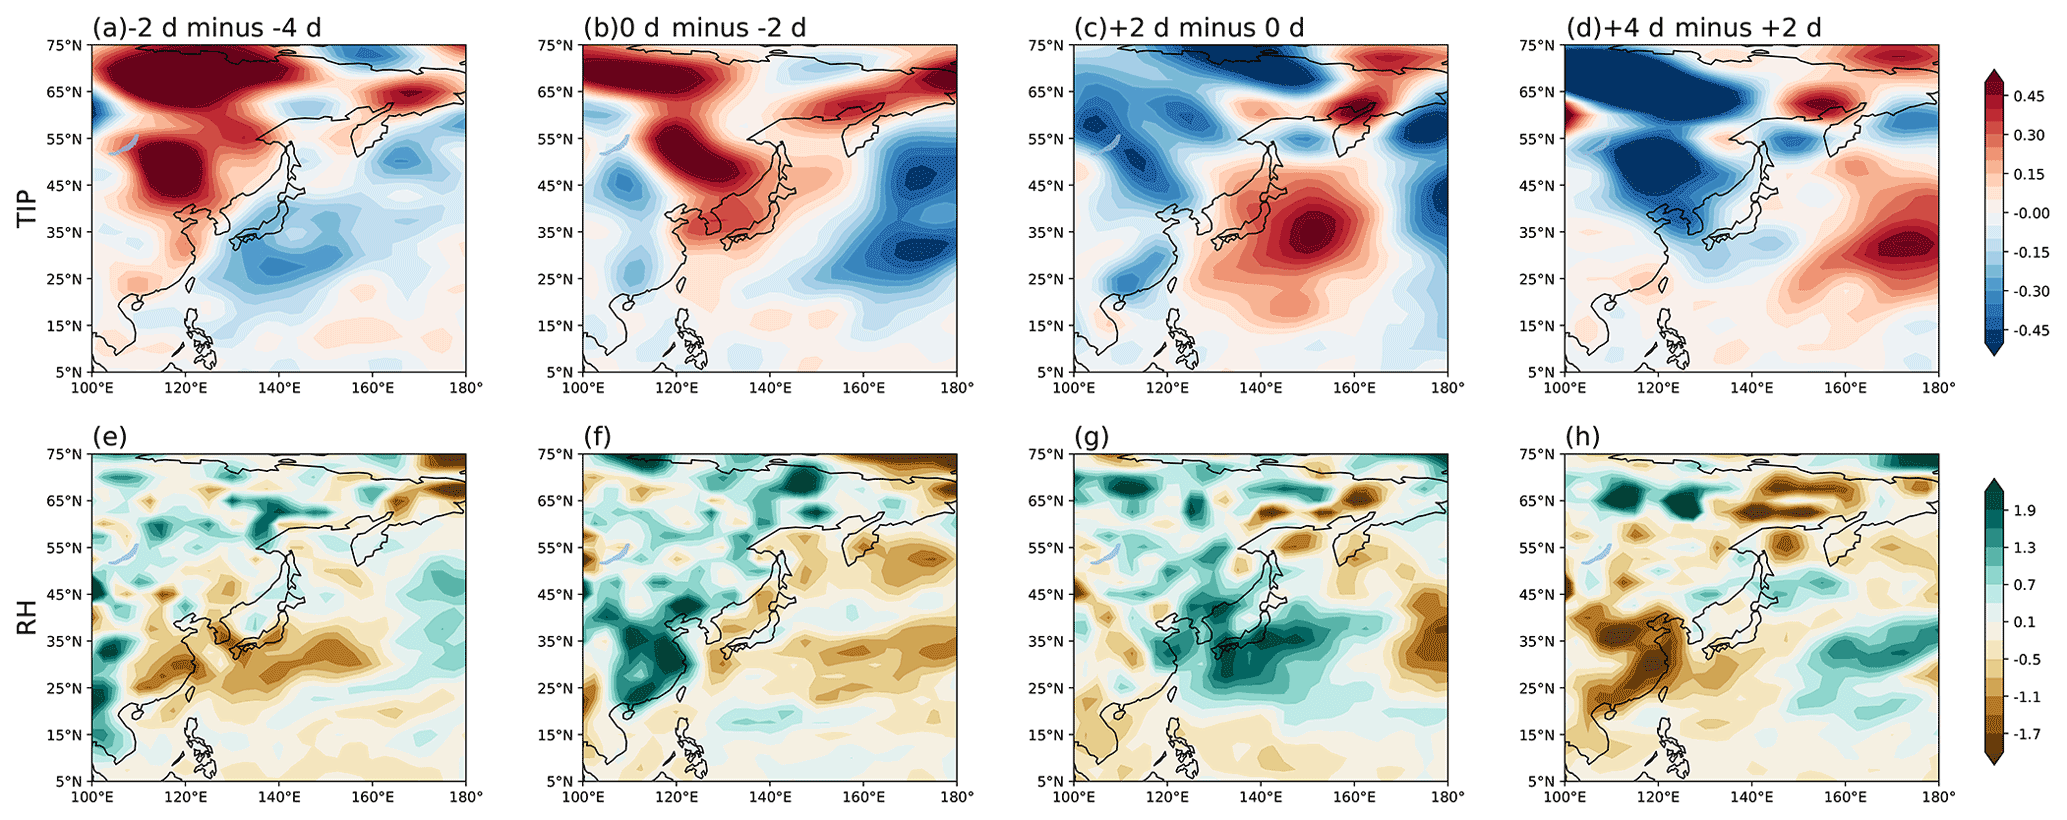
Figure 11Composite anomalies of (a–d) TIP variations (unit: K) and (e–h) RH variations (unit: %) from −4 to 4 d related to Type3 severe HDEC occurrences.
In winter, the anticyclonic anomalies over the Sea of Okhotsk are usually related to atmospheric blocking (Yun and Yoo, 2019; Fang and Lu, 2020; Hwang et al., 2022). Therefore, we calculated the daily atmospheric blocking introduced in Sect. 2.3 to investigate its relationship with Type3 severe HDEC. Figure 10 shows that when Type3 severe HDEC occurs, the PM2.5 concentration increases with the blocking anomalies in the high-latitudes build-up, dissipating with the blocking anomalies' crash. The blocking anomalies strengthen the TIP and provide sufficient RH in the lower atmosphere (Fig. 11), causing severe HDEC in NEC.
Based on previous studies and the differences in the influence ranges of the three circulations types in this study, we divided EC into NEC (40–54∘ N, 105–135∘ E), north China (NC; 33–40∘ N, 105–122∘ E), the YRV (27–33∘ N, 105–122∘ E), and SC (22–27∘ N, 105–122∘ E) to analyze the temporal characteristics of three HDEC types in different subregions of EC (Fig. 12a). Figure 12b, c, d, and e display the annual regional-averaged frequency of the three HDEC types in the four subregions. The results show that severe haze pollution mainly occurs in NC and less in SC. The frequency of severe haze generally shows a downward trend in the four subregions.

Figure 12(a) The four subregions of EC. The purple dots are the stations. (b–e) Frequency of three types of cool season severe HDEC in NEC, NC, YRV, and SC.
We further calculate the proportion of the frequency of each circulation type in the total annual severe haze frequency in the four subregions (Fig. 13). For NEC, the proportion of the three circulation types is almost equal. It should be noted that the proportion of circulation Type3 is much larger than in the other three subregions. In NC, the proportion of circulation Type1 is more than 40 %, while the proportion of circulation Type3 is about 20 %. For the YRV, circulation Type1 and Type2 lead the severe haze pollution. There is relatively little severe haze pollution in SC. Therefore, the dominant circulation type in SC has a strong interannual variation and is hardly affected by circulation Type3. Overall, on a weather scale, the HDEC is affected by a variety of synoptic circulations, and the areas affected by each synoptic circulation are also different.
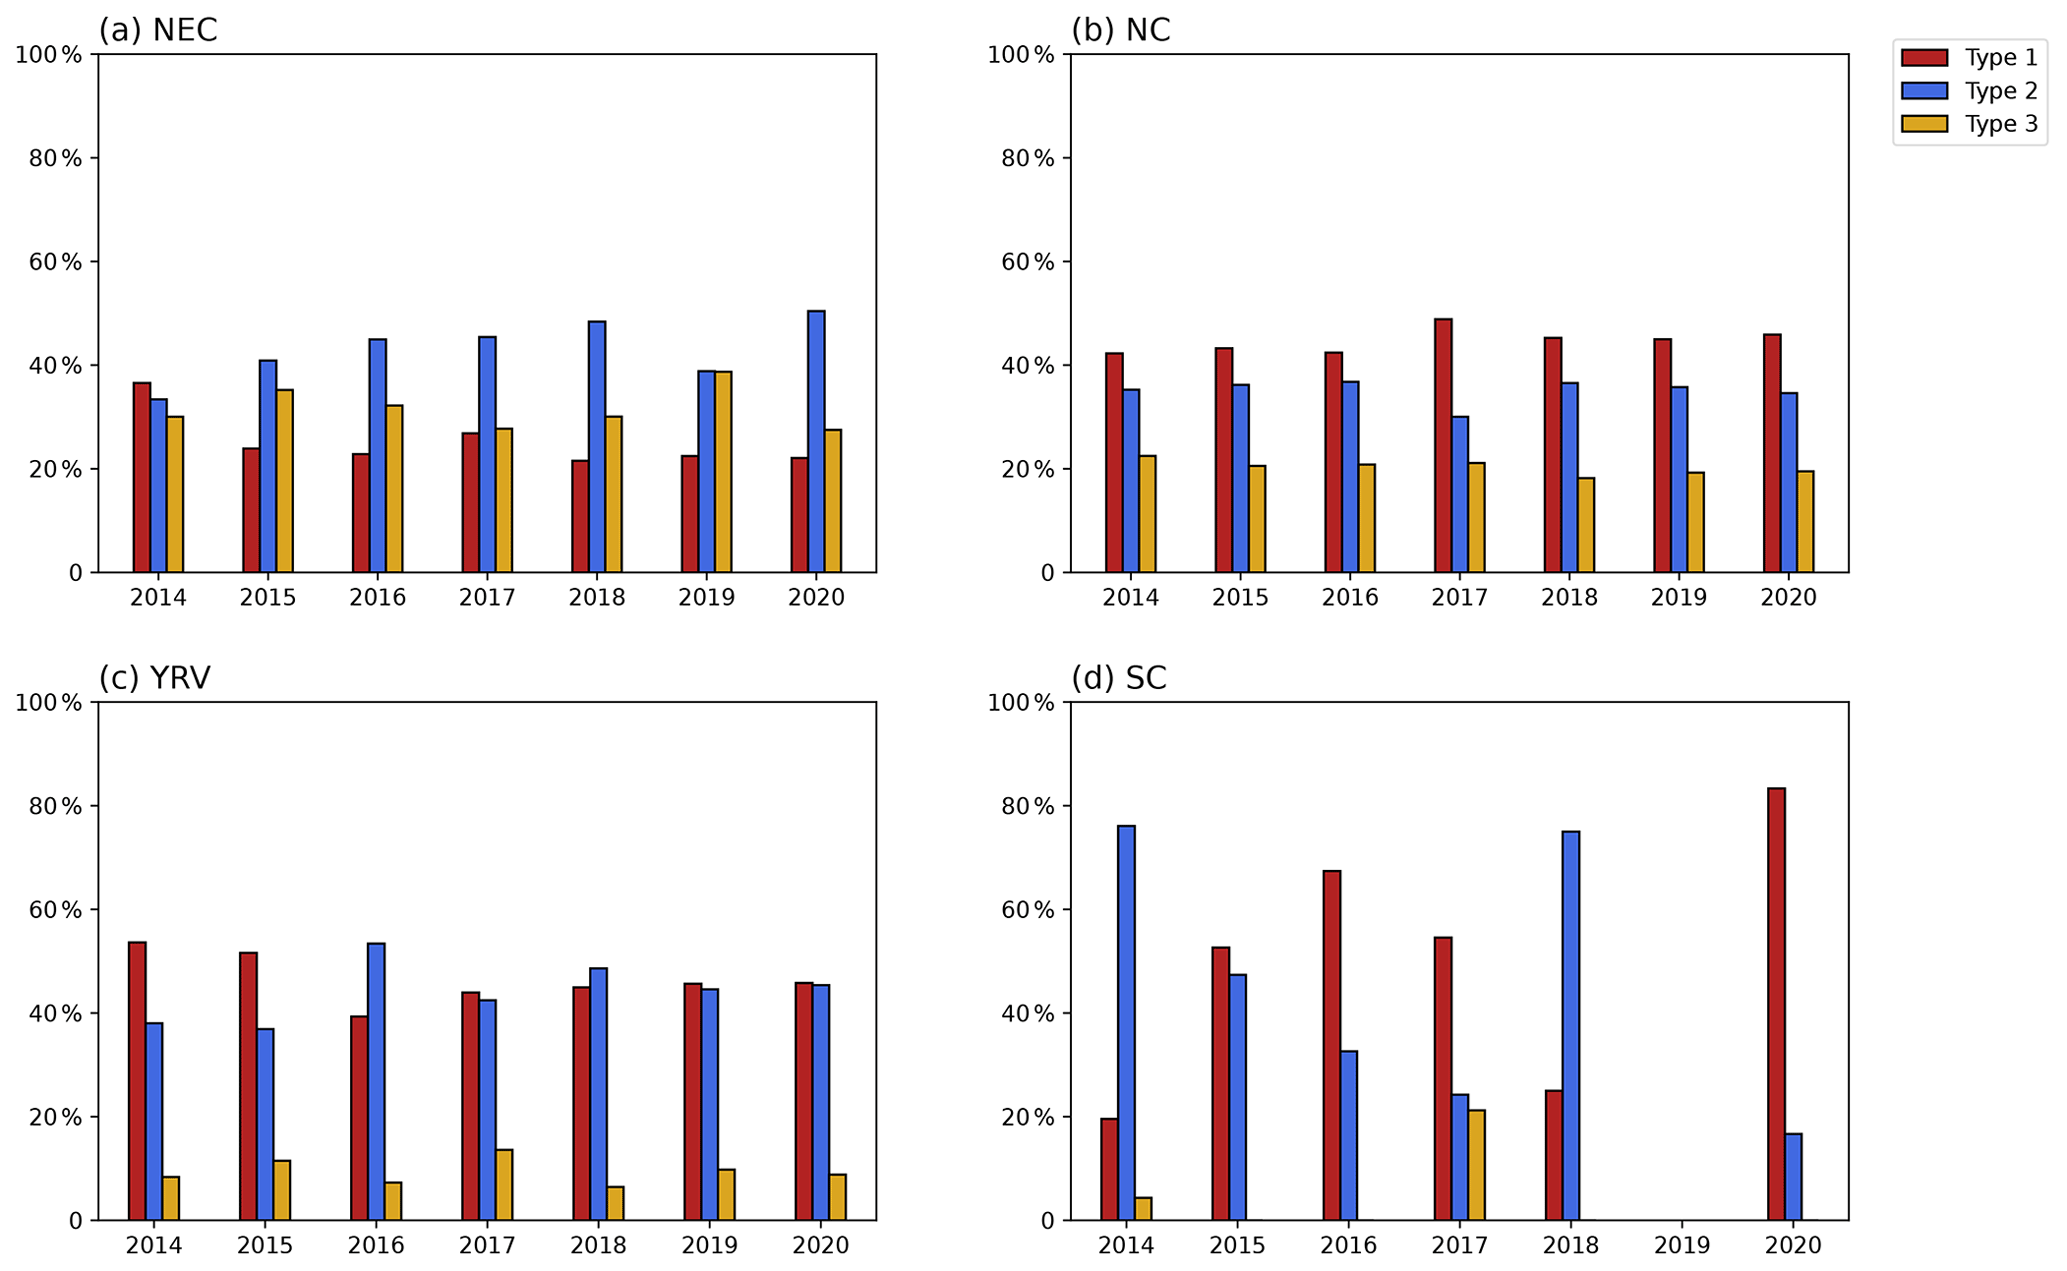
Figure 13Annual percentage of the three types of severe HDEC in (a) NEC, (b) NC, (c) the YRV, and (d) SC.
In this study, the HCA was used to investigate three dominant circulation types that could lead to severe HDEC. We clustered the circulations over the stations in EC on severe haze days from 2014 to 2021, which eliminated the interference of the circulations of non-severe haze days on the cluster results. The results show that three dominant circulation types associated with severe HDEC are obtained, which are mainly characterized by a local anticyclonic anomaly but also present obvious spatial variation on large-scale circulations. Circulation Type1 with a wave-train structure of “” in the upper troposphere mainly causes severe haze pollution in the YRV through the low-level northerly wind anomalies over NC. Although the sinking movement, TIP, and RH anomalies over the YRV are weak or not significant, the regional haze transportation leads to severe haze in the YRV. Circulation Type2 is characterized by two quasi-barotropic Rossby wave trains at 300 hPa, which may be stimulated and sustained by the joint affection of the EA/WR teleconnection and the winter EASJ. One travels from the south of Greenland across Siberia to NEC, forming a “” pattern of GPH anomalies, and the other travels from Europe to southern Asia, forming a “” pattern of GPH anomalies, which led to an anticyclonic over northeastern Asia and is conducive to the accumulation of haze. Circulation Type3 is characterized by a blocking anomaly over the Sea of Okhotsk, which influences the severe HDEC over NEC with a southeasterly wind at 850 hPa, strong TIP, and abundant moisture. The temporal characteristics of the three circulation types in NEC, NC, the YRV, and SC were further analyzed. The result shows that on the synoptic scale, HDEC is affected by various synoptic atmospheric circulations, and the regions affected by each synoptic atmospheric circulation are also different.
The study shows that circulation patterns and key systems that contribute to severe HDEC are complex and diverse, revealing the dominant circulation patterns of severe haze in different regions of EC. These three dominant atmospheric circulation patterns could potentially be used to establish severe winter haze prediction models for different regions of EC (e.g., project the future variations of severe haze in different regions of EC by identifying similar circulation patterns through machine learning or regression fitting). Due to the limitation of data, it is difficult to carry out the work of circulation classification over a longer period. Therefore, whether there is an interannual or interdecadal connection between the dominant circulation types of severe haze and its key circulation system needs further investigation. In addition, considering the latitude difference of PM2.5 concentrations in EC and the decreasing of PM2.5 concentrations due to the implementation of the Air Pollution Prevention and Control Action Plan since 2013, the flexible threshold to identify haze days is suggested for use in further studies. We will further carefully compare the impact of emissions and meteorological factors on haze in subsequent work.
This study shows that different circulation types may lead to severe haze in different regions of EC, and further studies are needed to investigate whether there are differences in persistence or intensity among them.
The daily PM2.5 concentrations for 935 meteorological stations in China are collected from the China National Environmental Monitoring Centre archive at https://quotsoft.net/air/ (last access: 16 May 2022). Daily mean meteorological data are obtained from the NCEP/NCAR reanalysis data archive at http://www.esrl.noaa.gov/psd/data/gridded/data.ncep.reanalysis.html (last access: 16 May 2022) (Kalnay et al., 1996; NCEP/NCAR, 2022). The monthly EA/WR index (Barnston and Lvezey, 1987; CPC, 2022) can be downloaded from NOAA’s Climate Prediction Center: http://www.cpc.ncep.noaa.gov/data/teledoc/telecontents.shtml (last access: 16 May 2022).
The supplement related to this article is available online at: https://doi.org/10.5194/acp-22-16017-2022-supplement.
SZ and GZ put forward the conception of this paper, and TW improved the research and manuscript. SZ, XY, and VI carried out the research. SZ wrote the manuscript with contributions from all co-authors.
The contact author has declared that none of the authors has any competing interests.
Publisher’s note: Copernicus Publications remains neutral with regard to jurisdictional claims in published maps and institutional affiliations.
The authors thank the reviewers for their helpful comments and suggestions, and thanks for the financial support from the National Key Research and Development Program of China, the National Natural Science Foundation of China, and the Postgraduate Research & Practice Innovation Program of Government of Jiangsu Province. The High-Performance Computing Center of Nanjing University of Information Science & Technology provides support for the data processing and visualization of this study.
This research is supported by the National Key Research and Development Program of China (grant no. 2022YFF0801704), the National Natural Science Foundation of China (grant nos. 42175035 and 42077192), and the Postgraduate Research & Practice Innovation Program of Government of Jiangsu Province (grant no. KYCX22_1162).
This paper was edited by Xavier Querol and reviewed by two anonymous referees.
An, X., Sheng, L., Liu, Q., Li, C., Gao, Y., and Li, J.: The combined effect of two westerly jet waveguides on heavy haze in the North China Plain in November and December 2015, Atmos. Chem. Phys., 20, 4667–4680, https://doi.org/10.5194/acp-20-4667-2020, 2020.
Barnston, A. G. and Livezey, R. E.: Classification, seasonality and persistence of low frequency atmospheric circulation patterns, Mon. Weather Rev., 115, 1083–1126, 1987.
Cai, W., Xu, X., Cheng, X., Wei, F., Qiu, X., and Zhu, W.: Impact of “blocking” structure in the troposphere on the wintertime persistent heavy air pollution in northern China, Sci. Total Environ., 741, 140325, https://doi.org/10.1016/j.scitotenv.2020.140325, 2020.
Cai, W. J., Li, K., Liao, H., Wang, H. J., and Wu, L. X.: Weather Conditions Conducive to Beijing Severe Haze More Frequent under Climate Change, Nat. Clim. Change, 7, 257–262, https://doi.org/10.1038/nclimate3249, 2017.
Chang, W. Y. and Zhan, J. Q.: The association of weather patterns with haze episodes: Recognition by PM2.5 oriented circulation classification applied in Xiamen, Southeastern China, Atmos. Res., 197, 425–436, https://doi.org/10.1016/j.atmosres.2017.07.024, 2017.
CPC: Atmospheric data, CPC [data set], available at: http://www.cpc.ncep.noaa.gov/data/teledoc/telecontents.shtml, last access: 16 May, 2022.
Ding, X., Zhang, Y. Q., He, Q. F., Yu, Q. Q., Shen, R. Q., Zhang, Y. L., Zhang, Z., Lyu, S. J., Hu, Q. H., Wang, Y. S., Li, L. F., Song, W., and Wang, X. M.: Spatial and seasonal variations of secondary organic aerosol from terpenoids over China. J. Geophys. Res.-Atmos, 121, 14661–14678, https://doi.org/10.1002/2016JD025467, 2016.
Ding, Y. H. and Liu, Y. J.: Analysis of long-term variations of fog and haze in China in recent 50 years and their relations with atmospheric humidity, Sci. China Ser. D: Earth Sci., 57, 36–46, https://doi.org/10.1007/s11430-013-4792-1, 2014.
Fan, X. Q. and Sun, Z. B: Analysis on Features of Haze Weather in Xiamen City during 1953–2008, Trans. Atmos. Sci. 32, 604–609, 2019.
Fang, B. and Lu, M.: Heatwave and blocking in the Northeastern Asia: Occurrence, variability, and association, J. Geophys. Res.-Atmos., 125, e2019JD031627, https://doi.org/10.1029/2019JD031627, 2020.
Gong, S., Liu, Y., He, J., Zhang, L., Lu, S., and Zhang, X.: Multiscale analysis of the impacts of meteorology and emissions on PM2.5 and O3 trends at various regions in China from 2013 to 2020 1: Synoptic circulation patterns and pollution, Sci. Total Environ., 815, 152770, https://doi.org/10.1016/j.scitotenv.2021.152770, 2022.
Hu, B., Chen, R., Xu, J. X., Yang, G. S., Xu, D. D., Chen, C. Y., and Zhao, Y . L.: Health effects of ambient ultrafine (nano) particles in haze, Chinese Sci. Bull., 60, 2808–2823, https://doi.org/10.1360/N972014-01404, 2015 (in Chinese).
Hwang, J., Son, S. W., Martineau, P., and Barriopedro, D.: Impact of winter blocking on surface air temperature in East Asia: Ural versus Okhotsk blocking, Clim. Dynam., 59, 2197–2212, https://doi.org/10.1007/s00382-022-06204-5, 2022.
Kalnay, E., Kanamitsu, M., Kistler, R., Collins,W., Deaven, D., Gandin, L., Iredell,M., Saha, S., White, G., Woollen, J., Zhu, Y., Leetmaa, A., Reynolds, R., Chelliah, M., Ebisuzaki, W., Higgins, W., Janowiak, J., Mo, K.C., Ropelewski, C., Wang, J., Jenne, R., and Joseph, D.: The NCEP/NCAR 40-year reanalysis project, B. Am. Meteorol. Soc., 77, 437–471, https://doi.org/10.1175/1520-0477(1996)077<0437:TNYRP>2.0.CO;2, 1996.
Leung, D. M., Tai, A. P. K., Mickley, L. J., Moch, J. M., van Donkelaar, A., Shen, L., and Martin, R. V.: Synoptic meteorological modes of variability for fine particulate matter (PM2.5) air quality in major metropolitan regions of China, Atmos. Chem. Phys., 18, 6733–6748, https://doi.org/10.5194/acp-18-6733-2018, 2018.
Li, J., Liao, H., Hu, J., and Li, N.: Severe particulate pollution days in China during 2013–2018 and the associated typical weather patterns in Beijing-Tianjin-Hebei and the Yangtze River Delta regions, Environ. Pollut., 248, 74–81, 2019.
Li, J., Hao, X., Liao, H., Wang, Y., Cai, W., Li, K., Yue, X., Yang, Y., Chen, H., Mao, Y., Fu, Y., Chen, L., and Zhu, J.: Winter particulate pollution severity in North China driven by atmospheric teleconnections, Nat. Geosci., 15, 349–355, https://doi.org/10.1038/s41561-022-00933-2, 2022.
Li, Q., Zhang, R. H., and Wang, Y.: Interannual variation of the winter-time fog–haze days across central and eastern China and its relation with East Asian winter monsoon, Int. J. Climatol., 36, 346–354, https://doi.org/10.1002/joc.4350, 2015.
Liao, Z., Xie, J., Fang, X., Wang, Y., Zhang, Y., Xu, X., and Fan, S.: Modulation of synoptic circulation to dry season PM2.5 pollution over the Pearl River Delta region: An investigation based on self organizing maps, Atmos. Environ., 230, 117482, https://doi.org/10.1016/j.atmosenv.2020.117482, 2020.
Liu, N., Zhou, S., Liu, C., and Guo, J.: Synoptic circulation pattern and boundary layer structure associated with PM2.5 during wintertime haze pollution episodes in Shanghai, Atmos. Res., 228, 186–195, https://doi.org/10.1016/j.atmosres.2019.06.001, 2019.
Liu, X., Hui, Y., Yin, Z. Y., Wang, Z., Xie, X., and Fang, J.: Deteriorating haze situation and the severe haze episode during December 18–25 of 2013 in Xi'an China, the worst event on record, Theor. Appl. Climatol., 125, 321–335, https://doi.org/10.1007/s00704-015-1509-8, 2015.
Monks, P., Granier, C., Fuzzi, S., Stohl, A., Williams, M., Akimoto, H., Amann, M., Baklanov, A., Baltensperger, U., and Bey, I.: Atmospheric composition change–Global and regional air quality, Atmos. Environ, 43, 5268–5350, https://doi.org/10.1016/j.atmosenv.2009.08.021, 2009.
NCEP/NCAR: Atmospheric data, NCEP/NCAR [data set], available at: http://www.esrl.noaa.gov/psd/data/gridded/data.ncep.reanalysis.html, last access: 16 May, 2022.
Niu, F., Li, Z. Q., Li, C., Lee, K. H., and Wang, M. Y.: Increase of wintertime fog in China: Potential impacts of weakening of the eastern Asian monsoon circulation and increasing aerosol loading, J. Geophys. Res., 115, D00K20, https://doi.org/10.1029/2009JD013484, 2010.
Plumb, R. A.: On the three-dimensional propagation of stationary waves, J. Atmos. Sci., 42, 217–229, https://doi.org/10.1175/1520-0469(1985)042<0217:OTTDPO>2.0.CO;2, 1985.
Qian, Y., Gong, D., Fan, J., Leung, L. R., Bennartz, R., Chen, D., and Wang, W.: Heavy pollution suppresses light rain in China: Observations and modeling, J. Geophys. Res., 114, D00K02, https://doi.org/10.1029/2008JD011575, 2009.
Rokach, L. and Maimon, O.: Clustering Methods, in: Data Mining and Knowledge Discovery Handbook, edited by: Maimon, O. and Rokach, L., Springer, Boston, MA, https://doi.org/10.1007/0-387-25465-X_15, 2005.
Rousseeuw, P.: Silhouettes: A graphical aid to the interpretation and validation of cluster analysis, J. Comput. Appl. Math., 20, 53–65, https://doi.org/10.1016/0377-0427(87)90125-7, 1987.
Shen, L., Jacob, D. J., Mickley, L. J., Wang, Y., and Zhang, Q.: Insignificant effect of climate change on winter haze pollution in Beijing, Atmos. Chem. Phys., 18, 17489–17496, https://doi.org/10.5194/acp-18-17489-2018, 2018.
Sun, Y., Ma, Z. F., Niu, T.R., Fu, Y., and Hu, J. F.: Characteristics of climate change with respect to fog days and haze days in China in the past 40 years, Clim. Environ. Res., 18, 397–406, 2013.
Sun, Y., Chen, C., Zhang, Y., Xu, W., Zhou, L., Cheng, X., Zheng, H., Ji, D., Li, J., Tang, X., Fu, P., and Wang, Z.: Rapid formation and evolution of an extreme haze episode in Northern China during winter 2015, Sci. Rep. 6, 27151, https://doi.org/10.1038/srep27151, 2016.
Sun, Y., Niu, T., He, J., Ma, Z., Liu, P., Xiao, D., Hu, J., Yang, J., and Yan, X.: Classification of circulation patterns during the formation and dissipation of continuous pollution weather over the Sichuan Basin, China, Atmos. Environ., 223, 117244, https://doi.org/10.1016/j.atmosenv.2019.117244, 2020.
Tibaldi, S. and Molteni, F.: On the operational predictability of blocking, Tellus, 42, 343–365, https://doi.org/10.1034/j.1600-0870.1990.t01-2-00003.x, 1990.
Tsaia, F., Tu, J. Y., Hsu, S. C., and Chen, W. N.: Case study of the Asian dust and pollutant event in spring 2006: Source, transport, and contribution to Taiwan, Sci. Total Environ, 478, 163–174, https://doi.org/10.1016/j.scitotenv.2014.01.072, 2014.
Wang, H. J., Chen, H. P., and Liu, J. P.: Arctic Sea Ice Decline Intensified Haze Pollution in Eastern China. Atmos. Oceanic Sci., 8, 1–9, https://doi.org/10.3878/AOSL20140081, 2015.
Wang, K. C., Dickinson, R. E., and Liang, S. L.: Clear sky visibility has decreased over land globally from 1973 to 2007, Science, 323, 1468–1470, https://doi.org/10.1126/science.1167549, 2009.
Wang, X. and Zhang, R.: Effects of atmospheric circulations on the interannual variation in PM2.5 concentrations over the Beijing–Tianjin–Hebei region in 2013–2018, Atmos. Chem. Phys., 20, 7667–7682, https://doi.org/10.5194/acp-20-7667-2020, 2020.
Wang, X., Zhang, R., Tan, Y., and Yu, W.: Dominant synoptic patterns associated with the decay process of PM2.5 pollution episodes around Beijing, Atmos. Chem. Phys., 21, 2491–2508, https://doi.org/10.5194/acp-21-2491-2021, 2021.
Wang, Z. S., Liu, X. D., and Xie, X. N.: Effects of Strong East Asian Cold Surges on Improving the Air Quality over Mainland China, Atmosphere, 7, 38, https://doi.org/10.3390/atmos7030038, 2016.
Wu, M., Wu, D., Fan, Q., Wang, B. M., Li, H. W., and Fan, S. J.: Observational studies of the meteorological characteristics associated with poor air quality over the Pearl River Delta in China, Atmos. Chem. Phys., 13, 10755–10766, https://doi.org/10.5194/acp-13-10755-2013, 2013.
Wu, P., Ding, Y. H., Liu, Y. J., and Li, X. C.: Influence of the East Asian winter monsoon and atmospheric humidity on the wintertime haze frequency over central-eastern China, Acta Meteorol. Sin., 74, 352–366, https://doi.org/10.11676/qxxb2016.029, 2016 (in Chinese).
Wu, P., Ding, Y., and Liu, Y.: Atmospheric circulation and dynamic mechanism for persistent haze events in the Beijing–Tianjin–Hebei region, Adv. Atmos. Sci., 34, 429–440, 2017.
Xiao, C., Zhang, Y., Lofgren, B. M., and Nie, Y.: The concurrent variability of East Asian subtropical and polar-front EAJSs and its implication for the winter climate anomaly in China, J. Geophys. Res.-Atmos., 121, 6787–6801, 2016.
Xie, Y. B., Chen, J., and Li, W.: An assessment of PM2.5 related health risks and impaired values of Beijing residents in a consecutive high-level exposure during heavy haze days, Environ. Sci., 35, 1–8, 2014.
Xu, J., Yan, F., Xie, Y., Wang, F., Wu, J., and Fu, Q.: Impact of meteorological conditions on a nine-day particulate matter pollution event observed in December 2013, Shanghai, China, Particuology, 20, 69–79, https://doi.org/10.1016/j.partic.2014.09.001, 2015.
Yang, Y., Zhou, Y., Li, K., Wang, H., Ren, L., Zeng, L., Li, H., Wang, P., Li., B., and Liao, H.: Atmospheric circulation patterns conducive to severe haze in eastern China have shifted under climate change, Geophys. Res. Lett., 48, e2021GL095011, https://doi.org/10.1029/2021GL095011, 2021.
Yin, Z. C. and Wang, H. J.: The relationship between the subtropical Western Pacific SST and haze over North-Central North China Plain, Int. J. Climatol., 36, 3479–3491, https://doi.org/10.1002/joc.4570, 2016.
Yin, Z. and Wang, H.: Role of atmospheric circulations in haze pollution in December 2016, Atmos. Chem. Phys., 17, 11673–11681, https://doi.org/10.5194/acp-17-11673-2017, 2017.
Yin, Z. C. and Wang, H. J.: Possible Relationship between the Chukchi Sea Ice in the Winter and the February Haze Pollution in the North China Plain, J. Climate, 32, 5179–5190, https://doi.org/10.1175/JCLI-D-18-0634.1, 2019.
Yin, Z. C., Wang, H. J., and Yuan, D. M.: Interdecadal increase of haze in winter over North China and the Huang-huai area and the weakening of the East Asia winter monsoon, Chin. Sci. Bull., 60, 1395–1400, 2015.
Yin, Z., Wang, H., and Chen, H.: Understanding severe winter haze events in the North China Plain in 2014: roles of climate anomalies, Atmos. Chem. Phys., 17, 1641–1651, https://doi.org/10.5194/acp-17-1641-2017, 2017.
Yin, Z., Zhang, Y., Wang, H., and Li, Y.: Evident PM2.5 drops in the east of China due to the COVID-19 quarantine measures in February, Atmos. Chem. Phys., 21, 1581–1592, https://doi.org/10.5194/acp-21-1581-2021, 2021.
Yun, S., Yoo, C.: The effects of spring and winter blocking on PM10 Concentration in Kore, Atmosphere, 10, 410, https://doi.org/10.3390/atmos10070410, 2019.
Zhang, S., Zeng, G., Yang, X., Wu, R., and Yin, Z.: Comparison of the influence of two types of cold surge on haze dispersion in eastern China, Atmos. Chem. Phys., 21, 15185–15197, https://doi.org/10.5194/acp-21-15185-2021, 2021.
Zhang, S. Y., Zeng, G., Wang, T. J., Yang, X. Y., and Vedaste, I.: Interannual relationship between displacement and intensity of East Asian jet stream and haze over eastern China in winter, Sci. Total Environ., 829, 154672, https://doi.org/10.1016/j.scitotenv.2022.154672, 2022.
Zhong, W., Yin, Z., and Wang, H.: The relationship between anticyclonic anomalies in northeastern Asia and severe haze in the Beijing–Tianjin–Hebei region, Atmos. Chem. Phys., 19, 5941–5957, https://doi.org/10.5194/acp-19-5941-2019, 2019.
- Abstract
- Introduction
- Data and methods
- Dominant synoptic atmospheric circulation patterns of severe HDEC
- Comparison of different circulation types associated with severe HDEC
- Conclusions and discussion
- Data availability
- Author contributions
- Competing interests
- Disclaimer
- Acknowledgements
- Financial support
- Review statement
- References
- Supplement