the Creative Commons Attribution 4.0 License.
the Creative Commons Attribution 4.0 License.
 | 20 Dec 2022
Satellite observations of seasonality and long-term trends in cirrus cloud properties over Europe: investigation of possible aviation impacts
Silke Groß
Linear contrails and contrail cirrus induced by global aviation have long been known to contribute to climate change by warming the atmosphere. Besides increasing global cirrus cloudiness, aviation may also alter the properties of natural cirrus clouds by soot emissions which lead to more heterogeneous freezing. During the first COVID-19 lockdown in Europe, changes in the properties and occurrence of cirrus clouds were determined with the lidar measurements of CALIPSO, which are presumed to be caused by the corresponding reduction in civil aviation. In the 10 years before the COVID-19 outbreak, however, aviation grew strongly in terms of CO2 emissions and flight densities in Europe. In this study, 10-year lidar measurements with CALIPSO are analysed to determine the seasonality and long-term trends in cirrus clouds as well as their correlations with the ambient temperatures and air traffic. The results show that there is a distinct seasonal cycle in the occurrence rates (ORs) and particle linear depolarization ratio (PLDR) of cirrus clouds. In addition, cirrus clouds appear within a broader altitude range in winter than in summer and they are characterized by larger OR and PLDR values in winter than in summer. The monthly medians of PLDR as well as their deseasonalized time series in the 10-year period before COVID-19 both show positive trends, which are statistically significant according to the Mann–Kendall (MK) significance test. However, the ORs of cirrus clouds show a negative trend, which might be connected with the background meteorological conditions. Since the cirrus PLDR strongly depends on the ambient temperatures, the contributions induced by temperature are further removed from the cirrus PLDR with a simple linear regression model. The derived residuals show significant positive trends according to the MK test. To compare the cirrus PLDR and air traffic (with the CO2 emissions from aviation as a proxy), the deseasonalization of both datasets were previously conducted since the seasonal cycles in both are not consistent. The deseasonalized time series determined for the cirrus PLDR and CO2 emissions from aviation both show increasing trends and their correlation coefficient is r=0.54 at the confidence level above 99.5 %. Finally, comparisons between the cirrus PLDR and aviation in every season were made and revealed a strong correlation in other seasons than in summer.
- Article
(6178 KB) - Full-text XML
- BibTeX
- EndNote


Aviation affects the Earth's radiation budget through a combination of aviation emissions of CO2 and non-CO2 effects which have a warming effect on the atmosphere (Lee et al., 2021). Linear contrails and contrail cirrus induced by water vapour and soot emissions from air traffic in the upper atmosphere are expected to contribute a large part of the climate impact of aviation (e.g. Burkhardt and Kärcher, 2011). Due to their climate impact and their suitability for monitoring the mitigation of aviation, numerous experimental and theoretical efforts have been carried out in the past few years to understand contrails and to determine their effect on climate by calculating radiative forcing (e.g. Heymsfield et al., 2010; Voigt et al., 2011; Burkhardt and Kärcher, 2011; Graf et al., 2012; Schumann and Graf, 2013; Kärcher et al., 2015; Kärcher, 2018; Bock and Burkhardt, 2019; Schumann et al., 2021a, b). However, aviation emissions and the resulting contrail formation interact with the atmosphere through a complex manner which is still not fully understood.
Cirrus clouds, composed of ice crystals with a variety of forms and shapes, usually appear in the upper atmosphere above ∼ 6 km. They have long been recognized, as studies reveal that cirrus clouds permanently cover on average 30 % of the Earth's surface with up to 70 % coverage over the tropics and they have a large impact on the Earth's radiation balance and climate evolution (Liou., 1986; Wang et al., 1996; Wylie and Menzel, 1999; Sassen and Campbell, 2001; Sassen et al., 2008; Nazaryan et al., 2008). Cirrus clouds influence the radiation balance by trapping the outgoing long-wave radiation from the ground and underlying atmosphere (warming) and reflecting the incoming short-wave solar radiation back into space (cooling). The contribution of these two opposite effects depends on the cloud microphysical, thermal, and optical properties, which include cloud heights, temperatures, and the shape and orientation of ice crystals (e.g. Fu and Liou, 1993; Zhang et al., 1999; Zerefos et al., 2003; Stephens et al., 2004; Campbell et al., 2016). Overall, cirrus clouds are assumed to have a net warming effect on the climate system, unlike the low and midlevel clouds (Chen et al., 2000).
Midlatitude cirrus clouds are of particular interest and have been intensively studied thanks to the high number of observation sites as well as campaign-based observations (e.g. Voigt et al., 2017, 2022) at these latitudes. Nevertheless, midlatitude cirrus clouds are induced and affected by various weather patterns and interact with the atmospheric dynamics, which lead to difficulties in their representation in global and regional climate models (Boucher et al., 2013). Furthermore, midlatitude cirrus clouds can be strongly influenced by the frequent air traffic. Besides increasing global cirrus cloudiness (Boucher, 1999; Minnis et al., 2004; Stubenrauch and Schumann, 2005), aviation-induced contrails and contrail cirrus also alter the optical and microphysical properties of natural cirrus clouds (e.g. Tesche et al., 2016; Urbanek et al., 2018; Li and Groß, 2021). Studies reveal that the effect of contrails and cirrus clouds on our climate is growing significantly, which is, however, still challenging the atmosphere community to parameterize their overall effect well (Bock and Burkhardt, 2019; Lee et al., 2021).
The radiative effects of cirrus clouds strongly depend on their microphysical properties, e.g. particle number concentration, size, and shape (e.g. Stephens et al., 1990; Haag and Kärcher, 2004), which are further influenced by the ambient conditions (e.g. temperature and supersaturation) and the nucleation mode (Heymsfield, 1977; Khvorostyanov and Sassen, 1998; Ström and Ohlsson, 1998; Urbanek et al., 2018). Hence, an accurate estimate of ice crystal shape and orientation is very important for the calculation of radiative transfer. In the past few decades, both laboratory experiments and field observations reveal a high variety of habit diagrams of atmospheric ice crystals which are closely correlated with temperature and ice supersaturation (Bailey and Hallett, 2004, 2009; Lawson et al., 2006, 2019). In natural clouds, however, ice crystals encounter varying temperature and humidity and may grow into irregular forms (Korolev et al., 1999, 2000). Furthermore, the dependence of ice crystal habits on temperature is also governed by mass transport (including convection and advection) and the region of origin of the particles (e.g. Bailey and Hallett, 2009; Um et al., 2015).
It is well known that light scattered by atmospheric ice crystals may exhibit different polarization states from incident light. Computation of the geometric ray tracing technique reveals that changes in polarization states depend on the internal ray paths and, more precisely, increase with increasing hexagonal axis ratio (= length over width) (e.g. Takano and Liou, 1989). The particle linear depolarization ratio (PLDR) is a well-defined parameter for evaluating this effect and is widely used to retrieve information on ice crystal habits, i.e. particle phase, shape, and orientation. In traditional lidar applications, PLDR is defined as the ratio of power from both polarization components perpendicular and parallel to the transmitted laser source and can be calculated using Eq. (1):
where β⊥ and β∥ are the perpendicular and parallel components of the backscatter coefficients retrieved from the ice crystals in clouds, respectively. The light backscattered by spherical particles exhibits the same orientation of polarization as the incident light, while the polarization changes when the light is backscattered by non-spherical particles such as cirrus ice crystals (Sassen et al., 1989; Freudenthaler et al., 2009; Sassen and Zhu, 2009; Urbanek et al., 2018). As a well-established technique, polarization lidar has been widely used to provide information on aerosol profiling and to distinguish between different types of aerosols (Freudenthaler et al., 2009; Tesche et al., 2009; Groß et al., 2011, 2013, 2015). Further, this technique is also applied to unambiguously determine the cloud phase (e.g. Bühl et al., 2016) and to study ice cloud properties (e.g. Schotland et al., 1971; Sassen, 1991; Ansmann et al., 2003; Groß et al., 2012; Urbanek et al., 2018). PLDR is mainly determined by ice crystal shapes that are a function of temperature, supersaturation (humidity), and potentially the availability of ice nuclei during ice formation (e.g. Bailey and Hallett, 2004, 2009; Schnaiter et al., 2012; Järvinen et al., 2018). In addition, the shapes of ice crystals are strongly influenced by the internal cloud dynamics, lifetime duration, and stage (Lawson et al., 2019, and references therein). PLDR is a suitable parameter used to retrieve information on ice crystal shape and hence to trace the aviation effects on clouds. Previous studies show that persistent contrails and contrail cirrus are characterized by higher values of PLDR than natural cirrus clouds (Freudenthaler et al., 1996; Mishchenko and Sassen, 1998; Noel et al., 2006; Iwabuchi et al., 2012). In addition, Urbanek et al. (2018) reported that cirrus clouds with enhanced PLDR values were found to be incidental to significantly lower supersaturations inside the clouds indicating more frequent heterogeneous freezing. They also carried out a backward-trajectory analysis and found that the affected ice clouds appear within areas under the influence of high aviation emissions. Under soot emissions, ice nucleation took place at lower supersaturation, which influences the form and size of ice crystals and further alters their optical properties (Urbanek et al., 2018). During the first COVID-19 lockdown in Europe starting from mid-March 2020, civil air traffic was significantly reduced by up to 88 % in April 2020 compared to the previous year (e.g. Li and Groß, 2021). Based on the analysis of lidar measurements with CALIPSO, a significant reduction in the cirrus PLDR was found in both March and April 2020 compared to the corresponding periods in the previous 6 years (Li and Groß, 2021). It is known, however, that global air traffic has been growing in the past few decades in terms of number of flights and CO2 emissions from aviation before the COVID-19 pandemic, which, of course, is considered a smaller change in air traffic compared to that caused by the COVID-19 lockdown (see Fig. 1 for the evolution of civil aviation in 42 European countries and regions in the 11 years from 2010 to 2020). In this study, we extend the analyses of Li and Groß (2021) and study the possible impact of aviation on the microphysical properties of cirrus clouds in terms of seasonality and long-term trend in the occurrence rate (OR) and PLDR of cirrus clouds.
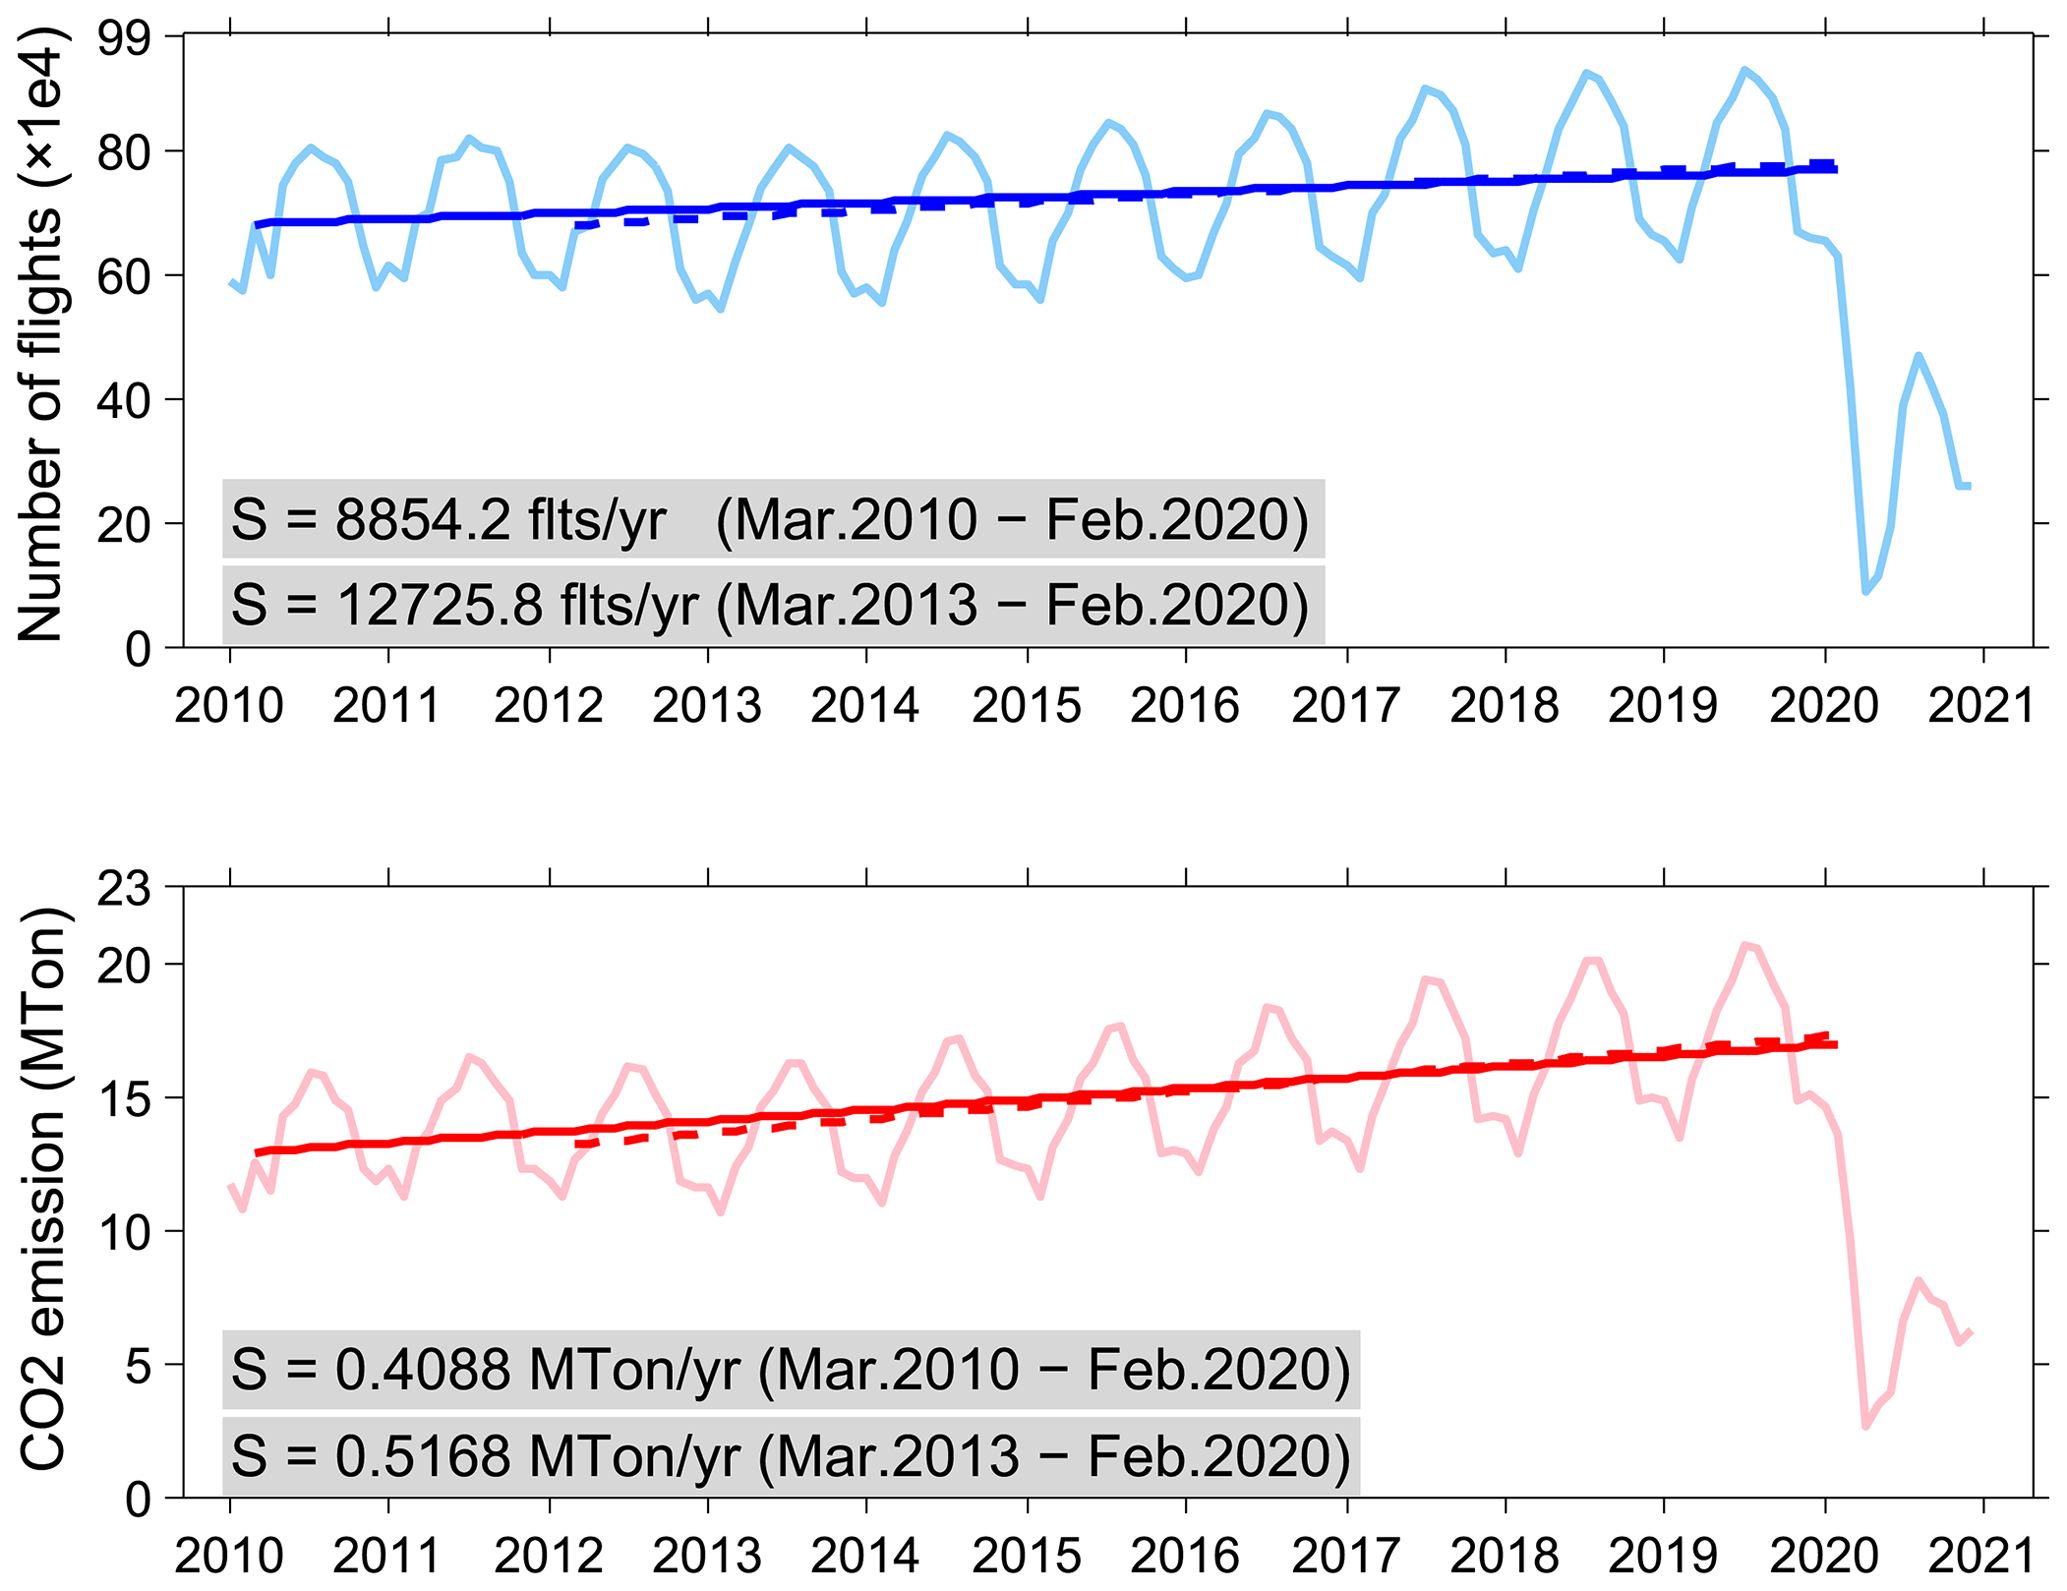
Figure 1Number of flights and the corresponding CO2 emissions from air traffic in different months over Europe (a total of 42 countries and regions) in 11 years during 2010–2020. The seasonal cycle in air traffic shows more flights (as well as CO2 emissions) in summer than in winter. The number of flights increased by about 1.30 % yr−1, whereas the CO2 emissions increased by about 3.16 % yr−1 in the last 10 years in Europe before the COVID-19 outbreak. During the COVID-19 pandemic, however, civil aviation in Europe was significantly reduced from March 2020 with only a partial recovery in summer 2020 and further reduction afterwards. Furthermore, we also note that there was in fact a slight decrease in the first 3 years from 2010 to 2013, especially in winter and early spring. The plots are reproduced based on the European flight historic data from the European Organisation for the Safety of Air Navigation (EUROCONTROL, https://www.eurocontrol.int/covid19, last access: 9 February 2022).
In Sect. 2 we outline the CALIPSO data and methods. Section 3 describes our results concerning seasonal variations and long-term trends in cirrus cloud properties and occurrence based on 10-year lidar measurements from March 2010 to February 2020. The dependence of the cirrus cloud properties on the corresponding ambient temperatures as well as aviation is determined and discussed in Sect. 4. Our conclusions are summarized in Sect. 5.
In this study, we focus on the same research area as Li and Groß (2021), i.e. the midlatitude regions from 35 to 60∘ N and from the Atlantic Ocean (15∘ W) to central Europe (15∘ E) (for the sake of simplicity, we refer to this research area as “Europe” in the rest of this paper). The measurements of cirrus clouds used here were conducted with the CALIOP (Cloud-Aerosol Lidar with Orthogonal Polarization) lidar, which is carried aboard the CALIPSO satellite within the A-Train constellation in a sun-synchronous polar orbit (Winker et al., 2010; Stephens et al., 2018). CALIOP is a dual-wavelength elastic backscatter lidar at 532 and 1064 nm and is polarization-sensitive at 532 nm (Winker et al., 2007; Hunt et al., 2009). The main datasets used here are the Level 2 5 km Cloud Profile Products of CALIOP which provide information on scientific parameters such as PLDR, temperature (derived from the GEOS-5 data), ice water content (derived from the CALIOP retrieved extinction by ice cloud particles), etc.
CALIOP is able to observe altitude-resolved profiles of backscatter intensity from numerous geophysical entities including clouds, aerosol layers, regions of clear air, and the returns from the Earth's surface. In this study, however, we are only interested in the cirrus ice clouds. We hence use the vertical feature mask (VFM) developed by the CALIPSO team to distinguish cirrus clouds from other entities including aerosols as well as from non-cirrus clouds (e.g. Liu et al., 2004, 2009; Hu et al., 2009; Omar et al., 2009; Vaughan et al., 2009; Winker et al., 2009). Furthermore, the archived data of CALIOP are classified into day- and night-time. The daytime observations are affected by solar illumination, which may lead to a reduction in the signal-to-noise ratio and hence make them more difficult to interpret. However, there is an aviation fingerprint with two maxima of flight densities during morning eastbound and afternoon westbound air traffic in the North Atlantic air traffic corridor, the research area we are focusing on in this study (e.g. Graf et al., 2012; Schumann and Graf, 2013). This implies that aviation effects on cirrus clouds are expected to be stronger during daytime than night-time. Therefore, both day- and night-time observations will be analysed here to study the influence of air traffic on cirrus to the fullest extent. For a detailed description of the CALIOP data, readers are referred to Li and Groß (2021) and references therein.
Being a nadir-pointing lidar, CALIOP collects data only along the ground track of the CALIPSO satellite. CALIPSO flies 3–4 times each day over this area and therefore ∼ 100 tracks of observations each month were collected during 2010–2020. Furthermore, this research area covers a large fraction of the North Atlantic flight corridor connecting central Europe with North America where the generation of contrail-induced cirrus clouds and the impact of aviation on cirrus clouds have been intensively studied (e.g. Graf et al., 2012; Schumann and Graf, 2013; Voigt et al., 2017; Urbanek et al., 2018; Schumann et al., 2021a; Li and Groß, 2021).
The cirrus morphologies and ORs as well as the high degree of variability in their microphysical properties depend greatly on the substantial differences in meteorological conditions. Hence, we first compare the evolution of the general meteorological conditions along the entire altitude range from 6 to 13 km including temperature, relative humidity with respect to ice (RHi), as well as vertical updraft and wind velocity covering our research area during 2010–2020. These parameters are directly derived from global ERA5 reanalysis data, produced by ECMWF with the Copernicus Climate Change Service (Hersbach et al., 2020), and their monthly values are shown in Fig. 2. The vertical bars in the upper panels stand for all the data points of air temperature and RHi, and in the lower panels, for vertical updraft and wind velocity. The blue circles show the medians of each quantity in different months and the red lines are best-fitting lines using a simple linear regression model (i.e. least squares fit of a first-degree polynomial to data) for all four quantities. The derived slopes are hence considered as the long-term trends in each quantity. First, there is a clear seasonal cycle in the air temperatures and a higher degree of variability in temperatures can be seen in winter than in summer. Further, extremely low temperatures with medians below −50 ∘C are seen in January and February 2012, which are indicative of the cold spell in early 2012 in Europe starting from 24 January and lasting for about 3 weeks (DWD, 2012). The influence of the extreme lower temperatures on the properties of cirrus clouds will be discussed below. Air temperatures show in median values an increasing trend of 0.0941 ∘C yr−1 with the confidence level at 90.0 %. In addition, the year-to-year variabilities of air temperatures in different months show that temperatures increased more significantly in winter than in summer (an increasing trend of 0.0098 ∘C yr−1 in summer and 0.1183 ∘C yr−1 in winter). The seasonal cycle in RHi, however, is not as significant as in air temperatures. For the long-term evolution, RHi shows a small decrease in median values with a trend of −0.0557 % yr−1 at the confidence level of only 25.5 %. In addition, the maxima of the monthly RHi values show a decreasing trend of −0.2431 % yr−1 (81.1 % confidence level), whereas their minima show an increasing trend of 0.9125 % yr−1 (99.8 % confidence level); i.e. the range of the RHi distribution became narrower in the last 11 years, especially during the period from 2010 to the end of 2017. We mentioned earlier that the vertical updrafts play a crucial role in the formation of cirrus clouds. However, monthly mean values of vertical updrafts determined from ERA5 reanalysis data are highly smoothed and can only provide a climatological reference for the background. This is also the case for wind velocity. Figure 2 (lower panel) shows in general a small decrease in vertical updrafts (negative values for upwards) and a small decrease in wind velocity with the confidence level at 53.7 % and 35.6 %, respectively. In a nutshell, the meteorological and dynamical conditions over Europe in the last 11 years provide us with a general picture of the background, which is generally stable during the period we focus on. With this information in mind, we can further study the seasonal variations and long-term trends in cirrus cloud occurrence and properties.
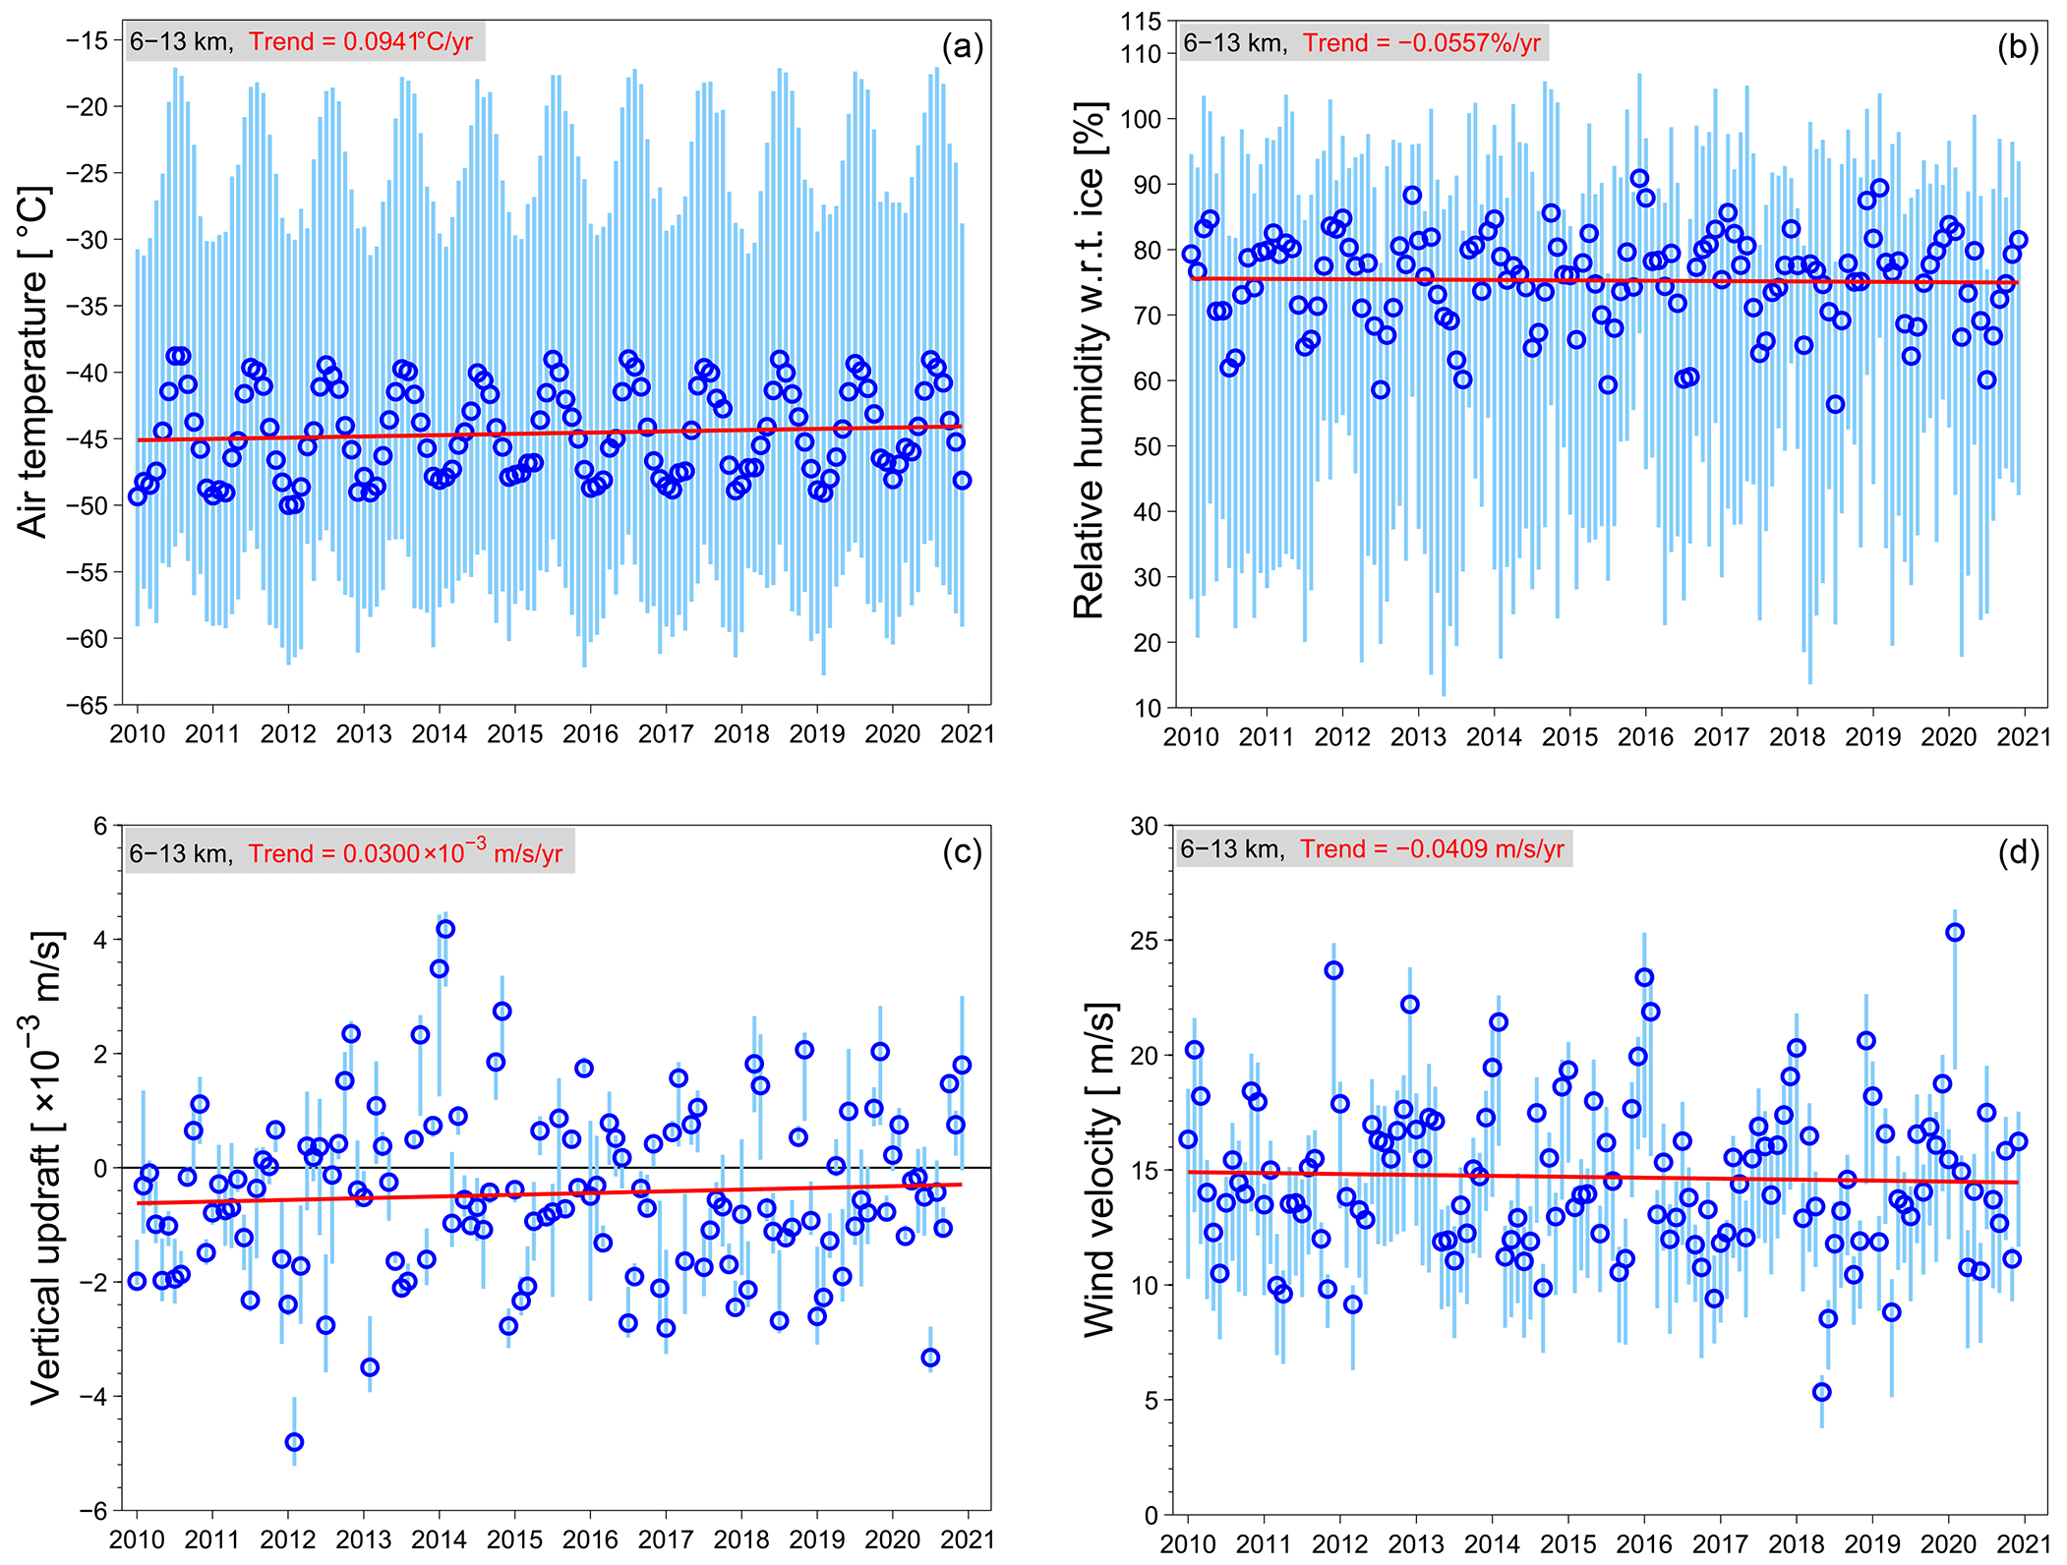
Figure 2Monthly variations in air temperature, relative humidity with respect to ice (RHi), vertical updraft, and wind velocity in the background at altitudes from 6 to 13 km, derived from ERA5 reanalysis data for 11 years from 2010 to 2020 over the European area (i.e. the research area in this study, lat: 35–60∘ N, long: 15∘ W to 15∘ E). The vertical bars show the value ranges for temperatures and RHi, respectively, in panels (a) and (b), and for vertical updraft and wind, respectively, in panels (c) and (d). The blue circles show the medians of each quantity in different months and the red lines are the best-fitting lines using the simple linear regression to data for all of them.
3.1 Seasonal variations of cirrus clouds
We first present the distribution of cirrus PLDR in each month from January 2010 to December 2020 in Fig. 3. This is derived from the observations at the typical altitudes in which cirrus clouds form from 6 to 13 km and at temperatures between −75 and −38 ∘C. Please note that typical cruising altitudes of aircraft over the North Atlantic and Europe lie between 8.8 and 12.5 km. However, aviation emissions over the mainland take place also at lower altitudes during ascent and descent from and to the airports. In order to compare the distribution of cirrus PLDR in different months, the number densities of scatter point data are normalized and visualized with different colour codes with the maximum number density indicated by 1 for each month. February 2016 with no observations available is marked in blank. Figure 3 provides a general climatology of the PLDR distributions in Europe with the majority of PLDR (> 60 % of the maxima) falling within the range from 0.2 to 0.55. There are clear seasonal cycles as expected in PLDR, which becomes more remarkable for those falling within the smaller range of PLDR. In addition, there are clear reductions in PLDR during the period of COVID-19 from March to December 2020 compared to the corresponding months in the previous years, which is consistent with previous studies (Li and Groß, 2021; Voigt et al., 2022) and will be discussed in detail below. Furthermore, the reductions in the cirrus PLDR are more remarkable for the measurements made in the daytime. The ORs of cirrus cloud during the period of COVID-19 also show a reduction, which has been reported recently (e.g. Schumann et al., 2021a; Quaas et al., 2021; Li and Groß, 2021).
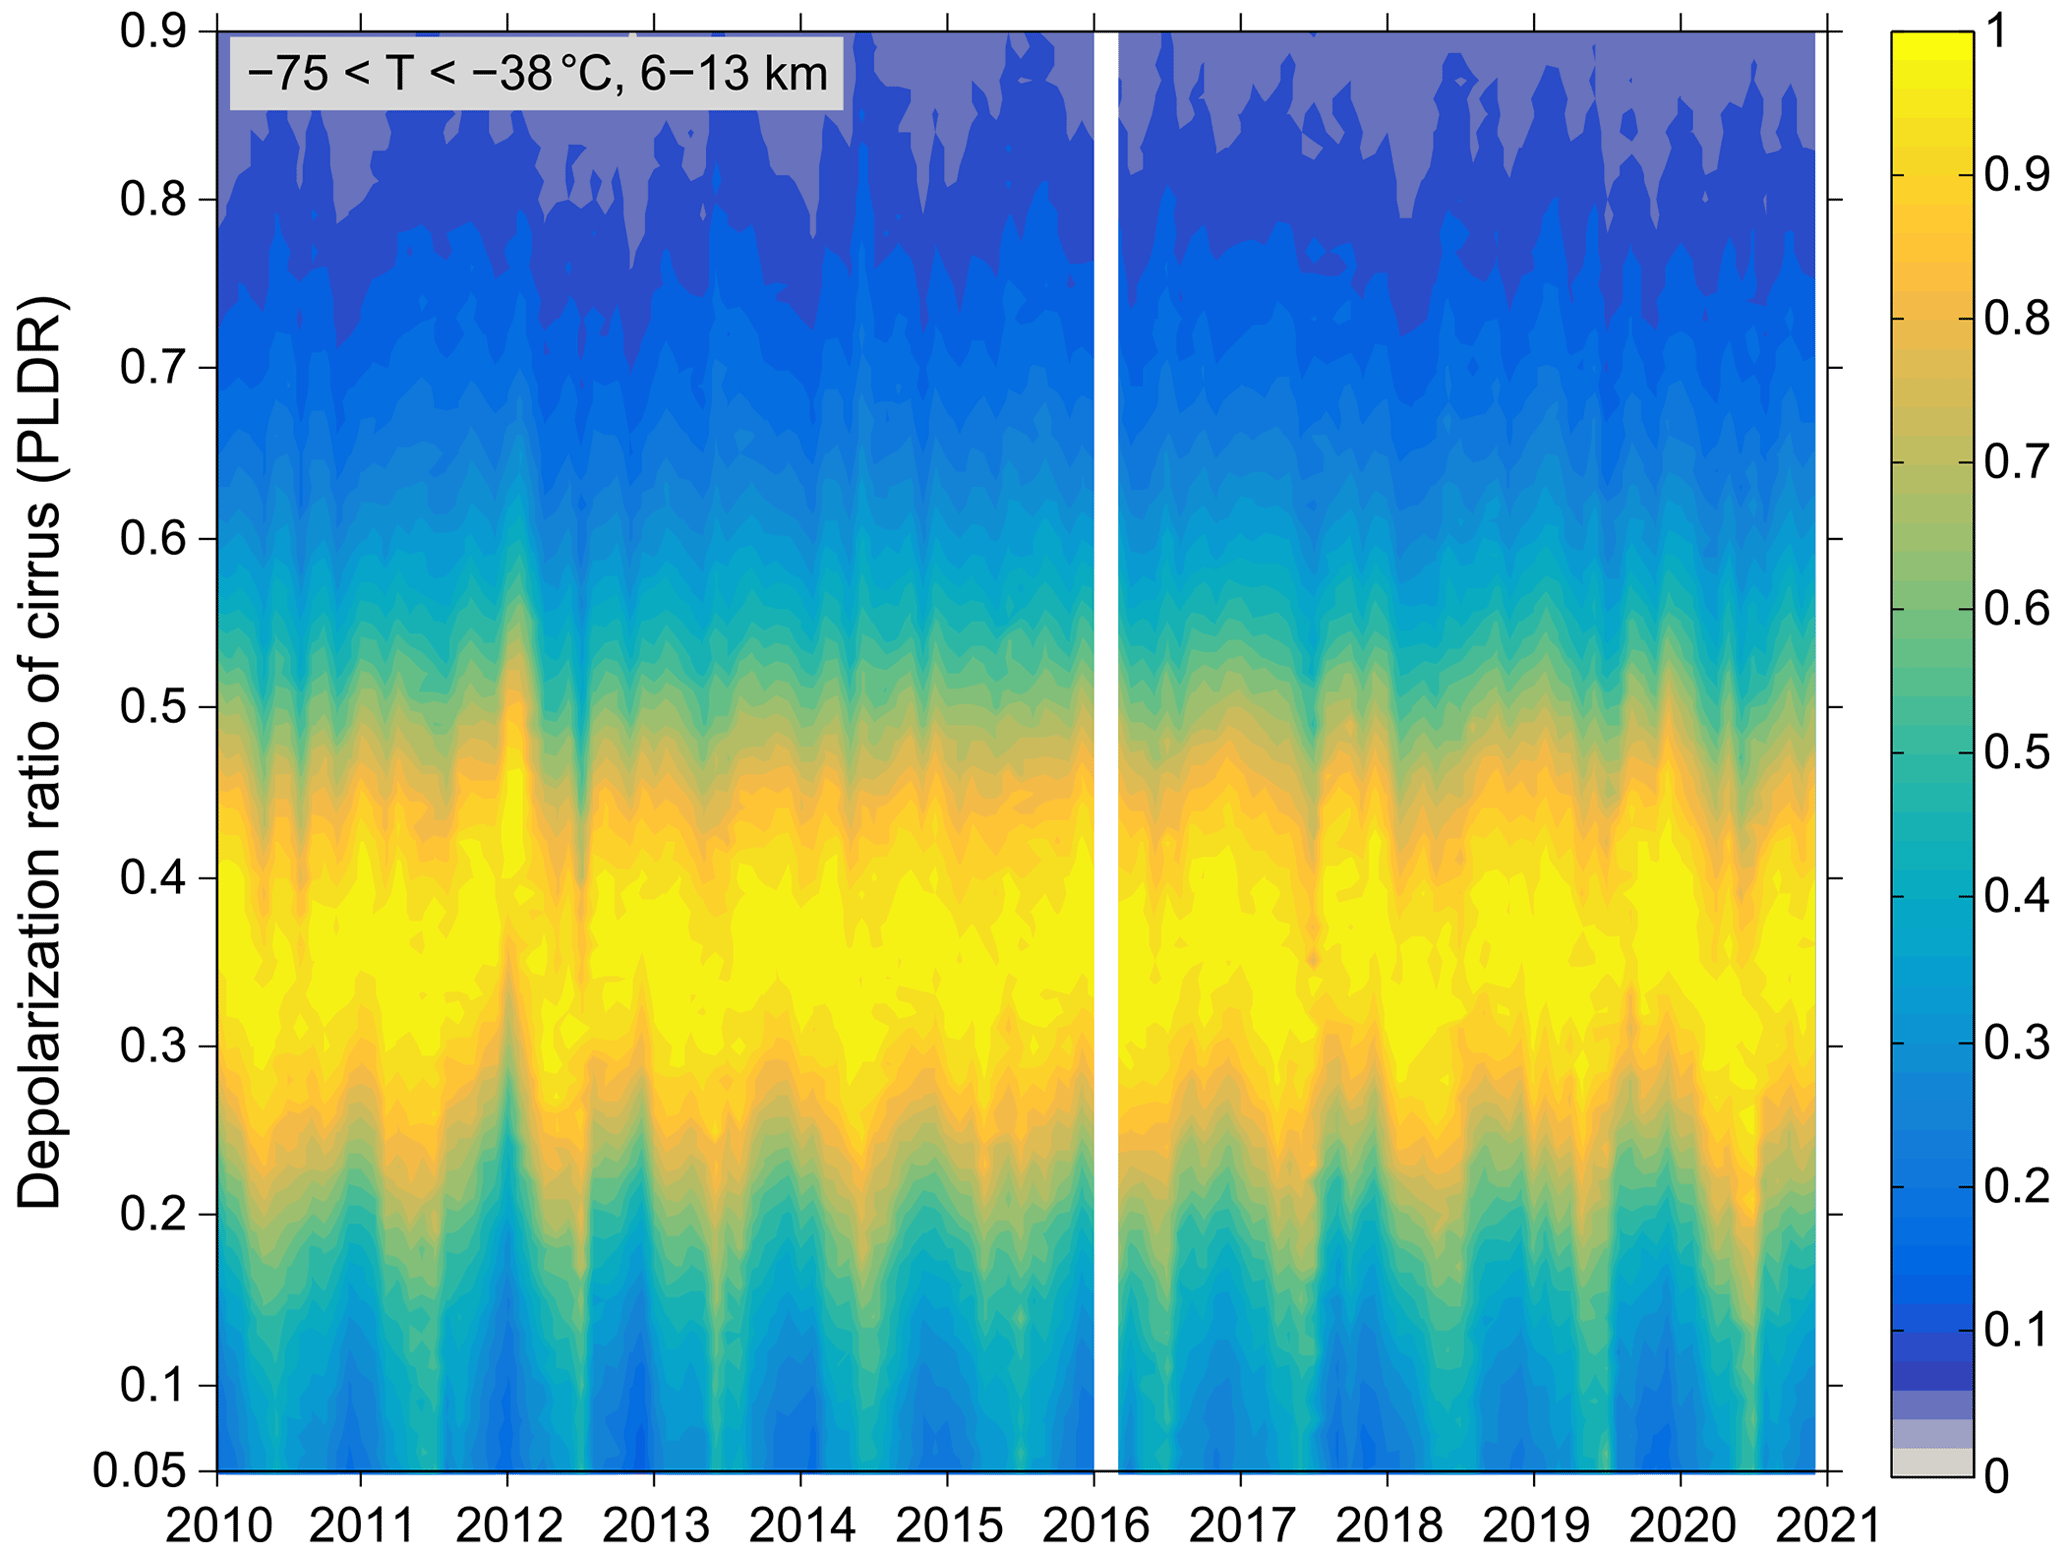
Figure 3Number densities of the cirrus PLDR distribution normalized for each month from January 2010 to December 2020. The data are derived from the observations at the typical cirrus heights from 6 to 13 km and at temperatures between −75 and −38 ∘C. The colour codes are used to visualize the relative number densities of scatter point data, with the maximum number density indicated by 1 in the colour bar.
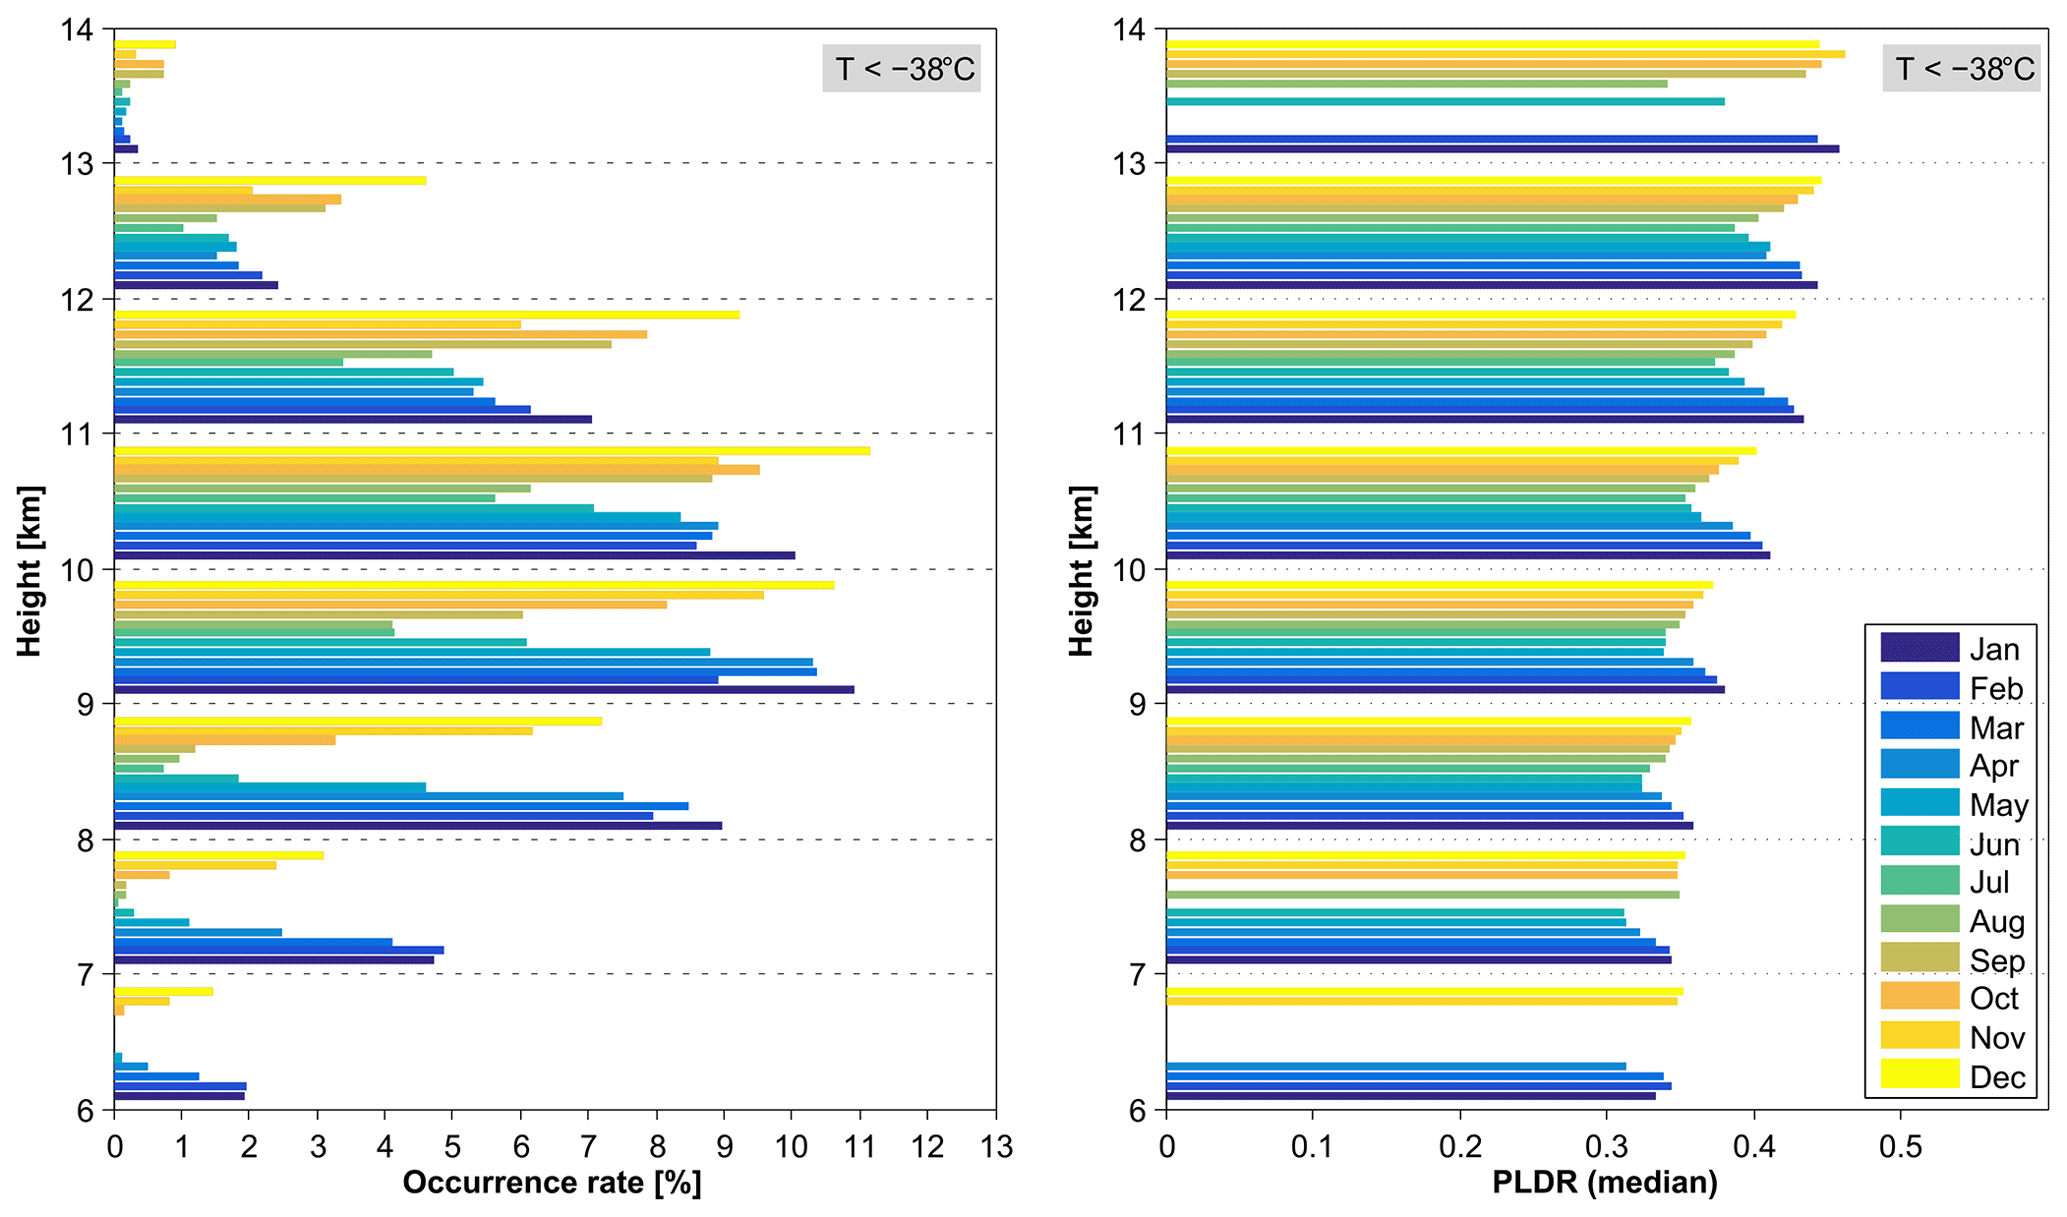
Figure 4Distributions of the occurrence rate (OR) and PLDR of cirrus clouds in each 1 km altitude bin. Both parameters follow a seasonal cycle: cirrus clouds in winter are characterized by larger values of PLDR and higher ORs than in summer. Furthermore, cirrus clouds appear within the full altitude range from 6 to 13 km in the winter months but only within the altitudes from ∼ 9 to 12.5 km in summer.
We next turn to the seasonality in cirrus cloud occurrence and PLDR in more detail. Figure 4 shows the cirrus OR and PLDR in different months (see the legend on the plot with descriptive labels) for each 1 km altitude bin from 6 to 13 km. They are derived from both day- and night-time lidar measurements of CALIPSO within the typical altitude range of cirrus clouds at temperatures between −75 and −38 ∘C over the last 10 years before COVID-19, i.e. from March 2010 to February 2020. The data with cirrus OR smaller than 0.1 % are neglected for plotting PLDR in the right panel. The profiles of cirrus OR along altitudes show that cirrus clouds mainly occurred in the height range from 9 to 11 km (with OR > 3 % in every month). The cirrus occurrence follows a significant seasonal cycle in all the altitude bins. The maxima of cirrus OR, up to 11 %, are found in the winter months, precisely in January or February below 10 km and in December above 10 km, respectively, and the minima of OR appear in July along altitudes. In addition, there is a stronger seasonality in the lower altitudes, with the cirrus OR in winter more than 10 times larger than in summer. Please note that this study concentrates on the aviation effects on cirrus clouds and thus the measurements of cirrus clouds due to deep convection are excluded when applying the CALIPSO VFM, which leads to a decrease in the cirrus ORs, especially in summer. Furthermore, cirrus clouds in the winter months appear within the full altitude range from 6 to 13 km while in summer only from 9 to 12.5 km for the data with OR > 1 % considered. For the PLDR values of cirrus clouds shown in the right panel, they also follow a distinct seasonal cycle in which cirrus clouds are characterized by larger PLDR values in winter than in summer in each altitude bin and the difference of PLDR in different months can be as large as 0.06 (∼ 15 %). The distributions of cirrus PLDR along altitudes show a clear increase with altitudes in each month and the difference in the medians of PLDR in each month can be as large as more than 0.1 (Urbanek et al., 2018; Li and Groß, 2021).
3.2 Long-term trend of cirrus cloud properties with significance test
In Fig. 5 (upper panel) we present the medians of cirrus PLDR in every month derived from both day- and night-time observations from 2010 to 2020 that covers the period of the COVID-19 pandemic in 2020. We can see that the cirrus PLDR shows clear reductions during the period of COVID-19 starting from March 2020 compared with the corresponding months in the previous years (shown with squares in grey in the upper panel of Fig. 5). The same findings on the changes in the cirrus cloud properties and occurrence in March and April 2020 compared to the previous years have been reported by Li and Groß (2021) as well as in early summer 2020 during the BLUESKY campaign by Voigt et al. (2022). Hence, in this study only observations before the COVID-19 outbreak are considered for further analysis. In order to calculate the long-term trends in the cirrus PLDR, we apply two methods in this study, i.e. the ordinary least square (OLS) estimator and Theil–Sen estimator (TSE) (Theil, 1950; Sen, 1968). The OLS estimator is a commonly used method to estimate the unknown parameters in a linear regression model by minimizing the sum of the squares of the differences between the observed dependent variables (here PLDR) and those predicted by the linear function of the independent variable (time in months). However, OLS is strongly affected by the presence of outliers in the time series, thus making the estimation less efficient. The TSE method is a nonparametric estimation technique by calculating all the slopes between pairs of points and choosing the median as the estimation of the regression slope. Compared to OLS, TSE is a robust linear regression against outliers since it uses medians instead of means. The calculated long-term trends (i.e. slopes) and the regressed linear fits with both methods are shown on the plot. We mentioned earlier that the aviation densities in Europe grew more strongly from 2013 (see Fig. 1). We hence further calculate the trends for the observations during a shorter period from March 2013 to February 2020 and the corresponding results are also presented in Fig. 5. First, the PLDR values show an increasing trend with a slope of 0.77 × 10⁻³ and 1.02 × 10⁻³ yr−1 with both methods, respectively, in the 10 years before the COVID-19 outbreak. We note the exceptions that cirrus clouds are characterized by extremely large values of PLDR in January and February 2012, which might be connected with the cold spell in Europe in early 2012 (e.g. DWD, 2012). We further compare the occurrence heights of cirrus clouds in January and February 2012 with other years and find that they are higher in distribution than other years. Conversely, the extremely low values of PLDR in July 2012 are correlated with the much lower occurrence heights of cirrus clouds in July 2012 than in other years. The interpretations for the results are based on the altitude dependence of the cirrus PLDR that is presented in Fig. 4 and also reported in previous studies (e.g. Urbanek et al., 2018; Li and Groß, 2021). For the subsequent analysis the extreme values are considered as outliers and removed. The interpolated data are then analysed with both OLS and TSE methods and the derived slopes are 0.87 × 10⁻³ and 0.97 × 10⁻³ yr−1, respectively. These exercises imply that the TSE method is more efficient for the data analysed here. Compared with the changes in aviation, we find that the PLDR values generally increase following the increasing aviation densities. This is consistent with the previous studies showing that cirrus clouds with enhanced PLDR values form in areas of high aviation emissions or vice versa (e.g. Urbanek et al., 2018; Li and Groß, 2021). Furthermore, larger trends are expected and derived as well from observations in a shorter period from March 2013 with a slope of 1.18 × 10⁻³ and 1.51 × 10⁻³ yr−1 with both methods, respectively. The same analyses are extended to the observations made only during daytime (not shown here), and the corresponding results show slightly larger trends of 0.93 × 10⁻³ and 1.09 × 10⁻³ yr−1 with both OLS and TSE, respectively, than the results derived from the combined day- and night-time observations. All the results of long-term trends with the medians of total PLDR values are summarized in Tables 1 and 2. The comparison indicates that aviation exerts a stronger influence on cirrus clouds in the daytime than at night since there is an aviation fingerprint with two maxima during morning eastbound and afternoon westbound air traffic in the North Atlantic flight corridor covering the area in this study (e.g. Graf et al., 2012; Schumann and Graf, 2013).
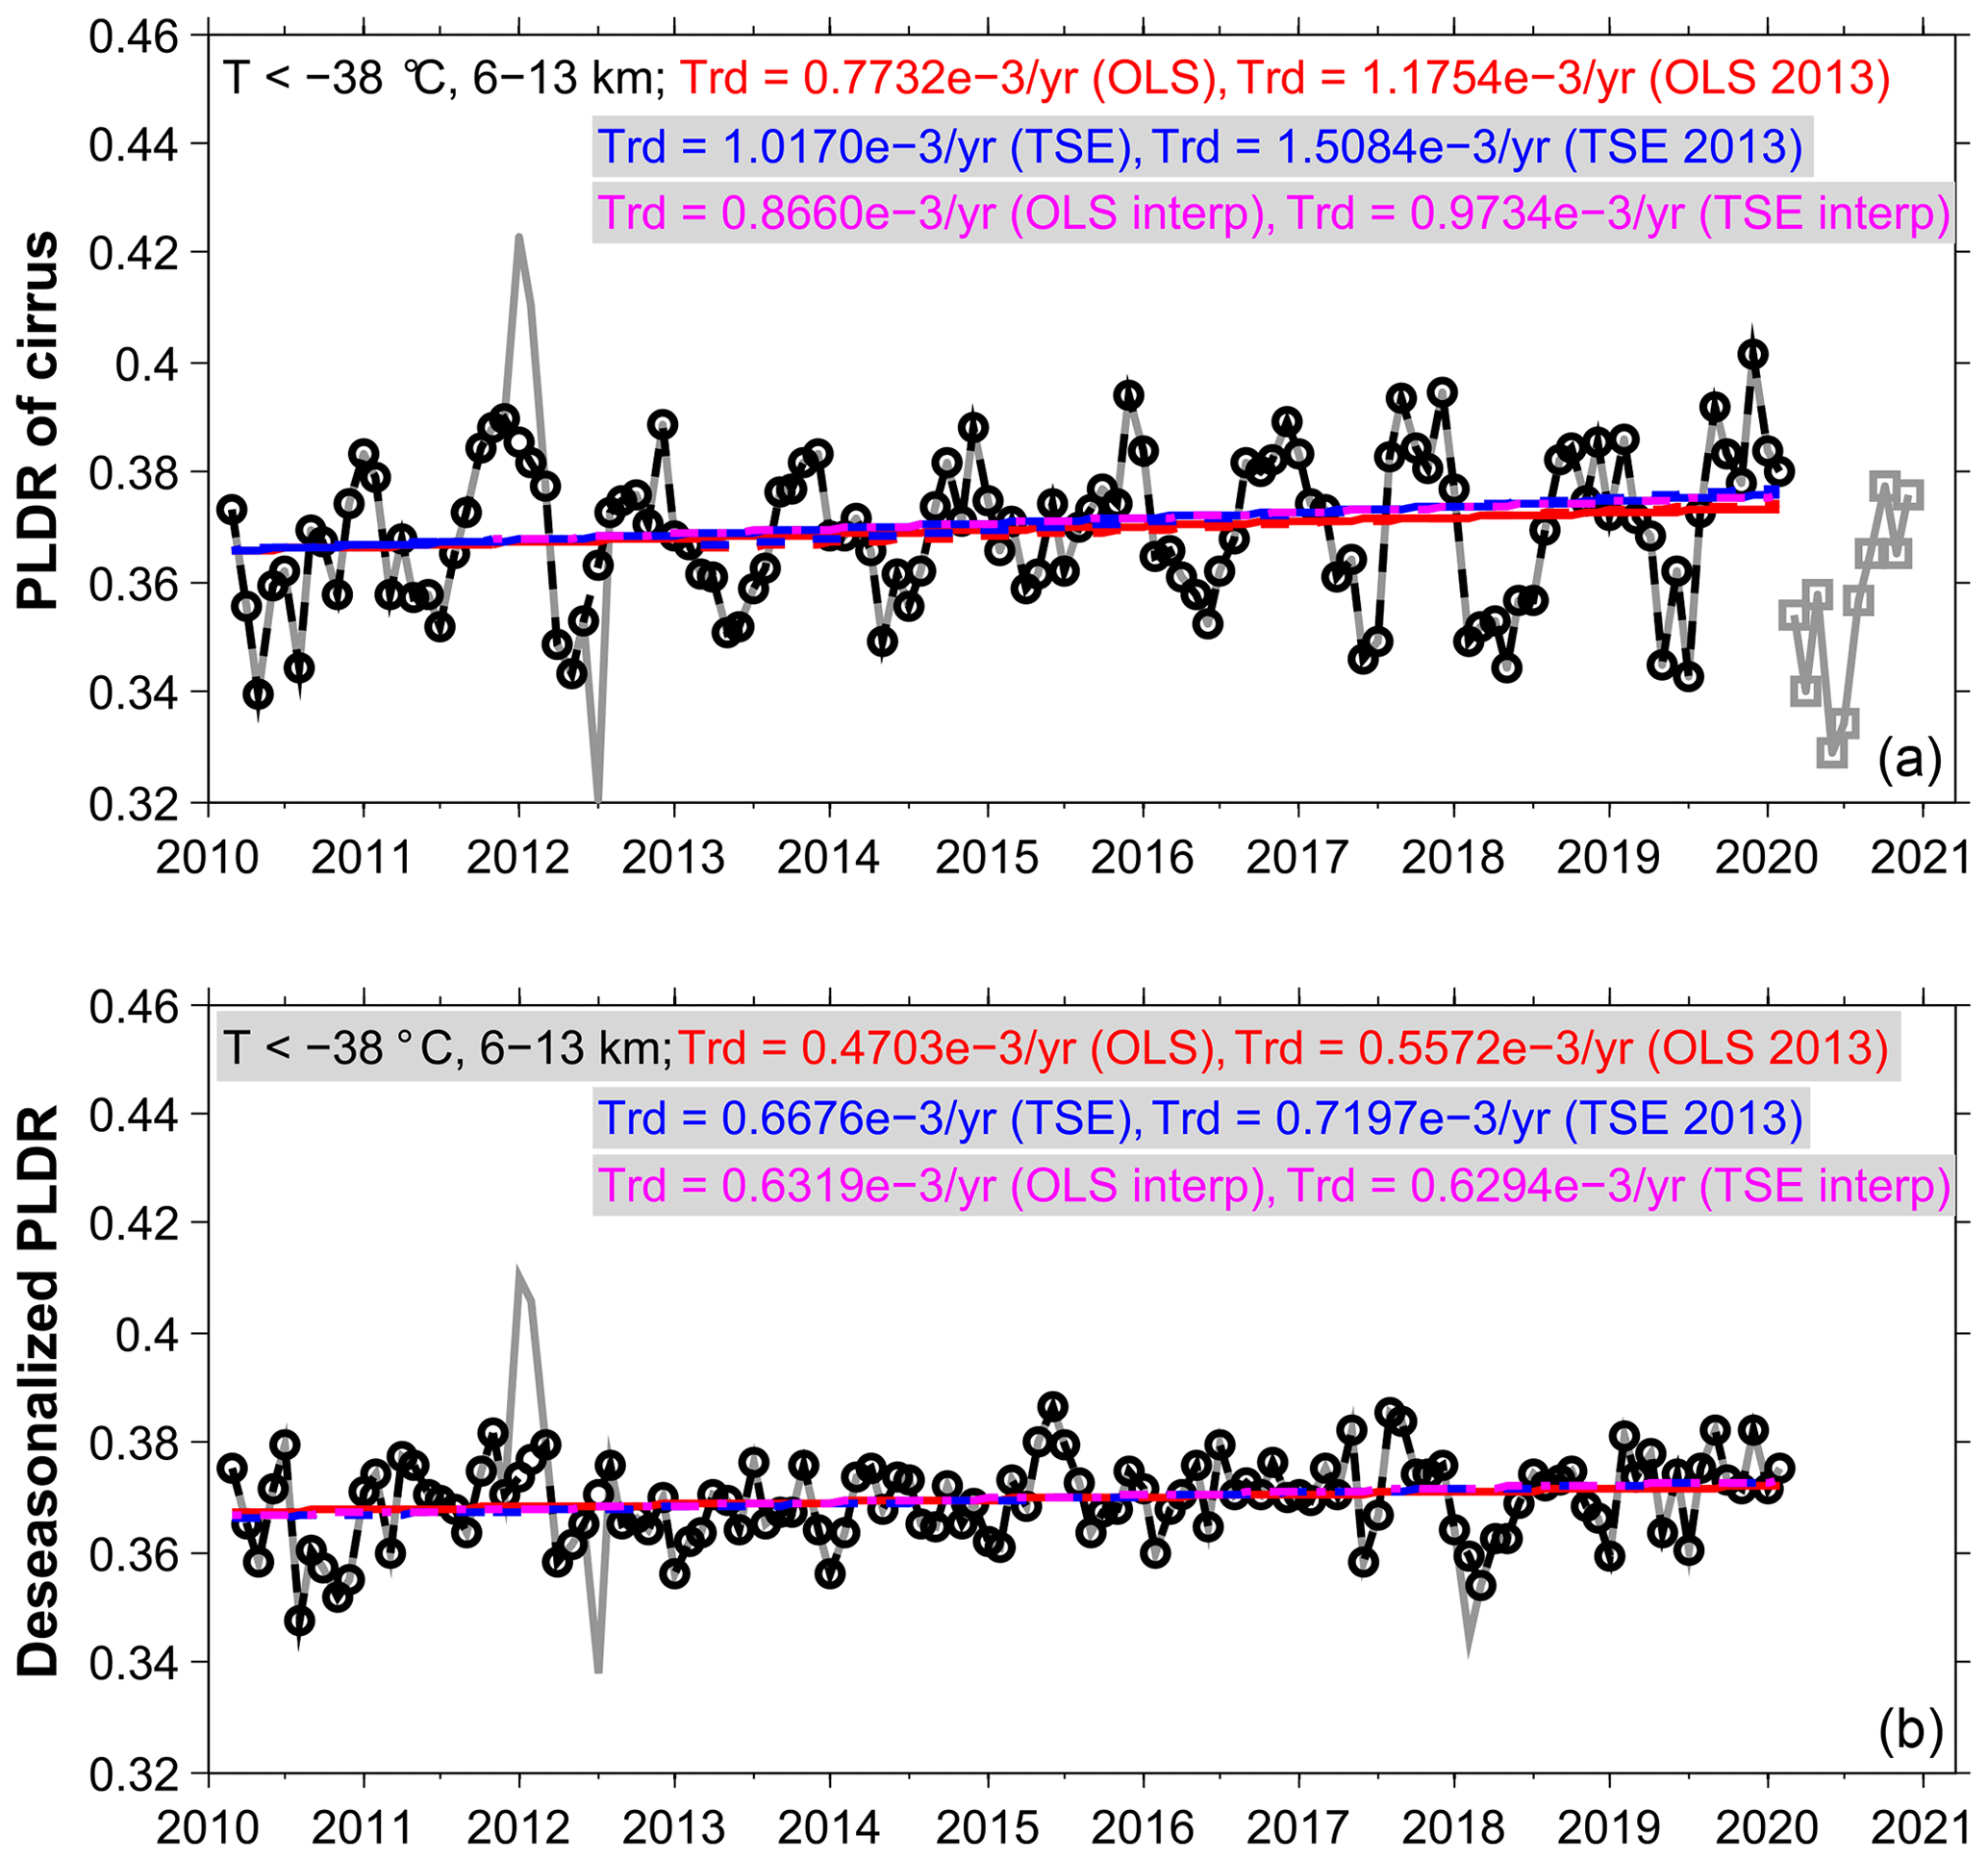
Figure 5(a) Medians of cirrus PLDR in different months from March 2010 to February 2020 shown in grey lines and during the COVID-19 pandemic starting from March 2020 shown in squares. The results are derived from both day- and night-time lidar measurements of CALIPSO. Both OLS and TSE methods are applied to determine the long-term trends (i.e. slopes) of the cirrus PLDR (medians) and the results are indicated on the plot (see text for details). (b) The long-term trends determined from the deseasonalized time series of cirrus PLDR (medians).
Table 1Long-term trends of monthly values of particle linear depolarization ratio (PLDR) within the typical cirrus altitude range from 6 to 13 km derived from both day- and night-time data during the period from March 2010 to February 2020: Comparison between two methods of the ordinary least square (OLS) estimator and the Theil–Sen estimator (TSE), including the Mann–Kendall (MK) significance test.
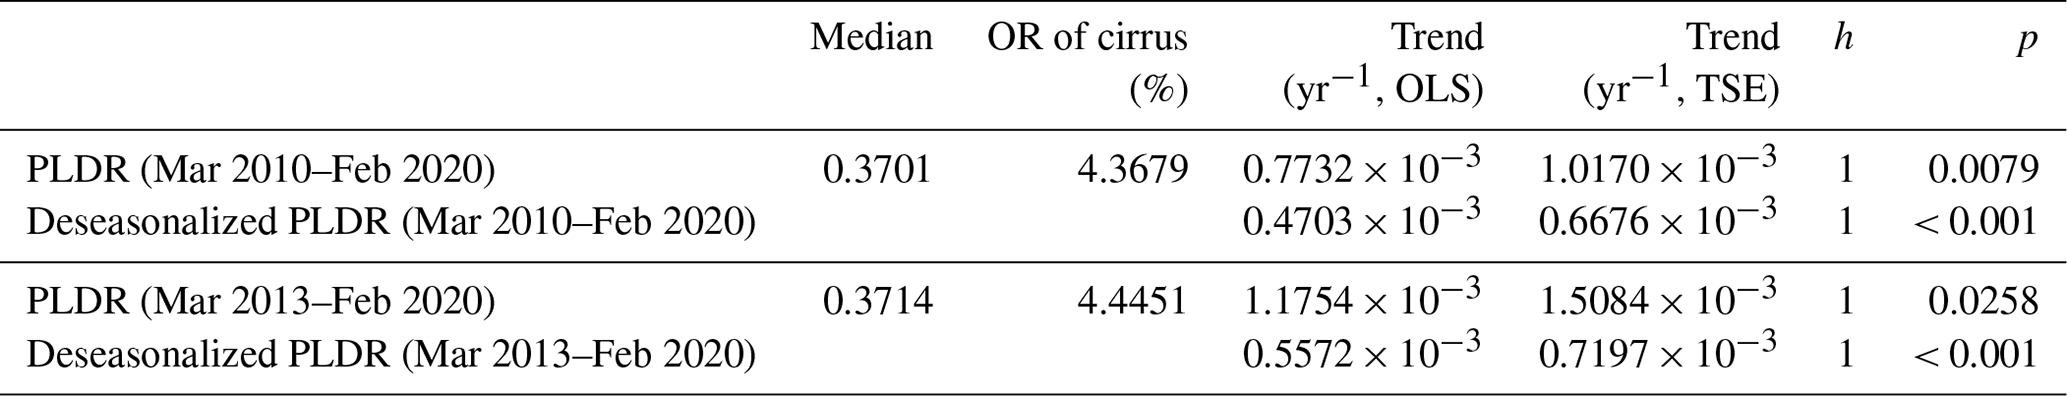
Table 2Same as Table 1, but for the results derived from only daytime data during the period from March 2010 to February 2020.

We mentioned in the previous subsection that cirrus cloud properties (PLDR) and ORs are dominated by seasonal cycles. Spectral analysis with Fourier transform is carried out on the time series of PLDR (not shown here), and the periodogram of PLDR with a dominant peak of power at the point of the 12-month cycle indicates a conspicuous seasonality (aka annual cycle). This repeating cycle of seasonality may obscure the long-term trend in the data that we want to determine. We therefore deseasonalize the data by computing the monthly climatological mean values, subtracting them from each monthly record and finally adding the total mean of PLDR. The deseasonalized values of PLDR are shown in the lower panel of Fig. 5. The detection of seasonal anomalies of extremely large PLDR values in winter and extremely small PLDR values in summer are easy, but the opponent cases are not. With the deseasonalization process, an outlier of February 2018 is detected which, however, will not bias the calculation by using the TSE method. The results of long-term trends again calculated with both OLS and TSE methods and the regressed linear fits are also shown in Fig. 5 (lower panel). The deseasonalized PLDR values show a long-term trend of 0.67 × 10⁻³ yr−1 (with TSE) and 0.72 × 10⁻³ yr−1 (with TSE) for the combined day- and night-time observations in the period from March 2010 to February 2020 and during a shorter period from March 2013 to February 2020, respectively.
Table 3Long-term trends of monthly occurrence rate (OR) of cirrus clouds at the typical cirrus altitude range from 6 to 13 km derived from both day- and night-time data during the period from March 2010 to February 2020 with the Theil–Sen estimator (TSE) method including the Mann–Kendall (MK) significance test.
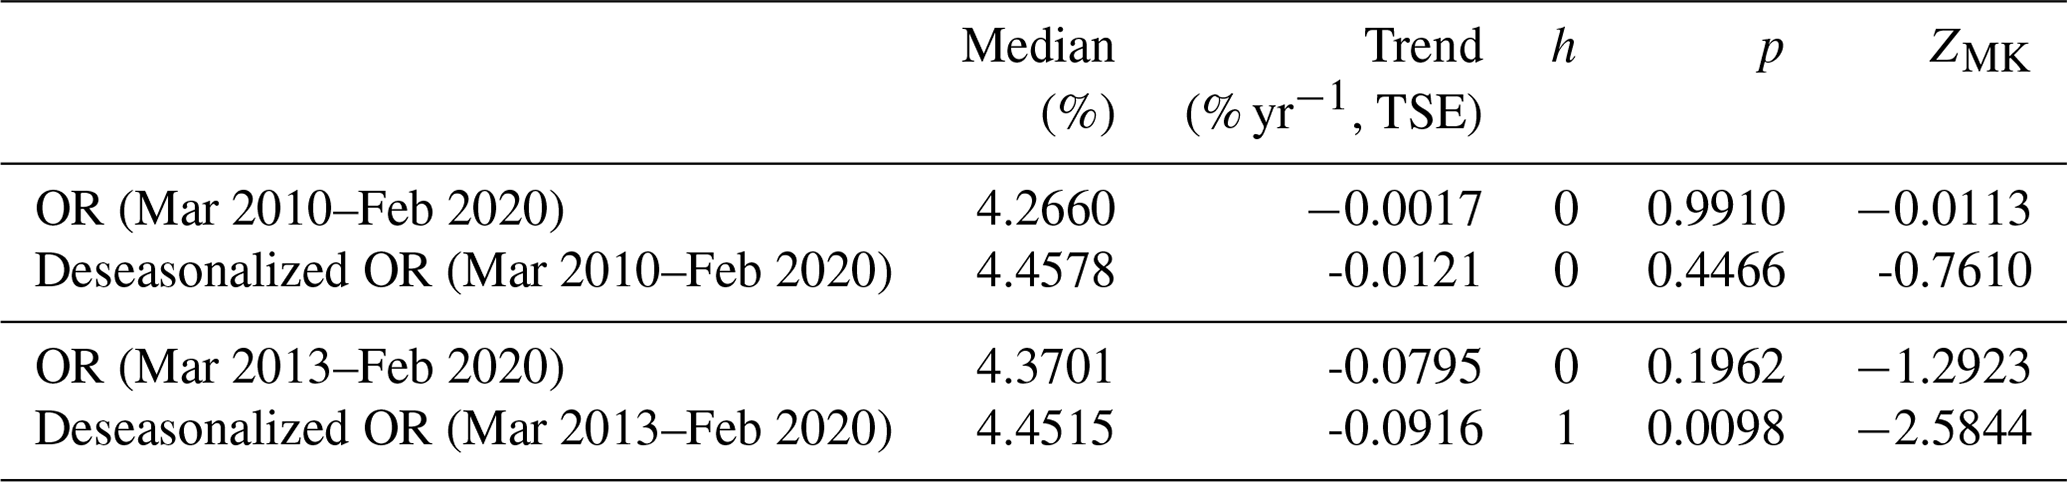
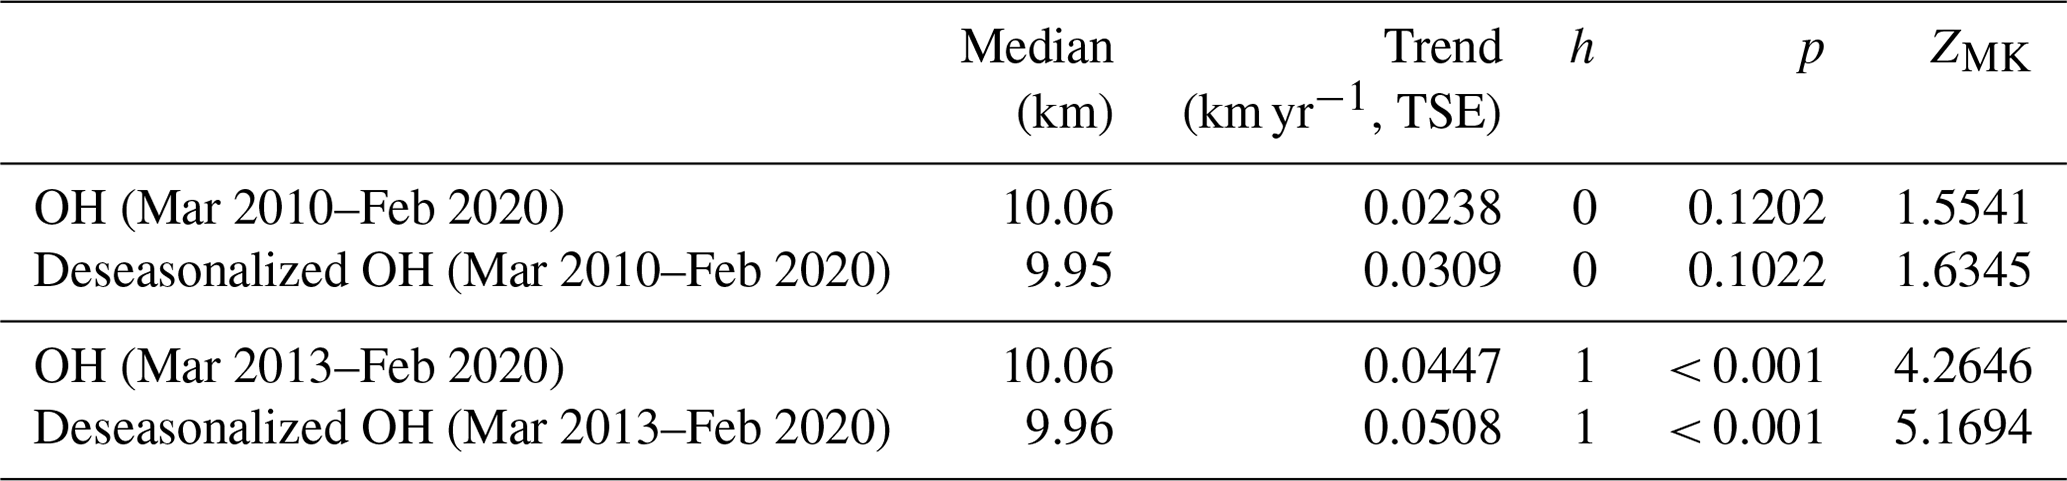
Table 4Long-term trends of monthly occurrence height (OH) of cirrus clouds at the typical cirrus altitude range from 6 to 13 km derived from both day- and night-time data during the period from March 2010 to February 2020 with the Theil–Sen estimator (TSE) method including the Mann–Kendall (MK) significance test.
The significance tests of the derived trends in the cirrus PLDR and their deseasonalized time series are carried out applying the Mann–Kendall (MK) test (Mann, 1945; Kendall, 1975). It is a rank-based nonparametric method that has been widely used to statistically assess whether there is a monotonic trend in a time series of environmental and hydrological data (e.g. Yue et al., 2002) (see Appendix B). The overall results of the MK test for the long-term trends in PLDR at a significance level of p=5 % are presented in Tables 1 and 2 for all the observations (including day- and night-time) and for only the daytime observations, respectively. Here, the p value returned from a MK test is a measure of the probability of rejecting or retaining the null hypothesis H0 stating that the data are independently distributed with no trend. h is a logical value (0 or 1) used to give the test decision: h=1 indicates a rejection of the null hypothesis (i.e. no trend) and h=0 indicates a failure to reject it at the 5 % significance level. From the results of the MK test, it is striking that significantly increasing trends (all with h=1) exist in the monthly values of PLDR and their deseasonalized values in the period from March 2010 to February 2020 as well as during a shorter period from March 2013 to February 2020.
We next turn to the determination of trend in the OR of cirrus clouds. Again, we analyse the observations of cirrus clouds at the altitudes from 6 to 13 km and at the temperatures from −75 to −38 ∘C. The corresponding results are shown in Fig. 6 (upper panel). Clearly, a strong seasonal cycle also exists in the OR with a monthly mean value of up to 8 % in the winter months and as low as 1 % in summer. Following the same procedure, the deseasonalization of cirrus OR was carried out and the corresponding results are shown in the lower panel of Fig. 6. The long-term trends are calculated with the TSE method and the linear fits are overplotted in Fig. 6 showing negative values; i.e. the cirrus ORs decrease with time in the 10 years before COVID-19. However, the significance tests with the MK test show that only a significant trend of −0.0916 % yr−1 exists in the deseasonalized OR for the period from March 2013 to February 2020. The derived long-term trends in the cirrus ORs are summarized in Table 3 along with their median values and the results of the significance test. Nevertheless, the decreasing cirrus OR can be traced back to the changes in the meteorological conditions, i.e. with increasing temperatures and decreasing humidity, during this 10-year period (see Fig. 2).
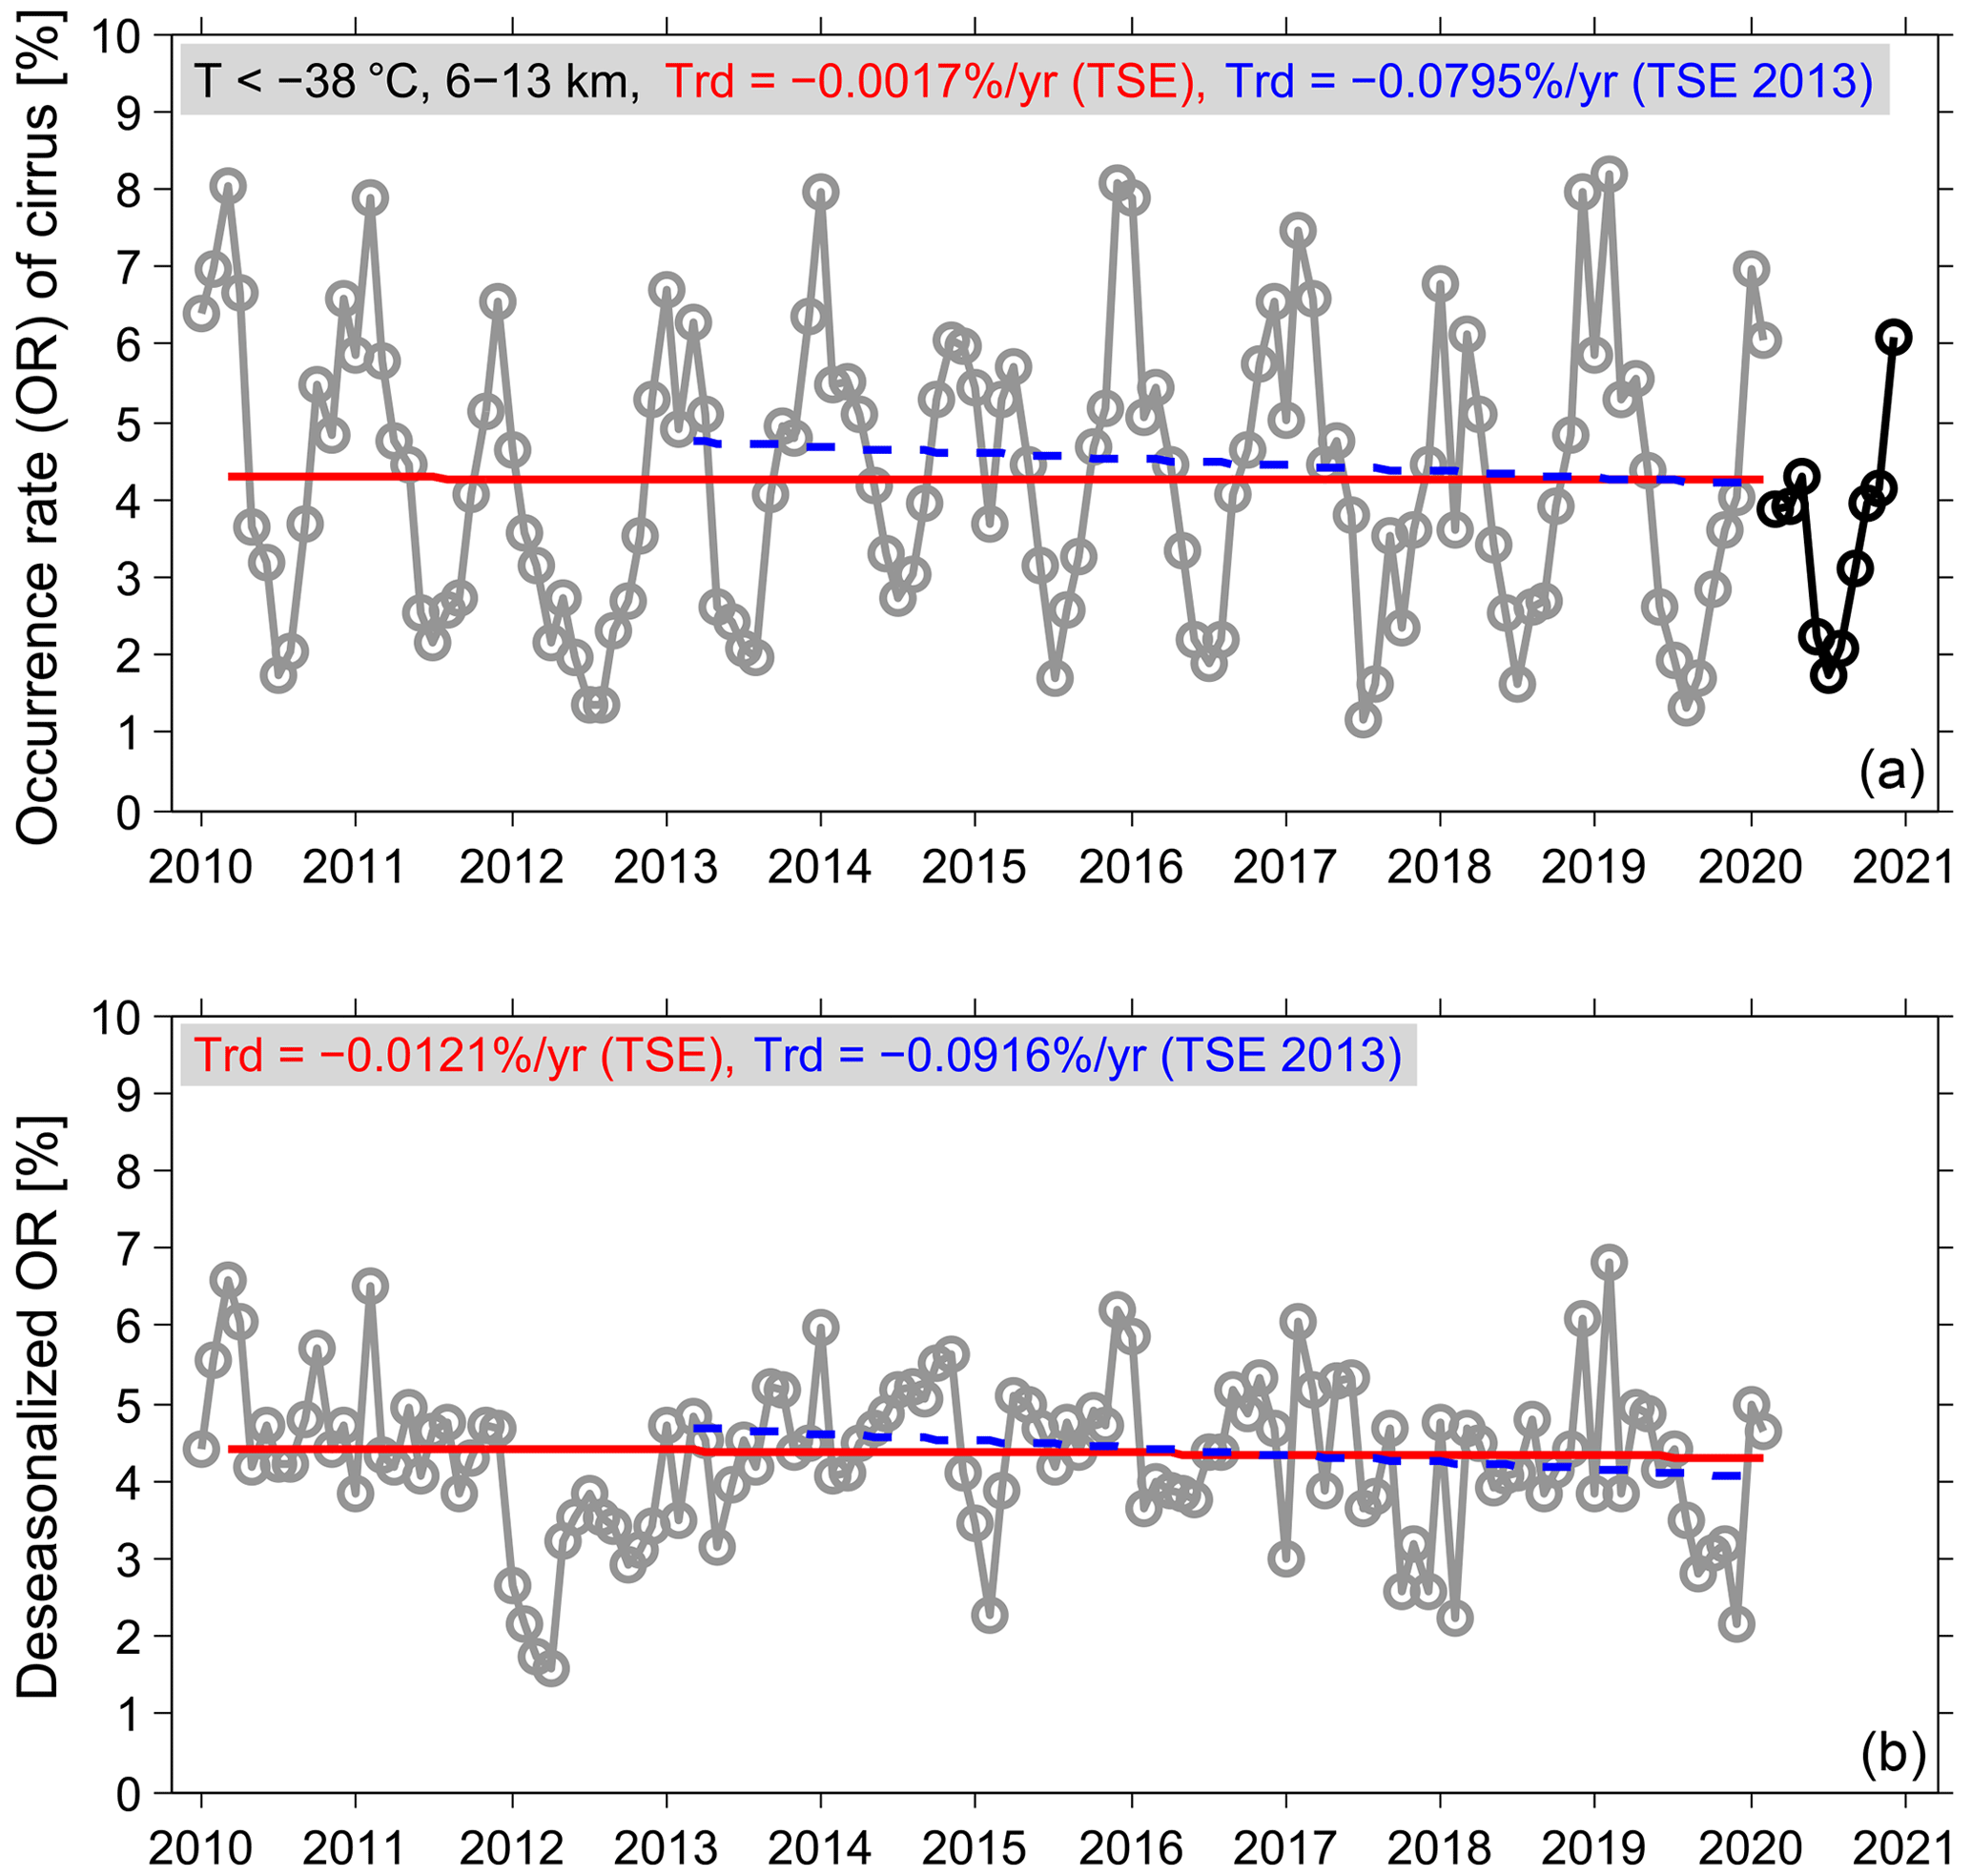
Figure 6Long-term variations in monthly occurrence rate (OR) of cirrus clouds in the period 2010–2020 as well as the linear fitting for the values in the periods from March 2010 to February 2020 (in red) and from March 2013 to February 2020 (in blue). The ORs of cirrus clouds during the COVID-19 pandemic are shown in black for comparison. The corresponding trends (i.e. the slopes) are indicated on the plot: panel (a) for the derived monthly OR from all the data including day- and night-time; panel (b) for the deseasonalized time series of OR.
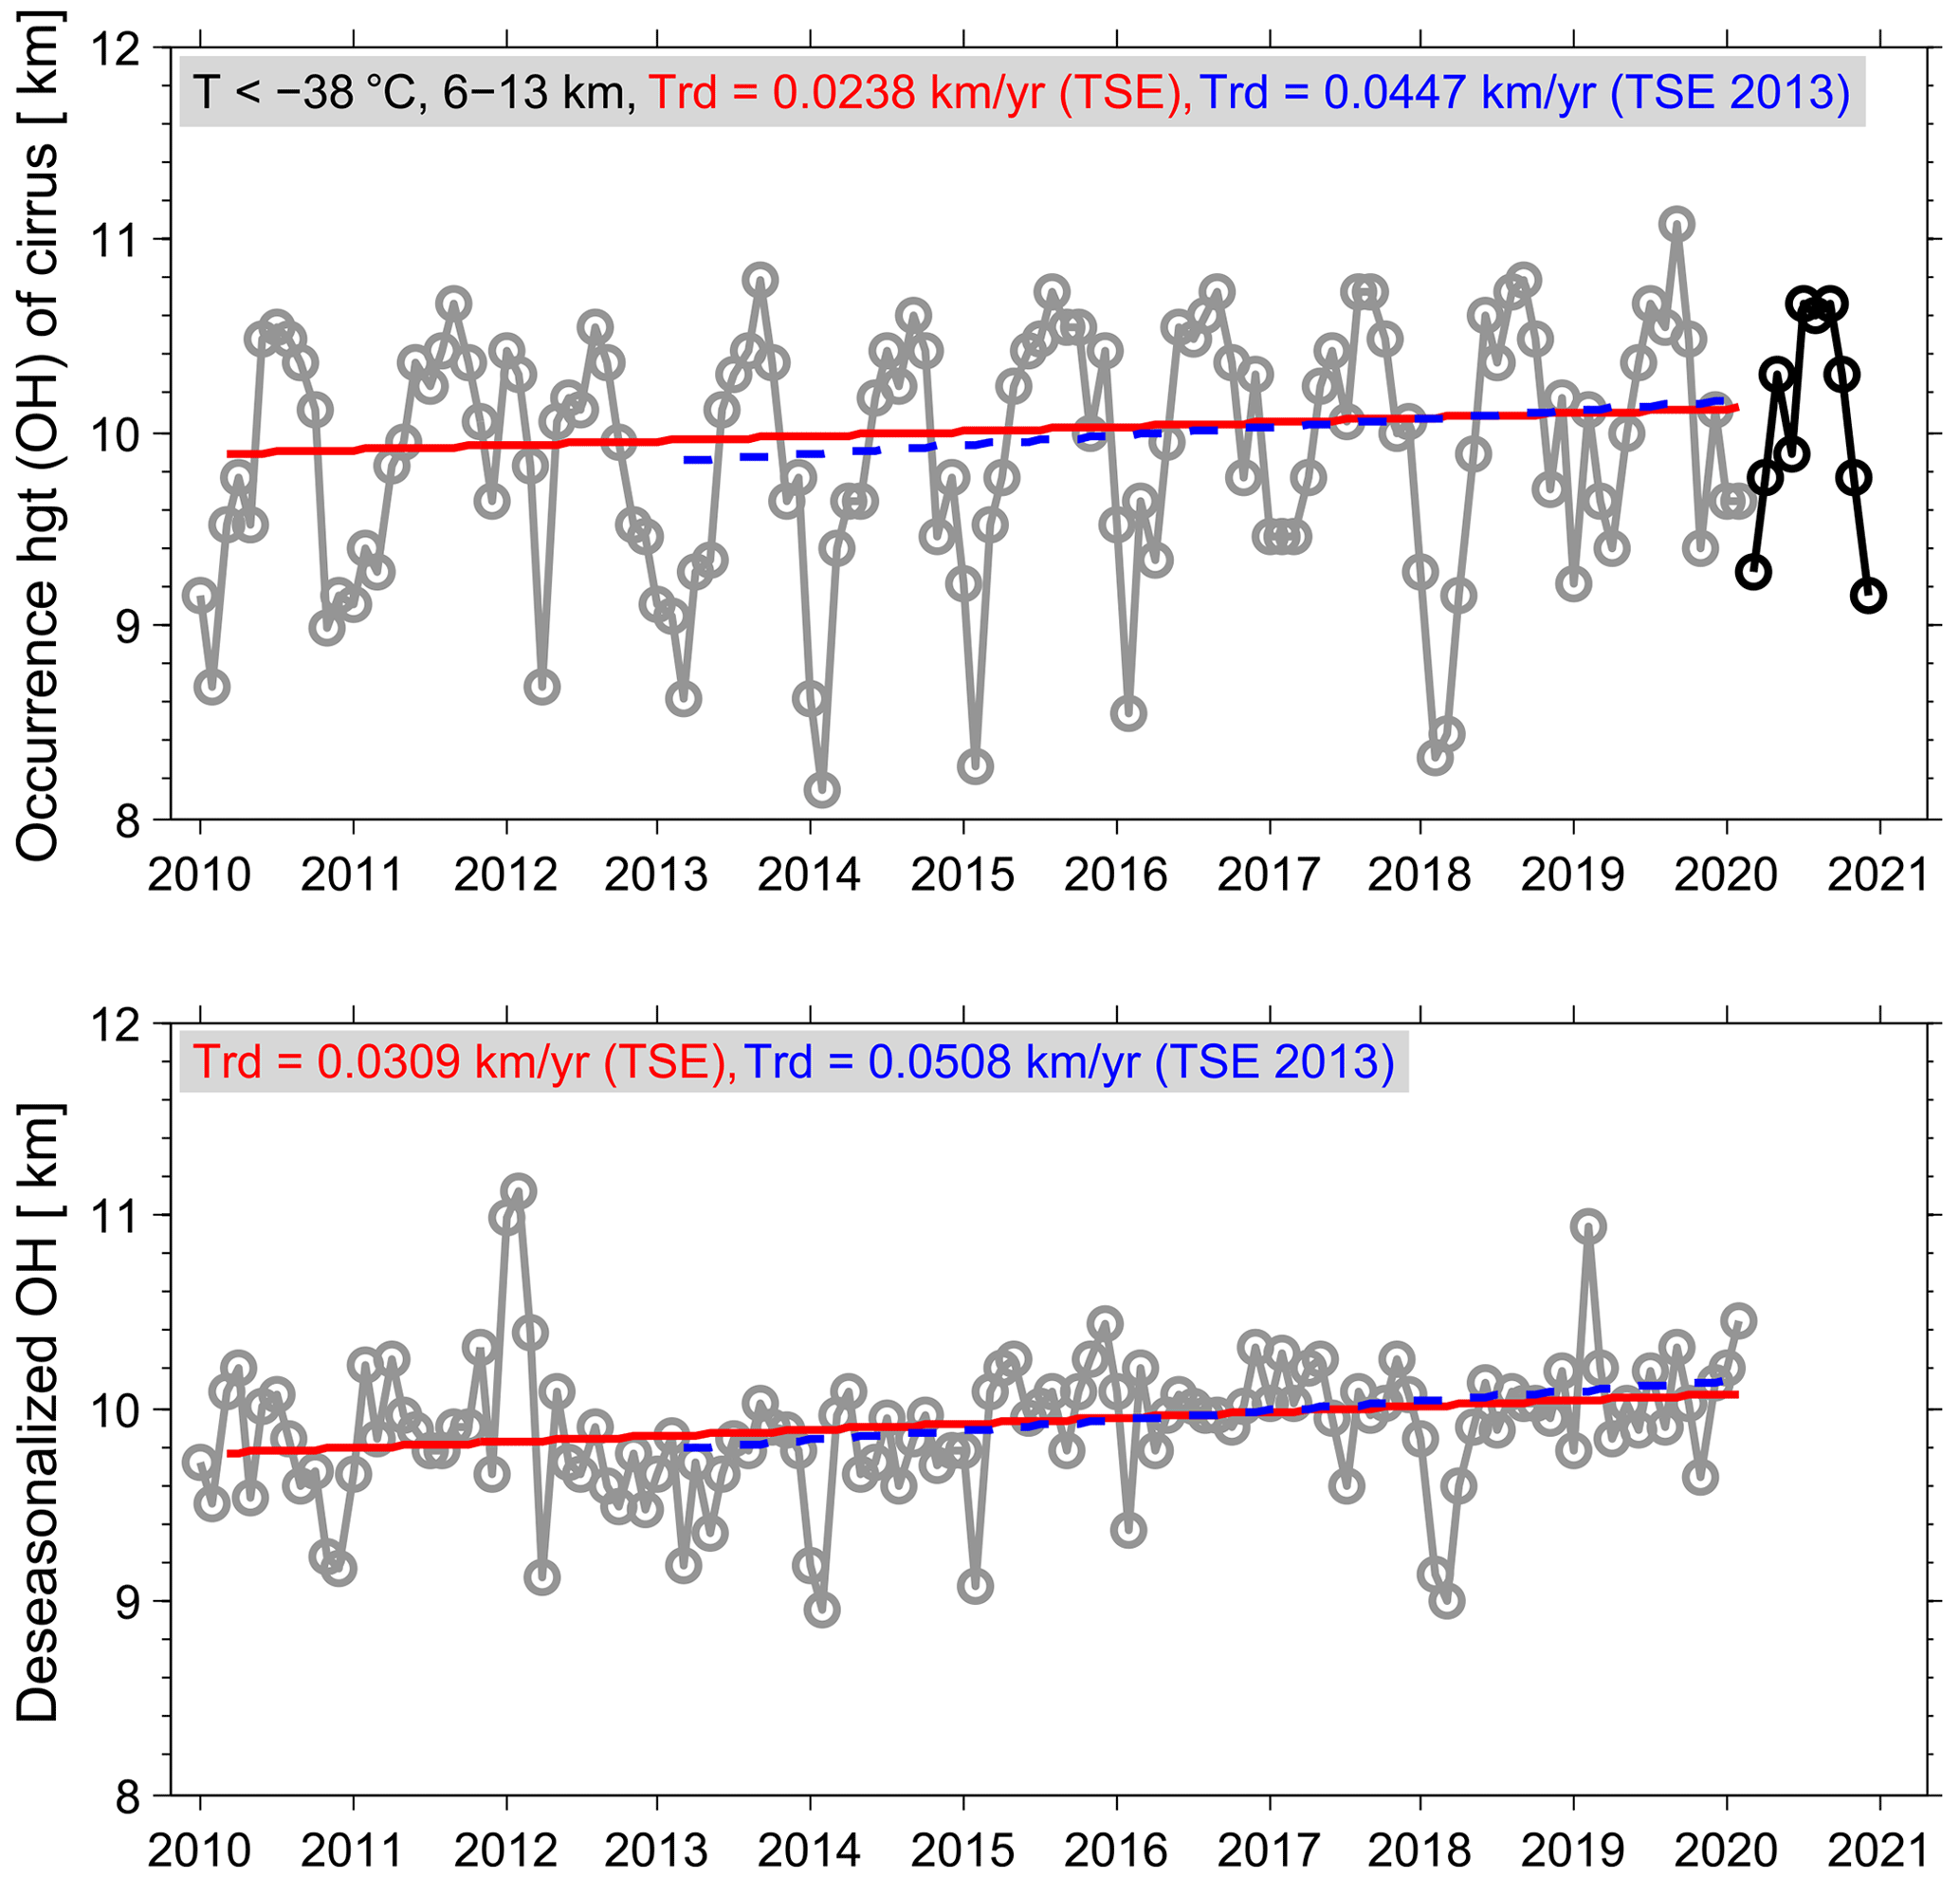
We presented earlier that PLDR generally increases with altitude. We hence determine the occurrence heights of cirrus clouds and their monthly means are shown in Fig. 7. The occurrence heights of cirrus also follow a distinct seasonal cycle with larger values in the summer months than in winter, which indicates that cirrus clouds in winter occur at the full altitude range from 6 to 13 km but in summer only at higher altitudes. The same procedures to calculate the long-term trends with the TSE method were carried out and the corresponding results are shown in Fig. 7. It is striking that the occurrence heights of cirrus clouds show a trend of 0.0238 km yr−1 (0.0447 km yr−1) during the full period from March 2010 to February 2020 (a shorter period from March 2013 to February 2020). After deseasonalizing the data, we reach a long-term trend of 0.0309 km yr−1 (0.0508 km yr−1) for the full period (a shorter period). Table 4 shows the summary of the derived long-term trends in the occurrence heights of cirrus clouds and the corresponding significance test. Importantly, the trends in the deseasonalized values of cirrus occurrence heights are statistically significant according to the results of the MK test. These findings are consistent with the upward shift of the aircraft cruising altitudes in the last years due to the fact that aircraft flying higher leads to less fuel burn and hence less CO2 emissions (https://www.eurocontrol.int/publication/eurocontrol-data-snapshot-21-aircraft-flying-higher-more-efficiently-and-sustainably, last access: 27 October 2022). In contrast to this, however, an upward displacement of air traffic may lead to the increase in the contrail coverage (e.g. Fichter et al., 2005).
4.1 Correlation with the ambient temperatures
It is reported that temperatures and other meteorological parameters play a decisive role in the formation and maintenance of cirrus clouds (e.g. Bailey and Hallett, 2004; Um et al., 2015). Given the scope of this study, we only discuss the contributions of temperature to the cirrus cloud properties. We first compare the relationship between the cirrus PLDR and the corresponding ambient temperatures in clouds. The temperatures used for this analysis are derived from the GEOS-5 (Goddard Earth Observing System, version 5) model data product provided to the CALIPSO by the GMAO (Global Modeling and Assimilation Office) data assimilation system. The comparisons between both quantities show that the dependence of the cirrus PLDR on the ambient temperatures has clearly different variations separated at a temperature threshold of ∼ −50 ∘C. At temperatures below −50 ∘C, the PLDR values are roughly negatively correlated with the ambient temperatures. At temperatures warmer than −50 ∘C, however, PLDR shows no clear correlation with the ambient temperatures, with the majority of values falling within the range from ∼ 0.23 to 0.45. The same relationship was determined also from the monthly data in April from 2014 to 2020 by Li and Groß (2021) (see their Fig. 7). For all the data in total, the PLDR values show a negative correlation with the corresponding ambient temperatures.
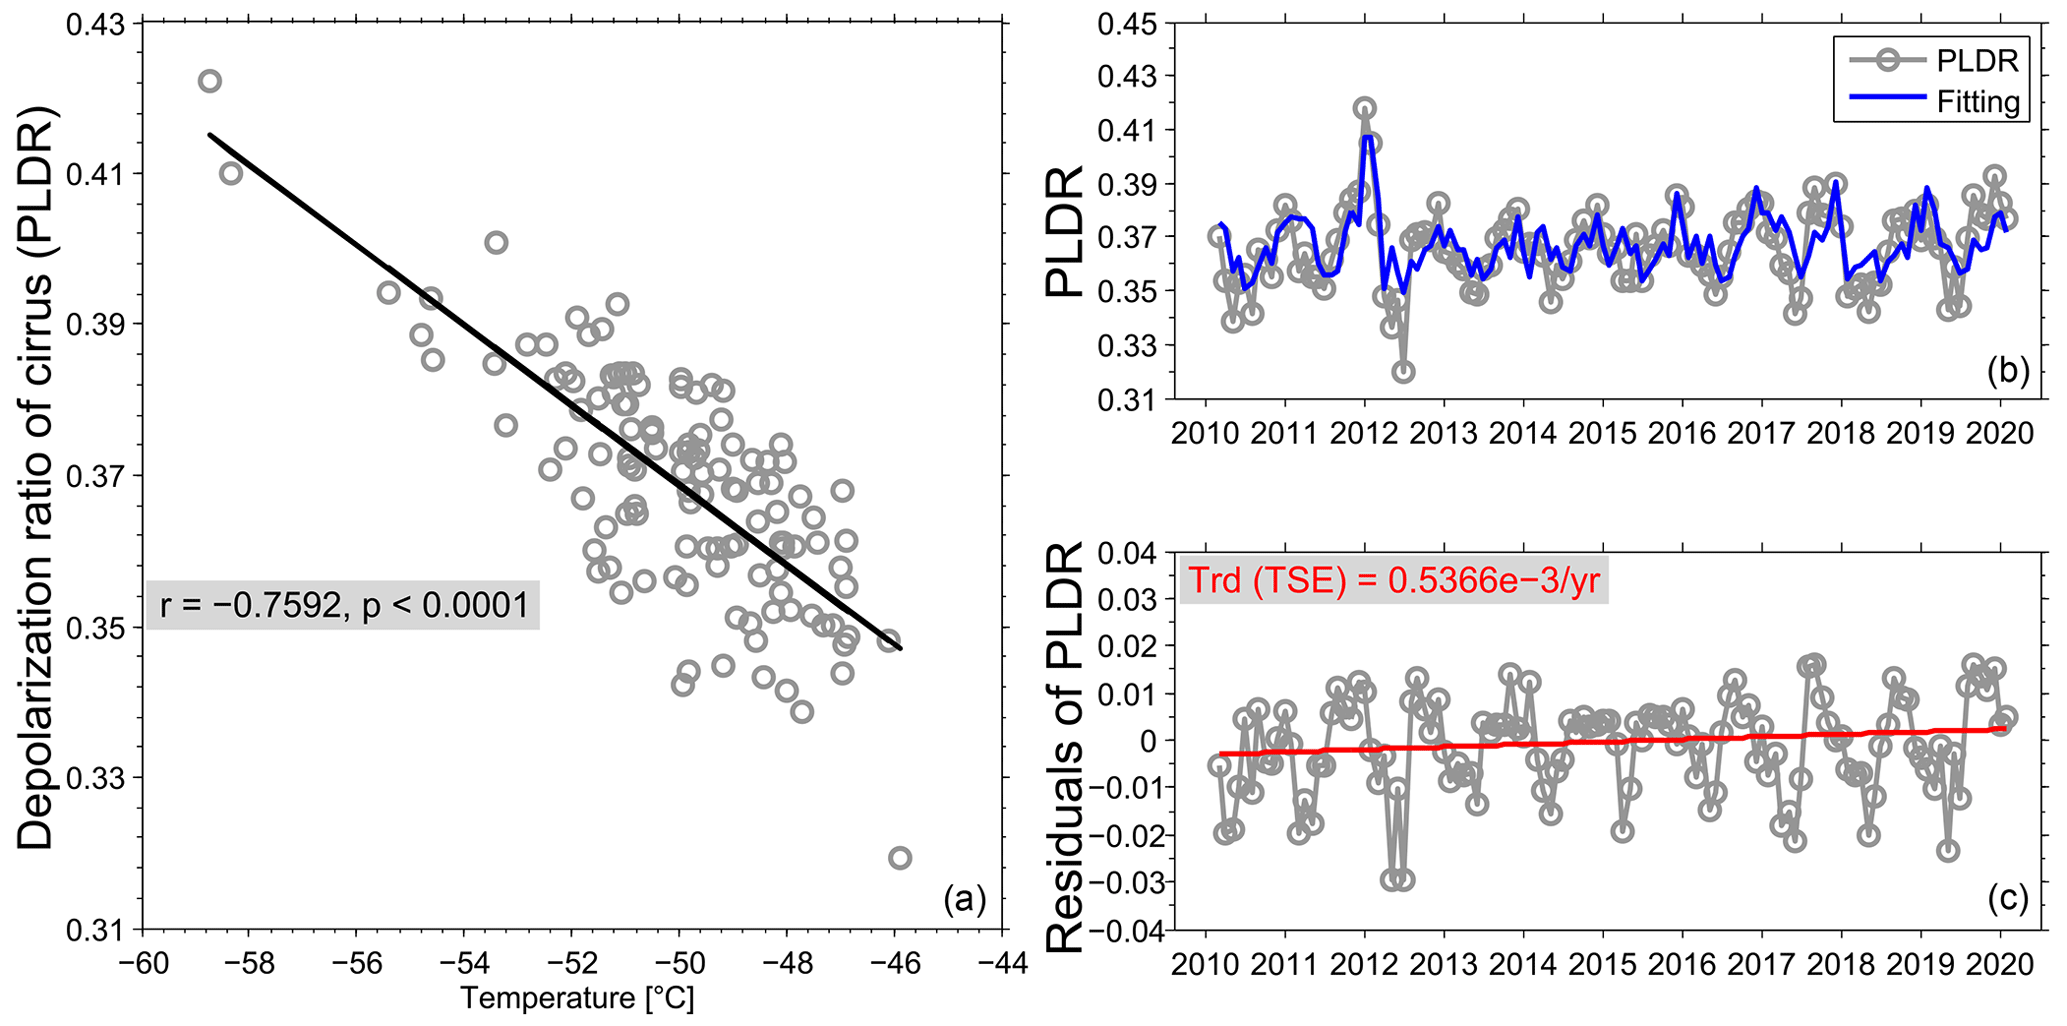
Figure 8(a) The grey circles stand for the correlation between the monthly medians of cirrus PLDR and the corresponding ambient temperatures, and the black line for the linear fitting line derived from all data points. (b, c) The monthly medians of cirrus PLDR during the period from March 2010 to February 2020 are shown in grey and the regressed values with the first-degree polynomial are shown in blue (b); the residuals after removing the regressed values from the monthly medians of PLDR are shown in grey and the linear fitting line with the Theil–Sen estimator (TSE) method is shown in red, with the long-term trend of 0.54 × 10⁻³ yr−1 indicated on the plots (c).
We further calculate the medians of cirrus PLDR in each month from March 2010 to February 2020 as well as the medians of ambient temperatures in cirrus clouds and the corresponding results are presented in the left panel of Fig. 8. The scatter plots clearly show that the cirrus PLDR values increase following the decreasing ambient temperatures with a correlation coefficient , which is statistically significant (p<0.0001). Due to the strong influence of the ambient temperatures on the properties of cirrus clouds, an appropriate method is needed to eliminate the parts in cirrus PLDR induced by temperatures. In this study, a regression model based on linear dependence is applied to isolate the temperature-induced parts:
where the variable T stands for the ambient temperature and Xth for the theoretical value of PLDR regressed from temperatures. After regression analyses, the absolute deviation ΔX (i.e. the residual) of the observational data Xobs from the corresponding Xth can be calculated by
Using the derived ΔX, linear trends can further be determined using a simple linear regression model:
where “time” stands for each month, season, or year for which data are available. For this study, a linear trend coefficient (slope) m can be determined from the monthly values of PLDR medians using Eq. (4).
Applying the linear dependence by Eq. (2) as well as Eq. (4), we derive the regressed PLDR values and the residuals (see the right panels of Fig. 8). The long-term trend in the residuals is calculated with the TSE method showing an increase of 0.54 × 10⁻³ yr−1, which is above the 90 % confidence level according to the MK test with p=0.0582. For a comparison, we also determine the regressed values according to the quadratic and cubic dependence, which, however, show no major difference from the results based on the linear dependence. The same analyses were also carried out on the daytime observations resulting in a long-term trend of 0.69 × 10⁻³ yr−1 in the residuals of PLDR, which is statistically significant with p<0.001. We should note that the dependence of the cirrus PLDR on the ambient temperatures to the full extent is not linear but shows different characteristics in different temperature range (roughly separated at ∼ −50 ∘C). However, the monthly mean values of both quantities along the full altitudes of cirrus clouds can still provide a climatological relationship between them. After removing the temperature-induced parts in the cirrus PLDR, the residuals still show an increasing trend over this period, which are presumed to be due to other factors than the meteorological conditions.
We discussed earlier that the occurrence heights of cirrus clouds show on average an increase over this period which, in general, corresponds to a decrease in temperatures in clouds. The altitude dependence of temperatures is assumed based on the fact that the tropopause heights are roughly 1.2 km higher than the peak of the cirrus occurrence heights (i.e. the most probable altitudes at which cirrus clouds occurred) and both parameters are highly correlated including their seasonal cycles and trends.
4.2 Correlation with the air traffic densities over Europe
Using the airborne lidar measurements during the ML-CIRRUS campaign in 2014 (Voigt et al., 2017), Urbanek et al. (2018) concentrated on the specific clouds and found lower supersaturation in the cirrus clouds with enhanced PLDR which were traced back to be forming in areas of high aviation emissions. Recently, Li and Groß (2021) analysed the satellite data of CALIPSO which cover the European area (i.e. the same research area as the current study) and found that strong reductions in air traffic in Europe caused by the COVID-19 pandemic led to significant changes in cirrus cloud properties in terms of PLDR. In this study, we further study the impact of the increasing air traffic on the cirrus clouds in a longer period of 10 years before COVID-19. We described that the air traffic densities in the 42 European countries and regions (see Fig. 1) show a clear seasonal cycle which is, however, roughly anticorrelated with the seasonality in the cirrus PLDR. To directly compare them, we first deseasonalize both datasets (here considering CO2 emissions as a proxy of air traffic densities) and the results are shown in Fig. 9. Please note that both the number of flights and the CO2 emissions from aviation are available and analysed here. The results derived from both datasets are consistent. Hence, we will only concentrate on the effect of CO2 emissions from aviation. According to the description above, the outliers in the deseasonalized PLDR have been removed and further interpolated (see Fig. 5). Furthermore, the annual mean variations of the deseasonalized PLDR are derived using a 12-point moving average smooth (shown in black in Fig. 9). We can see that the unexpected extreme values of PLDR might significantly change the deseasonalized dataset. The low values of the deseasonalized PLDR in the second half of 2010 and the first half of 2018 are presumed to be due to lower values of PLDR in August and November 2010 as well as February–March 2018 compared to the corresponding months in other years, respectively, which are correlated with the lower occurring heights of cirrus as discussed above (see Fig. 7). Besides the anomalies, an increasing trend can conspicuously be recognized in both parameters, especially during the period from January 2013 to February 2020. The correlation coefficients between them for a full period from January 2010 to February 2020 are r=0.25 and r=0.54, respectively. Larger values of the correlation coefficients (r=0.58) are also derived for a shorter period from January 2013 to February 2020. The confidence levels for all the cases are above 99.5 %.
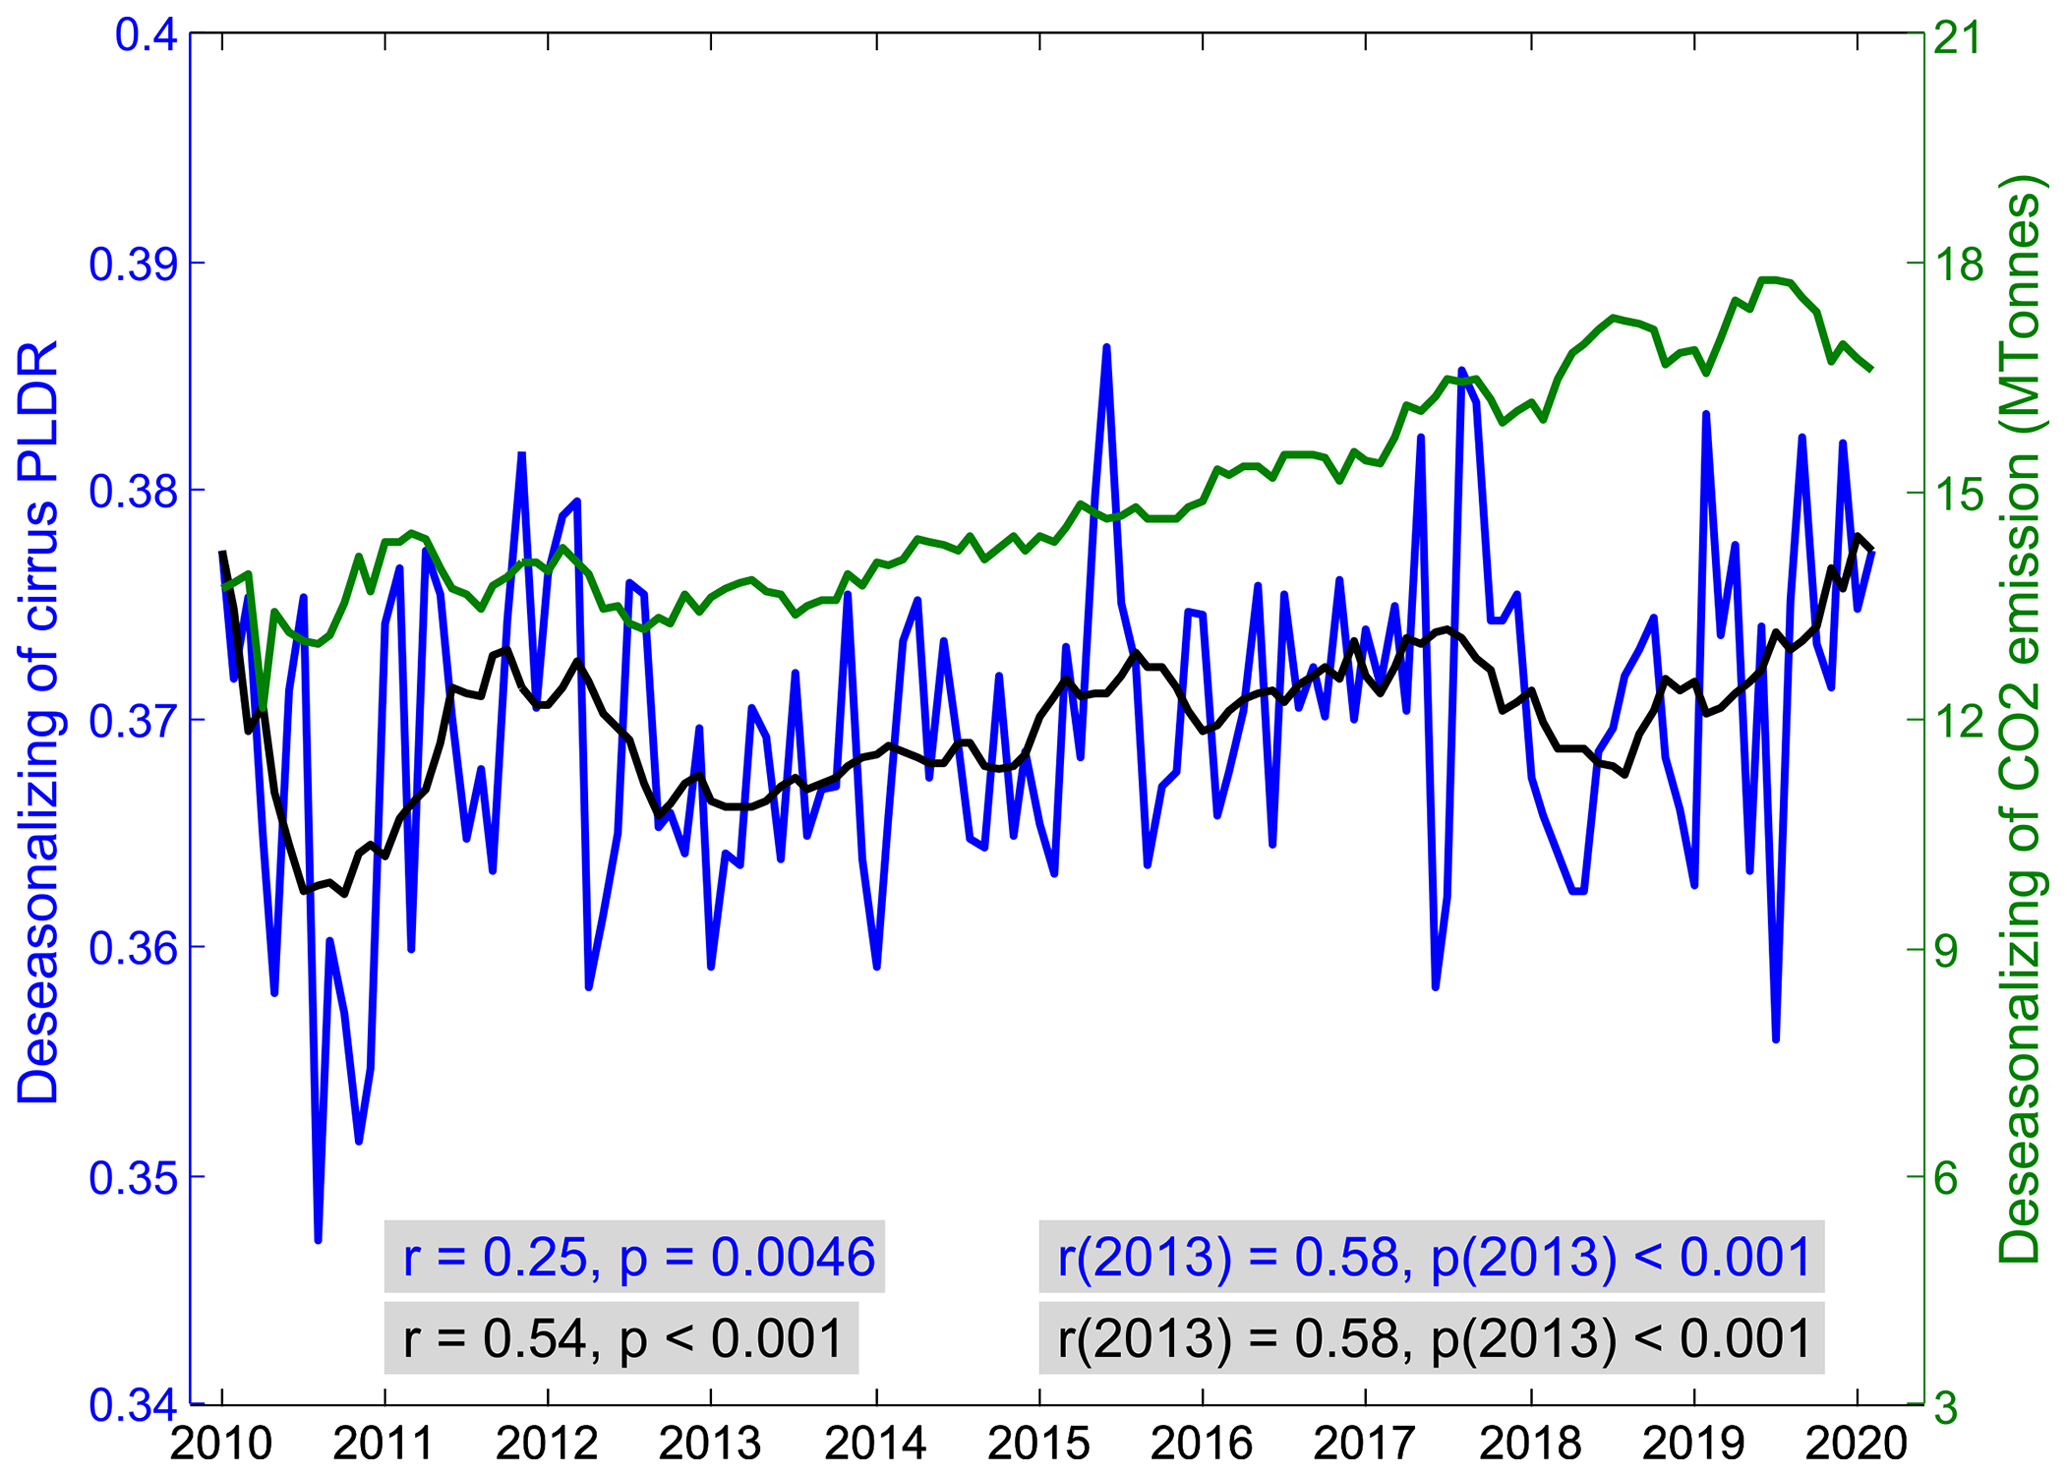
Figure 9Comparison between the deseasonalized time series of cirrus PLDR (in blue) and the corresponding deseasonalized CO2 emissions from aviation in Europe (in green). The annual mean variations of the deseasonalized PLDR are overplotted with a 12-point moving average smooth (in black). The correlation coefficients between both parameters for a full period as well as for a shorter period from January 2013 are calculated and indicated on the plot, which are all at the confidence level above 99.5 %.
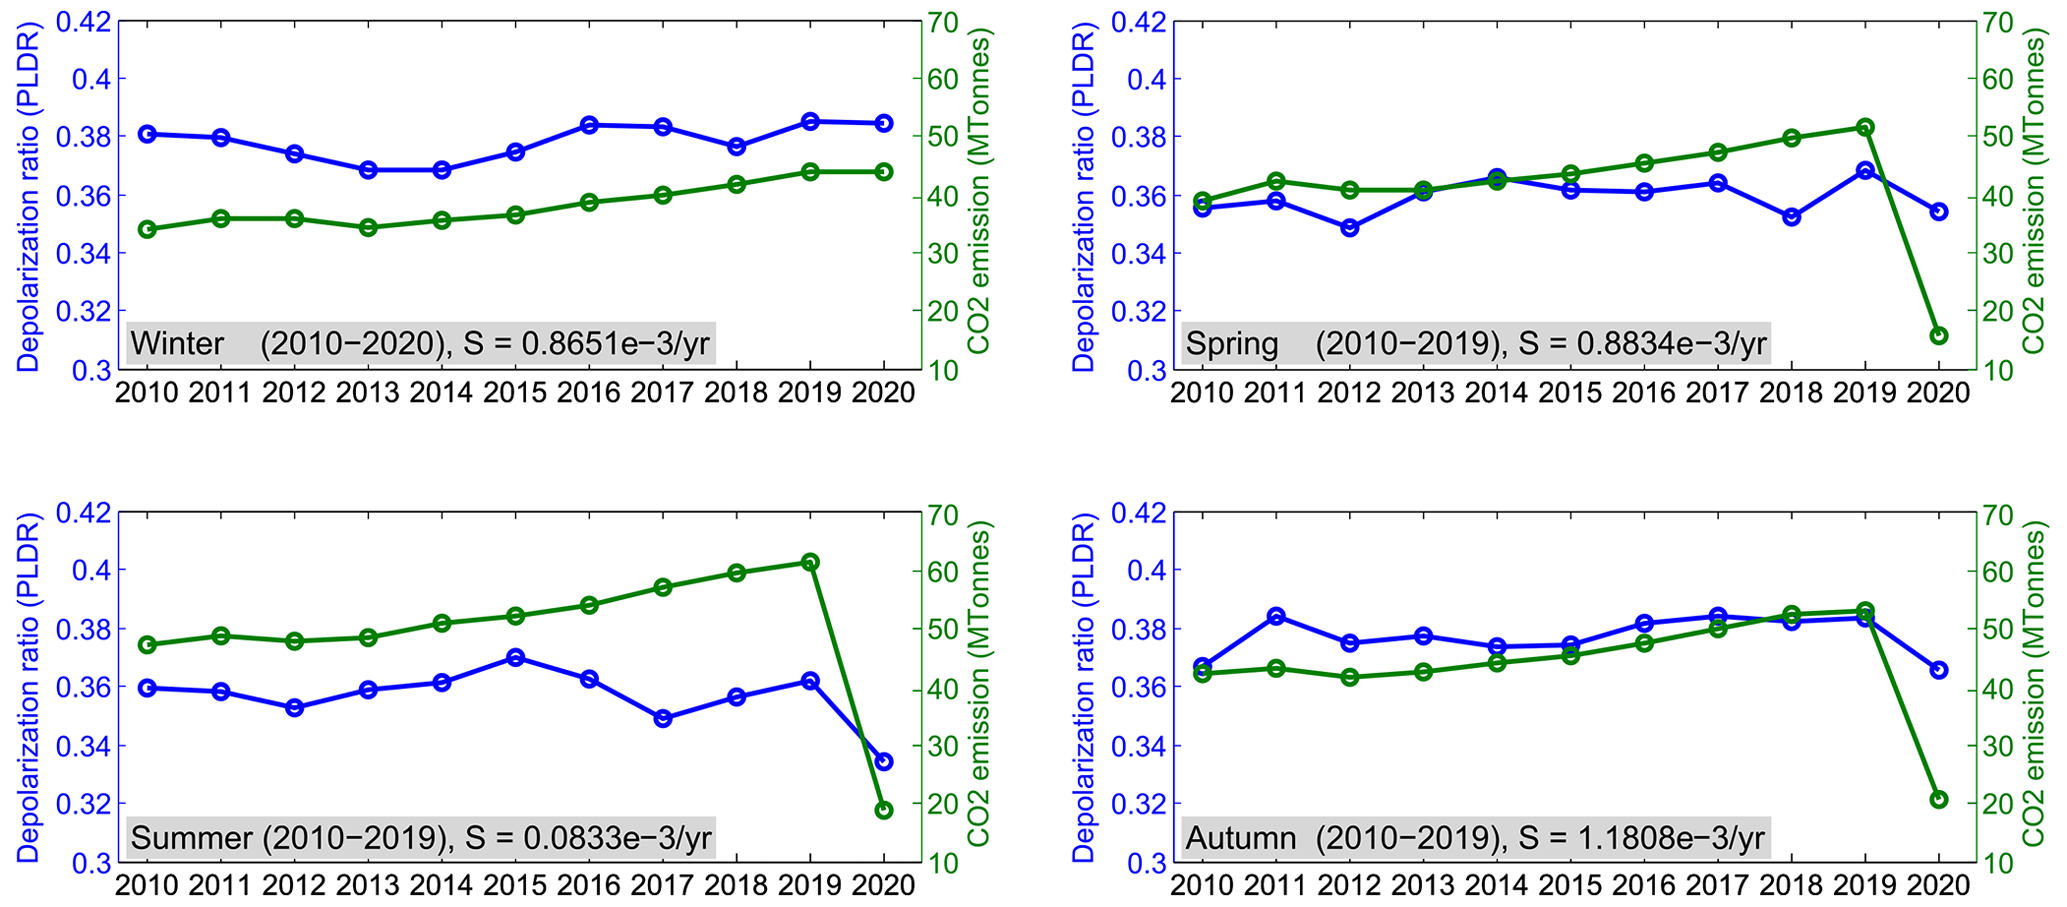
Figure 10Long-term trends in cirrus PLDR in different seasons and their correlations with the corresponding CO2 emissions from aviation in Europe. There are increasing trends in PLDR as well as CO2 emissions from aviation in all seasons in the 10 years before COVID-19. The correlation analysis between both parameters shows a strong correlation in winter, spring, and autumn, but a weak correlation in summer.
Table 5Correlation coefficients between the monthly PLDR values of cirrus clouds within the altitude from 6 to 13 km and corresponding CO2 emissions from aviation as well as number of flights in Europe in different seasons.
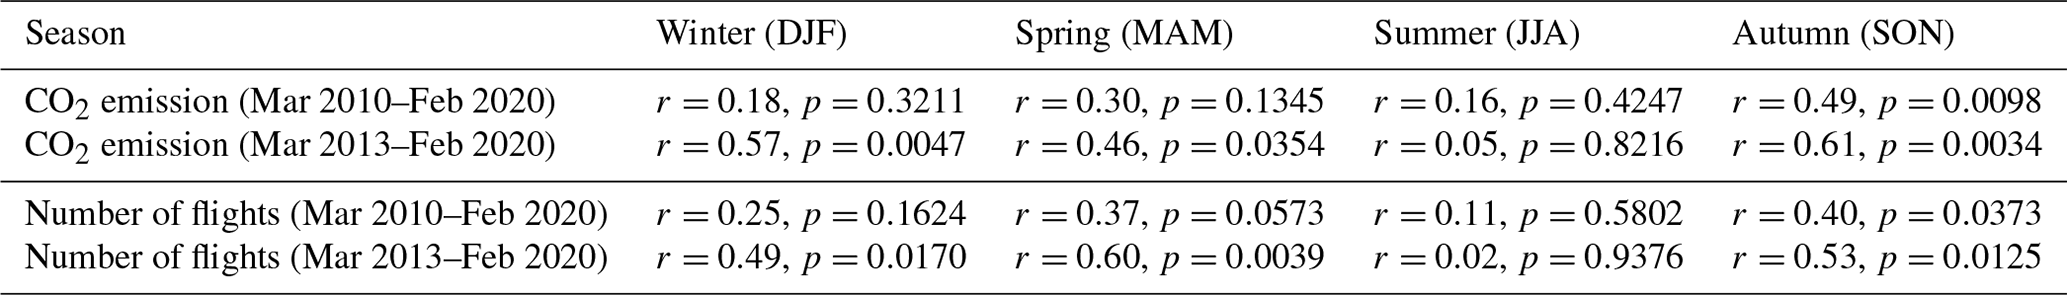
With the general relationship between the cirrus PLDR and air traffic in the 10-year period in mind, we may further concentrate on their correlations in different seasons. To illustrate the seasonal variations of the relationships between the cirrus PLDR and air traffic, we show the comparison between both parameters in different seasons (winter: December–February, but only January and February for 2010; spring: March–May; summer: June–August; autumn: September–November) in Fig. 10. First, the cirrus PLDR values in all the seasons show increasing trends in the 10 years before COVID-19. The trend in summer, however, is much smaller (10 times smaller) than those in other seasons. Strong reductions in air traffic due to the COVID-19 pandemic starting from March 2020 led to corresponding reductions in the cirrus PLDR in the spring, summer, and autumn of 2020, but a slight increase in the winter of 2020 (including December 2019) (Li and Groß, 2021). The calculated correlation coefficients between both parameters are all positive, but the confidence levels are above 95 % only for summer and autumn. We also calculate the correlation coefficients excluding the COVID-19 period, i.e. for winter from 2010 to 2020 and for other seasons from 2010 to 2019, showing the confidence levels above 95 % only for autumn. Finally, we perform the same calculations of correlation coefficients on the monthly PLDR and corresponding CO2 emissions from aviation in different seasons excluding the COVID-19 period and the results along with the corresponding p values at the 95 % confidence level are listed in Table 5.
Motivated by the work of Li and Groß (2021), who presented the changes in cirrus cloud properties and occurrence caused by the reduced air traffic during the COVID-19 pandemic, we carry out in the current study further analyses of 10-year lidar measurements of cirrus clouds with CALIPSO before the COVID-19 outbreak. Over this period, aviation grew strongly in terms of CO2 emissions and flight densities in Europe, especially from 2013 to early 2020.
The results show that cirrus clouds follow a distinct seasonal cycle in their appearance including occurrence rate (OR) and occurrence height (OH) as well as in the particle linear depolarization ratio (PLDR). Cirrus clouds in the winter months occurred within a broader altitude range from 6 to 13 km than in summer (only from 9 to 12.5 km) and their OR in winter can be more than 10 times larger than that in summer. Further, the seasonal cycles in cirrus OR are recognized along the entire altitudes where cirrus clouds form and it seems that they are more remarkable in the lower altitudes. The PLDR values of cirrus clouds show the majority of the data falling within the range from 0.2 to 0.55. Cirrus clouds are characterized by larger values of PLDR in winter than in summer. In addition, the PLDR values show generally a clear increase along the altitudes in each month, which is consistent with previous studies (e.g. Urbanek et al., 2018; Li and Groß, 2021).
The medians of PLDR in each month were first calculated from the measurements from 2010 to 2020 and they show a significant reduction during the COVID-19 pandemic starting from March 2020 which are presumed to be caused by the reduced air traffic (Li and Groß, 2021; Voigt et al., 2022). The long-term evolution of the cirrus PLDR before COVID-19 shows an increasing trend with a slope of 1.02 × 10⁻³ yr−1 (1.51 × 10⁻³ yr−1) in the period from March 2010 to February 2020 (from March 2013 to February 2020) based on the calculation with the Theil–Sen Estimator (TSE) method. The derived trends are both above the 95 % confidence level according to the Mann–Kendall (MK) significance test. The long-term trend of PLDR (a slope of 1.09 × 10⁻³ yr−1) was also derived from the daytime observations showing a slightly larger value than the result determined from both day- and night-time observations. Since the cirrus cloud occurrence and PLDR are dominated by seasonal cycles, we further deseasonalized the time series of monthly medians of PLDR. The deseasonalized PLDR values show a long-term trend of 0.67 × 10⁻³ yr−1 (with TSE) at the 99.5 % confidence level. The cirrus ORs as well as the deseasonalized values, however, both show a small negative trend over this period, which is presumed to be connected with the background meteorological conditions. Furthermore, there are strong increasing trends in the cirrus occurrence heights as well as in their deseasonalized values, which is very striking since the findings correspond to the upward shift of the aircraft cruising altitudes in the last years.
To study the potential reasons for the trends detected in cirrus clouds, we first compare the relationship between the cirrus PLDR and the corresponding ambient temperatures from all the data, which show a negative correlation at temperatures below −50 ∘C and no clear correlation above that. For the monthly medians, however, a significant linear correlation was reached between both parameters with a correlation coefficient of −0.76. We hence regressed PLDR with a simple linear regression model because of the strong dependence of PLDR on the ambient temperatures and removed the temperature-induced contributions from the cirrus PLDR. The derived residuals reveal an increasing trend of 0.54 × 10⁻³ yr−1 above the 90 % confidence level according to the MK test, which should be induced by other factors than temperatures. Before we carry out the comparison between the cirrus PLDR and the corresponding aviation, we should first deseasonalize both datasets since they follow totally different seasonal cycles (roughly anticorrelated). In general, there is a conspicuous increasing trend in the deseasonalized time series of PLDR as well as the corresponding CO2 emissions from aviation, especially in the period from January 2013 to February 2020. The close correlation between them shows a correlation coefficient of 0.25 (0.58) in the full period from January 2010 to February 2020 (from January 2013 to February 2020), which are above the 99.5 % confidence level. We further compared the relationship between the cirrus PLDR and the corresponding CO2 emissions from aviation in different seasons. Concentrating on the data before the COVID-19 outbreak, we calculated the correlation coefficients between both parameters based on their monthly values in different seasons and found a strong correlation in winter, spring, and autumn, but a weak correlation in summer.
The OLS estimator is a common technique for estimating coefficients of linear regression equations which describe the relationship between one or more independent quantitative variables and a dependent variable (simple or multiple linear regression). The OLS estimator chooses the coefficients by minimizing the sum of the squares of the differences between the observed dependent variables and the predicted values by a linear regression function of the independent variable. The OLS estimator is highly biased by the outliers in the time series. The presence of outliers shifts the distribution of errors away from a normal distribution resulting in heavy tails due to greater standard error than expected.
The TSE (or Theil–Sen regression or Sen tau method) is a nonparametric estimation technique for estimating a linear trend (i.e. only for one-variable regression), which uses median instead of mean. Hence, this estimator is not sensitive to outliers. The idea behind the estimator is simple. The slopes S between all pairwise sets of observations are computed and the medians of all these slopes are chosen as the estimate of the regression slope.
The simple linear regression model based on the observations (xi,yi) is , i=1, 2, …, n, where y is the dependent variable, x is the independent variable, α and β are intercept and slope parameters, respectively, and ϵ is the error term. The Theil–Sen slope estimate is obtained by taking the median of all
where . The intercept b is obtained by taking the median of all the differences (yi−sixi).
The Mann-Kendall (MK) trend test (Mann, 1945; Kendall, 1975) is a nonparametric test (i.e. no underlying assumption made about the distribution of the data) widely used to statistically assess whether there is a monotonic increasing or decreasing trend in a time series of climatologic and hydrologic data, even if there is a seasonal component in the time series. The null hypothesis, H0, states that the data are independently distributed with no trend. The alternative hypothesis, H1, is that the data follow a monotonic trend. According to the test, each data value of the time series with n data points is compared with all subsequent data values. The statistic S is incremented by 1, if a data value from a later time period is higher than a data value sampled earlier, otherwise S is decremented by 1; i.e. the MK test statistic S is calculated by
where Xi and Xj are the values of sequence i, j; n is the length of the time series and
Mann (1945) and Kendall (1975) have documented that the statistic S is approximately normally distributed when n≥8. The mean of S is E(S)=0 and the variance σ2 of S is defined by
where m is the number of the groups of tied ranks and Tj is the number of data points in the jth tied group. The standardized test statistic ZMK is computed by
A positive (negative) value of the statistic ZMK indicates that the data show an increase (decrease) with time. Given a significance level α, the null hypothesis is rejected (i.e. there is a statistically significant trend in the time series) if the absolute value of ZMK is larger than the theoretical value (for two-tailed test) or Z1−α (for one-tailed test), indicating that a significant trend exists in the time series. Here denotes the )th percentile of the standard normal distribution and can be obtained from the standard normal Z table. In this study a confidence level is used. At the significance level p=5 %, the null hypothesis is rejected if .
Data description and example codes for handling the VFM data are available at https://www-calipso.larc.nasa.gov/resources/calipso_users_guide/data_summaries/vfm/ (last access: 27 September 2021, NASA, 2021a). The MATLAB codes for drawing the plots in this paper can be made available upon request.
The CALIPSO data, including VFM used in this study, can be obtained via https://subset.larc.nasa.gov/calipso/login.php (last access: 27 September 2021, login required, NASA, 2021b). ECMWF ERA5 data can be freely accessed from https://www.ecmwf.int/en/forecasts/datasets/reanalysis-datasets/era5 (last access: 13 December 2022, Hersbach et al., 2020). The reanalysed data of cirrus parameters can be made available upon request.
QL collected and analysed the data and wrote the manuscript with help from SG. Both authors discussed the results and findings and contributed to finalizing the manuscript.
The contact author has declared that none of the authors has any competing interests.
Publisher’s note: Copernicus Publications remains neutral with regard to jurisdictional claims in published maps and institutional affiliations.
We thank the NASA Langley Research Center Atmospheric Science Data Center (ASDC) and CALIPSO science team for making the data available for research. Furthermore, we acknowledge ECMWF for providing the ERA5 data from the Copernicus Climate Change Service (C3S) Climate Data Store.
This research has been supported by the DLR internal funding within the MABAK project.
The article processing charges for this open-access publication were covered by the German Aerospace Center (DLR).
This paper was edited by Matthias Tesche and reviewed by two anonymous referees.
Ansmann, A., Bösenberg, J., Chaikovsky, A., Comerón, A., Eckhardt, S., Eixmann, R., Freudenthaler, V., Ginoux, P., Komguem, L., Linné, H., Ángel López Márquez, M., Matthias, V., Mattis, I., Mitev, V., Müller, D., Music, S., Nickovic, S., Pelon, J., Sauvage, L., Sobolewsky, P., Srivastava, M. K., Stohl, A., Torres, O., Vaughan, G., Wandinger, U., and Wiegner, M.: Long range transport of Saharan dust to northern Europe: the 11–16 Octorber 2001 outbreak observed with EARLINET, J. Geophys. Res., 108, 4783, https://doi.org/10.1029/2003JD003757, 2003. a
Bailey, M. P. and Hallett, J.: Growth rates and habits of ice crystals between −20 ∘C and −70 ∘C, J. Atmos. Sci., 61, 514–554, 2004. a, b, c
Bailey, M. P. and Hallett, J.: A comprehensive habit diagram for atmospheric ice crystals: Confirmation from the laboratory, AIRS II, and other field studies, J. Atmos. Sci., 66, 2888–2899, https://doi.org/10.1175/2009JAS2883.1, 2009. a, b, c
Bock, L. and Burkhardt, U.: Contrail cirrus radiative forcing for future air traffic, Atmos. Chem. Phys., 19, 8163–8174, https://doi.org/10.5194/acp-19-8163-2019, 2019. a, b
Boucher, O.: Air traffic may increase cirrus cloudiness, Nature, 397, 30–31, https://doi.org/10.1038/16169, 1999. a
Boucher, O., Randall, D., Artaxo, P., Bretherton, C., Feingold, G., Forster, P., Kerminen, V.-M., Kondo, Y., Liao, H., Lohmann, U., Rasch, P., Satheesh, S. K., Sherwood, S., Stevens, B., and Zhang, X. Y.: Clouds and Aerosols. In: Climate Change 2013: The Physical Science Basis, Contribution of Working Group I to the Fifth Assessment Report of the Intergovernmental Panel on Climate Change, edited by: Stocker, T. F., Qin, D., Plattner, G.-K., Tignor, M., Allen, S. K., Boschung, J., Nauels, A., Xia, Y., Bex, V., and Midgley, P. M., Cambridge University Press, Cambridge, United Kingdom and New York, NY, USA, 571–657, https://doi.org/10.1017/CBO9781107415324.016, 2013. a
Bühl, J., Seifert, P., Myagkov, A., and Ansmann, A.: Measuring ice- and liquid-water properties in mixed-phase cloud layers at the Leipzig Cloudnet station, Atmos. Chem. Phys., 16, 10609–10620, https://doi.org/10.5194/acp-16-10609-2016, 2016. a
Burkhardt, U. and Kärcher, B.: Global radiative forcing from contrail cirrus, Nat. Clim. Change, 1, 54–58, https://doi.org/10.1038/nclimate1068, 2011. a, b
Campbell, J. R., Lolli, S., Lewis, J. R., Gu, Y., and Welton E. J.: Daytime cirrus cloud top-of-the-Atmosphere radiative forcing properties at a midlatitude site and their global consequences, J. Appl. Meteor. Climatol., 55, 1667–1679, https://doi.org/10.1175/JAMC-D-15-0217.1, 2016. a
Chen, J., Rossow, W. B., and Zhang, Y.: Radiative effects of cloud-type variations, J. Climate, 13, 264–286, https://doi.org/10.1175/1520-0442(2000)013<0264:REOCTV>2.0.CO;2, 2000. a
DWD (Deutsche Wetterdienst): Cold spell in Europe and Asia in later winter 2011/2012, issued by WMO Regional Climate Centres, https://public.wmo.int/en/media/news/cold-spell-europe-and-asia-late-winter-20112012 (last access: 13 December 2022), 2012. a, b
Fichter, C., Marquart, S., Sausen, R., and Lee, D. S.: The impact of cruise altitude on contrails and related radiative forcing, Meteorol. Z., 14, 563–572, 2005. a
Freudenthaler, V., Homburg, F., Jäger, H.: Optical parameters of contrails from lidar measurements: Linear depolarization, Geophys. Res. Lett., 23, 3715–3718, 1996. a
Freudenthaler, V., Esselborn, M., Wiegner, M., Heese, B., Tesche, M., Ansmann, A., Müller, D., Althause, D., Wirth, M., Fix, A., Ehret, G., Knippertz, P., Toledano, C., Gasteiger, J., Garhammer, M., and Seefeldner, M.: Depolarization ratio profiling at several wavelengths in pure Saharan dust during SAMUM 2006, Tellus, 61B, 165–179, 2009. a, b
Fu, Q. and Liou, K. N.: Parameterization of the radiative properties of cirrus clouds, J. Atmos. Sci., 50, 2008–2025, 1993. a
Graf, K., Schumann, U., Mannstein, H., and Mayer, B.: Aviation induced diurnal North Atlantic cirrus cover cycle, Geophys. Res. Lett., 39, L16804, https://doi.org/10.1029/2012GL052590, 2012. a, b, c, d
Groß, S., Tesche, M., Freudenthaler, V., Toledano, C., Wiegner, M., Ansmann, A., Althausen, D., and Seefeldner, M.: Characterization of Saharan dust, marine aerosols and mixtures of biomass-burning aerosols and dust by means of multi-wavelength depolarization and Raman lidar measurements during SAMUM 2, Tellus, 63B, 706–724, 2011. a
Groß, S., Freudenthaler, V., Wiegner, M., Gasteiger, J., Geiß, A., and Schnell, F.: Dual-wavelength linear depolarization ratio of volcanic aerosols: Lidar measurements of the Eyjafjallaökull plume over Maisach, Germany, Atmos. Environ., 48, 85–96, https://doi.org/10.1016/j.atmosenv.2011.06.017, 2012. a
Groß, S., Esselborn, M., Abicht, F., Wirth, M., Fix, A., and Minikin, A.: Airborne high spectral resolution lidar observation of pollution aerosol during EUCAARI-LONGREX, Atmos. Chem. Phys., 13, 2435–2444, https://doi.org/10.5194/acp-13-2435-2013, 2013. a
Groß, S., Freudenthaler, V., Wirth, M., Weinzierl, B.: Towards an aerosol classification scheme for future EarthCARE lidar observations and implications for research needs, Atmos. Sci. Lett., 16, 77–82, https://doi.org/10.1002/asl2.524, 2015. a
Haag, W. and Kärcher, B.: The impact of aerosols and gravity waves on cirrus clouds at mid-latitudes, J. Geophys. Res., 109, D12202, https://doi.org/10.1029/2004JD004579, 2004. a
Hersbach, H., Bell, B., Berrisford, P., Hirahara, S., Horányi, A., Muñoz-Sabater, J., Nicolas, J., Peubey, C., Radu, R., Schepers, D., Simmons, A., Soci, C., Abdalla, S., Abellan, X., Balsamo, G., Bechtold, P., Biavati, G., Bidlot, J., Bonavita, M., De Chiara, G., Dahlgren, P., Dee, D., Diamantakis, M., Dragani, R., Flemming, J., Forbes, R., Fuentes, M., Geer, A., Haimberger, L., Healy, S., Hogan, R. J., Hólm, E., Janisková, M., Keeley, S., Laloyaux, P., Lopez, P., Lupu, C., Radnoti, G., de Rosnay, P., Rozum, I., Vamborg, F., Villaume, S., and Thépaut, J. N.: The ERA5 global reanalysis, Q. J. Roy. Meteorol. Soc., 146, 1999–2049, https://doi.org/10.1002/qj.3803, 2020. a, b
Heymsfield, A., Baumgardner, D., Demott, P., Forster, P., Gierens, K., and Kärcher, B.: Contrail microphysics, B. Am. Meteorol. Soc., 91, 465–472, https://doi.org/10.1175/2009BAMS2839.1, 2010. a
Heymsfield, A. J.: Precipitation development in stratiform ice clouds: A microphysical and dynamical study J. Atmos. Sci., 34, 367–381, 1977. a
Hu, Y., Winker, D., Vaughan, M., Lin, B., Omar, A., Trepte, C., Flittner, D., Yang, P., Nasiri, S. L., Baum, B., Holz, R., Sun, W., Liu, Z., Wang, Z., Young, S., Stamnes, K., Huang, J., and Kuehn, R.: CALIPSO/CALIOP cloud phase discrimination algorithm, J. Atmos. Ocean. Tech., 26, 2293–2309, https://doi.org/10.1175/2009JTECHA1280.1, 2009. a
Hunt, W. H., Winker, D. M., Vaughan, M. A., Powell, K. A., Lucker, P. L., and Weimer, C.: CALIPSO lidar description and performance assessment, J. Atmos. Ocean. Tech., 26, 1214–1228, 2009. a
Iwabuchi, H., Yang, P., Liou, K. N., and Minnis, P.: Physical and optical properties of persistent contrails: Climatology and interpretation, J. Geophys. Res., 117, D06215, https://doi.org/10.1029/2011JD017020, 2012. a
Järvinen, E., Jourdan, O., Neubauer, D., Yao, B., Liu, C., Andreae, M. O., Lohmann, U., Wendisch, M., McFarquhar, G. M., Leisner, T., and Schnaiter, M.: Additional global climate cooling by clouds due to ice crystal complexity, Atmos. Chem. Phys., 18, 15767–15781, https://doi.org/10.5194/acp-18-15767-2018, 2018. a
Kärcher, B.: Formation and radiative forcing of contrail cirrus, Nat. Commun., 9, 1824, https://doi.org/10.1038/s41467-018-04068-0, 2018. a
Kärcher, B., Burkhardt, U., Bier, A., Bock, L., and Ford, I. J.: The microphysical pathway to contrail formation, J. Geophys. Res.-Atmos., 120, 7893–7927, https://doi.org/10.1002/2015JD023491, 2015. a
Kendall, M. G.: Rank correlation methods, 4th edn., Charles Griffin, London, UK, ISBN 10 0852641990/ISBN 13 9780852641996, 1975. a, b, c
Khvorostyanov, V. and Sassen, K.: Toward the theory of homogeneous nucleation and its parameterization for cloud models, Geophys. Res. Lett., 25, 3155–3158, 1998. a
Korolev, A. V., Isaac, G. A., and Hallett, J.: Ice particle habits in Arctic clouds, Geophys. Res. Lett., 26, 1299–1302, https://doi.org/10.1029/1999GL900232, 1999. a
Korolev, A. V., Isaac, G. A., and Hallett, J.: Ice particle habits in stratiform clouds, Q. J. Roy. Meteorol. Soc., 126, 2873–2902, https://doi.org/10.1002/qj.49712656913, 2000. a
Lawson, R. P., Baker, B., Pilson, B., and Mo, Q.: In situ observations of the microphysical properties of wave, cirrus, and anvil clouds,. Part II: Cirrus clouds, J. Atmos. Sci., 63, 3186–3203, https://doi.org/10.1175/JAS3803.1, 2006. a
Lawson, R. P., Woods, S., Jensen, E., Erfani, E., Gurganus, C., Gallagher, M., Connolly, P., Whiteway, J., Baran, A. J., May, P., Heymsfield, A., Schmitt, C. G., McFarquhar, G., Um, J., Protat, A., Bailey, M., Lauce, S., Muehlbauer, A., Stith, J., Korolev, A., Toon, O. B., and Krämer, M.: A review of ice particle shapes in cirrus formed in situ and in Anvils, J. Geophys. Res., 124, 10049–10090, https://doi.org/10.1029/2018JD030122, 2019. a, b
Lee, D. S., Fahey, D. W., Skowron, A., Allen, M. R., Burkhardt, U., Chen, Q., Doherty, S. J., Freeman, S., Forster, P. M., Fuglestvedt, J., Gettelman, A., De León, R. R., Lim, L. L., Lund, M. T., Millar, R. J., Owen, B., Penner, J. E., Pitari, G., Prather, M. J., Sausen, R., and Wilcox, L. J.: The contribution of global aviation to anthropogenic climate forcing for 2000 to 2018, Atmos. Environ., 244, 117834, https://doi.org/10.1016/j.atmosenv.2020.117834, 2021. a, b
Li, Q. and Groß, S.: Changes in cirrus cloud properties and occurrence over Europe during the COVID-19-caused air traffic reduction, Atmos. Chem. Phys., 21, 14573–14590, https://doi.org/10.5194/acp-21-14573-2021, 2021. a, b, c, d, e, f, g, h, i, j, k, l, m, n, o, p, q, r, s
Liou, K. N.: Influence of cirrus clouds on weather and climate processes: A global perspective, Mon. Weather Rev., 114, 1167–1199, 1986. a
Liu, Z., Vaughan, M., Winker, D., Hostetler, C., Poole, L., Hlavka, D., Hart, W., and McGill, M.: Use of probability distribution functions for discriminating between cloud and aerosol in lidar backscatter data, J. Geophys. Res., 109, D15202, https://doi.org/10.1029/2004JD004732, 2004. a
Liu, Z., Vaughan, M., Winker, D., Kittaka, C., Getzewich, B., Kuehn, R., Omar, A., Powell, K., Trepte, C., and Hostetler, C.: The CALIPSO lidar cloud and aerosol discrimination: Version 2 algorithm and initial assessment of performance, J. Atmos. Ocean. Tech., 26, 1198–1213, https://doi.org/10.1175/2009JTECHA1229.1, 2009. a
Mann, H. B.: Nonparametric tests against trend, Econometrica, 13, 245–259, https://doi.org/10.2307/1907187, 1945. a, b, c
Minnis, P., Ayers, J. K., Palikonda, R., and Phan, D.: Contrails, cirrus trends, and climate, J. Climate, 17, 1671–1685, https://doi.org/10.1175/1520-0442(2004)017<1671:CCTAC>2.0.CO;2, 2004. a
Mishchenko, M. I. and Sassen, K.: Depolarization of lidar returns by small ice crystals: An application to contrails, Geophys. Res. Lett., 25, 309–312, 1998. a
NASA: CALIPSO: Data User's Guide – Data Product Description – Lidar Level 2 5 km Vertical Feature Mask (VFM) Version 3.x Product, https://www-calipso.larc.nasa.gov/resources/calipso_users_guide/data_summaries/vfm/, last access: 27 September 2021a. a
NASA: CALIPSO Search and Subsetting web application, NASA Langley Research Center Atmospheric Science Data Center [data set], available at: https://subset.larc.nasa.gov/calipso/login.php, last access: 27 September 2021b. a
Nazaryan, H., McCormick, M. P., and Menzel, W. P.: Global characterization of cirrus clouds using CALIPSO data, J. Geophys. Res., 113, D16211, https://doi.org/10.1029/2007JD009481, 2008. a
Noel, V., Chepfer, H., Haeffelin, M., and Morille, Y.: Classification of ice crystal shapes in midlatitude ice clouds from three years of lidar observations over the SIRTA observatory, J. Atmos. Sci., 63, 2978–2991, https://doi.org/10.1175/JAS3767.1, 2006. a
Omar, A. H., Winker, D. M., Vaughan, M. A., Hu, Y., Trepte, C. R., Ferrare, R. A., Lee, K.-P., Hostetler, C. A., Kittaka, C., Rogers, R. R., Kuehn, R. E., and Liu, Z.: The CALIPSO automated aerosol classification and lidar ratio selection algorithm, J. Atmos. Ocean. Tech., 26, 1994–2014, https://doi.org/10.1175/2009JTECHA1231.1, 2009. a
Quaas, J., Gryspeerdt, E., Vautard, R., and Boucher, O.: Climate impact of aircraft-induced cirrus assessed from satellite observations before and during COVID-19, Environ. Res. Lett., 16, 064051, https://doi.org/10.1088/1748-9326/abf686, 2021. a
Sassen, K.: The polarization lidar technique for cloud research: A review and current assessment, B. Am. Meteorol. Soc., 72, 1848–1866, https://doi.org/10.1175/1520-0477(1991)072<1848:TPLTFC>2.0.CO;2, 1991. a
Sassen, K. and Campbell, J. R.: A midlatitude cirrus cloud climatology from the facility for atmospheric remote sensing. Part I: Macrophysical and synoptic properties, J. Atmos. Sci., 58, 481–496, https://doi.org/10.1175/1520-0469(2001)058<0481:AMCCCF>2.0.CO;2, 2001. a
Sassen, K. and Zhu, J.: A global survey of CALIPSO linear depolarization ratios in ice clouds: Initial findings, J. Geophys. Res., 114, D00H07, https://doi.org/10.1029/2009JD012279, 2009. a
Sassen, K., Griffin, M. K., and Dodd, G. C.: Optical scattering and microphysical properties of subvisual cirrus clouds and climatic implications, J. Appl. Meteorol., 28, 91–98, https://doi.org/10.1175/1520-0450(1989)028<0091:OSAMPO>2.0.CO;2, 1989. a
Sassen, K., Wang, Z., and Liu, D.: Global distribution of cirrus clouds from CloudSat/Cloud-Aerosol Lidar and Infrared Pathfinder Satellite Observations (CALIPSO) measurements, J. Geophys. Res., 113, D00A12, https://doi.org/10.1029/2008JD009972, 2008. a
Schnaiter, M., Büttner, S., Möhler, O., Skrotzki, J., Vragel, M., and Wagner, R.: Influence of particle size and shape on the backscattering linear depolarisation ratio of small ice crystals – cloud chamber measurements in the context of contrail and cirrus microphysics, Atmos. Chem. Phys., 12, 10465–10484, https://doi.org/10.5194/acp-12-10465-2012, 2012. a
Schotland, R. M., Sassen, K., and Stone, R.: Observations by lidar of linear depolarization ratios for hydrometeors, J. Appl. Meteorol., 10, 1011–1017, 1971. a
Schumann, U. and Graf, K.: Aviation-induced cirrus and radiation changes at diurnal timescales, J. Geophys. Res., 118, 2404–2421, https://doi.org/10.1002/jgrd.50184, 2013. a, b, c, d
Schumann, U., Poll, I., Teoh, R., Koelle, R., Spinielli, E., Molloy, J., Koudis, G. S., Baumann, R., Bugliaro, L., Stettler, M., and Voigt, C.: Air traffic and contrail changes over Europe during COVID-19: a model study, Atmos. Chem. Phys., 21, 7429–7450, https://doi.org/10.5194/acp-21-7429-2021, 2021a. a, b, c
Schumann, U., Bugliaro, L., Dörnbrack, A., Baumann, R., and Voigt, C.: Aviation contrail cirrus and radiative forcing over Europe during 6 months of COVID-19, Geophys. Res. Lett., 48, e2021GL092771, https://doi.org/10.1029/2021GL092771, 2021b. a
Sen, P. K.: Estimates of the regression coefficient based on Kendall's tau, J. Am. Stat. Assoc., 63, 1379–1389, https://doi.org/10.2307/2285891, 1968. a
Stephens, G., Winker, D. M., Pelon, J., Trepte, C., Vane, D., Yuhas, C., L'Ecuyer, T., and Lebsock, M.: CloudSat and CALIPSO within the A-Train: Ten years of actively observing the Earth system, B. Am. Meteorol. Soc., 99, 569–581, https://doi.org/10.1175/BAMS-D-16-0324.1, 2018. a
Stephens, G. L., Tsay, S-C., Stackhouse Jr., P. W., and Flatau, P. J., The relevance of the microphysical and radiative properties of cirrus clouds to climate and climatic feedback, J. Atmos. Sci., 47, 1742–1754, 1990. a
Stephens, G. L., Wood, N. B., and Gabriel, P. M.: An assessment of the parameteirzation of subgrid-scale cloud effects on radiative transfer. Part I: Vertical overlap, J. Atmos. Sci. 61, 71500732, https://doi.org/10.1175/1520-0469(2004)061<0715:aaotpo>2.0.co;2, 2004. a
Ström, J. and Ohlsson, S.: In situ measurements of enhanced crystal number densities in cirrus clouds caused by aircraft exhaust, J. Geophys. Res., 103, 11355–11361, 1998. a
Stubenrauch, C. J. and Schumann, U.: Impact of air traffic on cirrus coverage, Geophys. Res. Lett., 32, L14813, https://doi.org/10.1029/2005GL022707, 2005. a
Takano, Y. and Liou, K. N.: Solar radiative transfer in cirrus clouds. Part I: Single‐scattering and optical properties of hexagonal ice crystals, J. Atmos. Sci., 46, 3–19, https://doi.org/10.1175/1520-0469(1989)046<0003:SRTICC>2.0.CO;2, 1989. a
Tesche, M., Ansmann, A., Müller, D., Althausen, D., Engelmann, R., Freudenthaler, V., and Groß, S.: Vertically resolved separation of dust and smoke over Cape Verde using multi-wavelength Raman and polarization lidars during Saharan Mineral Dust Experiment 2008, J. Geophys. Res., 114, D13202, https://doi.org/10.1029/2009JD011862, 2009. a
Tesche, M., Achtert, P., Glantz, P., and Noone, K. J.: Aviation effects on already-existing cirrus clouds, Nat. Commun., 7, 12016, https://doi.org/10.1038/ncomms12016, 2016. a
Theil, H.: A rank-invariant method of linear and polynomial regression analysis, I. Proc. Kon. Ned. Akad. v. Wetensch., A53, 386–392, 1950. a
Um, J., McFarquhar, G. M., Hong, Y. P., Lee, S.-S., Jung, C. H., Lawson, R. P., and Mo, Q.: Dimensions and aspect ratios of natural ice crystals, Atmos. Chem. Phys., 15, 3933–3956, https://doi.org/10.5194/acp-15-3933-2015, 2015. a, b
Urbanek, B., Groß, S., Wirth, M., Rolf, C., Krämer, M., and Voigt, C.: High depolarization ratios of naturally occurring cirrus clouds near air traffic regions over Europe, Geophys. Res. Lett., 45, 13166–13172, https://doi.org/10.1029/2018GL079345, 2018. a, b, c, d, e, f, g, h, i, j, k, l
Vaughan, M. A., Powell, K. A., Kuehn, R. E., Young, S. A., Winker, D. M., Hostetler, C. A., Hunt, W. H., Liu, Z., McJill, M. J., and Getzewich, B. J.: Fully automated detection of cloud and aerosol layers in the CALIPSO lidar measurements, j. Atmos. Ocean. Tech., 26, 2034–2050, https://doi.org/10.1175/2009JTECHA1228.1, 2009. a
Voigt, C., Schumann, U., Jessberger, P., Jurkat, T., Petzold, A., Gayet, J.-F., Krämer, M., Thornberry, T., and Fahey, D. W.: Extinction and optical depth of contrails, Geophys. Res. Lett., 38, L11806, https://doi.org/10.1029/2011GL047189, 2011. a
Voigt, C., Schumann, U., Minikin, A., Abdelmonem, A., Afchine, A., Borrmann, S., Boettcher, M., Buchholz, B., Bugliaro, L., Costa, A., Curtius, J., Dollner, M., Dörnbrack, A., Dreiling, V., Ebert, V., Ehrlich, A., Fix, A., Forster, L., Frank, F., Fütterer, D., Giez, A., Graf, K., Grooß, J.-U., Groß, S., Heimerl, K., Heinold, B., Hüneke, T., Järvinen, E., Jurkat, T., Kaufmann, S., Kenntner, M., Klingebiel, M., Klimach, T., Kohl, R., Krämer, M., Krisna, T. C., Luebke, A., Mayer, B., Mertes, S., Molleker, S., Petzold, A., Pfeilsticker, K., Port, M., Rapp, M., Reutter, P., Rolf, C., Rose, D., Sauer, D., Schäfler, A., Schlage, R., Schnaiter, M., Schneider, J., Spelten, N., Spichtinger, P., Stock, P., Walser, A., Weigel, R., Weinzierl, B., Wendisch, M., Werner, F., Wernli, H., Wirth, M., Zahn, A., Ziereis, H., and Zöger, M.: ML-CIRRUS: The airborne experiment on natural cirrus and contrail cirrus with the high-altitude long-range research aircraft HALO, B. Am. Meteorol. Soc., 98, 271–288, https://doi.org/10.1175/BAMS-D-15-00213.1, 2017. a, b, c
Voigt, C., Lelieveld, J., Schlager, H., Schneider, J., Curtius, J., Meerkötter, R., Sauer, D., Bugliaro, Luca., Bohn, B., Crowley, J. N., Erbertseder, T., Groß, S., Hahn, V., Li, Q., Mertens, M., Pöhlker, M. L., Pozzer, A., Schumann, U., Tomsche, L., Williams, J., Zahn, A., Andreae, M., Borrmann, S., Bräuer, T., Dörich, R., Dörnbrack, A., Edtbauer, A., Ernle, L., Fischer, H., Giez, A., Granzin, M., Grewe, V., Harder, H., Heinritzi, M., Holanda, B. A., Jöckel, P., Kaider, K., Krüger, O. O., Lucke, J., Marsing, A., Martin, A., Matthes, S., Pöhlker, C., Pöschl, U., Reifenberg, S., Ringsdorf, A., Scheibe, M., Tadic, I., Zauner-Wieczorek, M., Henke, R., and Rapp, M.: Cleaner skies during the COVID-19 lockdown, B. Am. Meteorol. Soc., 103, E1796–E1827, https://doi.org/10.1175/BAMS-D-21-0012.1, 2022. a, b, c, d
Wang, P., Minnis, P., McCormick, M. P., Kent, G. S., and Skeens, K. M.: A 6-year climatology of cloud occurrence frequency from SAGE II observations (1985–1990), J. Geophys. Res., 101, 407–429, 1996. a
Winker, D. M., Hunt, B. H., and McGill, M. J.: Initial performance assessment of CALIOP, Geophys. Res. Lett., 34, L19803, https://doi.org/10.1029/2007GL030135, 2007. a
Winker, D. M., Vaughan, M. A., Omar, A., Hu, Y., and Powell, K. A.: Overview of the CALIPSO mission and CALIOP data processing algorithms, J. Atmos. Ocean. Tech., 26, 2310–2323, https://doi.org/10.1175/2009JTECHA1281.1, 2009. a
Winker, D. M., Pelon, J., Coakley Jr., J. A., Ackerman, S. A., Charlson, R. J., Colarco, P. R., Flamant, P., Fu, Q., Hoff, R. M., Kittaka, C., Kubar, T. L., Le Treut, H., Mccormick, M. P., Mégie, G., Poole, L., Powell, K., Trepte, C., Vaughan, M. A., and Wielicki, B. A.: The CALIPSO Mission: A global 3D view of aerosols and clouds, B. Am. Meteorol. Soc., 91, 1211–1229, https://doi.org/10.1175/2010BAMS3009.1, 2010. a
Wylie, D. P. and Menzel, W. P.: Eight years of high cloud statistics using HIRS, J. Climate, 12, 170–184, 1999. a
Yue, S., Pilon, P., and Cavadias, G.: Power of the Mann-Kendall and Spearman's rho tests for detecting monotonic trends in hydrological series, J. Hydrol., 259, 254–271, https://doi.org/10.1016/S0022-1694(01)00594-7, 2002. a
Zerefos, C. S., Eleftheratos, K., Balis, D. S., Zanis, P., Tselioudis, G., and Meleti, C.: Evidence of impact of aviation on cirrus cloud formation, Atmos. Chem. Phys., 3, 1633–1644, https://doi.org/10.5194/acp-3-1633-2003, 2003. a
Zhang, Y., Macke, A., and Albers, F.: Effects of crystal size spectrum and crystal shape on stratiform cirrus radiative forcing, Atmos. Res., 52, 59–75, 1999. a
- Abstract
- Introduction
- Data and methods
- Results
- Discussion
- Conclusions
- Appendix A: Ordinary least squares (OLS) estimator and Theil–Sen estimator (TSE)
- Appendix B: Mann–Kendall test
- Code availability
- Data availability
- Author contributions
- Competing interests
- Disclaimer
- Acknowledgements
- Financial support
- Review statement
- References