the Creative Commons Attribution 4.0 License.
the Creative Commons Attribution 4.0 License.
 | 20 Dec 2022
Seasonal significance of new particle formation impacts on cloud condensation nuclei at a mountaintop location
Noah S. Hirshorn
Lauren M. Zuromski
Christopher Rapp
Ian McCubbin
Gerardo Carrillo-Cardenas
Fangqun Yu
New particle formation (NPF) events are defined as a sudden burst of aerosols followed by growth and can impact climate by growing to larger sizes and under proper conditions, potentially forming cloud condensation nuclei (CCN). Field measurements relating NPF and CCN are crucial in expanding regional understanding of how aerosols impact climate. To quantify the possible impact of NPF on CCN formation, it is important to not only maintain consistency when classifying NPF events but also consider the proper timeframe for particle growth to CCN-relevant sizes. Here, we analyze 15 years of direct measurements of both aerosol size distributions and CCN concentrations and combine them with novel methods to quantify the impact of NPF on CCN formation at Storm Peak Laboratory (SPL), a remote, mountaintop observatory in Colorado. Using the new automatic method to classify NPF, we find that NPF occurs on 50 % of all days considered in the study from 2006 to 2021, demonstrating consistency with previous work at SPL. NPF significantly enhances CCN during the winter by a factor of 1.36 and during the spring by a factor of 1.54, which, when combined with previous work at SPL, suggests the enhancement of CCN by NPF occurs on a regional scale. We confirm that events with persistent growth are common in the spring and winter, while burst events are more common in the summer and fall. A visual validation of the automatic method was performed in the study. For the first time, results clearly demonstrate the significant impact of NPF on CCN in montane North American regions and the potential for widespread impact of NPF on CCN.
- Article
(3612 KB) - Full-text XML
- BibTeX
- EndNote


Atmospheric aerosols, which originate from primary emissions or through secondary gas-to-particle conversions, are a large source of climatic uncertainty (Stocker et al., 2014). Aerosols can affect Earth's radiative balance directly by interacting with incoming radiation and indirectly through their role as cloud condensation nuclei (CCN) (Twomey, 1974; Twomey et al., 1984; Albrecht, 1989; Charlson et al., 1992). New particle formation (NPF) is a source of atmospheric aerosols that involves the formation of particles less than 3 nm in diameter and the subsequent growth of these freshly nucleated particles to larger sizes (Yu and Luo, 2009; Spracklen et al., 2010). These secondary aerosols originating from NPF can indirectly impact climate by acting as CCN (Kerminen et al., 2012; Gordon et al., 2017; Kerminen et al., 2018). Previous modeling studies estimate that the contribution of secondary aerosols from NPF to CCN is significant in the free troposphere, with some estimates predicting that 35 % of CCN, at a supersaturation of 0.2 %, originate from secondary aerosols (Merikanto et al., 2009). Gordon et al. (2017) estimate that at a supersaturation of 0.2 %, 67 % of CCN at low-level cloud heights in the pre-industrial atmosphere are attributed to NPF, compared to 54 % in the current atmosphere (Gordon et al., 2017). Understanding the contribution of NPF to CCN in clean, remote environments will not only expand the regional understanding of how NPF can impact CCN but also allow for potential estimates of CCN concentrations in the pre-industrial atmosphere, providing a baseline for the comparison of current, anthropogenic-influenced climate trends to those of the pre-industrial atmosphere (Carslaw et al., 2017).
Mountaintop studies evaluating the relationship between NPF and CCN are important in understanding the impact that NPF can have on CCN in remote regions, including the free troposphere (Hallar et al., 2011, 2016; Rose et al., 2017; Sellegri et al., 2019). A review by Zhu et al. (2021) analyzes data from multiple campaigns at Mt. Tai in China, showing that NPF does contribute to CCN at the site, but decreases in anthropogenic sulfur dioxide (SO2) over time have contributed to the lower production of CCN number concentrations from NPF events (Zhu et al., 2021). At the Mt. Chacaltaya Observatory, Rose et al. (2017) find that 61 % of NPF events during a 2012 study grew to CCN-relevant sizes, reaching a minimum diameter of 50–150 nm, and that these events are highly likely to enhance CCN concentrations, especially in the free troposphere (Rose et al., 2017). Because a CCN counter was not available at Mt. Chacaltaya, the study utilizes a methodology to identify times in which NPF contributes to CCN concentrations, starting from when aerosol number concentrations at 50, 80, and 100 nm begin to increase and ending when the maximum number concentration is observed at the respective size bin (Rose et al., 2017). Recent observations from a remote site in the western Himalayas estimated the survival probability to show that a majority of secondary aerosols grew to CCN-relevant sizes during observations; there was an 82 % probability that a particle would grow to 50 nm and a 53 % probability that a particle would grow to 100 nm (Sebastian et al., 2021; Pierce and Adams, 2007). Findings from these mountaintop studies not only show the potential of secondary aerosols to activate as CCN at clean mountaintop sites but also highlight the importance of long-term studies at different remote locations to increase regional understanding of how NPF impacts CCN in different environments, since the ability of secondary aerosols to impact CCN is highly dependent on the regional characteristics of a given observatory.
Observational studies that consider the contribution of NPF to CCN formation must classify NPF events and determine the time at which CCN is enhanced by NPF. Historically, NPF is classified visually by scientists looking for a particle burst and subsequent growth over multiple hours, forming a new nucleation mode (Dal Maso et al., 2005). However, visual classification can lead to potential human biases and brings into question the accuracy of comparisons between studies (Joutsensaari et al., 2018). An automatic methodology to identify NPF, such as the one used in this study, can minimize human bias during long-term studies at different locations. Since the time period in which CCN is enhanced by NPF is highly dependent on particle growth, the time to reach CCN-relevant sizes can range from a few hours in polluted environments with high growth rates to over a day in remote environments with lower growth rates (Kerminen et al., 2012).
In an effort to increase the number of observational studies relating NPF to CCN, previous studies, both with and without a cloud condensation nuclei counter (CCNC), have developed various methodologies to determine the time period in which observed CCN concentrations can be attributed to the occurrence of an NPF event (Kalivitis et al., 2015; Kalkavouras et al., 2017; Dameto de España et al., 2017; Rose et al., 2017; Kalkavouras et al., 2019; Kecorius et al., 2019; Rejano et al., 2021; Ren et al., 2021). Similar to the methodology of Rose et al. (2017) detailed above, Kalkavouras et al. (2017) estimate CCN by finding particle concentrations above the minimum size required for aerosols to activate as CCN and then consider the environmental supersaturation when estimating how many aerosols in a given distribution could act as CCN. This approach further calculates the droplet number and considers how supersaturation, chemical composition and updraft velocity may impact the cloud droplet number (Kalkavouras et al., 2017). An evolution of this approach by Kalkavouras et al. (2019) calculates the relative dispersion of CCN at different supersaturations and considers CCN times when the relative dispersion is higher than initial conditions before a CCN event (Kalkavouras et al., 2019). This method was further employed at 35 different sites around the globe, both urban and remote, to determine the impact NPF has on CCN concentrations (Ren et al., 2021). Kecorius et al. (2019) utilize a CCNC in the Arctic to analyze CCN enhancements by fitting a slope to CCN measurements, starting when aerosol formation rates increased and ending when an air mass shift occurred (Kecorius et al., 2019). In another study utilizing a CCNC in Vienna, Austria, Dameto de España et al. (2017) consider CCN number concentrations for a time period that occurs after particles reach CCN-relevant sizes (Dameto de España et al., 2017). This time period is the same duration as the time between NPF initiation and when particles reach CCN-relevant sizes. When it comes to determining the time period that NPF may impact CCN for long-term datasets, the methodology not only should efficiently and independently (without using CCN observations) ensure that aerosols are growing to CCN sizes but also needs to consider the growth patterns of individual NPF events to accurately determine when NPF stops contributing to CCN.
In this study, we present 15 years of aerosol and CCN data from Storm Peak Laboratory (SPL), a remote, mountaintop observatory in Steamboat Springs, CO, USA, and quantify the impact of NPF events on CCN concentrations. Datasets of this length are rare and provide a unique opportunity to quantify long-term trends that have enough data to make statistically significant conclusions. NPF occurs frequently at SPL allowing for the seasonal comparison of the relationship between NPF and CCN (Hallar et al., 2011). To identify the occurrence of NPF and when to consider CCN concentrations, we present two new, statistical-based methods: one to classify NPF events and another to determine the period in which CCN number concentrations can be attributed to NPF.
2.1 Storm Peak Laboratory
Storm Peak Laboratory (SPL) is a remote, mountaintop observatory (3210 m a.s.l., 40.455∘ N, 106.745∘ W) located in Steamboat Springs, CO. SPL is one of the only sites in North America with long-term measurements of aerosol size distributions and CCN number concentrations (Lowenthal et al., 2002; Borys and Wetzel, 1997; Hallar et al., 2017). The laboratory is commonly in-cloud during storms and sees frequent NPF events (Hallar et al., 2011; Borys and Wetzel, 1997; Lowenthal et al., 2019). The primary wind direction at the laboratory is westerly, which allows for the potential transport of SO2 and the formation of sulfuric acid (H2SO4), an NPF precursor, from multiple powerplants 50–250 km upwind of SPL (Hallar et al., 2016; Obrist et al., 2008). SPL is located above a mixed forest allowing for the emission of a variety of different biogenic volatile organic compounds (BVOCs) that can impact aerosol formation and growth (Amin et al., 2012). Given the remote, mountaintop location of SPL, clean atmospheric conditions are common at the laboratory (Obrist et al., 2008).
To measure aerosols at SPL, we use a TSI Inc. (Shoreview, MN) scanning mobility particle sizer (SMPS) 3936 (with a TSI 3010 condensation particle counter (CPC)) for particles with diameters between 8 and 340 nm that scans every 5 min. Data are collected on a log-normal scale with particle diameter on a log scale and time on a normal scale. The instrument is periodically shipped back to TSI Inc. for routine maintenance and calibrations. The sheath and sample flow rates are 10 and 1 L min−1, respectively, for the SMPS. Multiple charge corrections and diffusion corrections are applied to all SMPS data used in the analysis. SMPS data from SPL are now available on the European Monitoring and Evaluation Programme (EBAS) database, including level 1 data, which maintain 5 min time resolution while removing invalid values and calibrations, as well as level 2 data which present hourly averages and quantify atmospheric variability. Level 1 SMPS data are used in this study. The goal of EBAS data is to store long-term atmospheric science datasets and provide standards for quality assurance; thus rigorous standards for data quality are implemented to any data admitted to EBAS (Norwegian Institute for Air Research). SPL consistently runs a single-column droplet measurement technology (DMT; Boulder, CO) CCNC that collects number concentrations of CCN every second (Lance et al., 2006; Roberts and Nenes, 2005). We consider instrument measurements at supersaturation levels between 0.2 % and 0.4 % in our study.
2.2 An automatic method to classify new particle formation
A crux of studying atmospheric NPF is the identification of NPF events. The identification process historically utilized three-dimensional plots of log-normal size distributions and visual inspection aimed at identifying a burst of particles below 20 nm, followed by growth over the course of multiple hours that forms a new nucleation mode (Dal Maso et al., 2005; Kulmala et al., 2012). By visually inspecting these plots, the viewer sorts days into the following broad categories based on the observed growth patterns: event, non-event, or undefined. In an effort to improve the visual classification process proposed by Dal Maso et al. (2005), studies split events into subcategories to provide more specific classifications detailing whether particle growth is sustained during a given day or if the given day exhibits a burst of particles (Hirsikko et al., 2007; Kulmala et al., 2012; Boy et al., 2008; Svenningsson et al., 2008; Dal Maso et al., 2005). The visual classification of NPF can present problems, since human biases can influence classification leading to issues with the reproducibility and comparability of studies (Joutsensaari et al., 2018). To minimize the potential biases that influence visual classification, we present a statistically based, automatic sorting technique that evaluates particle burst and growth patterns to classify days into one of the following categories: type 1a event, type 1b event, class II event, undefined, or non-event (Hirsikko et al., 2007; Tröstl et al., 2016). The logic of the automatic classification technique is shown in a flowchart (Fig. 1) and described below.
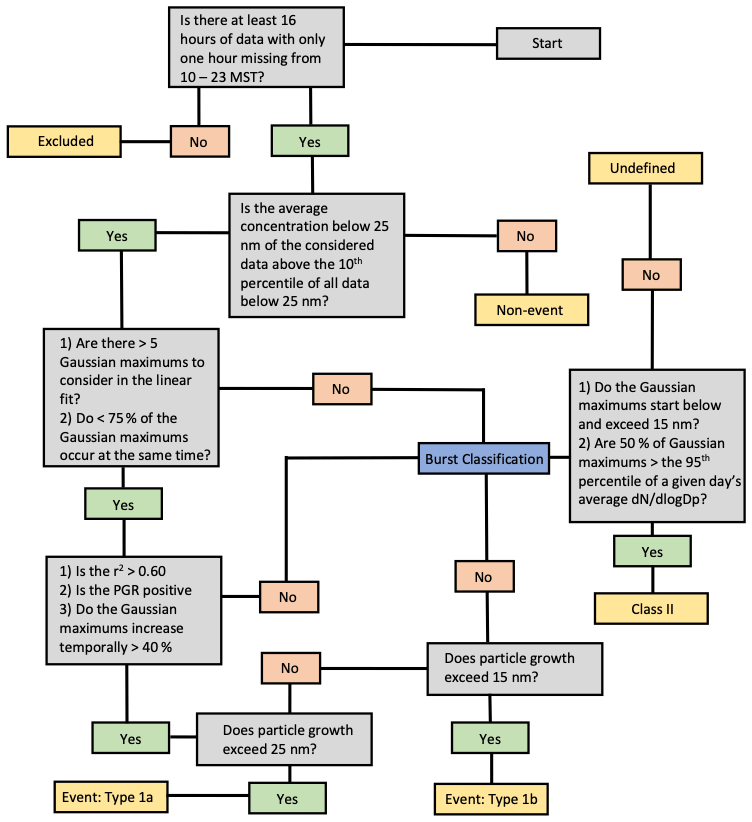
Figure 1Flowchart illustrating the step-by-step process of the automatic NPF classification method. PGR: particle growth rate.
The first step of the automatic classification method is to ensure the availability of SMPS level 1 data. Although NPF events can span multiple days, we consider daily data (00:00–23:59 MST) as well as the first 12 h (00:00–12:00 MST) of the next day to ensure the consideration of an NPF event does not prematurely end if growth continues overnight. The 5 min SMPS data are only considered if the first 24 h period meets the following conditions: there are at least 16 h of data present and the period between 10:00–23:00 MST (the times in which NPF is most common at SPL) has less than 1 h of data missing.
The days that successfully undergo quality control are then considered by the automatic classification method. For data to be classified as an event, two general conditions must be met: a burst of particles in the nucleation mode and growth that spans multiple hours contributing to the formation of a new nucleation mode. To first address the presence of a burst and identify days that are non-events, we compute the percentiles of all particle concentrations in our dataset below 25 nm from 10:00–23:00 MST. Days below the 10th percentile were automatically categorized as non-events, since they are automatically assumed to not have high enough nucleation mode number concentrations for an NPF event to have occurred. For days where the average particle concentration below 25 nm is above the 10th percentile of all data considered, the maximum of the Gaussians is calculated at each size bin. The normal distributions were fit by solving for the non-linear least-squares estimates using the R programming language (Eq. 1), which considers the particle size distribution at each diameter to return the time that corresponds to the maximum concentration at that given diameter (Bates and Watts, 1988). In the equation, “k” is the maximum aerosol number concentration, “t” is the time index where the normalized maximum at Dp occurs, “μ” is the mean aerosol concentration, and “σ” is the corresponding standard deviation. This equation is used for the calculation of individual maximum Gaussians at each size bin:
The derived time index represents the time at which the maximum of the peak-fitted particle size distributions occurs for each value of Dp. For data where at least five different Gaussian maximum points are calculated, a linear regression is fit to these maxima allowing for further analysis of growth over the course of an event (Lehtinen and Kulmala, 2003). R2 values for the linear regression (one below 20 nm and another from 20 to about 70 nm), as well as the time differences between the maxima, are also considered to ensure growth. For days to be defined as an event, the time difference between bin maxima must be positive and non-zero for at least 40 % of occurrences, the largest r2 value must be at least 0.6, there must be at least five maxima considered in the fit, and the largest size bin with a calculated Gaussian maximum must be above 25 nm for type 1a event classification and 15 nm for type 1b event classification. While 15 nm may seem like a low threshold for NPF growth, the growth of a given event often reaches sizes exceeding the diameter where the last Gaussian is calculated. Figure 2 is an example of a day that is calculated as an event because the threshold is lowered to 15 nm. Days that do not meet the above statistic-based criteria are initially classified as undefined but can be classified as a class II event later in the method.
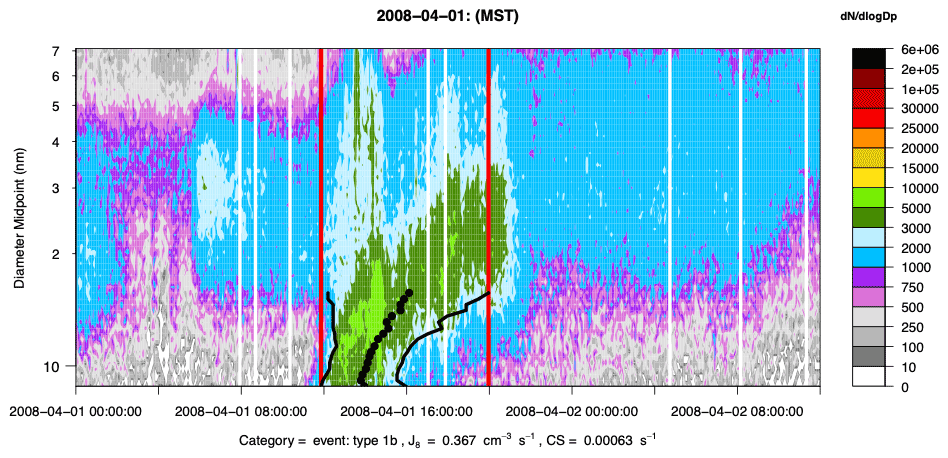
Figure 2An example of a day classified as a type 1b event. Setting 15 nm as the diameter that the growth Gaussian maxima must reach allows for this day to be classified as an event demonstrating why the threshold is set at 15 nm. Gaussian maxima (black points) are outlined by the first-order derivative of the fitted distribution at each size (black line). The vertical red lines denote the initiation and end times of a given event as assigned by the automated methodology.
For days that are defined as an event, the growth rate and event start and stop times are calculated. To find the growth rate, a linear regression is fit to the maximum Gaussians which are time dependent. The growth rate is determined by the following equation:
Because the slope of the linear regression fit of the maximum Gaussians represents particle growth over time during NPF events, this value is used when determining the growth rate. This method is most similar to the log-normal function fitting method of calculating growth rate but finds the growth rate by fitting a linear regression to the maximum Gaussians. Derivatives of the linear regressions are used to determine the start and end time of events, where the start time of the event is defined by the time of the first maximum of the first-order derivative and the end time of the event is defined by the time of the last first-order derivative minimum. Figure 3 illustrates an example of an NPF event and a day classified as a non-event.
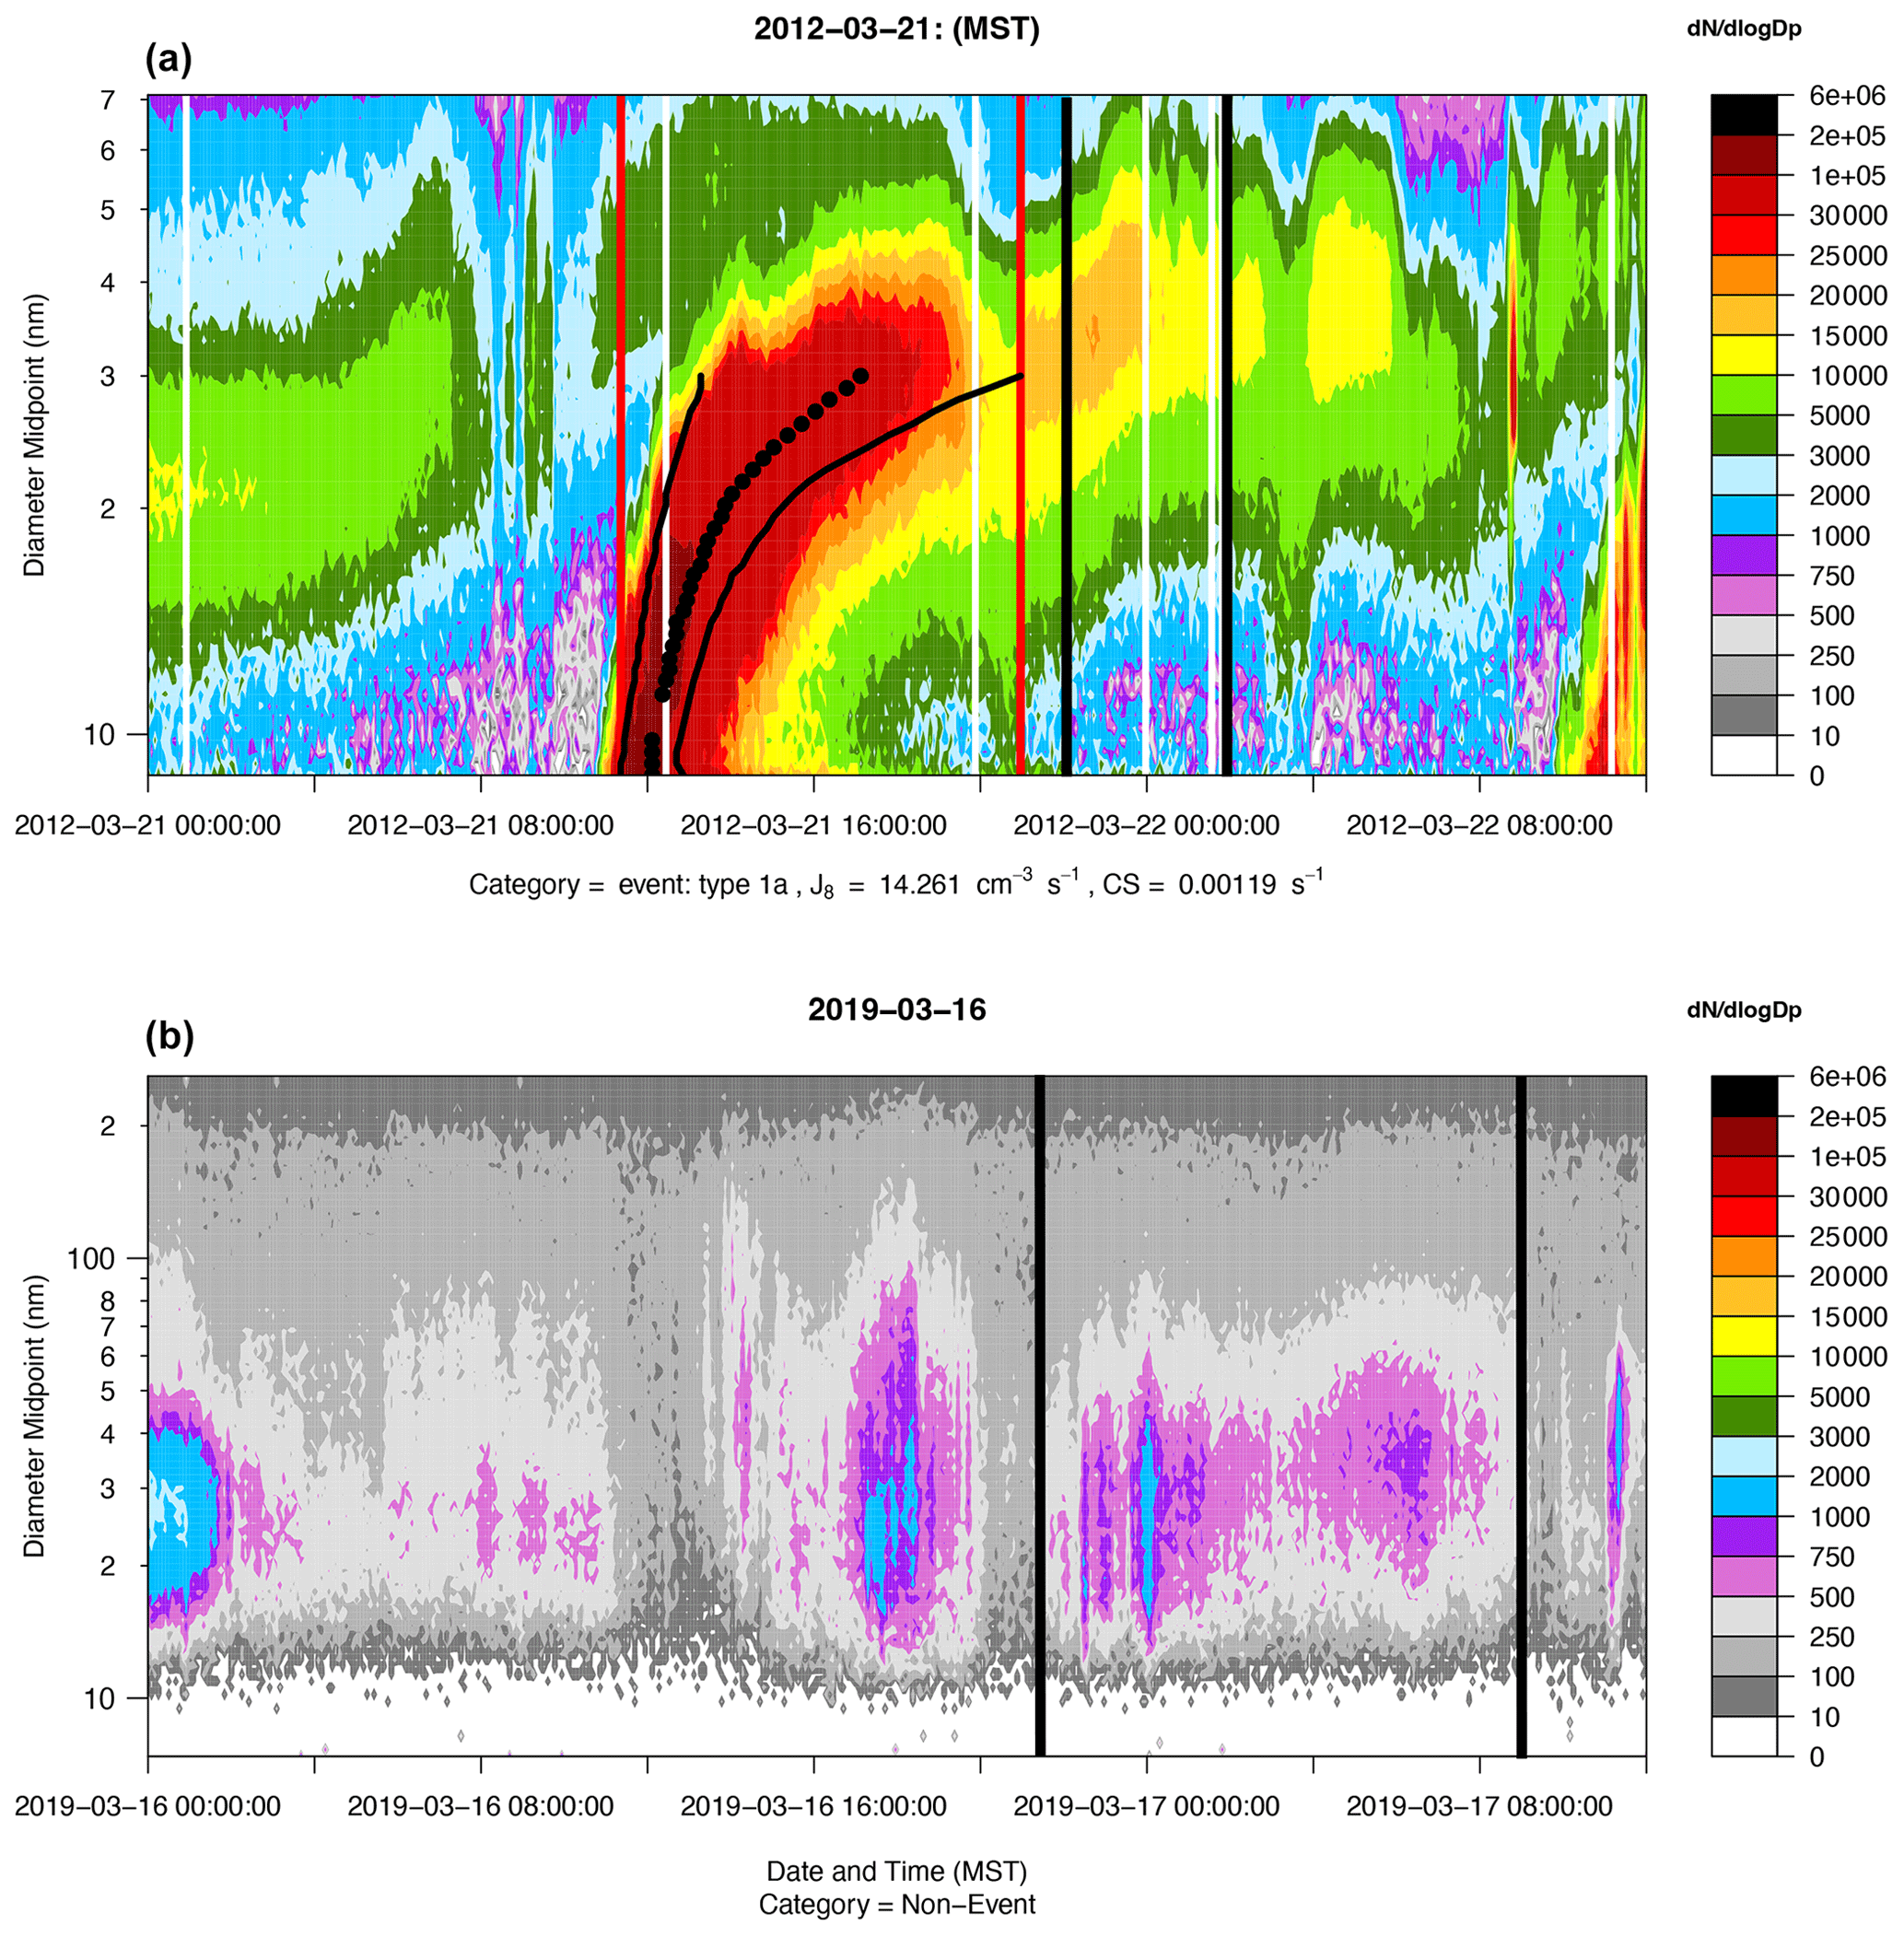
Figure 3Strong NPF event (a) with midpoint size bin maxima (black points) outlined by the first-order derivative of the fitted distribution at each size (black sloped lines). The vertical red lines denote the initiation and end times of a given event as assigned by the automatic methodology. A non-event (b) is added for comparison. The vertical black lines represent the time period when CCN is considered (CCNstart through CCNend) which is determined for each individual event day, while the seasonal average of this period is used for comparing CCN during non-event days.
Days that are not classified as a type 1a or type 1b event are further considered to determine whether the given day is a class II event or undefined. Class II events are different than type 1a and type 1b events due to the presence of a particle burst which resembles an “apple” shape rather than persistent growth (Dal Maso et al., 2005; Junninen et al., 2008). Because the methodology detailed thus far considers growth patterns, significant class II particle bursts are initially classified as undefined due to weak growth (undefined stats fail) or Gaussian stacking in which greater than 75 % of the calculated Gaussian maxima occur at the same time (undefined burst). To address class II events, we apply an additional set of threshold tests to determine if days initially classified as undefined should be classified as a class II event.
Days that were classified as “undefined burst” or “undefined stats fail” are eligible for reclassification as class II events based on multiple thresholds. Class II events exhibit Gaussian maxima that occur at elevated number concentrations, exhibit particles bursting to a larger size, and originate in the nucleation mode; however, there is often a minimal difference in the temporal location of the calculated Gaussian maxima. Thus, the focus of this analysis is the identification of a significant particle burst. To confirm that the burst originates with smaller particles and exceeds the sizes required for class II events, the lowest size bin of a calculated Gaussian for a given day must be below 15 nm and the highest size bin of a calculated Gaussian must be above 15 nm. To ensure that the given day exhibits a strong enough burst for consideration as a class II event, at least 50 % of calculated Gaussians must have values above the 95th percentile of all values in a given day. In addition, the diameters of consecutively calculated Gaussian maxima for days initially classified as an undefined burst cannot differ by more than 20 nm. The reason this threshold is not applied to days initially defined as undefined stats fail is because there is some growth observed, thus removing days with large Gaussian maxima differences could lead to the accidental removal of a class II NPF event that exhibits weak growth in addition to a significant burst.
2.3 Formation rates (J8) and condensation sink (CS) values
The aerosol formation rate (J8) and condensation sink (CS) values are calculated as part of the automatic classification method. J8 values are calculated for type 1a and type 1b events. CS values are calculated for the comparison of values between type 1a and type 1b events and non-events.
The J8 value for an event is defined by the formation rate equation (Kulmala et al., 2004, 2012):
where is the change in the number concentration of particles across the considered size distribution from about 8 to 25 nm during Δt which is the time difference from the defined start of an event to the defined end of an event. When calculating the initial and final number concentrations, we utilize the average number concentration observed between 4 and 1 h prior to NPF initiation as the initial number concentration. The final number concentration is the average number concentration from all 5 min scans taken during an event. Doing so allows for the comparison of the initial conditions of an NPF event and aerosol formation across the entirety of a given event. The additional loss terms in the equation represent loss to the coagulation sink and loss due to growth out of the size range (Kulmala et al., 2012). The entire size distribution measured by the SMPS is used when calculating the coagulation sink loss term (Casquero-Vera et al., 2020).
CS values are calculated for the entire size distribution using the following equation (Pirjola et al., 1999; Kulmala et al., 2001):
In the equation, ri is the radius of a given size bin (cm), and Ni is the number concentration (cm−3) of the given size bin. D is the diffusion coefficient of vapor, which is assumed to be 0.13 cm2 s−1 for H2SO4 at SPL based on calculations using representative pressure and temperature at the site (Hanson and Eisele, 2000; Welty et al., 2020; Tuovinen et al., 2021). βm is calculated following the protocols of Kulmala et al. (2012) and Tuovinen et al. (2020) where the mass accommodation coefficient in these calculations is assumed to be unity (Kulmala et al., 2001; Nishita et al., 2008; Hallar et al., 2011; Kulmala et al., 2012; Tuovinen et al., 2020).
2.4 Determining when to consider cloud condensation nuclei concentrations
Determining whether an NPF event is impacting CCN concentrations is crucial in understanding the exact contribution of aerosols to cloud formation and, thus, understanding the potential climatic impacts. While environmental supersaturation and particle hygroscopicity are both crucial factors for CCN activation, aerosols from NPF must grow to CCN-relevant sizes before activating as CCN. Therefore, it is important to consider CCN enhancements due to NPF at times when particles reach CCN sizes. In this study, we propose and apply a statistical method to determine the time in which to consider the contribution of NPF to CCN concentrations. Our method sets a start and end time for CCN concentrations based only on aerosol concentration measurements that consider growth patterns of aerosols over and around the time of NPF.
For days classified as type 1a events and type 1b events, the start time of CCN consideration (CCNstart) is the first time after the start of an NPF event that 25 % of all particles in a given scan (ranging from 8 to about 340 nm) are above 40 nm. Utilizing a percentile-based threshold method to determine CCNstart allows for newly formed particles to grow to CCN sizes and is an effective metric when dealing with multi-year datasets. CCNstart for non-event days is calculated by using the average of CCNstart calculated for each season during events. We consider CCN concentrations during non-events to determine if NPF events result in an enhancement of CCN. Sunlight is generally necessary for NPF and growth; therefore, it is important to consider the variations in the seasonal diurnal cycle and obtain one unique value of CCNstart for each season that accurately represents the time that NPF impacts the site during each season (Hallar et al., 2011).
The end time of CCN consideration (CCNend) is determined by finding the time at which particle growth from an event tapers off. To do so, we estimate the bin that corresponds to the normalized maximum aerosol concentration at each timestamp from the start of the NPF event to 17:00 MST the next day. This ensures that consecutive events are not erroneously considered. The maximum bin diameter at each timestamp is determined in a similar way to the NPF classification method (Eq. 1), but when considering CCN, we find the maximum of fitted Gaussians at each timestamp. Because the formation of CCN from nucleated particles can exceed the time period of NPF, especially in remote environments, our method allows for the evolution of particle growth over a time period long enough to ensure particles originating from NPF can grow to CCN sizes.
Once each time has a corresponding diameter maximum, we evaluate the overall growth pattern by fitting a polynomial curve to the Gaussian bin maxima over time. Once the curve is fit, the time at which the last inflection point occurs (in which the fitted line transitions from positive slopes to negative slopes) is selected as CCNend. The last inflection point of the curve serves as an indicator of growth tapering off, and, therefore, we assume that the enhancement of CCN from NPF has concluded. For non-events, CCNend is determined by adding the average duration of CCN consideration (CCNend − CCNstart) to the previously averaged CCNstart. Four different values of CCNend, one for each season, are determined when finding CCNend values for non-events. An example NPF day including labels of CCNstart and CCNend illustrating the time at which we assume CCN is enhanced by NPF is included in Fig. 3. To compare the impact NPF events have on CCN, CCN number concentrations directly measured are considered during the time period spanning from CCNstart to CCNend during valid events and non-events. An average CCN number concentration for supersaturation levels between 0.2 % and 0.4 % is calculated for each individual time period. These values are then averaged separately each season between events and non-events. The goal is to determine whether CCN concentrations are enhanced by NPF events. During long-term studies, especially at clean, remote locations like SPL, directly comparing events and non-events will result in the relative enhancement of CCN due to events at a given location. By removing the subjectivity of selecting idealized cases, we provide a more robust methodology to evaluate long-term datasets. The methodology within this paper carefully considers similar timeframes within the diel pattern with and without NPF, to look at the relative change induced by NPF. At other high-altitude mountaintop sites around the globe, this approach could have sources of error, since NPF can be associated with the transport of both condensable vapors and pre-existing aerosol that could become CCN (Sellegri et al., 2019). However, SPL seems to be an exception to this rule, since previous observations of NPF show an association with lower existing particle surface areas which allows for a more direct comparison of events and non-events (Hallar et al., 2011; Sellegri et al., 2019). By further comparing events to non-events through a seasonal lens, we ensure that days with similar meteorological conditions are compared.
3.1 Fifteen years of new particle formation at Storm Peak Laboratory
Over the course of 15 years (2006–2021), we consider 835 d that pass basic quality control protocols and have both aerosol and CCN data available for analysis. The automatic method to determine NPF classification splits the data into one of the following five categories: type 1a event, type 1b event, class II event, undefined, or non-event (Hirsikko et al., 2007; Tröstl et al., 2016). Of the 835 d considered, 95 d are classified as a type 1a event, 80 d are classified as a type 1b event, 244 d are classified as a class II (burst) event, 269 d are classified as undefined, and 147 d are classified as a non-event. When considering the overall NPF event frequency, which includes type 1a events, type 1b events, or class II events, the overall event frequency calculated by the automatic method is 50 %, which compares well to the 52 % overall event frequency observed at SPL by Hallar et al. (2011).
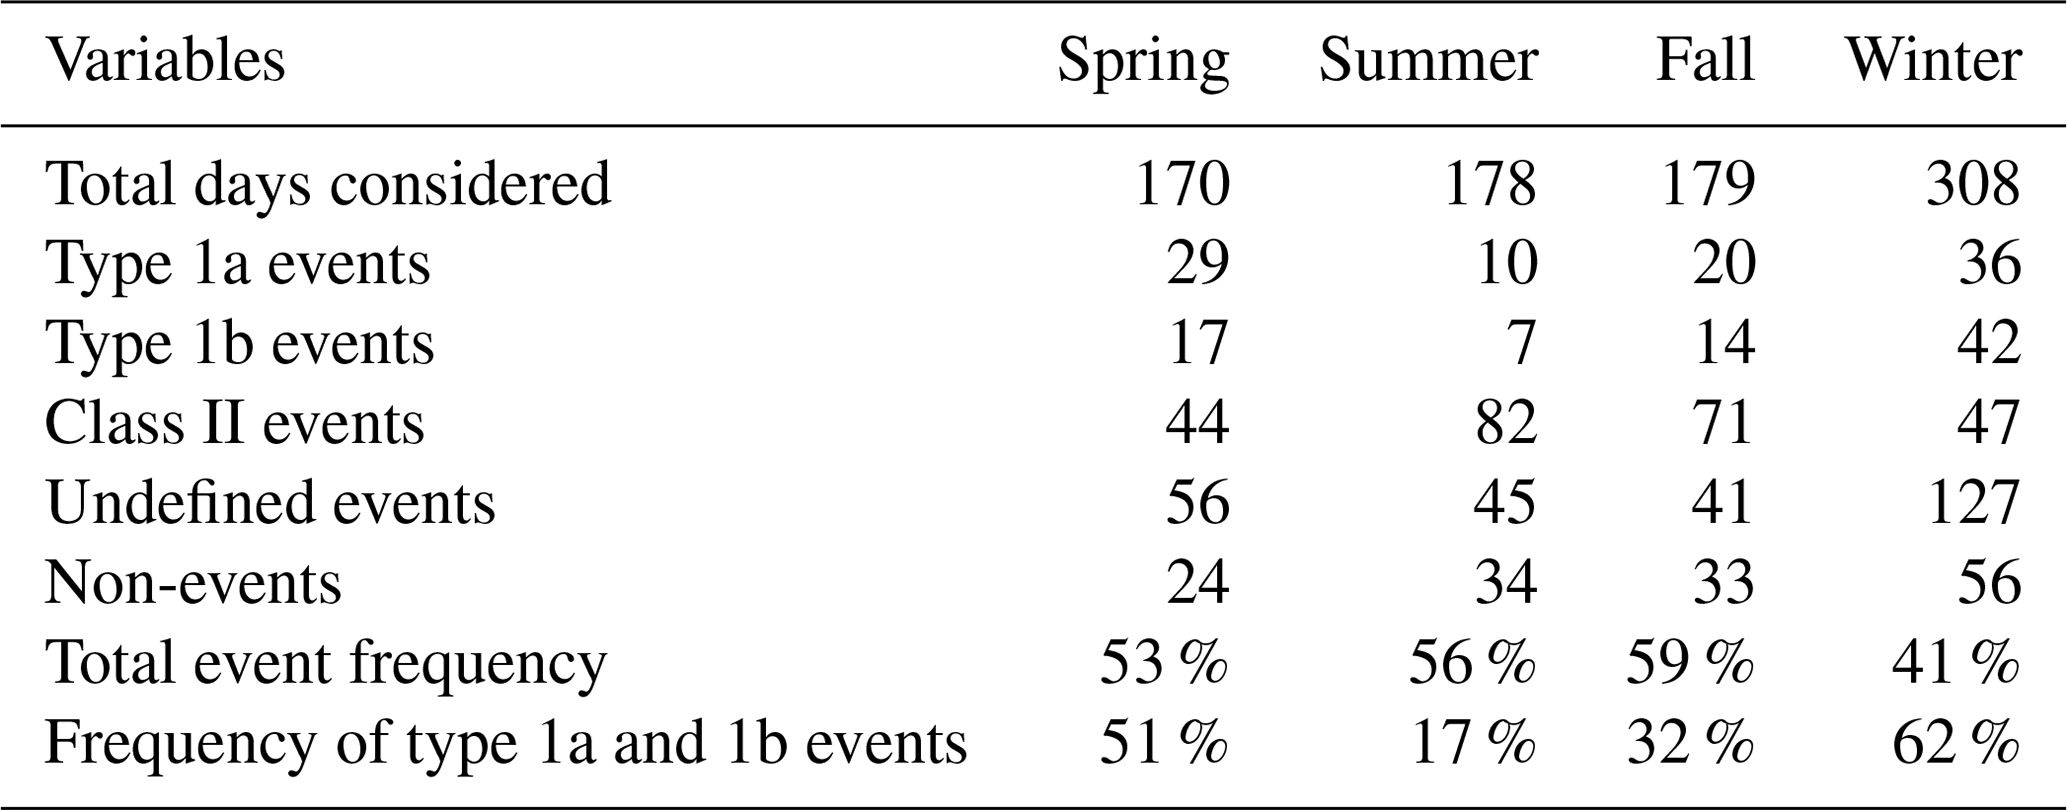
Evaluating NPF from a seasonal lens at SPL creates a better understanding of how important variables, such as temperature, SO2 concentrations, and the presence of organics, affect NPF (Hallar et al., 2016, 2013). Table 1 details the frequency of NPF events across all seasons. The summer and fall display the highest frequency of events with either a type 1a event, type 1b event, or class II event occurring on 56 % of days in the summer and 59 % of days in the fall. The spring (53 %) and winter (41 %) display similar but slightly lower event frequencies than the summer and fall at SPL. An analysis focusing on the frequency of different event types is conducted to determine which seasons may be conducive to the occurrence of type 1a and type 1b events in which persistent growth occurs. We find that type 1a events and type 1b events are more likely to occur in the winter (62 % of all NPF events) and spring (51 % of all NPF events) than in the summer (17 % of all NPF events) and fall (32 % of all NPF events) where burst events are more common partially due to higher temperatures (Yu et al., 2015).
Table 1A summary of variables related to the frequency of NPF split by season. The total event frequency considers the percentage of days that a type 1a event, type 1b event, or class II event occurs compared to an undefined or non-event day. The “Frequency of type 1a/1b events” row considers the percentage of all events in a given season that are persistent growth events (type 1a event or type 1b event).
When analyzing the impact of NPF on CCN concentrations, it is important to focus on days that exhibit a prolonged period of consistent particle growth, allowing for aerosols from NPF to reach CCN-relevant sizes. While type 1a events, type 1b events, and class II events are all considered NPF events, class II events do not exhibit strong, consistent growth, making it difficult to calculate growth statistics (Dal Maso et al., 2005). From this point forward, we focus on comparing type 1a events and type 1b events against non-events to better understand how aerosols from NPF affect CCN. Figure 4 compares the average number of particles of a given size produced during type 1a and type 1b events against non-events. We find that NPF days at SPL produce significantly more particles than non-event days up to diameters of 82.0 nm, which is larger than the critical diameter, theorized to be as low as 30 nm at SPL, required for aerosols to activate as CCN (Lowenthal et al., 2002). The significant increase in particles between 30.0 and 82.0 nm during type 1a and type 1b NPF events, providing an average enhancement of 2.78 (cm−3) times more particles during events, demonstrates an important influx of particles from NPF that reach sizes relevant to CCN formation at SPL. Above 82 nm, days with NPF events do not indicate more particles than non-events, which suggests any enhancements in CCN due to NPF events are likely due to particles below 82 nm. Previous work at SPL has shown that during NPF events, particles as low as 5 nm are observed alongside events demonstrating that particles observed during NPF originate from nucleation (Hallar et al., 2016).
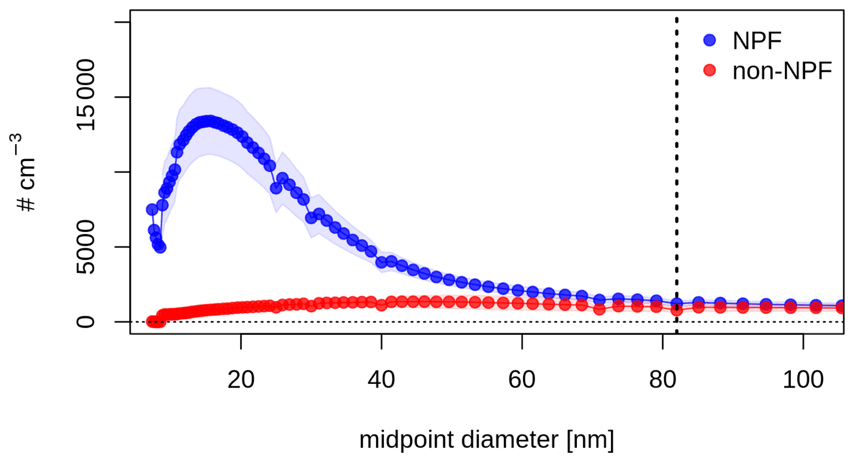
Figure 4Average number of particles produced at each particle diameter for NPF events (blue) and non-events (red). NPF events produce significantly more particles at aerosol diameters below the vertical line (82.0 nm) as determined by a two-sample t test (p<0.05 indicates significance).
3.2 Enhancements of cloud condensation nuclei due to new particle formation
To better understand the extent that aerosols from NPF events affect CCN concentrations, additional quality control is conducted to determine days when NPF events grow to CCN-relevant sizes and days with available CCN data taken at supersaturation levels between 0.2 % and 0.4 %. If there are errors in the CCN data or the difference between CCNstart and CCNend is less than an hour, the day is discarded from CCN consideration. We compare 139 type 1a and 1b events that exhibit growth to CCN sizes against 111 non-events.
Figure 5 illustrates comparative CCN number concentrations following type 1a and 1b events and non-events. We find that NPF enhances CCN concentrations by a factor of 1.54 in the spring and 1.36 in the winter. Higher CCN concentrations during NPF events than non-events are statistically significant in both the winter (p=0.020) and spring (p=0.025). However, CCN concentrations between events and non-events during the summer (p=0.889) and fall (p=0.432) are not statistically significant. Average number concentrations of CCN are higher during NPF events in the spring (event: 146.47 cm−3, non-event: 94.92 cm−3), winter (event: 98.60 cm−3, non-event: 72.67 cm−3), and fall (event: 258.84 cm−3, non-event: 245.61 cm−3) but lower during NPF events in the summer (event: 306.63 cm−3, non-event: 388.05 cm−3).
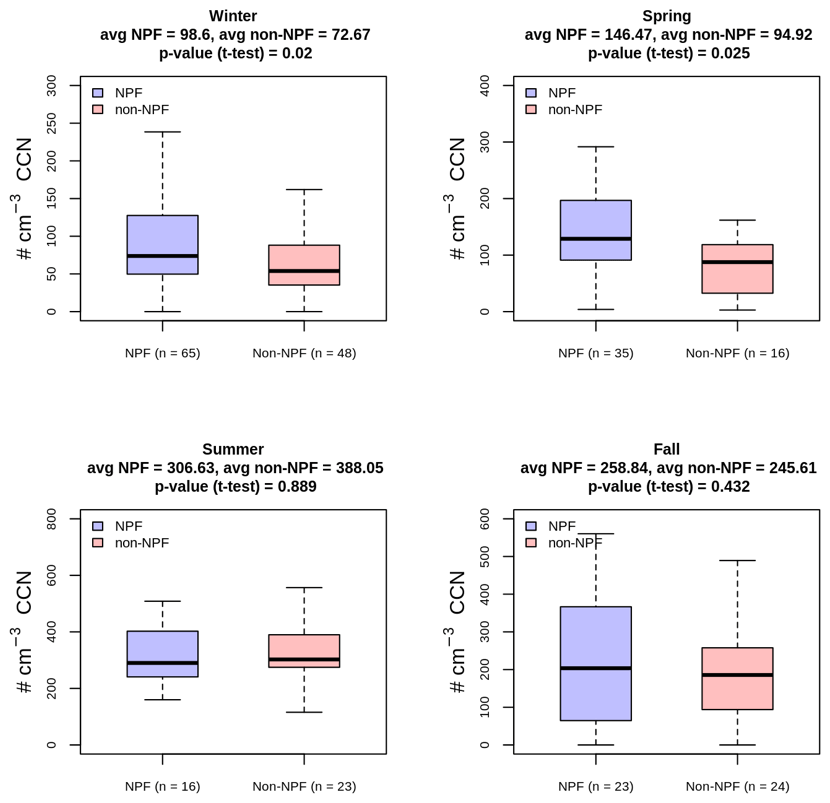
Figure 5Seasonal comparisons of average CCN number concentrations (cm−3) during NPF events (blue) and non-events (red). CCN concentrations during events are considered starting at the CCNstart time and ending at the CCNend time of a given day. CCN is considered during non-events starting at the seasonal average of CCNstart and ending at the seasonal average of CCNend. Displayed p values represent the results of a two-sample t test with a one-sided hypothesis that NPF days would exhibit greater CCN concentrations than non-events. We interpret values below p=0.05 to be statistically significant. p values show that the spring and winter display statistically significant enhancements of CCN due to NPF, a trend that is absent during the summer and fall.
NPF significantly enhances CCN concentrations in the spring and winter, the two seasons with the highest frequency of type 1a and type 1b events. Previous work at SPL indicates that the increased prevalence of anthropogenic H2SO4 precursors and cooler temperatures are two potential reasons that can lead to conditions that are conducive to NPF during the spring and winter seasons (Hallar et al., 2016; Yu and Hallar, 2014). While previous laboratory studies suggest that multiple gases including ammonia, amines, and organic compounds all influence NPF, H2SO4 is important for initiating particle nucleation due to its low volatility under atmospheric-relevant conditions (Yu et al., 2015; Sipila et al., 2010). SO2, which is a precursor of H2SO4, is emitted from coal-fired powerplants upwind of SPL allowing for the transport of SO2 which has been previously observed at SPL and can help explain the high frequency of NPF events (Hallar et al., 2016). In addition to H2SO4, lower temperatures are another important factor that can aid the enhancement of particle nucleation by lowering the thermodynamic energy barrier required for nucleation to occur (Yu, 2010; Bianchi et al., 2016; Duplissy et al., 2016; Lee et al., 2019). The combination of prevalent H2SO4 precursors and lower temperatures are two possible factors that can allow for the occurrence of persistent NPF on a regional scale during the spring and winter (Yu and Hallar, 2014). These results from modeling work suggest the significant enhancement of CCN due to NPF events during the winter and spring at SPL may be applicable on a regional scale in remote regions of North America downwind of power plants providing insight into the processes that drive CCN formation.
NPF does not significantly enhance CCN concentrations in the summer and fall seasons, compared to the spring and winter seasons (Fig. 5). One factor that could help explain this phenomenon is higher temperatures observed in the summer and fall compared to the spring and winter. Higher temperatures in the summer and fall, the seasons where NPF is not significant for forming CCN, can be a barrier to nucleation, since higher temperatures lead to lower supersaturation ratios of H2SO4 (Yu et al., 2015). In addition to higher temperatures, previous work shows that SO2 concentrations at SPL are slightly lower in the summer and fall than in the spring and winter, suggesting that H2SO4 could be less likely to form due to the combination of higher temperatures and lower available SO2 (Hallar et al., 2016; Yu et al., 2015). SO2 is not available for the entirety of the dataset, hindering the direct connection between H2SO4 precursors to the occurrence of NPF at SPL.
The CS and environmental conditions are two additional factors that can potentially explain the presence of higher aerosol concentrations during the summer and fall, despite the lack of a CCN enhancement due to NPF. The CS is a parameter that indicates how fast aerosols will condense onto pre-existing particles while also indicating how many pre-existing particles are present (Kulmala et al., 2001; Pirjola et al., 1999). Table 2 shows that CS values are highest in the summer, followed by the fall at SPL, indicating there is more pre-existing aerosol in the summer and fall than in the spring and winter. Data from the Whistler Aerosol and Cloud Study, which also takes place in a montane setting in western North America, also find that particles are more likely to grow to CCN-relevant sizes when the CS is lower, since there are fewer particles to react with condensable gases, a trend that is also observed in this work (Pierce et al., 2012). Because the CS is calculated before NPF initiation, these trends further suggest that aerosol transport to the site is not affecting the background particle concentrations during events. More work to analyze the relationship between CS and particle transport is required, since the role the CS has on NPF is highly dependent on the conditions of a given site. Environmental conditions in the intermountain US, such as wildfires, are another factor that could help explain the higher CCN concentrations present in the summer and fall during both events and non-events, since aged smoke has been observed to enhance CCN concentrations at sizes above 80 nm in the western US (Twohy et al., 2021). With wildfires becoming more frequent in the western US, CCN from wildfire emissions is expected to be a contributor to total CCN during the summer and fall months at SPL (Hallar et al., 2017). More work is needed to better understand the role that the CS and wildfires play on CCN at SPL during the summer and fall.
Table 2Seasonal summary of variables calculated for type 1a and 1b events. Values are presented as the mean of the variable ± 1 standard deviation.

The lack of a significant CCN enhancement by NPF at SPL during the summer suggests that one potential phenomenon influencing NPF, and eventually CCN concentrations, is that lower temperatures are lowering the energy barrier required for H2SO4 formation in the winter and spring (Yu et al., 2015). This suggests that an anthropogenic source of SO2, similar to the powerplants upwind of SPL, is one important aspect for the occurrence of NPF events that can enhance CCN observed in the spring and winter at SPL (Hallar et al., 2016). Other mountaintop studies that report NPF events enhancing CCN are near an anthropogenic emission source. For example, the Mt. Chacaltaya Observatory, where previous studies report 61 % of events grow to CCN sizes, is located 15 km away from the city of La Paz, Bolivia (Rose et al., 2017). Mt. Tai, a mountaintop observatory in Shandong, China, on the transport path of the Asian continental outflow, reports a decreased frequency of NPF events that grow to CCN sizes because of decreases in SO2 concentrations over time, demonstrating the importance that H2SO4 precursors have on growing aerosols from NPF to CCN sizes (Zhu et al., 2021; Fu et al., 2008). The results from this work can be compared to other results from studies that report an enhancement of CCN due to NPF (Table 3).
Table 3Details of multiple studies that find the enhancement of CCN by NPF using observational data. For a study to be included on this list, an enhancement percentage or factor of CCN due to NPF must be calculated.
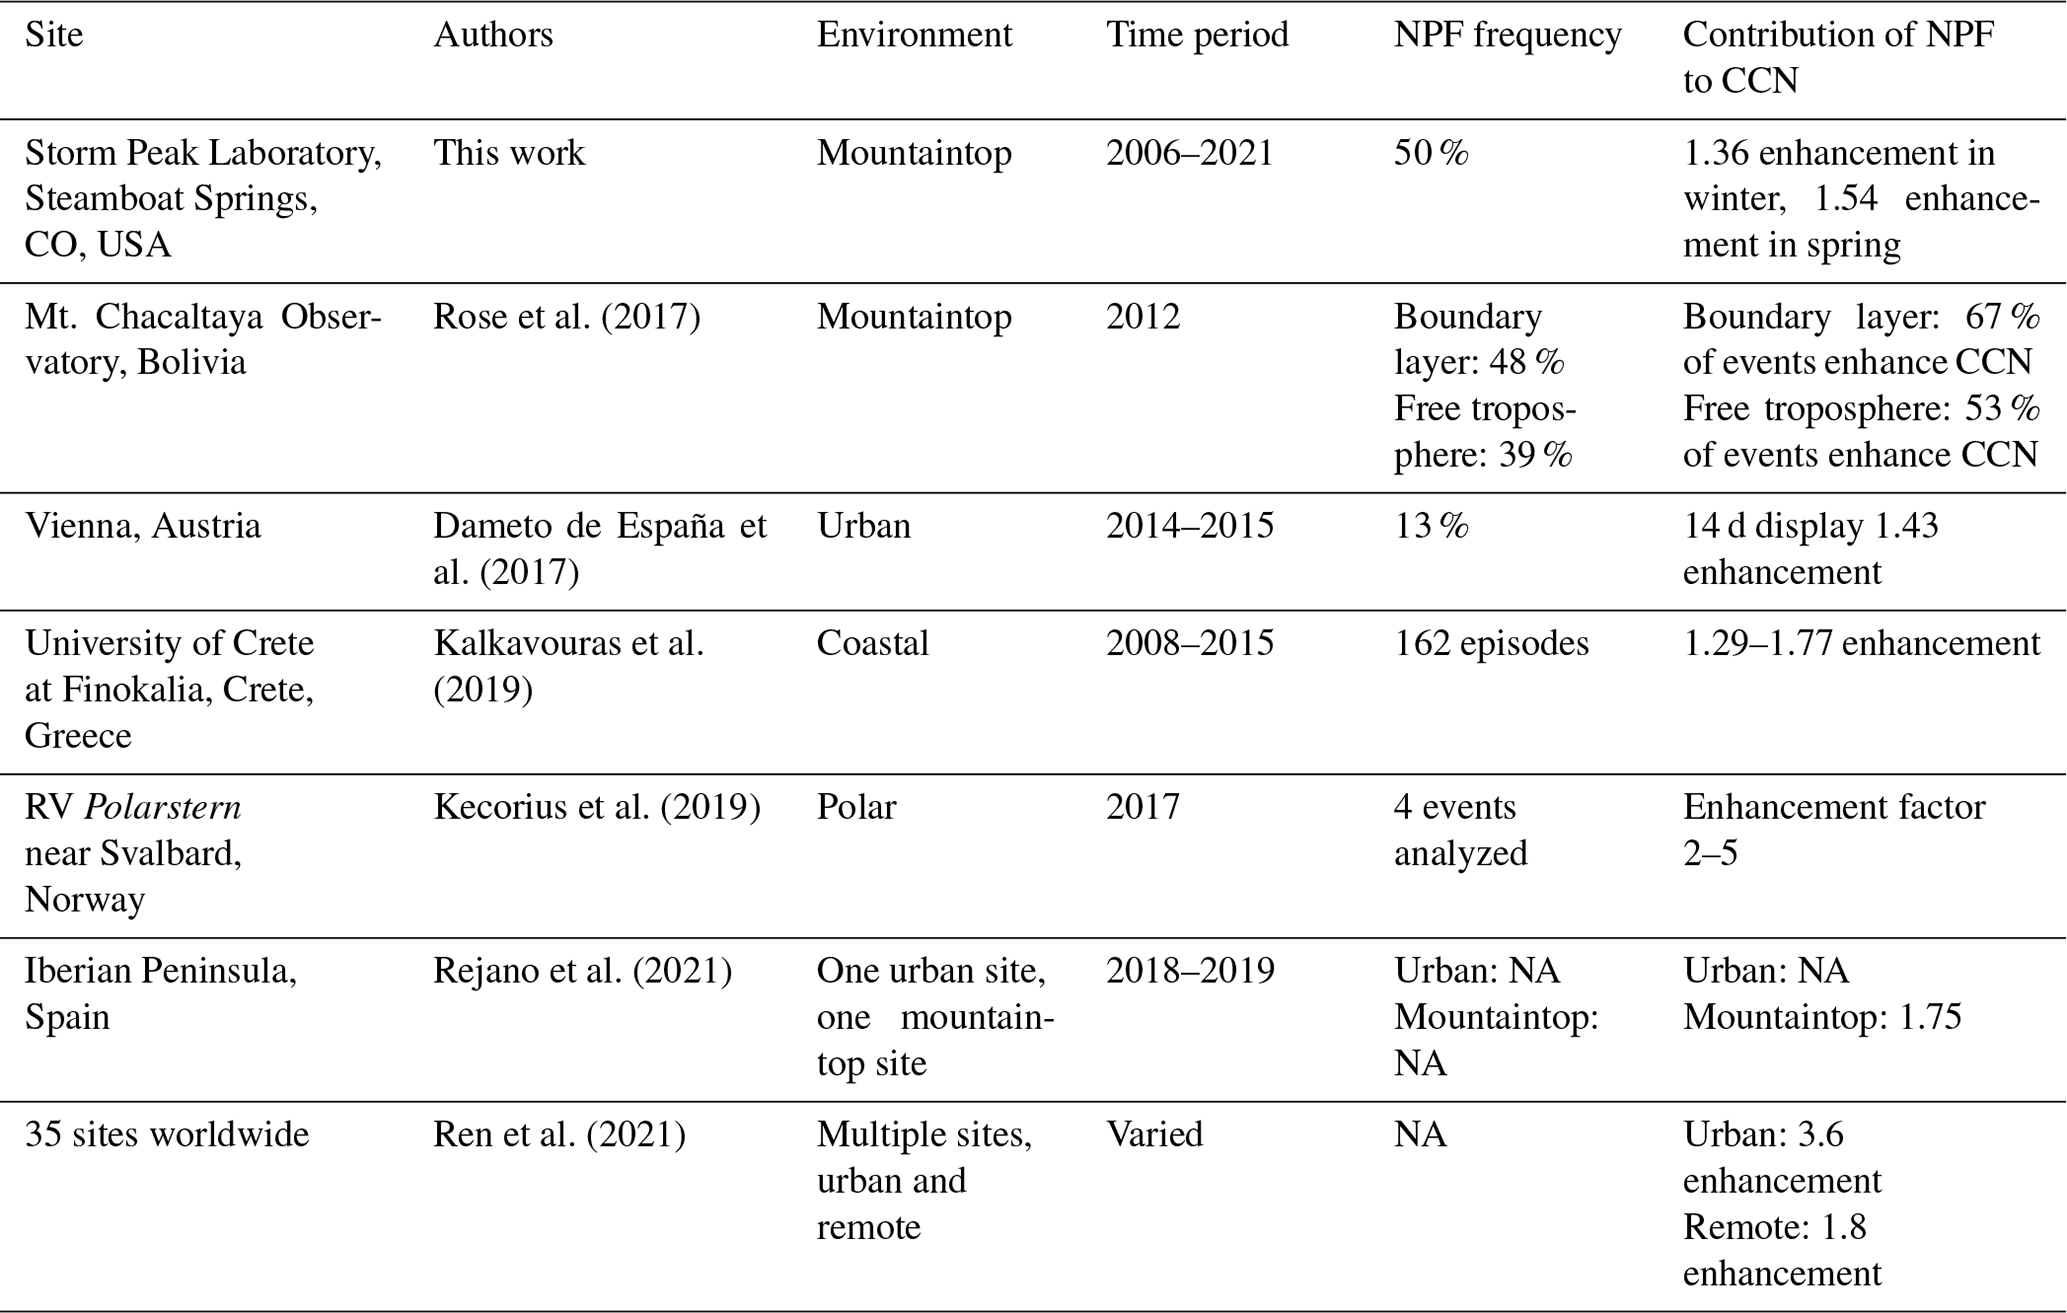
NA – not available.
To verify the automatic classifications of NPF events, we visually classify NPF events and then compare the agreement. Figure 6 contains the total number of days classified into the four classification schemes: event (includes type 1a and type 1b events), class II event, non-event, and undefined. The agreement rate of the four classification schemes between visual and automatic classification is 51 %. The automatic method classifies more days as undefined (32.2 %) compared to the visual classification method (14.6 %), leading to this poor agreement rate. However, this agreement rate increases to 79 % when considering the binary classification of events (type 1a event, type 1b event, class II event) and non-events (undefined, non-event).
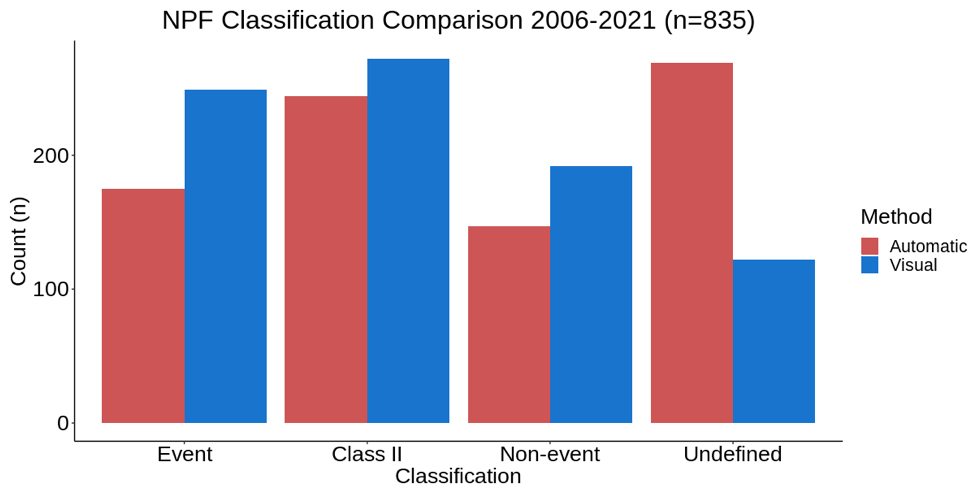
Figure 6Comparisons detailing the number of days considered a given classification category between the automatic classification method (red) and visual classification (blue). The event category includes type 1a and type 1b events.
A large source of the days classified as undefined by the automatic method are days in which five Gaussian maxima are not able to be calculated. These are days that are classified as events, undefined, and non-events during visual classification. Future work to improve the visual classification method should consider why specific days may not have Gaussian maxima fitted and thus could be incorrectly classified as undefined days. The automatic method has an 85 % agreement with visual classification at identifying events when these undefined days, due to a lack of Gaussians, are removed, demonstrating a generally good overall agreement. Because the automatic method analyzes the number concentrations with different metrics, while visual classification looks at patterns in a colored size distribution, the automatic method may be more sensitive to small perturbations in the data. More studies utilizing automatic methodology and comparing automatic classification to visual classification will help to determine aspects where automatic classification can be improved.
Because the particle growth rate and J8 values are based on calculations implemented in the automatic methodology, analysis of these variables can allow for further verification of the automatic method (Table 2). Average growth rates are the highest in the summer (10.61 nm h−1) and lowest in the winter (4.98 nm h−1). The spring and fall seasons display similar growth rates (spring: 6.51 nm h−1, fall: 5.83 nm h−1), which could indicate that the growth rate displays a seasonal cycle at SPL. Compared to Hallar et al. (2011) which utilizes visual classification methods, growth rates determined by the automatic classification are similar, albeit lower by 13.2 % in the spring, higher by 16.5 % in the summer, and lower by 14.1 % in the winter (Hallar et al., 2011). These results affirm that the automatic method is calculating growth rates well, since there is an expected difference due to different dates considered in each study. J8 values are also calculated at SPL for all seasons (Table 2). Average seasonal J8 values range from 1.76 to 11.07 cm−3 s−1, which are higher than the average seasonal values observed at SPL in 2011 ranging from 0.37 to 1.19 cm−3 s−1 (Hallar et al., 2011). Because this study uses the methodology of Kulmala et al. (2012), and Hallar et al. (2011) uses methodology from Kulmala et al. (2004), differences between the two studies are expected since loss terms are not considered in the simplified equation used in Hallar et al. (2011; Kulmala et al., 2004, 2012).
While the J8 values are higher than calculated in Hallar et al. (2011), the seasonal variation in the J8 values, with the highest observed values in the summer, indicates that our method aligns with previous work. Observations of summer NPF at SPL indicate that short bursts of particles are common in the summer which would lead to higher J8 values (Yu and Hallar, 2014). The higher growth rates observed in the summer accompanied by slightly shorter event durations further supports that NPF in the summer is likely due to significant bursts rather than prolonged growth (Table 2). Since 83 % of events classified by the method in the summer are class II events, the automatic method is successfully identifying these burst days and calculates variables that are consistent with these observations.
While a comparison with the automatic methods that use deep-learning-based convolution neural networks (CNNs) (Joutsensaari et al., 2018; Su et al., 2022) would provide an important comparison, training the CNN would require the removal of the data used in training from consideration. For example, Su et al. (2022) require 358 annotated days to train and only classifies class I (banana-shaped) events, while our method can also identify class II days. Joutsensaari et al. (2018) present another option of automatic classification using deep learning but recommend 150 d per class to properly train the method for each site. The big advantage of our method compared to other automatic methods is that aspects of the statistical method can be altered to fit individual sites without having to train the method. Assuming there are enough data available, future studies focusing on using automatic methodology should attempt to use both the statistical method detailed here and CNN-based automatic methods.
This work at SPL marks the first long-term, direct observations of aerosols and CCN that are analyzed in North America to quantify the impact NPF events have on CCN concentrations. Findings show that NPF events significantly enhance CCN concentrations in the spring by a factor of 1.54 and in the winter by a factor of 1.36, while there is no significant enhancement observed in the summer or fall. Type 1a and type 1b NPF events, characterized by persistent growth, are more common in the spring and winter while class II burst events are more common in the summer and fall. Lower temperatures which decrease the barrier for nucleation in the spring and winter alongside higher levels of SO2 (an important H2SO4 precursor) in these seasons are likely factors that contribute to the occurrence of NPF events that eventually enhance CCN concentrations (Hallar et al., 2016; Yu et al., 2015).
An innovative aspect of this research is the implementation of two new automatic methods: one to classify NPF and another to determine the times when CCN concentrations are impacted by NPF. The automatic method to identify NPF produces an overall event frequency of 50 % which compares well to event frequencies calculated by previous studies using visual classification. A comparison of the automatic classification method to visual classification produces close to an 80 % agreement showing the promise of automatic methodology to be applied in future studies. A threshold method to determine CCNstart and a growth-based method to determine CCNend ensure that CCN concentrations are considered during times that particles from a given NPF event could activate as CCN. These methods are easily applicable to larger datasets, making it possible to increase efficiency when comparing the effect of NPF on CCN at multiple sites.
At SPL, the presence of an anthropogenic SO2 plume from upwind coal-fired powerplants during the spring and winter appears to be an important factor allowing for particles from NPF to eventually activate as CCN. Similar enhancements of CCN in remote, continental regions, such as SPL, may require an anthropogenic source of NPF precursors to grow to sizes relevant to CCN formation. These results are in contrast to previous modeling studies that find NPF reduces CCN, thus providing a new perspective on the significant extent NPF enhances CCN concentrations in remote regions with close proximity to an anthropogenic source of H2SO4 precursors (Sullivan et al., 2018). More studies connecting NPF to CCN in different regions across the globe will add important information and increase understanding of the climate-relevant relationship between NPF and CCN.
All aerosol and CCN data will be available on the EBAS dataset. Please feel free to reach out to the corresponding author for access to relevant data and/or code.
The manuscript was written by NSH with contributions from all authors. Experiment design, data analysis, and methodology development were performed by NSH, LMZ, CR, GCC, and AGH. IM, FY, and AGH further contributed materials and analysis tools necessary for the study.
The contact author has declared that none of the authors has any competing interests.
Publisher's note: Copernicus Publications remains neutral with regard to jurisdictional claims in published maps and institutional affiliations.
The authors would like to acknowledge the University of Utah's Global Change and Sustainability Center and Douglas Lowenthal, DRI, for their support. Thank you to Maria Garcia and Dan Gilchrist for their hard work maintaining instruments at Storm Peak Laboratory.
This research has been supported by the Division of Atmospheric and Geospace Sciences (grant no. 1951632).
This paper was edited by Lynn M. Russell and reviewed by two anonymous referees.
Albrecht, B. A.: Aerosols, Cloud Microphysics, and Fractional Cloudiness, Science, 245, 1227–1230, https://doi.org/10.1126/science.245.4923.1227, 1989.
Amin, H., Atkins, P. T., Russo, R. S., Brown, A. W., Sive, B., Hallar, A. G., and Huff Hartz, K. E.: Effect of Bark Beetle Infestation on Secondary Organic Aerosol Precursor Emissions, Environ. Sci. Technol., 46, 5696–5703, https://doi.org/10.1021/es204205m, 2012.
Bates, D. M. and Watts, D. G.: Nonlinear regression analysis and its applications, Wiley, 1988.
Bianchi, F., Tröstl, J., Junninen, H., Frege, C., Henne, S., Hoyle, C. R., Molteni, U., Herrmann, E., Adamov, A., Bukowiecki, N., Chen, X., Duplissy, J., Gysel, M., Hutterli, M., Kangasluoma, J., Kontkanen, J., Kürten, A., Manninen, H. E., Münch, S., Peräkylä, O., Petäjä, T., Rondo, L., Williamson, C., Weingartner, E., Curtius, J., Worsnop, D. R., Kulmala, M., Dommen, J., and Baltensperger, U.: New particle formation in the free troposphere: A question of chemistry and timing, Science, 352, 1109–1112, https://doi.org/10.1126/science.aad5456, 2016.
Borys, R. D. and Wetzel, M. A.: Storm Peak Laboratory: A Research, Teaching, and Service Facility for the Atmospheric Sciences, B. Am. Meteorol. Soc., 78, 2115–2124, https://doi.org/10.1175/1520-0477(1997)078<2115:SPLART>2.0.CO;2, 1997.
Boy, M., Karl, T., Turnipseed, A., Mauldin, R. L., Kosciuch, E., Greenberg, J., Rathbone, J., Smith, J., Held, A., Barsanti, K., Wehner, B., Bauer, S., Wiedensohler, A., Bonn, B., Kulmala, M., and Guenther, A.: New particle formation in the Front Range of the Colorado Rocky Mountains, Atmos. Chem. Phys., 8, 1577–1590, https://doi.org/10.5194/acp-8-1577-2008, 2008.
Carslaw, K. S., Gordon, H., Hamilton, D. S., Johnson, J. S., Regayre, L. A., Yoshioka, M., and Pringle, K. J.: Aerosols in the Pre-industrial Atmosphere, Curr. Clim. Change Rep., 3, 1–15, https://doi.org/10.1007/s40641-017-0061-2, 2017.
Casquero-Vera, J. A., Lyamani, H., Dada, L., Hakala, S., Paasonen, P., Román, R., Fraile, R., Petäjä, T., Olmo-Reyes, F. J., and Alados-Arboledas, L.: New particle formation at urban and high-altitude remote sites in the south-eastern Iberian Peninsula, Atmos. Chem. Phys., 20, 14253–14271, https://doi.org/10.5194/acp-20-14253-2020, 2020.
Charlson, R. J., Schwartz, S. E., Hales, J. M., Cess, R. D., Coakley, J. A., Hansen, J. E., and Hofmann, D. J.: Climate Forcing by Anthropogenic Aerosols, Science, 255, 423–430, 1992.
Dal Maso, M., Kulmala, M., Riipinen, I., and Wagner, R.: Formation and growth of fresh atmospheric aerosols: Eight years of aerosol size distribution data from SMEAR II, Hyytiälä, Finland, Boreal Environ. Res., 10, 323–336, 2005.
Dameto de España, C., Wonaschütz, A., Steiner, G., Rosati, B., Demattio, A., Schuh, H., and Hitzenberger, R.: Long-term quantitative field study of New Particle Formation (NPF) events as a source of Cloud Condensation Nuclei (CCN) in the urban background of Vienna, Atmos. Environ., 164, 289–298, https://doi.org/10.1016/j.atmosenv.2017.06.001, 2017.
Duplissy, J., Merikanto, J., Franchin, A., Tsagkogeorgas, G., Kangasluoma, J., Wimmer, D., Vuollekoski, H., Schobesberger, S., Lehtipalo, K., Flagan, R. C., Brus, D., Donahue, N. M., Vehkamäki, H., Almeida, J., Amorim, A., Barmet, P., Bianchi, F., Breitenlechner, M., Dunne, E. M., Guida, R., Henschel, H., Junninen, H., Kirkby, J., Kürten, A., Kupc, A., Määttänen, A., Makhmutov, V., Mathot, S., Nieminen, T., Onnela, A., Praplan, A. P., Riccobono, F., Rondo, L., Steiner, G., Tome, A., Walther, H., Baltensperger, U., Carslaw, K. S., Dommen, J., Hansel, A., Petäjä, T., Sipilä, M., Stratmann, F., Vrtala, A., Wagner, P. E., Worsnop, D. R., Curtius, J., and Kulmala, M.: Effect of ions on sulfuric acid-water binary particle formation: 2. Experimental data and comparison with QC-normalized classical nucleation theory, J. Geophys. Res.-Atmos., 121, 1752–1775, https://doi.org/10.1002/2015JD023539, 2016.
Fu, P., Kawamura, K., Okuzawa, K., Aggarwal, S. G., Wang, G., Kanaya, Y., and Wang, Z.: Organic molecular compositions and temporal variations of summertime mountain aerosols over Mt. Tai, North China Plain, J. Geophys. Res.-Atmos., 113, D19107, https://doi.org/10.1029/2008JD009900, 2008.
Gordon, H., Kirkby, J., Baltensperger, U., Bianchi, F., Breitenlechner, M., Curtius, J., Dias, A., Dommen, J., Donahue, N. M., Dunne, E. M., Duplissy, J., Ehrhart, S., Flagan, R. C., Frege, C., Fuchs, C., Hansel, A., Hoyle, C. R., Kulmala, M., Kürten, A., Lehtipalo, K., Makhmutov, V., Molteni, U., Rissanen, M. P., Stozkhov, Y., Tröstl, J., Tsagkogeorgas, G., Wagner, R., Williamson, C., Wimmer, D., Winkler, P. M., Yan, C., and Carslaw, K. S.: Causes and importance of new particle formation in the present-day and preindustrial atmospheres, J. Geophys. Res.-Atmos., 122, 8739–8760, https://doi.org/10.1002/2017JD026844, 2017.
Hallar, A. G., Lowenthal, D. H., Chirokova, G., Borys, R. D., and Wiedinmyer, C.: Persistent daily new particle formation at a mountain-top location, Atmos. Environ., 45, 4111–4115, https://doi.org/10.1016/j.atmosenv.2011.04.044, 2011.
Hallar, A. G., Lowenthal, D. H., Clegg, S. L., Samburova, V., Taylor, N., Mazzoleni, L. R., Zielinska, B. K., Kristensen, T. B., Chirokova, G., McCubbin, I. B., Dodson, C., and Collins, D.: Chemical and hygroscopic properties of aerosol organics at Storm Peak Laboratory, J. Geophys. Res.-Atmos., 118, 4767–4779, https://doi.org/10.1002/jgrd.50373, 2013.
Hallar, A. G., Petersen, R., McCubbin, I. B., Lowenthal, D., Lee, S., Andrews, E., and Yu, F.: Climatology of New Particle Formation and Corresponding Precursors at Storm Peak Laboratory, Aerosol Air Qual. Res., 16, 816–826, https://doi.org/10.4209/aaqr.2015.05.0341, 2016.
Hallar, A. G., Molotch, N. P., Hand, J. L., Livneh, B., McCubbin, I. B., Petersen, R., Michalsky, J., Lowenthal, D., and Kunkel, K. E.: Impacts of increasing aridity and wildfires on aerosol loading in the intermountain Western US, Environ. Res. Lett., 12, 014006, https://doi.org/10.1088/1748-9326/aa510a, 2017.
Hanson, D. R. and Eisele, F.: Diffusion of H2SO4 in Humidified Nitrogen: Hydrated H2SO4, J. Phys. Chem. A, 104, 1715–1719, https://doi.org/10.1021/jp993622j, 2000.
Hirsikko, A., Bergman, T., Laakso, L., Dal Maso, M., Riipinen, I., Hõrrak, U., and Kulmala, M.: Identification and classification of the formation of intermediate ions measured in boreal forest, Atmos. Chem. Phys., 7, 201–210, https://doi.org/10.5194/acp-7-201-2007, 2007.
Joutsensaari, J., Ozon, M., Nieminen, T., Mikkonen, S., Lähivaara, T., Decesari, S., Facchini, M. C., Laaksonen, A., and Lehtinen, K. E. J.: Identification of new particle formation events with deep learning, Atmos. Chem. Phys., 18, 9597–9615, https://doi.org/10.5194/acp-18-9597-2018, 2018.
Junninen, H., Hulkkonen, M., Riipinen, I., Nieminen, T., Hirsikko, A., Suni, T., Boy, M., Lee, S.-H., Vana, M., Tammet, H., Kerminen, V.-M., and Kulmala, M.: Observations on nocturnal growth of atmospheric clusters, Tellus B, 60, 365–371, https://doi.org/10.1111/j.1600-0889.2008.00356.x, 2008.
Kalivitis, N., Kerminen, V.-M., Kouvarakis, G., Stavroulas, I., Bougiatioti, A., Nenes, A., Manninen, H. E., Petäjä, T., Kulmala, M., and Mihalopoulos, N.: Atmospheric new particle formation as a source of CCN in the eastern Mediterranean marine boundary layer, Atmos. Chem. Phys., 15, 9203–9215, https://doi.org/10.5194/acp-15-9203-2015, 2015.
Kalkavouras, P., Bossioli, E., Biskos, G., Mihalopoulos, N., Nenes, A., and Tombrou, M.: Impact of Chemical Composition on NPF, CCN and Droplet Formation at South Aegean Sea During Summertime Etesians, in: Perspectives on Atmospheric Sciences, Springer, Cham, 875–881, https://doi.org/10.1007/978-3-319-35095-0_125, 2017.
Kalkavouras, P., Bougiatioti, A., Kalivitis, N., Stavroulas, I., Tombrou, M., Nenes, A., and Mihalopoulos, N.: Regional new particle formation as modulators of cloud condensation nuclei and cloud droplet number in the eastern Mediterranean, Atmos. Chem. Phys., 19, 6185–6203, https://doi.org/10.5194/acp-19-6185-2019, 2019.
Kecorius, S., Vogl, T., Paasonen, P., Lampilahti, J., Rothenberg, D., Wex, H., Zeppenfeld, S., van Pinxteren, M., Hartmann, M., Henning, S., Gong, X., Welti, A., Kulmala, M., Stratmann, F., Herrmann, H., and Wiedensohler, A.: New particle formation and its effect on cloud condensation nuclei abundance in the summer Arctic: a case study in the Fram Strait and Barents Sea, Atmos. Chem. Phys., 19, 14339–14364, https://doi.org/10.5194/acp-19-14339-2019, 2019.
Kerminen, V.-M., Paramonov, M., Anttila, T., Riipinen, I., Fountoukis, C., Korhonen, H., Asmi, E., Laakso, L., Lihavainen, H., Swietlicki, E., Svenningsson, B., Asmi, A., Pandis, S. N., Kulmala, M., and Petäjä, T.: Cloud condensation nuclei production associated with atmospheric nucleation: a synthesis based on existing literature and new results, Atmos. Chem. Phys., 12, 12037–12059, https://doi.org/10.5194/acp-12-12037-2012, 2012.
Kerminen, V.-M., Chen, X., Vakkari, V., Petäjä, T., Kulmala, M., and Bianchi, F.: Atmospheric new particle formation and growth: review of field observations, Environ. Res. Lett., 13, 103003, https://doi.org/10.1088/1748-9326/aadf3c, 2018.
Kulmala, M., Maso, M. D., Mäkelä, J. M., Pirjola, L., Väkevä, M., Aalto, P., Miikkulainen, P., Hämeri, K., and O'Dowd, C. D.: On the formation, growth and composition of nucleation mode particles, Tellus B, 53, 479–490, https://doi.org/10.1034/j.1600-0889.2001.530411.x, 2001.
Kulmala, M., Laakso, L., Lehtinen, K. E. J., Riipinen, I., Dal Maso, M., Anttila, T., Kerminen, V.-M., Hõrrak, U., Vana, M., and Tammet, H.: Initial steps of aerosol growth, Atmos. Chem. Phys., 4, 2553–2560, https://doi.org/10.5194/acp-4-2553-2004, 2004.
Kulmala, M., Petäjä, T., Nieminen, T., Sipilä, M., Manninen, H. E., Lehtipalo, K., Dal Maso, M., Aalto, P. P., Junninen, H., Paasonen, P., Riipinen, I., Lehtinen, K. E. J., Laaksonen, A., and Kerminen, V.-M.: Measurement of the nucleation of atmospheric aerosol particles, Nat. Protoc., 7, 1651–1667, https://doi.org/10.1038/nprot.2012.091, 2012.
Lance, S., Nenes, A., Medina, J., and Smith, J. N.: Mapping the Operation of the DMT Continuous Flow CCN Counter, Aerosol Sci. Tech., 40, 242–254, https://doi.org/10.1080/02786820500543290, 2006.
Lee, S.-H., Gordon, H., Yu, H., Lehtipalo, K., Haley, R., Li, Y., and Zhang, R.: New Particle Formation in the Atmosphere: From Molecular Clusters to Global Climate, J. Geophys. Res.-Atmos., 124, 7098–7146, https://doi.org/10.1029/2018JD029356, 2019.
Lehtinen, K. E. J. and Kulmala, M.: A model for particle formation and growth in the atmosphere with molecular resolution in size, Atmos. Chem. Phys., 3, 251–257, https://doi.org/10.5194/acp-3-251-2003, 2003.
Lowenthal, D. H., Borys, R. D., and Wetzel, M. A.: Aerosol distributions and cloud interactions at a mountaintop laboratory, J. Geophys. Res.-Atmos., 107, AAC 1-1–AAC 1-6, https://doi.org/10.1029/2001JD002046, 2002.
Lowenthal, D. H., Hallar, A. G., David, R. O., McCubbin, I. B., Borys, R. D., and Mace, G. G.: Mixed-phase orographic cloud microphysics during StormVEx and IFRACS, Atmos. Chem. Phys., 19, 5387–5401, https://doi.org/10.5194/acp-19-5387-2019, 2019.
Merikanto, J., Spracklen, D. V., Mann, G. W., Pickering, S. J., and Carslaw, K. S.: Impact of nucleation on global CCN, Atmos. Chem. Phys., 9, 8601–8616, https://doi.org/10.5194/acp-9-8601-2009, 2009.
Nishita, C., Osada, K., Kido, M., Matsunaga, K., and Iwasaka, Y.: Nucleation mode particles in upslope valley winds at Mount Norikura, Japan: Implications for the vertical extent of new particle formation events in the lower troposphere, J. Geophys. Res.-Atmos., 113, D06202, https://doi.org/10.1029/2007JD009302, 2008.
Obrist, D., Hallar, A. G., McCubbin, I., Stephens, B. B., and Rahn, T.: Atmospheric mercury concentrations at Storm Peak Laboratory in the Rocky Mountains: Evidence for long-range transport from Asia, boundary layer contributions, and plant mercury uptake, Atmos. Environ., 42, 7579–7589, https://doi.org/10.1016/j.atmosenv.2008.06.051, 2008.
Pierce, J. R. and Adams, P. J.: Efficiency of cloud condensation nuclei formation from ultrafine particles, Atmos. Chem. Phys., 7, 1367–1379, https://doi.org/10.5194/acp-7-1367-2007, 2007.
Pierce, J. R., Leaitch, W. R., Liggio, J., Westervelt, D. M., Wainwright, C. D., Abbatt, J. P. D., Ahlm, L., Al-Basheer, W., Cziczo, D. J., Hayden, K. L., Lee, A. K. Y., Li, S.-M., Russell, L. M., Sjostedt, S. J., Strawbridge, K. B., Travis, M., Vlasenko, A., Wentzell, J. J. B., Wiebe, H. A., Wong, J. P. S., and Macdonald, A. M.: Nucleation and condensational growth to CCN sizes during a sustained pristine biogenic SOA event in a forested mountain valley, Atmos. Chem. Phys., 12, 3147–3163, https://doi.org/10.5194/acp-12-3147-2012, 2012.
Pirjola, L., Kulmala, M., Wilck, M., Bischoff, A., Stratmann, F., and Otto, E.: Formation of Sulphuric Acid Aerosols and Cloud Condensation Nuclei: an Expression for Significant Nucleation and Model Comparison, J. Aerosol Sci., 30, 1079–1094, https://doi.org/10.1016/S0021-8502(98)00776-9, 1999.
Rejano, F., Titos, G., Casquero-Vera, J. A., Lyamani, H., Andrews, E., Sheridan, P., Cazorla, A., Castillo, S., Alados-Arboledas, L., and Olmo, F. J.: Activation properties of aerosol particles as cloud condensation nuclei at urban and high-altitude remote sites in southern Europe, Sci. Total Environ., 762, 143100, https://doi.org/10.1016/j.scitotenv.2020.143100, 2021.
Ren, J., Chen, L., Fan, T., Liu, J., Jiang, S., and Zhang, F.: The NPF Effect on CCN Number Concentrations: A Review and Re-Evaluation of Observations From 35 Sites Worldwide, Geophys. Res. Lett., 48, e2021GL095190, https://doi.org/10.1029/2021GL095190, 2021.
Roberts, G. C. and Nenes, A.: A Continuous-Flow Streamwise Thermal-Gradient CCN Chamber for Atmospheric Measurements, Aerosol Sci. Tech., 39, 206–221, https://doi.org/10.1080/027868290913988, 2005.
Rose, C., Sellegri, K., Moreno, I., Velarde, F., Ramonet, M., Weinhold, K., Krejci, R., Andrade, M., Wiedensohler, A., Ginot, P., and Laj, P.: CCN production by new particle formation in the free troposphere, Atmos. Chem. Phys., 17, 1529–1541, https://doi.org/10.5194/acp-17-1529-2017, 2017.
Sebastian, M., Kanawade, V. P., Soni, V. K., Asmi, E., Westervelt, Daniel. M., Vakkari, V., Hyvärinen, A.-P., Pierce, J. R., and Hooda, R. K.: New Particle Formation and Growth to Climate-Relevant Aerosols at a Background Remote Site in the Western Himalaya, J. Geophys. Res.-Atmos., 126, e2020JD033267, https://doi.org/10.1029/2020JD033267, 2021.
Sellegri, K., Rose, C., Marinoni, A., Lupi, A., Wiedensohler, A., Andrade, M., Bonasoni, P., and Laj, P.: New Particle Formation: A Review of Ground-Based Observations at Mountain Research Stations, Atmosphere, 10, 493, https://doi.org/10.3390/atmos10090493, 2019.
Sipila, M., Berndt, T., Petaja, T., Brus, D., Vanhanen, J., Stratmann, F., Patokoski, J., Mauldin, R. L., Hyvarinen, A.-P., Lihavainen, H., and Kulmala, M.: The Role of Sulfuric Acid in Atmospheric Nucleation, Science, 327, 1243–1246, https://doi.org/10.1126/science.1180315, 2010.
Spracklen, D. V., Carslaw, K. S., Merikanto, J., Mann, G. W., Reddington, C. L., Pickering, S., Ogren, J. A., Andrews, E., Baltensperger, U., Weingartner, E., Boy, M., Kulmala, M., Laakso, L., Lihavainen, H., Kivekäs, N., Komppula, M., Mihalopoulos, N., Kouvarakis, G., Jennings, S. G., O'Dowd, C., Birmili, W., Wiedensohler, A., Weller, R., Gras, J., Laj, P., Sellegri, K., Bonn, B., Krejci, R., Laaksonen, A., Hamed, A., Minikin, A., Harrison, R. M., Talbot, R., and Sun, J.: Explaining global surface aerosol number concentrations in terms of primary emissions and particle formation, Atmos. Chem. Phys., 10, 4775–4793, https://doi.org/10.5194/acp-10-4775-2010, 2010.
Stocker, T. F., Qin, D., Plattner, G. K., Tignor, M. M. B., Allen, S. K., Boschung, J., Nauels, A., Xia, Y., Bex, V., and Midgley, P. M.: Summary for Policymakers, in: Climate Change 2013: The Physical Science Basis. Contribution of Working Group I to the Fifth Assessment Report of the Intergovernmental Panel on Climate Change, edited by: Stocker, T., Qin, D., Plattner, G.-K., Tignor, M., Allen, S., Boschung, J., Nauels, A., Xia, Y., Bex, V., and Midgley, P., Cambridge University Press, Cambridge, UK, and New York, NY, USA, 3–29, 2014.
Su, P., Joutsensaari, J., Dada, L., Zaidan, M. A., Nieminen, T., Li, X., Wu, Y., Decesari, S., Tarkoma, S., Petäjä, T., Kulmala, M., and Pellikka, P.: New particle formation event detection with Mask R-CNN, Atmos. Chem. Phys., 22, 1293–1309, https://doi.org/10.5194/acp-22-1293-2022, 2022.
Sullivan, R. C., Crippa, P., Matsui, H., Leung, L. R., Zhao, C., Thota, A., and Pryor, S. C.: New particle formation leads to cloud dimming, npj Clim Atmos. Sci., 1, 9, https://doi.org/10.1038/s41612-018-0019-7, 2018.
Svenningsson, B., Arneth, A., Hayward, S., Holst, T., Massling, A., Swietlicki, E., Hirsikko, A., Junninen, H., Riipinen, I., Vana, M., Maso, M. D., Hussein, T., and Kulmala, M.: Aerosol particle formation events and analysis of high growth rates observed above a subarctic wetland–forest mosaic, Tellus B, 60, 353–364, https://doi.org/10.1111/j.1600-0889.2008.00351.x, 2008.
Tröstl, J., Herrmann, E., Frege, C., Bianchi, F., Molteni, U., Bukowiecki, N., Hoyle, C. R., Steinbacher, M., Weingartner, E., Dommen, J., Gysel, M., and Baltensperger, U.: Contribution of new particle formation to the total aerosol concentration at the high-altitude site Jungfraujoch (3580 m asl, Switzerland), 121, 11692–11711, https://doi.org/10.1002/2015JD024637, 2016.
Tuovinen, S., Kontkanen, J., Jiang, J., and Kulmala, M.: Investigating the effectiveness of condensation sink based on heterogeneous nucleation theory, J. Aerosol Sci., 149, 105613, https://doi.org/10.1016/j.jaerosci.2020.105613, 2020.
Tuovinen, S., Kontkanen, J., Cai, R., and Kulmala, M.: Condensation sink of atmospheric vapors: the effect of vapor properties and the resulting uncertainties, Environ. Sci.-Atmos., 1, 543–557, https://doi.org/10.1039/D1EA00032B, 2021.
Twohy, C. H., Toohey, D. W., Levin, E. J. T., DeMott, P. J., Rainwater, B., Garofalo, L. A., Pothier, M. A., Farmer, D. K., Kreidenweis, S. M., Pokhrel, R. P., Murphy, S. M., Reeves, J. M., Moore, K. A., and Fischer, E. V.: Biomass Burning Smoke and Its Influence on Clouds Over the Western U. S., Geophys. Res. Lett., 48, e2021GL094224, https://doi.org/10.1029/2021GL094224, 2021.
Twomey, S.: Pollution and the planetary albedo, Atmos. Environ., 8, 1251–1256, https://doi.org/10.1016/0004-6981(74)90004-3, 1974.
Twomey, S. A., Piepgrass, M., and Wolfe, T. L.: An assessment of the impact of pollution on global cloud albedo, Tellus B, 36, 356–366, https://doi.org/10.1111/j.1600-0889.1984.tb00254.x, 1984.
Welty, J., Rorrer, G. L., and Foster, D. G.: Fundamentals of Momentum, Heat, and Mass Transfer, John Wiley & Sons, 783 pp., ISBN 978-1-119-72354-7, 2020.
Yu, F.: Ion-mediated nucleation in the atmosphere: Key controlling parameters, implications, and look-up table, J. Geophys. Res.-Atmos., 115, D03206, https://doi.org/10.1029/2009JD012630, 2010.
Yu, F. and Hallar, A. G.: Difference in particle formation at a mountaintop location during spring and summer: Implications for the role of sulfuric acid and organics in nucleation, J. Geophys. Res.-Atmos., 119, 12246–12255, https://doi.org/10.1002/2014JD022136, 2014.
Yu, F. and Luo, G.: Simulation of particle size distribution with a global aerosol model: contribution of nucleation to aerosol and CCN number concentrations, Atmos. Chem. Phys., 9, 7691–7710, https://doi.org/10.5194/acp-9-7691-2009, 2009.
Yu, F., Luo, G., Pryor, S. C., Pillai, P. R., Lee, S. H., Ortega, J., Schwab, J. J., Hallar, A. G., Leaitch, W. R., Aneja, V. P., Smith, J. N., Walker, J. T., Hogrefe, O., and Demerjian, K. L.: Spring and summer contrast in new particle formation over nine forest areas in North America, Atmos. Chem. Phys., 15, 13993–14003, https://doi.org/10.5194/acp-15-13993-2015, 2015.
Zhu, Y., Xue, L., Gao, J., Chen, J., Li, H., Zhao, Y., Guo, Z., Chen, T., Wen, L., Zheng, P., Shan, Y., Wang, X., Wang, T., Yao, X., and Wang, W.: Increased new particle yields with largely decreased probability of survival to CCN size at the summit of Mt. Tai under reduced SO2 emissions, Atmos. Chem. Phys., 21, 1305–1323, https://doi.org/10.5194/acp-21-1305-2021, 2021.