the Creative Commons Attribution 4.0 License.
the Creative Commons Attribution 4.0 License.
 | 12 Dec 2022
Conditions favorable for secondary ice production in Arctic mixed-phase clouds
Julie Thérèse Pasquier
Jan Henneberger
Fabiola Ramelli
Annika Lauber
Robert Oscar David
Jörg Wieder
Tim Carlsen
Rosa Gierens
Marion Maturilli
Ulrike Lohmann
The Arctic is very susceptible to climate change and thus is warming much faster than the rest of the world. Clouds influence terrestrial and solar radiative fluxes and thereby impact the amplified Arctic warming. The partitioning of thermodynamic phases (i.e., ice crystals and water droplets) within mixed-phase clouds (MPCs) especially influences their radiative properties. However, the processes responsible for ice crystal formation remain only partially characterized. In particular, so-called secondary ice production (SIP) processes, which create supplementary ice crystals from primary ice crystals and the environmental conditions that they occur in, are poorly understood. The microphysical properties of Arctic MPCs were measured during the Ny-Ålesund AeroSol Cloud ExperimENT (NASCENT) campaign to obtain a better understanding of the atmospheric conditions favorable for the occurrence of SIP processes. To this aim, the in situ cloud microphysical properties retrieved by a holographic cloud imager mounted on a tethered balloon system were complemented by ground-based remote sensing and ice-nucleating particle measurements. During the 6 d investigated in this study, SIP occurred during about 40 % of the in-cloud measurements, and high SIP events with number concentrations larger than 10 L−1 of small pristine ice crystals occurred in 4 % of the in-cloud measurements. This demonstrates the role of SIP for Arctic MPCs. The highest concentrations of small pristine ice crystals were produced at temperatures between −5 and −3 ∘C and were related to the occurrence of supercooled large droplets freezing upon collision with ice crystals. This suggests that a large fraction of ice crystals in Arctic MPCs are produced via the droplet-shattering mechanism. From evaluating the ice crystal images, we could identify ice–ice collision as a second SIP mechanism that dominated when fragile ice crystals were observed. Moreover, SIP occurred over a large temperature range and was observed in up to 80 % of the measurements down to −24 ∘C due to the occurrence of ice–ice collisions. This emphasizes the importance of SIP at temperatures below −8 ∘C, which are currently not accounted for in most numerical weather models. Although ice-nucleating particles may be necessary for the initial freezing of water droplets, the ice crystal number concentration is frequently determined by secondary production mechanisms.
- Article
(9446 KB) - Full-text XML
- BibTeX
- EndNote


Clouds influence the radiation budget in two competing ways. On the one hand, they scatter shortwave radiation back to space and thereby cool the surface. On the other hand, they absorb and re-emit longwave radiation and thereby warm the surface. The Arctic is experiencing an amplified warming (Meredith et al., 2019), which is influenced by several feedback processes associated with temperature, water vapor, and clouds (Goosse et al., 2018). The influence of clouds on the radiation budget in the Arctic is especially complex and uncertain because of the strongly varying reflection from the surface below (sea ice or water) or the lack of solar radiation during polar night (e.g., Goosse et al., 2018). In addition, the phase partitioning and concentration of the cloud particles determine the exact radiative properties of the mixed-phase clouds (MPCs) consisting of water vapor, cloud droplets, and ice crystals (Sun and Shine, 1994). Because the cloud particle concentration and phase partitioning strongly influence the radiative properties of MPCs, a thorough understanding of the processes that determine the formation and transformation of cloud particles is required.
At temperatures below −38 ∘C, cloud droplets freeze homogeneously, whereas at temperatures between −38 and 0 ∘C, primary ice crystals form on ice-nucleating particles (INPs). However, many observations have shown that the ice crystal number concentration (ICNC) in MPCs is frequently several orders of magnitude higher than the measured INP concentration (INPC; e.g., Hobbs and Rangno, 1985, 1998; Ladino et al., 2017; Korolev et al., 2020). This discrepancy can be explained by additional ice crystals falling from a seeder cloud aloft (e.g. Ramelli et al., 2021; Proske et al., 2021), by the influence of surface processes such as blowing snow (e.g., Beck et al., 2018), or by the formation of secondary ice crystals from the existing ice crystals (e.g., Hallett and Mossop, 1974; Takahashi et al., 1995; Field et al., 2017; Korolev and Leisner, 2020). This last process, known as secondary ice production (SIP), is thought to play a critical role in the formation of ice crystals in supercooled clouds (e.g., Korolev et al., 2020; Korolev and Leisner, 2020).
Several SIP mechanisms have been proposed over the past decades: droplet shattering during freezing, rime splintering during riming, fragmentation during ice–ice collision, and fragmentation during sublimation (e.g., Field et al., 2017; Korolev and Leisner, 2020). Droplet shattering is defined as the ejection of secondary ice crystals caused by cracking, fragmentation, bubble bursting or jetting, which can occur due to pressure build-up during freezing of droplets (e.g., Mason and Maybank, 1960; Takahashi and Yamashita, 1970; Lauber et al., 2018; Keinert et al., 2020). The rime-splintering process, or Hallett–Mossop process (Hallett and Mossop, 1974; Mossop, 1978), refers to the production of secondary ice during riming and is expected to occur when cloud droplets freeze upon collision with large rimed ice particles (e.g., Mossop, 1978, 1985; Field et al., 2017; Korolev and Leisner, 2020). Fragmentation during collision of several ice particles can lead to their fragmentation, which creates secondary ice crystals (Vardiman, 1978; Takahashi et al., 1995). Finally, fragmentation during ice crystal sublimation in unsaturated regions can create secondary ice crystals, but it requires that the fragments re-enter the saturated cloud regions; otherwise, the complete sublimation of the fragment is likely (Dong et al., 1994; Bacon et al., 1998).
The environmental conditions favorable for SIP were mostly assessed in laboratory studies (see Korolev and Leisner, 2020, for an overview of laboratory studies on SIP). Temperature, cloud droplet concentrations and sizes, and ice crystal sizes and habits are particularly relevant for the occurrence of SIP (e.g., Korolev and Leisner, 2020). The temperature range between −8 and −3 ∘C was suggested to be the most favorable for the occurrence of rime splintering (Hallett and Mossop, 1974; Mossop and Hallett, 1974), whereas the maximum rate of fragments produced by droplet shattering or by ice–ice collision was observed at around −15 ∘C in laboratory studies (Takahashi and Yamashita, 1970; Takahashi et al., 1995; Lauber et al., 2018). However, evidence for droplet shattering has been observed over a much wider temperature range, from −20 ∘C up to −0.5 ∘C during field observations of natural MPCs (Lawson et al., 2015; Korolev et al., 2020; Lauber et al., 2021; Pasquier et al., 2022a) and in laboratory experiments (Keinert et al., 2020). Cloud droplets are needed for the rime-splintering and the droplet-shattering processes. Although droplets smaller than 12 µm and larger than 24 µm are necessary for the rime-splintering process (e.g., Mossop, 1978, 1985; Korolev and Leisner, 2020), the probability of droplet-shattering occurrence increases with increasing droplet size (Lauber et al., 2018; Keinert et al., 2020). The size and concentration of the droplets is, in turn, influenced by aerosol particles acting as cloud condensation nuclei (CCN), by updrafts, by the general cloud dynamics, and by the cloud lifetime (Lohmann et al., 2016). The ICNCs and the ice crystal shapes and sizes are also relevant for SIP. In particular, large rimed ice crystals were found to increase the rate of splinters ejected during rime splintering (Hallett and Mossop, 1974) and ice–ice collision (Vardiman, 1978). Particles with complex shapes are more likely to produce fragments during sublimation (Bacon et al., 1998).
However, there are large inconsistencies and many gaps in the current knowledge of the physical mechanisms and environmental conditions favorable for SIP due to the scarcity of laboratory and field measurements (Korolev and Leisner, 2020). In addition, direct measurements of in-cloud SIP processes are challenging, as the secondary fragments and splinters of a few micrometers or less are typically below the resolution limit of cloud measurement probes, and the probability of observing a cloud particle when it is involved in SIP is infinitesimally small. Furthermore, the presence of an INP in ice particles can only be determined on a crystal-by-crystal basis, which requires that each ice crystal is sampled and analyzed individually for the presence of an INP (Hoffer and Braham, 1962; Mertes et al., 2007; Worringen et al., 2015; Mignani et al., 2019). However, when the concentration of small ice crystals exceeds that of ambient INPs, SIP processes must have contributed to the ICNC. As such, several studies compare INPC with total ICNC to infer the occurrence of SIP (e.g., Ladino et al., 2017; Li et al., 2021; Wieder et al., 2022a). The cloud microphysical properties can additionally be used to identify the mechanism potentially responsible for SIP. For example, rimed particles together with a sufficient concentration of cloud droplets (with diameter below 12 µm and above 24 µm) at temperatures between −8 and −3 ∘C are an indicator of the occurrence of the rime-splintering process (e.g., Lloyd et al., 2015). Meanwhile, drizzle drops and/or frozen drops can be indicators of the occurrence of droplet shattering (e.g., Lawson et al., 2017), and large rimed particles or broken ice crystals at relatively low temperatures may be indicators of ice–ice collisions.
Even if SIP parametrizations were used on case studies for the ice–ice collision and droplet-shattering mechanisms (e.g., Sotiropoulou et al., 2020; Dedekind et al., 2021; Georgakaki et al., 2022), only the rime-splintering process is widely used in numerical weather and climate models. However, accurate descriptions of SIP processes and of the environmental conditions favorable for SIP are needed to correctly represent the phase partitioning within MPCs to estimate their radiative properties in the Arctic (Young et al., 2019).
The present study aims to identify conditions favorable for SIP in low-level Arctic MPCs using a holographic imager mounted on the tethered balloon system HoloBalloon (Ramelli et al., 2020) together with ground-based INP and remote sensing measurements. The results presented originate from 6 d of measurement in MPCs collected during the Ny-Ålesund AeroSol Cloud ExperimENT (NASCENT) campaign (Pasquier et al., 2022a) in Ny-Ålesund, Svalbard. First, the main instrumentation and the methodology applied for SIP identification are described in Sect. 2. Second, we present the meteorology and the occurrence of SIP over six measurement days in Sect. 3. Then, the environmental conditions associated with the SIP occurrence are examined in Sect. 4. Lastly, the final remarks and recommendations for future work are given in Sect. 5.
2.1 Measurement location
The data presented in this paper were collected during the NASCENT campaign, which took place in Ny-Ålesund, Svalbard, (78.9∘ N, 11.9∘ E, Fig. 1a) from September 2019 to August 2020 with the goal of enhancing the existing knowledge about aerosols and clouds in the Arctic climate and their interactions throughout the year. A description of the campaign and the main instrumentation is given in Pasquier et al. (2022a). Ny-Ålesund is situated on the south side of Kongsfjorden and on the northern side of a mountain range, with Mt. Zeppelin being the closest mountain, situated 2.5 km southwestward of the settlement (Fig. 1b). The surface wind is strongly influenced by the topography (Fig. 1b) and is typically channeled along Kongsfjorden (Beine et al., 2001; Maturilli et al., 2013; Maturilli and Kayser, 2017; Pasquier et al., 2022a).

Figure 1(a) Map of Svalbard, with the location of Ny-Ålesund marked with the red star. (b) Map of the peninsula close to Ny-Ålesund. Ny-Ålesund, the Kronebreen and Kongsvegen glaciers, the fjord Kongsfjorden, and the Mt. Zeppelin mountain are labeled (topographical data from Norwegian Polar Institute, 2014).
2.2 Instrument setup
The tethered balloon system HoloBalloon (Ramelli et al., 2020) was used to perform in situ cloud microphysical measurements during October–November 2019 and March–April 2020. HoloBalloon consists of a cloud measurement platform hanging 12 m below a Helikite. The main instrument on the measuring platform is the HOLographic cloud Imager for Microscopic Objects (HOLIMO). HOLIMO images cloud particles in the size range from small cloud droplets (6 µm) to precipitation-sized particles (2 mm) in a three-dimensional sample volume to obtain information about the phase-resolved particle size distribution and particle habits (Henneberger et al., 2013; Beck et al., 2017; Ramelli et al., 2020). The classification of cloud droplets and ice crystals is performed based on their shape, using a convolutional neural network trained and fine tuned on cloud particles from holographic imagers (Touloupas et al., 2020; Lauber, 2020). The smallest detectable ice crystals are 25 µm, and all particles below this threshold are automatically classified as cloud droplets. Furthermore, ice crystals with a rather circular shape in the 2D image are misclassified as cloud droplets. All ice crystals were manually classified into habits based on their 2D shape into plates, columns, frozen drops, recirculation particles showing evidences for growth in the plate and columnar growth regimes (see Sect. 3.2 and Pasquier et al., 2022b, for details), and aged particles that comprise rimed, aggregated, and irregular ice crystals. In addition, cloud droplets and artifacts wrongly classified as ice crystals by the convolutional neural network were manually reclassified. Therefore, the uncertainty in the concentration of ice particles can be estimated with ±15 % for ice crystals smaller than 100 µm and ±5 % for ice crystals larger than about 100 µm (Beck, 2017). For cloud droplets, the uncertainty is estimated to be ±6 %, as determined for the classification with the convolutional neural network in Touloupas et al. (2020). The sampling volume of HOLIMO is about 16–20 cm3 per frame, and approximately 4–6 frames were taken per second, which gives a volume of 3 to 60 L for the averages over 30 s to 5 min used in this study. Thus, the limit of detection of HOLIMO, corresponding to one cloud particle measured in the time average, amounts to ∼0.3 L−1 for measurements averaged over 30 s. Note that using a tethered balloon system such as HoloBalloon for cloud microphysical measurements has the advantage that the influence from ice crystals lifted from the ground (e.g., blowing snow, Beck et al., 2018) can be neglected due to the distance of the measurements from the surface. In addition, HOLIMO's open-path configuration and anti-shattering tips (as recommended in Korolev et al., 2013) as well as the automatic orientation of the kytoon and the payload in the wind direction mitigate the shattering of falling ice crystals in the sample volume.
Ambient aerosols were sampled through a heated inlet mounted on top of an observatory container located next to the launching location of HoloBalloon (Pasquier et al., 2022a). Downstream of the inlet, a high-flow-rate impinger (Coriolis® µ, Bertin Instruments, France) operating at 300 L min−1 collected ambient aerosol particles with aerodynamic diameters of 0.5 µm and larger into pure water. For one sample, the impinger collected aerosol particles for 1 h, probing a volume of 18 m3. Directly after collection, each sample was analyzed for INPC via the offline technique DRoplet Ice Nuclei Counter Zurich (DRINCZ; David et al., 2019), which measured INPC at sub-freezing temperatures between approximately −20 and −3 ∘C. INPCs were calculated according to Vali (1971), corrected for the sampling water's background, and converted to concentrations in air, and their uncertainties were calculated by applying Gaussian error propagation. Further details of the processing are presented in Wieder et al. (2022b) and Li et al. (2022). The lower INPC detection limit amounts to L−1, and the relative measurement uncertainty is, on average, given by a factor of 2.
The in situ measurements were complemented by remote sensing instruments installed at the French–German Arctic Research Base AWIPEV. In particular, the 94 GHz cloud radar of the University of Cologne (JOYRAD-94, RPG; Küchler et al., 2017) was used for analyzing the whole cloud structure; the ceilometer (CL51, Vaisala; Maturilli and Ebell, 2018) was utilized to determine the cloud base height, and the wind lidar (Windcube200, Leosphere; Graßl et al., 2022) enabled the continuous characterization of wind direction and speed in the lower troposphere. Meteorological surface measurements were continuously available from the AWIPEV observation site (Maturilli et al., 2013, 2015), and the vertical atmospheric structure was determined by daily and additional radiosondes (Maturilli and Kayser, 2017) during specific measurement periods.
2.3 SIP identification
We use a specific method to identify from in situ measurements cloud regions where SIP recently occurred, using the concentration of small pristine ice crystals (diameters <100 µm), following the approach introduced by Korolev et al. (2020). This approach is based on the fact that, if SIP occurs in a supersaturated environment, the newly formed ice fragments or splinters rapidly grow by means of water vapor diffusion into detectable, faceted ice crystal habits representative of the environment in which they grow (e.g., Nakaya, 1954; Libbrecht, 2005). With time, the ice crystal habit can lose its spatial correlation with its environment of origin due to turbulent diffusion as well as horizontal and/or vertical advection. Korolev et al. (2020) estimated the time that a secondary ice particle remains associated with its environment of origin to be 60–120 s, which allows a hexagonal plate or column to grow to a width or length of 50–150 µm at water saturation, depending on its aspect ratio and the environmental temperature. Following this method, we use the occurrence of pristine ice crystals with major axes between 25 and 106 µm as an indicator of SIP regions. The major axis is defined as the major axis of an ellipse that encompasses the detected pixels of the particle. This specific cut-off size was chosen, as it is the bin size of the size distribution used in the processing of the data closest to 100 µm, thus lying in between 50 and 150 µm. Examples of pristine ice crystals smaller than 106 µm, used as indicators for SIP regions, are shown in Fig. 2 and are contrasted with non-pristine ice crystals smaller than 106 µm and pristine ice crystals larger than 106 µm. We exclude non-pristine ice crystals from the SIP analysis, as their habits and thus the environment in which they grew cannot be unambiguously defined. This also removes the potential for any falling ice or rime from the balloon to be misclassified as SIP.
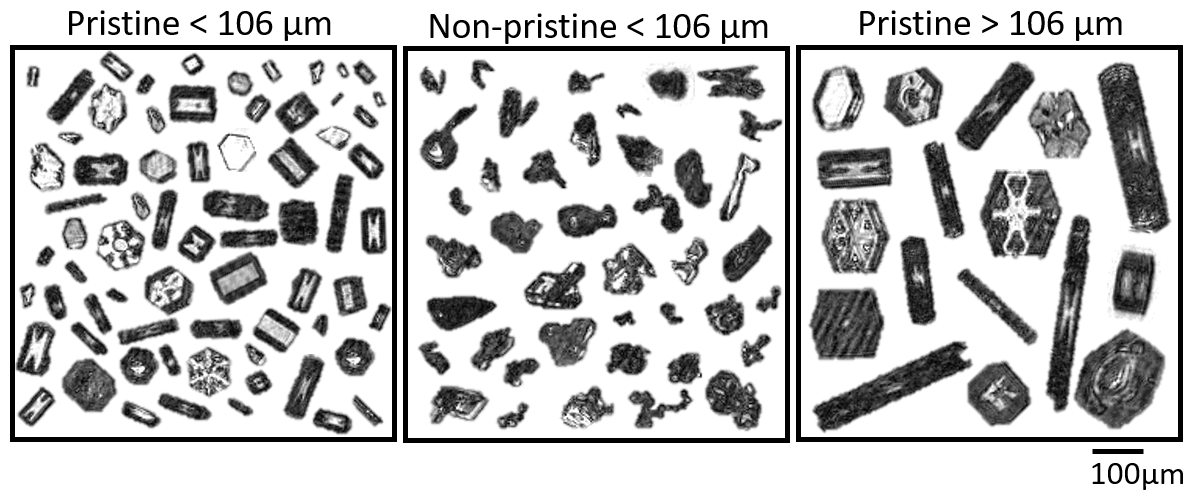
Figure 2Examples of ice crystals observed with HOLIMO, classified as pristine ice crystals with diameters <106 µm, non-pristine ice crystals with diameters <106 µm, and pristine ice crystals with diameters >106 µm. The presence of pristine ice crystals with diameters <106 µm was used for the identification of SIP. The scale bar applies to all panels.
The identified SIP regions were further classified into three SIP classes – namely, low SIP regions (SIPlow), moderate SIP regions (SIPmod), and high SIP regions (SIPhigh) – using the number concentration of pristine ice crystals with diameters <106 µm (ICNCpr<106 µm) as follows:
-
SIPlow: 0.3 L L−1,
-
SIPmod: 1 L L−1,
-
SIPhigh: ICNC L−1.
In addition, SIPall represents the three SIP classes combined, and SIPno refers to ICNC L−1, with 0.3 L−1 being the lower limit of detection of HOLIMO for measurements averaged over 30 s. This means that if no small pristine ice crystals are measured, the actual ICNCpr<106 µm is below 0.3 L−1 but not necessarily 0 L−1. This signifies that all the ICNCpr<106 µm smaller than 0.3 L−1 are not taken into account in the analysis of SIP in this study. Note that the contribution from primary ice nucleation in the remote Arctic region around Ny-Ålesund is expected to be lower than this 0.3 L−1 at temperatures above −20 ∘C (e.g., Tobo et al., 2020; Rinaldi et al., 2021; Li et al., 2022).
To ensure that the measurements were conducted in-cloud, only regions where the relative humidity with respect to ice derived from the interpolated radiosonde measurements is higher than 95 % or where the liquid water content measured by HOLIMO was larger than 0.005 g m−3 are taken into account. Both criteria are used disjointedly, because in some cases, the cloud may only be saturated with respect to ice, and in other cases, the relative humidity measured by the radiosonde closest in time may not capture local areas of saturation.
2.4 Determination of INP concentrations
The INPC derived from the DRINCZ measurements on the ground is used to estimate the INPC at the cloud top (INPCCT) and at the HoloBalloon measurement altitude (INPCHB). As the INPC is a function of the nucleation temperature (increasing exponentially with decreasing temperature), we use the temperatures at the cloud top and at the measurement location of HoloBalloon to estimate INPCCT and INPCHB. These temperatures are derived from the linearly interpolated radiosonde temperature profiles together with the highest cloud top altitude retrieved by the cloud radar on each day and the measurement altitude of HoloBalloon (see Sect. A2 in the Appendix for details). INPCCT represents the cloud's highest INPC estimate, as the lowest cloud temperatures are generally found at cloud top. INPCCT is therefore representative of the maximum ICNC that could have formed via primary nucleation from INPs. INPCHB is representative of the ICNC that could have formed by primary nucleation on INPs at the measurement location and can be directly compared to ICNCpr<106 µm, because the method employed assumes that the ice crystals smaller 106 µm have formed close to HoloBalloon's location.
Uncertainties arise from using INP measurements taken at the surface to estimate the in cloud INPC. For well-mixed boundary layers, in which the aerosol particle concentrations are constant between the surface and cloud base, the INPC at the ground and in the cloud should be comparable (neglecting INP depletion by scavenging and INP entrainment at cloud top). However, in decoupled cloud cases, when a shear layer and/or a large potential temperature increase is observed below the cloud base, the INPC in the cloud could be different than the one observed at the ground. In the cases presented in this study, the layers from cloud base to the surface were generally well-mixed, and no strong decoupling case was observed (Fig. A1). In addition, Pasquier et al. (2022a) compared the INPC measured at the observatory container at sea level on 12 November 2019 and the INPC averaged over several days at the mountaintop Zeppelin Observatory located 2 km southwestward at 475 m a.s.l. (Fig. 1b) and found that the INPC were in agreement within a factor of 5 at the two locations despite the different measurement methods and time averages used.
3.1 Overview of the 6 d with MPCs
The microphysical properties of the MPCs were identified with HOLIMO on five consecutive days, from 8 to 12 November 2019, and on 1 April 2020. The total cloud droplet number concentrations (CDNC) measured by HOLIMO reached up to 30 cm−3, and supercooled large droplets (SLDs) (defined here as having diameters larger than 64 µm) were observed during four measurement flights (Fig. 3d). This CDNC is considerably lower than for comparable continental clouds, which typically have CDNCs of up to 1000 cm−3 (Lohmann et al., 2016), but it is representative of the pristine Arctic environment, where limited CCN availability results in low CDNCs, as discussed in, e.g., Lance et al. (2011) and Koike et al. (2019). Generally, ICNCpr<106 µm is orders of magnitude larger than INPCHB, and ICNC is orders of magnitude larger than INPCCT, except on 10 November 2019 (Fig. 3e). This indicates that primary ice nucleation via INPs cannot be solely responsible for the observed ICNC and suggests that SIP processes contributed to the ICNC.
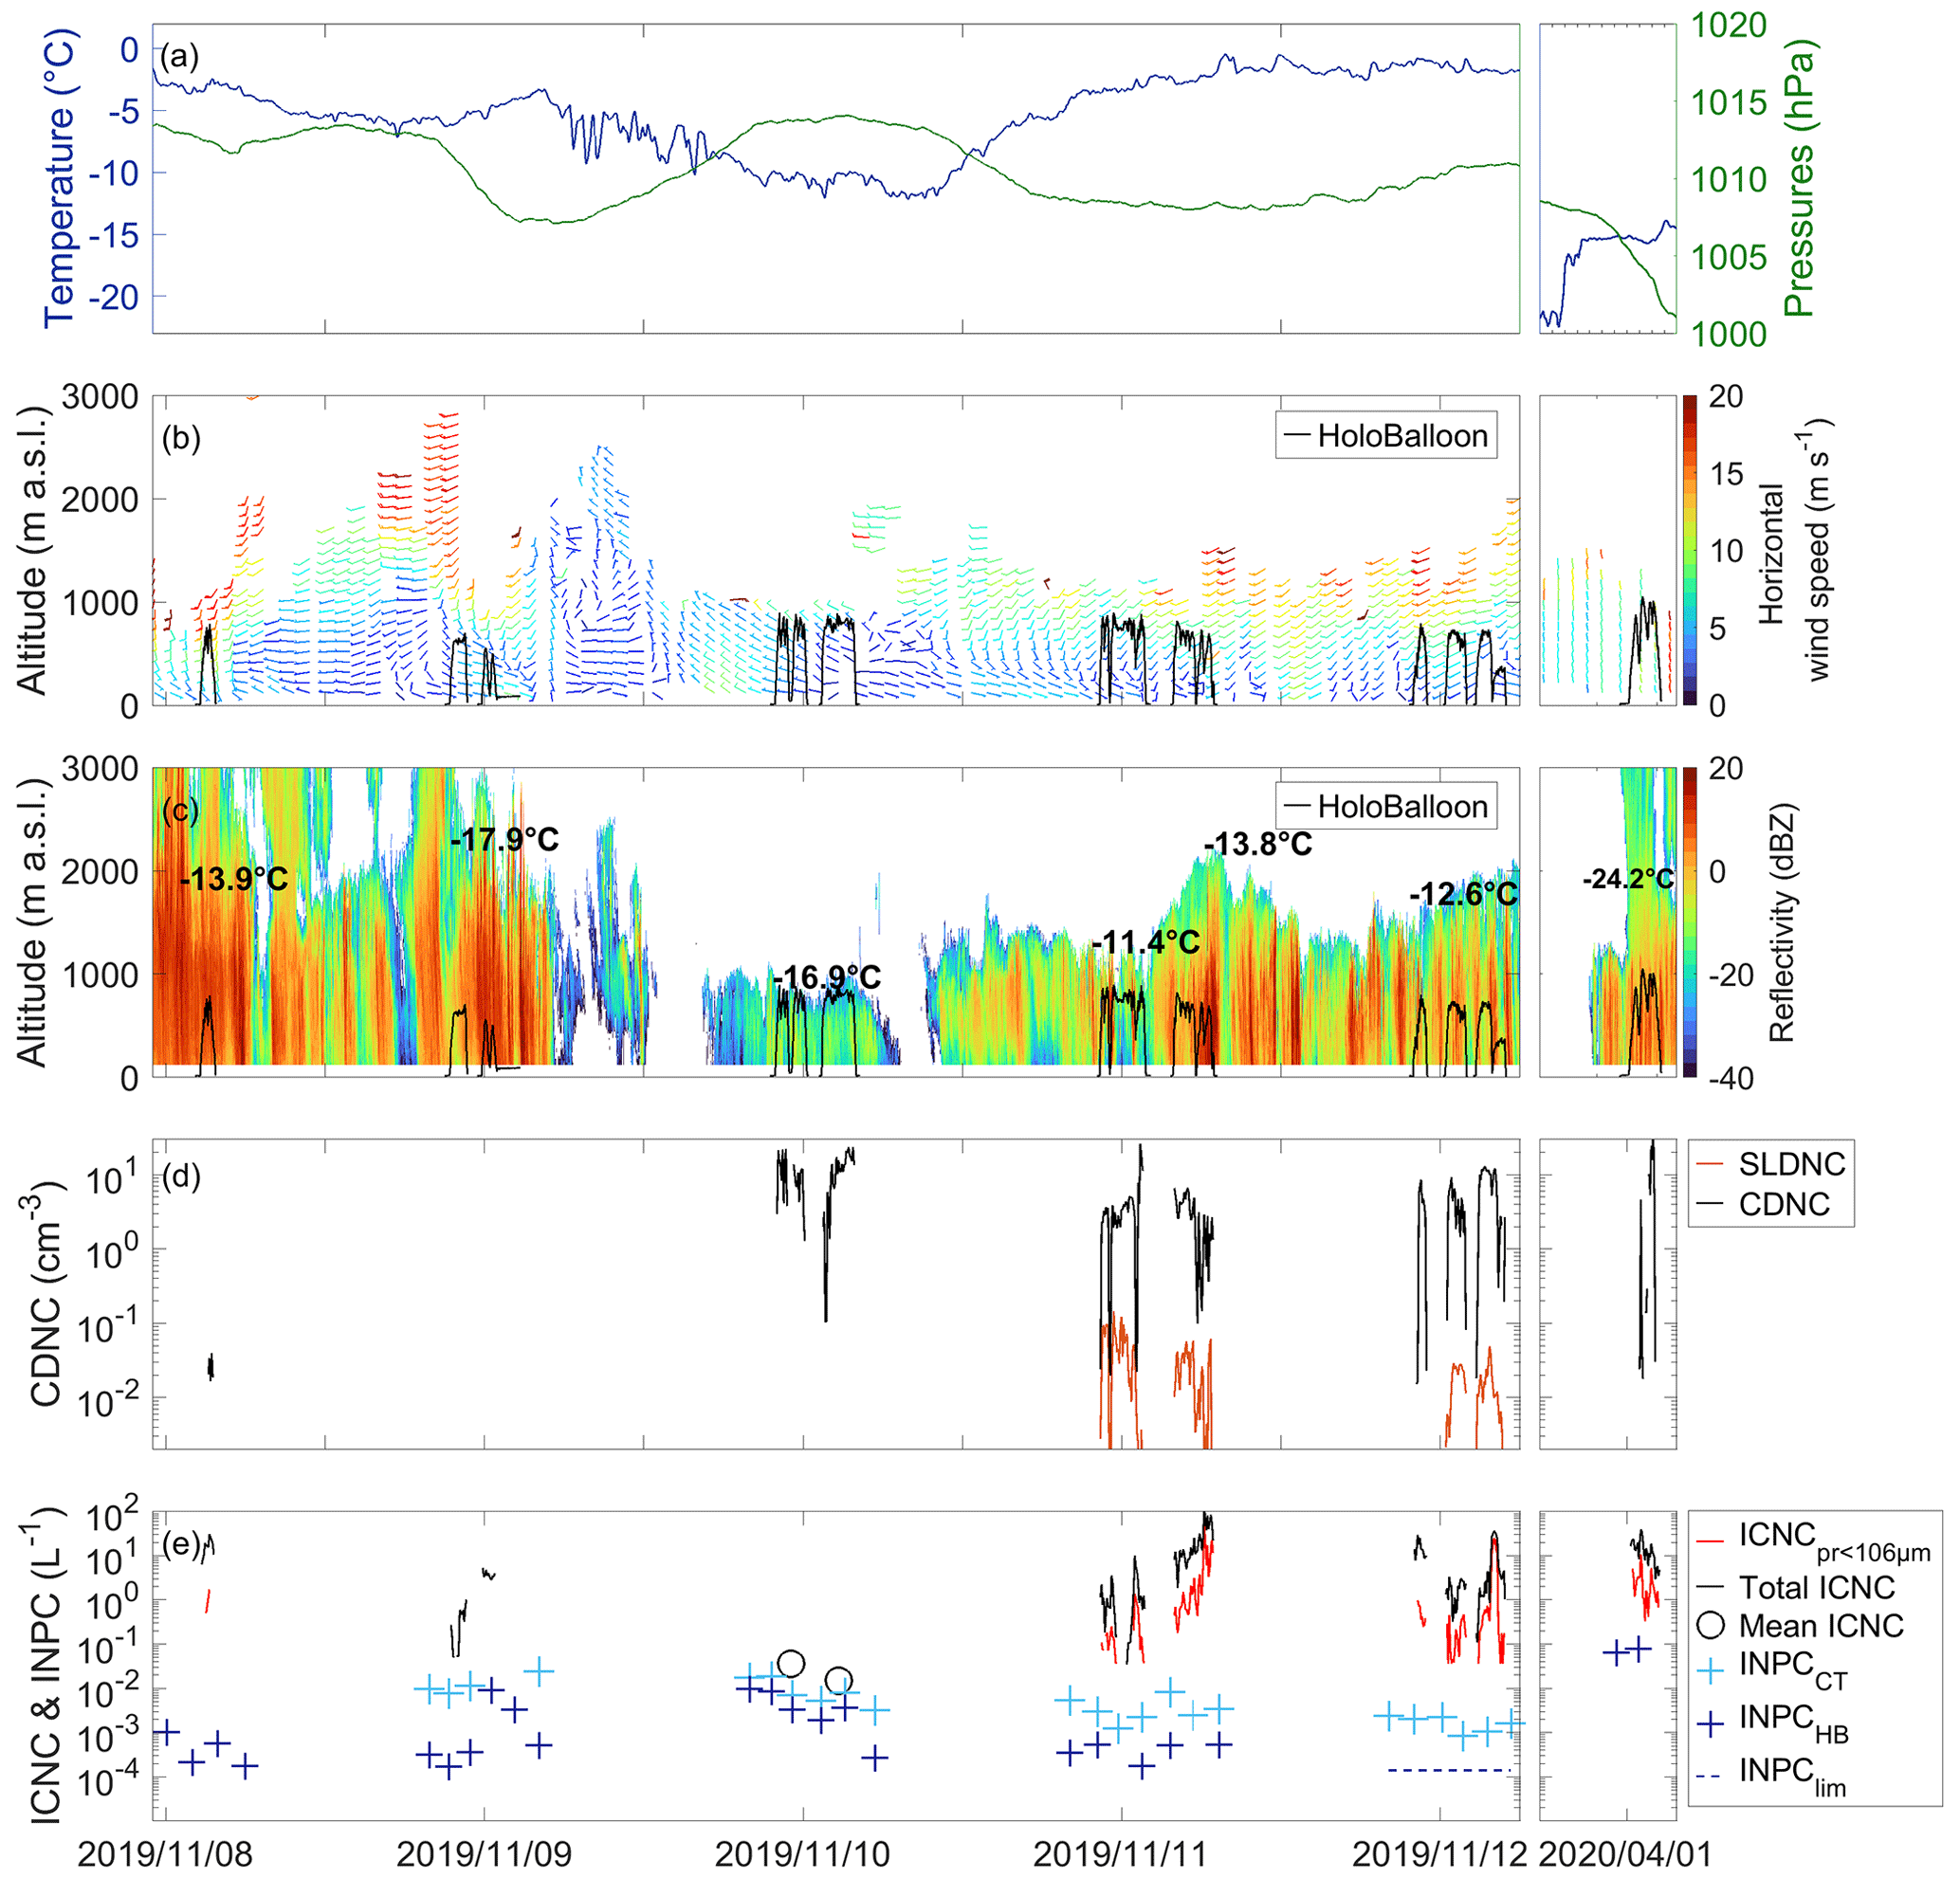
Figure 3(a) Ambient temperature (blue line) and pressure (green line) measured from the weather mast two meters above ground at the AWIPEV Observatory. (b) Horizontal wind speed measured with the wind lidar averaged over 1 h (wind barbs) and HoloBalloon measurement height (black line). (c) Cloud radar reflectivity (color), HoloBalloon measurement height (black line), and cloud top temperatures from radiosonde launches measured during the 6 d measurement period. On 8 November 2019 and 1 April 2020, the temperature is shown at an altitude of 1800 m a.s.l., because the cloud top is higher than 3000 m a.s.l. (d) Total CDNC (black) and SLD number concentration (SLDNC) (orange) averaged over 5 min. The uncertainty in the concentration of cloud droplets and SLDs is estimated to be ±6 %. (e) Total ICNC (black line) and ICNCpr<106 µm (red line) averaged over 5 min, INPCCT (light blue crosses), and INPCHB (dark blue crosses). For 10 November 2019, the ICNCs averaged over each flight are shown with black circles, because the ICNC are too low to display a time series. On 12 November 2019, the INPCHB were below the limit of detection of the INP instrumentation; therefore, the limit of detection ( L−1) is displayed instead (INPClim, dark blue dashed line). The uncertainty for the concentration of ice particles smaller than 100 µm is estimated to be ±15 % and ±5 % for ice crystals larger than 100 µm. The uncertainty for the INPC amounts to a factor of 2. On 8 November 2019 and 1 April 2020, no INPCCT can be provided, as the cloud top temperatures were below the observable nucleation temperatures of our INP instrumentation. All data are shown from 11:00 UTC on 8 November to 18:00 UTC on 12 November 2019 and on 1 April 2020 from 05:00 to 16:00 UTC. Note that the ticks are at 12:00 UTC for each day.
On 8 November 2019, an occluded front moved over Ny-Ålesund, producing strong southwesterly large-scale winds (up to 20 m s−1 at 2000 m a.s.l.) and about 12 mm of accumulated precipitation (not shown). As the front passed, the low-level cloud field was overrun by a deep cloud layer that extended to cloud top temperatures below −38 ∘C at an altitude of 5000 m a.s.l. At these temperatures, any cloud droplet would freeze independently of INPs via homogeneous freezing. On 9 November 2019, the sea-level pressure dropped by about 7 hPa, and the surface wind speed increased from 2 to 8 m s−1 as another low pressure system passed over Ny-Ålesund (Fig. 3a and b). During the flights performed on 8 and 9 November 2019, HoloBalloon measured mostly in subsaturated regions below cloud, where the cloud droplets and ice crystals were evaporating and sublimating, respectively, as also indicated by the relative humidity below 100 % below ∼700 m observed by the radiosondes (Fig. 4). Evidence of ice crystal sublimation can been deduced from the rounded edges of the ice crystals and the thin filaments connecting parts of the crystals to their main body (Fig. 5a). It is evident that such ice crystals could easily break up into two or more particles, depending on their original shape, thereby creating secondary ice crystals. However, unless these fragments were reintroduced into regions with ice (super)saturation by updrafts, they would sublimate completely.
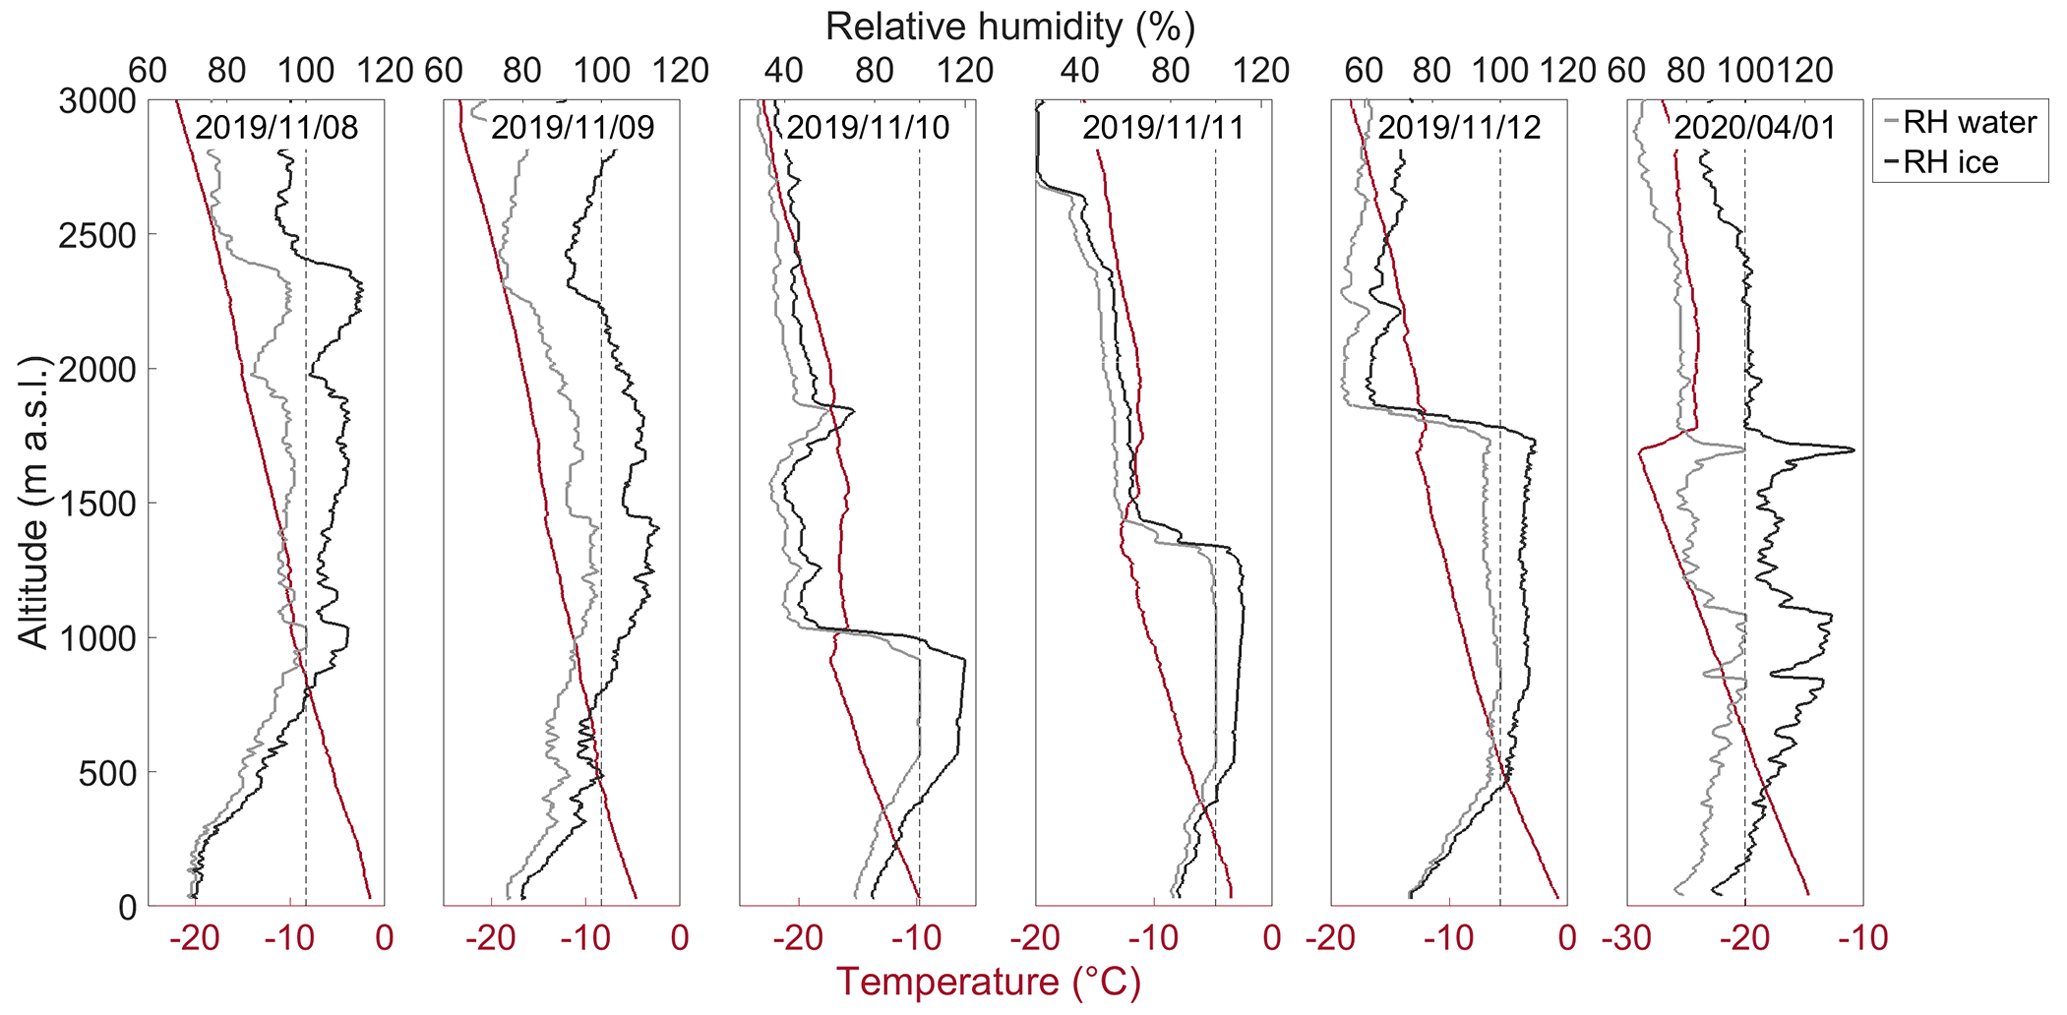
Figure 4Temperature (red) and relative humidity (RH) with respect to water (bright gray) and ice (dark gray), as measured by the radiosonde launched at 11:00 UTC on 8 to 12 November 2019 and at 17:00 UTC on 1 April 2020. The 100 % RH line is shown with the broken black vertical line.
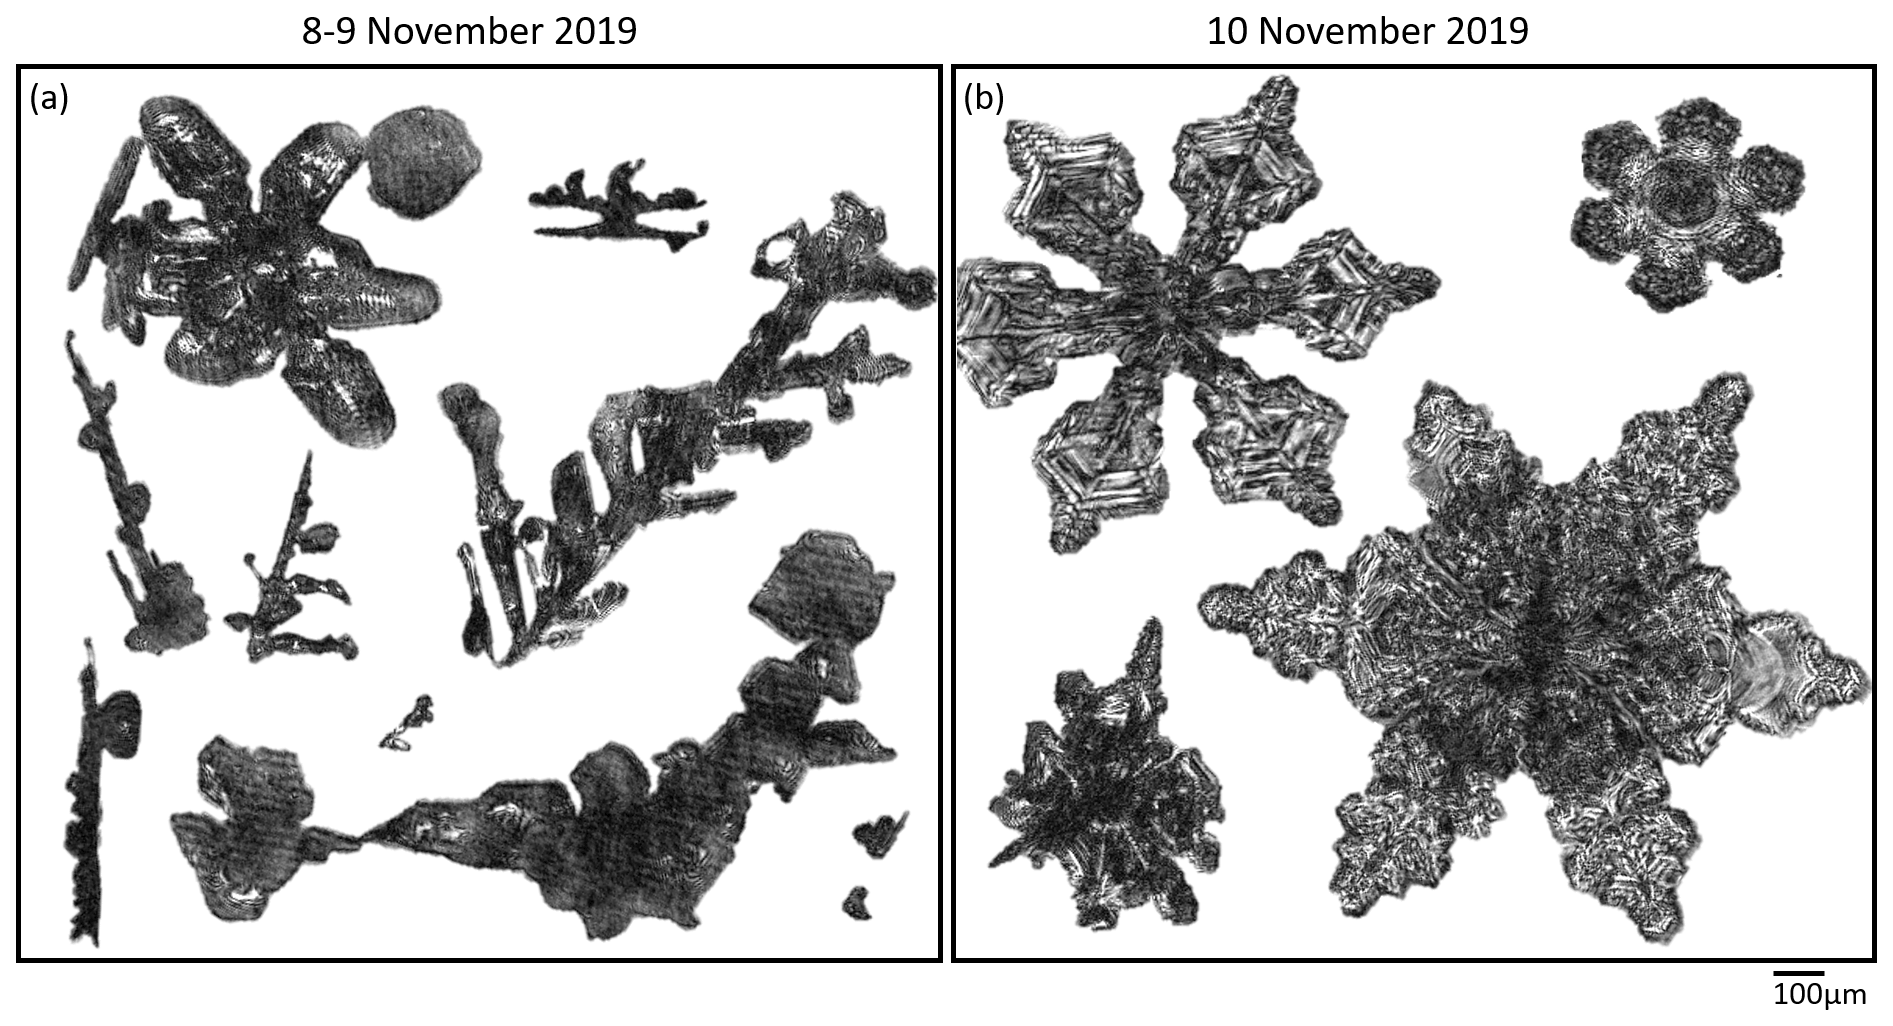
Figure 5Representative examples of ice crystals observed with HOLIMO during the flights on (a) 8 and 9 November 2019 and (b) 10 November 2019. The scale bar applies to both panels.
On 8 and 9 November 2019, updrafts estimated from the remote sensing observation at the HoloBalloon location (see Appendix A3 for the methods) reached up to 2.5 and 1 m s−1, respectively. These moderate updrafts could have lifted some fragments back into ice supersaturated regions, where they could have grown again and increased the ICNC. Otherwise, if the ice crystals sublimated completely, the remaining INPs could have re-entered the cloud and formed new ice crystals (e.g., Solomon et al., 2015; Possner et al., 2017; Fu et al., 2019). Although this could act as a pathway to enhance ICNCs, the resulting ice formation mechanism would be primary ice crystal nucleation and not SIP.
After the low pressure system moved eastward of Ny-Ålesund on 10 November 2019, the flow became northwesterly and advected cold air towards Ny-Ålesund. This cold, northwesterly flow pushed under the warmer air that was present in the fjord valley before and, in this way, acted like a cold front, lifting the air and causing the formation of a shallow and very lightly precipitating stratocumulus cloud deck. Consistently, the temperature at the surface dropped from approximately −3 to −10 ∘C within a few hours (Fig. 3a). Two measurement flights were conducted on 10 November 2019, and HoloBalloon was able to penetrate through the cloud deck with a cloud top temperature of −17 ∘C (Figs. 3c and 4). The CDNCs measured by HOLIMO were about 20–30 cm−3 (Fig. 3d). The dynamics were weak within this cloud, as the horizontal and vertical wind speeds did not exceed 5 m s−1 (Fig. 3b) and 1 m s−1, respectively. A few dendrite-like ice crystals were measured by HOLIMO during both flights (Fig. 5b), and the ICNC averaged over the two entire flight periods amounted to L−1 (Fig. 3e). No pristine ice crystals smaller than 106 µm were measured, and the mean ICNC fell within the daily variability of the INPCCT observed (Fig. 3e). Thus, we conclude that the ice crystals formed by primary nucleation on INPs and that no SIP process substantially increased the ICNCs on this day. Therefore, the INP availability determined the ice crystal formation. This shows the ability of INPs to control ice crystal formation in remote pristine areas like the Arctic in the case of shallow clouds and weak dynamics.
On 11 and 12 November 2019, the weather in Ny-Ålesund was influenced by the passage of a warm front embedded with several precipitation showers. In these 2 d, the MPC evolved from a SIPlow state with ICNCpr<106 µm below 1 L−1 to a SIPhigh state with ICNCpr<106 µm greater than 50 L−1. As this is about 5 orders of magnitude higher than the estimated INPCHB, we propose that SIP mechanisms were responsible for the sudden increase in ICNCpr<106 µm, and we examine the contribution from the likely active SIP processes in detail in Sect. 3.2.
On 1 April 2020, a warm front passed over Ny-Ålesund and produced a cirrus cloud at 7000 m. This cirrus layer deepened to an altostratus deck and acted as a seeder cloud that precipitated into the low-level mixed-phase feeder cloud below, thereby enhancing the ICNC in the low-level MPC measured by HoloBalloon. However, the INPCHB was up to 1 to 2 orders of magnitude smaller than the ICNCpr<106 µm, which indicates that some SIP processes were likely active in the low-level MPC. The microphysical properties of the low-level mixed-phase feeder cloud are discussed in Sect. 3.3.
3.2 High SIP event on 11 November 2019
On 11 November 2019, a precipitating low-level MPC was observed, with a cloud base around 700 m a.s.l. and cloud top rising from about 1000 to 2200 m a.s.l. (Fig. 6a). The surface temperature increased from −3.1 to −0.3 ∘C between 11:00 and 20:00 UTC (Fig. 3a), whereas the cloud top temperature decreased from −11 to −13.5 ∘C as the cloud top height increased. The cloud radar observed regions of enhanced reflectivity, indicative of the presence of large ice crystals (Fig. 6a). Two flights into the MPC were performed at 10:15–13:40 and 15:50–19:00 UTC with HoloBalloon (Fig. 6a). The measured cloud droplet size distribution peaked at around 50 µm, and SLDs were observed, except during a short period between 13:15 and 13:45 UTC when the CDNC spectra peaked at smaller sizes (Fig. 6b).
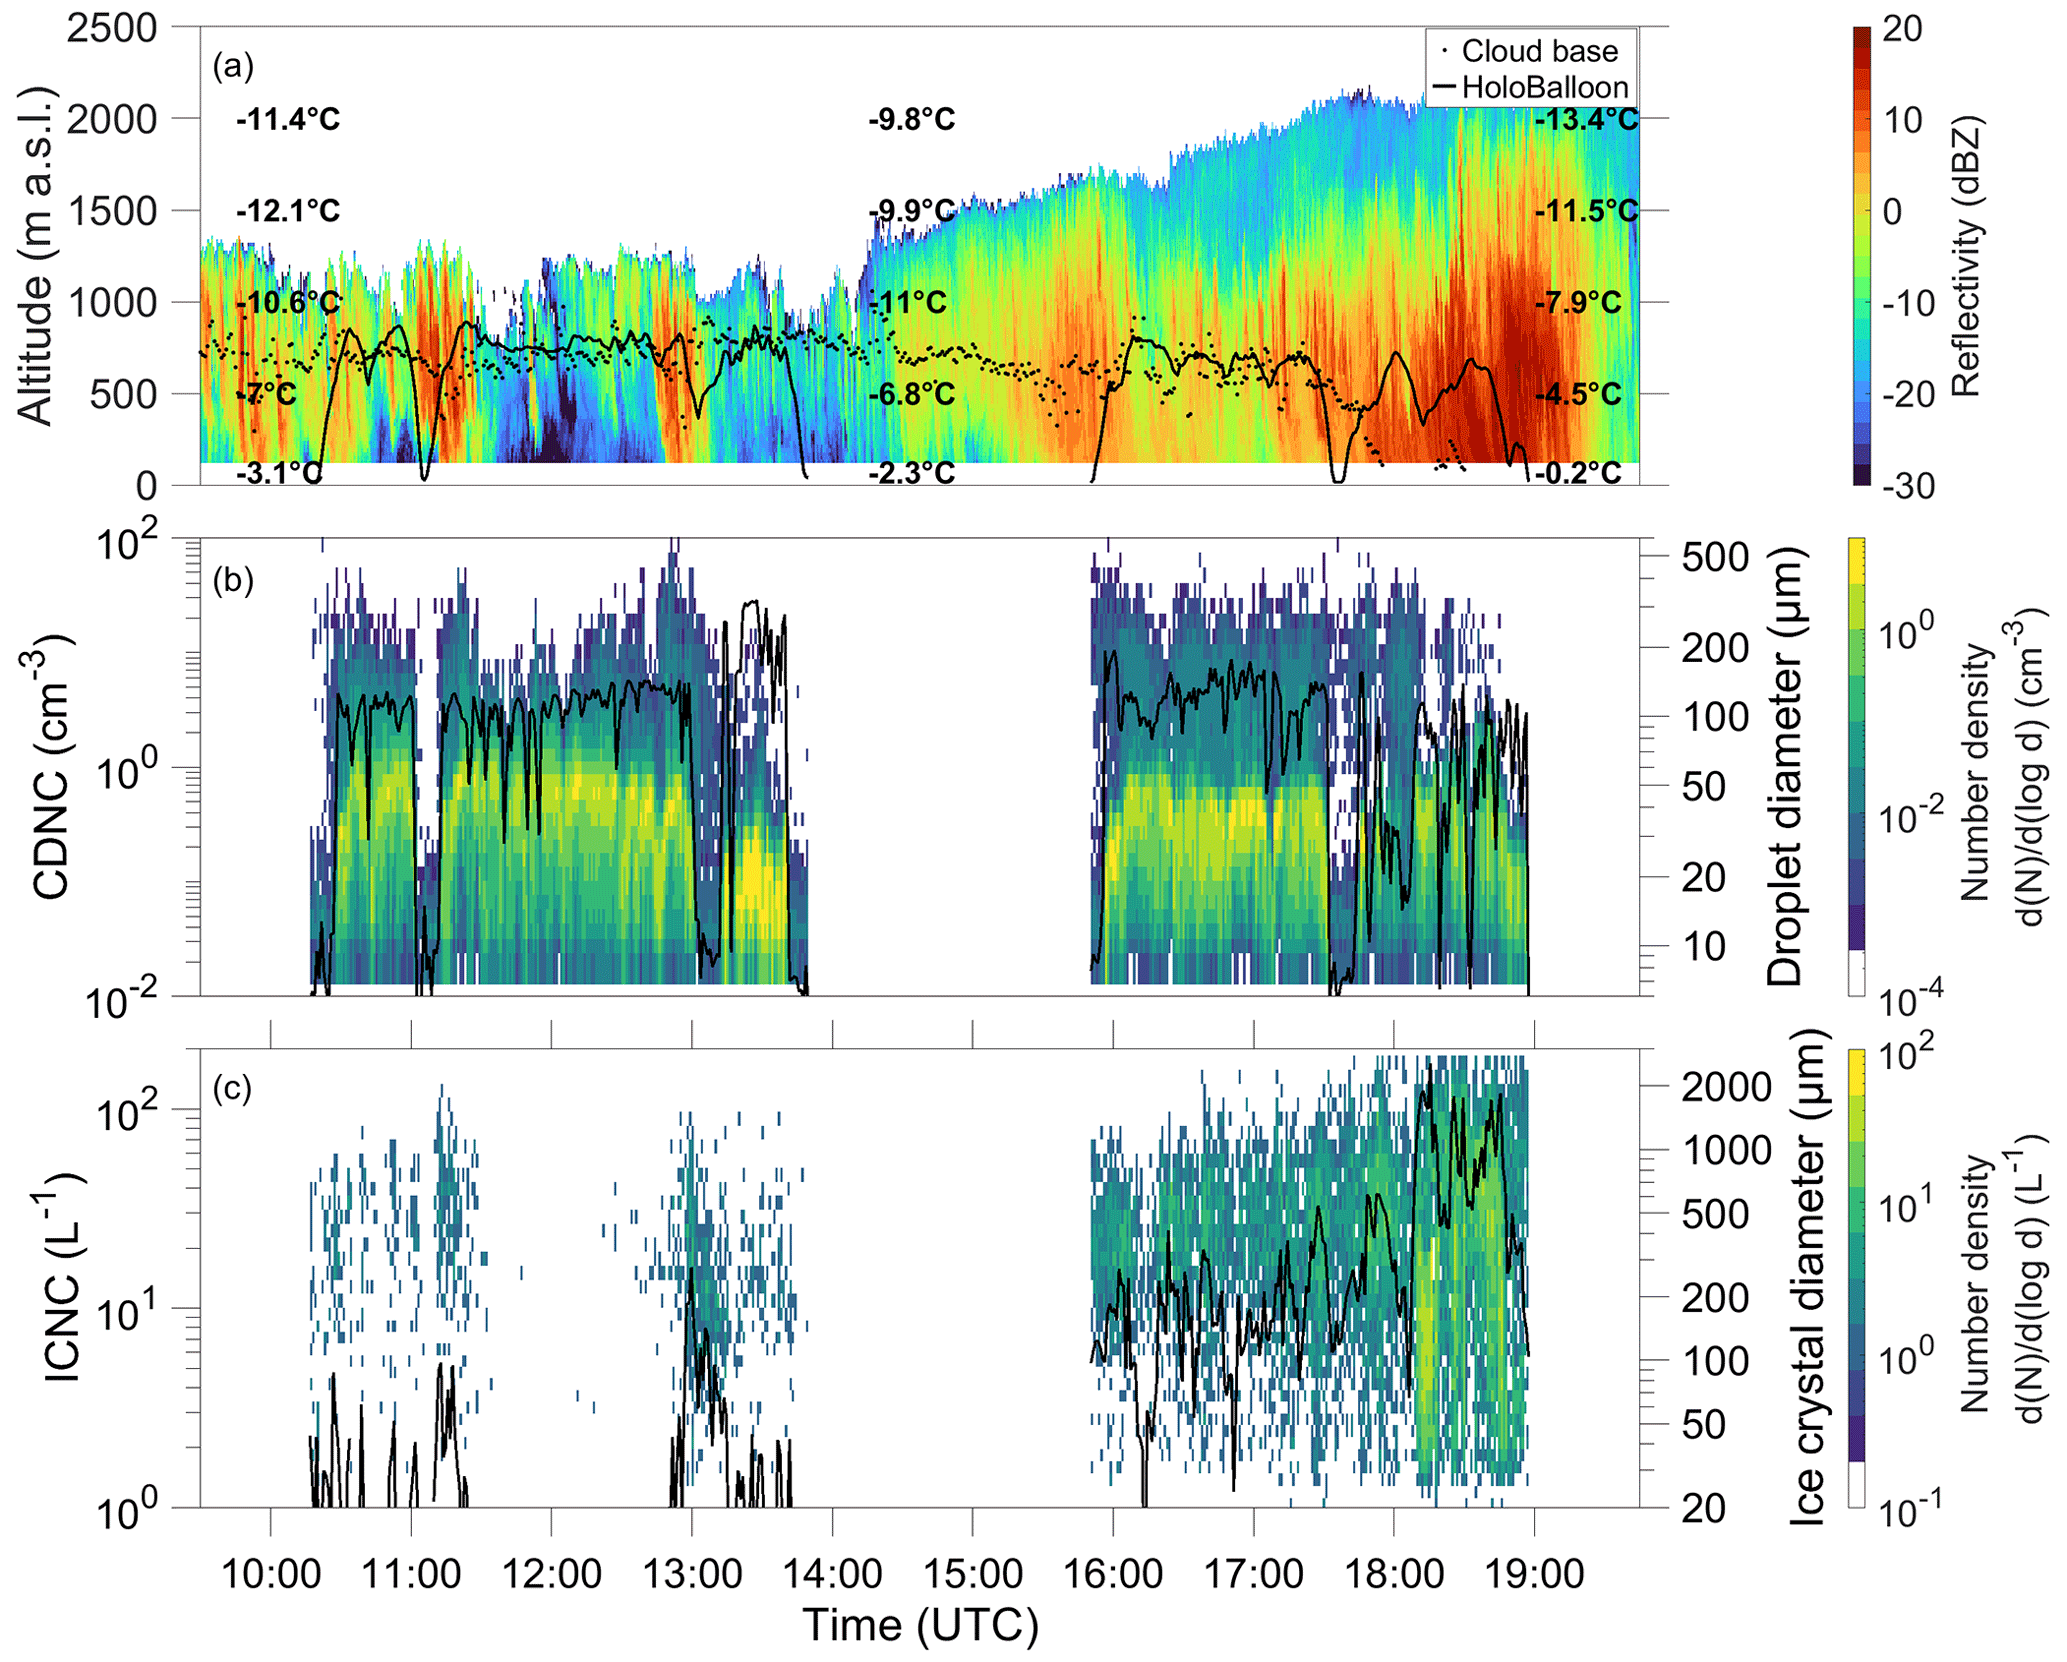
Figure 6Overview of the cloud properties on 11 November 2019. (a) Cloud radar reflectivity (color), HoloBalloon measurement height (black line), cloud base height measured by the ceilometer (black dots), and temperatures at the corresponding altitudes measured by the radiosonde at 11:00, 14:00, and 20:00 UTC. Note that the lowering of the cloud base to the surface detected by the ceilometer after 17:30 UTC is caused by precipitation. (b) Cloud droplet size distributions (color shading) and total CDNC (black line). The uncertainty in the concentration of cloud droplets and SLDs is estimated to be ±6 %. (c) Ice crystal size distributions (color shading) and total ICNC (black line) measured by HOLIMO, averaged over 1 min. The uncertainty for the concentrations of ice particles smaller than 106 µm is estimated to be ±15 %, and for the concentrations of larger ice crystals, it is estimated to be ±5 %.
The measured cloud evolved from low total ICNC ranging between 0.3 and 11 L−1 and ICNCpr<106 µm below 1 L−1 during the first flight (10:15–13:40 UTC), to a region with total ICNC ranging mostly between 5 and 30 L−1 and ICNCpr<106 µm between 1–3 L−1 (contributing about 3 %–30 % to the total ICNC) (15:50–18:10 UTC), and finally to a region with ICNC up to 150 L−1, out of which up to 90 L−1 (60 %) were ICNCpr<106 µm (18:10–18:45 UTC) (Figs. 6c and 7b and c). This last period (18:10–18:45 UTC) is marked by several peaks in ICNC above 100 L−1 and ICNCpr<106 µm above 10 L−1 (Figs. 6c and 7b). On this day, the INPCCT varied between and L−1, and the INPCHB varied between and L−1 (Fig. 3e), thus being 4 to 5 orders of magnitude lower than the ICNC and ICNCpr<106 µm. No increase in INPC is observed during the course of the day. Hence, nucleation on INPs cannot explain the measured peaks in ICNCpr<106 µm at 18:10 UTC onwards. Therefore, we assign the increases to local SIP processes.
Locally formed ice crystals smaller than 106 µm were mostly elongated columns with a large aspect ratio between 3 and 9 (Fig. 7a). These habits are consistent with the environmental temperature (−4.5 ∘C) at their measurement location. The high aspect ratio of the columns indicates that the cloud layer had a relatively high water supersaturation (Nakaya, 1954; Libbrecht, 2005). Note that columns with a maximum length larger than 106 µm were observed (see Fig. 7a) but not accounted for in the ICNCpr<106 µm.
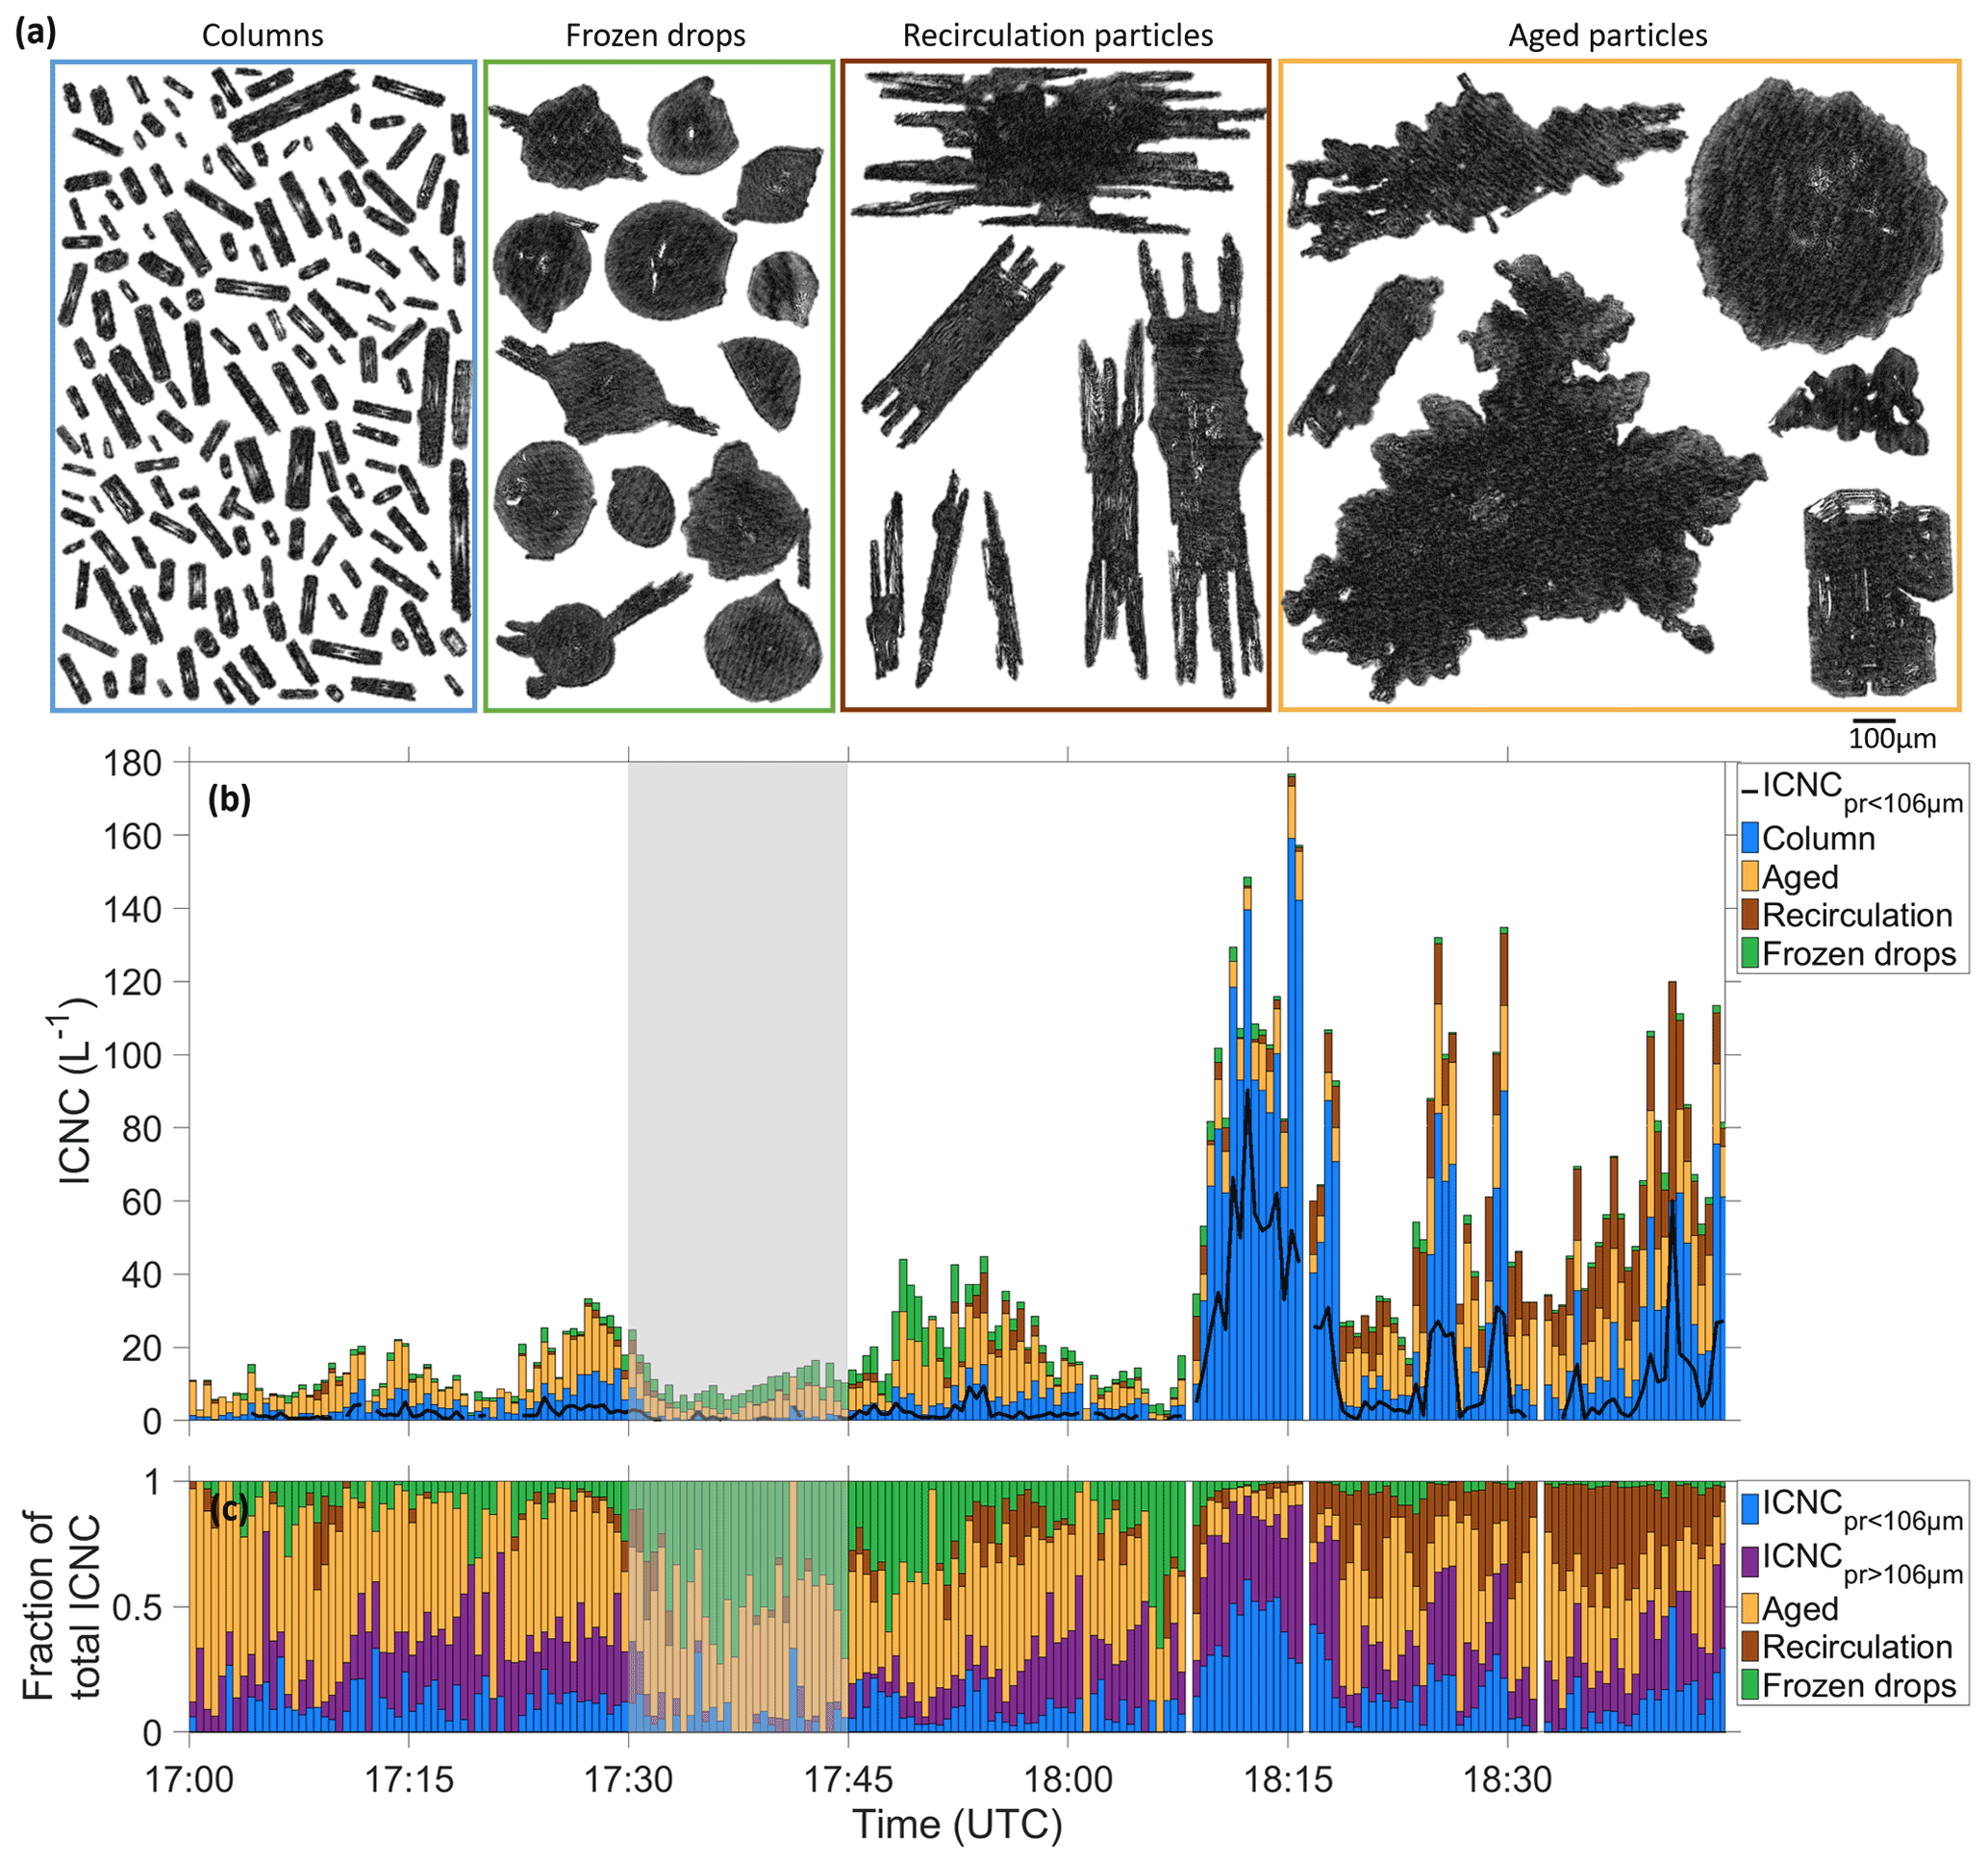
Figure 7(a) Representative examples of ice crystals classified in typical habits observed with HOLIMO between 17:00 and 19:00 UTC on 11 November 2019. The scale bar applies to all panels. (b) Concentrations of ice crystals classified into habits and ICNCpr<106 µm (black line). (c) Fraction of ICNCpr<106 µm, pristine ice crystals with diameter >106 µm (ICNCpr<106 µm), aged ice crystals, recirculation particles, and frozen drops concentrations to ICNC. The shaded area shows when HoloBalloon flew out of the cloud. The measurements are averaged over 30 s. The uncertainty for the concentrations of ice particles smaller than 106 µm is estimated to be ±15 %, and for the concentrations of larger ice crystals, it is estimated to be ±5 %.
Ice crystal habits help to understand which SIP processes contributed to the increase in ICNCpr<106 µm. Ice crystals observed before 18:00 UTC were mainly aged particles, whereas ice crystals observed during SIP periods starting from 18:10 UTC were frozen drops, recirculated particles (Fig. 7a–c), which are a mix of columnar and plate-like crystals due to the crystals growing in different temperature regimes (Korolev et al., 2020; Pasquier et al., 2022b), and aged particles. The presence of aged particles together with cloud droplets smaller than 12 µm and larger than 24 µm before 18:00 UTC suggests that the rime-splintering process could be responsible for the ICNCpr<106 µm below 3 L−1. The observation of frozen drops during SIP periods suggests that the droplet-shattering process produced splinters during the freezing of SLDs (e.g., Lauber et al., 2018; Korolev and Leisner, 2020). In particular, the ratios of frozen drops to total ICNC were especially large (0.6) at 18:05–18:10 UTC, just before the first and largest peak in ICNCpr<106 µm (Fig. 7c). Coincidentally, some observed frozen drops were identified on HOLIMO images to have accreted with small columns, suggesting that the collision of SLDs with ice crystals initiated their freezing.
A likely explanation for this first ICNCpr<106 µm peak is therefore that the droplet-shattering mechanism caused the formation of splinters, which grew to small pristine columns. Then these small columns could further collide with SLDs, thereby initiating their freezing and the formation of additional ice splinters. This could have led to a cascading SIP process via a positive feedback loop that could explain the rapid increase in ICNCpr<106 µm, as already proposed by Lawson et al. (2015). The fraction of frozen drops is lower after this peak in ICNCpr<106 µm at 18:10 UTC (Fig. 7c), and the concentration of large drops decreased after this peak as well (Fig. 6b), indicating that the SLDs froze and precipitated out of the cloud. Thus, we propose that droplet shattering contributed largely to the peak of ICNCpr<106 µm (90 L−1) at 18:10 UTC. With SLD number concentration of about 50 L−1 and a frozen drop concentration reaching up to 6 L−1, around 10 % of the SLDs seem to have frozen, thereby producing, on average, approximately 15 secondary ice crystals.
Between 18:20 and 18:55 UTC, droplet shattering likely plays a lesser role. Instead, SIP by ice–ice collision seems to dominate after recirculation particles appear in concentrations up to 10 L−1 after 18:15 UTC (Fig. 7b and c). As these particles contained fragile branches, their collision and subsequent breakup could have created additional ice crystals. The fraction of recirculation particles to the ICNC is especially large between 18:20 and 18:45 UTC. Therefore, we suggest that the ice–ice collision breakup as well as the droplet shattering contributed to the peaks in ICNCpr<106 µm observed during this period.
The temperature was in the range of the rime-splintering process; however, the CDNC was between 0.1 and 3 cm−3 between 18:10 and 18:45 UTC (Fig. 6b), and the concentration of cloud droplets smaller than 12 µm required for the rime-splintering process (Mossop, 1978, 1985) was between 0.01 and 0.2 cm−3. Thus, the probability of collision of rimed particles with droplets at these small concentrations is likely too low to have any important effect on the rime-splintering process. Earlier on this day, the aged and rimed particles were the most frequent ice crystals observed (Fig. 7c), and the CDNCs (Fig. 6b) were larger, without a significant increase of the ICNCspr<106 µm. Therefore, the rime-splintering process probably did not contribute significantly to the increase in ICNCpr<106 µm.
In conclusion, we propose that droplet shattering was mainly responsible for the high peak in ICNCpr<106 µm at 18:10–18:15 UTC and that ice–ice collisions, particularly between recirculation particles, contributed to the peaks in ICNCpr<106 µm between 18:20–18:55 UTC in combination with droplet shattering. A comparable SIPhigh event with ICNCpr<106 µm up to 55 L−1 was observed on 12 November 2019. On this day, columns having formed in higher parts of the cloud collided with SLDs during sedimentation, thereby initiating their freezing and splinter production via the droplet-shattering mechanism, as described in Pasquier et al. (2022a).
3.3 Seeder–feeder event on 1 April 2020
On 1 April 2020, a warm front passed over Ny-Ålesund and caused an observed temperature increase of 7 ∘C in less than 2 h, a pressure drop from 1009 to 994 hPa, a wind direction change from southeasterly to northwesterly, and an increase in wind speed at the surface (Fig. 3a and b). Warm air overrunning produced a thickening cirrus cloud, which initially formed at 7000 m and then continued to deepen into an altostratus cloud (Fig. 8a). The temperature above ∼4500 m a.s.l. was below −38 ∘C, and thus, the ice crystals formed by homogeneous and/or heterogeneous nucleation in the cirrus–altostratus cloud. The radar reflectivity signal indicates that ice crystals were sedimenting to about 3000 m a.s.l., where a region of lower reflectivity suggests their partial sublimation (Fig. 8a). This is in agreement with the relative humidity with respect to ice below 100 % measured by the radiosonde above 2500 m a.s.l. (Fig. 4). A low-level cloud formed at around 09:00 UTC, with cloud top height rising from 1000 to 1500 m a.s.l. during the day. This cloud was characterized by regions of higher reflectivity, indicating the presence of larger ice crystals. Additionally, an increase in reflectivity was visible between 1500 and 2000 m a.s.l. from 12:00 to 14:00 UTC, which shows that the layer was saturated with respect to ice, allowing the ice particles to grow, and suggests the presence of an embedded supercooled liquid layer. This layer could also be seen in the cloud base measured by the ceilometer when the signal was not attenuated by precipitation.
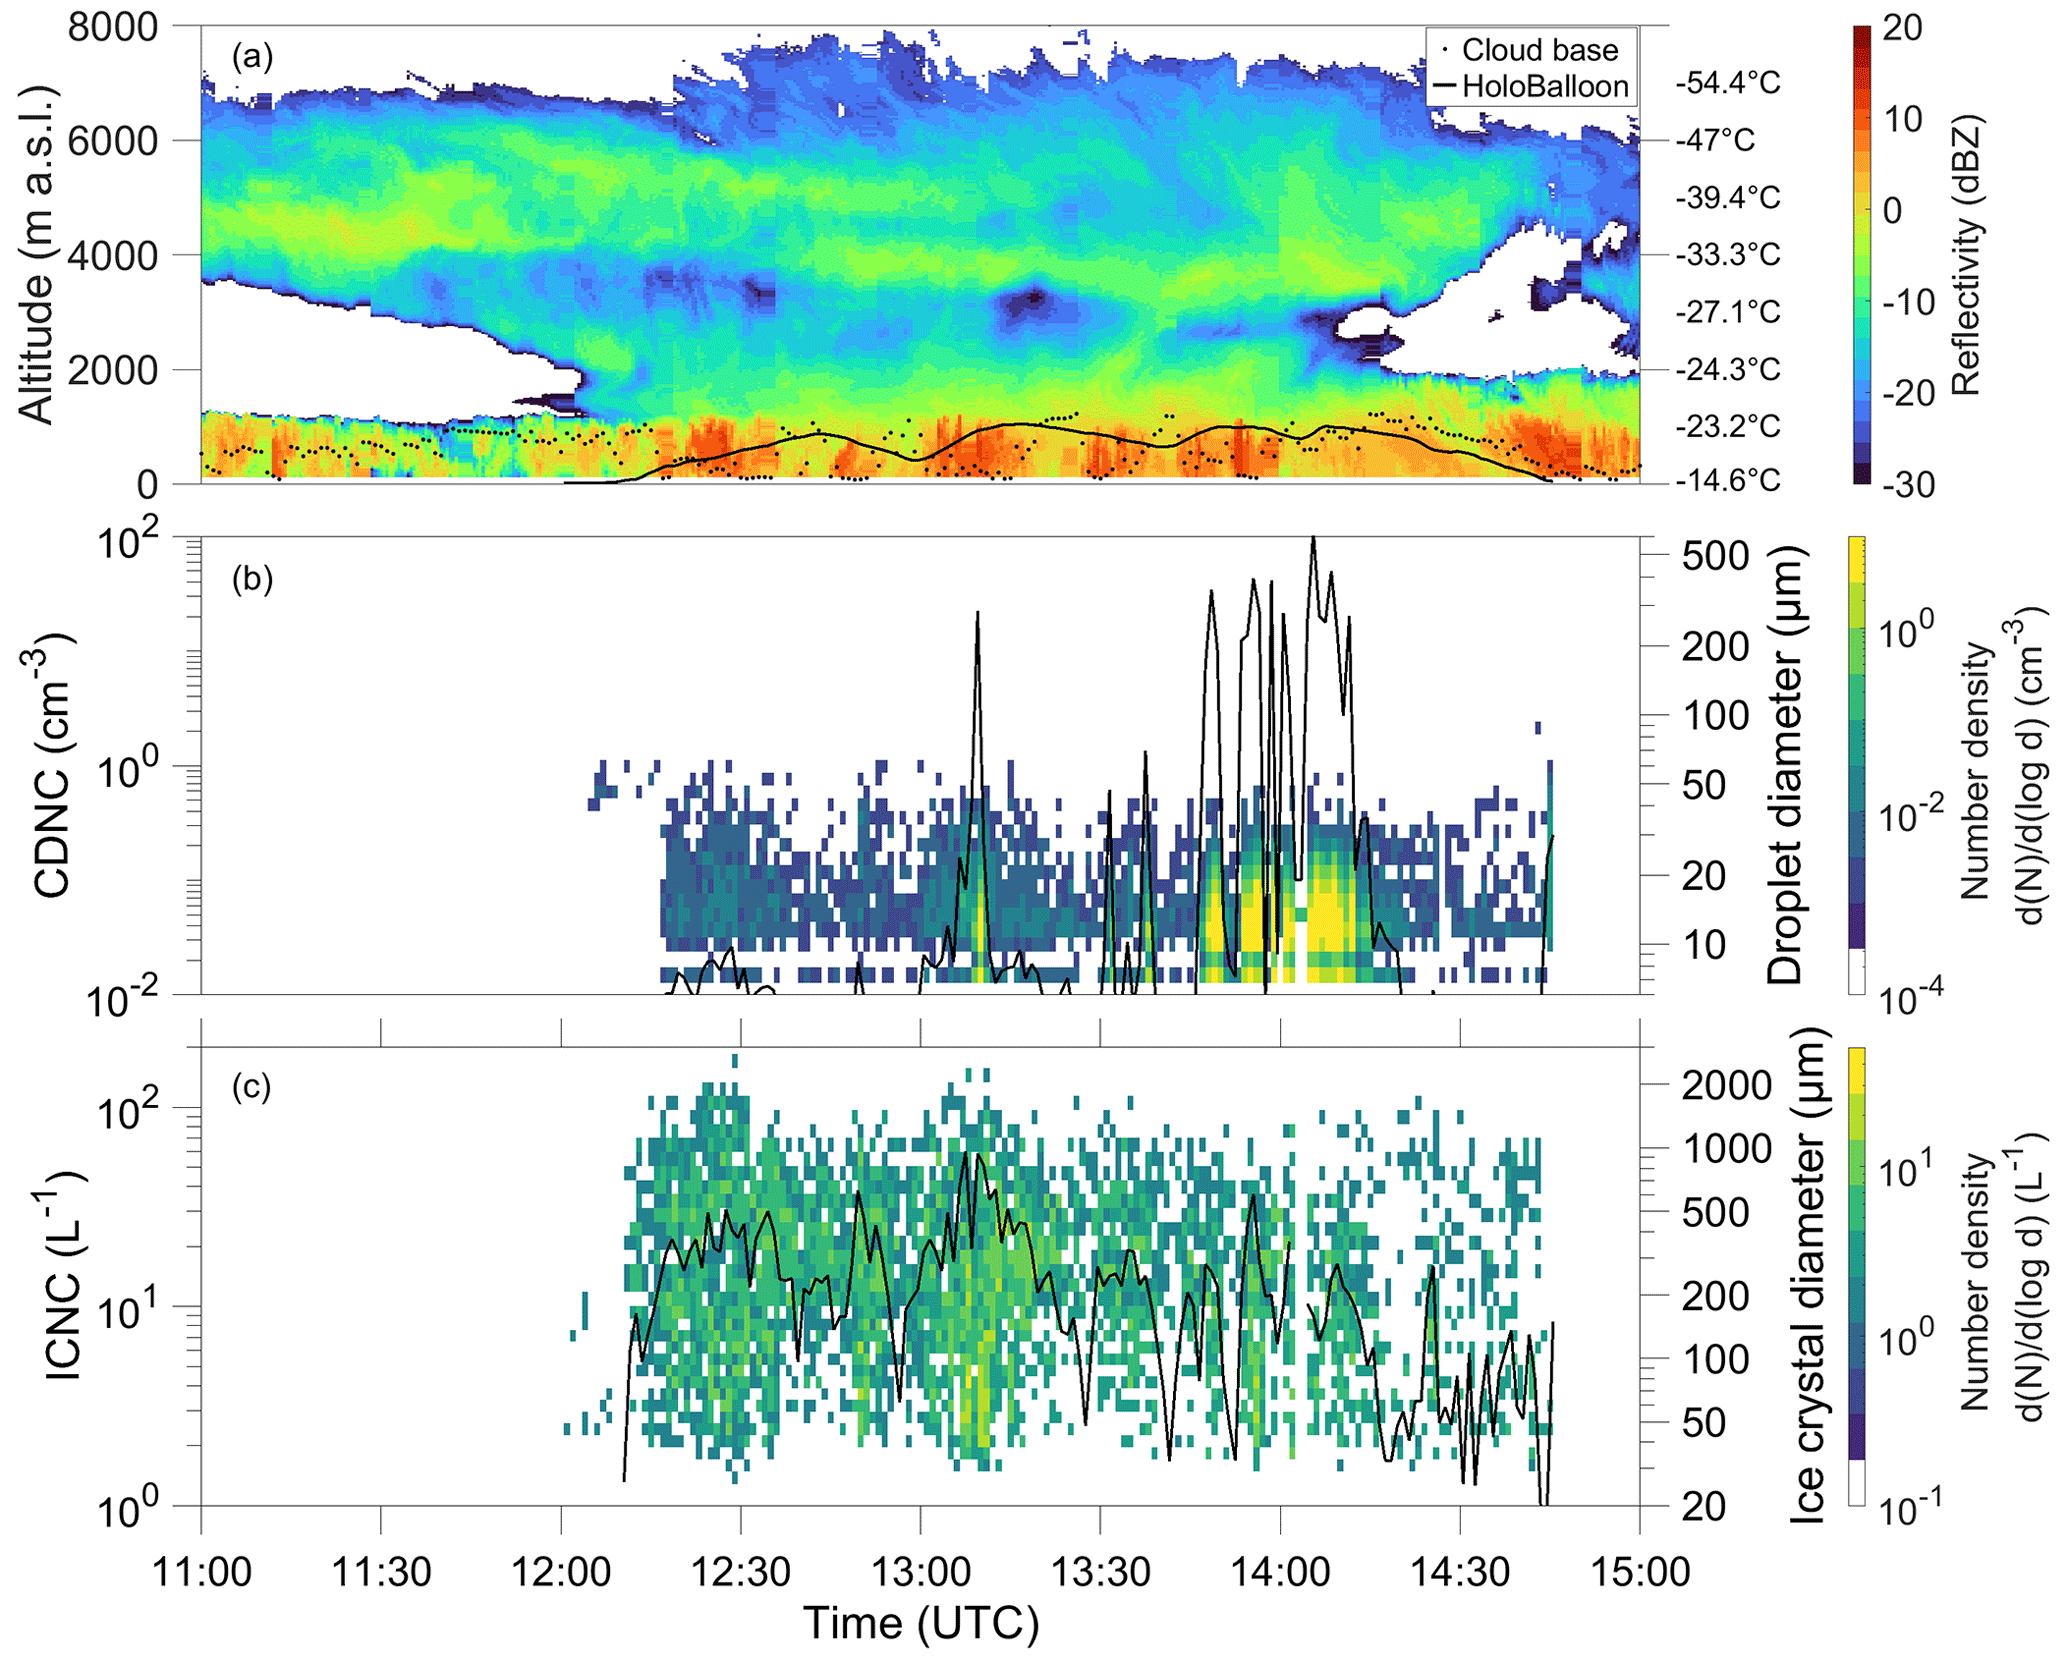
Figure 8Overview of the cloud properties on 1 April 2020. (a) Cloud radar reflectivity (color), HoloBalloon measurement height (black line), cloud base height measured by the ceilometer (black dots), and temperatures at the corresponding altitudes measured by the radiosounding at 17:00 UTC. (b) Cloud droplet size distributions (color shading) and total CDNC (black line). The uncertainty in the concentration of cloud droplets and SLDs is estimated to be ±6 %. (c) Ice crystal size distributions (color shading) and total ICNC (black line) measured by HOLIMO, averaged over 1 min. The uncertainty for the concentrations of ice particles smaller than 106 µm is estimated to be ±15 %, and for the concentrations of larger ice crystals, it is estimated to be ±5 %.
The CDNCs measured by HOLIMO only reached concentrations higher than 10 cm−3 at 13:10 UTC and between 13:45 and 14:15 UTC (Fig. 8b). These higher CDNCs (>10 cm−3) are observed when HoloBalloon was in the transition region from low to high radar reflectivity (i.e., in the embedded supercooled liquid layer). It suggests that, in this region, water saturation was sustained and promoted the formation and growth of cloud droplets, while below, in the regions with low CDNCs, the environment was subsaturated with respect to water, and the cloud droplets were evaporating.
In the low-level cloud, the ICNC amounted up to 78 L−1 because of the contribution from crystals sedimenting from the seeder cloud (Fig. 8). The ice crystal habits were composed of pristine plates and columns together with aged particles (Fig. 9a). The large, aged ice crystals likely originated from the seeder cloud aloft and experienced collisions with cloud particles during their sedimentation. In contrast, the small columns and plates observed (Fig. 9a) must have formed close to the measurement location due to their small size and pristine nature. At temperatures below −22 ∘C, as experienced above 600 m, supersaturation relative to ice determines whether ice crystals grow to plates or columns (Nakaya, 1954). The columns therefore originated from regions with higher supersaturation (likely in the embedded supercooled liquid layer) and plates from regions of lower supersaturation with respect to ice. Indeed, peaks in the concentrations of columns at 13:10 and 14:00 UTC (Fig. 9b) coincide with the increases in CDNC (Fig. 8b).

Figure 9(a) Representative examples of ice crystals classified into typical habits, observed with HOLIMO on 1 April 2020. Ice crystals with indications of broken features are highlighted with brown frames. The scale bar is representative for both panels. (b) The concentration of the ice crystals by habit and ICNCpr<106 µm (black line) between 12:15 and 14:00 UTC (bottom) on 1 April 2020 are shown. The measurements are averaged over 30 s. The uncertainty for the concentrations of ice particles smaller than 100 µm is estimated to be ±15 %, and for the concentrations of larger ice crystals, it is estimated to be ±5 %.
As the INPCHB ( L−1) was 2 to 3 orders of magnitude lower than the ICNCpr<106 µm (25 L−1) (Fig. 3c), SIP processes were active. Again, we use the ice crystal habits together with the environmental conditions prevailing in this cloud to evaluate the likely SIP processes contributing to ICNCpr<106 µm. Rimed particles were observed, and the concentration of small droplets may have been sufficient in some regions of the low-level cloud (13:10 and 13:45–14:15 UTC) to trigger the rime-splintering mechanism. However, the observed temperature (−24 to −18 ∘C) was far below the temperature range of rime splintering (−8 to −3 ∘C). Furthermore, no large droplets necessary for the droplet-shattering process were observed. Therefore, the rime-splintering and the droplet-shattering processes are unlikely to have played a significant role as SIP mechanisms in the observed cloud. On the contrary, some ice crystals contained underdeveloped corners (highlighted by the black frames in Fig. 9a), which could be a result of recent ice–ice collisions. As the ICNCs were large (up to 78 L−1), collisions between ice crystals likely occurred. In addition, ice–ice collisions are believed to be most efficient at colder temperatures (Takahashi et al., 1995), such as those observed on this day. Therefore, we deduce that the ice–ice collisions were the most likely active SIP mechanism in the low-level feeder cloud. We propose that the large ice crystals sedimenting from the seeder cloud grew rapidly at lower altitudes in the ice-supersaturated regions. They could create secondary ice particles by colliding with other ice crystals in the low-level feeder cloud. This hypothesis is in agreement with the recent study by Georgakaki et al. (2022), which associates the occurrence of the ice–ice collision mechanism with the occurrence of precipitating seeder–feeder events.
During the 6 d of observations performed with HoloBalloon during the NASCENT campaign, 2253 measurements of 30 s intervals were taken in-cloud, corresponding to a total of 18.7 h and a volume of 5150 L. Out of these measurements, SIPall (representing all measurements with ICNC L−1) was present during 39 % of the measurements. When dividing by the intensity of the SIP, SIPlow, SIPmod, and SIPhigh occurred 18.4 %, 16.6 %, and 4 % of the time, respectively (Fig. 10).

Figure 10Frequency of occurrence of SIPno (ICNCpr<106 µm <0.3 L−1), SIPlow (0.3 L ICNC L−1), SIPmod (1 L ICNC L−1), and SIPhigh (10 L ICNCpr<106 µm). The numbers refer to the number of 30 s intervals observed within each SIP class.
As described in Sect. 1, several environmental conditions (e.g., cloud droplet concentration and size, ice crystal size and habit, and temperature) influence the occurrence of SIP. Using the assumption that pristine ice crystals smaller than 106 µm are associated with their environment of origin, we can relate SIP to the environmental conditions prevailing at the measurement location. The role of the different hydrometeor types and temperatures for the occurrence of SIP observed over the 6 d of measurements in MPCs is discussed below.
4.1 Role of the hydrometeor types for SIP
The comparison between ICNCpr<106 µm representative of SIP and the concentrations of cloud droplets (diameter <64 µm), SLDs (diameter >64 µm), frozen drops, and ice crystals helps to understand their relationship to SIP. The analysis of the influence of ice crystals on SIP is delicate, because it is possible that the larger ice crystals are secondary ice crystals having grown to larger sizes than the threshold used (106 µm). To overcome this issue, we discuss only the connection between SIP and ice crystals larger than 327 µm and refer to these as snow crystals.
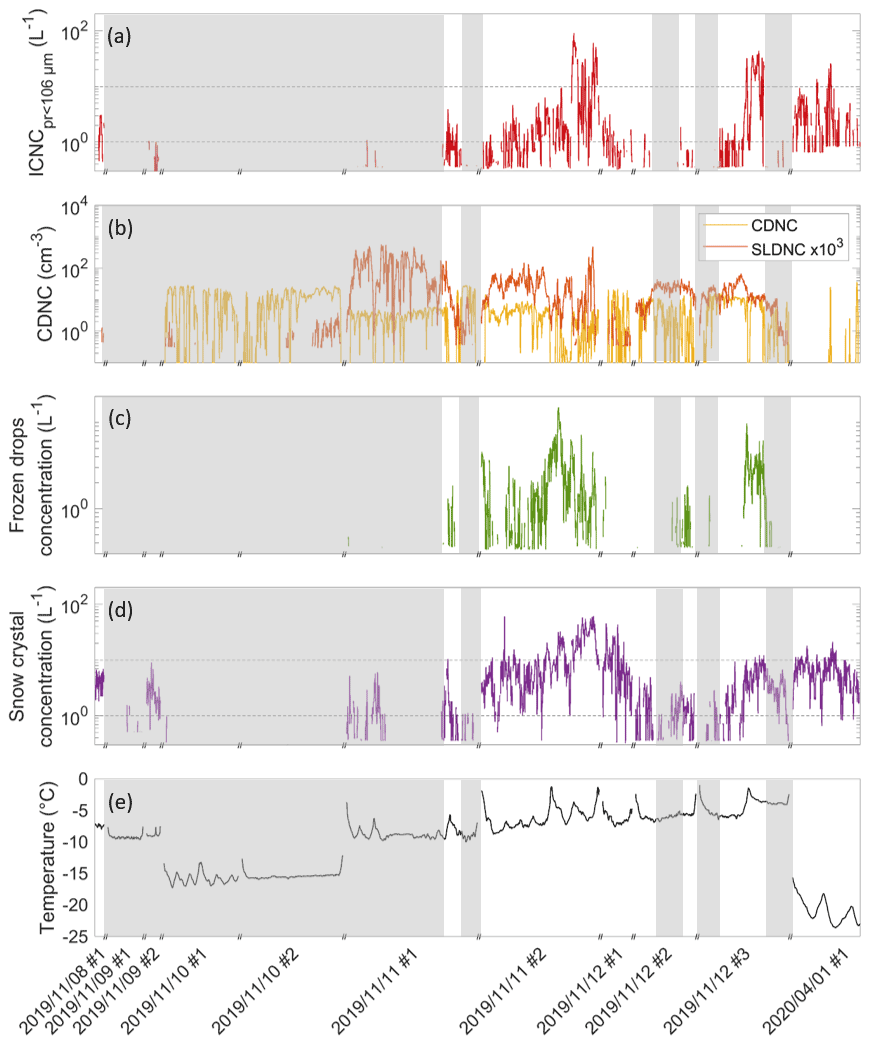
Figure 11(a) ICNCpr<106 µm, (b) CDNC and SLD number concentrations (SLDNC), (c) frozen drop number concentrations, and (d) snow crystals number concentrations retrieved with HOLIMO, averaged over 30 s. The uncertainty for the concentration of cloud droplets is estimated to be ±6 %; for the concentration of ice particles smaller than 100 µm, it is estimated to be ±15 %; and for the concentration of snow crystals and frozen drops, it is estimated to be ±5 %. (e) Temperature derived from the radiosondes at the HoloBalloon location. The breaks on the time axis separate measurement flights. The black dashed lines in panels (a) and (d) denote the SIPmod (1 L−1) and SIPhigh (10 L−1) limits. The white regions show the occurrence of SIP, whereas the gray shaded regions show no SIP.
Snow crystals seem to follow the same trend as ICNCpr<106 µm (Fig. 11a and d), and the correlation coefficient between the concentrations of snow crystals and ICNCpr<106 µm amounts to 0.4. This demonstrates the obvious connection between snow crystals and SIP – i.e., primary ice is needed in order for SIP to be initiated. In contrast, no obvious connection between ICNCpr<106 µm and cloud droplets was observed (correlation coefficient of 0.01). Indeed, the highest CDNCs prevailed on 10 November 2019, when no evidence for SIP was observed, and the CDNCs were mostly below 5 cm−3 during the prevalence of SIPmod and SIPhigh events on 11 and 12 November 2019 (Fig. 11a and b). However, SLDs were always observed during SIP occurrence, except on 1 April 2020, when only snow crystals were observed (Fig. 11a, b, and d). This suggests that, on 1 April 2020, the presence of snow crystals alone was sufficient for the occurrence of SIP, likely via the ice–ice collision process, as discussed in Sect. 3.3. During the first flight on 11 November 2019, the highest SLD number concentrations (up to 20 L−1) were measured, but no SIP was observed. The reason is likely that there were not enough snow crystals colliding with the SLDs, thereby not initiating their freezing, causing a lack of SIP via the droplet-shattering process. In fact, no frozen drops were observed on this day. This indicates that freezing of SLD via immersion or contact freezing with an INP is not sufficient to trigger droplet shattering at the temperature experienced (−8 to −2 ∘C) and that the presence of snow crystals is needed to initiate their freezing. Indeed, frozen drops are observed during 41.7 % of SIPall and 83.5 % of the SIPhigh events (Table 1).
Table 1Frequency of occurrence and OEF of the following hydrometeor types: cloud droplets (with concentrations larger than 5 cm−3), SLDs, frozen drops, and snow crystals during all measurements (Nall), SIPall, SIPlow, SIPmod, and SIPhigh. Bold font signifies OEF values larger than 1, i.e., enhancements.
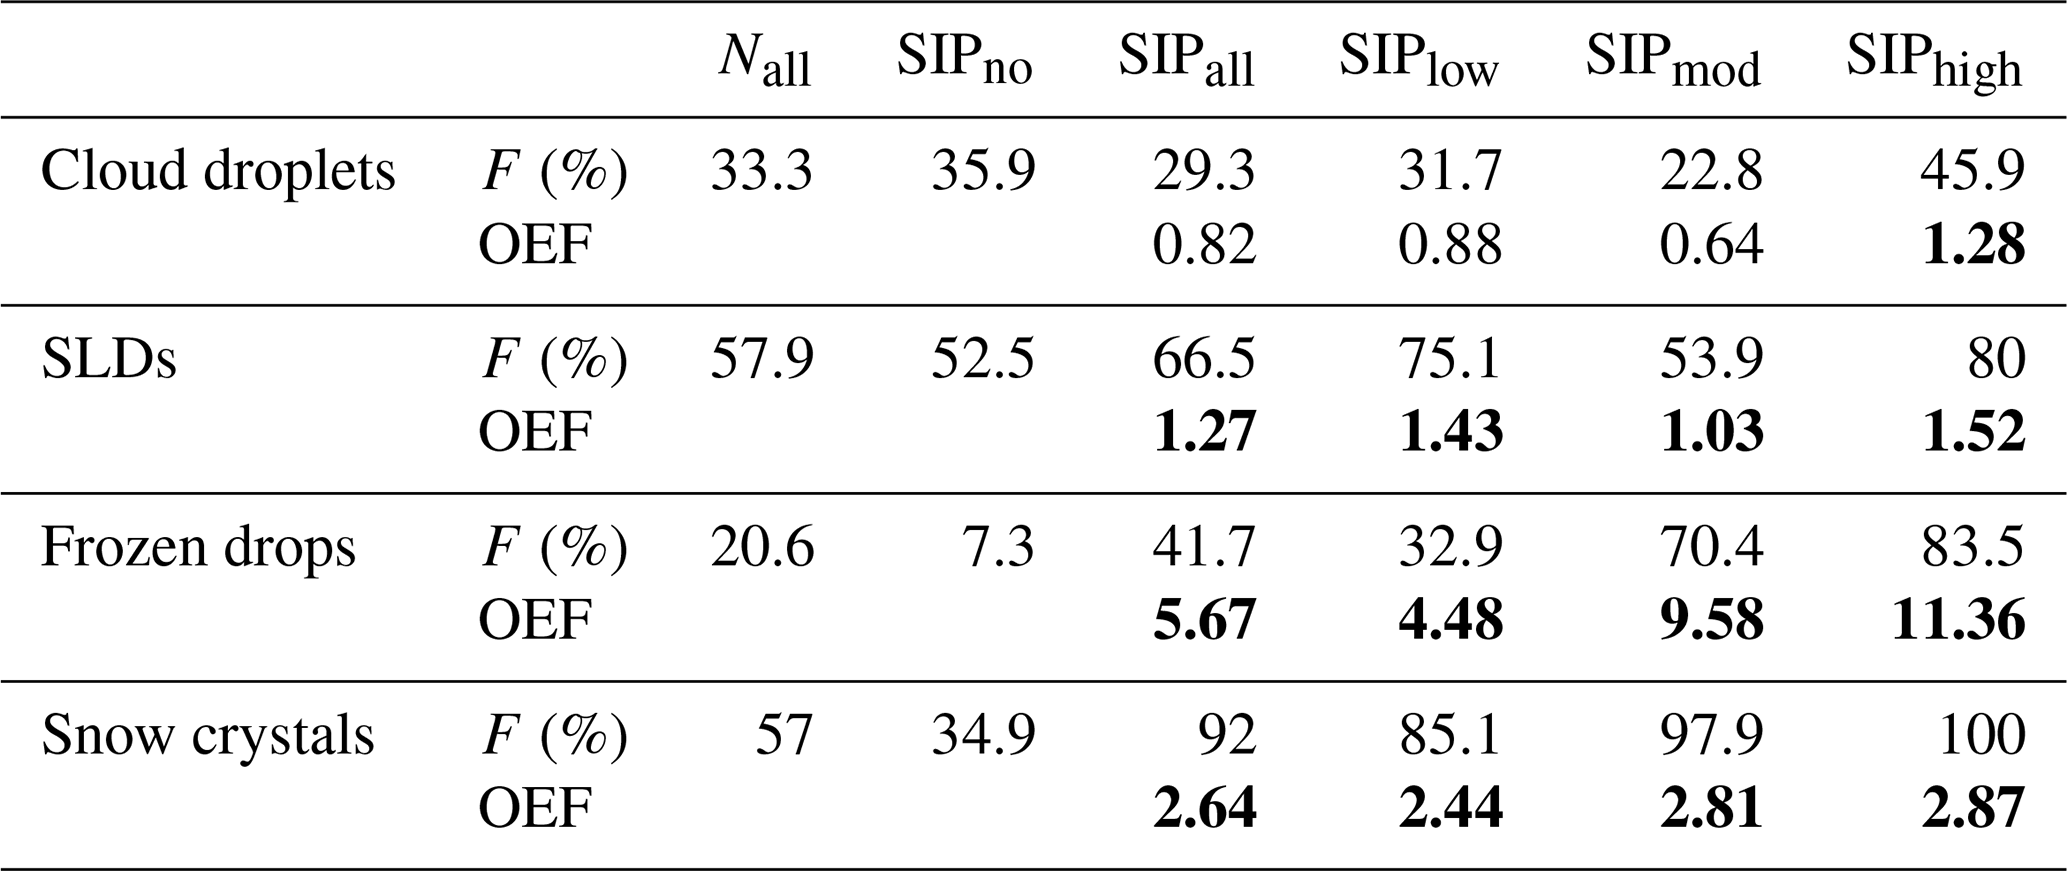
To quantify the importance of different hydrometeor types for SIP, we calculate an occurrence enhancement factor (OEF) relative to SIPno for all the SIP classes and for the following hydrometeor types: cloud droplets, SLDs, frozen drops, and snow crystals. First, the frequency of occurrence of a hydrometeor type during each SIP class () and the frequency of occurrence of a hydrometeor type when no SIP is observed () were calculated. Then, the OEF for every hydrometeor type and SIP class (OEF) was derived as follows:
An OEF greater than unity signifies that the hydrometeor type is more frequently present during SIP than during SIPno and thus hints at a possible connection between the hydrometeor type and the occurrence of SIP.
During the presence of snow crystals, the frequency of occurrence of SIPall compared to SIPno is enhanced by a factor of 2.64, and SIPhigh is enhanced by a factor of 2.86 (Table 1). This further demonstrates that the production of ice crystals prior to SIP is required. The influence of a high concentration of cloud droplets on SIP was identified by using a threshold of CDNC >5 cm−3, which represents the mean CDNC over the 6 measurement days. The OEF of cloud droplets is below 1 for all SIP classes, except SIPhigh, for which it increases slightly to 1.41 (Table 1). This signifies that the occurrence of SIP is reduced compared to SIPno when the concentration of cloud droplets was higher than 5 cm−3 and indicates that concentrations of cloud droplets exceeding 5 cm−3 were not necessary for SIP occurrence in the measurements presented. In contrast, the occurrences of all SIP classes are enhanced when SLDs are present, suggesting influence by the droplet-shattering mechanism. Finally, the occurrence of SIP is enhanced by a factor between 4.5 and 11 compared to SIPno when frozen drops are observed (Table 1). This large enhancement is also consistent with the dominant role of the droplet-shattering mechanism, especially for SIPmod and SIPhigh.
Previous studies have linked the presence of SLD to the occurrence of SIP in tropical and midlatitude convective clouds (e.g., Lawson et al., 2015, 2017; Keppas et al., 2017). In convective clouds with a warm cloud base, the formation of SLDs occurs by collision–coalescence in updraft cores that extend over a large portion of the troposphere (Lawson et al., 2017). In other cases, the SLD responsible for the initiation of droplet shattering close to the melting layer were suggested to originate from melted ice crystals recirculating through the melting layer within updrafts (Korolev et al., 2020; Lauber et al., 2021). Here, we propose that the formation of large SLDs, which are related to SIP, is determined by the low CCN concentration prevailing in the clean Arctic environment together with the sufficiently high updraft speeds, as observed in cloud containing SLDs during NASCENT. A connection between SLD and ice crystal formation was already proposed by Rangno and Hobbs (2001) and Lance et al. (2011). However, they did not relate the formation of the ice crystals to SIP via the droplet-shattering mechanisms.
In summary, no connection was found between the concentration of cloud droplets exceeding 5 cm−3 and SIP. On the contrary, a strong relationship exists between SLD and SIP, with the prerequisite that sufficient snow crystals are present to initiate their freezing upon collision and to activate the droplet-shattering process. Moreover, snow crystals can be sufficient for triggering SIP via ice–ice collisions.
4.2 Temperature
During the 6 d of MPC observations, measurements covered temperatures between −24 and −1 ∘C, albeit with very few measurements between −14 and −10 ∘C (Fig. 12c and d). Between −8 and −2 ∘C, evidence of SIP was observed between 54 % and 68 % of the time (Fig. 12d). Meanwhile, at temperatures below −18 ∘C, evidence of SIP was almost always observed, with 80 % of the measurements involving SIP (Fig. 12c). However, the measurements obtained at these low temperatures originate solely from 1 April 2020 (Fig. 12c) and are related to the ice–ice collision process, as discussed in Sect. 3.3. It should also be noted that the large number of measurements without SIP at −16 ∘C occurred during the cloud case on 10 November 2019 (Fig. 12d), when ice formation was limited by the INPC, as discussed in Sect. 3.1 (see also the temperature evolution during the flights in Fig. 11e).
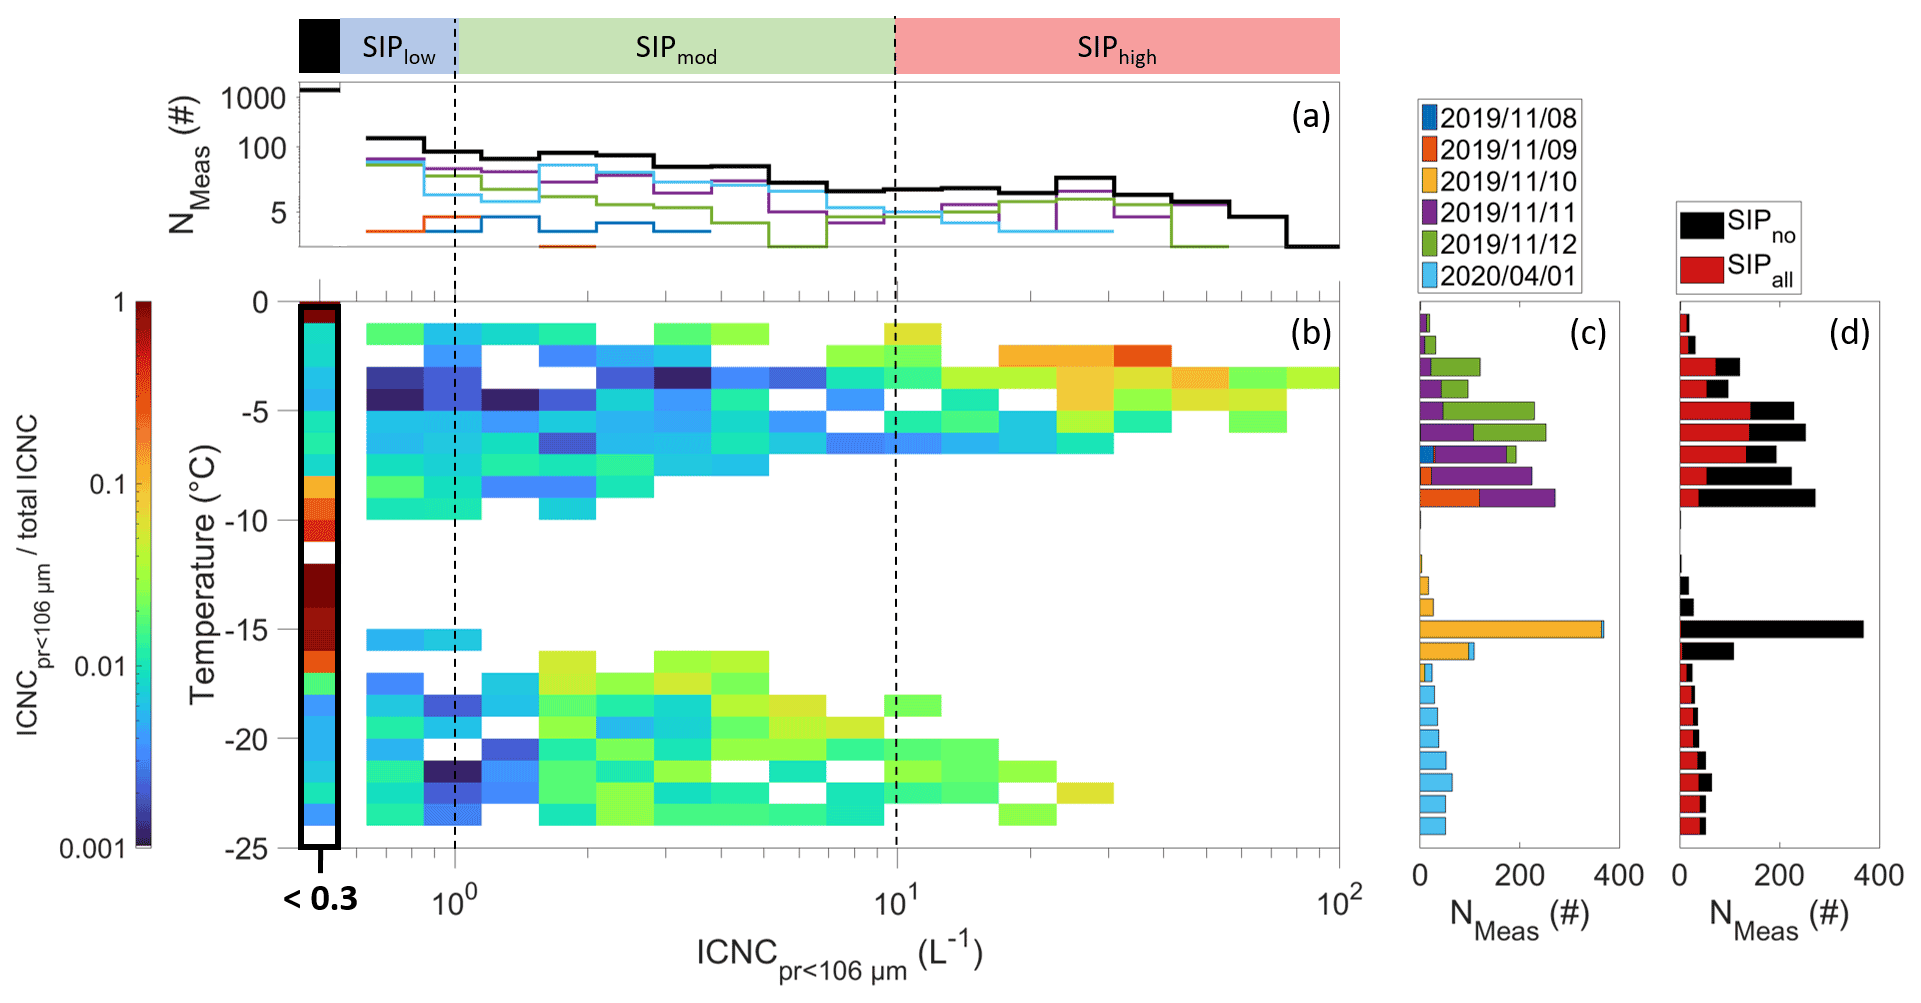
Figure 12(a) Number of measurements for each ICNCpr<106 µm bin (note the log scale) for each day of measurements (color lines) and all measurements (black line). The ICNCpr<106 µm regions – defined as SIPlow, SIPmod, and SIPhigh – are shown on top, and SIPno is represented with a black box. (b) ICNCpr<106 µm fraction from total ICNC for each temperature bin of 1 ∘C (color shading) and each ICNCpr<106 µm bin. The frequency of ICNC L−1 to ICNC (SIPno class conditions) is highlighted by the thick black frame. A concentration of 0.3 L−1 was used for the calculation of ICNCpr<106 µm to total ICNC when no ice crystal was measured in the 30 s interval. (c) Number of measurements (Nmeas) per temperature bin for each day of measurements (colored bars). The data were averaged over 30 s for the analysis. (d) Number of measurements (Nmeas) per temperature bin (1 ∘C) for measurements with SIP (red bars) and for measurements with SIPno (black bars).
In addition to the frequency of occurrence of SIP, the number of secondary ice crystals produced determines the impact of SIP. The distribution of the fraction of ICNCpr<106 µm to total ICNC as a function of temperature and ICNCpr<106 µm (Fig. 12b) gives information on the number of ice crystals produced by SIP at each temperature. The highest ICNCpr<106 µm were observed at temperatures between −7 and −2 ∘C, with concentrations exceeding 50 L−1 (i.e., in the SIPhigh class) between −5 and −3 ∘C (Fig. 12b). Measurements performed on 11 and 12 November 2019 are responsible for this SIPhigh event (Fig. 12d) and are mainly caused by the droplet-shattering and the ice–ice collision processes (as discussed in Sect. 3.2 and Pasquier et al., 2022a). Moderate to high ICNCpr<106 µm (SIPmod and SIPhigh classes) were also observed at temperatures between −24 and −16 ∘C on 1 April 2020 (Fig. 12b and d). Note that the warmer temperature range (−7 and −2 ∘C) overlaps with the rime-splintering process. However, since the other criteria for the rime-splintering process (i.e., rimed ice crystals and a sufficient concentration of cloud droplets with diameters smaller than 12 µm) were not met during the measurements with SIP, the contribution of the rime-splintering process is assumed to be negligible.
The concentrations of small ice crystals are higher (Fig. 12b), but the proportion of measurements with SIP occurrence (Fig. 12c) was lower on 11 and 12 November 2019 between −7 and −2 ∘C compared to measurements obtained on 1 April 2020 between −24 and −18 ∘C. Thus, the droplet-shattering processes found to be active at the warmer temperatures on 11 and 12 November seem to be less frequently active but also to create more splinters than the ice–ice collision process found to be active at the colder temperatures on 1 April 2020. This would be in agreement with laboratory studies showing that a large number of splinters (>10) can be produced from the freezing of a single drop (Lauber et al., 2018; Korolev and Leisner, 2020) as well as with recent remote sensing studies showing that high SIP events are associated with the presence of large drops in Arctic clouds (Luke et al., 2021). Note, however, that one measurement flight at lower temperatures is not sufficient to draw a conclusive statement about the number of splinters produced at these temperatures.
To conclude, SIP occurred over the entire temperature range where measurements were performed, with the highest concentrations of ice crystals smaller than 106 µm (>50 L−1) observed between −3 and −5 ∘C being caused mainly by the droplet-shattering process and the highest percentage of the measurements with SIP between −18 and −24 ∘C being caused by the ice–ice collision mechanism. This denotes the importance of the droplet-shattering and ice–ice collision mechanisms over a large temperature range and highlights the necessity of including these processes over a larger temperature range in numerical weather and climate models.
In this paper, the microphysical properties of Arctic MPCs measured during the NASCENT campaign over five consecutive days, from 8 to 12 November 2019, and on 1 April 2020 with the tethered balloon system HoloBalloon together with ground-based INP and remote sensing measurements as well as radiosonde profiling are discussed. Emphasis is placed on the formation of ice crystals, especially on the occurrence of SIP, and on the environmental conditions favorable for SIP. We used the concentration of small pristine ice crystals (ICNCpr<106 µm) to identify SIP occurring in the 60 to 120 s preceding the measurements. The key findings are summarized as follows:
-
SIP regions were identified in ∼40 % of the in-cloud measurements. In one probed MPC on 10 November 2019, ice crystal formation was limited by the concentration of aerosols acting as INPs at −17 ∘C. In two other MPCs on 11 and 12 November 2019, the ICNCpr<106 µm suddenly increased from below 1 L−1 (SIPlow) to more than 50 L−1 (SIPhigh) due to the droplet-shattering mechanism, which most likely generated a positive SIP feedback loop by creating splinters causing the freezing of additional droplets, creating splinters again. Finally, in two MPCs on 11 November 2019 and on 1 April 2020, the ice–ice collision mechanism was proposed to be responsible for moderate to high SIP (ICNCpr<106 µm up to 25 L−1).
-
SLDs were found to be favorable for the occurrence of SIP, as the frequency of SIP was enhanced in the presence of SLDs. Moreover, the frequency of occurrence of frozen drops was enhanced by a factor of 5 during SIP events (Table 1), whereby frozen drops were measured in 83.5 % of the SIPhigh observations. Thus, freezing of SLDs was strongly favorable for SIP, which indicates a large contribution from the droplet-shattering mechanism. We suggest that the presence of SLD itself is related to the strong updrafts and low CCN concentrations observed in the clean Arctic environment.
-
SIP cloud regions were observed over a large temperature range (−24 to −1 ∘C). The highest concentrations of secondary ice crystals were measured between −5 and −3 ∘C (>50 L−1, Fig. 12b) and were related mainly to the droplet-shattering mechanism (Sect. 3.2), while the highest proportion of the measurements showed the occurrence of SIP between −24 and −18 ∘C (up to 80 %, Fig. 12c) in one MPC related to the ice–ice collision mechanism (Sect. 3.3). This emphasizes the need to include SIP parametrizations for these two processes over a large temperature range in numerical weather prediction models, which generally only include a parametrization for the rime-splintering process active at temperatures between −8 and −3 ∘C.
Overall, this study observed a large variety of microphysical properties of Arctic MPCs during the 6 d of measurements, including two SIP mechanisms and the conditions favorable for these SIP mechanisms. Although INPs are necessary for the formation of the first (primary) ice crystals, our results indicate that, when SIP processes are active, they ultimately determine the ICNC. Therefore, the focus of future work investigating the evolution of ice crystal concentrations in Arctic low-level clouds should be placed on SIP. Further field and laboratory studies are required to better constrain the environmental conditions favorable for SIP in order to develop robust SIP parametrizations for numerical weather prediction models. In particular, field studies should characterize in-cloud INPC up to high subfreezing temperatures ( ∘C) to accurately constrain the SIP rate. Furthermore, we especially recommend including the presence of SLDs and their collision frequency with ice to estimate the contribution of the droplet-shattering mechanism, which was shown to play an important role in ice crystal formation in the observed Arctic MPC. Finally, we propose to extend the SIP parametrizations to all sub-freezing temperatures, as SIP was observed down to −24 ∘C in one sampled Arctic MPC.
A1 Potential temperature and wind profile
The potential temperature and wind profiles observed from the radiosondes over the 6 d of measurements suggest well-mixed boundary layers, and no strongly decoupled cloud is observed.
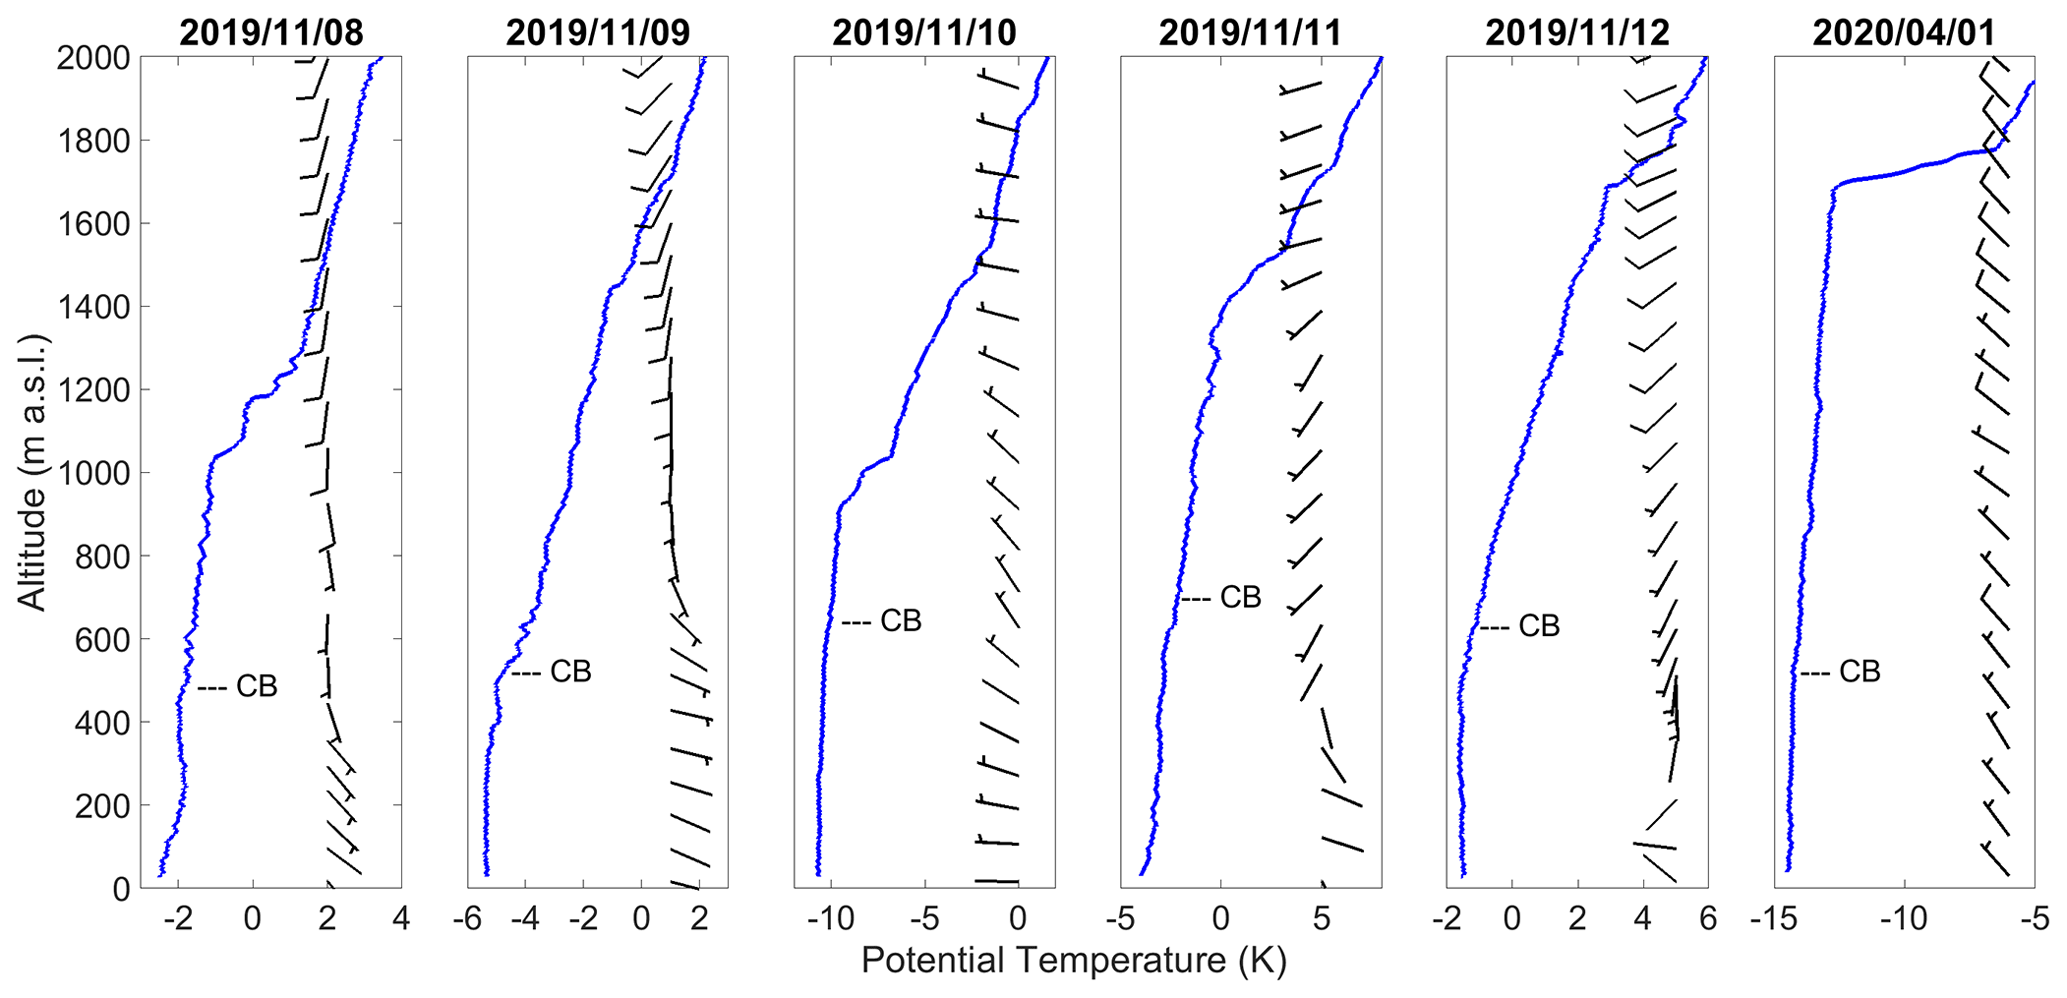
Figure A1Potential temperature and wind speed and direction measured by the radiosonde launched at 11:00 or 17:00 UTC over the 6 d of measurements. The mean cloud base (CB) measured with the ceilometer is labeled.
A2 Cloud top and HoloBalloon temperature and relative humidity determination from radiosonde measurements
The temperature profile from the radiosondes was used to determine the ambient temperature at HoloBalloon's measurement location and the cloud top temperature. If several radiosondes were launched during a day, the temperature profile between two launches was linearly interpolated from the two closest profiles. If only the daily radiosonde was launched, the temperature profile was used for the whole day. The same method was applied for the relative humidity. The cloud top altitude was determined from the first altitude where the cloud radar does not measure the reflectivity, and a running mean over 5 min was used to smooth high temporal variability in cloud top height. From this altitude, the temperature at cloud top was derived.
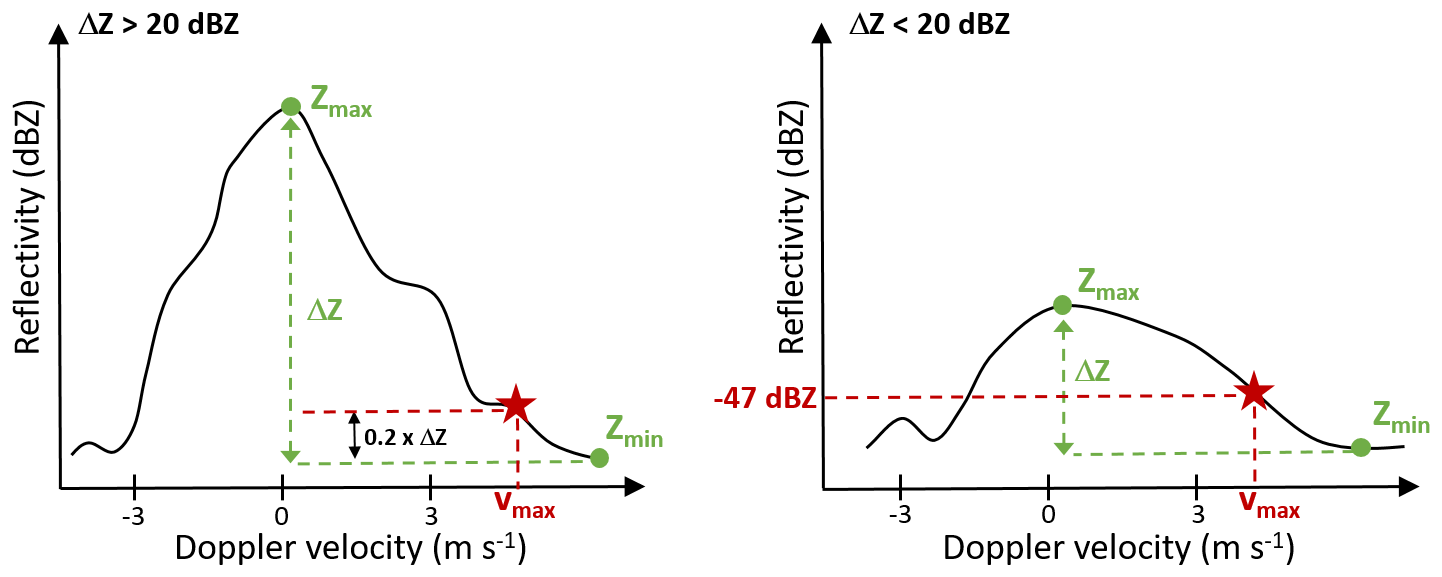
Figure A2Schematic of the derivation of the maximum Doppler velocity vmax (red star) from the Doppler spectra. Zmin and Zmax (green dots) are the minimum and maximum radar reflectivity (see the text for more details).
A3 Updraft wind speed estimate
As the Doppler velocity is the sum of the fall velocity of cloud particles and updraft or downdraft, the largest Doppler velocities within a measured Doppler spectrum can be used as approximation for the updraft velocities experienced by the smallest cloud particles (Shupe et al., 2008). We use a similar approach as in Ramelli et al. (2021) to estimate the updraft velocity from the maximum Doppler velocity derived from the Doppler spectra, as shown in Fig. A2. First, a running mean was used to smooth the Doppler spectra. If the difference between Zmax and Zmin exceeded 20 dBZ, the maximum Doppler velocity vmax was derived as follows:
where Zmax and Zmin are the maximum and minimum radar reflectivity. If the difference between Zmin and Zmin was lower than 20 dBZ, vmax was derived at −47 dBZ to avoid the selection of noise in Doppler spectra with low amplitude. The threshold of −47 dBZ was chosen, because it is the lowest reflectivity that was typically above the noise level. A positive (negative) Doppler velocity indicates downdraft (updraft). Note that, in the absence of small cloud particles, the updraft may be strongly underestimated by this method.
The cloud microphysical, INP, and cloud radar data are available for download at https://doi.org/10.5281/zenodo.7402285 (Pasquier et al., 2022c). The data from the radiosonde (Maturilli, 2020d, a), wind lidar (Graßl and Ritter, 2021), ceilometer (Maturilli, 2019, 2020e), and surface weather (Maturilli, 2020c, b) are available on PANGAEA (https://www.pangaea.de/, last access: 19 November 2022). The scripts to reproduce the figures in this study are available at https://doi.org/10.5281/zenodo.7407107 (Pasquier et al., 2022d).
JTP analyzed the cloud observational data and prepared the figures of the paper. FR, JH, ROD, AL, JW, and UL helped in analyzing and interpreting the observational data. JTP, JW, ROD, TC, and JH performed the HoloBalloon measurements. JW performed the INP measurements. RG processed the remote sensing data and helped in interpreting the remote sensing observations. MM was responsible for the radiosonde launches during the NASCENT campaign. JTP prepared the manuscript with contributions from all authors.
The contact author has declared that none of the authors has any competing interests.
Publisher’s note: Copernicus Publications remains neutral with regard to jurisdictional claims in published maps and institutional affiliations.
This project has received funding from the European Union's Horizon 2020 research and innovation program under grant no. 821205 (FORCeS), from the Swiss Polar Institute (Exploratory Grants 2018), and from the Swiss National Science Foundation (SNSF; grant no. 200021_175824). Rosa Gierens and Marion Maturilli gratefully acknowledge the funding by the Deutsche Forschungsgemeinschaft (DFG, German Research Foundation) – Project-ID 268020496 – TRR 172, within the Transregional Collaborative Research Center “ArctiC Amplification: Climate Relevant Atmospheric and SurfaCe Processes, and Feedback Mechanisms (AC)3”. Robert Oscar David and Tim Carlsen gratefully acknowledge the funding by the European Research Council (ERC) through grant no. StG758005. Robert Oscar David would also like to acknowledge EEARO-NO-2019-0423/IceSafari, contract no. 31/2020, under the NO grants 2014–2021 of EEA Grants/Norway Grants for financial support. We thank Alexei Korolev for the fruitful scientific discussions. We thank Guangyu Li for his help performing the aerosol and cloud microphysical measurements during the campaign, and we thank Guangyu Li and Michael Roesch for their help in the installation of the setup for the campaign. We would also like to thank Roland Neuber and Paul Zieger in particular for their support and advice during the organization of the campaign. We thank all those involved in the field work associated with NASCENT, particularly the AWIPEV and Norwegian Polar Institute Sverdrup stations staff. Finally, we thank Alexei Korolev, an anonymous reviewer, and the editor Timothy Garrett for their constructive and helpful feedback on the manuscript, which strengthened the paper.
This research has been supported by the European Research Council though Horizon 2020 (FORCeS, grant no. 821205; MC2, grant no. 758005), the Schweizerischer Nationalfonds zur Förderung der Wissenschaftlichen Forschung (grant no. 200021_175824), the Deutsche Forschungsgemeinschaft (grant no. 268020496), and the EEA Grants and Norway Grants 2014–2021 funding schemes (IceSafari, grant no. EEARO-NO-2019-0423, contract no. 31/2020).
The article processing charges for this open-access publication were covered by ETH Zurich.
This paper was edited by Timothy Garrett and reviewed by Alexei Korolev and one anonymous referee.
Bacon, N. J., Swanson, B. D., Baker, M. B., and Davis, E. J.: Breakup of levitated frost particles, J. Geophys. Res.-Atmos., 103, 13763–13775, https://doi.org/10.1029/98JD01162, 1998. a, b
Beck, A.: Observing the Microstructure of Orographic Clouds with HoloGondel, PhD thesis, ETH Zurich, https://doi.org/10.3929/ethz-b-000250847, 2017. a
Beck, A., Henneberger, J., Schöpfer, S., Fugal, J., and Lohmann, U.: HoloGondel: in situ cloud observations on a cable car in the Swiss Alps using a holographic imager, Atmos. Meas. Tech., 10, 459–476, https://doi.org/10.5194/amt-10-459-2017, 2017. a
Beck, A., Henneberger, J., Fugal, J. P., David, R. O., Lacher, L., and Lohmann, U.: Impact of surface and near-surface processes on ice crystal concentrations measured at mountain-top research stations, Atmos. Chem. Phys., 18, 8909–8927, https://doi.org/10.5194/acp-18-8909-2018, 2018. a, b
Beine, H. J., Argentini, S., Maurizi, A., Mastrantonio, G., and Viola, A.: The local wind field at Ny-Å lesund and the Zeppelin mountain at Svalbard, Meteorol. Atmos. Phys., 78, 107–113, https://doi.org/10.1007/s007030170009, 2001. a
David, R. O., Cascajo-Castresana, M., Brennan, K. P., Rösch, M., Els, N., Werz, J., Weichlinger, V., Boynton, L. S., Bogler, S., Borduas-Dedekind, N., Marcolli, C., and Kanji, Z. A.: Development of the DRoplet Ice Nuclei Counter Zurich (DRINCZ): validation and application to field-collected snow samples, Atmos. Meas. Tech., 12, 6865–6888, https://doi.org/10.5194/amt-12-6865-2019, 2019. a
Dedekind, Z., Lauber, A., Ferrachat, S., and Lohmann, U.: Sensitivity of precipitation formation to secondary ice production in winter orographic mixed-phase clouds, Atmos. Chem. Phys., 21, 15115–15134, https://doi.org/10.5194/acp-21-15115-2021, 2021. a
Dong, Y., Oraltay, R. G., and Hallett, J.: Ice particle generation during evaporation, Atmos. Res., 32, 45–53, https://doi.org/10.1016/0169-8095(94)90050-7, 1994. a
Field, P. R., Lawson, R. P., Brown, P. R. A., Lloyd, G., Westbrook, C., Moisseev, D., Miltenberger, A., Nenes, A., Blyth, A., Choularton, T., Connolly, P., Buehl, J., Crosier, J., Cui, Z., Dearden, C., DeMott, P., Flossmann, A., Heymsfield, A., Huang, Y., Kalesse, H., Kanji, Z. A., Korolev, A., Kirchgaessner, A., Lasher-Trapp, S., Leisner, T., McFarquhar, G., Phillips, V., Stith, J., and Sullivan, S.: Secondary Ice Production: Current State of the Science and Recommendations for the Future, Meteor. Mon., 58, 7.1–7.20, https://doi.org/10.1175/AMSMONOGRAPHS-D-16-0014.1, 2017. a, b, c
Fu, S., Deng, X., Shupe, M. D., and Xue, H.: A modelling study of the continuous ice formation in an autumnal Arctic mixed-phase cloud case, Atmos. Res., 228, 77–85, https://doi.org/10.1016/j.atmosres.2019.05.021, 2019. a
Georgakaki, P., Sotiropoulou, G., Vignon, É., Billault-Roux, A.-C., Berne, A., and Nenes, A.: Secondary ice production processes in wintertime alpine mixed-phase clouds, Atmos. Chem. Phys., 22, 1965–1988, https://doi.org/10.5194/acp-22-1965-2022, 2022. a, b
Goosse, H., Kay, J. E., Armour, K. C., Bodas-Salcedo, A., Chepfer, H., Docquier, D., Jonko, A., Kushner, P. J., Lecomte, O., Massonnet, F., Park, H.-S., Pithan, F., Svensson, G., and Vancoppenolle, M.: Quantifying climate feedbacks in polar regions, Nat. Commun., 9, 1–13, https://doi.org/10.1038/s41467-018-04173-0, 2018. a, b
Graßl, S. and Ritter, C.: Windlidar data from Ny-Ålesund, Svalbard (AWIPEV), PANGAEA [data set], https://doi.org/10.1594/PANGAEA.939662, 2021. a
Graßl, S., Ritter, C., and Schulz, A.: The Nature of the Ny-Ålesund Wind Field Analysed by High-Resolution Windlidar Data, Remote Sens., 14, 3771, https://doi.org/10.3390/rs14153771, 2022. a
Hallett, J. and Mossop, S. C.: Production of secondary ice particles during the riming process, Nature, 249, 26–28, https://doi.org/10.1038/249026a0, 1974. a, b, c, d
Henneberger, J., Fugal, J. P., Stetzer, O., and Lohmann, U.: HOLIMO II: a digital holographic instrument for ground-based in situ observations of microphysical properties of mixed-phase clouds, Atmos. Meas. Tech., 6, 2975–2987, https://doi.org/10.5194/amt-6-2975-2013, 2013. a
Hobbs, P. V. and Rangno, A. L.: Ice Particle Concentrations in Clouds, J. Atmos. Sci., 42, 2523–2549, https://doi.org/10.1175/1520-0469(1985)042<2523:IPCIC>2.0.CO;2, 1985. a
Hobbs, P. V. and Rangno, A. L.: Microstructures of low and middle-level clouds over the Beaufort Sea, Q. J. Roy. Meteor. Soc., 124, 2035–2071, https://doi.org/10.1002/qj.49712455012, 1998. a
Hoffer, T. E. and Braham, R. R.: A Laboratory Study of Atmospheric Ice Particles, J. Atmos. Sci., 19, 232–235, https://doi.org/10.1175/1520-0469(1962)019<0232:ALSOAI>2.0.CO;2, 1962. a
Keinert, A., Spannagel, D., Leisner, T., and Kiselev, A.: Secondary Ice Production upon Freezing of Freely Falling Drizzle Droplets, J. Atmos. Sci., 77, 2959–2967, https://doi.org/10.1175/JAS-D-20-0081.1, 2020. a, b, c
Keppas, S. C., Crosier, J., Choularton, T. W., and Bower, K. N.: Ice lollies: An ice particle generated in supercooled conveyor belts, Geophys. Res. Lett., 44, 5222–5230, https://doi.org/10.1002/2017GL073441, 2017. a
Koike, M., Ukita, J., Ström, J., Tunved, P., Shiobara, M., Vitale, V., Lupi, A., Baumgardner, D., Ritter, C., Hermansen, O., Yamada, K., and Pedersen, C. A.: Year-Round In Situ Measurements of Arctic Low-Level Clouds: Microphysical Properties and Their Relationships With Aerosols, J. Geophys. Res.-Atmos., 124, 1798–1822, https://doi.org/10.1029/2018JD029802, 2019. a
Korolev, A. and Leisner, T.: Review of experimental studies of secondary ice production, Atmos. Chem. Phys., 20, 11767–11797, https://doi.org/10.5194/acp-20-11767-2020, 2020. a, b, c, d, e, f, g, h, i, j
Korolev, A., Emery, E., and Creelman, K.: Modification and Tests of Particle Probe Tips to Mitigate Effects of Ice Shattering, J. Atmos. Ocean Technol., 30, 690–708, https://doi.org/10.1175/JTECH-D-12-00142.1, 2013. a
Korolev, A., Heckman, I., Wolde, M., Ackerman, A. S., Fridlind, A. M., Ladino, L. A., Lawson, R. P., Milbrandt, J., and Williams, E.: A new look at the environmental conditions favorable to secondary ice production, Atmos. Chem. Phys., 20, 1391–1429, https://doi.org/10.5194/acp-20-1391-2020, 2020. a, b, c, d, e, f, g
Küchler, N., Kneifel, S., Löhnert, U., Kollias, P., Czekala, H., and Rose, T.: A W-Band Radar-Radiometer System for Accurate and Continuous Monitoring of Clouds and Precipitation, J. Atmos. Ocean. Technol., 34, 2375–2392, https://doi.org/10.1175/JTECH-D-17-0019.1, 2017. a
Ladino, L. A., Korolev, A., Heckman, I., Wolde, M., Fridlind, A. M., and Ackerman, A. S.: On the role of ice-nucleating aerosol in the formation of ice particles in tropical mesoscale convective systems, Geophys. Res. Lett., 44, 1574–1582, https://doi.org/10.1002/2016GL072455, 2017. a, b
Lance, S., Shupe, M. D., Feingold, G., Brock, C. A., Cozic, J., Holloway, J. S., Moore, R. H., Nenes, A., Schwarz, J. P., Spackman, J. R., Froyd, K. D., Murphy, D. M., Brioude, J., Cooper, O. R., Stohl, A., and Burkhart, J. F.: Cloud condensation nuclei as a modulator of ice processes in Arctic mixed-phase clouds, Atmos. Chem. Phys., 11, 8003–8015, https://doi.org/10.5194/acp-11-8003-2011, 2011. a, b
Lauber, A.: In-situ observations of ice multiplication in clouds using a holographic imager and a deep learning algorithm for the classification of cloud particles, PhD thesis, ETH Zurich, Zurich, https://doi.org/10.3929/ethz-b-000474830, 2020. a
Lauber, A., Kiselev, A., Pander, T., Handmann, P., and Leisner, T.: Secondary Ice Formation during Freezing of Levitated Droplets, J. Atmos. Sci., 75, 2815–2826, https://doi.org/10.1175/JAS-D-18-0052.1, 2018. a, b, c, d, e
Lauber, A., Henneberger, J., Mignani, C., Ramelli, F., Pasquier, J. T., Wieder, J., Hervo, M., and Lohmann, U.: Continuous secondary-ice production initiated by updrafts through the melting layer in mountainous regions, Atmos. Chem. Phys., 21, 3855–3870, https://doi.org/10.5194/acp-21-3855-2021, 2021. a, b
Lawson, P., Gurganus, C., Woods, S., and Bruintjes, R.: Aircraft Observations of Cumulus Microphysics Ranging from the Tropics to Midlatitudes: Implications for a New Secondary Ice Process, J. Atmos. Sci., 74, 2899–2920, https://doi.org/10.1175/JAS-D-17-0033.1, 2017. a, b, c
Lawson, R. P., Woods, S., and Morrison, H.: The Microphysics of Ice and Precipitation Development in Tropical Cumulus Clouds, J. Atmos. Sci., 72, 2429–2445, https://doi.org/10.1175/JAS-D-14-0274.1, 2015. a, b, c
Li, G., Wieder, J., Pasquier, J. T., Henneberger, J., and Kanji, Z. A.: Predicting atmospheric background number concentration of ice-nucleating particles in the Arctic, Atmos. Chem. Phys., 22, 14441–14454, https://doi.org/10.5194/acp-22-14441-2022, 2022. a, b
Li, H., Möhler, O., Petäjä, T., and Moisseev, D.: Two-year statistics of columnar-ice production in stratiform clouds over Hyytiälä, Finland: environmental conditions and the relevance to secondary ice production, Atmos. Chem. Phys., 21, 14671–14686, https://doi.org/10.5194/acp-21-14671-2021, 2021. a
Libbrecht, K. G.: The physics of snow crystals, Rep. Prog. Phys., 68, 855–895, https://doi.org/10.1088/0034-4885/68/4/r03, 2005. a, b
Lloyd, G., Choularton, T. W., Bower, K. N., Crosier, J., Jones, H., Dorsey, J. R., Gallagher, M. W., Connolly, P., Kirchgaessner, A. C. R., and Lachlan-Cope, T.: Observations and comparisons of cloud microphysical properties in spring and summertime Arctic stratocumulus clouds during the ACCACIA campaign, Atmos. Chem. Phys., 15, 3719–3737, https://doi.org/10.5194/acp-15-3719-2015, 2015. a
Lohmann, U., Lüönd, F., and Mahrt, F.: Clouds, in: An Introduction to Clouds: From the Microscale to Climate, Cambridge University Press, 1–25, https://doi.org/10.1017/CBO9781139087513.002, 2016. a, b
Luke, E. P., Yang, F., Kollias, P., Vogelmann, A. M., and Maahn, M.: New insights into ice multiplication using remote-sensing observations of slightly supercooled mixed-phase clouds in the Arctic, P. Natl. Acad. Sci. USA, 118, 13, https://doi.org/10.1073/pnas.2021387118, 2021. a
Mason, B. J. and Maybank, J.: The fragmentation and electrification of freezing water drops, Q. J. Roy. Meteor. Soc., 86, 176–185, https://doi.org/10.1002/qj.49708636806, 1960. a
Maturilli, M.: Expanded measurements from station Ny-Ålesund (2019–11). Alfred Wegener Institute – Research Unit Potsdam, PANGAEA [data set], https://doi.org/10.1594/PANGAEA.909941, 2019. a
Maturilli, M.: High resolution radiosonde measurements from station Ny-Ålesund (2020–04). Alfred Wegener Institute – Research Unit Potsdam, PANGAEA [data set], https://doi.org/10.1594/PANGAEA.917967, 2020a. a
Maturilli, M.: Continuous meteorological observations at station Ny-Ålesund (2020–04). Alfred Wegener Institute – Research Unit Potsdam, PANGAEA [data set], https://doi.org/10.1594/PANGAEA.925612, 2020b. a
Maturilli, M.: Continuous meteorological observations at station Ny-Ålesund (2019–11). Alfred Wegener Institute – Research Unit Potsdam, PANGAEA [data set], https://doi.org/10.1594/PANGAEA.911503, 2020c. a
Maturilli, M.: High resolution radiosonde measurements from station Ny-Ålesund (2019–11). Alfred Wegener Institute – Research Unit Potsdam, PANGAEA [data set], https://doi.org/10.1594/PANGAEA.911039, 2020d. a
Maturilli, M.: Expanded measurements from station Ny-Ålesund (2020–04). Alfred Wegener Institute – Research Unit Potsdam, PANGAEA [data set], https://doi.org/10.1594/PANGAEA.917581, 2020e. a
Maturilli, M. and Ebell, K.: Twenty-five years of cloud base height measurements by ceilometer in Ny-Ålesund, Svalbard, Earth Syst. Sci. Data, 10, 1451–1456, https://doi.org/10.5194/essd-10-1451-2018, 2018. a
Maturilli, M. and Kayser, K.: Arctic warming, moisture increase and circulation changes observed in the Ny-Ålesund homogenized radiosonde record, Theor. Appl. Climatol., 130, 1434–4483, https://doi.org/10.1007/s00704-016-1864-0, 2017. a, b
Maturilli, M., Herber, A., and König-Langlo, G.: Climatology and time series of surface meteorology in Ny-Ålesund, Svalbard, Earth Syst. Sci. Data, 5, 155–163, https://doi.org/10.5194/essd-5-155-2013, 2013. a, b
Maturilli, M., Herber, A., and König-Langlo, G.: Surface radiation climatology for Ny-Ålesund, Svalbard (78.9∘ N), basic observations for trend detection, Theor. Appl. Climatol., 120, 331–339, https://doi.org/10.1007/s00704-014-1173-4, 2015. a
Meredith, M., Sommerkorn, M., Cassotta, S., Derksen, C., Ekaykin, A., Hollowed, A., Kofinas, G., Mackintosh, A., Melbourne-Thomas, J., Muelbert, M. M. C., and Ottersen, G.: Polar Regions – Chapter 3, IPCC Special Report on the Ocean and Cryosphere in a Changing Climate, https://www.ipcc.ch/srocc/chapter/chapter-3-2/ (last access: 19 November 2022), 2019. a
Mertes, S., Verheggen, B., Walter, S., Connolly, P., Ebert, M., Schneider, J., Bower, K. N., Cozic, J., Weinbruch, S., Baltensperger, U., and Weingartner, E.: Counterflow Virtual Impactor Based Collection of Small Ice Particles in Mixed-Phase Clouds for the Physico-Chemical Characterization of Tropospheric Ice Nuclei: Sampler Description and First Case Study, Aerosol Sci. Tech., 41, 848–864, https://doi.org/10.1080/02786820701501881, 2007. a
Mignani, C., Creamean, J. M., Zimmermann, L., Alewell, C., and Conen, F.: New type of evidence for secondary ice formation at around −15∘ C in mixed-phase clouds, Atmos. Chem. Phys., 19, 877–886, https://doi.org/10.5194/acp-19-877-2019, 2019. a
Mossop, S. C.: The influence of drop size distribution on the production of secondary ice particles during graupel growth, Q. J. Roy. Meteor. Soc., 104, 323–330, https://doi.org/10.1002/qj.49710444007, 1978. a, b, c, d
Mossop, S. C.: Secondary ice particle production during rime growth: The effect of drop size distribution and rimer velocity, Q. J. Roy. Meteor. Soc., 111, 1113–1124, https://doi.org/10.1002/qj.49711147012, 1985. a, b, c
Mossop, S. C. and Hallett, J.: Ice Crystal Concentration in Cumulus Clouds: Influence of the Drop Spectrum, Science, 186, 632–634, https://doi.org/10.1126/science.186.4164.632, 1974. a
Nakaya, U: Snow Crystals: Natural and Artificial, Harvard University Press, Cambridge, MA and London, England, https://doi.org/10.4159/harvard.9780674182769, 1954. a, b, c
Norwegian Polar Institute: Kartdata Svalbard 1:100 000 (S100 Kartdata)/Map Data, https://doi.org/10.21334/npolar.2014.645336c7, 2014. a
Pasquier, J. T., David, R. O., Freitas, G., Gierens, R., Gramlich, Y., Haslett, S., Li, G., Schäfer, B., Siegel, K., Wieder, J., Adachi, K., Belosi, F., Carlsen, T., Decesari, S., Ebell, K., Gilardoni, S., Gysel-Beer, M., Henneberger, J., Inoue, J., Kanji, Z. A., Koike, M., Kondo, Y., Krejci, R., Lohmann, U., Maturilli, M., Mazzolla, M., Modini, R., Mohr, C., Motos, G., Nenes, A., Nicosia, A., Ohata, S., Paglione, M., Park, S., Pileci, R. E., Ramelli, F., Rinaldi, M., Ritter, C., Sato, K., Storelvmo, T., Tobo, Y., Traversi, R., Viola, A., and Zieger, P.: The Ny-Ålesund Aerosol Cloud Experiment (NASCENT): Overview and First Results, B. Am. Meteorol. Soc., 103, 11, https://doi.org/10.1175/BAMS-D-21-0034.1, 2022a. a, b, c, d, e, f, g, h
Pasquier, J. T., Henneberger, J., Ramelli, F., Korolev, A., Wieder, J., Lauber, A., Li, G., David, R. O., Carlsen, T., Gierens, R., Maturilli, M., and Lohmann, U.: Understanding the history of two complex ice crystal habits deduced from a holographic imager, Geophys. Res. Lett., accepted, 2022b. a, b
Pasquier, J. T., Henneberger, J., Ramelli, F., Wieder, J., Gierens, R., Ebell, K., Li, G., David, R. O., and Carlsen, T.: Data from the NASCENT campaign used in the publications: “Conditions favorable for secondary ice production in Arctic mixed-phase clouds” and “Understanding the history of two complex ice crystal habits deduced from a holographic imager”, Zenodo [data set], https://doi.org/10.5281/zenodo.7402285, 2022c. a
Pasquier, J. T., Henneberger, J., and Ramelli, F.: Scripts for the publication: “Conditions favorable for secondary ice production in Arctic mixed-phase clouds”, Zenodo [code], https://doi.org/10.5281/zenodo.7407107, 2022d. a
Possner, A., Ekman, A. M. L., and Lohmann, U.: Cloud response and feedback processes in stratiform mixed-phase clouds perturbed by ship exhaust, Geophys. Res. Lett., 44, 1964–1972, https://doi.org/10.1002/2016GL071358, 2017. a
Proske, U., Bessenbacher, V., Dedekind, Z., Lohmann, U., and Neubauer, D.: How frequent is natural cloud seeding from ice cloud layers ( ∘C) over Switzerland?, Atmos. Chem. Phys., 21, 5195–5216, https://doi.org/10.5194/acp-21-5195-2021, 2021. a
Ramelli, F., Beck, A., Henneberger, J., and Lohmann, U.: Using a holographic imager on a tethered balloon system for microphysical observations of boundary layer clouds, Atmos. Meas. Tech., 13, 925–939, https://doi.org/10.5194/amt-13-925-2020, 2020. a, b, c
Ramelli, F., Henneberger, J., David, R. O., Bühl, J., Radenz, M., Seifert, P., Wieder, J., Lauber, A., Pasquier, J. T., Engelmann, R., Mignani, C., Hervo, M., and Lohmann, U.: Microphysical investigation of the seeder and feeder region of an Alpine mixed-phase cloud, Atmos. Chem. Phys., 21, 6681–6706, https://doi.org/10.5194/acp-21-6681-2021, 2021. a, b
Rangno, A. L. and Hobbs, P. V.: Ice particles in stratiform clouds in the Arctic and possible mechanisms for the production of high ice concentrations, J. Geophys. Res.-Atmos., 106, 15065–15075, https://doi.org/10.1029/2000JD900286, 2001. a
Rinaldi, M., Hiranuma, N., Santachiara, G., Mazzola, M., Mansour, K., Paglione, M., Rodriguez, C. A., Traversi, R., Becagli, S., Cappelletti, D., and Belosi, F.: Ice-nucleating particle concentration measurements from Ny-Ålesund during the Arctic spring–summer in 2018, Atmos. Chem. Phys., 21, 14725–14748, https://doi.org/10.5194/acp-21-14725-2021, 2021. a
Shupe, M. D., Kollias, P., Poellot, M., and Eloranta, E.: On deriving vertical air motions from cloud radar Doppler spectra, J. Atmos. Ocean. Technol., 25, 547–557, 2008. a
Solomon, A., Feingold, G., and Shupe, M. D.: The role of ice nuclei recycling in the maintenance of cloud ice in Arctic mixed-phase stratocumulus, Atmos. Chem. Phys., 15, 10631–10643, https://doi.org/10.5194/acp-15-10631-2015, 2015. a
Sotiropoulou, G., Sullivan, S., Savre, J., Lloyd, G., Lachlan-Cope, T., Ekman, A. M. L., and Nenes, A.: The impact of secondary ice production on Arctic stratocumulus, Atmos. Chem. Phys., 20, 1301–1316, https://doi.org/10.5194/acp-20-1301-2020, 2020. a
Sun, Z. and Shine, K. P.: Studies of the radiative properties of ice and mixed-phase clouds, Q. J. Roy. Meteorol. Soc., 120, 111–137, https://doi.org/10.1002/qj.49712051508, 1994. a
Takahashi, C. and Yamashita, A.: Shattering of Frozen Water Drops in a Supercooled Cloud, J. Meteorol. Soc. Jpn. Ser. II, 48, 373–376, https://doi.org/10.2151/jmsj1965.48.4_373, 1970. a, b
Takahashi, T., Nagao, Y., and Kushiyama, Y.: Possible High Ice Particle Production during Graupel–Graupel Collisions, J. Atmos. Sci., 52, 4523–4527, https://doi.org/10.1175/1520-0469(1995)052<4523:PHIPPD>2.0.CO;2, 1995. a, b, c, d
Tobo, Y., Uetake, J., Matsui, H., Moteki, N., Uji, Y., Iwamoto, Y., Miura, K., and Misumi, R.: Seasonal Trends of Atmospheric Ice Nucleating Particles Over Tokyo, J. Geophys. Res.-Atmos., 125, e2020JD033658, https://doi.org/10.1029/2020JD033658, 2020. a
Touloupas, G., Lauber, A., Henneberger, J., Beck, A., and Lucchi, A.: A convolutional neural network for classifying cloud particles recorded by imaging probes, Atmos. Meas. Tech., 13, 2219–2239, https://doi.org/10.5194/amt-13-2219-2020, 2020. a, b
Vali, G.: Quantitative Evaluation of Experimental Results an the Heterogeneous Freezing Nucleation of Supercooled Liquids, J. Atmos. Sci., 28, 402–409, https://doi.org/10.1175/1520-0469(1971)028<0402:QEOERA>2.0.CO;2, 1971. a
Vardiman, L.: The Generation of Secondary Ice Particles in Clouds by Crystal–Crystal Collision, J. Atmos. Sci., 35, 2168–2180, https://doi.org/10.1175/1520-0469(1978)035<2168:TGOSIP>2.0.CO;2, 1978. a, b
Wieder, J., Ihn, N., Mignani, C., Haarig, M., Bühl, J., Seifert, P., Engelmann, R., Ramelli, F., Kanji, Z. A., Lohmann, U., and Henneberger, J.: Retrieving ice-nucleating particle concentration and ice multiplication factors using active remote sensing validated by in situ observations, Atmos. Chem. Phys., 22, 9767–9797, https://doi.org/10.5194/acp-22-9767-2022, 2022a. a
Wieder, J., Mignani, C., Schär, M., Roth, L., Sprenger, M., Henneberger, J., Lohmann, U., Brunner, C., and Kanji, Z. A.: Unveiling atmospheric transport and mixing mechanisms of ice-nucleating particles over the Alps, Atmos. Chem. Phys., 22, 3111–3130, https://doi.org/10.5194/acp-22-3111-2022, 2022b. a
Worringen, A., Kandler, K., Benker, N., Dirsch, T., Mertes, S., Schenk, L., Kästner, U., Frank, F., Nillius, B., Bundke, U., Rose, D., Curtius, J., Kupiszewski, P., Weingartner, E., Vochezer, P., Schneider, J., Schmidt, S., Weinbruch, S., and Ebert, M.: Single-particle characterization of ice-nucleating particles and ice particle residuals sampled by three different techniques, Atmos. Chem. Phys., 15, 4161–4178, https://doi.org/10.5194/acp-15-4161-2015, 2015. a
Young, G., Lachlan-Cope, T., O'Shea, S. J., Dearden, C., Listowski, C., Bower, K. N., Choularton, T. W., and Gallagher, M. W.: Radiative Effects of Secondary Ice Enhancement in Coastal Antarctic Clouds, Geophys. Res. Lett., 46, 2312–2321, https://doi.org/10.1029/2018GL080551, 2019. a
- Abstract
- Introduction
- Methods
- SIP occurrence during 6 d of MPC measurements in Arctic MPCs
- Environmental conditions favorable for SIP
- Conclusions
- Appendix A: Auxiliary parameters
- Code and data availability
- Author contributions
- Competing interests
- Disclaimer
- Acknowledgements
- Financial support
- Review statement
- References