the Creative Commons Attribution 4.0 License.
the Creative Commons Attribution 4.0 License.
 | 07 Dec 2022
Where does the dust deposited over the Sierra Nevada snow come from?
Yun Qian
Cenlin He
Jianyu Zheng
Zhibo Zhang
Antonis Gkikas
Mineral dust contributes up to one-half of surface aerosol loading in spring over the southwestern United States, posing an environmental challenge that threatens human health and the ecosystem. Using self-organizing map (SOM) analysis with dust deposition and flux data from WRF-Chem and Modern-Era Retrospective analysis for Research and Applications, Version 2 (MERRA-2), we identify four typical dust transport patterns across the Sierra Nevada, associated with the mesoscale winds, Sierra barrier jet (SBJ), North Pacific High (NPH), and long-range cross-Pacific westerlies, respectively. We find that dust emitted from the Central Valley is persistently transported eastward, while dust from the Mojave Desert and Great Basin influences the Sierra Nevada during mesoscale transport occurring mostly in winter and early spring. Asian dust reaching the mountain range comes either from the west through straight isobars (cross-Pacific transport) or from the north in the presence of the NPH. Extensive dust depositions are found on the west slope of the mountain, contributed by Central Valley emissions and cross-Pacific remote transport. In particular, the SBJ-related transport produces deposition through landfalling atmospheric rivers, whose frequency might increase in a warming climate.
- Article
(23567 KB) - Full-text XML
-
Supplement
(3520 KB) - BibTeX
- EndNote


The emission, transport, and deposition of mineral dust (hereafter dust) are processes receiving increasing interest from the scientific community (Sarangi et al., 2020). Dust emission is an integral part of aridification and mirrors the effects of climatic change and anthropogenic land use on global drylands (Duniway et al., 2019). Airborne dust interacts with Earth's climate system by altering the radiation budget and cloud lifetime and amount (Forster et al., 2007; Haywood et al., 2005; Huang et al., 2019; Liu et al., 2022b). Research has indicated that exposure to dust particles can cause respiratory infections, heart disease, and chronic obstructive pulmonary disease (COPD) (Laden et al., 2006; Lim et al., 2012; Crooks et al., 2016). A significant association between dust exposure and increased mortality has been reported, but there is no consensus in this regard to date (Giannadaki et al., 2014). The deposition of dust on snow surface influences snow albedo, further contributing to anthropogenic climate change as early as the 1970s (Qian et al., 2009, 2014; Skiles et al., 2018).
Dust over the southwestern United States, particularly in California and Nevada states, is an important aerosol type contributing to more than half of surface aerosol concentrations in spring (Kim et al., 2021). Covered by dry soil with large gaps and sparse vegetation, the surrounding Mojave Desert, Sonoran Desert, and Great Basin are susceptible to wind erosion (Okin et al., 2006; Duniway et al., 2019). The dry or ephemeral lakes in the deserts produce very fine dust containing toxic inorganic constituents (Goldstein et al., 2017). In addition, anthropogenic land-use practices, e.g., agriculture and human settlement, have greatly disturbed crustal biomass and produced windblown dust along the west coast (Pappagianis and Einstein, 1978; Clausnitzer and Singer, 2000; Neff et al., 2008). Furthermore, cross-Pacific dust transported from Asia and Africa to the Sierra Nevada range is widely reported (Ault et al., 2011; Creamean et al., 2014, 2013). The surface dust concentration has been found to increase in the past 2 decades during spring at sites across the southwest (Tong et al., 2017; Hand et al., 2017; Brahney et al., 2013), and the onset of dust season is shifting earlier in response to climate change (Hand et al., 2016). The elevated dust emission and earlier dust season are supposed to lead to a spectrum of environmental and societal impacts in the most populated US state. In particular, the resultant dust deposition on mountain snow decreases snow albedo and produces a radiation forcing of 0–14.6 W m−2 during the melting season (Huang et al., 2022a), shifting snowmelt timing to earlier dates and further increasing California's vulnerability to water resource fluctuations (Wu et al., 2018; Huang et al., 2022b). With its complex terrains, frequently varying microclimate, and coexisting sources from both local and remote regions, the Sierra Nevada area is an interesting region for studying dust transport and its response to climate change.
Characterization of dust emission, transport, and deposition across the Sierra Nevada has been investigated using various data. Isotopic analyses (i.e., concentrations of Pb and Nd) are widely used to distinguish and quantify the respective contribution of dust emission from local (dried Owens Lake), regional (Central Valley and the Mojave Desert), and global sources (Asia and Africa) on the dust deposition on the mountain (Muhs et al., 2007; Jardine et al., 2021; Aciego et al., 2017; Aarons et al., 2019). Their source attribution has been generally confirmed by the analyses of dust particle size and composition (Creamean et al., 2014, 2013; Reheis and Kihl, 1995). The isotopic and composition analyses have been commonly used with back-trajectory modeling to further identify the dust transport pathway from the source to the deposition location (Vicars and Sickman, 2011; Creamean et al., 2014, 2013). Yet, these analyses generally retrieve dust sources in a short time and at a specific location. Alternatively, ground-based measurement networks were established in the 1990s and provide long-term trends of dust concentrations and the interannual variability across multiple sites (Hand et al., 2017; Achakulwisut et al., 2017; Hand et al., 2016). However, they do not contain information on dust origins and atmospheric conditions responsible for dust transport. Satellite retrievals were less commonly used to study dust characteristics across the Sierra Nevada (Lei and Wang, 2014), mainly due to the poor data coverage caused by cloud contamination in the region.
Global and regional climate–chemistry models have been widely used to understand the drivers of the variability of dust and quantify the role of regional and remote transport, filling the gaps in the observations (Chin et al., 2002, 2007; Kim et al., 2021; Wu et al., 2017). While dust emissions and transport have been generally studied, a connection between dust emissions from the source region and the timing, location, and amount of dust deposition to the Sierra Nevada snow is lacking. The isotopic and composition analyses attribute dust sources at a few sites. But to the best of our knowledge, no regional characterization has been conducted on how dust is transported to the Sierra Nevada after emissions from adjacent drylands and remote continents and when, where, and how many depositions occur for dust transported through different pathways. The connection between dust emissions, transport pathways, and deposition to snow would facilitate the prediction of future changes in dust regimes and the corresponding climate impact, enabling more efficient management practices. With a focus on the dust that influences the Sierra Nevada, this study investigates the following questions. (1) Where does the dust come from? (2) How is dust transported to the mountain from the sources? (3) How is the dust deposited on the Sierra Nevada during spring, when the dust in snow largely influences snow albedo and snowmelt? We integrate models and observations to understand how the dust deposition is linked to a specific source both surrounding and far from the Sierra Nevada.
2.1 WRF-Chem configuration
We used the WRF-Chem version 3.9 to study dust emission and transport across the Sierra Nevada. The model setups (Table 1), including the physical schemes and emission inventory, follow Huang et al. (2022a), which showed that the model captures the distribution and variation in aerosols reasonably well in the study domain (126.12–112.86∘ W, 32.3–43.0∘ N). The Model of Ozone and Related chemical Tracers (MOZART) chemistry module (Emmons et al., 2020) and the Model for Simulating Aerosol Interactions and Chemistry with four bins (MOSAIC 4-bin) aerosol model (Zaveri and Peters, 1999) were applied, and dust emissions were calculated online using the GOCART dust scheme (Ginoux et al., 2001). The meteorological initial and lateral boundary conditions (IC and LBCs) were derived from the ECMWF Reanalysis v5 (ERA5) at 0.25∘ horizontal resolution and 6 h temporal intervals (Hersbach et al., 2020). Spectral nudging was employed with a timescale of 6 h above the PBL to reduce the drift between ERA5 reanalysis data and WRF's internal tendencies (Von Storch et al., 2000). The chemical initial and boundary conditions were provided by CAM-Chem (Buchholz et al., 2019).

We applied the model to two nested domains (Fig. 1). Domain 1 (126.12–112.86∘ W, 32.3–43.0∘ N) was configured to cover all of California, Nevada, and part of the surrounding states with 110 × 120 grid cells at 10 km × 10 km horizontal resolution; the nested domain 2 covered the Sierra Nevada and surrounding regions with a 2 km × 2 km resolution. The cumulus scheme is turned off in domain 2 with convection-permitting resolution. We used 35 vertical model layers from the surface to 10 hPa with denser layers at lower altitudes to resolve the PBL. The simulation period ranged from 20 September 2018 to 31 August 2019, while we only used output from February to June in consideration of both dust emission season and mountain snow existence (Hand et al., 2016; Kim et al., 2021; Achakulwisut et al., 2017).
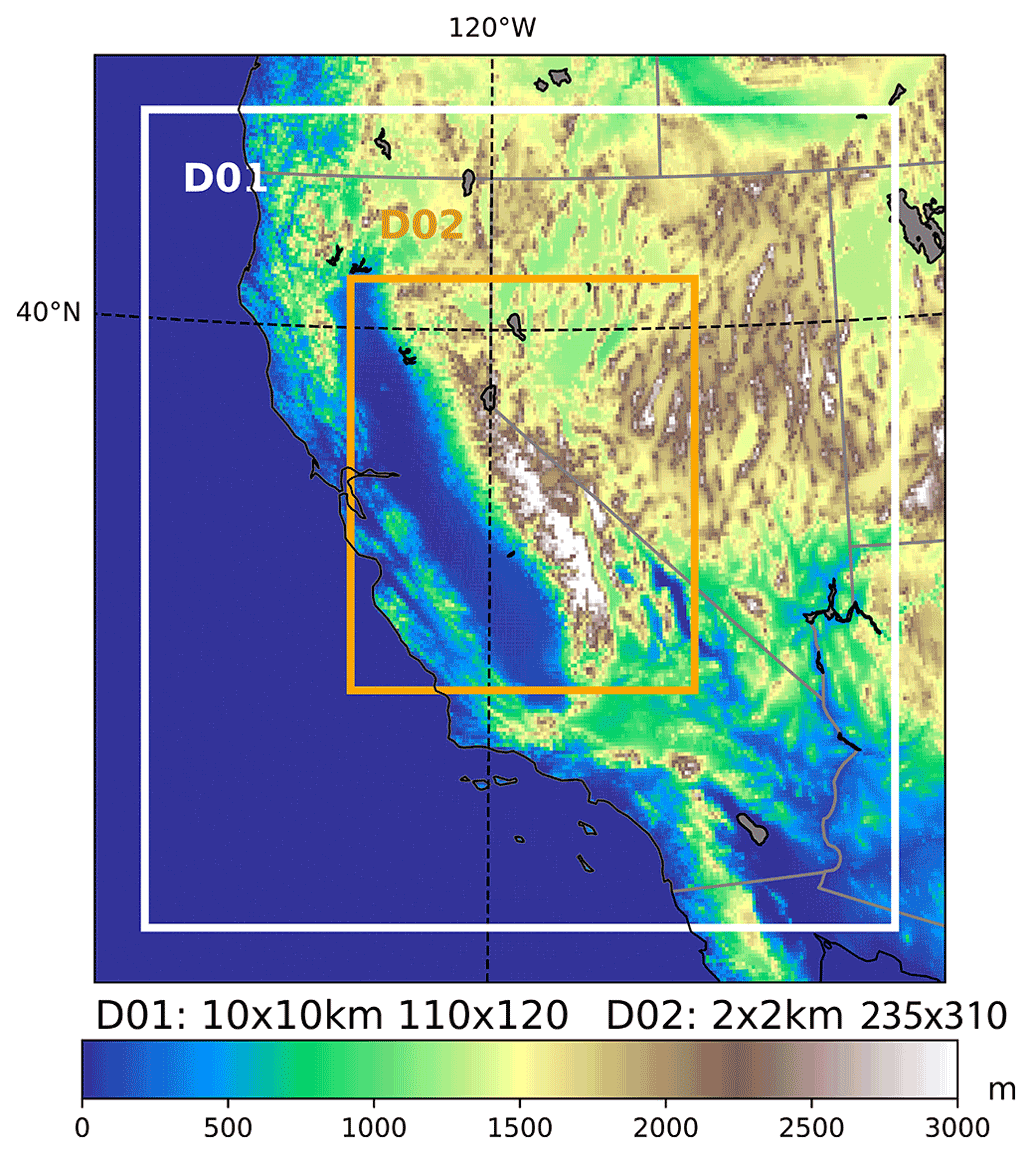
Figure 1WRF-Chem simulation domain 1 (D01) and domain 2 (D02) used in this study.
2.2 MERRA-2 and ERA5 reanalysis
The Modern-Era Retrospective analysis for Research and Applications, Version 2 (MERRA-2), is a widely used atmospheric reanalysis with a spatial resolution of 0.500∘ × 0.625∘ and 72 vertical layers (Buchard et al., 2017). MERRA-2 aerosol products are produced by combining GEOS atmospheric model version 5 (GEOS-5) with a 3D variational data assimilation algorithm to incorporate satellite observations, including from the Advanced Very High Resolution Radiometer (AVHRR), Moderate Resolution Imaging Spectroradiometer (MODIS), and Multi-angle Imaging Spectro Radiometer (MISR), as well as ground-based observations such as the AEronet RObotic NETwork (AERONET) (Gelaro et al., 2017). Although the aerosol vertical profile, composition, and size distributions are not constrained by the assimilation of aerosol optical depth (AOD), previous studies demonstrated that the aerosol assimilation system has considerably improved the agreement with numerous observed aerosol properties (Buchard et al., 2016, 2017; Randles et al., 2017). The assimilation results in the imbalance of global dust mass and produces a considerably larger deposition than the simulated dust emission (Buchard et al., 2017). MERRA-2 simulates dust with diameter bins of 0.2–2.0 (DU001), 2.0–3.6 (DU002), 3.6–6.0 (DU003), 6.0–12.0 (DU004), and 12.0–20.0 (DU005) µm, while the MOSAIC 4-bin in WRF-Chem simulates dust with geometric size bins of 0.039–0.156, 0.156–0.625, 0.625–2.5, and 2.5–10.0 µm. We therefore use the dust concentrations of the first four size bins in MERRA-2 (DU001 + DU002 + DU003 + 0.74 × DU004) to match with dust with geometric size less than 10.0 µm in WRF-Chem (https://gmao.gsfc.nasa.gov/reanalysis/MERRA-2/FAQ/, last access: February 2022).
ERA5 provides assimilated wind fields at a 0.25∘ × 0.25∘ horizontal resolution at 137 hybrid sigma/pressure levels from 1979 to near-real time (Hersbach et al., 2020). This study obtained the 3-hourly meridional and zonal wind field from February to June 2019 from 1000 to 500 hPa. The ERA5 wind reanalyses were used with satellite-retrieved dust optical depth (DOD) to evaluate the classified dust emission and transport patterns from the model.
2.3 Satellite observations for validation
The Infrared Atmospheric Sounding Interferometer (IASI) on board the European Meteorological Operation (MetOp) satellite series measures infrared radiation in 8461 spectral channels between 3.63 and 15.5 µm. The instrument has provided near-global coverage with a spatial resolution of 12 km at nadir (Hilton et al., 2012) since 2007. IASI is primarily sensitive to coarse-mode dust particles, and thus the retrieved AOD at the wavelength of 10 µm can represent the DOD (Yu et al., 2019). Note that the thermal infrared (IR) AOD reported by IASI is usually significantly smaller than the visible AOD in MODIS because of the spectral dependence of dust extinction (Zheng et al., 2022). We use the version 2.2 AOD product developed at the Centre National de la Recherche Scientifique Laboratoire de Météorologie Dynamique from https://iasi.aeris-data.fr/dust-aod/ (last access: February 2022) (Capelle et al., 2014). The 0.3∘ × 0.3∘ daily AOD data covering California were produced by aggregating day and night retrievals at the satellite pixel resolution (Capelle et al., 2018), in consideration of both data completeness and fine features. The 1.0∘ × 1.0∘ daily AOD was produced in a similar way to investigate dust transport from Asia across the North Pacific.
The MIDAS (ModIs Dust AeroSol) dataset provides global fine-resolution (0.1∘ × 0.1∘) daily DOD between 2003 and 2017 using quality-filtered AOD from MODIS Aqua and DOD-to-AOD ratios from MERRA-2 reanalyses (Gkikas et al., 2021). Despite the uncertainties in modeled DOD-to-AOD ratios, the validations of the MIDAS dataset against the AERONET dust-like AOD and the LIdar climatology of Vertical Aerosol Structure for space-based lidar simulation (LIVAS) DOD reveal a high level of agreement at both global and station level (Gkikas et al., 2022). Compared with other MODIS-derived DOD products (Song et al., 2021; Voss and Evan, 2020; Ginoux et al., 2012; Pu and Ginoux, 2018), MIDAS has finer spatial and temporal resolutions over both land and ocean, which is particularly applicable in this study focusing on a small region and a few cases at daily scale. The dataset has been extended to near-real time to match our study year.
Cloud-Aerosol Lidar with Orthogonal Polarization (CALIOP) is a two-wavelength (532 and 1064 nm) polarization lidar on board the Cloud-Aerosol Lidar and Infrared Pathfinder Satellite Observation (CALIPSO) satellite (Hunt et al., 2009). Since June 2006, the lidar has been collecting an almost continuous record of high-resolution profiles of aerosol and clouds as fine as 30 m in the vertical, covering 82∘ N to 82∘ S (Winker et al., 2010; Winker et al., 2009). This study used clear-sky data from the CALIOP Version 4, level-2 aerosol profile product (Young et al., 2018), to investigate the vertical profile of the elevated dust layer, especially from remote transport. When there were large DOD values shown in IASI and MIDAS, we examined the vertical profiles of dust by identifying the “dust,” “polluted dust,” and “dusty marine” species in the CALIOP data (Kim et al., 2018)
2.4 SOM analysis
We applied self-organizing map (SOM) analysis, a clustering method developed in the field of artificial neural networks, to recognize different weather features associated with dust transport and deposition. SOMs have been widely used in atmospheric sciences to recognize spatially organized sets of patterns in the data (Reusch et al., 2007; Bao and Wallace, 2015; Liu et al., 2022a; Song et al., 2019). Before the machine-learning process, we assign a few two-dimensional arrays of initial nodes randomly or more efficiently from the leading empirical orthogonal functions (EOFs). During the training phase, the Euclidean distance between each input pattern and the initiation nodes is calculated to begin an iterative procedure. The best-matching node or the “winning” node is the one with the smallest distance between the initiation nodes and the input vector. Then the winning node and the neighborhood nodes around the winner are updated to adjust themselves toward the input vector. Since this process is iterated and fine-tuned, the nodes are self-organizing. The final SOM nodes represent typical dust transport and deposition patterns across the Sierra Nevada.
Here, we first used five variables from the WRF-Chem inner domain (D02) in the SOM clustering, including dust deposition flux at the Sierra Nevada, the low-level meridional and zonal dust transport fluxes, and the mid-level meridional and zonal dust transport fluxes surrounding the Sierra Nevada. The original fields were used without any filtering methods to consider the extreme cases. The 3-hourly model outputs during February–June 2019 are used to count for the spatial distribution and temporal evolution of dust transport and deposition. For WRF-Chem, we averaged the zonal and meridional dust fluxes in model levels 3–5 (roughly 900–950 hPa over coastal California and 650–700 hPa over the Sierra Nevada) to acquire the low-level transport features. We averaged 200–700 hPa fluxes to acquire the mid-level transport features. Levels 3–5 were selected to focus on airborne particulate matter entrained above the planetary boundary layer and transported on the regional scale. Remote transport of Asian and African dust is mostly found around 600–200 hPa, which flows downward to the lower troposphere along the post-cold isentropic surface into the atmospheric river (AR) environment (Voss et al., 2021). By selecting levels between 200–700 hPa, we were able to include all cross-Pacific remote transport in the middle level.
We tested the number of clusters (k) that ranges in 3, 4, 5, 6, 8, 9, and 16 to assess the distinctiveness and robustness of different k. For each k, the robustness of the clusters was measured by a classifiability index (CI) (Vigaud and Robertson, 2017; Vigaud et al., 2018; Hannachi, 2010) constructed using the minimum spatial correlation coefficient between the clusters obtained from the full data and many random halves of the data (100 halves used here) (Hannachi, 2010). Therefore, the CI measured the reproductivity of the k clusters partitioning (Visbeck et al., 2001), with perfect partitioning leading to 1. Figure S1 shows the CI as a function of the number of clusters using WRF-Chem output for 2019. With the highest CI, the four-cluster partitioning represents distinct dust transport and deposition patterns over the Sierra Nevada well and is used in this study.
To verify the recognized transport patterns based on WRF-Chem, we conducted SOM analyses using variables from MERRA-2. We first remapped the same five variables using bilinear interpolation from 0.5∘ × 0.625∘ to 10 km, the resolution of the WRF-Chem outer domain, before clustering. The vertical levels of low-level and mid-level dust transport fluxes were selected to approximately match the WRF-Chem pressure level. Four nodes were identified and arranged to make a direct comparison with those from WRF-Chem. To further investigate if transport patterns recognized from SOM vary significantly with years, we applied SOM analyses over 2001–2021 using MERRA-2 extended records of dust fluxes and deposition.
3.1 Dust emission sources around the Sierra Nevada
We find four emission source regions surrounding the Sierra Nevada where dust emissions could potentially influence the mountain snow impurities between February and June (Fig. 2). The Mojave Desert, located southeast of the Sierra Nevada, is characterized by low annual precipitation, sparse vegetation, and dried fine soil. Airborne dust loading over the desert can reach 30 000 µ m−2 averaged over our study period (Fig. 2a). It is generally transported eastward but can also be transported westward, influencing the southern part of the mountain (Neff et al., 2008). Dust produced in the northern (Sacramento Valley) and the southern part (San Joaquin and Tulare basins) of the Central Valley is often transported eastward to the mountains. With high soil aridity and a higher fraction of dry sand (Duniway et al., 2019), the southern Central Valley is more erodible and emits a higher amount of fine dust. The Great Basin dust is relatively weak in magnitude but located at a higher altitude. Therefore, it can easily ride along wind currents upward along the east slope of the mountain. The column dust loading in MERRA-2 confirms our results in WRF-Chem (Fig. 2b), despite it showing a stronger dust emission in the Great Basin while a weaker one in the Sacramento Valley. The IASI shows the strongest IR DOD in the Mojave Desert, followed by the southern Central Valley, but smaller dust emissions from the Sacramento Valley as compared with model output (Fig. 2c). The smaller magnitude is largely due to the fact that IASI measures the radiation at IR wavelengths, which is more sensitive to coarse-mode dust particles (Yu et al., 2019), whereas the fine dust produced in the Central Valley has a negligible contribution to DOD at 10 µm. In contrast, MIDAS captures dust emissions from the Great Basin, the southern and northern Central Valley (Fig. 2d) but not the Mojave Desert. MIDAS is reported to underestimate DOD from the Mojave Desert compared to AERONET DOD, which might be caused by the lower dust amounts simulated in MERRA-2 (Gkikas et al., 2021) and the underestimation of MODIS AOD over the deserts as compared to ground observations (Tao et al., 2017).
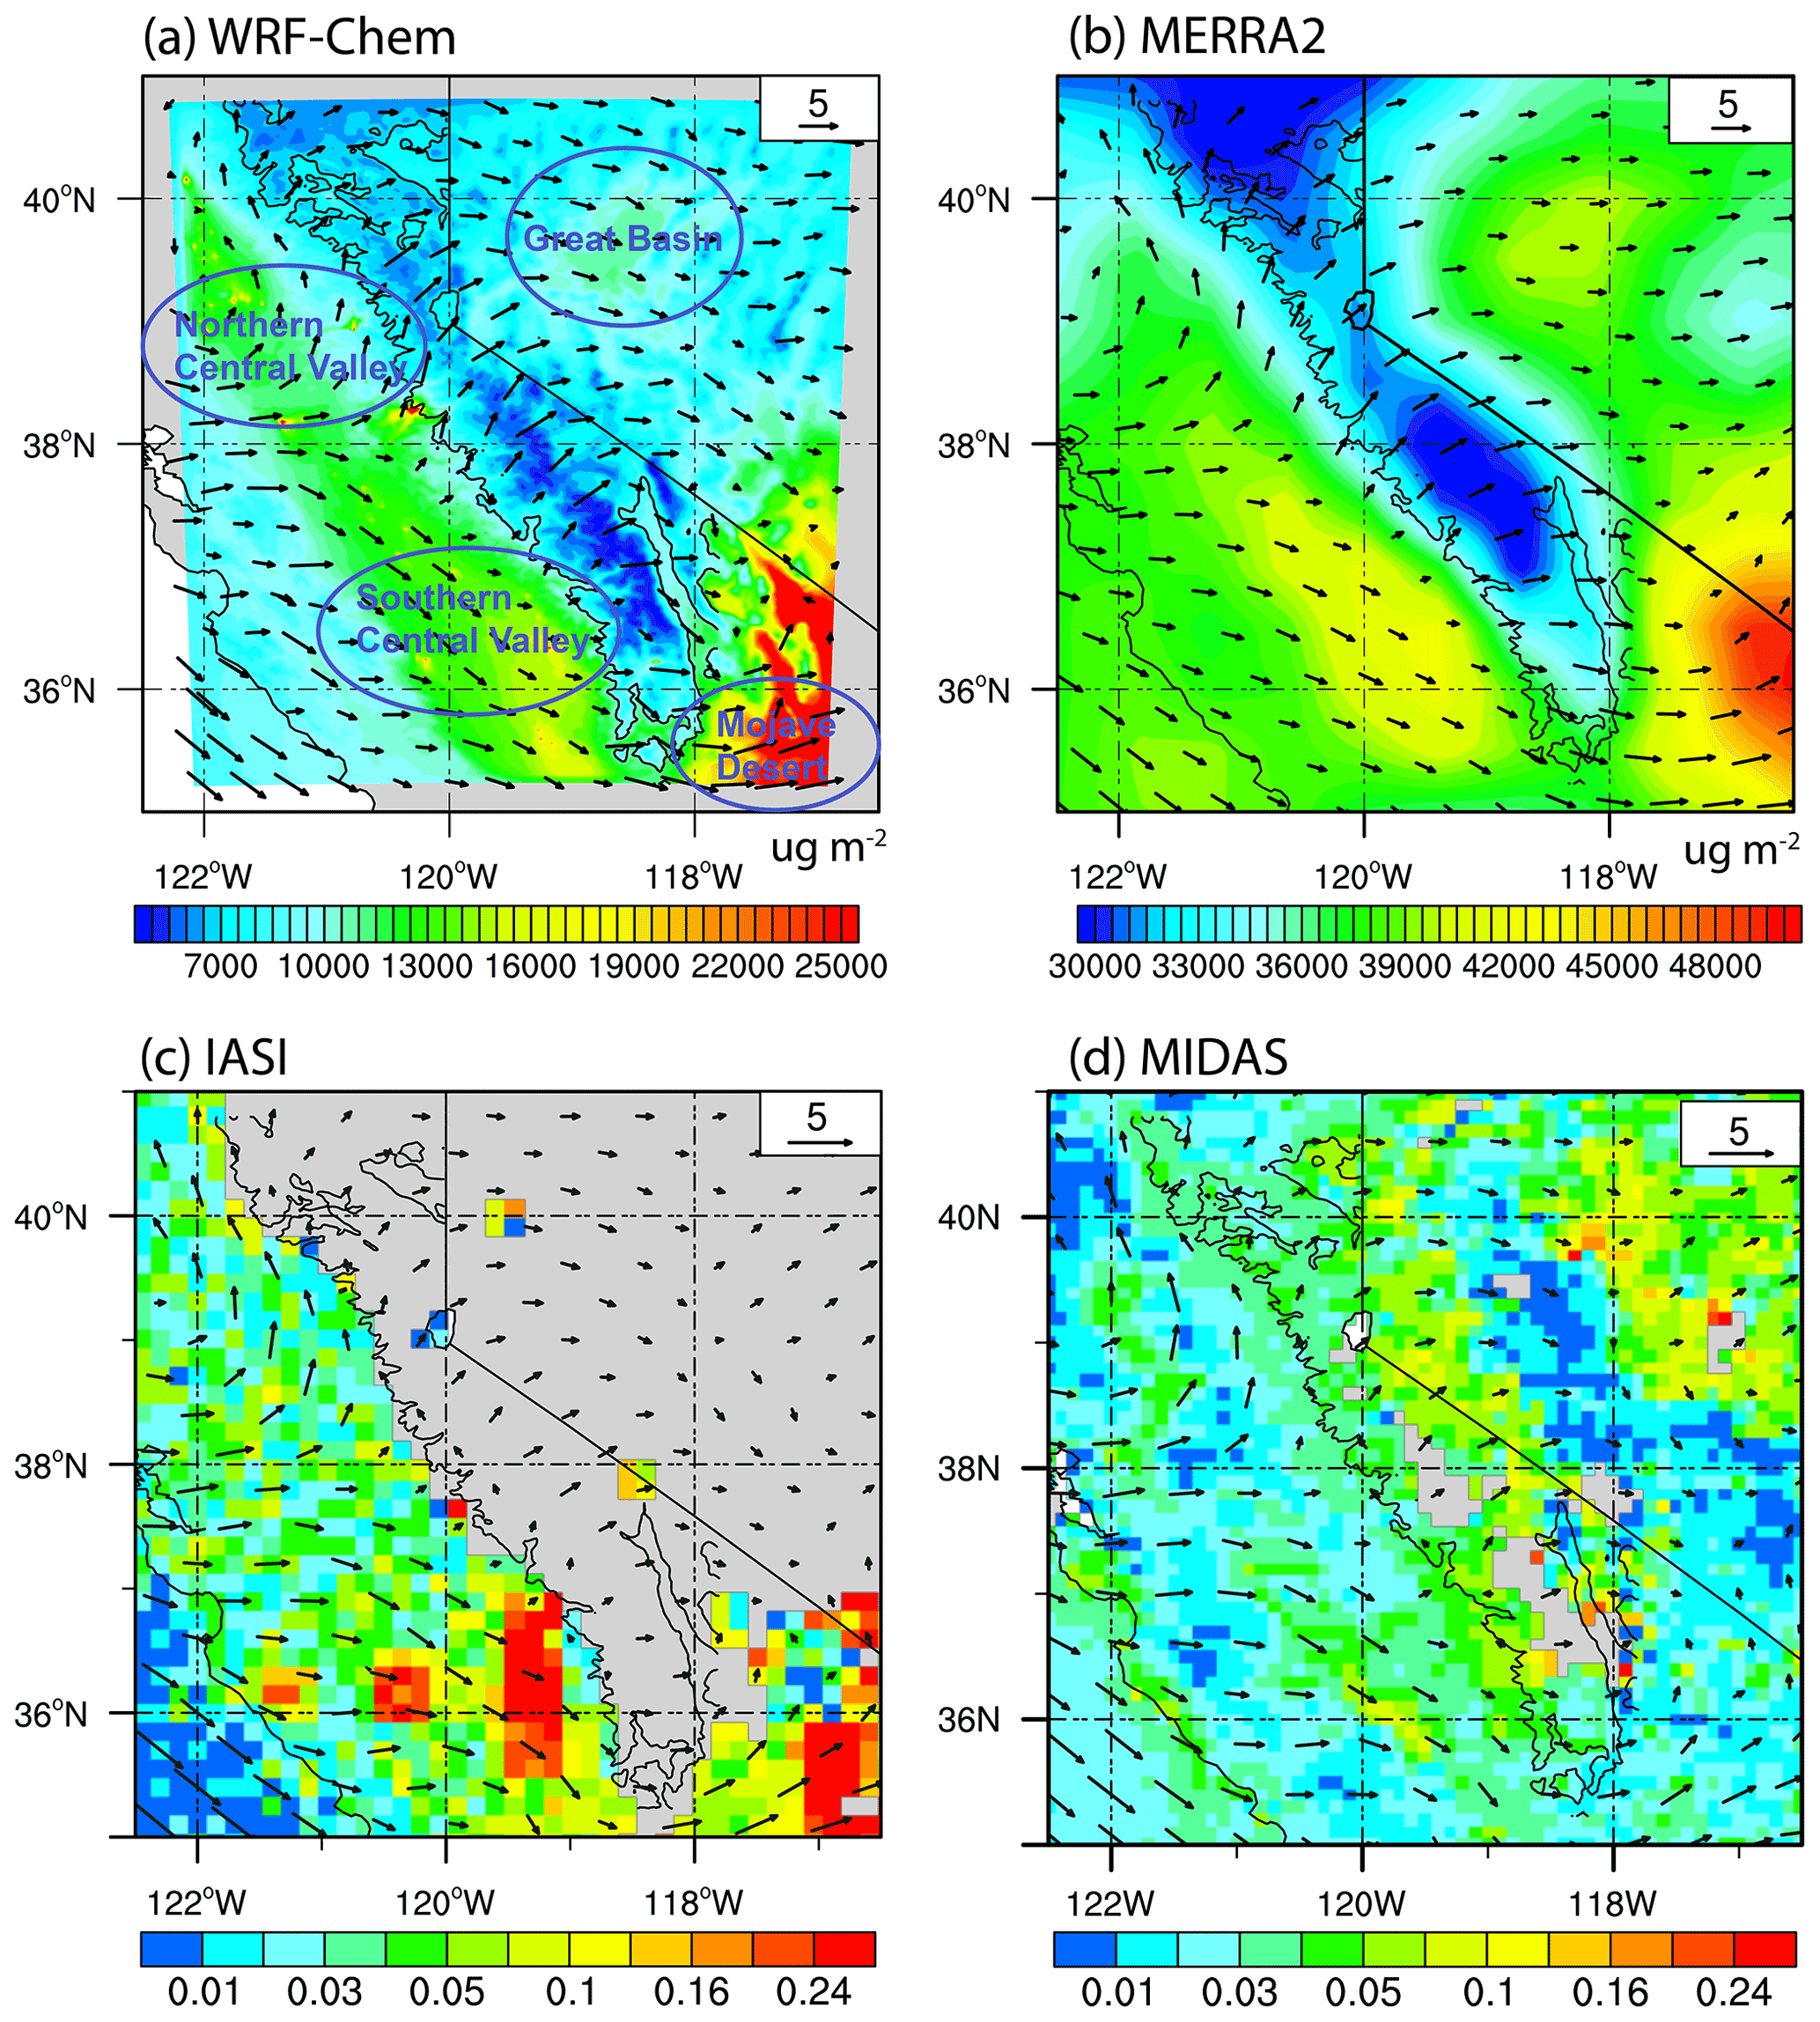
Figure 2The spatial distribution of dust in model and satellite observations averaged in February–June 2019. Column dust loading (µ m−2) and low-level winds (roughly 875–925 hPa; m s−1) in (a) WRF-Chem and (b) MERRA-2. (c) Observed thermal infrared DOD at the wavelength of 10 µm from IASI. (d) Observed visible DOD at the wavelength of 550 µm from MIDAS. The low-level winds (m s−1) in (c) and (d) are from ERA5 reanalyses. Black contours indicate an elevation of 1500 m, which represents the Sierra Nevada range used in this study. The grey areas in (c)–(d) are missing pixels in satellite observations.
3.2 Dust transport across the Sierra Nevada
This section introduces the features of dust transport patterns discerned from WRF-Chem and evaluates them against satellite observations over the period of February to June 2019. Figure 3 shows the WRF-Chem dust concentration and wind in the low levels and middle levels averaged for each of the four types acquired from the SOM analyses. The dust transport pattern represented in SOM type 1 accounts for 35.8 % of hours from February to June (Fig. 3a), especially in February (43 %) and March (57 %) (Fig. 4a). Type 2 occurs in 24.2 % of the whole study period and contributes to more than 50 % in February and then decreases with the month. In contrast, types 3 and 4 account for 17.8 % and 22.3 %, respectively, with the occurrence increasing with the month. The maximum occurrence is found in June for type 3 (40 %) and April for type 4 (34 %), respectively.
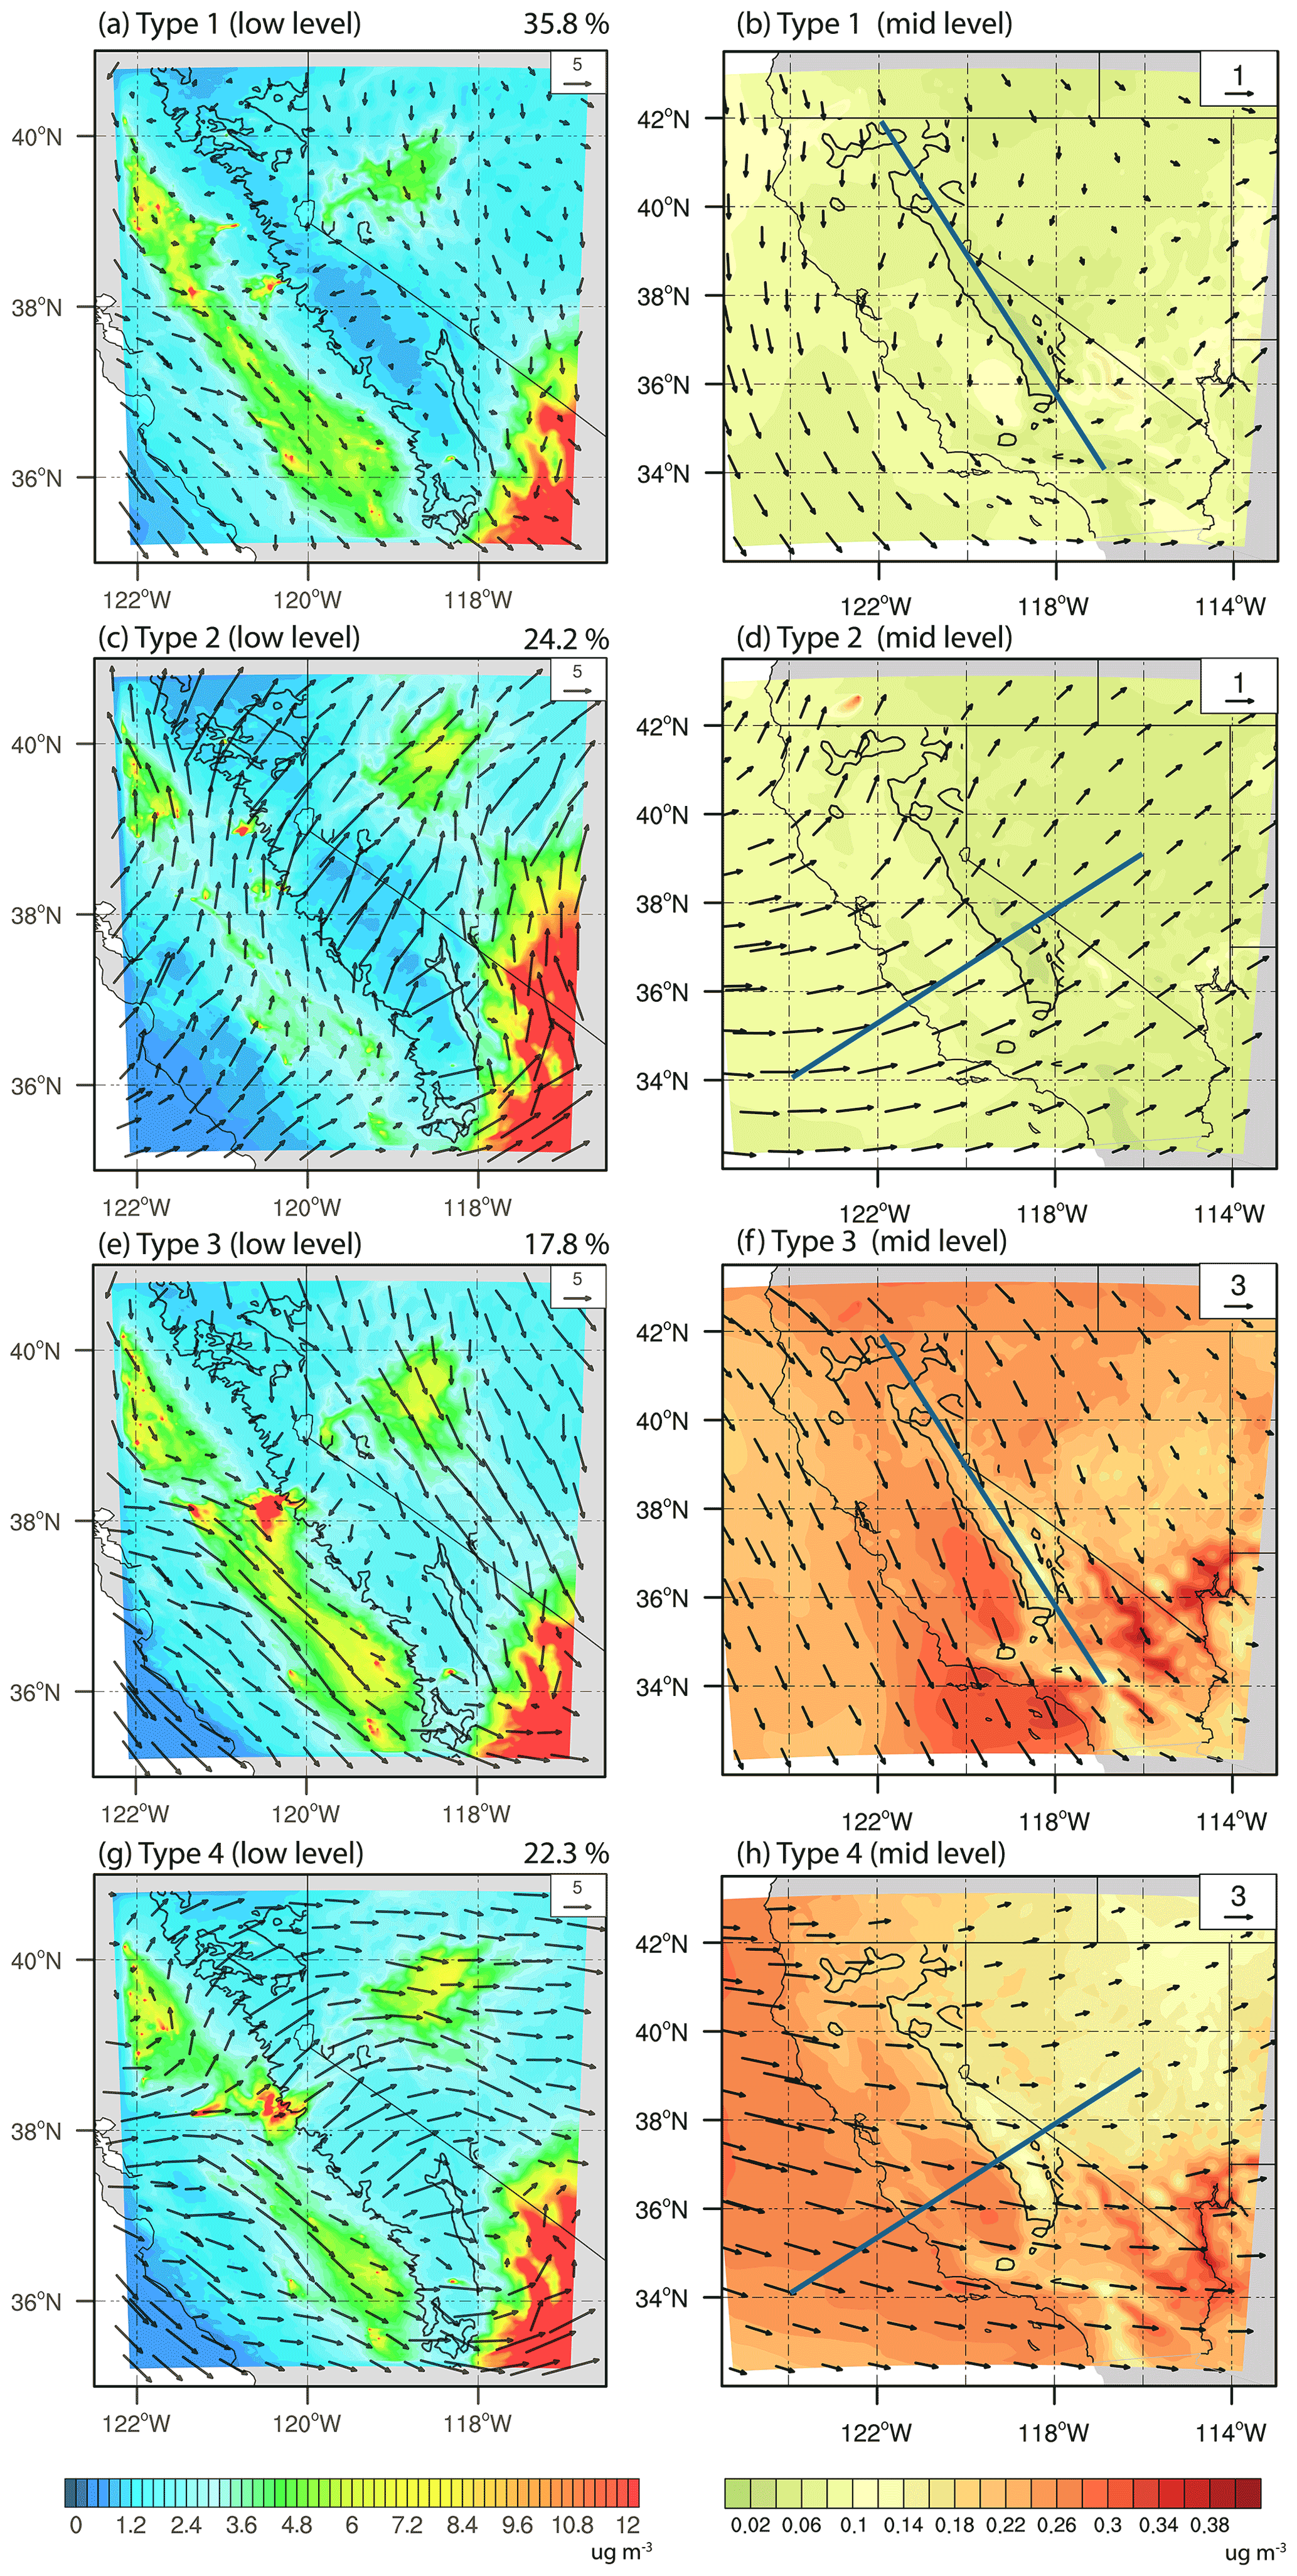
Figure 3(a, c, e, g) Low-level (roughly 875–925 hPa) dust concentration (ug m−3) and wind vectors (m s−1) in each of the four SOM types in WRF-Chem. The numbers on the top right of panels denote the frequency of each type. (b, d, f, h) Mid-level (200–700 hPa average) dust concentration (ug m−3) and dust transport in types 1–4. The position of the cross-section used for Fig. 5 is denoted in each plot.
3.2.1 Mesoscale regional (MSR) transport
In type 1, dust is transported from northwest to southeast in the Central Valley at the low level (roughly 875–925 hPa over the California coast). A vortex (Schultz eddy) was found in the northern Central Valley (Fig. 3a), circulating counterclockwise and confining dust to the local environment (Bao et al., 2008). The air inflow from the ocean is relatively weak and obstructed by the terrain. The Great Basin is dominated by the northwesterlies. The emitted dust is transported southeastward and blocked by the mountain, depositing dust on the east slope. Dust emitted from the Mojave Desert can be elevated to the middle level (Fig. 3b). The cross-section further shows a vertical circulation where the Mojave Desert dust is blown away from the Sierra Nevada at the low level and towards the mountain at 600–700 hPa (Fig. 5a). A weaker mid-level cross-Pacific flow is found in type 1 than in other types (Fig. 6a), with no signals of remote transport reaching the Sierra Nevada (Fig. 3b). Type 1 generally corresponds to the dust transport in lack of prevailing large-scale weather systems. The high peaks of the Sierra Nevada produce mesoscale circulations and prevent the Central Valley and Great Basin dust from being transported to the other side of the mountain. It is referred to as “mesoscale regional (MSR) transport” hereafter.
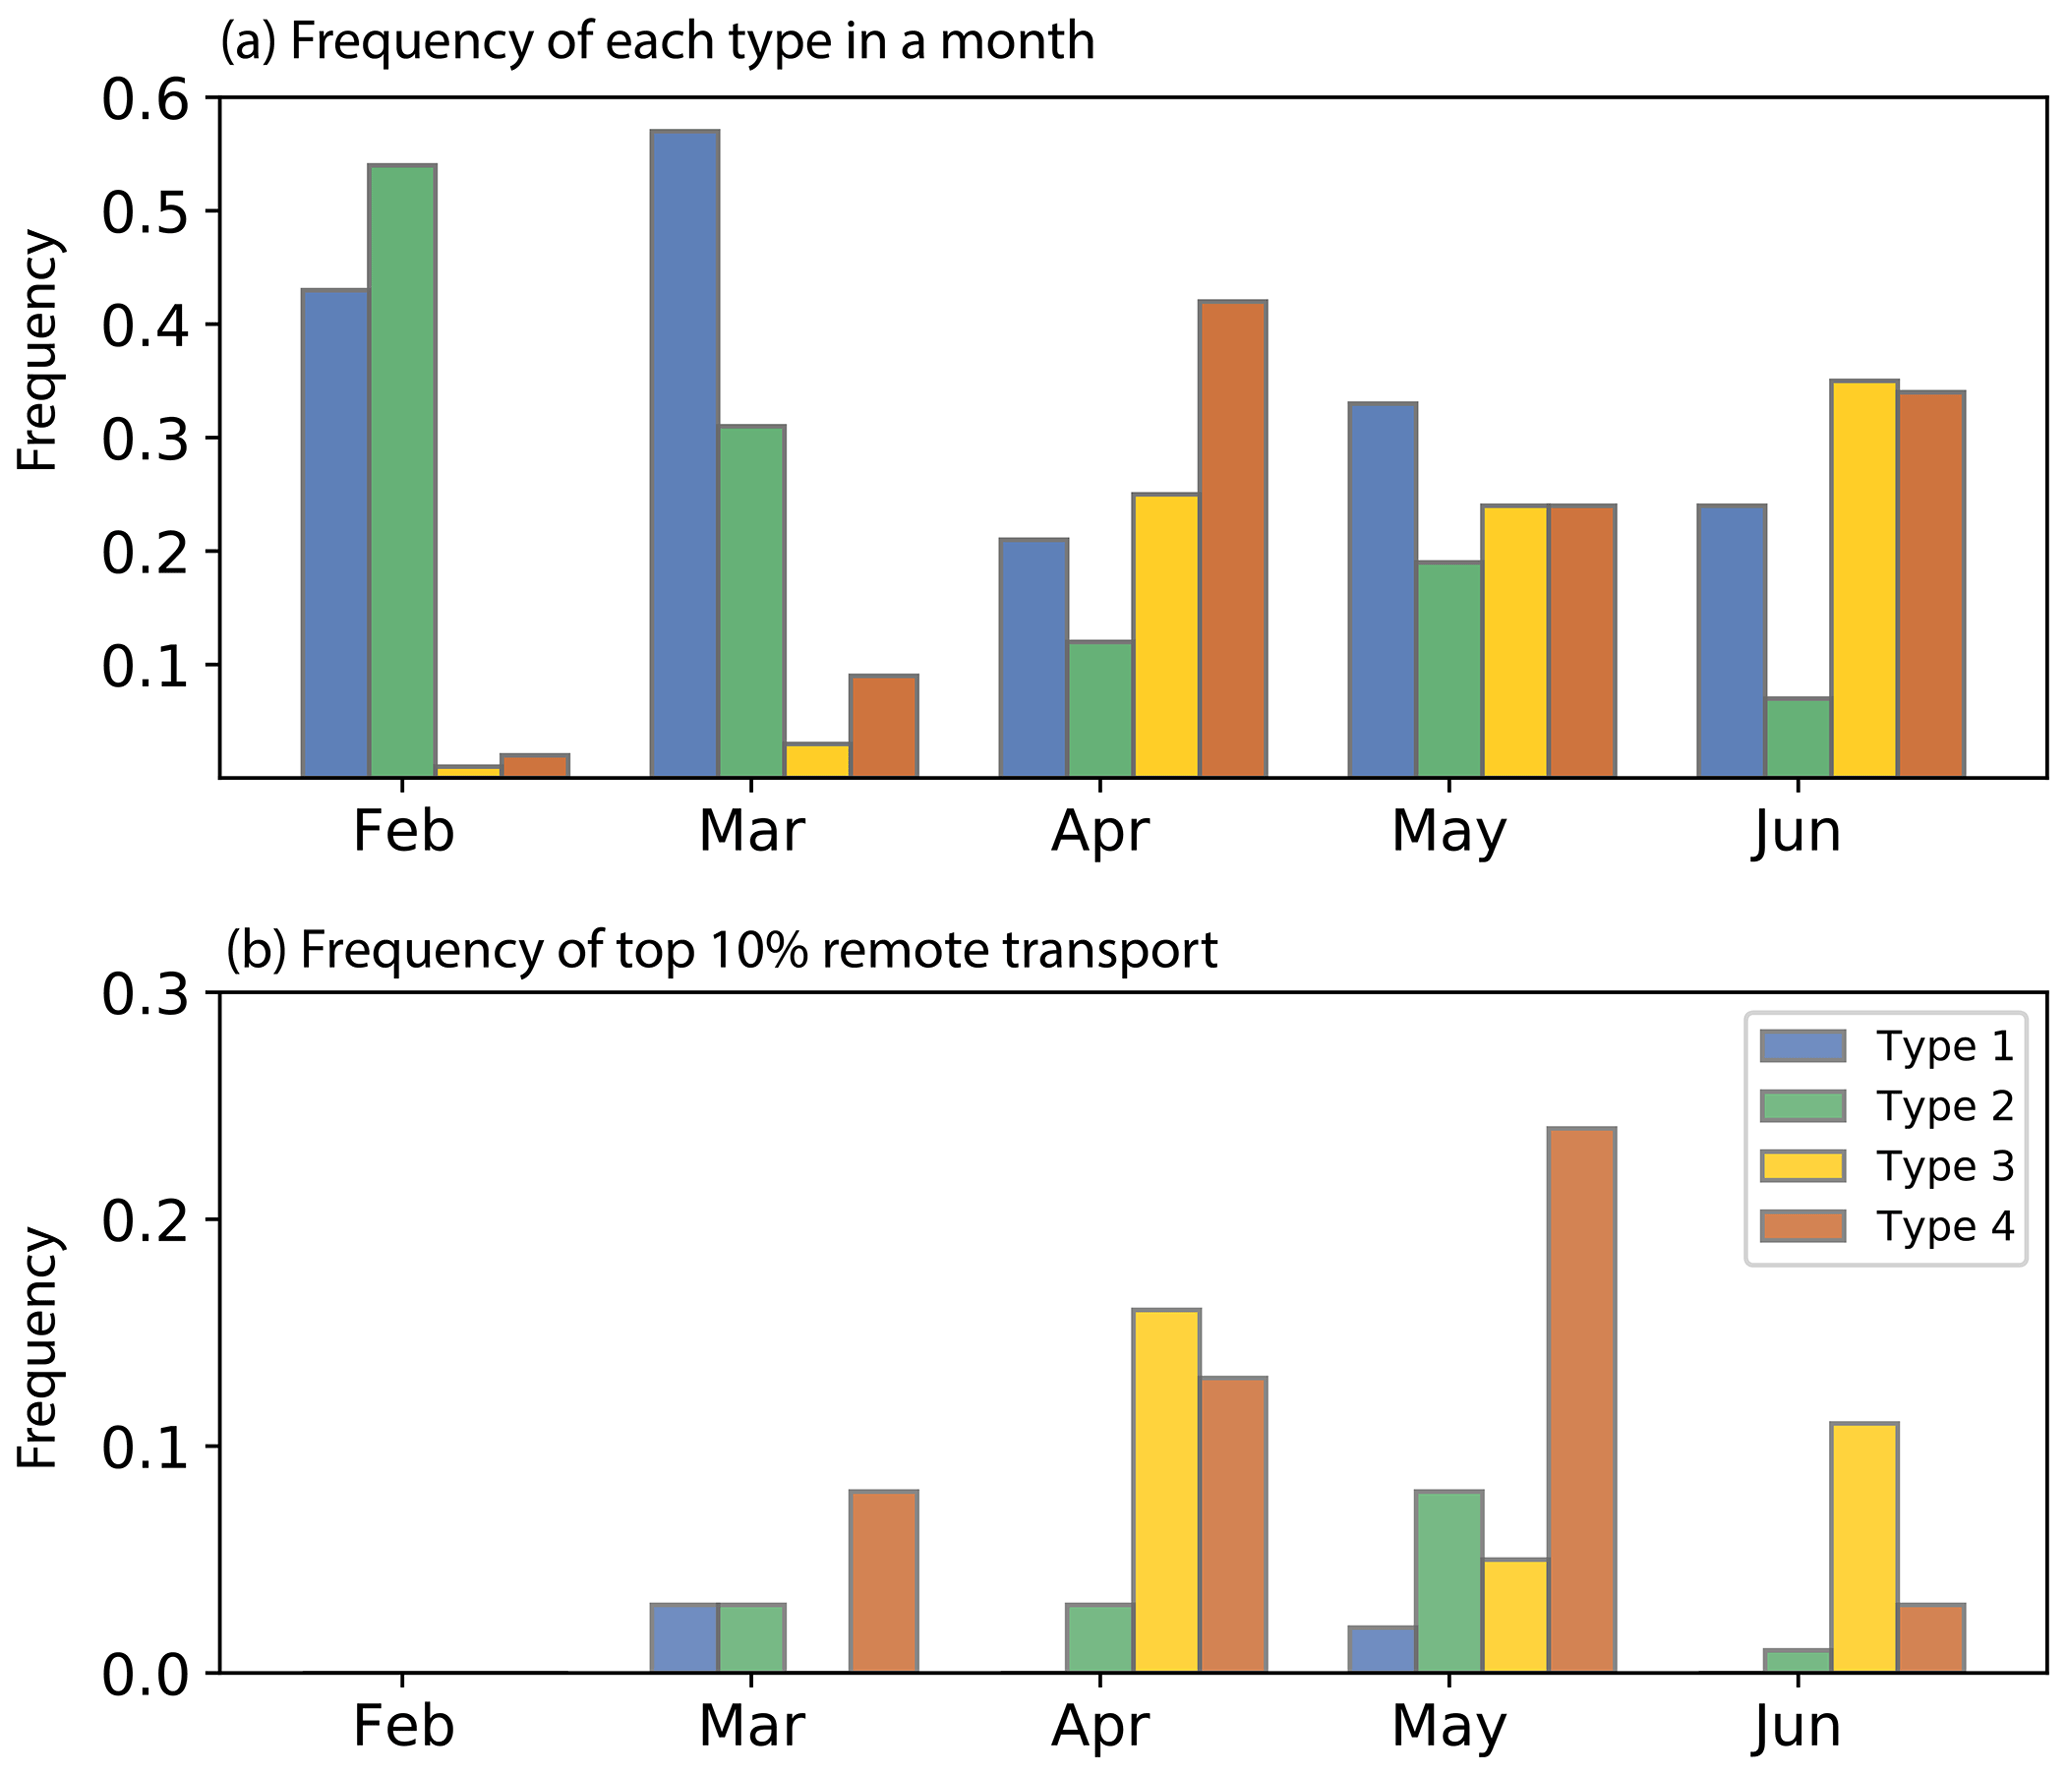
Figure 4(a) The frequency of each type (the time dominated by each type divided by total time in a month) that occurs in February, March, April, May, and June in WRF-Chem. (b) The frequency of each type in the top 10 % remote transport (the time dominated by each type divided by total time of the top 10 % remote transport).
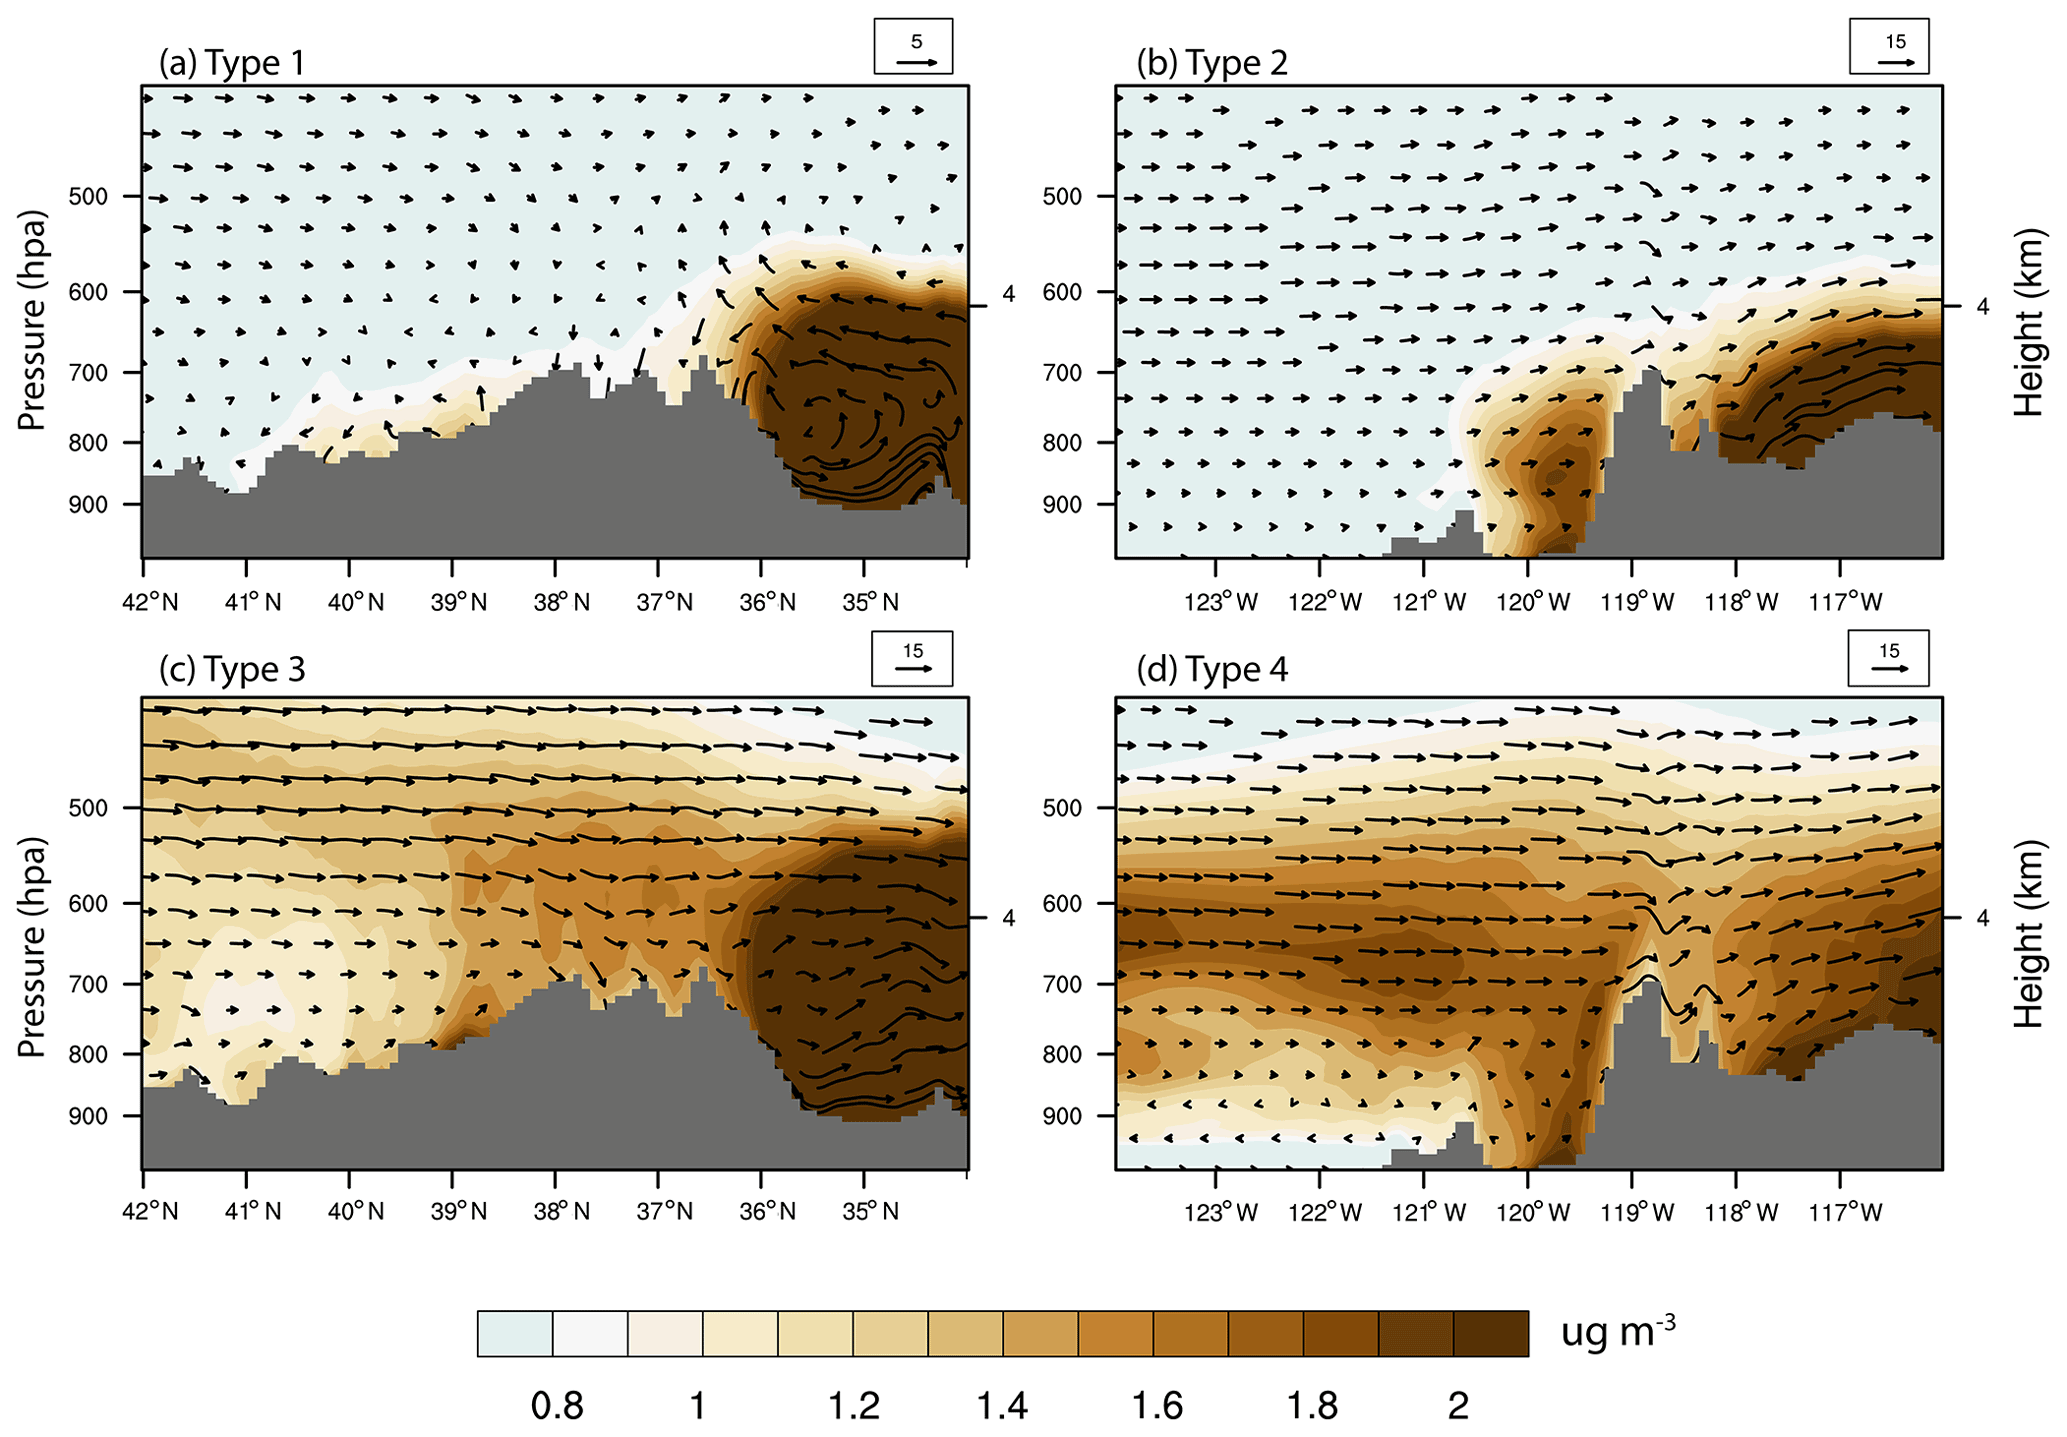
Figure 5Cross-section of dust concentration (shaded; ug m−3) and dust transport fluxes (vectors; µ m−2 s−1) at 1000–400 hPa for each SOM type in WRF-Chem. The position of each cross-section is denoted in Fig. 3b (type 1), d (type 2), f (type 3), and h (type 4). The grey area indicates the topography of the Sierra Nevada.
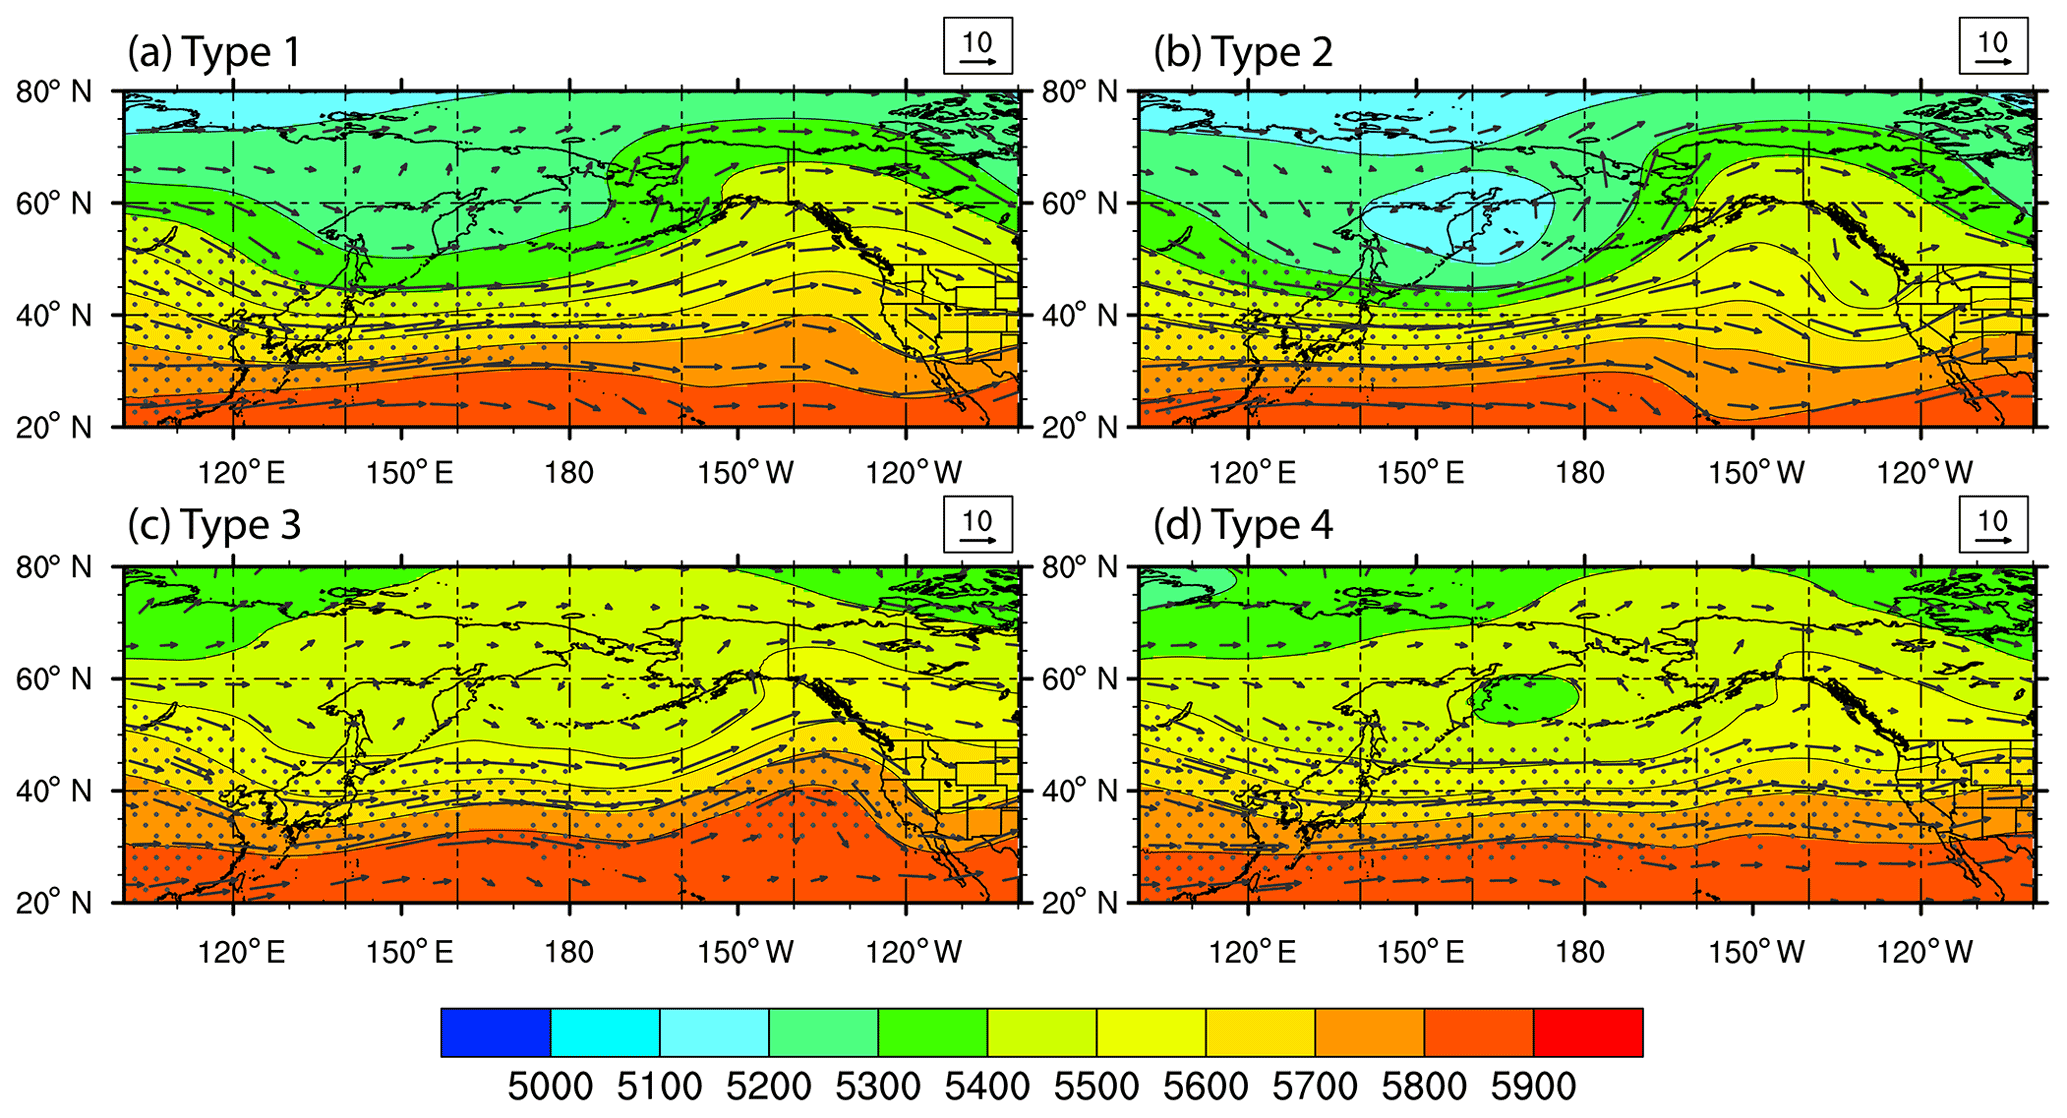
Figure 6Geopotential height (gpm) and wind vectors (m s−1) at 500 hPa in each of the four SOM types in WRF-Chem. The dotted regions indicate DOD higher than 0.03 from MERRA-2.
We validate the features of type 1 from WRF-Chem using satellite-retrieved DOD and wind vectors from ERA5. The cloud contamination results in many missing satellite pixels in our study domain, making the transport patterns hard to discern on a single day. DOD and winds belonging to the same SOM type on consecutive days are averaged to maximize the data completeness. One typical example for each type is presented based on their representativeness and the maximum spatial coverage. Figure 7a–b present dust emission and transport patterns during 10–12 May, a typical case for MSR transport. In IASI, we find peak IR DOD (>0.2) over the Mojave Desert and the southern Central Valley and moderate values in the Sacramento Basin related to the Schultz eddy (Fig. 5a), resembling the relative magnitude of dust concentrations in regional source regions in WRF-Chem (Fig. 3a). MIDAS shows another evidence of dust transport pathways within the Central Valley with a higher resolution, although the maximum DOD shifts slightly towards the mountain range (Fig. 7b). Dust emissions from the Great Basin are weaker than those from the southern Central Valley.
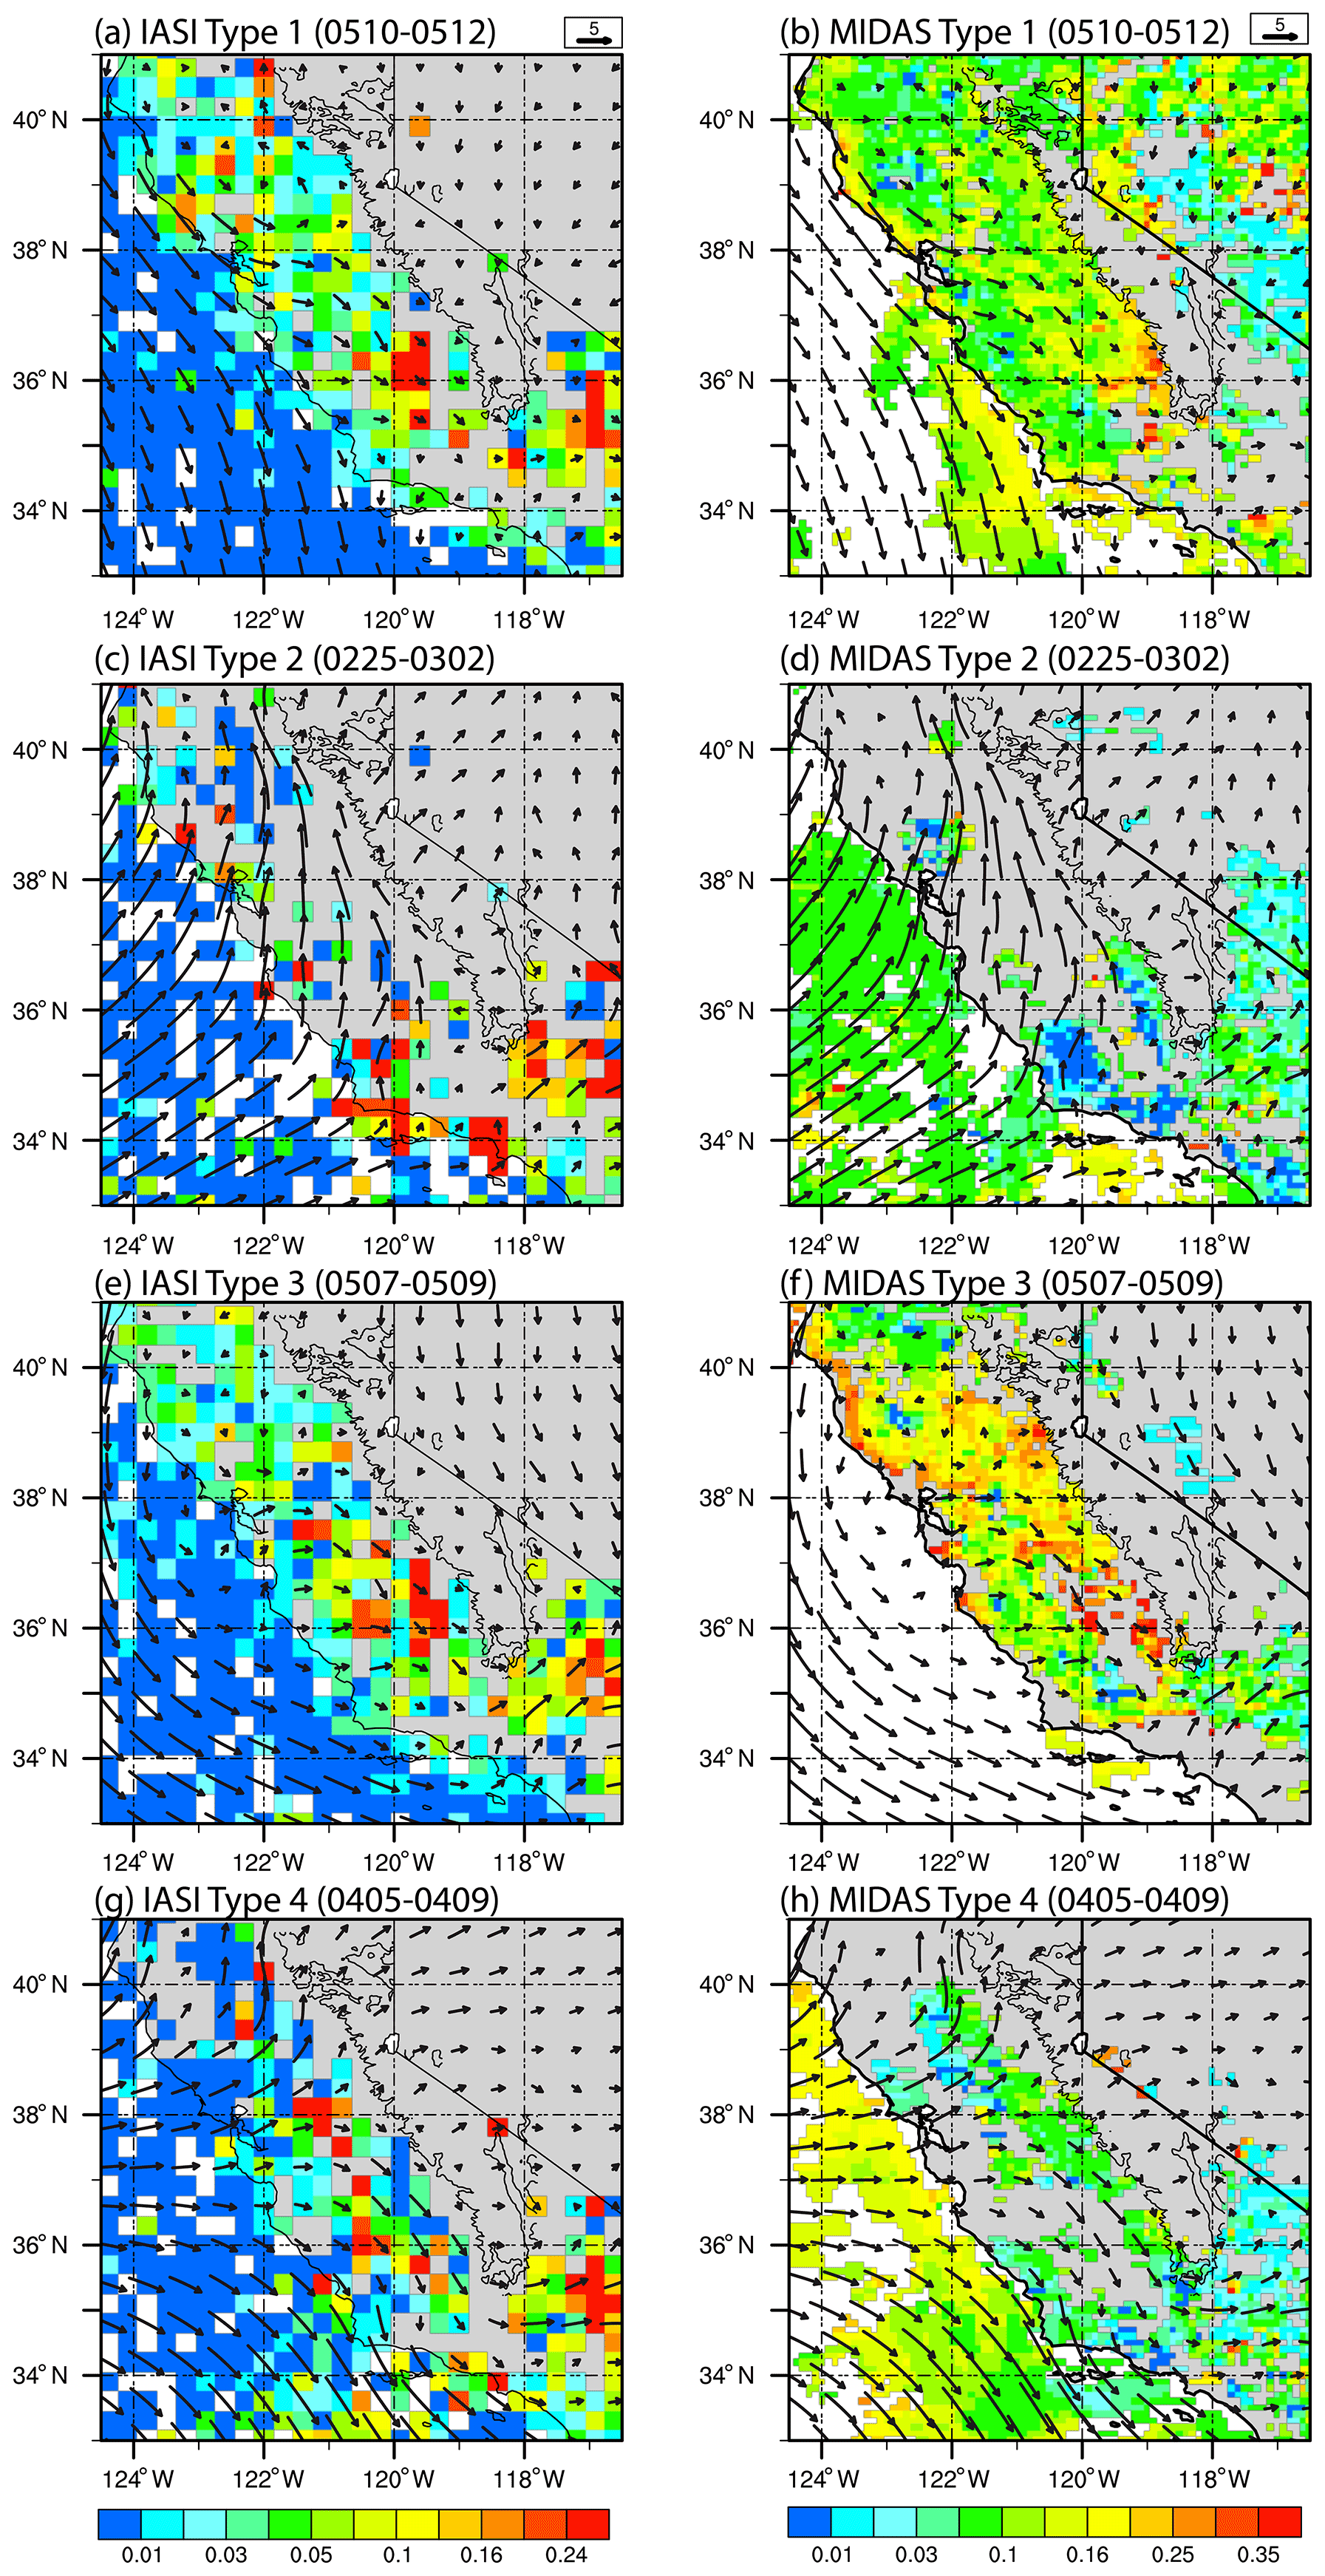
Figure 7(a, c, e, g) IR DOD at the wavelength of 10 µm retrieved from IASI and (b, d, f, h) visible DOD at the wavelength of 550 µm from MIDAS for each type. The low-level winds (vectors; m s−1) are obtained from the ERA5 reanalyses. The numbers in the parentheses indicate the event time period for the year 2019.
3.2.2 Sierra-barrier-jet-related (SBJ-related) transport
In type 2, the low-level winds turn to the north above the western slope of the Sierra Nevada (Fig. 3c), which resembles the terrain-locked Sierra barrier jets (SBJs) typically observed during the presence of ARs (Neiman et al., 2013). The large-scale pattern consists of a low 500 hPa geopotential height (GPH) center in the North Pacific (Fig. 6b). The meridional gradient produces intense storm tracks from the Kuroshio Current towards Alaska (Rodionov et al., 2007). Indeed, we find extensive precipitation in type 2 (not shown), which produces more wet deposition along the mountain's windward (west- and south-facing) slopes and result in cleaner air in the Central Valley (Fig. 3c). The dust layer at the Central Valley is found below 700 hPa, mostly blocked by the high mountain peaks, and is hardly transported to the lee-side (east) slope of the mountain (Fig. 5b), despite the cross-barrier westerlies found in the middle level. Dominated by SBJs, dust generated in the Great Basin and the Mojave Desert is blown away from the mountain. No clear signal of remote transport is found on the California coast (Fig. 3d). The dust transport from all sources is closely connected to SBJ; therefore, type 2 is referred to as the “SBJ-related transport”. In both IASI and MIDAS, we find more missing pixels for SBJ-related transport than any other type caused by cloud contamination (Fig. 7c–d). The AR-related landfalling precipitation from 25 February to 2 March removes the airborne dust particles. A cleaner atmosphere might be induced, but it is hard to confirm considering the missing pixels over the continent.
3.2.3 North Pacific High-related (NPH-related) transport
Type 3 has northwestern winds in both Central Valley and the Great Basin (Fig. 3e), transporting Central Valley dust to the southwest part of the Sierra Nevada in early summer. It is known as the “North Pacific High-related (NPH-related) transport”, during which the North Pacific High (NPH) built up in the north Pacific 130∘ W produces the northwest–southeast wind direction along the California coast (Fig. 6c), influencing the transport patterns for dust emitted from the surrounding sources. At the middle level, we observe a meridional mid-level dust transport pathway (Fig. 3f), which appears at 400–500 hPa in the northern Sierra Nevada and descends to 700 hPa at 36–37∘ N, the top of the southern Sierra Nevada (Fig. 5c). The MERRA-2 reanalysis DOD (Fig. 6c) further shows that dust originating from Asia is transported towards North America following the isobars and wind patterns (discussed further in Sect. 3.2.3). The dust emitted from the Great Basin is transported by the southward winds to the east slope of the mountains, while emissions from the Mojave Desert are transported away from the mountain range.
The simulated dust concentration and transport in the NPH-related transport are confirmed by DOD observations during 7–9 May, with the transport pathway parallel to the California coast (Fig. 7e–f). Studies have shown two main pathways of Asian dust transport to North America during the spring months: (1) meridional excursions north into Alaska and then south along the US west coast and (2) zonal transport over the North Pacific Ocean (Creamean et al., 2014). With north–south dust transport at the middle level, the NPH-related transport characterizes the first pathway. To examine this hypothesis, we averaged the IR DOD and 500 hPa wind field over the North Pacific during 2–9 May. We included a few days before the event (Fig. 8a) as it takes 7–10 d for dust to be transported from Asia to North America (Ault et al., 2011; Creamean et al., 2013). The dust transport pathway shows that after being emitted from East Asia and the Gobi Desert, dust is transported zonally to 150∘ W, excursing north into Alaska/Canada and then traveling south along the US west coast. Similar conclusions can be drawn with more evident pathways using DOD from MERRA-2 reanalyses (Fig. 8e). An elevated dust belt from 8 to 12 km is discerned over the North American coast (27 to 60∘ N) from the CALIOP data, denoting the north–south transport of a thin dust layer through the middle level (Fig. 8c).
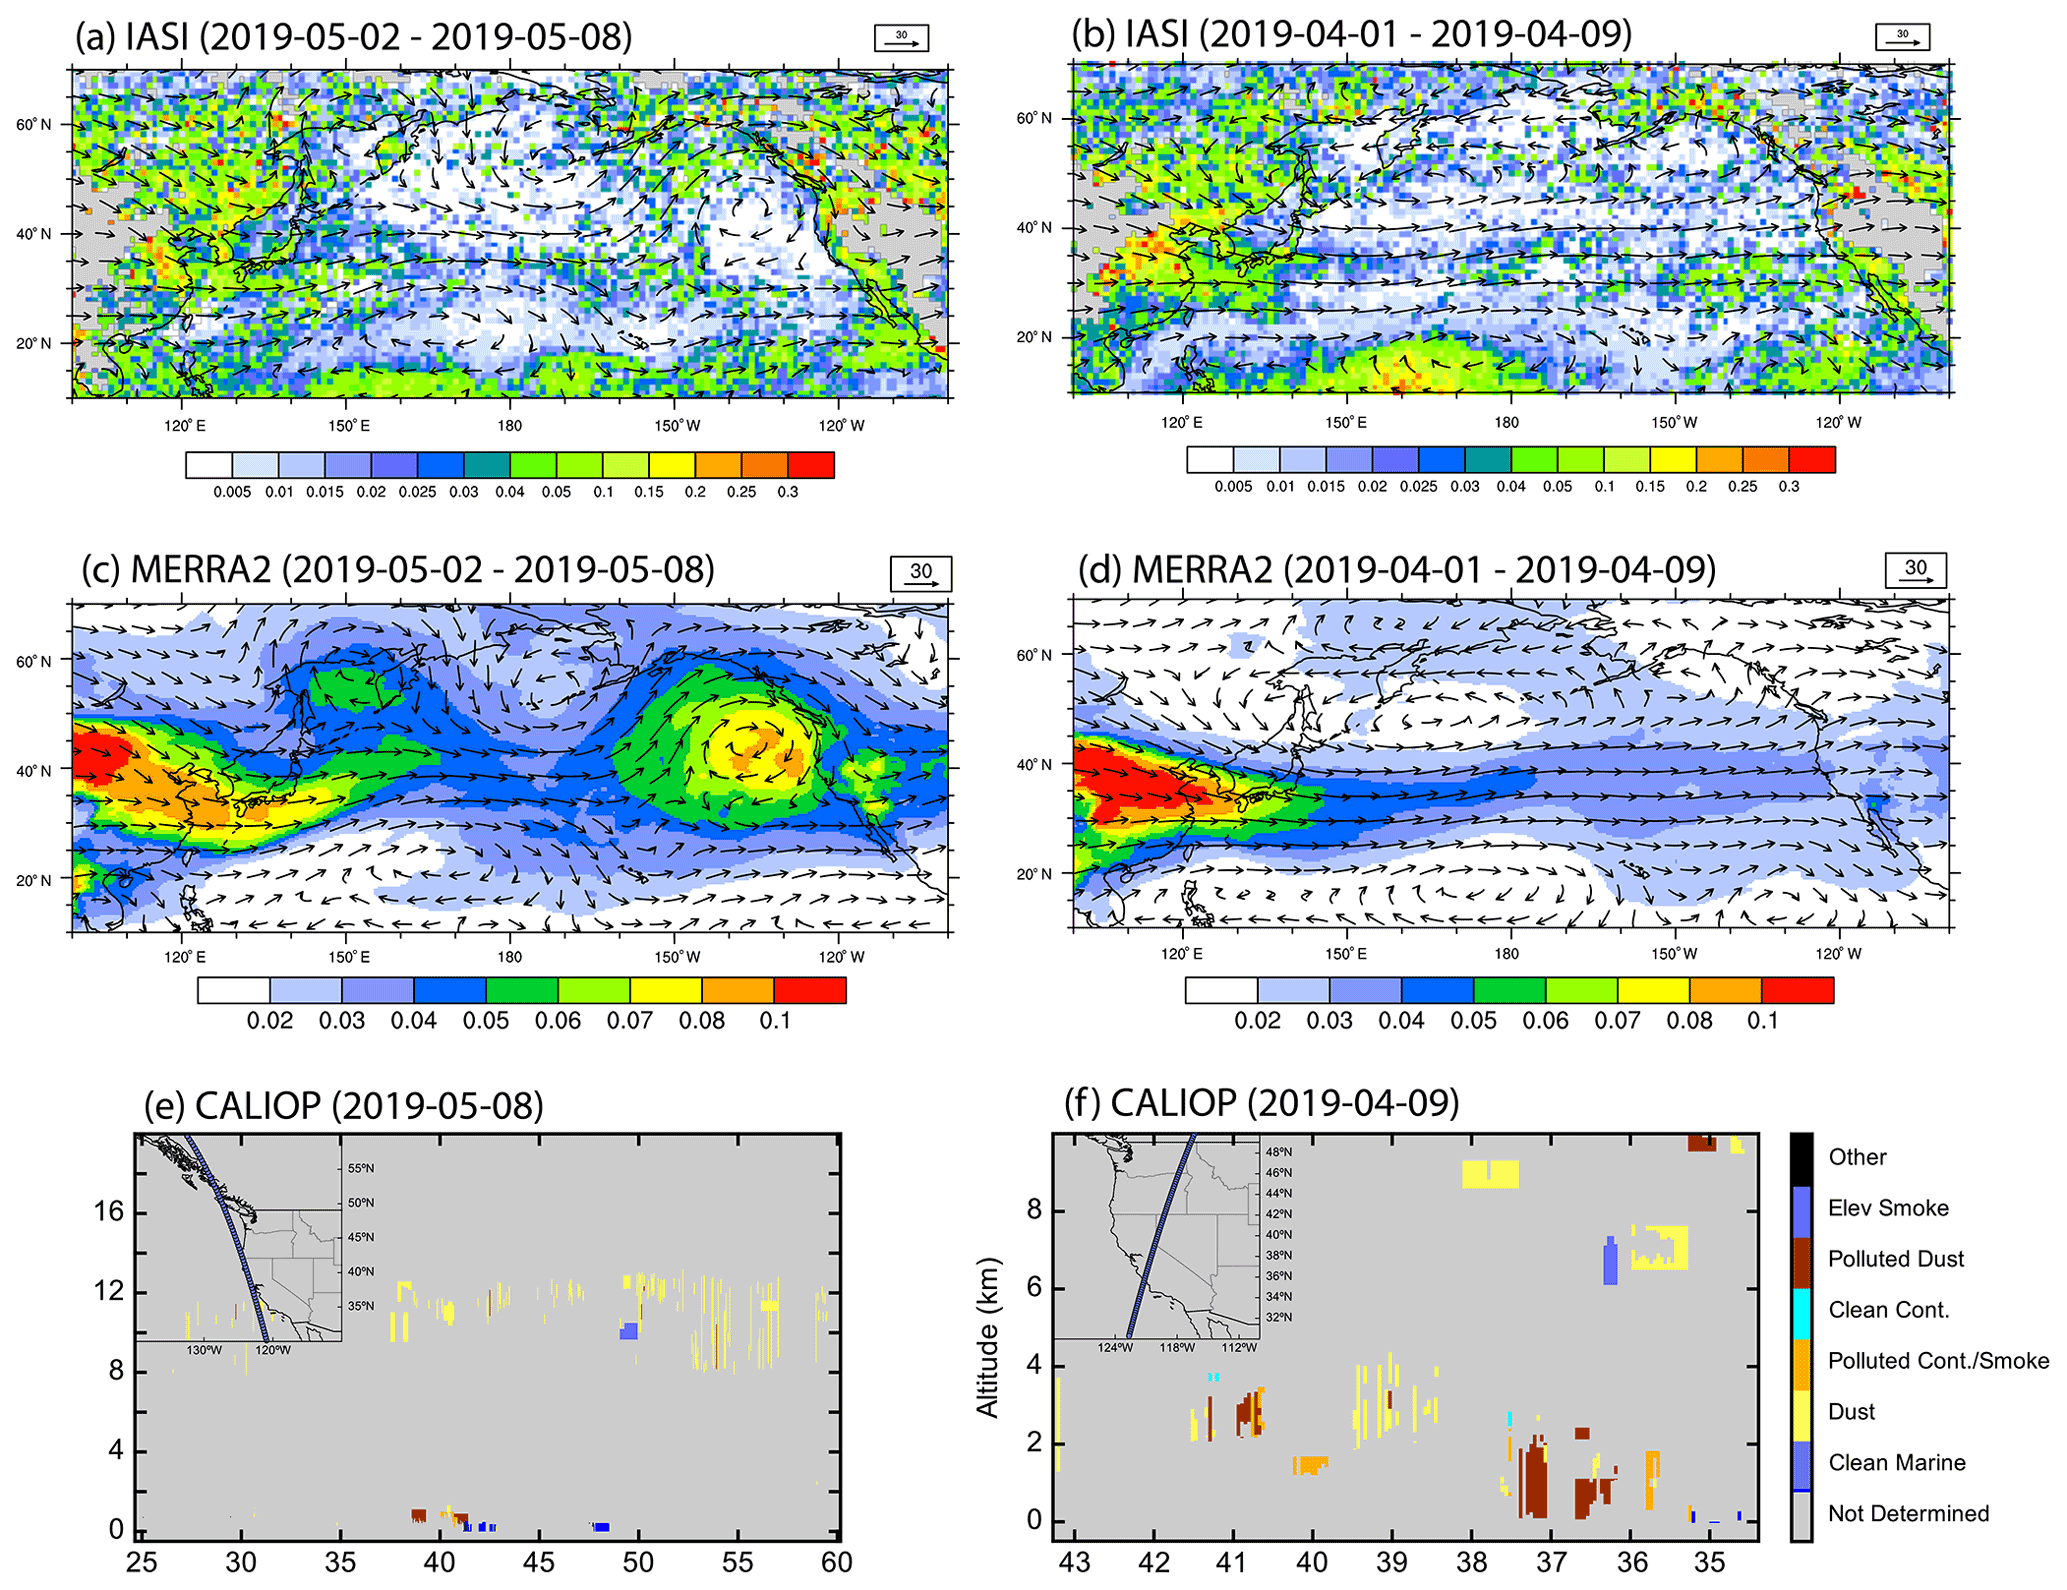
Figure 8(a) IR DOD from IASI and 500 hPa winds (m s−1) from ERA5 over the North Pacific for a typical type 3 case averaged between 2 May 2019 and 8 May 2019. (b) Same as (a) but for a typical type 4 event averaged between 1 April 2019 to 9 May 2019. (c) DOD from MERRA-2 and 500 hPa winds (m s−1) from ERA5 for a type 3 event. (d) Same as (c) but for a type 4 event. (e) Latitude–height cross-section of aerosol species from CALIOP on 8 May 2019 (type 3). (f) Same as (e) but for a typical type 4 case on 9 April 2019.
3.2.4 Cross-Pacific zonal (CPZ) transport
Air inflows from the ocean enter California and diverge to the northern and southern branches in type 4, transporting dust eastward across the Sierra Nevada (Fig. 3g). At the middle level, the low-GPH center recedes in April, and the isobars become straighter than in boreal winter, which facilitates the zonal transport of dust emitted from middle Asia over the North Pacific Ocean (Fig. 6d). The cross-section further shows that an elevated dust layer is transported from the ocean at around 700–500 hPa (Fig. 5d). The concentrations are much stronger and the altitude also lower than the NPH-related transport (Fig. 5c). The remotely transported dust descends to low altitudes when reaching the California coast and converges with the dust from the Central Valley at around 800 hPa. A portion of dust is compacted to the windward slopes at higher elevations, and the remaining across the mountains affects the east slope. Dust emitted from the Great Basin and the Mojave Desert is transported away from the mountains. Type 4 is denoted “cross-Pacific zonal (CPZ) transport” to reflect the strong cross-Pacific dust transport.
The period of 5–9 April, a typical case for the CPZ transport, clearly shows the north and south branches of dust transport over the Central Valley (Fig. 7g–h). Different from the NPH-related transport pathway, the large-scale DOD and winds at 500 hPa (averaged over 1–9 April) show that dust emitted from East Asia is being transported eastward, with a belt of IR DOD >0.1 evident around 25–40∘ N (Fig. 8b). The DOD from MERRA-2 confirms the zonal pathways of dust transport with a smaller magnitude (Fig. 8d). The vertical distribution shows an elevated dust layer at 2–4 km above ground level, reaching the higher elevation of the mountain (Fig. 8f).
We calculated the mid-level dust remote transport, defined as the dust influxes from the north and west boundaries of the 200–700 hPa of WRF-Chem modeling domain 1, and investigated how the top 10 % largest remote transport distribute in each SOM (Fig. 4b). Among all the large remote transport, CPZ transport accounts for 48 %, while NPH-related transport accounts for 32 %, indicating that the zonal pathway plays a more important role in the cross-Pacific transport. Most remote transport is found in April and May, the former dominated by the meridional transport in the existence of the NPH, while the latter is led by the CPZ transport. The remaining two types contribute to a fairly small portion, consistent with the clean atmosphere in the middle levels (Fig. 3b, d).
3.2.5 Dust emissions and transport in back-trajectory analyses
We discern four types of dust transport patterns across the Sierra Nevada using the SOM clustering method. MSR transport represents the local dust transport, which contributes to more than 20 % of the time each month during February–June (Fig. 4a) in the absence of prevailing weather systems. The SBJ-related air inflows transport dust eastward and are closely related to the AR, during which the GPH and storm tracks at 500 hPa feature a typical large-scale pattern during the boreal winter (Rodionov et al., 2007). As time evolves, the GPH center recedes, and the isobars become more straight zonally in April, bringing dust from Asia and Africa to the western US coast (CPZ transport). In early summer, the buildup of NPH in the east Pacific corresponds to north–south winds along the California coast, transporting dust along the Sierra Nevada (NPH-related transport).
We further conducted air mass back-trajectory (AMBT) simulations to evaluate the dust emission sources and transport pathways identified using SOM analyses. The back-trajectory simulation was conducted using the Hybrid Single-Particle Lagrangian Integrated Trajectory (HYSPLIT) model with meteorological forcings from the North American Mesoscale Forecast System. We selected typical days for the four SOM types as in Fig. 7 and three sites located at the central Sierra Nevada (38∘ N, 120.3∘ W), southern Sierra Nevada (36.5∘ N, 119∘ W), and eastern Sierra Nevada (37∘ N, 117∘ W), to represent dust deposition at different subregions.
The 12 h and 7 d AMBT results corroborate the identified local and long-range transport pathways for each type. The transport pathways generally follow the wind directions shown in Fig. 7. Multiple emission source regions are found in type 1, including the Central Valley where dust is transported eastward to the windward slopes and the Great Basin where dust is transported westward to the lee-side slopes (Fig. S2). In type 2, dust deposited in all three sites comes from the Central Valley (Fig. S2), and the transport corresponds to the direction of SBJ during the AR (Fig. 7c). Types 3 and 4 are affected by both local and remote transport. Locally, dust mainly comes from northern California and the Great Basin in type 3, while it comes from the Central Valley in type 4. Remotely, in type 3, we find dust emitted from Asia and North Africa excurses meridionally to Alaska at 135∘ W and then travels southward along the US west coast (Fig. S3a). In contrast, dust emitted from East Asia is transported zonally across the Pacific, reaching the Sierra Nevada from the west (Fig. S3b).
3.3 Dust deposition over the Sierra Nevada
The averaged dust deposition and low-level dust transport for each type are shown in Fig. 9, including both dry and wet depositions. The dry depositions consider the diffusion and gravitational effects, while wet depositions describe in-cloud removal (rainout) and below-cloud removal (washout) by grid-resolved stratiform precipitation as well as the sub-grid wet scavenging (Chapman et al., 2009; Easter et al., 2004). In all SOM types, extensive depositions are found on the west slope in all types, generally decreasing with elevation.
MSR transport has the smallest deposition among the four types (Fig. 9a). Large depositions are found in the southern Sierra Nevada and Lake Tahoe. Dust contributing to the deposition mainly originates from the Mojave Desert and the Great Basin dryland. In contrast, large depositions found in the southern and eastern parts of the mountains in NPH-related transport may be produced in agricultural land from the southern Central Valley, as we find a persistent eastward transport pathway in the low level (Fig. 9c). The remote transported dust plays a minor role as it is located above 8 km in altitude.
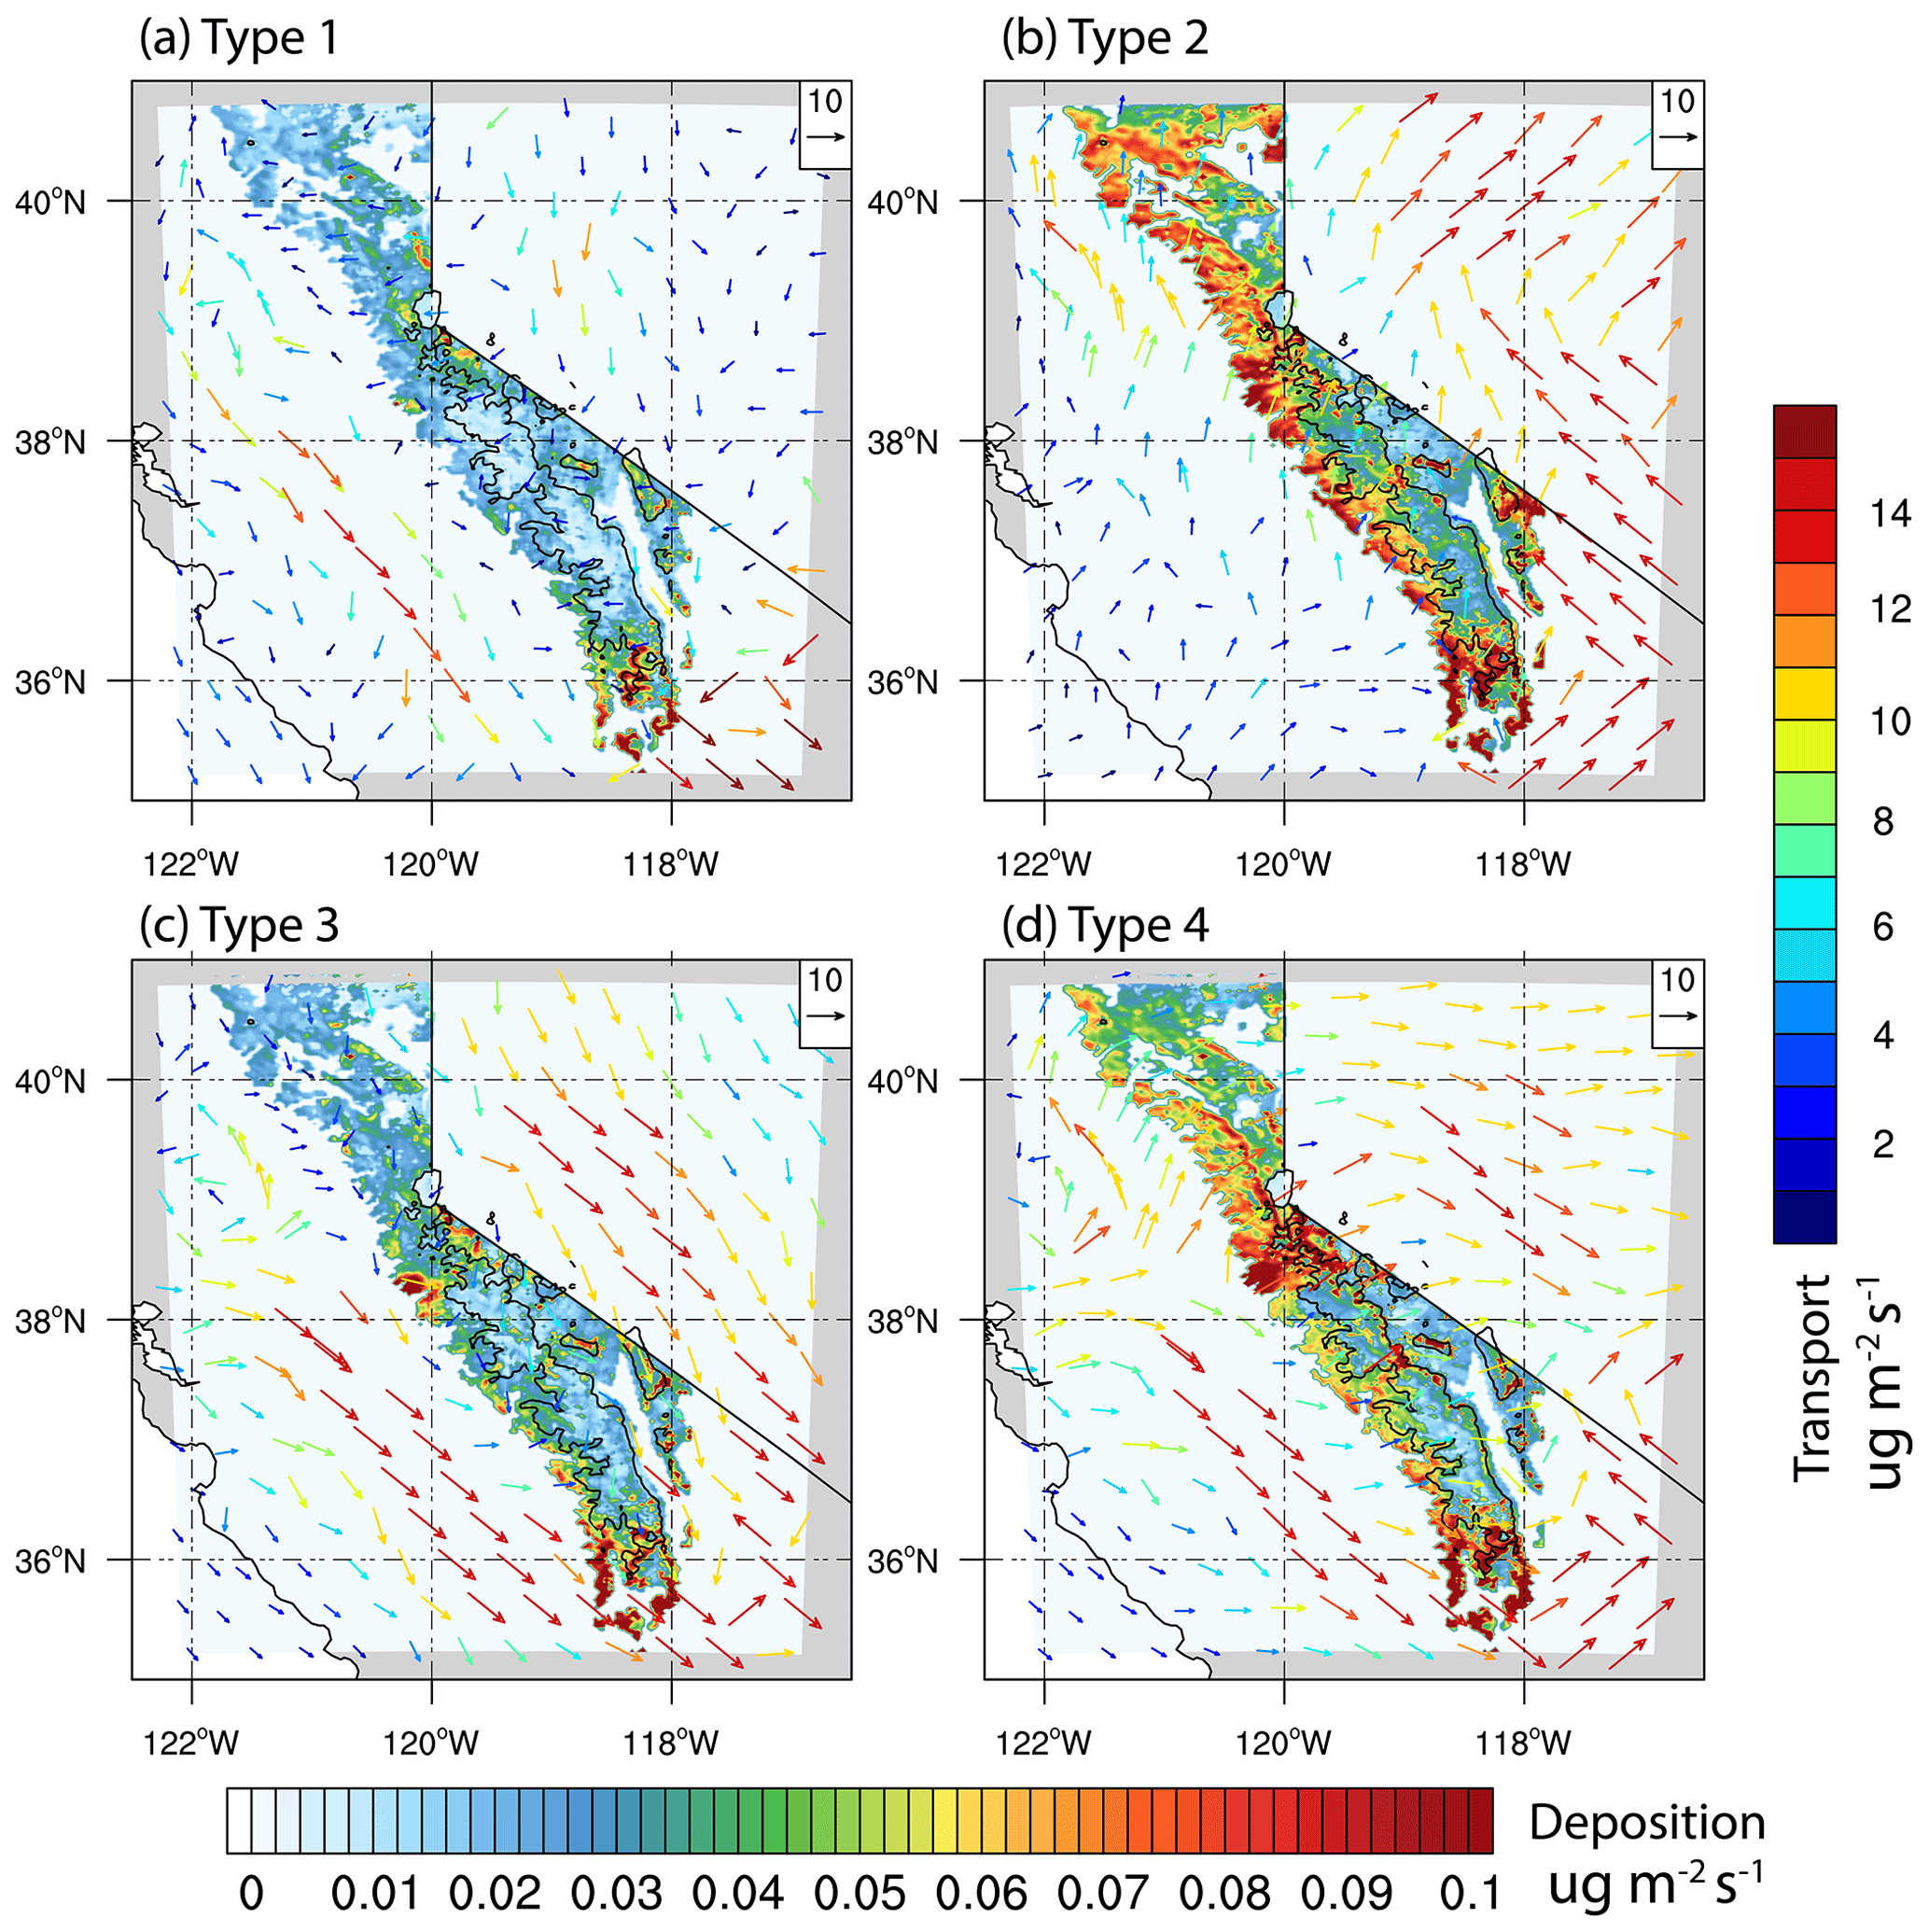
Figure 9(a–d) Dust deposition (shaded; µ m−2 s−1) over the Sierra Nevada and low-level dust transport fluxes (colored vectors; µ m−2 s−1) across the Sierra Nevada averaged over each of the four SOM types in WRF-Chem. Black contours indicate an elevation of 2500 m. The bottom color bar shows the magnitude of dust deposition over the Sierra Nevada, while the right color bar shows the magnitude of dust transport flux vectors.
While SBJ-related transport has the lowest low-level dust concentration over the Central Valley, it produces the largest deposition along the west slope (Fig. 9b). Most eastward transport in the southern Sierra Nevada is obstructed by the high mountain peaks, resulting in large depositions below 2900 m. The SBJ turns eastward in the Sacramento basin and climbs through the mountain north of 38∘ N, producing a relatively homogenous deposition in the northern part. The combination of dust transport and deposition indicates that dust influencing the mountain snow impurities mostly comes from the Central Valley. Compared with the other SOM types, SBJ-related transport has large depositions at elevations higher than 2500 m (discuss later). Large depositions are also found in the CPZ transport (Fig. 9d), with the largest value occurring on the west slope of the central and southern Sierra Nevada, contributed by both Asian dust and Central Valley dust. Compared to MSR and NPH-related transport, the large-scale westerlies in the Central Valley (SBJ-related and cross-Pacific transport) produce larger deposition, probably because of the more efficient removal of particles by collision with terrestrial surfaces at higher elevations (Fig. 5d).
To quantify the relative importance of wet and dry depositions in each 3-hourly total deposition data, we calculate the fraction of wet depositions to total depositions averaged over the Sierra Nevada: . The contribution of dry deposition is defined in a similar way. We find that the wet deposition accounts for 40 % in frequency in the SBJ-related type. The landfalling precipitation has deposited large amounts of airborne dust on the snow surface, producing a cleaner atmosphere, as we have found in Fig. 3c. The frequent wet depositions also explain the larger depositions in high elevations (Fig. 9b): dust particles reaching the high mountains are small in size and difficult to deposit through gravitational effects. Wet deposition is a more efficient way of depositing small particles as they collect dust in raindrops. In contrast, dry depositions play predominant roles (more than 80 % in frequency) in all the other types (Fig. 10a). Figure 10b further shows the contribution of wet deposition increases with deposition intensity. The averaged contribution of wet depositions in magnitude increases from 19 % in all events to 29 % in the top 10 percentile, 36 % in the top 5 percentile, and 56 % in the top 1 percentile largest events, supporting our conclusion that wet deposition is a more efficient way of dust deposition.
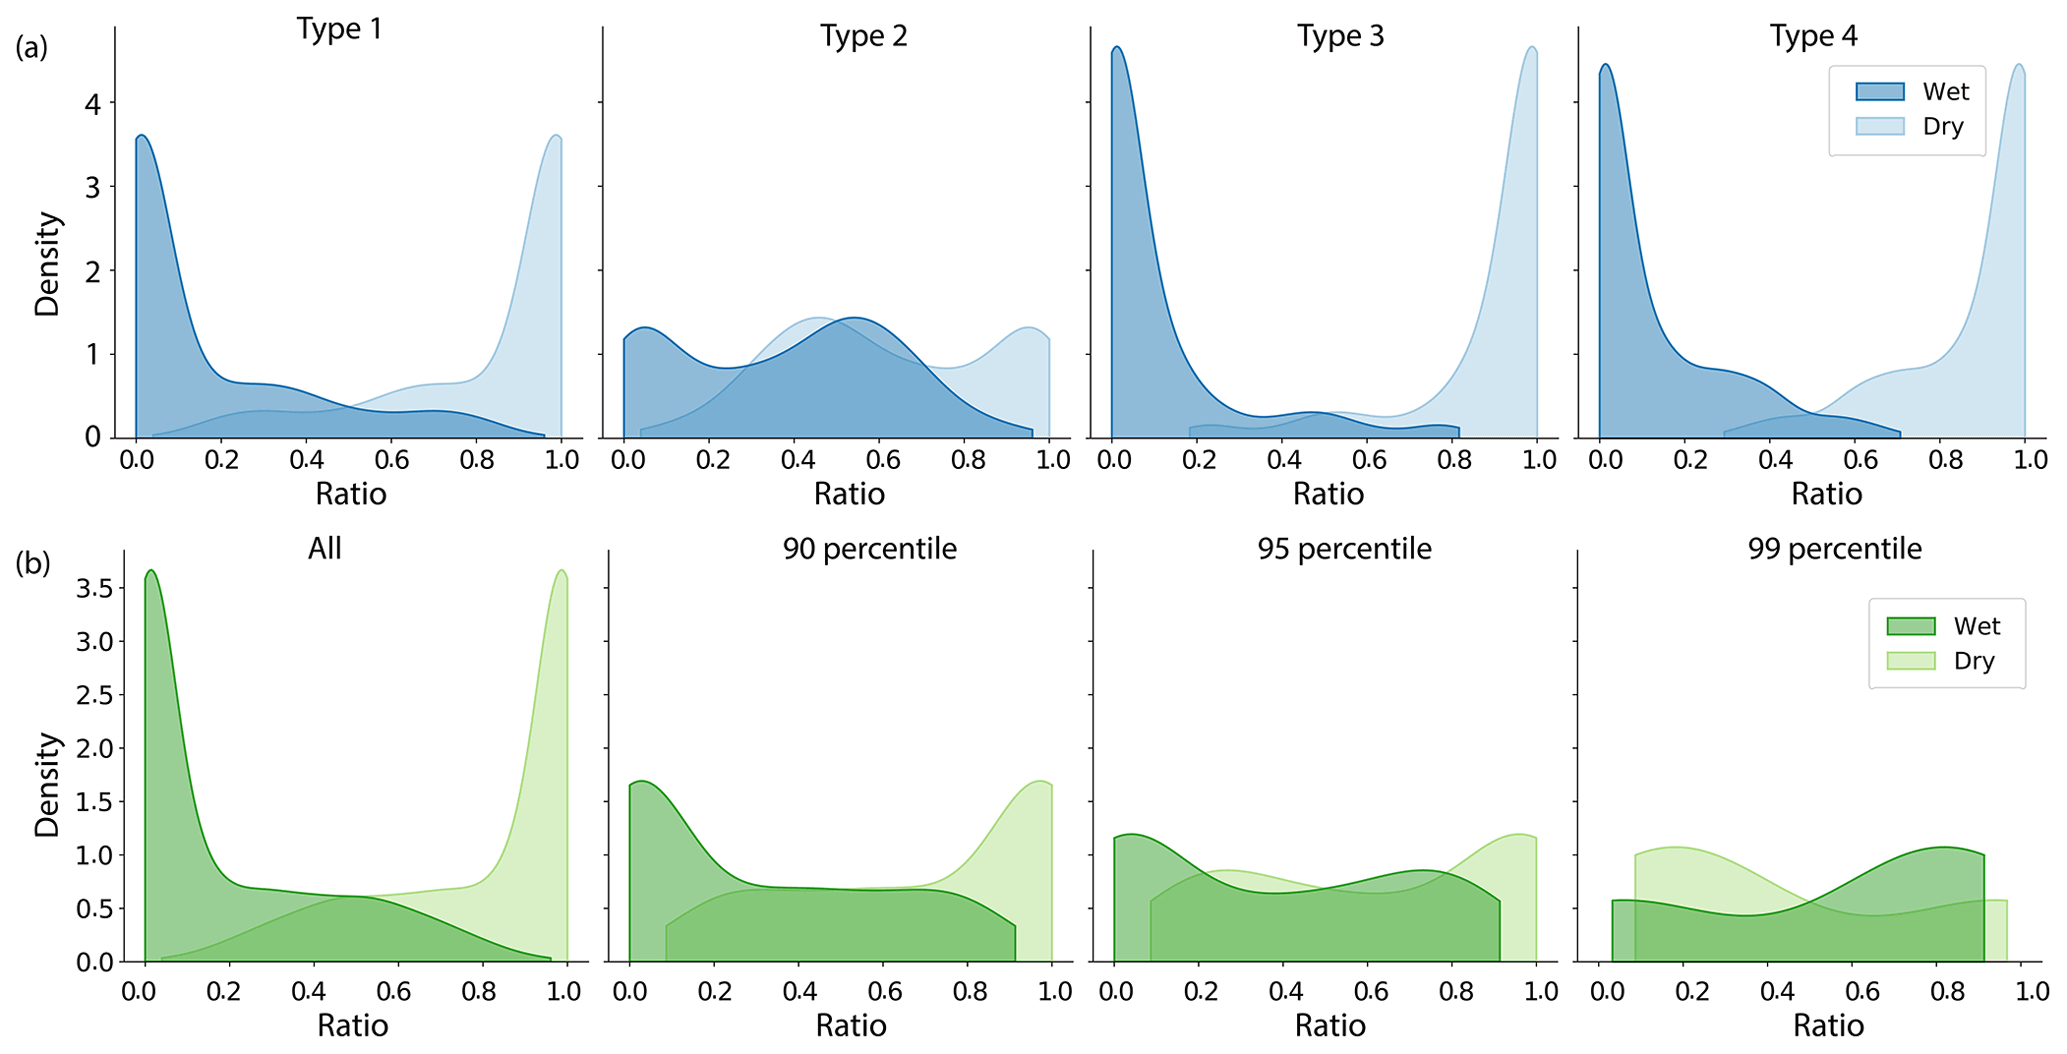
Figure 10(a) Distribution of contribution of wet and dry depositions to total deposition in each type in WRF-Chem. (b) Distribution of contribution of wet and dry depositions to total deposition for all depositions and depositions over the 90th, 95th, and 99th percentile.
3.4 Features of the dust transport in MERRA-2
We repeated the SOM analyses using 2019 MERRA-2 data to examine the WRF-Chem model performance and interannual variability. We conducted additional SOM analyses using 2001–2021 climatology MERRA-2 data to investigate the interannual variability of the transport patterns. The low-level and mid-level dust transport features identified in MERRA-2 (Figs. 11–12) are similar to their corresponding types in WRF-Chem (Fig. 3), with types 1, 2, 3, and 4 representing MSR, SBJ-related, NPH-related, and CPZ transport, respectively (Fig. 11). Additionally, north–south transport occurs in the middle layer in type 3 and west–east transport in type 4, despite the slight difference in the peak region (Fig. 12).
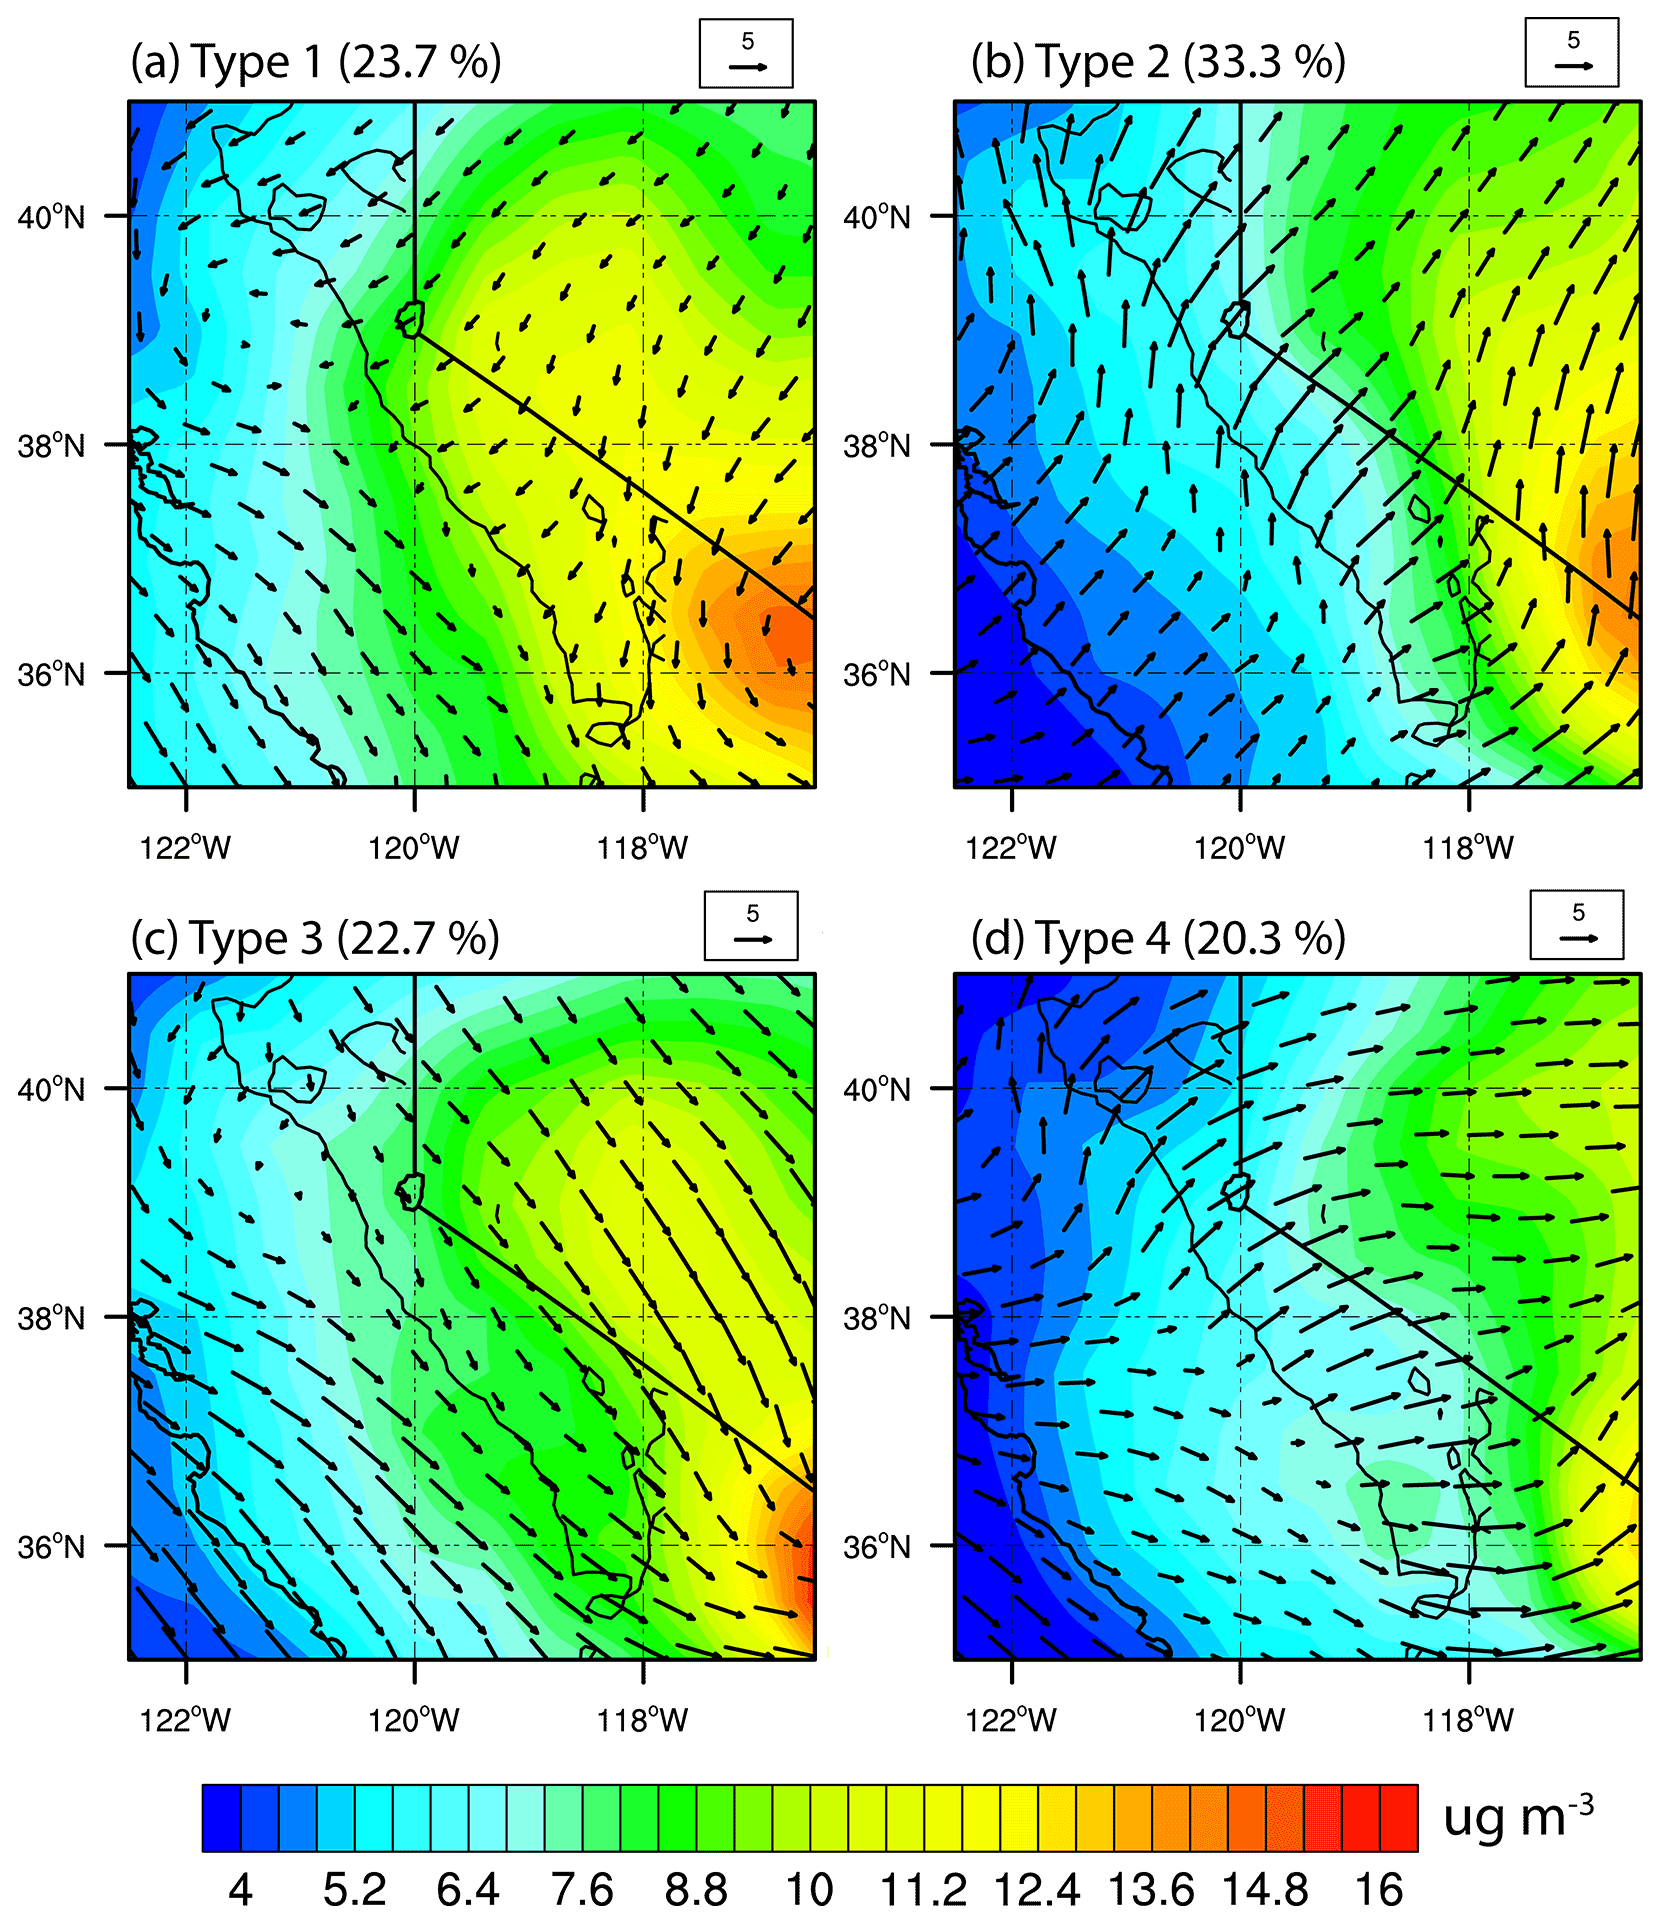
Figure 11Low-level dust concentration (ug m−3) and wind vectors (m s−1) in each of the four SOM types from MERRA-2 for the year 2019. The numbers above the panels denote the frequency of each type.
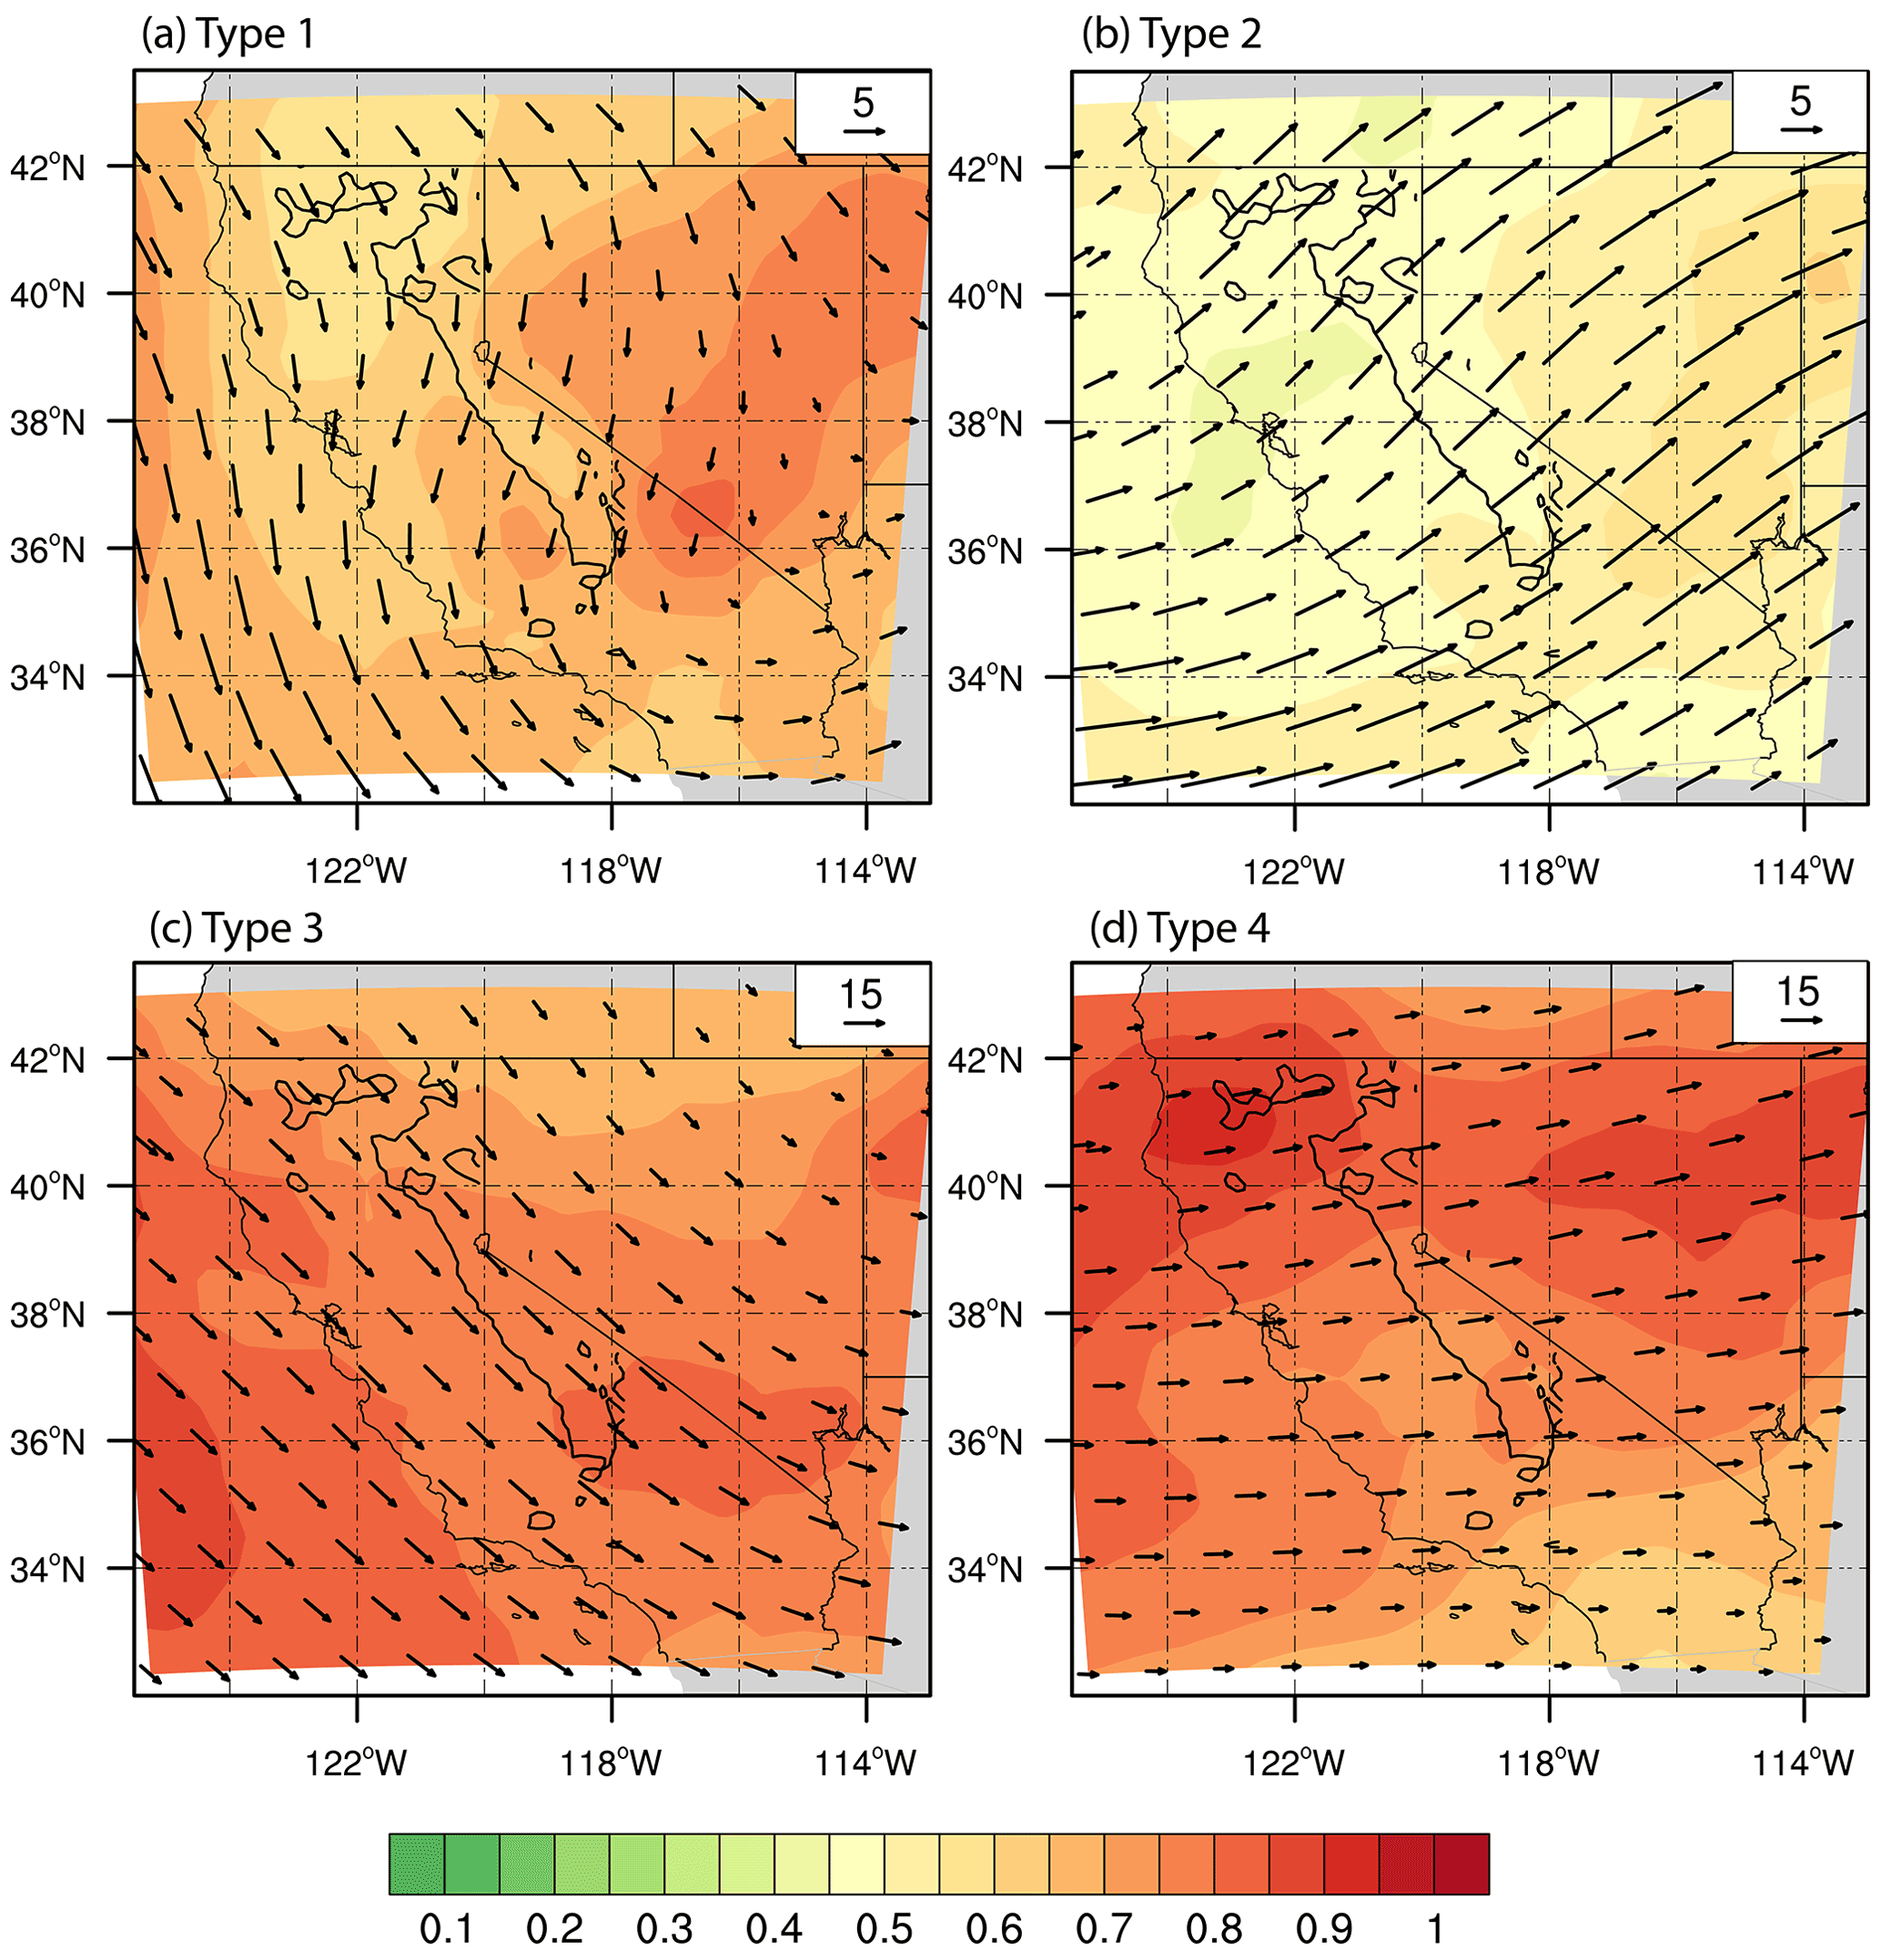
Figure 12Mid-level (200–700 hPa average) dust concentration (ug m−3) and dust transport fluxes (µ m−2 s−1) in each of the four SOM types from MERRA-2 for the year 2019.
The relative contribution of each transport type in MERRA-2 (SBJ-related > MSR > CPZ > NPH-related) is generally consistent with the results in WRF-Chem (MSR > SBJ-related > CPZ > NPH-related), except that MSR transport occurs less frequently in MERRA-2. The difference is largely caused by the spatial resolution of the two datasets. With a resolution of 0.5∘ × 0.625∘, MERRA-2 has smooth topography information and cannot resolve the high peaks of the Sierra Nevada, which produce the MSR winds and transport. Consequently, MSR transport contributes to a smaller fraction in the MERRA-2. The coarser-resolution MERRA-2 also produces a more homogeneous dust concentration at low levels than 2 km WRF-Chem.
Similar dust concentrations and transport patterns are found in the 21-year SOM analysis (Fig. 13), indicating that the four patterns identified in 2019 are representative of the climatological conditions. In climatology, the SBJ is weaker, and air inflows hit the California coast at a latitude further north (about 40∘ N; Fig. 13b), which is reasonable as 2019 is an El Niño year with a stronger AR reaching California further south than usual.
The changes in the transport patterns reflect the interannual variations of large-scale forcings and regional weather conditions, which are investigated using the frequency of each type in a year during 2001–2021 (Fig. S4). Types 1 and 4 have a negative correlation coefficient () in their frequency, indicating the competing impact between remote transport and local emissions on dust concentrations over the Sierra Nevada. In particular, type 4 tends to occur more frequently during La Niña years, while it occurs less frequently during El Niño years. An opposite conclusion can be drawn for type 1. We further examine the dust transport pattern and the frequency of the four SOM types during three La Niña (2008, 2011, and 2021) and three El Niño (2015, 2016, and 2019) years. We find that the La Niña years have larger dust concentrations than El Niño years in both lower levels and middle levels (Figs. S5–S8), due to suppressed precipitation and drier soil in the southwestern United States. Meanwhile, the frequencies of types 3 and 4 are higher in El Niño years, reflecting the increased contribution of cross-Pacific transport to dust loading over California. The increase of remote transport weakens the relative importance of local emissions, decreasing the frequency of type 1.

Figure 13Low-level dust concentration (ug m−3) and wind vectors (m s−1) in each of the four SOM types from MERRA-2 averaged over 2001–2021. The numbers on the top right of panels denote the frequency of each type.
With a focus on the dust that influences mountain snow, we investigated the dust sources surrounding the Sierra Nevada and their typical transport patterns during the spring and early summer. Despite the strongest emissions from the Mojave Desert, dust is only transported northward to the mountain when the mesoscale weather pattern dominates the southwest United States (Fig. 14). During 64.25 % of our study period, dust from the Mojave Desert is transported away from the mountains. Dust emitted from the Great Basin is transported to the central Sierra Nevada during MSR transport and to the eastern part when the NPH builds in the eastern Pacific. It is blown eastward by air inflows from the ocean during SBJ or cross-Pacific transport. In contrast, dust produced by the Central Valley is persistently transported to the west mountain slope, playing an essential role in snow impurities there. Carried by intense air inflows, it can be transported to the lee side of the Sierra Nevada.
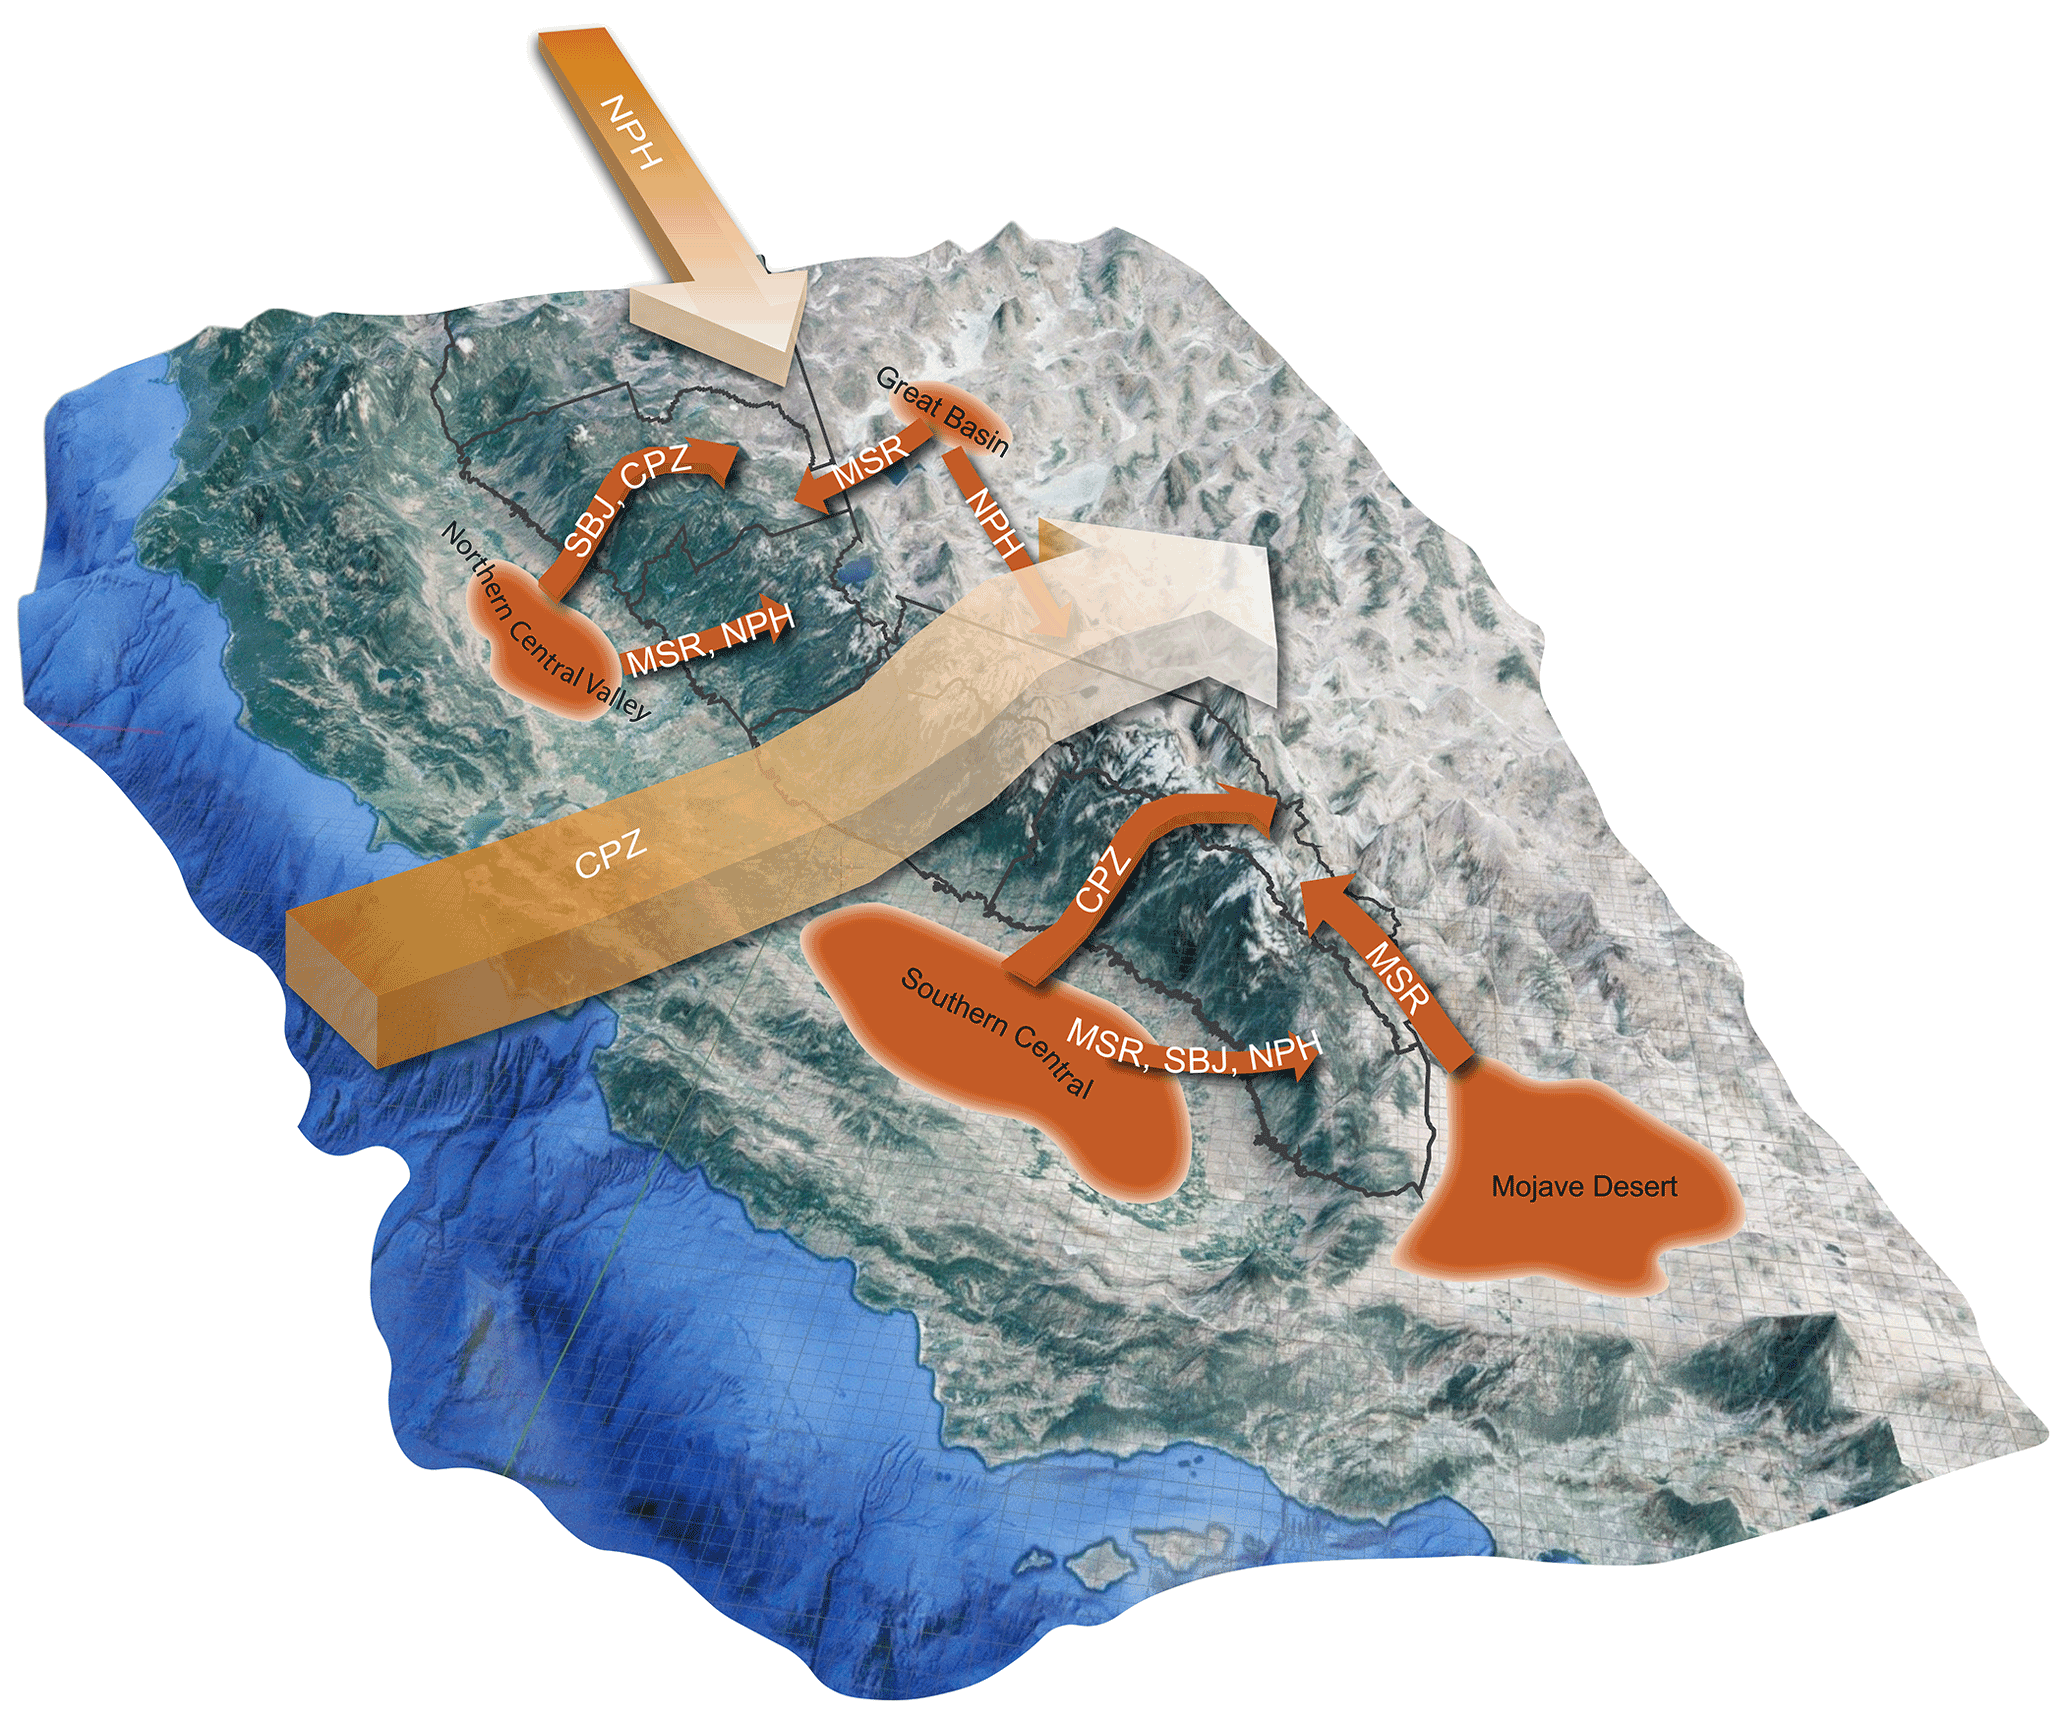
Figure 14Schematic diagram of typical dust transport patterns across the Sierra Nevada. “MSR” denotes mesoscale regional transport. “SBJ” and “NPH” denote dust transport dominated by Sierra barrier jets (SBJs) and the North Pacific High (NPH), respectively, while “CPZ” denotes cross-Pacific zonal transport.
During April, Asian dust is transported zonally over the North Pacific through the straight zonal isobars at the middle level. The dust layer descends to 800 hPa when it reaches the California coast. In the presence of the NPH, dust emitted from Asia excurses north into Alaska and Canada and travels south along the US west coast. The dust travels at a higher altitude, and the concentrations are weaker than the zonal transport.
Large amounts of depositions are found on the west slope, which generally decrease with elevations. Dust particles transported to the higher altitude are small in size and difficult to deposit through gravitational effects. The SBJ-produced AR collects dust in the rain and snow and deposits it on the high mountain. In addition, considerable depositions occur when the elevated dust layer from the Pacific collides with the mountain. We acknowledge that our characterization of dominant transport patterns might be limited by model uncertainties. Further, the coarse-resolution reanalyses data, MERRA-2, cannot accurately resolve the topography effects and tend to underestimate mesoscale regional transport. Furthermore, both WRF-Chem and MERRA-2 describe dust emissions from dryland by relating them to high wind speed, soil moisture, and soil type (Ginoux et al., 2001), while dust emission from agricultural lands is not specifically implemented. However, a comprehensive evaluation of airborne dust and PM2.5 concentration between model simulation and site observations in our previous study shows a good agreement between both (Huang et al., 2022a). In addition, the dust transport pathways have well-defined patterns associated with the mesoscale and large-scale weather systems. The general consistency across different models (WRF-Chem and MERRA-2) and observations (satellite analysis) and across different years also gives us confidence that the results are valid despite model uncertainties.
The analyses of dust emissions and transport can be used to understand dust transport in a changing climate. Studies have shown that global warming continues to dry the soil, producing more dust emissions over the western United States. Nevertheless, the change in transport and deposition patterns has not been well recognized. Our study highlighted the connection between dust transport and dominant weather patterns across the Sierra Nevada; the latter might respond in a more predictable way to climate change. Future projections show that global warming may increase the frequency of the landfalling AR by 20 %–35 % by the end of the 21st century (Hagos et al., 2016; Rhoades et al., 2021). In addition, the widening of the Hadley Cell in response to global warming might enhance the NPH and shift it poleward (Song et al., 2018; Choi et al., 2016). That said, the SBJ- and NPH-related dust transport may occur more frequently, while MSR transport may become less common. In this regard, changes in dust emissions from the Central Valley might play a more critical role in mountain snow impurities than those from the Mojave Desert and the Great Basin, producing more depositions on the west slope of the Sierra Nevada.
The IASI DOD data are acquired from https://iasi.aeris-data.fr/dust-aod/ (last access: February 2022, Capelle et al., 2014). The MIDAS DOD is acquired from https://doi.org/10.5281/zenodo.4244106 (Gkikas et al., 2020). MERRA-2 aerosol reanalyses are available from https://disc.gsfc.nasa.gov/datasets?keywords=MERRA2&page=1 (last access: February 2022, DOI: https://doi.org/10.5067/VJAFPLI1CSIV, GMAO, 2015), and ERA5 wind reanalyses are available from https://doi.org/10.5065/BH6N-5N20 (European Centre for Medium-Range Weather Forecasts, 2019). The WRF-Chem and MERRA-2 SOM clustering results have been uploaded to https://doi.org/10.5281/zenodo.6795994 (Huang, 2022).
The supplement related to this article is available online at: https://doi.org/10.5194/acp-22-15469-2022-supplement.
HH performed the analysis and drafted the manuscript. The methodology was developed by HH and YL. JZ and AG provided the observational data used for model validation. YQ, CH, and ZZ helped with the analysis and offered valuable comments. All authors contributed to writing and editing the manuscript.
At least one of the (co-)authors is a member of the editorial board of Atmospheric Chemistry and Physics. The peer-review process was guided by an independent editor, and the authors also have no other competing interests to declare.
Publisher’s note: Copernicus Publications remains neutral with regard to jurisdictional claims in published maps and institutional affiliations.
This research was supported by NASA awards 80NSSC21K0997, 80NSSC20K1722, 80NSSC20K1349, and 80NSSC18K1489. Antonis Gkikas was supported by the Hellenic Foundation for Research and Innovation (H.F.R.I.) under the “2nd Call for H.F.R.I. Research Projects to support Post-Doctoral Researchers” (project acronym: ATLANTAS, project number: 544). The Pacific Northwest National Laboratory (PNNL) is operated for DOE by the Battelle Memorial Institute under contract DE-AC05-76RLO1830.
This research has been supported by the National Aeronautics and Space Administration (grant nos. 80NSSC21K0997, 80NSSC20K1722, 80NSSC20K1349, and 80NSSC18K1489). Antonis Gkikas was supported by the Hellenic Foundation for Research and Innovation (H.F.R.I.) under the “2nd Call for H. F. R. I. Research Projects to support Post-Doctoral Researchers” (project acronym: ATLANTAS, project no.: 544). The Pacific Northwest National Laboratory (PNNL) is operated for DOE by the Battelle Memorial Institute under contract DE-AC05-76RLO1830.
This paper was edited by Jianping Huang and reviewed by two anonymous referees.
Aarons, S. M., Arvin, L. J., Aciego, S. M., Riebe, C. S., Johnson, K. R., Blakowski, M. A., Koornneef, J. M., Hart, S. C., Barnes, M. E., Dove, N., Botthoff, J. K., Maltz, M., and Aronson, E. L.: Competing droughts affect dust delivery to Sierra Nevada, Aeolian Res., 41, 100545, https://doi.org/10.1016/j.aeolia.2019.100545, 2019.
Achakulwisut, P., Shen, L., and Mickley, L. J.: What Controls Springtime Fine Dust Variability in the Western United States? Investigating the 2002–2015 Increase in Fine Dust in the U.S. Southwest, J. Geophys. Res.-Atmos., 122, 12449–12467, https://doi.org/10.1002/2017JD027208, 2017.
Aciego, S. M., Riebe, C. S., Hart, S. C., Blakowski, M. A., Carey, C. J., Aarons, S. M., Dove, N. C., Botthoff, J. K., Sims, K. W. W., and Aronson, E. L.: Dust outpaces bedrock in nutrient supply to montane forest ecosystems, Nat. Commun., 8, 14800, https://doi.org/10.1038/ncomms14800, 2017.
Ault, A. P., Williams, C. R., White, A. B., Neiman, P. J., Creamean, J. M., Gaston, C. J., Ralph, F. M., and Prather, K. A.: Detection of Asian dust in California orographic precipitation, J. Geophys. Res.-Atmos., 116, D16205, https://doi.org/10.1029/2010JD015351, 2011.
Bao, J.-W., Michelson, S. A., Persson, P. O. G., Djalalova, I. V., and Wilczak, J. M.: Observed and WRF-Simulated Low-Level Winds in a High-Ozone Episode during the Central California Ozone Study, J. Appl. Meteorol. Clim., 47, 2372–2394, https://doi.org/10.1175/2008jamc1822.1, 2008.
Bao, M. and Wallace, J. M.: Cluster Analysis of Northern Hemisphere Wintertime 500-hPa Flow Regimes during 1920–2014, J. Atmos. Sci., 72, 3597–3608, https://doi.org/10.1175/JAS-D-15-0001.1, 2015.
Brahney, J., Ballantyne, A. P., Sievers, C., and Neff, J. C.: Increasing Ca2+ deposition in the western US: The role of mineral aerosols, Aeolian Research, 10, 77–87, https://doi.org/10.1016/j.aeolia.2013.04.003, 2013.
Buchard, V., da Silva, A. M., Randles, C. A., Colarco, P., Ferrare, R., Hair, J., Hostetler, C., Tackett, J., and Winker, D.: Evaluation of the surface PM2.5 in Version 1 of the NASA MERRA Aerosol Reanalysis over the United States, Atmos. Environ., 125, 100–111, https://doi.org/10.1016/j.atmosenv.2015.11.004, 2016.
Buchard, V., Randles, C. A., da Silva, A. M., Darmenov, A., Colarco, P. R., Govindaraju, R., Ferrare, R., Hair, J., Beyersdorf, A. J., Ziemba, L. D., and Yu, H.: The MERRA-2 Aerosol Reanalysis, 1980 Onward. Part II: Evaluation and Case Studies, J. Climate, 30, 6851–6872, https://doi.org/10.1175/JCLI-D-16-0613.1, 2017.
Buchholz, R. R., Emmons, L. K., Tilmes, S., and The CESM2 Development Team: CESM2.1/CAM-chem Instantaneous Output for Boundary Conditions, UCAR/NCAR – Atmospheric Chemistry Observations and Modeling Laboratory [data set], https://doi.org/10.5065/NMP7-EP60, 2019.
Capelle, V., Chédin, A., Siméon, M., Tsamalis, C., Pierangelo, C., Pondrom, M., Crevoisier, C., Crepeau, L., and Scott, N. A.: Evaluation of IASI-derived dust aerosol characteristics over the tropical belt, Atmos. Chem. Phys., 14, 9343–9362, https://doi.org/10.5194/acp-14-9343-2014, 2014 (data available at: https://iasi.aeris-data.fr/dust-aod/, last access: February 2022).
Capelle, V., Chédin, A., Pondrom, M., Crevoisier, C., Armante, R., Crepeau, L., and Scott, N. A.: Infrared dust aerosol optical depth retrieved daily from IASI and comparison with AERONET over the period 2007–2016, Remote Sens. Environ., 206, 15–32, https://doi.org/10.1016/j.rse.2017.12.008, 2018.
Chapman, E. G., Gustafson Jr., W. I., Easter, R. C., Barnard, J. C., Ghan, S. J., Pekour, M. S., and Fast, J. D.: Coupling aerosol-cloud-radiative processes in the WRF-Chem model: Investigating the radiative impact of elevated point sources, Atmos. Chem. Phys., 9, 945–964, https://doi.org/10.5194/acp-9-945-2009, 2009.
Chin, M., Ginoux, P., Kinne, S., Torres, O., Holben, B. N., Duncan, B. N., Martin, R. V., Logan, J. A., Higurashi, A., and Nakajima, T.: Tropospheric Aerosol Optical Thickness from the GOCART Model and Comparisons with Satellite and Sun Photometer Measurements, J. Atmos. Sci., 59, 461–483, https://doi.org/10.1175/1520-0469(2002)059<0461:Taotft>2.0.Co;2, 2002.
Chin, M., Diehl, T., Ginoux, P., and Malm, W.: Intercontinental transport of pollution and dust aerosols: implications for regional air quality, Atmos. Chem. Phys., 7, 5501–5517, https://doi.org/10.5194/acp-7-5501-2007, 2007.
Choi, J., Lu, J., Son, S. W., Frierson, D. M., and Yoon, J. H.: Uncertainty in future projections of the North Pacific subtropical high and its implication for California winter precipitation change, J. Geophys. Res.-Atmos., 121, 795–806, 2016.
Clausnitzer, H. and Singer, M. J.: Environmental influences on respirable dust production from agricultural operations in California, Atmos. Environ., 34, 1739–1745, https://doi.org/10.1016/S1352-2310(99)00385-4, 2000.
Creamean, J. M., Suski, K. J., Rosenfeld, D., Cazorla, A., DeMott, P. J., Sullivan, R. C., White, A. B., Ralph, F. M., Minnis, P., and Comstock, J. M.: Dust and biological aerosols from the Sahara and Asia influence precipitation in the western US, Science, 339, 1572–1578, 2013.
Creamean, J. M., Spackman, J. R., Davis, S. M., and White, A. B.: Climatology of long-range transported Asian dust along the West Coast of the United States, J. Geophys. Res.-Atmos., 119, 12171–12185, https://doi.org/10.1002/2014JD021694, 2014.
Crooks, J. L., Cascio, W. E., Percy, M. S., Reyes, J., Neas, L. M., and Hilborn, E. D.: The Association between Dust Storms and Daily Non-Accidental Mortality in the United States, 1993–2005, Environ. Health Persp., 124, 1735–1743, https://doi.org/10.1289/EHP216, 2016.
Duniway, M. C., Pfennigwerth, A. A., Fick, S. E., Nauman, T. W., Belnap, J., and Barger, N. N.: Wind erosion and dust from US drylands: a review of causes, consequences, and solutions in a changing world, Ecosphere, 10, e02650, https://doi.org/10.1002/ecs2.2650, 2019.
Easter, R. C., Ghan, S. J., Zhang, Y., Saylor, R. D., Chapman, E. G., Laulainen, N. S., Abdul-Razzak, H., Leung, L. R., Bian, X. D., and Zaveri, R. A.: MIRAGE: Model description and evaluation of aerosols and trace gases, J. Geophys. Res.-Atmos., 109, D20210, https://doi.org/10.1029/2004jd004571, 2004.
Emmons, L. K., Schwantes, R. H., Orlando, J. J., Tyndall, G., Kinnison, D., Lamarque, J. F., Marsh, D., Mills, M. J., Tilmes, S., Bardeen, C., Buchholz, R. R., Conley, A., Gettelman, A., Garcia, R., Simpson, I., Blake, D. R., Meinardi, S., and Petron, G.: The Chemistry Mechanism in the Community Earth System Model Version 2 (CESM2), J. Adv. Model. Earth Sy., 12, e2019MS001882, https://doi.org/10.1029/2019MS001882, 2020.
European Centre for Medium-Range Weather Forecasts: ERA5 Reanalysis (0.25 Degree Latitude-Longitude Grid), Research Data Archive at the National Center for Atmospheric Research, Computational and Information Systems Laboratory [data set], https://doi.org/10.5065/BH6N-5N20, 2019.
Forster, P., Ramaswamy, V., Artaxo, P., Berntsen, T., Betts, R., Fahey, D. W., Haywood, J., Lean, J., Lowe, D. C., Myhre, G., Nganga, J., Prinn, R., Raga, G., Schulz, M., and Van Dorland, R.: Changes in Atmospheric Constituents and in Radiative Forcing. In: Climate Change 2007: The Physical Science Basis, Contribution of Working Group I to the Fourth Assessment Report of the Intergovernmental Panel on Climate Change, edited by: Solomon, S., Qin, D., Manning, M., Chen, Z., Marquis, M., Averyt, K. B., Tignor, M., and Miller, H. L., Cambridge University Press, Cambridge, United Kingdom and New York, NY, USA, 2007.
Gelaro, R., McCarty, W., Suarez, M. J., Todling, R., Molod, A., Takacs, L., Randles, C., Darmenov, A., Bosilovich, M. G., Reichle, R., Wargan, K., Coy, L., Cullather, R., Draper, C., Akella, S., Buchard, V., Conaty, A., da Silva, A., Gu, W., Kim, G. K., Koster, R., Lucchesi, R., Merkova, D., Nielsen, J. E., Partyka, G., Pawson, S., Putman, W., Rienecker, M., Schubert, S. D., Sienkiewicz, M., and Zhao, B.: The Modern-Era Retrospective Analysis for Research and Applications, Version 2 (MERRA-2), J. Climate, 30, 5419–5454, https://doi.org/10.1175/JCLI-D-16-0758.1, 2017.
Giannadaki, D., Pozzer, A., and Lelieveld, J.: Modeled global effects of airborne desert dust on air quality and premature mortality, Atmos. Chem. Phys., 14, 957–968, https://doi.org/10.5194/acp-14-957-2014, 2014.
Ginoux, P., Chin, M., Tegen, I., Prospero, J. M., Holben, B., Dubovik, O., and Lin, S. J.: Sources and distributions of dust aerosols simulated with the GOCART model, J. Geophys. Res.-Atmos., 106, 20255–20273, https://doi.org/10.1029/2000jd000053, 2001.
Ginoux, P., Prospero, J. M., Gill, T. E., Hsu, N. C., and Zhao, M.: Global-scale attribution of anthropogenic and natural dust sources and their emission rates based on MODIS Deep Blue aerosol products, Rev. Geophys., 50, RG3005, https://doi.org/10.1029/2012RG000388, 2012.
Gkikas, A., Proestakis, E., Amiridis, V., Kazadzis, S., Di Tomaso, E., Tsekeri, A., Marinou, E., Hatzianastassiou, N., and Pérez García-Pando, C.: ModIs Dust AeroSol (MIDAS): A global fine resolution dust optical depth dataset, Zenodo [data set], https://doi.org/10.5281/zenodo.4244106, 2020.
Gkikas, A., Proestakis, E., Amiridis, V., Kazadzis, S., Di Tomaso, E., Tsekeri, A., Marinou, E., Hatzianastassiou, N., and Pérez García-Pando, C.: ModIs Dust AeroSol (MIDAS): a global fine-resolution dust optical depth data set, Atmos. Meas. Tech., 14, 309–334, https://doi.org/10.5194/amt-14-309-2021, 2021.
Gkikas, A., Proestakis, E., Amiridis, V., Kazadzis, S., Di Tomaso, E., Marinou, E., Hatzianastassiou, N., Kok, J. F., and García-Pando, C. P.: Quantification of the dust optical depth across spatiotemporal scales with the MIDAS global dataset (2003–2017), Atmos. Chem. Phys., 22, 3553–3578, https://doi.org/10.5194/acp-22-3553-2022, 2022.
Global Modeling and Assimilation Office (GMAO): MERRA-2 tavg1_2d_slv_Nx: 2d,1-Hourly,Time-Averaged,Single-Level,Assimilation,Single-Level Diagnostics V5.12.4, Goddard Space Flight Center Distributed Active Archive Center (GSFC DAAC), Greenbelt, MD, USA, https://doi.org/10.5067/VJAFPLI1CSIV, 2015.
Goldstein, H. L., Breit, G. N., and Reynolds, R. L.: Controls on the chemical composition of saline surface crusts and emitted dust from a wet playa in the Mojave Desert (USA), J. Arid Environ., 140, 50–66, https://doi.org/10.1016/j.jaridenv.2017.01.010, 2017.
Hagos, S. M., Leung, L. R., Yoon, J.-H., Lu, J., and Gao, Y.: A projection of changes in landfalling atmospheric river frequency and extreme precipitation over western North America from the Large Ensemble CESM simulations, Geophys. Res. Lett., 43, 1357–1363, https://doi.org/10.1002/2015GL067392, 2016.
Hand, J. L., White, W. H., Gebhart, K. A., Hyslop, N. P., Gill, T. E., and Schichtel, B. A.: Earlier onset of the spring fine dust season in the southwestern United States, Geophys. Res. Lett., 43, 4001–4009, https://doi.org/10.1002/2016GL068519, 2016.
Hand, J. L., Gill, T. E., and Schichtel, B. A.: Spatial and seasonal variability in fine mineral dust and coarse aerosol mass at remote sites across the United States, J. Geophys. Res.-Atmos., 122, 3080–3097, https://doi.org/10.1002/2016JD026290, 2017.
Hannachi, A.: On the origin of planetary-scale extratropical winter circulation regimes, J. Atmos. Sci., 67, 1382–1401, 2010.
Haywood, J. M., Allan, R. P., Culverwell, I., Slingo, T., Milton, S., Edwards, J., and Clerbaux, N.: Can desert dust explain the outgoing longwave radiation anomaly over the Sahara during July 2003?, J. Geophys. Res.-Atmos., 110, D05105, https://doi.org/10.1029/2004JD005232, 2005.
Hersbach, H., Bell, B., Berrisford, P., Hirahara, S., Horanyi, A., Munoz-Sabater, J., Nicolas, J., Peubey, C., Radu, R., Schepers, D., Simmons, A., Soci, C., Abdalla, S., Abellan, X., Balsamo, G., Bechtold, P., Biavati, G., Bidlot, J., Bonavita, M., De Chiara, G., Dahlgren, P., Dee, D., Diamantakis, M., Dragani, R., Flemming, J., Forbes, R., Fuentes, M., Geer, A., Haimberger, L., Healy, S., Hogan, R. J., Holm, E., Janiskova, M., Keeley, S., Laloyaux, P., Lopez, P., Lupu, C., Radnoti, G., de Rosnay, P., Rozum, I., Vamborg, F., Villaume, S., and Thepaut, J.-N.: The ERA5 global reanalysis, Q. J. Roy. Meteor. Soc., 146, 1999–2049, https://doi.org/10.1002/qj.3803, 2020.
Hilton, F., Armante, R., August, T., Barnet, C., Bouchard, A., Camy-Peyret, C., Capelle, V., Clarisse, L., Clerbaux, C., Coheur, P. F., Collard, A., Crevoisier, C., Dufour, G., Edwards, D., Faijan, F., Fourrie, N., Gambacorta, A., Goldberg, M., Guidard, V., Hurtmans, D., Illingworth, S., Jacquinet-Husson, N., Kerzenmacher, T., Klaes, D., Lavanant, L., Masiello, G., Matricardi, M., McNally, A., Newman, S., Pavelin, E., Payan, S., Pequignot, E., Peyridieu, S., Phulpin, T., Remedios, J., Schlussel, P., Serio, C., Strow, L., Stubenrauch, C., Taylor, J., Tobin, D., Wolf, W., and Zhou, D.: Hyperspectral Earth Observation from IASI: Five Years of Accomplishments, B. Am. Meteorol. Soc., 93, 347–370, https://doi.org/10.1175/Bams-D-11-00027.1, 2012.
Huang, H.: Data for “Where does the dust deposited over the Sierra Nevada snow come from?”, Zenodo [data set], https://doi.org/10.5281/zenodo.6795994, 2022.
Huang, H., Gu, Y., Xue, Y., Jiang, J., and Zhao, B.: Assessing aerosol indirect effect on clouds and regional climate of East/South Asia and West Africa using NCEP GFS, Clim. Dynam., 52, 5759–5774, https://doi.org/10.1007/s00382-018-4476-9, 2019.
Huang, H., Qian, Y., He, C., Bair, E. H., and Rittger, K.: Snow Albedo Feedbacks Enhance Snow Impurity-Induced Radiative Forcing in the Sierra Nevada, Geophys. Res. Lett., 49, e2022GL098102, https://doi.org/10.1029/2022GL098102, 2022a.
Huang, H., Fischella, M. R., Liu, Y., Ban, Z., Fayne, J. V., Li, D., Cavanaugh, K. C., and Lettenmaier, D. P.: Changes in Mechanisms and Characteristics of Western U.S. Floods Over the Last Sixty Years, Geophys. Res. Lett., 49, e2021GL097022, https://doi.org/10.1029/2021gl097022, 2022b.
Hunt, W. H., Winker, D. M., Vaughan, M. A., Powell, K. A., Lucker, P. L., and Weimer, C.: CALIPSO Lidar Description and Performance Assessment, J. Atmos. Ocean. Tech., 26, 1214–1228, https://doi.org/10.1175/2009jtecha1223.1, 2009.
Jardine, G. E., Crocker, A. J., Bailey, I., Cooper, M. J., Milton, J. A., and Wilson, P. A.: The imprint of windblown dust from the North American Southwest on the California Channel Islands and Pacific Ocean sediments, Quaternary Sci. Rev., 261, 106934, https://doi.org/10.1016/j.quascirev.2021.106934, 2021.
Kim, D., Chin, M., Cruz, C. A., Tong, D., and Yu, H.: Spring Dust in Western North America and Its Interannual Variability – Understanding the Role of Local and Transported Dust, J. Geophys. Res.-Atmos., 126, e2021JD035383, https://doi.org/10.1029/2021JD035383, 2021.
Kim, M.-H., Omar, A. H., Tackett, J. L., Vaughan, M. A., Winker, D. M., Trepte, C. R., Hu, Y., Liu, Z., Poole, L. R., Pitts, M. C., Kar, J., and Magill, B. E.: The CALIPSO version 4 automated aerosol classification and lidar ratio selection algorithm, Atmos. Meas. Tech., 11, 6107–6135, https://doi.org/10.5194/amt-11-6107-2018, 2018.
Laden, F., Schwartz, J., Speizer, F. E., and Dockery, D. W.: Reduction in fine particulate air pollution and mortality: Extended follow-up of the Harvard Six Cities study, Am. J. Respir. Crit. Care Med., 173, 667–672, https://doi.org/10.1164/rccm.200503-443OC, 2006.
Lei, H. and Wang, J. X. L.: Observed characteristics of dust storm events over the western United States using meteorological, satellite, and air quality measurements, Atmos. Chem. Phys., 14, 7847–7857, https://doi.org/10.5194/acp-14-7847-2014, 2014.
Lim, S. S., Vos, T., Flaxman, A. D., Danaei, G., Shibuya, K., Adair-Rohani, H., AlMazroa, M. A., Amann, M., Anderson, H. R., Andrews, K. G., Aryee, M., Atkinson, C., Bacchus, L. J., Bahalim, A. N., Balakrishnan, K., Balmes, J., Barker-Collo, S., Baxter, A., Bell, M. L., Blore, J. D., Blyth, F., Bonner, C., Borges, G., Bourne, R., Boussinesq, M., Brauer, M., Brooks, P., Bruce, N. G., Brunekreef, B., Bryan-Hancock, C., Bucello, C., Buchbinder, R., Bull, F., Burnett, R. T., Byers, T. E., Calabria, B., Carapetis, J., Carnahan, E., Chafe, Z., Charlson, F., Chen, H., Chen, J. S., Cheng, A. T.-A., Child, J. C., Cohen, A., Colson, K. E., Cowie, B. C., Darby, S., Darling, S., Davis, A., Degenhardt, L., Dentener, F., Des Jarlais, D. C., Devries, K., Dherani, M., Ding, E. L., Dorsey, E. R., Driscoll, T., Edmond, K., Ali, S. E., Engell, R. E., Erwin, P. J., Fahimi, S., Falder, G., Farzadfar, F., Ferrari, A., Finucane, M. M., Flaxman, S., Fowkes, F. G. R., Freedman, G., Freeman, M. K., Gakidou, E., Ghosh, S., Giovannucci, E., Gmel, G., Graham, K., Grainger, R., Grant, B., Gunnell, D., Gutierrez, H. R., Hall, W., Hoek, H. W., Hogan, A., Hosgood, H. D., Hoy, D., Hu, H., Hubbell, B. J., Hutchings, S. J., Ibeanusi, S. E., Jacklyn, G. L., Jasrasaria, R., Jonas, J. B., Kan, H., Kanis, J. A., Kassebaum, N., Kawakami, N., Khang, Y.-H., Khatibzadeh, S., Khoo, J.-P., Kok, C., Laden, F., Lalloo, R., Lan, Q., Lathlean, T., Leasher, J. L., Leigh, J., Li, Y., Lin, J. K., Lipshultz, S. E., London, S., Lozano, R., Lu, Y., Mak, J., Malekzadeh, R., Mallinger, L., Marcenes, W., March, L., Marks, R., Martin, R., McGale, P., McGrath, J., Mehta, S., Memish, Z. A., Mensah, G. A., Merriman, T. R., Micha, R., Michaud, C., Mishra, V., Hanafiah, K. M., Mokdad, A. A., Morawska, L., Mozaffarian, D., Murphy, T., Naghavi, M., Neal, B., Nelson, P. K., Nolla, J. M., Norman, R., Olives, C., Omer, S. B., Orchard, J., Osborne, R., Ostro, B., Page, A., Pandey, K. D., Parry, C. D. H., Passmore, E., Patra, J., Pearce, N., Pelizzari, P. M., Petzold, M., Phillips, M. R., Pope, D., Pope, C. A., Powles, J., Rao, M., Razavi, H., Rehfuess, E. A., Rehm, J. T., Ritz, B., Rivara, F. P., Roberts, T., Robinson, C., Rodriguez-Portales, J. A., Romieu, I., Room, R., Rosenfeld, L. C., Roy, A., Rushton, L., Salomon, J. A., Sampson, U., Sanchez-Riera, L., Sanman, E., Sapkota, A., Seedat, S., Shi, P., Shield, K., Shivakoti, R., Singh, G. M., Sleet, D. A., Smith, E., Smith, K. R., Stapelberg, N. J. C., Steenland, K., Stöckl, H., Stovner, L. J., Straif, K., Straney, L., Thurston, G. D., Tran, J. H., Van Dingenen, R., van Donkelaar, A., Veerman, J. L., Vijayakumar, L., Weintraub, R., Weissman, M. M., White, R. A., Whiteford, H., Wiersma, S. T., Wilkinson, J. D., Williams, H. C., Williams, W., Wilson, N., Woolf, A. D., Yip, P., Zielinski, J. M., Lopez, A. D., Murray, C. J. L., and Ezzati, M.: A comparative risk assessment of burden of disease and injury attributable to 67 risk factors and risk factor clusters in 21 regions, 1990–2010: a systematic analysis for the Global Burden of Disease Study 2010, The Lancet, 380, 2224–2260, https://doi.org/10.1016/S0140-6736(12)61766-8, 2012.
Liu, Y., Qian, Y., and Berg, L. K.: Local-thermal-gradient and large-scale-circulation impacts on turbine-height wind speed forecasting over the Columbia River Basin, Wind Energ. Sci., 7, 37–51, https://doi.org/10.5194/wes-7-37-2022, 2022a.
Liu, Y., Qian, Y., Feng, S., Berg, L. K., Juliano, T. W., Jiménez, P. A., and Liu, Y.: Sensitivity of solar irradiance to model parameters in cloud and aerosol treatments of WRF-solar, Sol. Energy, 233, 446–460, 2022b.
Muhs, D. R., Budahn, J., Reheis, M., Beann, J., Skipp, G., and Fisher, E.: Airborne dust transport to the eastern Pacific Ocean off southern California: Evidence from San Clemente Island, J. Geophys. Res.-Atmos., 112, D13203, https://doi.org/10.1029/2006JD007577, 2007.
Neff, J. C., Ballantyne, A. P., Farmer, G. L., Mahowald, N. M., Conroy, J. L., Landry, C. C., Overpeck, J. T., Painter, T. H., Lawrence, C. R., and Reynolds, R. L.: Increasing eolian dust deposition in the western United States linked to human activity, Nat. Geosci., 1, 189–195, https://doi.org/10.1038/ngeo133, 2008.
Neiman, P. J., Hughes, M., Moore, B. J., Ralph, F. M., and Sukovich, E. M.: Sierra Barrier Jets, Atmospheric Rivers, and Precipitation Characteristics in Northern California: A Composite Perspective Based on a Network of Wind Profilers, Mon. Weather Rev., 141, 4211–4233, https://doi.org/10.1175/mwr-d-13-00112.1, 2013.
Okin, G., Gillette, D., and Herrick, J.: Multi-scale controls on and consequences of aeolian processes in landscape change in arid and semi-arid environments, J. Arid Environ., 65, 253–275, 2006.
Pappagianis, D. and Einstein, H.: Tempest from Tehachapi takes toll or Coccidioides conveyed aloft and afar, West J. Med., 129, 527–530, PMID: 735056, PMCID: PMC1238466, 1978.
Pu, B. and Ginoux, P.: How reliable are CMIP5 models in simulating dust optical depth?, Atmos. Chem. Phys., 18, 12491–12510, https://doi.org/10.5194/acp-18-12491-2018, 2018.
Qian, Y., Gustafson, W. I., Leung, L. R., and Ghan, S. J.: Effects of soot-induced snow albedo change on snowpack and hydrological cycle in western United States based on Weather Research and Forecasting chemistry and regional climate simulations, J. Geophys. Res.-Atmos., 114, D03108, https://doi.org/10.1029/2008jd011039, 2009.
Qian, Y., Yasunari, T. J., Doherty, S. J., Flanner, M. G., Lau, W. K. M., Ming, J., Wang, H., Wang, M., Warren, S. G., and Zhang, R.: Light-absorbing particles in snow and ice: Measurement and modeling of climatic and hydrological impact, Adv. Atmos. Sci., 32, 64–91, https://doi.org/10.1007/s00376-014-0010-0, 2014.
Randles, C. A., Da Silva, A. M., Buchard, V., Colarco, P. R., Darmenov, A., Govindaraju, R., Smirnov, A., Holben, B., Ferrare, R., Hair, J., Shinozuka, Y., and Flynn, C. J.: The MERRA-2 Aerosol Reanalysis, 1980–onward, Part I: System Description and Data Assimilation Evaluation, J. Climate, 30, 6823–6850, https://doi.org/10.1175/JCLI-D-16-0609.1, 2017.
Reheis, M. C. and Kihl, R.: Dust Deposition in Southern Nevada and California, 1984–1989 – Relations to Climate, Source Area, and Source Lithology, J. Geophys. Res.-Atmos., 100, 8893–8918, https://doi.org/10.1029/94jd03245, 1995.
Reusch, D. B., Alley, R. B., and Hewitson, B. C.: North Atlantic climate variability from a self-organizing map perspective, J. Geophys. Res.-Atmos., 112, D02104, https://doi.org/10.1029/2006JD007460, 2007.
Rhoades, A. M., Risser, M. D., Stone, D. A., Wehner, M. F., and Jones, A. D.: Implications of warming on western United States landfalling atmospheric rivers and their flood damages, Weather Clim. Extreme, 32, 100326, https://doi.org/10.1016/j.wace.2021.100326, 2021.
Rodionov, S. N., Bond, N. A., and Overland, J. E.: The Aleutian Low, storm tracks, and winter climate variability in the Bering Sea, Deep-Sea Res. Pt. II, 54, 2560–2577, https://doi.org/10.1016/j.dsr2.2007.08.002, 2007.
Sarangi, C., Qian, Y., Rittger, K., Leung, L. R., Chand, D., Bormann, K. J., and Painter, T. H.: Dust dominates high-altitude snow darkening and melt over high-mountain Asia, Nat. Clim. Change, 10, 1045–1051, https://doi.org/10.1038/s41558-020-00909-3, 2020.
Skiles, S. M., Flanner, M., Cook, J. M., Dumont, M., and Painter, T. H.: Radiative forcing by light-absorbing particles in snow, Nat. Clim. Change, 8, 964–971, https://doi.org/10.1038/s41558-018-0296-5, 2018.
Song, F., Leung, L. R., Lu, J., and Dong, L.: Future Changes in Seasonality of the North Pacific and North Atlantic Subtropical Highs, Geophys. Res. Lett., 45, 11959–11968, https://doi.org/10.1029/2018GL079940, 2018.
Song, F., Feng, Z., Leung, L. R., Houze Jr., R. A., Wang, J., Hardin, J., and Homeyer, C. R.: Contrasting Spring and Summer Large-Scale Environments Associated with Mesoscale Convective Systems over the U.S. Great Plains, J. Climate, 32, 6749–6767, https://doi.org/10.1175/JCLI-D-18-0839.1, 2019.
Song, Q., Zhang, Z., Yu, H., Ginoux, P., and Shen, J.: Global dust optical depth climatology derived from CALIOP and MODIS aerosol retrievals on decadal timescales: regional and interannual variability, Atmos. Chem. Phys., 21, 13369–13395, https://doi.org/10.5194/acp-21-13369-2021, 2021.
Tao, M., Chen, L., Wang, Z., Wang, J., Che, H., Xu, X., Wang, W., Tao, J., Zhu, H., and Hou, C.: Evaluation of MODIS Deep Blue Aerosol Algorithm in Desert Region of East Asia: Ground Validation and Intercomparison, J. Geophys. Res.-Atmos., 122, 10357–10368, https://doi.org/10.1002/2017JD026976, 2017.
Tong, D. Q., Wang, J. X. L., Gill, T. E., Lei, H., and Wang, B.: Intensified dust storm activity and Valley fever infection in the southwestern United States, Geophys. Res. Lett., 44, 4304–4312, https://doi.org/10.1002/2017GL073524, 2017.
Vicars, W. C. and Sickman, J. O.: Mineral dust transport to the Sierra Nevada, California: Loading rates and potential source areas, J. Geophys. Res.-Biogeo., 116, G01018, https://doi.org/10.1029/2010jg001394, 2011.
Vigaud, N. and Robertson, A. W.: Convection regimes and tropical-midlatitude interactions over the Intra-American Seas from May to November, Int. J. Climatol., 37, 987–1000, 2017.
Vigaud, N., Robertson, A. W., and Tippett, M. K.: Predictability of recurrent weather regimes over North America during winter from submonthly reforecasts, Mon. Weather Rev., 146, 2559–2577, 2018.
Visbeck, M. H., Hurrell, J. W., Polvani, L., and Cullen, H. M.: The North Atlantic Oscillation: past, present, and future, P. Natl. Acad. Sci. USA, 98, 12876–12877, 2001.
von Storch, H., Langenberg, H., and Feser, F.: A spectral nudging technique for dynamical downscaling purposes, Mon. Weather Rev., 128, 3664–3673, 2000.
Voss, K. K. and Evan, A. T.: A New Satellite-Based Global Climatology of Dust Aerosol Optical Depth, J. Appl. Meteorol. Clim., 59, 83–102, https://doi.org/10.1175/JAMC-D-19-0194.1, 2020.
Voss, K. K., Evan, A. T., and Ralph, F. M.: Evaluating the Meteorological Conditions Associated With Dusty Atmospheric Rivers, J. Geophys. Res.-Atmos., 126, e2021JD035403, https://doi.org/10.1029/2021JD035403, 2021.
Winker, D. M., Vaughan, M. A., Omar, A., Hu, Y. X., Powell, K. A., Liu, Z. Y., Hunt, W. H., and Young, S. A.: Overview of the CALIPSO Mission and CALIOP Data Processing Algorithms, J. Atmos. Ocean. Tech., 26, 2310–2323, https://doi.org/10.1175/2009jtecha1281.1, 2009.
Winker, D. M., Pelon, J., Coakley, J. A., Ackerman, S. A., Charlson, R. J., Colarco, P. R., Flamant, P., Fu, Q., Hoff, R. M., Kittaka, C., Kubar, T. L., Le Treut, H., McCormick, M. P., Megie, G., Poole, L., Powell, K., Trepte, C., Vaughan, M. A., and Wielicki, B. A.: THE CALIPSO MISSION A Global 3D View of Aerosols and Clouds, B. Am. Meteorol. Soc., 91, 1211–1229, https://doi.org/10.1175/2010bams3009.1, 2010.
Wu, L., Su, H., Kalashnikova, O. V., Jiang, J. H., Zhao, C., Garay, M. J., Campbell, J. R., and Yu, N.: WRF-Chem simulation of aerosol seasonal variability in the San Joaquin Valley, Atmos. Chem. Phys., 17, 7291–7309, https://doi.org/10.5194/acp-17-7291-2017, 2017.
Wu, L., Gu, Y., Jiang, J. H., Su, H., Yu, N., Zhao, C., Qian, Y., Zhao, B., Liou, K.-N., and Choi, Y.-S.: Impacts of aerosols on seasonal precipitation and snowpack in California based on convection-permitting WRF-Chem simulations, Atmos. Chem. Phys., 18, 5529–5547, https://doi.org/10.5194/acp-18-5529-2018, 2018.
Young, S. A., Vaughan, M. A., Garnier, A., Tackett, J. L., Lambeth, J. D., and Powell, K. A.: Extinction and optical depth retrievals for CALIPSO's Version 4 data release, Atmos. Meas. Tech., 11, 5701–5727, https://doi.org/10.5194/amt-11-5701-2018, 2018.
Yu, H., Tan, Q., Chin, M., Remer, L. A., Kahn, R. A., Bian, H., Kim, D., Zhang, Z., Yuan, T., Omar, A. H., Winker, D. M., Levy, R. C., Kalashnikova, O., Crepeau, L., Capelle, V., and Chédin, A.: Estimates of African Dust Deposition Along the Trans-Atlantic Transit Using the Decadelong Record of Aerosol Measurements from CALIOP, MODIS, MISR, and IASI, J. Geophys. Res.-Atmos., 124, 7975–7996, https://doi.org/10.1029/2019JD030574, 2019.
Zaveri, R. A. and Peters, L. K.: A new lumped structure photochemical mechanism for large-scale applications, J. Geophys. Res.-Atmos., 104, 30387–30415, 1999.
Zheng, J., Zhang, Z., Garnier, A., Yu, H., Song, Q., Wang, C., Dubuisson, P., and Di Biagio, C.: The thermal infrared optical depth of mineral dust retrieved from integrated CALIOP and IIR observations, Remote Sens. Environ., 270, 112841, https://doi.org/10.1016/j.rse.2021.112841, 2022.