the Creative Commons Attribution 4.0 License.
the Creative Commons Attribution 4.0 License.
 | 06 Dec 2022
Instant and delayed effects of March biomass burning aerosols over the Indochina Peninsula
Anbao Zhu
Haiming Xu
Jiechun Deng
Jing Ma
Shaofeng Hua
By analyzing observations and simulations from the Weather Research and Forecasting model coupled with Chemistry (WRF-Chem), we investigated instant and delayed responses of large-scale atmospheric circulations and precipitation to biomass burning (BB) aerosols over the Indochina Peninsula (ICP) in the peak emission of March. The results show that the BB aerosols inhibit precipitation over the ICP in March and promote precipitation from early April to mid April. Specifically, the March BB aerosols over the ICP can induce mid- to lower-tropospheric heating and planetary boundary layer cooling to enhance local atmospheric stability; meanwhile, the perturbation heating can trigger an anomalous low in the lower troposphere to moisten the mid troposphere. However, the convection suppression due to the stabilized atmosphere dominates over the favorable water-vapor condition induced by large-scale circulation responses, leading to overall reduced precipitation over the ICP in March. For the delayed effect, the anomalous low can provide more water vapor as the monsoon advances in early April, although it becomes much weaker without BB aerosols' strong heating. On the other hand, the convective instability above 850 hPa is enhanced by more water vapor, resulting in enhanced precipitation over the ICP, northern South China Sea, and southern China. Thereafter, the condensational latent heating gradually takes over from the BB aerosol radiative heating, acting as the main driver for maintaining the anomalous circulation and thus the delayed effect in mid April.
- Article
(22310 KB) - Full-text XML
-
Supplement
(1390 KB) - BibTeX
- EndNote


Biomass burning (BB), including agro-residue burning and forest or prairie fires, is one of the largest sources of many trace gases and aerosol particles in the atmosphere (Reid et al., 2005). Globally, BB contributes 42 % of the black carbon (BC) emissions and 74 % of the organic carbon (OC) emissions (Bond et al., 2004). Smoke aerosols produced by BB can reduce air quality, diminish visibility, and harm public health (Huang et al., 2013; Yadav et al., 2017; Requia et al., 2021). BB-emitted aerosols also have vital impacts on regional climate and the hydrological cycle through interactions with radiation, clouds, and precipitation (Koren et al., 2004; Jacobson, 2014; Hodnebrog et al., 2016; T. Liu et al., 2020). The Indochina Peninsula (ICP) is one of the most active fire hotspots in the world (Lin et al., 2009; Gautam et al., 2013; Yadav et al., 2017), with high population density and thus high social and economic relevance and with strong monsoon circulation variability (Li et al., 2016; Wu et al., 2016). Therefore, it is essential to investigate the feedback mechanisms of BB aerosol–climate interactions to better understand aerosols' climatic and socioeconomic impacts (Lau, 2016; Ding et al., 2021).
BB aerosols can affect the climate in several ways. The aerosols, such as BC and OC aerosols, can directly scatter and absorb solar radiation (i.e., the so-called “direct effect”), thereby reducing the solar radiation reaching the surface. Both observational and numerical studies suggested that BB aerosols' direct effect can inhibit vertical instability by heating the atmosphere of the smoke aerosol layer and cooling the surface, thereby reducing surface fluxes and suppressing warm-cloud formation and convective activity (Koren et al., 2004; Feingold et al., 2005; Hodnebrog et al., 2016; X. Huang et al., 2016) and enhancing the low-cloud fraction (Sakaeda et al., 2011; Lu et al., 2018; Ding et al., 2021). On the other hand, BB aerosols can locally reduce precipitation by serving as cloud condensation nuclei and ice nuclei, increasing cloud droplet number concentration, decreasing droplet-effective radii (i.e., “indirect effect”), and decelerating the autoconversion process (Lee et al., 2014; L. Liu et al., 2020; Herbert et al., 2021). Numerical modeling studies have found that the direct effect dominates at low BB aerosol loading, while the indirect effect dominates at high BB aerosol loading (L. Liu et al., 2020; Herbert et al., 2021). However, the initial suppressive effect of BB aerosols on rainfall can lead to convective invigoration by cold rain processes (Martins et al., 2009). BB aerosols may also enhance rainfall under certain conditions, which are highly dependent on factors such as the altitude and longevity of the smoke plume (Tummon et al., 2010; Ban-Weiss et al., 2012; Herbert et al., 2021), the atmospheric degree of instability (Gonçalves et al., 2015), and the diurnal cycle of the convective system (Lee and Wang, 2020; Herbert et al., 2021). The above-mentioned perturbations caused by BB aerosols can also affect large-scale atmospheric circulation, thus changing the regional climate (Zhang et al., 2009; Lee et al., 2014; Jiang et al., 2020; Zhou et al., 2021).
The ICP experiences substantial agro-residue burning across farmlands in preparation for planting during the dry season, typically between February and April with a maximum occurrence in March (Huang et al., 2013; Shi et al., 2014) (Fig. 1a–e). Large amounts of BB aerosols are injected into the atmosphere, uplifted up to 3 km height by the India–Burma trough and transported to southern China and the South China Sea (SCS) and even to the western North Pacific Ocean by the subtropical southwesterly jet (Lin et al., 2009; Huang et al., 2013; W. R. Huang et al., 2016; Zhu et al., 2021). The BB aerosols become minimal after the monsoon rainfall onset in late April due to rainout and washout processes (W. R. Huang et al., 2016). Although the total BB emission in the ICP in March–April is only 20 % of that in South Africa in June–August, the cloud cover enhancement induced by the BB aerosols is similar (over 30 %) in both regions, suggesting a much stronger aerosol effect on climate in the ICP (Ding et al., 2021).
The effects of BB aerosols over the ICP on regional air quality (Lin et al., 2009; Huang et al., 2013; Lin et al., 2014; Q. Yang et al., 2022) and climate (Lee and Kim, 2010; Lee et al., 2014; Pani et al., 2018; Dong et al., 2019; Wang et al., 2021; S. Yang et al., 2022) have been widely investigated based on observations and numerical modeling studies. However, aerosol–cloud–precipitation interactions over the ICP have rarely been explored. Using an atmospheric global climate model (AGCM) coupled with an aerosol module, Lee and Kim (2010) showed that BC's radiative forcing (including anthropogenic and BB-emitted) in East Asia induces an anomalous meridional circulation through the radiation effect during spring. The anomalous upward motion near 30∘ N causes increased precipitation over Myanmar and Bangladesh, while the anomalous downward motion around 10∘ N causes a decrease in precipitation over Southeast Asia. Based on the Goddard Earth Observing System version 5 (GEOS-5)/AGCM model, Lee et al. (2014) suggested that both the direct effect (increasing lower-atmospheric stability) and indirect effect (decelerating cloud droplet autoconversion process) of BB aerosols can suppress local precipitation in the ICP during the pre-monsoon season (March–April), and the large-scale advection of cloud moisture invigorates the downwind rainfall. S. Yang et al. (2022) utilized the Weather Research and Forecasting model coupled with Chemistry (WRF-Chem) to show that the increased atmospheric stability induced by BB aerosols inhibits local rainfall over the ICP. The low-level cyclonic anomaly wind induced by the BB aerosol heating can modify moisture transport, leading to increased (decreased) rainfall over the southern coast (northern interior) of southern China. A case study by Wang et al. (2021) revealed that BB aerosols transported from the ICP can suppress convective precipitation and enhance non-convective precipitation over southern China. Most of these studies focused on the seasonal timescale (Lee and Kim, 2010; Lee et al., 2014; S. Yang et al., 2022) or individual cases lasting a few days (Wang et al., 2021). However, the BB emission over the ICP has a strong intra-seasonal variability peaking in March (Fig. 1e), whose instant and delayed effects on the climate remain unclear.
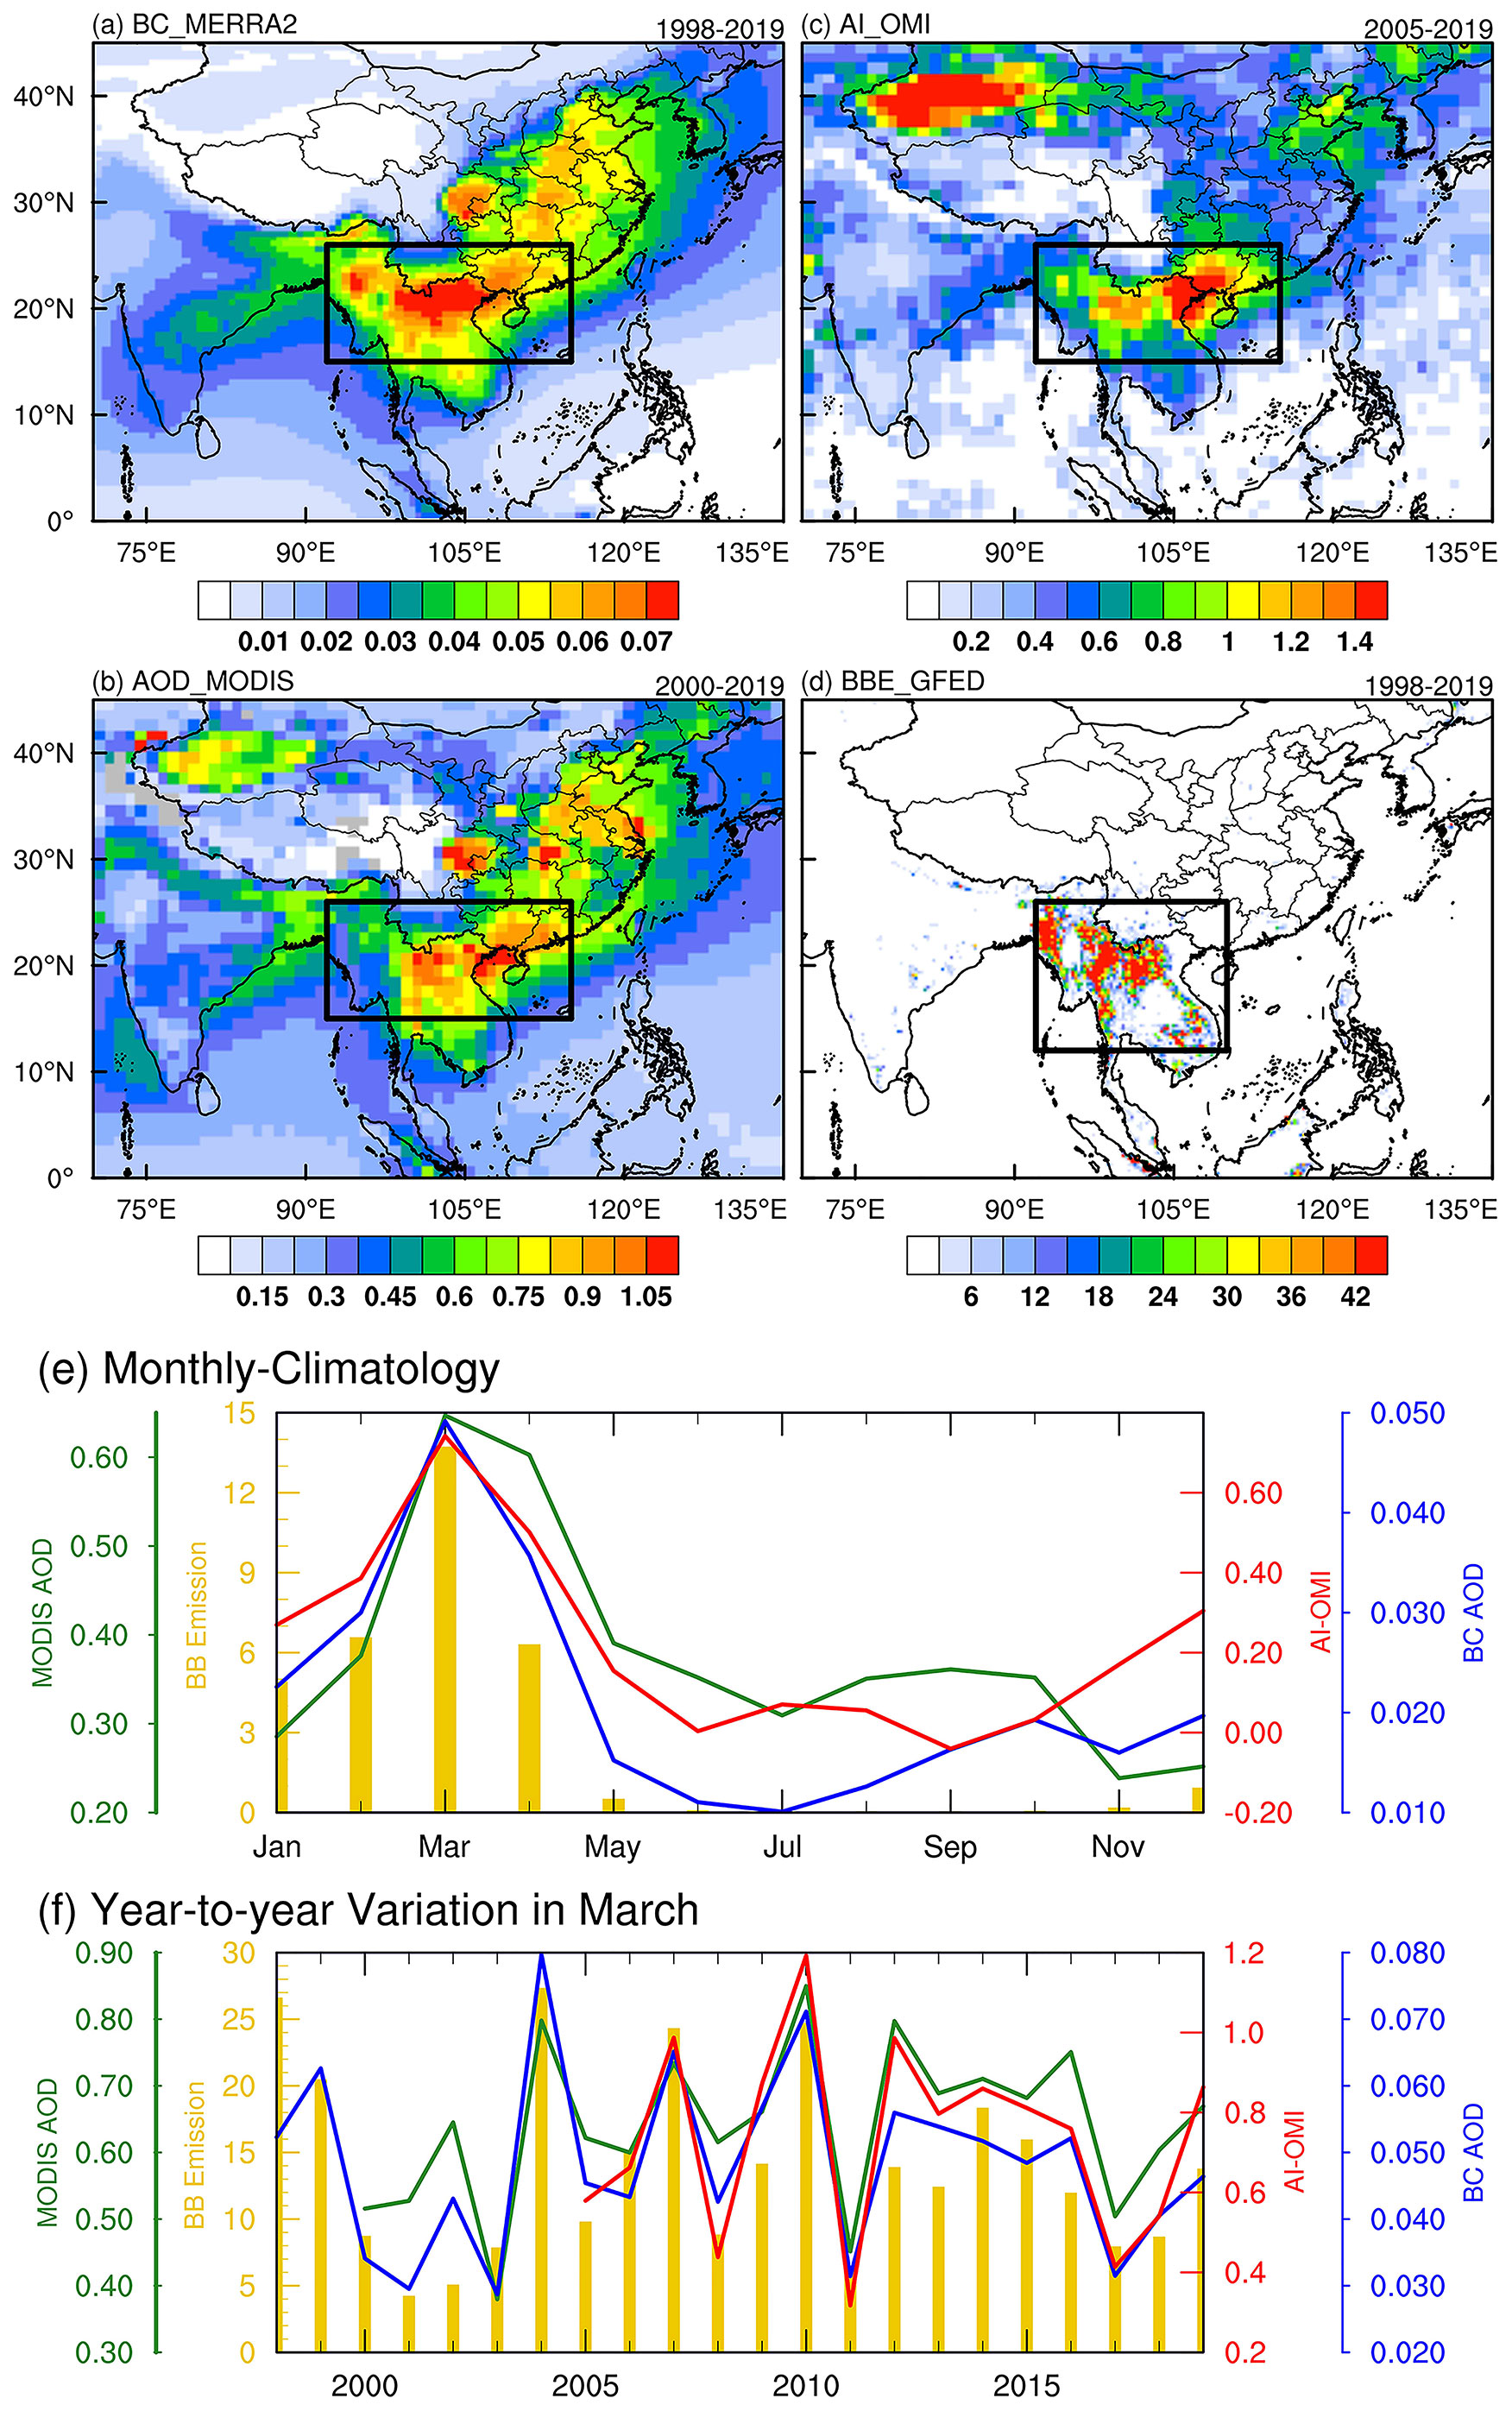
Figure 1Spatial distribution of March (a) black carbon (BC) aerosol optical depth (AOD; shading, unitless) averaged over 1998–2019 from MERRA-2, (b) AOD (unitless) averaged over 2000–2019 from MODIS Terra, (c) aerosol index (AI; unitless) averaged over 2005–2019 from OMI, and (d) biomass burning (BB) carbon emission (shading; g C m−2 month−1) averaged over 1998–2019 from GFEDv4.1. (e) Monthly climatology of BB aerosol indices (blue line for BC AOD, green line for AOD, red line for AI) and emission (gold bar) averaged over Indochina (92–115∘ E, 15–26∘ N for BC AOD, AOD, and AI; 92–110∘ E, 12–26∘ N for BB emission, as outlined by the black boxes in panels a–d). (f) Same as (e) but for the time series of monthly averaged BB aerosol indices in March.
In this study, we examine the impacts of March BB aerosols over the ICP using both observations and model experiments. In particular, we address the following questions. (1) What are the instant and delayed effects of March BB aerosols over the ICP on atmospheric circulation and precipitation? (2) What are the differences between these two effects, and what are their underlying physical mechanisms? The remaining paper is organized as follows. In Sect. 2, we describe the data, methods, model, and experimental design. In Sect. 3, we present the observed evidence of BB aerosol impacts on circulation and precipitation. In Sect. 4, we discuss the responsible physical mechanisms based on simulation results. Conclusions and discussions are provided in Sect. 5.
2.1 Data and statistical methods
The meteorological and BC aerosol data used in this study are the Modern-Era Retrospective analysis for Research and Applications Version 2 (MERRA-2) from the National Aeronautics and Space Administration (NASA) Global Modeling and Assimilation Office (GMAO) (Gelaro et al., 2017), with a spatial resolution of 0.5∘ by 0.65∘ (longitude by latitude) on 72 levels. MERRA-2 reanalysis is the first satellite-era (1980 onward) reanalysis data jointly assimilating meteorological and aerosol observations. The MERRA-2 aerosol data are produced using the Goddard Chemistry Aerosol Radiation and Transport (GOCART) aerosol model coupled with the GEOS-5 data assimilation system. The GOCART model simulates five aerosol species: dust, black carbon, organic carbon, sulfate, and sea salt. GEOS-5 assimilates the bias-corrected aerosol optical depth (AOD) from the Advanced Very-High-Resolution Radiometer (AVHRR) instrument over the ocean (Heidinger et al., 2014), the Moderate-resolution Imaging Spectroradiometer (MODIS) from the Terra and Aqua satellites (Levy et al., 2010), Multiangle Imaging SpectroRadiometer (MISR) AOD over land (Kahn et al., 2005), and ground-based Aerosol Robotic Network (AERONET) AOD (Holben et al., 1998). Numerous evaluations of the MERRA-2 aerosol data have shown that both the AOD and the vertical structure of aerosol properties in MERRA-2 have good agreement with the observations (Buchard et al., 2017). In this study, we use the monthly mean BC AOD.
We also use the AOD from the 1∘ MODIS Terra Level-3 monthly product (MOD08_M3) (Gupta et al., 2016), the aerosol index (AI) from the 1∘ Ozone Monitoring Instrument (OMI)/Aura Level-3 daily product (OMAERUVd) (Torres et al., 2007), and BB emissions from the Global Fire Emissions Database version 4.1 (GFEDv4) (Randerson et al., 2017) to compare with MERRA-2 BC AOD. In addition, we use the atmospheric fields from the fifth-generation European Centre for Medium-Range Weather Forecasts (ECMWF) reanalysis data (ERA5) (Hersbach and Dee, 2016), including zonal and meridional wind components on a 0.25∘ grid. The monthly and daily precipitation data on the 0.25∘ grid are from the Tropical Rainfall Measuring Mission (TRMM) Multi-satellite Precipitation Analysis (TMPA) 3B43 and 3B42 (Huffman et al., 2007), respectively.
For consistency, the precipitation data from the TRMM, the ERA5 reanalysis data, the GFEDv4 BB emissions, and the MERRA-2 BC AOD all cover the same period of 1998–2019. MODIS AOD and OMI AI cover the periods of 2000–2019 and 2005–2019, respectively. In this study, we focus on the effect of March BB aerosols on regional climate in early spring (1 March–20 April), including the instant effect in March and the delayed effect in early April (1st–10th) and mid April (11th–20th). The linear regression analysis is used and subjected to the two-tailed Student's t test for statistical significance.
2.2 Model and experimental design
In this study, WRF-Chem version 4.2.1 is used to simulate the evolution of BB aerosols and trace gases to investigate their interactions with meteorological conditions over the ICP and East Asia. The model is configured to cover the Bay of Bengal, the ICP, and East Asia (Fig. 2) with 331 × 255 grids at 27 km horizontal resolution and 42 levels from the ground to 50 hPa. The planetary boundary layer (PBL) processes are parameterized using the Mellor–Yamada–Janjic (MYJ) scheme with local vertical mixing (Janjić, 1994) combined with the Noah land surface model and the Monin–Obukhov scheme for the surface layer physical processes and the interaction with the land surface (Chen et al., 2010; Pahlow et al., 2001). The Rapid Radiative Transfer Model for General circulation models (RRTMG) coupled with the aerosol radiative effect is used for both shortwave (SW) and longwave (LW) radiation (Iacono et al., 2008). The double-moment Morrison microphysics scheme (Morrison et al., 2009) and the Grell–Freitas (GF) cumulus scheme (Grell and Freitas, 2014) are used to ensure that aerosol indirect effects are included. The Carbon-Bond Mechanism version Z (CBMZ) gas-phase chemistry mechanism combined with the Model for Simulating Aerosol Interactions and Chemistry (MOSAIC) aerosol module (Zaveri and Peters, 1999; Zaveri et al., 2008) is selected for aerosol simulation. Aerosol optical properties are calculated based on the Maxwell Garnett approximation (Bohren and Huffman, 1998).
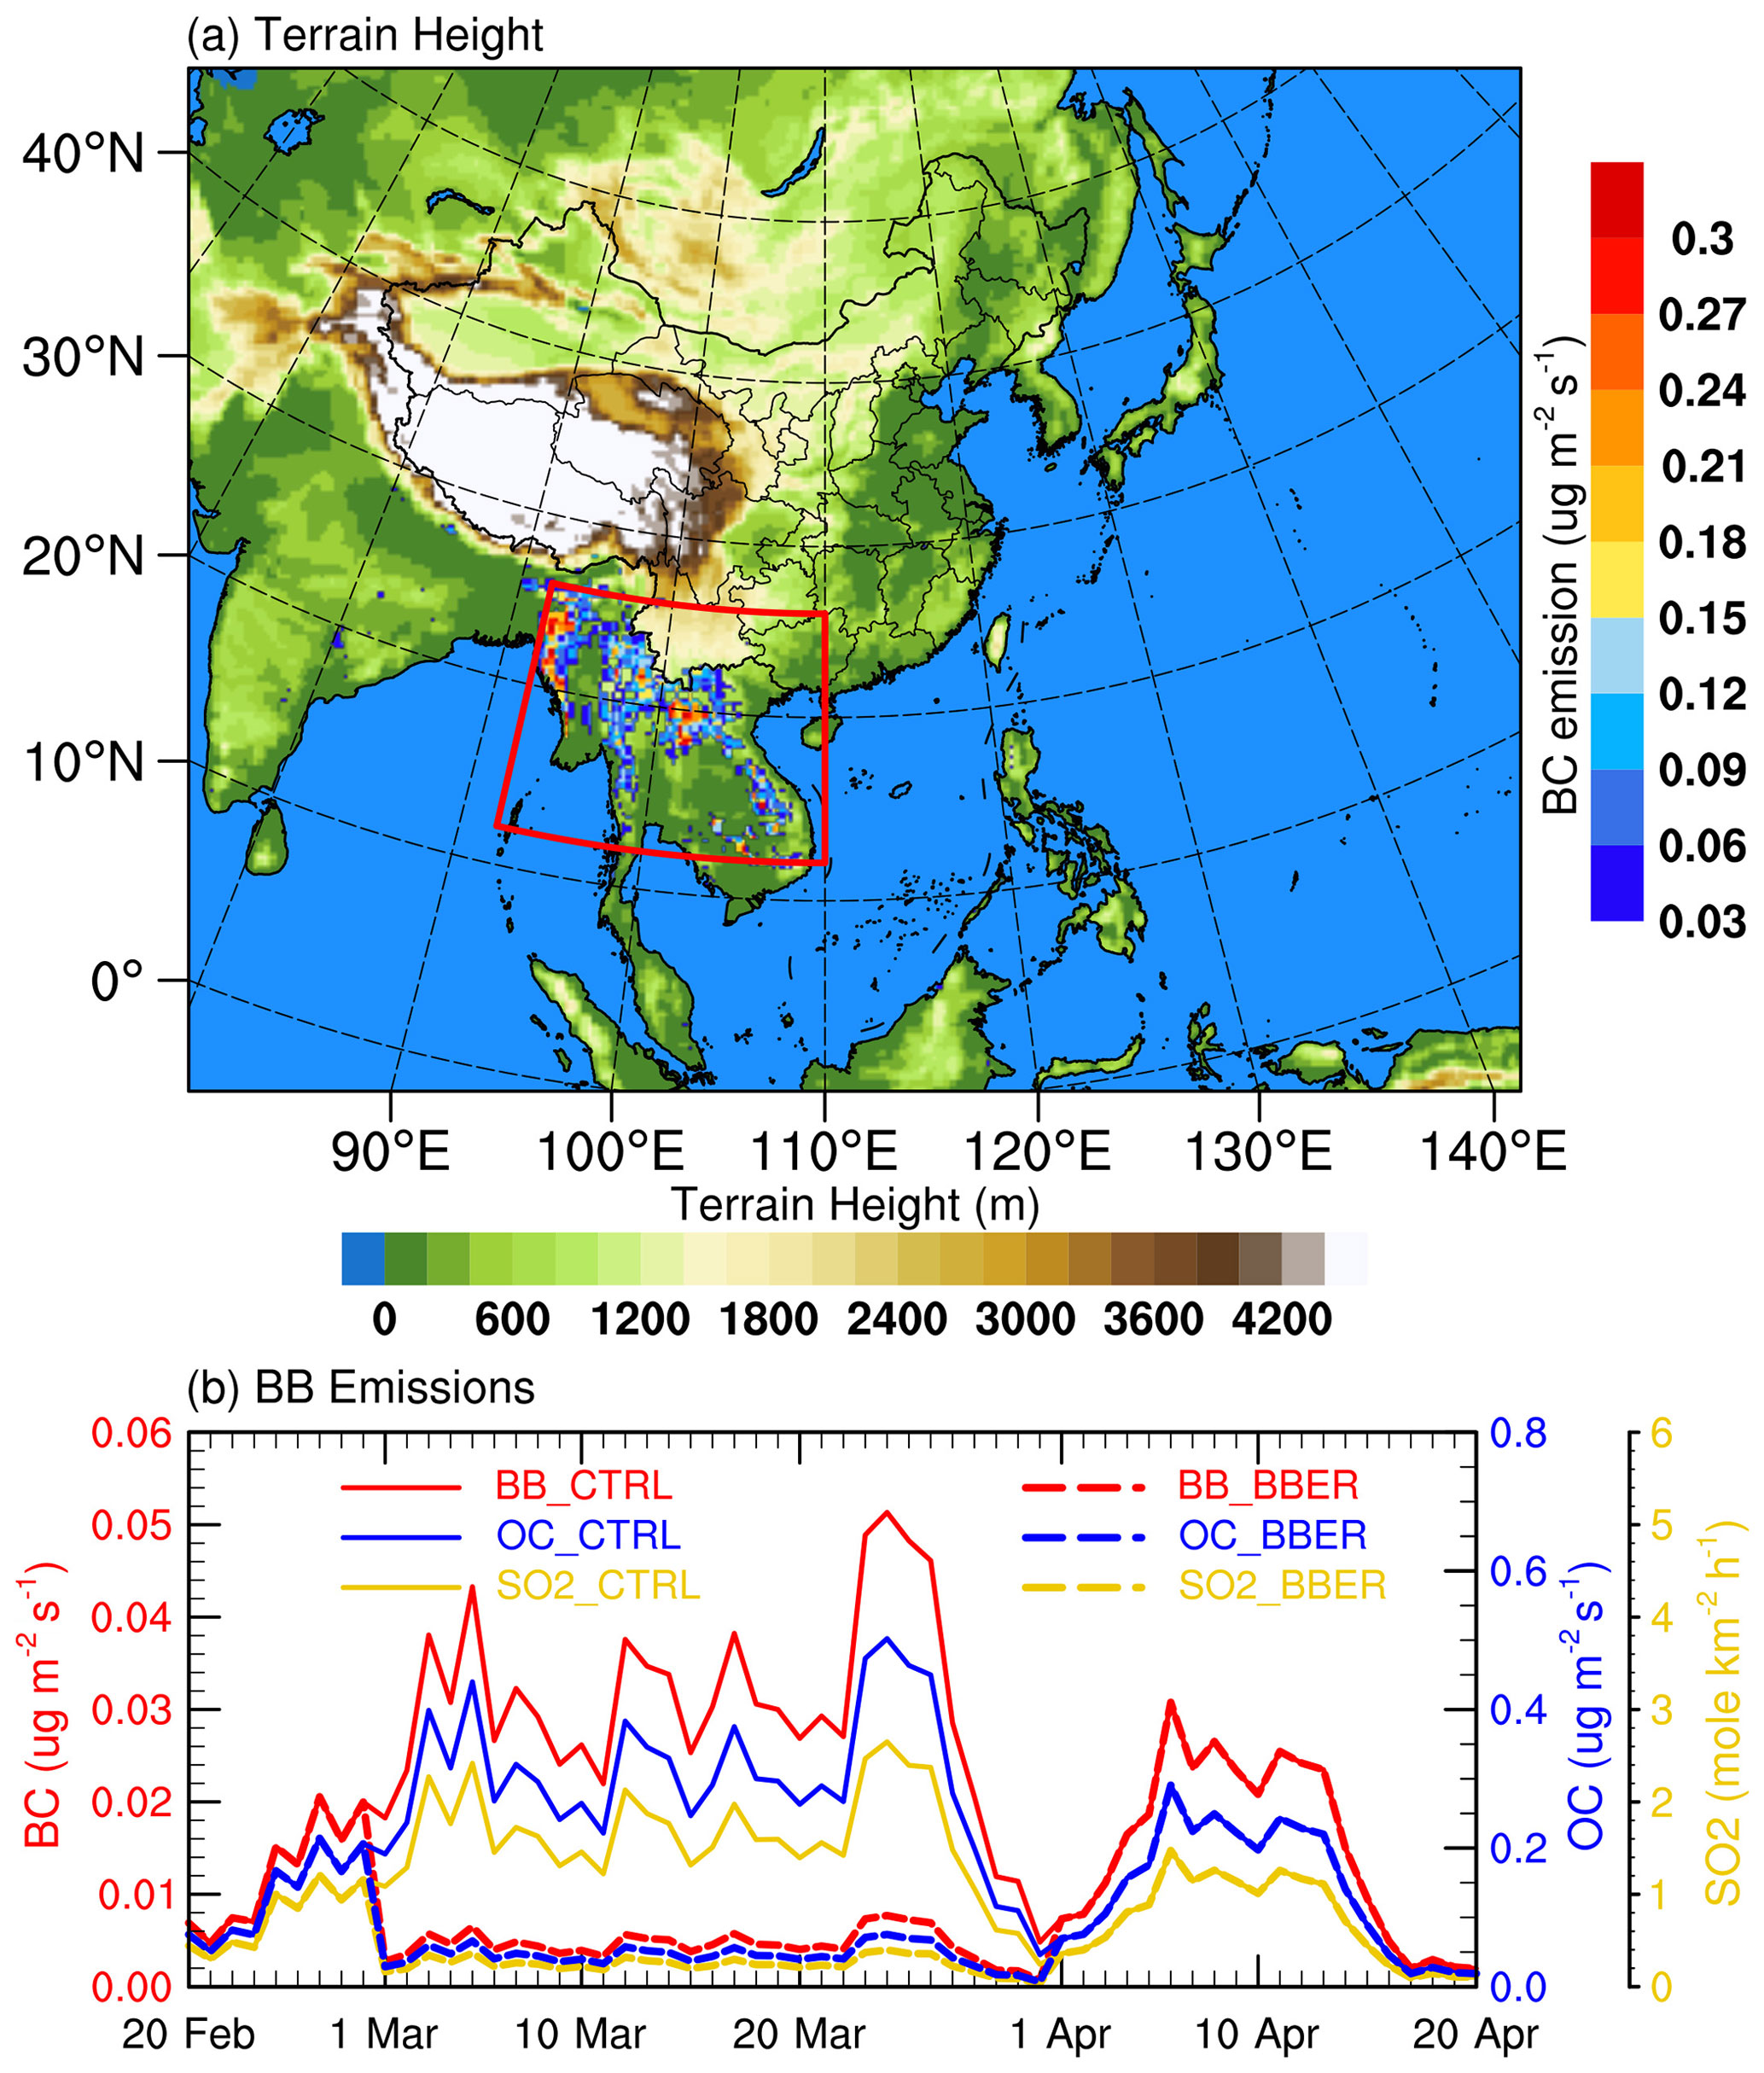
Figure 2(a) Model domain, orography (shading; m) and March BC emission input in the model from BB based on the Fire INventory from NCAR (FINN) version 1.5. (b) The time series of BB emissions (BC, OC, and SO2) averaged over Indochina (92–110∘ E, 12–26∘ N, as outlined by the red box in panel a) from 20 February to 20 April 2010. The solid curves are the emissions for the control experiment (CTRL). The dashed curves are the emissions for the sensitivity experiment (BBER); i.e., the March emissions are reduced to 15 %.
The boundary and initial conditions of meteorological fields are derived from the National Centers for Environmental Prediction (NCEP) Final Analysis (FNL) data with 1∘ spatial resolution and a 6 h temporal interval. The input sea-surface temperature (SST) data are the NCEP real-time global SST analysis. The anthropogenic emission source comes from the Multi-resolution Emission Inventory for China (MEIC) database for China (Li et al., 2017a) and from the MIX inventory (Li et al., 2017b) for regions outside of China. The biogenic emissions are calculated online using the Model of Emissions of Gases and Aerosols from Nature (MEGAN) (Guenther et al., 2012). The GOCART dust emission scheme with the Air Force Weather Agency (AFWA) modifications (LeGrand et al., 2019) is used to simulate dust emissions. The high-resolution fire emissions based on the Fire INventory from NCAR (FINN) version 1.5 (Wiedinmyer et al., 2011) are selected as the BB emissions. Specific settings are listed in Table 1.
Note that the choice of BB emission inventory could significantly affect the simulated aerosols due to the uncertainty in emission inventories introduced by a variety of measurements or analysis procedures, including detection of fire or areas burned, retrieval of fire-radiative power, emission factors, biome types, burning stages, and fuel consumption estimates (T. Liu et al., 2020; Pan et al., 2020). While the comparison of BB emission inventories is beyond the scope of this study, the FINN version 1.5 utilized in this study is widely used in BB aerosol modeling investigations (Lee and Wang, 2020; L. Liu et al., 2020; Wang et al., 2021; Takeishi and Wang, 2022); nevertheless, the potential impact of using different inventories needs to be kept in mind.
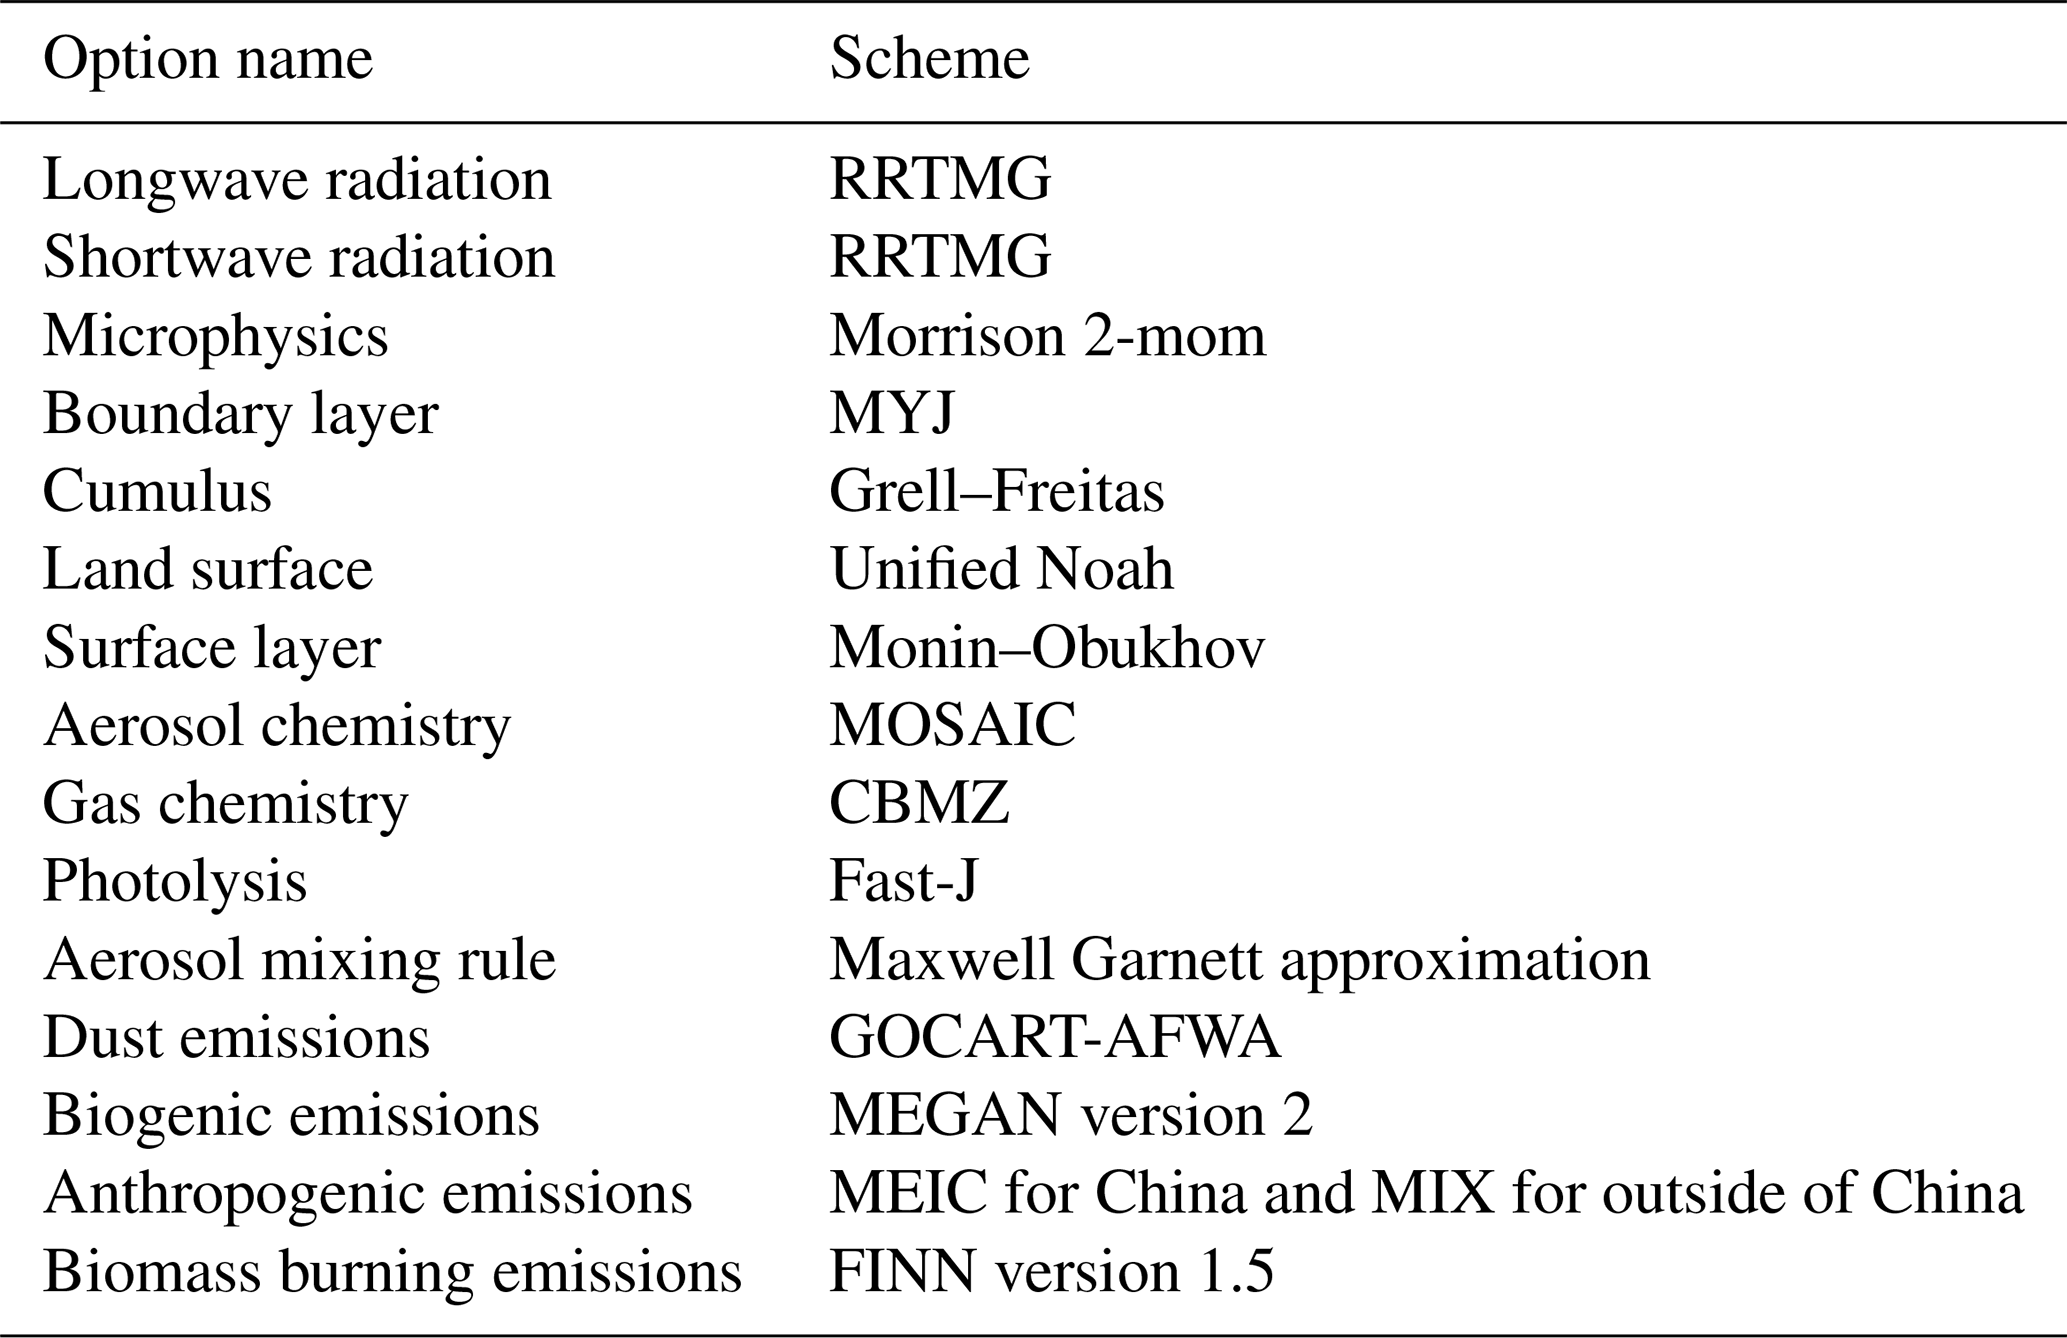
Table 1WRF-Chem model parameterization option settings and emissions used in this study.
To investigate the impacts of March BB aerosols on radiation, circulation, and precipitation, we conduct two groups of simulations with different BB emission scenarios and compare these results. The control experiment (CTRL) has the original BB emissions, while the sensitivity experiment (BBER) has the March BB emissions reduced to 15 % (Fig. 2b). To increase the robustness of our findings, we use six ensemble members for each experiment by perturbing initial and boundary conditions; that is, the ensemble simulations start at 1 d apart on 20–25 February 2010, respectively, and all end on 30 April 2010. Thus, a different starting day in February for each member is discarded as the spinup time, and we only focus on the period from 1 March to 20 April 2010. We chose the year of 2010 for modeling because the BB emission in 2010 was greater than its climatology by about 1.7 standard deviations. We reduced BB emission to 15 % in the sensitivity experiment in this study, because the March BB emission over the ICP in 2001, the year with the lowest BB emission during 1998–2019, is roughly 15 % of that in 2010. It would be more realistic to investigate the effects of BB aerosols on atmospheric circulation and precipitation on the interannual timescale.
3.1 Variation in BB aerosols
For observational evidence of possible responses of atmospheric circulation and precipitation to BB aerosols, we first examine the spatial distribution of the climatological mean BB aerosols in March (Fig. 1a–d) and their temporal variation (Fig. 1f) via multiple data sources. The spatial pattern of BB aerosols from the aerosol reanalysis data (MERRA-2) is quite consistent with multiple satellite retrievals (Fig. 1a–d). The high BC aerosol loading is concentrated in the northern ICP with a maximum BC AOD exceeding 0.07 (Fig. 1a), which is contributed by BB emissions (Fig. 1d). High BC AOD also appears over the Sichuan Basin and central–eastern China, likely caused by anthropogenic activities (Qin and Xie, 2012; Ning et al., 2018). High MODIS AOD values are also seen over northwestern China (Fig. 1b), as large dust aerosols are emitted from the Taklimakan Desert in March (Bao et al., 2009). As positive AI generally represents absorbing aerosols (dust and smoke), high AI is found over the northern ICP and northwestern China (Fig. 1c). Unlike the high BC loading over the Sichuan Basin and central–eastern China (Fig. 1a), the AI is small over these regions, likely because the AI's sensitivity to aerosol amount increases more or less proportionally to the aerosol layer height, while any aerosol below about 1000 m is unlikely to be detected (de Graaf et al., 2005). The dust and BB aerosols are transported eastward at higher atmospheric levels and are more easily detected, whereas anthropogenic pollution transport mainly occurs within the boundary layer, giving rise to smaller AI (Kaskaoutis et al., 2010).
For temporal variation, the BC AOD from MERRA-2 over the ICP agrees well with satellite datasets and BB emissions. Figure 1f shows the time series of area-averaged monthly BB aerosol indices in March for the northern ICP (92–115∘ E, 15–26∘ N for BC AOD, AOD, and AI; 92–110∘ E, 12–26∘ N for BB emissions). The correlations between the time series of MERRA-2 BC AOD and MODIS AOD (2000–2019), AI (2005–2019), and BB emission (1998–2019) are 0.90, 0.93, and 0.85, respectively; all are statistically significant at the 99 % level. This indicates that the BB aerosols over the ICP have a large interannual fluctuation in March, consistent with the recent study by Ding et al. (2021) based on multiple satellite records. However, such interannual variation could be influenced by meteorological factors such as the India–Burma trough (W.-R. Huang et al., 2016) and El Niño–Southern Oscillation (ENSO) (Zhu et al., 2021). On the other hand, the interannual fluctuation can be used to detect climate effects of the aerosols. Given this, we define a BB aerosol index (BBAI) as the time series of MERRA-2 BC AOD (1998–2019, blue line in Fig. 1f) to explore BB aerosols' effects on atmospheric circulation and precipitation.
3.2 Relationship between BB aerosols and precipitation
Figure 3 shows the regressed anomalies of BC AOD, precipitation, and 850 hPa wind upon the BBAI in March and in early to mid April. In March, significant positive BC AOD anomalies are seen over the ICP, northern SCS, southern China, and the ocean south of Japan (Fig. 3a), as the BB aerosols emitted from the central and northern ICP are transported eastward by the prevailing winds (Lin et al., 2009; Huang et al., 2013, 2020; W.-R. Huang et al., 2016a). Correspondingly, the rainfall over the ICP is reduced by anomalous westerly wind, while the rainfall in coastal Southeast China is enhanced by anomalous southerly wind (Fig. 3d), forming a dipole anomaly structure.
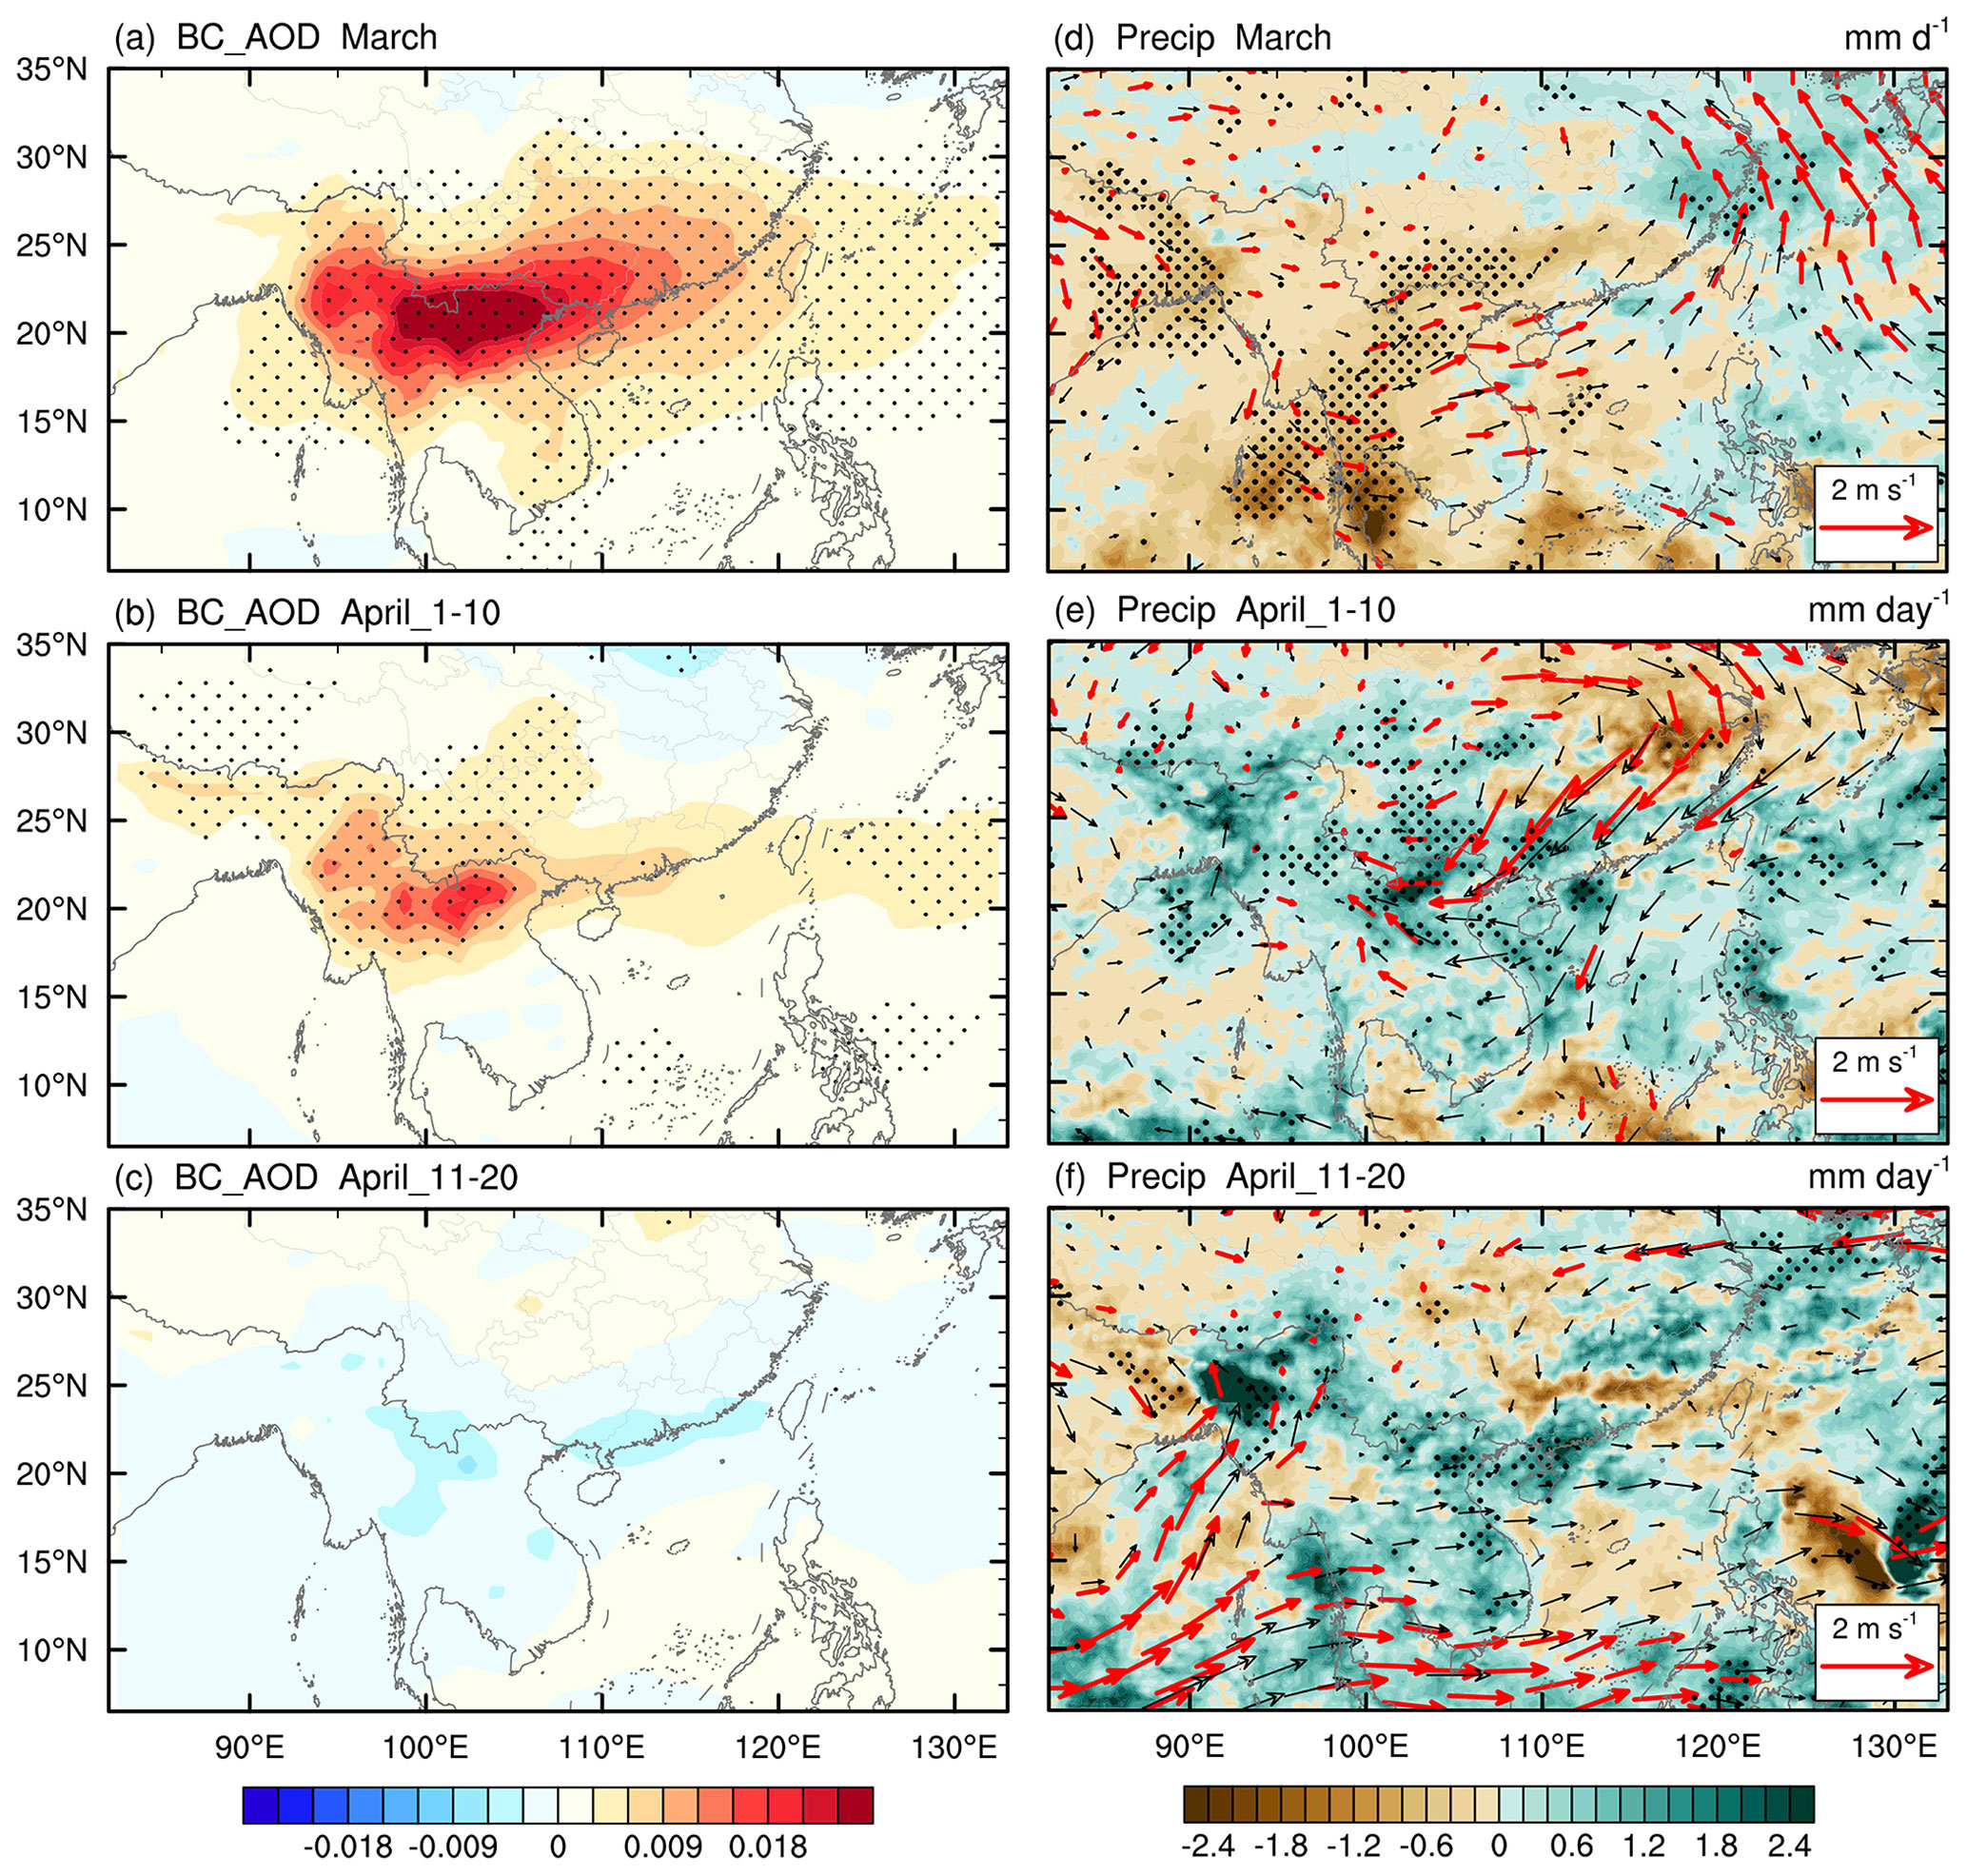
Figure 3Regressions of anomalies in (a–c) BC AOD (shading; unitless) and in (d–f) precipitation (shading; mm d−1) and 850 hPa wind (vector; m s−1) onto the standardized BBAI in (a, d) March, (b, e) early April, and (c, f) mid April. Stippling (red vector) denotes that the regressed anomalies of BC AOD and precipitation (of wind) are statistically significant at the 95 % confidence level based on a Student's t test.
Generally, the lifetime of BB aerosols and their eastward transport life cycle last a few days to weeks (Deng et al., 2008; Huang et al., 2020; Adam et al., 2021). Thus, significant positive BC AOD anomalies are still observed over the northern ICP, southwestern China, and the northwestern Pacific east of Taiwan in early April (Fig. 3b). However, the precipitation anomaly pattern is roughly opposite to that in March, with above-normal precipitation from the northern Bay of Bengal eastward to the northern SCS and below-normal precipitation over the middle and lower reaches of the Yangtze River (Fig. 3e). Correspondingly, significant anomalous northeasterly wind occurs from the middle and lower reaches of the Yangtze River toward the northern ICP, acting to reduce the climatological southwesterly wind and the water-vapor transport in southern China. When mid April comes, no significant BB aerosol anomalies can be found (Fig. 3c), but the positive precipitation anomalies still exist over the northern and eastern ICP and the Beibu Gulf, accompanied by anomalous westerly wind across the Indo-Pacific Ocean and southwesterly wind from the northern tropical Indian Ocean to the northwestern ICP (Fig. 3f). As no significant anomalies are found in circulation and precipitation after about 20 April, we will focus on the features in early to mid April.
As mentioned above, the March BB aerosols can reduce precipitation over the ICP in March but increase precipitation from 1 April to around 20 April, indicating that the effects of March BB aerosols on precipitation can last from March to early to mid April but with opposite effects in the 2 months. Due to the covariation of aerosols and meteorological fields, it is hard to determine the causality between BB aerosols over the ICP and atmospheric circulation (and precipitation), especially using instant observations. Therefore, in the following section, we will use two groups of WRF-Chem experiments to reveal the physical mechanisms responsible for these relationships.
4.1 Evaluation of model results
Figure 4a–b illustrate the spatial patterns of the observed and modeled rainfall and 850 hPa wind averaged from 1 March to 20 April 2010. The TRMM data show a large rainfall belt extending from the Nanling Mountains to the south of the Yangtze River (110–120∘ E, 23–30∘ N) (Fig. 4a), known as spring persistent rainfall in Jiangnan of China (SPRJ). (Note: Jiangnan is the name in Chinese for the region south of the Yangtze River.) In addition, large amounts of precipitation can also be found over the northwestern ICP region, which is typical orographic precipitation on the windward side of the slope. The WRF-Chem ensemble-mean rainfall based on six CTRL members (Fig. 4b) shows a spatial pattern consistent with that in the TRMM, and the pattern correlation is up to 0.71, although the model overestimates the convection in the northern tropical Indian Ocean, orographic precipitation in the northwestern ICP region, and rainfall south of Japan. Similar overestimated tropical convection and orographic precipitation can be seen in S. Yang et al. (2022) using the same model. It was reported that regional climate models, including the WRF, tend to overestimate precipitation due to deficiencies within the convective cloud and microphysical schemes (Caldwell et al., 2009; Argüeso et al., 2012). The atmospheric circulation in East Asia during early spring (1 March–20 April) 2010 is characterized by strong easterly winds across the tropical Indo-Pacific Ocean and southwesterly winds from the Bay of Bengal and SCS to southern China (Fig. 4a). In general, the model can reasonably capture these observed circulation features with the pattern correlations of 0.94 and 0.67 for the 850 hPa zonal and meridional wind components, respectively.
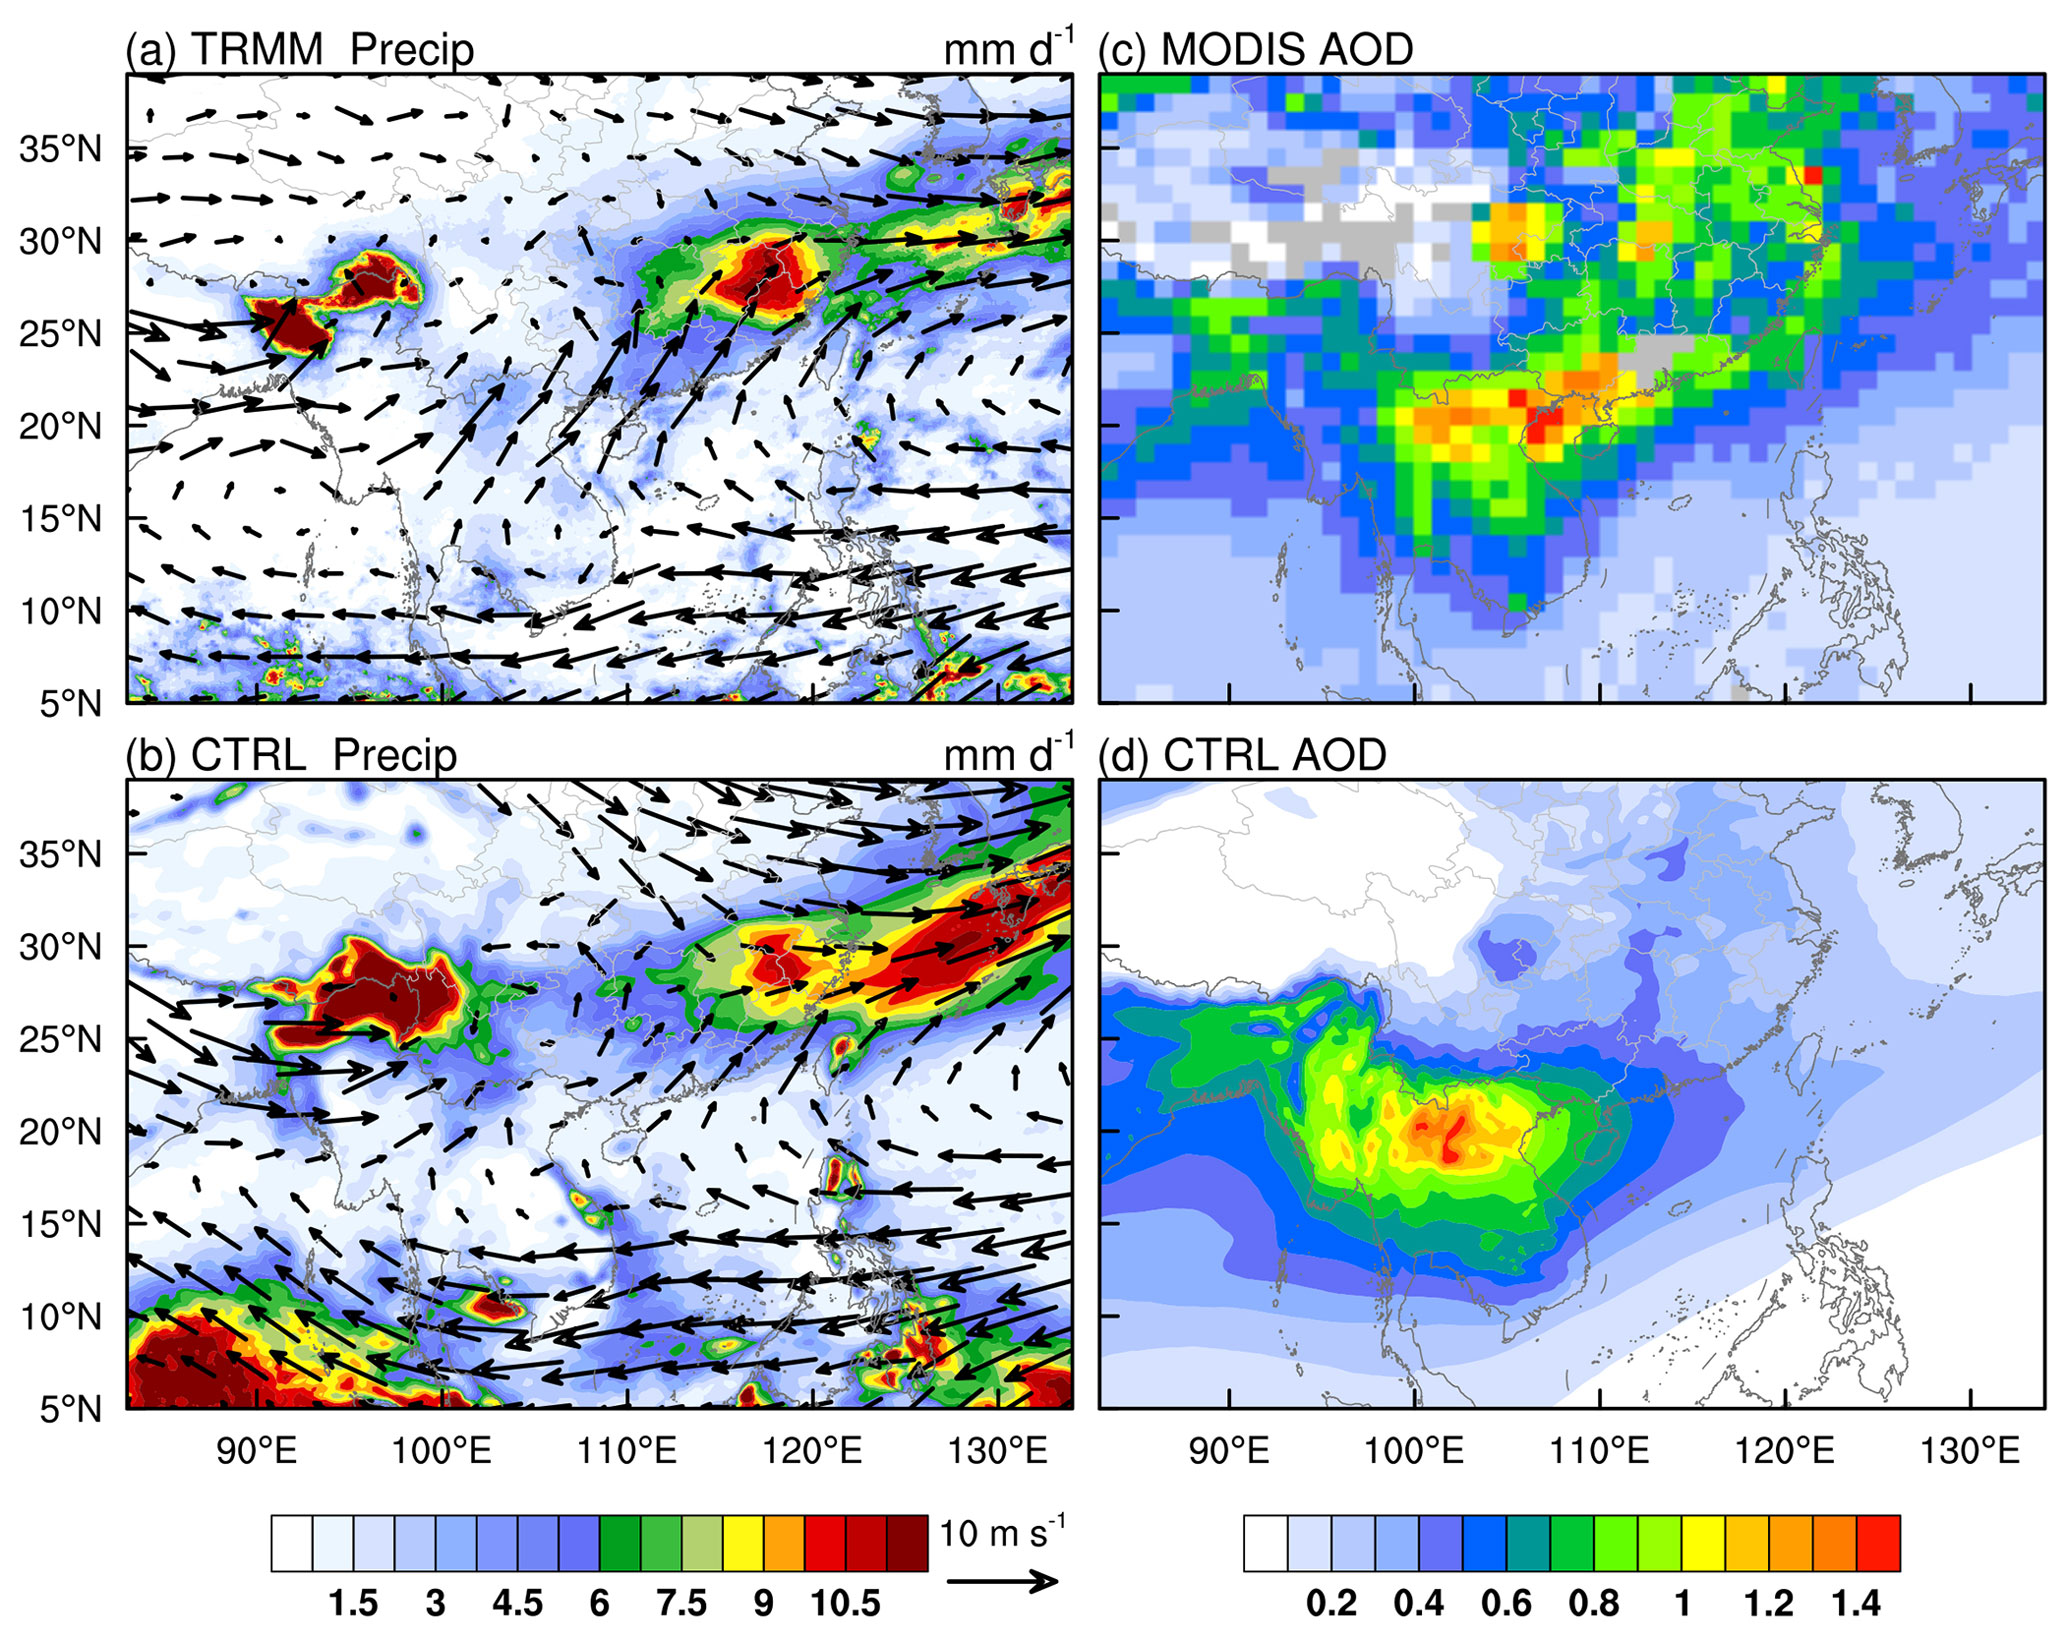
Figure 4Spatial distributions of precipitation (shading; mm d−1) and 850 hPa wind (vector; m s−1) averaged over the early spring (1 March to 20 April) of 2010 from (a) observations (TRMM precipitation and ERA5 wind) and (b) the ensemble mean of WRF-Chem CTRL. (c, d) Same as (a) and (b) but for AOD (shading; unitless) from (c) MODIS and (d) the ensemble mean of WRF-Chem CTRL.
The spatial pattern of modeled AOD is consistent with MODIS satellite retrieval, with the pattern correlation of 0.71. Figure 4c–d show that WRF-Chem can capture the observed high aerosol loading over the ICP; however, it underestimates the AOD over eastern China and its coastal regions. The model simulation underestimates the AOD by 25.63 % for the whole domain. The differences between model simulations and satellite data could be attributed to two potential factors. First, the WRF-Chem model does not fully cover the effect of relative humidity on AOD calculation, as increased relative humidity can lead to higher AOD because of aerosol humidification (Myhre et al., 2007). Second, the GOCART AFWA scheme can underestimate the dust aerosol concentration in northwestern China (Zhao et al., 2020), resulting in a lower AOD in northern China. Nevertheless, the WRF-Chem model has a good performance in simulating the BB aerosols over the ICP.
Generally, the model reproduces well the spatial distributions of rainfall, circulation, and aerosols. Specific evaluation statistics are summarized in Table S1 in the Supplement. Given this, the ensemble-mean differences between CTRL and BBER (i.e., CTRL minus BBER) are used to examine the effects of BB aerosols and the associated physical mechanisms.
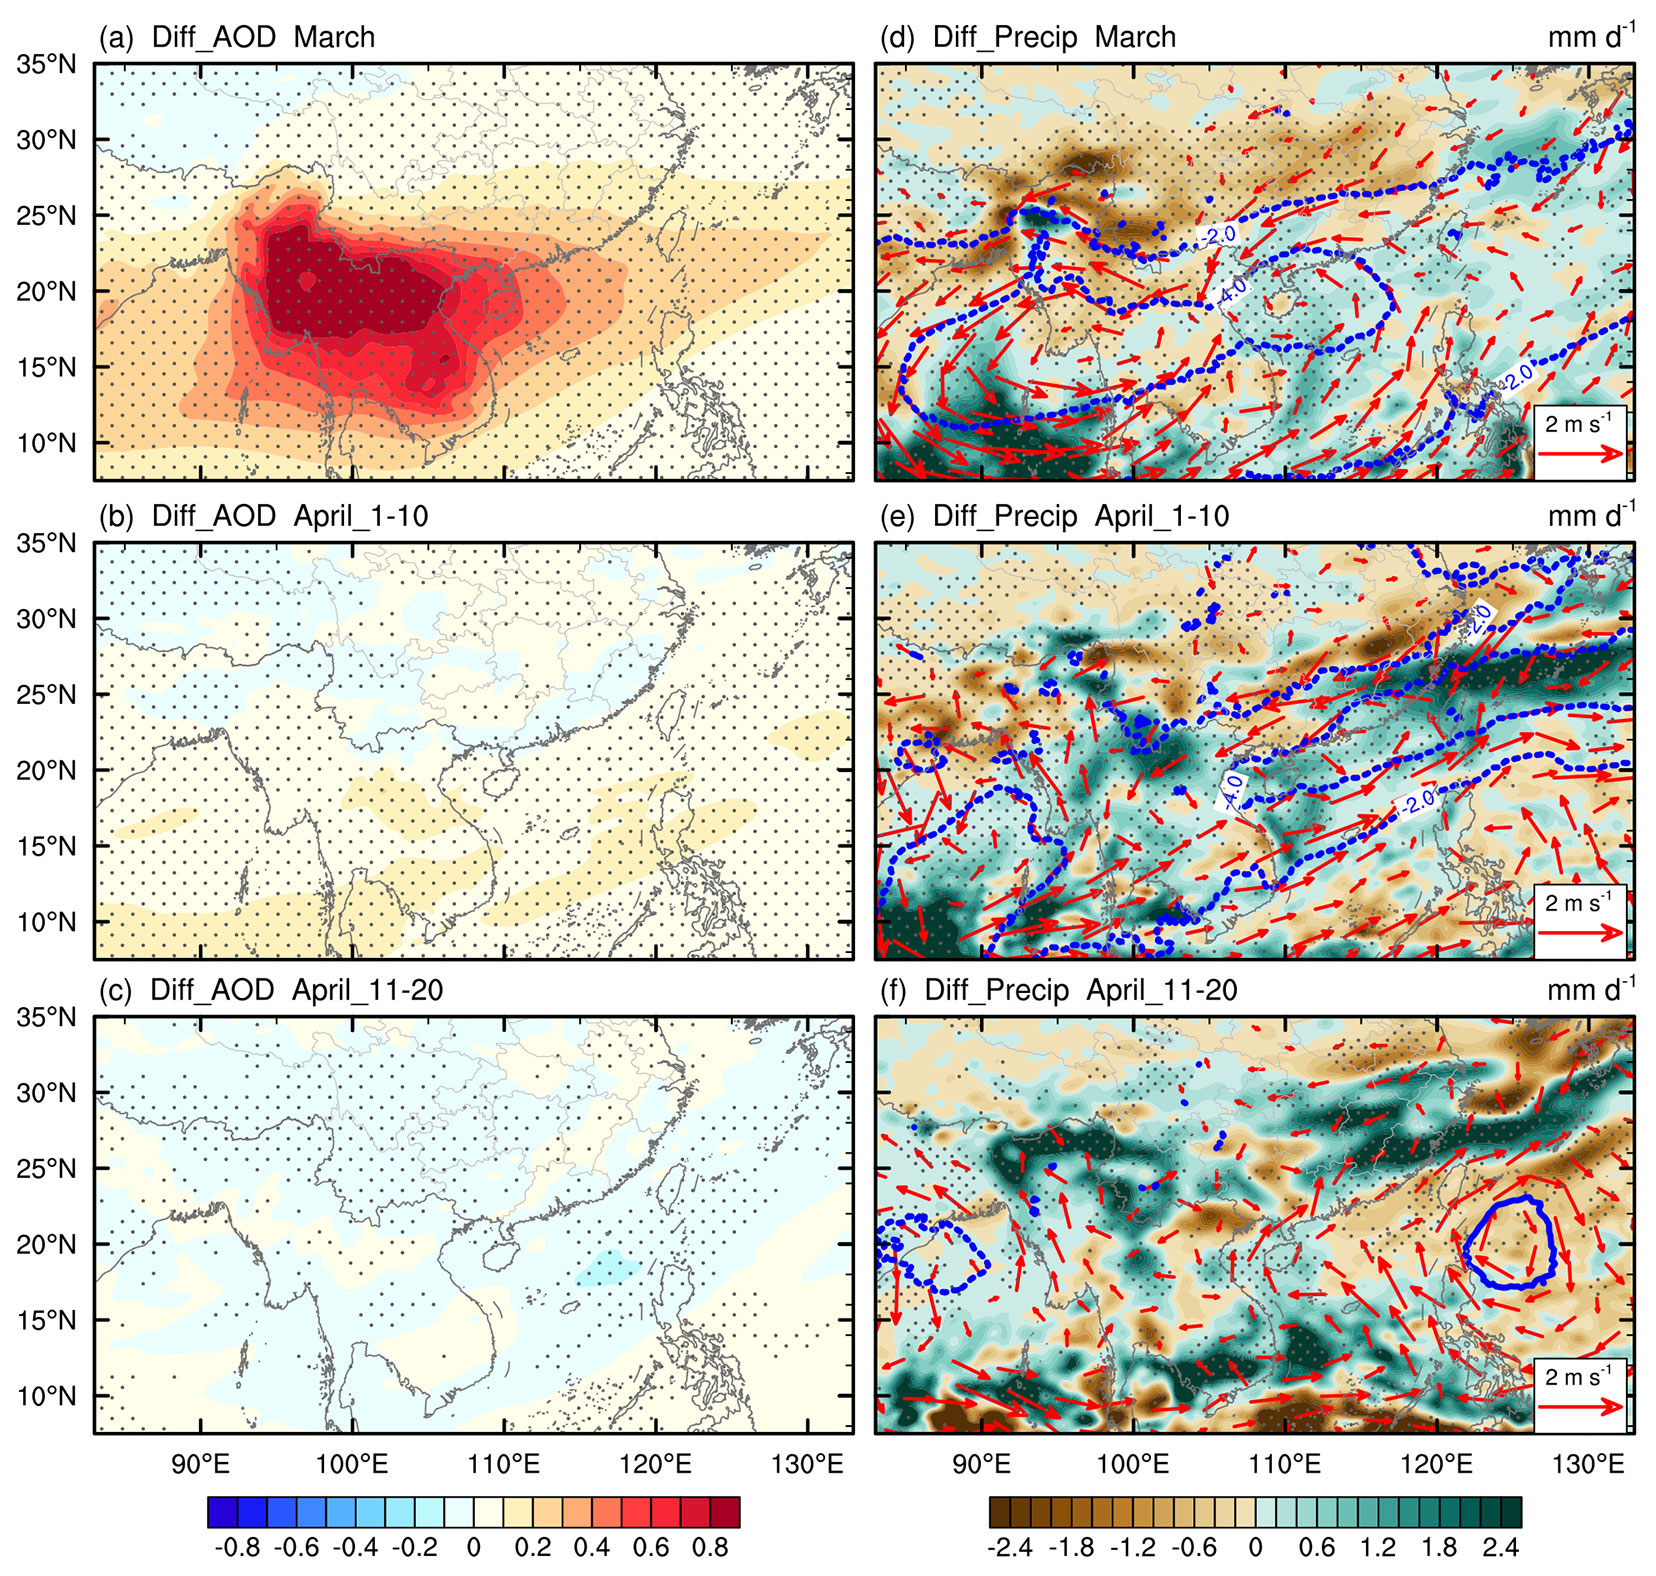
Figure 5WRF-Chem-simulated ensemble-mean differences in (a–c) AOD (shading; unitless) and (d–f) precipitation (shading; mm d−1), 850 hPa wind (vector; m s−1), and geopotential height (blue contours with an interval of 2 dagpm; the dashed contours are for negative values and the zero contour is omitted for clarity) between CTRL and BBER (i.e., CTRL minus BBER) during (a, d) March, (b, e) early April, and (c, f) mid April of 2010. Stippling (red vector) denotes the AOD and precipitation (wind) that are statistically significant at the 95 % confidence level based on a Student's t test.
4.2 Effects of BB aerosols
Figure 5 shows the BB aerosol-induced differences in AOD, rainfall, and 850 hPa wind during March and early to mid April of 2010. The BB aerosols significantly increased in March due to BB emissions, with a maximum AOD anomaly exceeding 1.2 over the northern ICP (Fig. 5a). The aerosol loading anomaly gradually decreased from the northern ICP to the northern SCS up to the northwestern Pacific, and the anomaly also declined westward from the ICP to the central Bay of Bengal (Fig. 5a). These are the results of BB aerosol dispersion downstream along with the subtropical westerlies and tropical easterlies. Lagrangian dispersion modeling for air mass shows that aerosols over the northern ICP can be transported to the northern SCS and southern China, while the aerosols over the southern ICP have westward trajectories of 11 %–31 % and partially reach the central Bay of Bengal (Fig. S1 in the Supplement). The AOD anomaly pattern of AOD agrees well with observations (Fig. 3a). The BB aerosol-induced anomalous circulation exhibits a belt-shaped low-pressure band in the lower troposphere (850 hPa) over Southeast Asia, with two centers located to the east (Hainan) and west (coastal southern Myanmar) of the ICP (Fig. 5d). Correspondingly, the precipitation decreased by roughly 13 % from the northern Bay of Bengal to southern China. This was probably because the anomalous easterly wind on the northern flank of the low-pressure zone acted to weaken the prevailing southwesterly wind (Fig. 4b), thereby reducing the moisture transport from the Bay of Bengal and SCS. In addition, the precipitation was reduced by about 15 % over most of the ICP (Fig. 5d), which was the emission source region. This might be related to the suppressive effect of BB aerosols on local convection (Hodnebrog et al., 2016; S. Yang et al., 2022). The largest rainfall reduction occurred in the northwestern ICP, with a maximum exceeding 2 mm d−1. The BB aerosol-induced rainfall reduction over the emission source region is consistent with observations (Fig. 3d). Enhanced precipitation occurred in the western and northern SCS, the East China Sea, and their coastal regions under southerly wind anomalies. These simulated changes in rainfall and circulation induced by March BB aerosols agree well with the results based on climate models (Lee et al., 2014; Chavan et al., 2021) and mesoscale weather models (Wang et al., 2021; S. Yang et al., 2022).
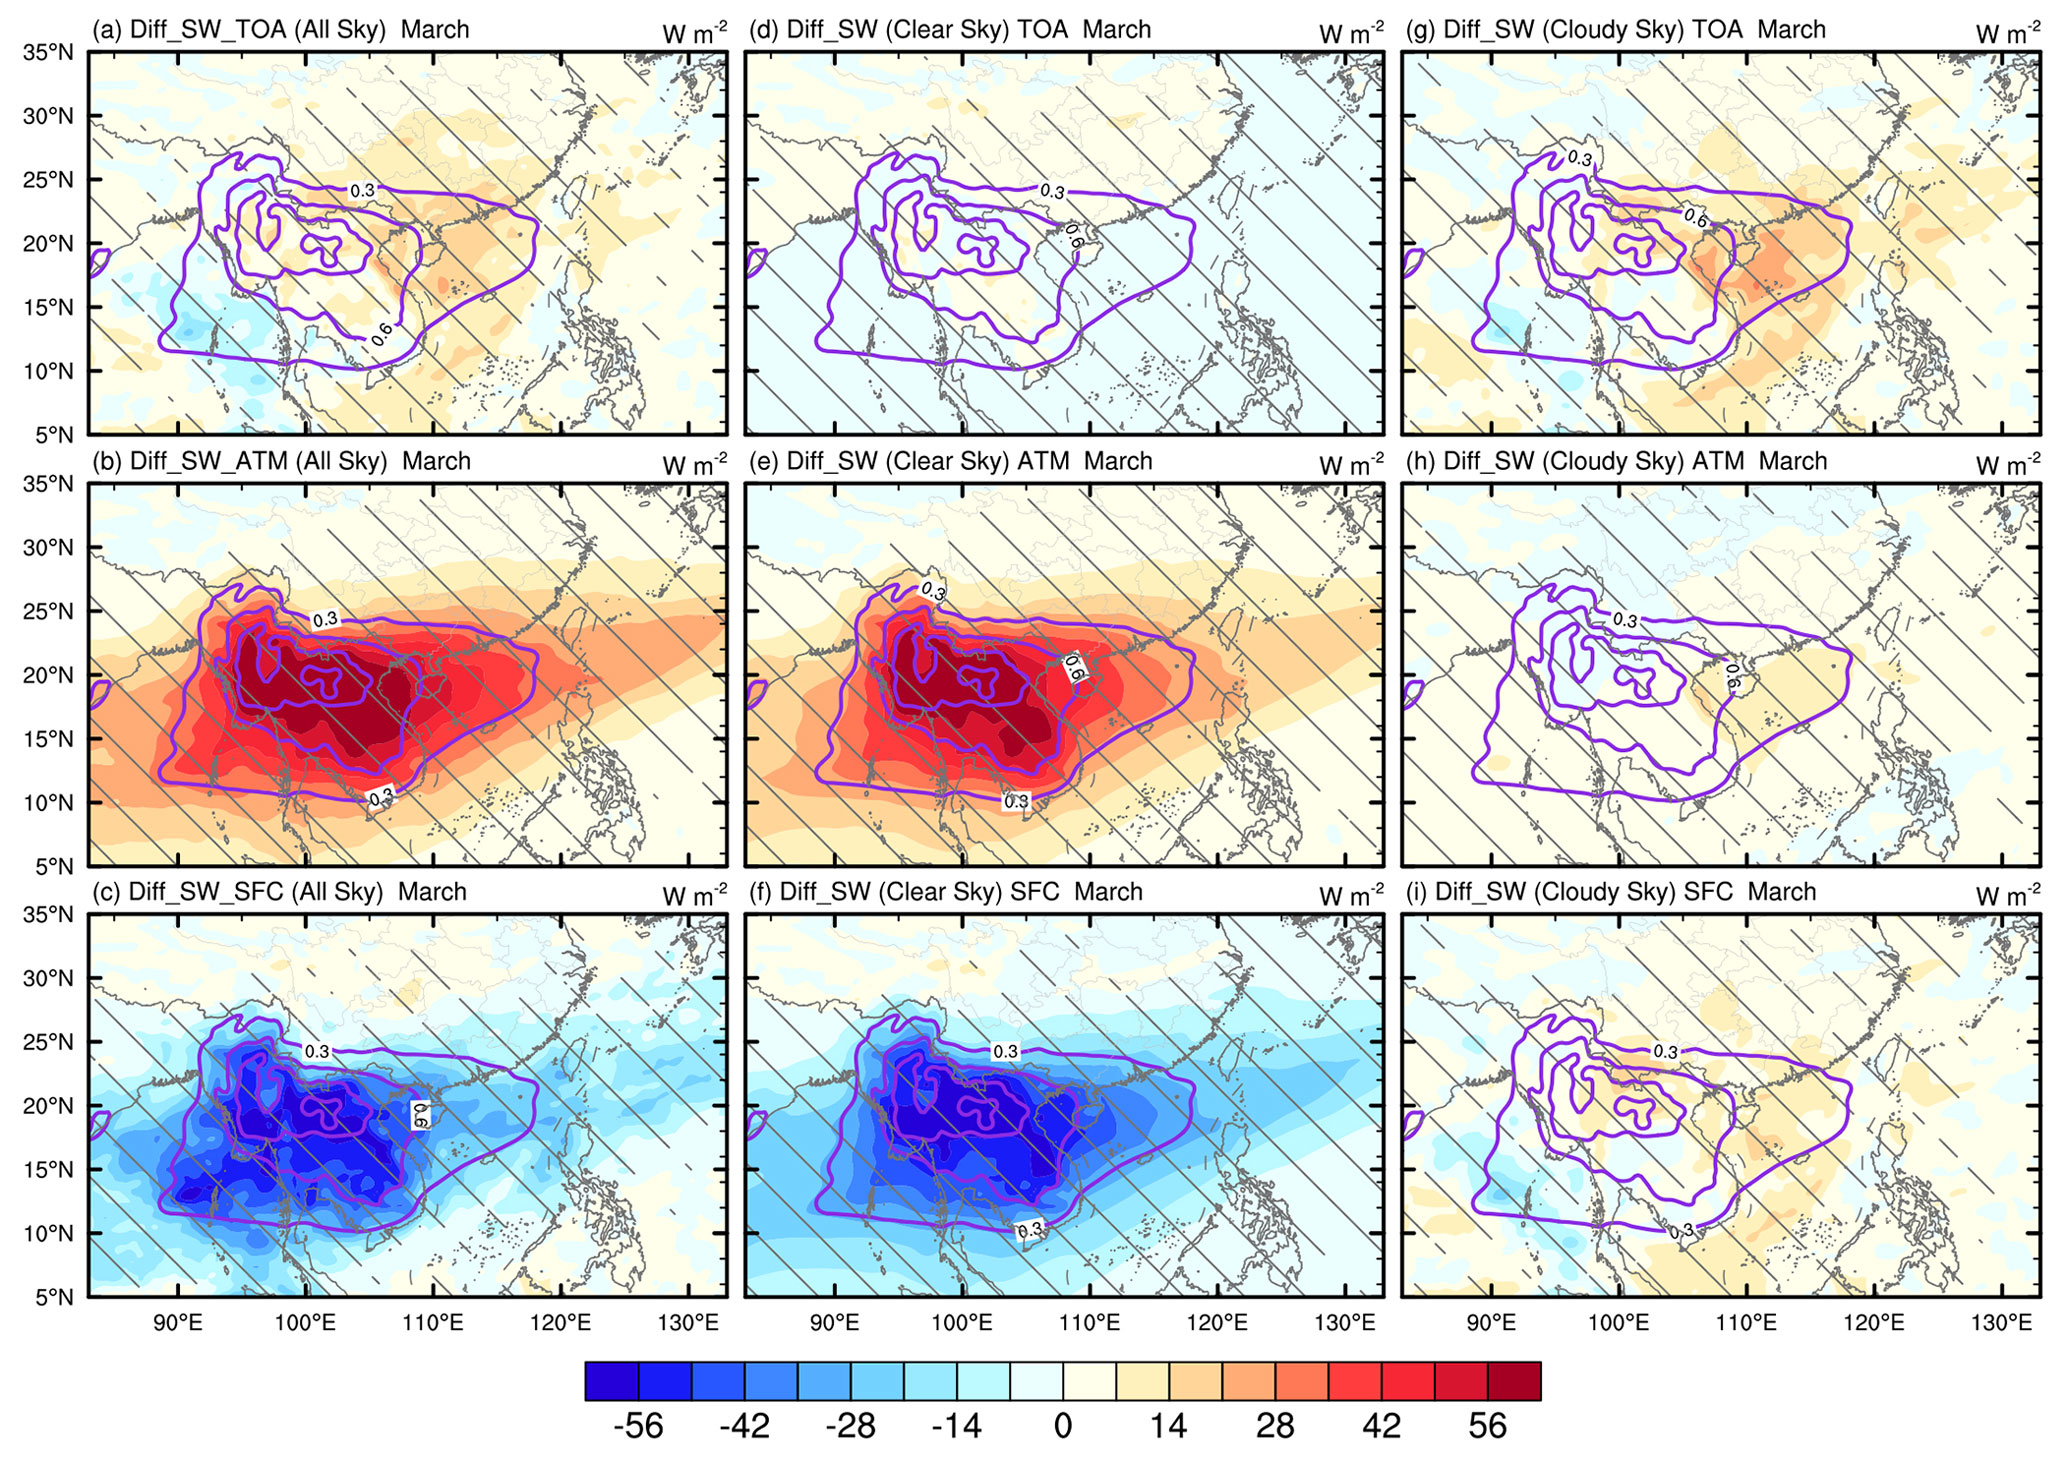
Figure 6(a–c) Differences (CTRL minus BBER) in all-sky net downward shortwave radiative flux (shading; W m−2) (a) at the top of the atmosphere (TOA), (b) in the atmosphere (ATM), and (c) at the surface (SFC) in March 2010. (d–f) and (g–i): same as (a)–(c) but for clear-sky and cloudy-sky differences, respectively. The purple contours with an interval of 0.3 denote AOD differences (CTRL minus BBER). Hatching denotes that the radiative effect is statistically significant at the 95 % confidence level based on a Student's t test.
As in the observations (Fig. 3b), positive aerosol anomalies due to March BB emissions were still evident (albeit smaller) in early April (Fig. 5b). The centers of the belt-shaped anomalous low at 850 hPa were located over coastal southern China and the southern Bay of Bengal (Fig. 5e). This indicates that the circulation response to March BB aerosols did not disappear immediately and could last from March to early April, although it became weak. However, the precipitation promotion due to March BB aerosols dominated over the entire ICP region in early April, in contrast to the rainfall reduction in March. Besides, the SPRJ rainband shifted markedly southward, characterized by reduced precipitation in the middle and lower reaches of the Yangtze River and by increased precipitation from coastal Southeast China to the East China Sea. These responses of rainfall and circulation to March BB emissions are similar to those in observations shown in Sect. 3.2. Since aerosol concentration anomalies in April were affected a little by the March BB emissions, the anomalous rainfall in early April could be potentially caused by the large-scale circulation change.
During mid April, no significant AOD differences appeared over the ICP (Fig. 5c). The BB aerosol-induced belt-shaped 850 hPa low-pressure band almost dissipated, with only a small cyclonic anomaly wind in the northern Bay of Bengal (Fig. 5f). The anomalous southerly wind in the western ICP transported moisture from the Bay of Bengal to the northern ICP and increased precipitation in the northwestern IPC along the topography on the southeastern side of the Tibetan Plateau. Clearly, the observed circulation and precipitation anomalies in mid April (Fig. 3f) can also be reproduced in the WRF-Chem model.
4.3 Physical mechanism underlying the BB aerosol–rainfall relationship
4.3.1 Instant effect
The BB aerosols can significantly change radiative forcing by absorption and scattering of solar radiation, leading to spatial perturbation and redistribution of energy (Chavan et al., 2021). Figure 6a–c show the BB aerosol-induced changes in net downward SW radiative fluxes at the top of the atmosphere (TOA), in the atmosphere, and at the surface under all-sky conditions in March. BB aerosols can absorb SW radiation and heat up the atmosphere. Thus, positive SW radiation anomalies dominate in the atmosphere over the regions with high BB aerosol loading, with a magnitude of 30–65 W m−2 from the Bay of Bengal across the ICP to the coastal region of South China and the SCS (Fig. 6b). At the surface, BB aerosols prevent the solar radiation from reaching the surface by scattering and absorption, which causes a surface cooling effect over the high BB aerosol loading regions, as shown in Fig. 6c. The maximum magnitude of the negative SW radiative flux anomalies is about 60 W m−2 in the northern ICP. The above BB aerosol-induced SW radiative forcing, both in the atmosphere and at the surface, is comparable in magnitude to that found previously (Lin et al., 2014; Pani et al., 2018; S. Yang et al., 2022).
At the TOA, the positive all-sky SW radiative flux anomalies induced by BB aerosols are above 15 W m−2 over North Vietnam, southern China, and the SCS but below 7.5 W m−2 over the BB emission source region in the northern ICP (Fig. 6a), which is consistent with previous results in both modeling (Lee and Kim, 2010; Dong et al., 2019) and measurement studies (Pani et al., 2016, 2018). Generally, BB aerosols can reflect and scatter more SW radiation back to space compared to BB aerosol-free cases, leading to a weak negative SW radiative forcing at the TOA, as demonstrated in some studies (Lee et al., 2014; Lin et al., 2014; Chavan et al., 2021; S. Yang et al., 2022). Nevertheless, absorbing BB aerosols can also switch from exerting a negative to a positive SW radiative effect at the TOA due to increased underlying cloud coverage or brightness of the underlying layer (Chand et al., 2009; Lu et al., 2018). Thus, under clear-sky conditions (i.e., radiative forcing by aerosols without the cloud–circulation feedback), the TOA SW radiative effect is negative over waters and weakly positive over most of the land (Fig. 6d) due to the high surface albedo contrast between those two underlying surfaces, while the strong TOA positive radiative effect over the downstream regions of the BB aerosols' transport is mainly due to the cloud–circulation feedback. Figure 6g–i show the radiative effects caused by changes in cloud fraction (measured as the all-sky minus clear-sky radiative effects). Positive radiative effects in cloudy conditions are mostly distributed along the coastal regions and the ocean waters off southern China and North Vietnam, with a magnitude of 14–28 W m−2. Greater cloud covers occur in these regions (Fig. 7a), which are concentrated in the lower troposphere (i.e., 1000–800 hPa; Fig. 7b). A previous study demonstrated that the enhancement of low clouds beneath the BB aerosol plume around 3 km over subtropical East Asia is caused by a synergetic effect of aerosol–cloud–boundary layer interaction with the monsoon (Ding et al., 2021). In turn, the BB aerosol plume uplifted above the clouds could absorb more solar radiation reflected from the cloud top, thus reducing the shortwave radiation reflected back to space (Dong et al., 2019). This also means that the increasingly thick and bright cloud layer underneath the BB aerosol plume would further amplify the direct warming effect in the atmosphere induced by BB aerosols (Ding et al., 2021), resulting in an increase in atmospheric warming by roughly 15 %–20 % (Fig. 6h). The spatial pattern of the net (LW+SW) radiative effect is dominated by the SW radiative effect, because the LW radiative effect is relatively small. Thus, the LW and net radiative effects are not shown here.
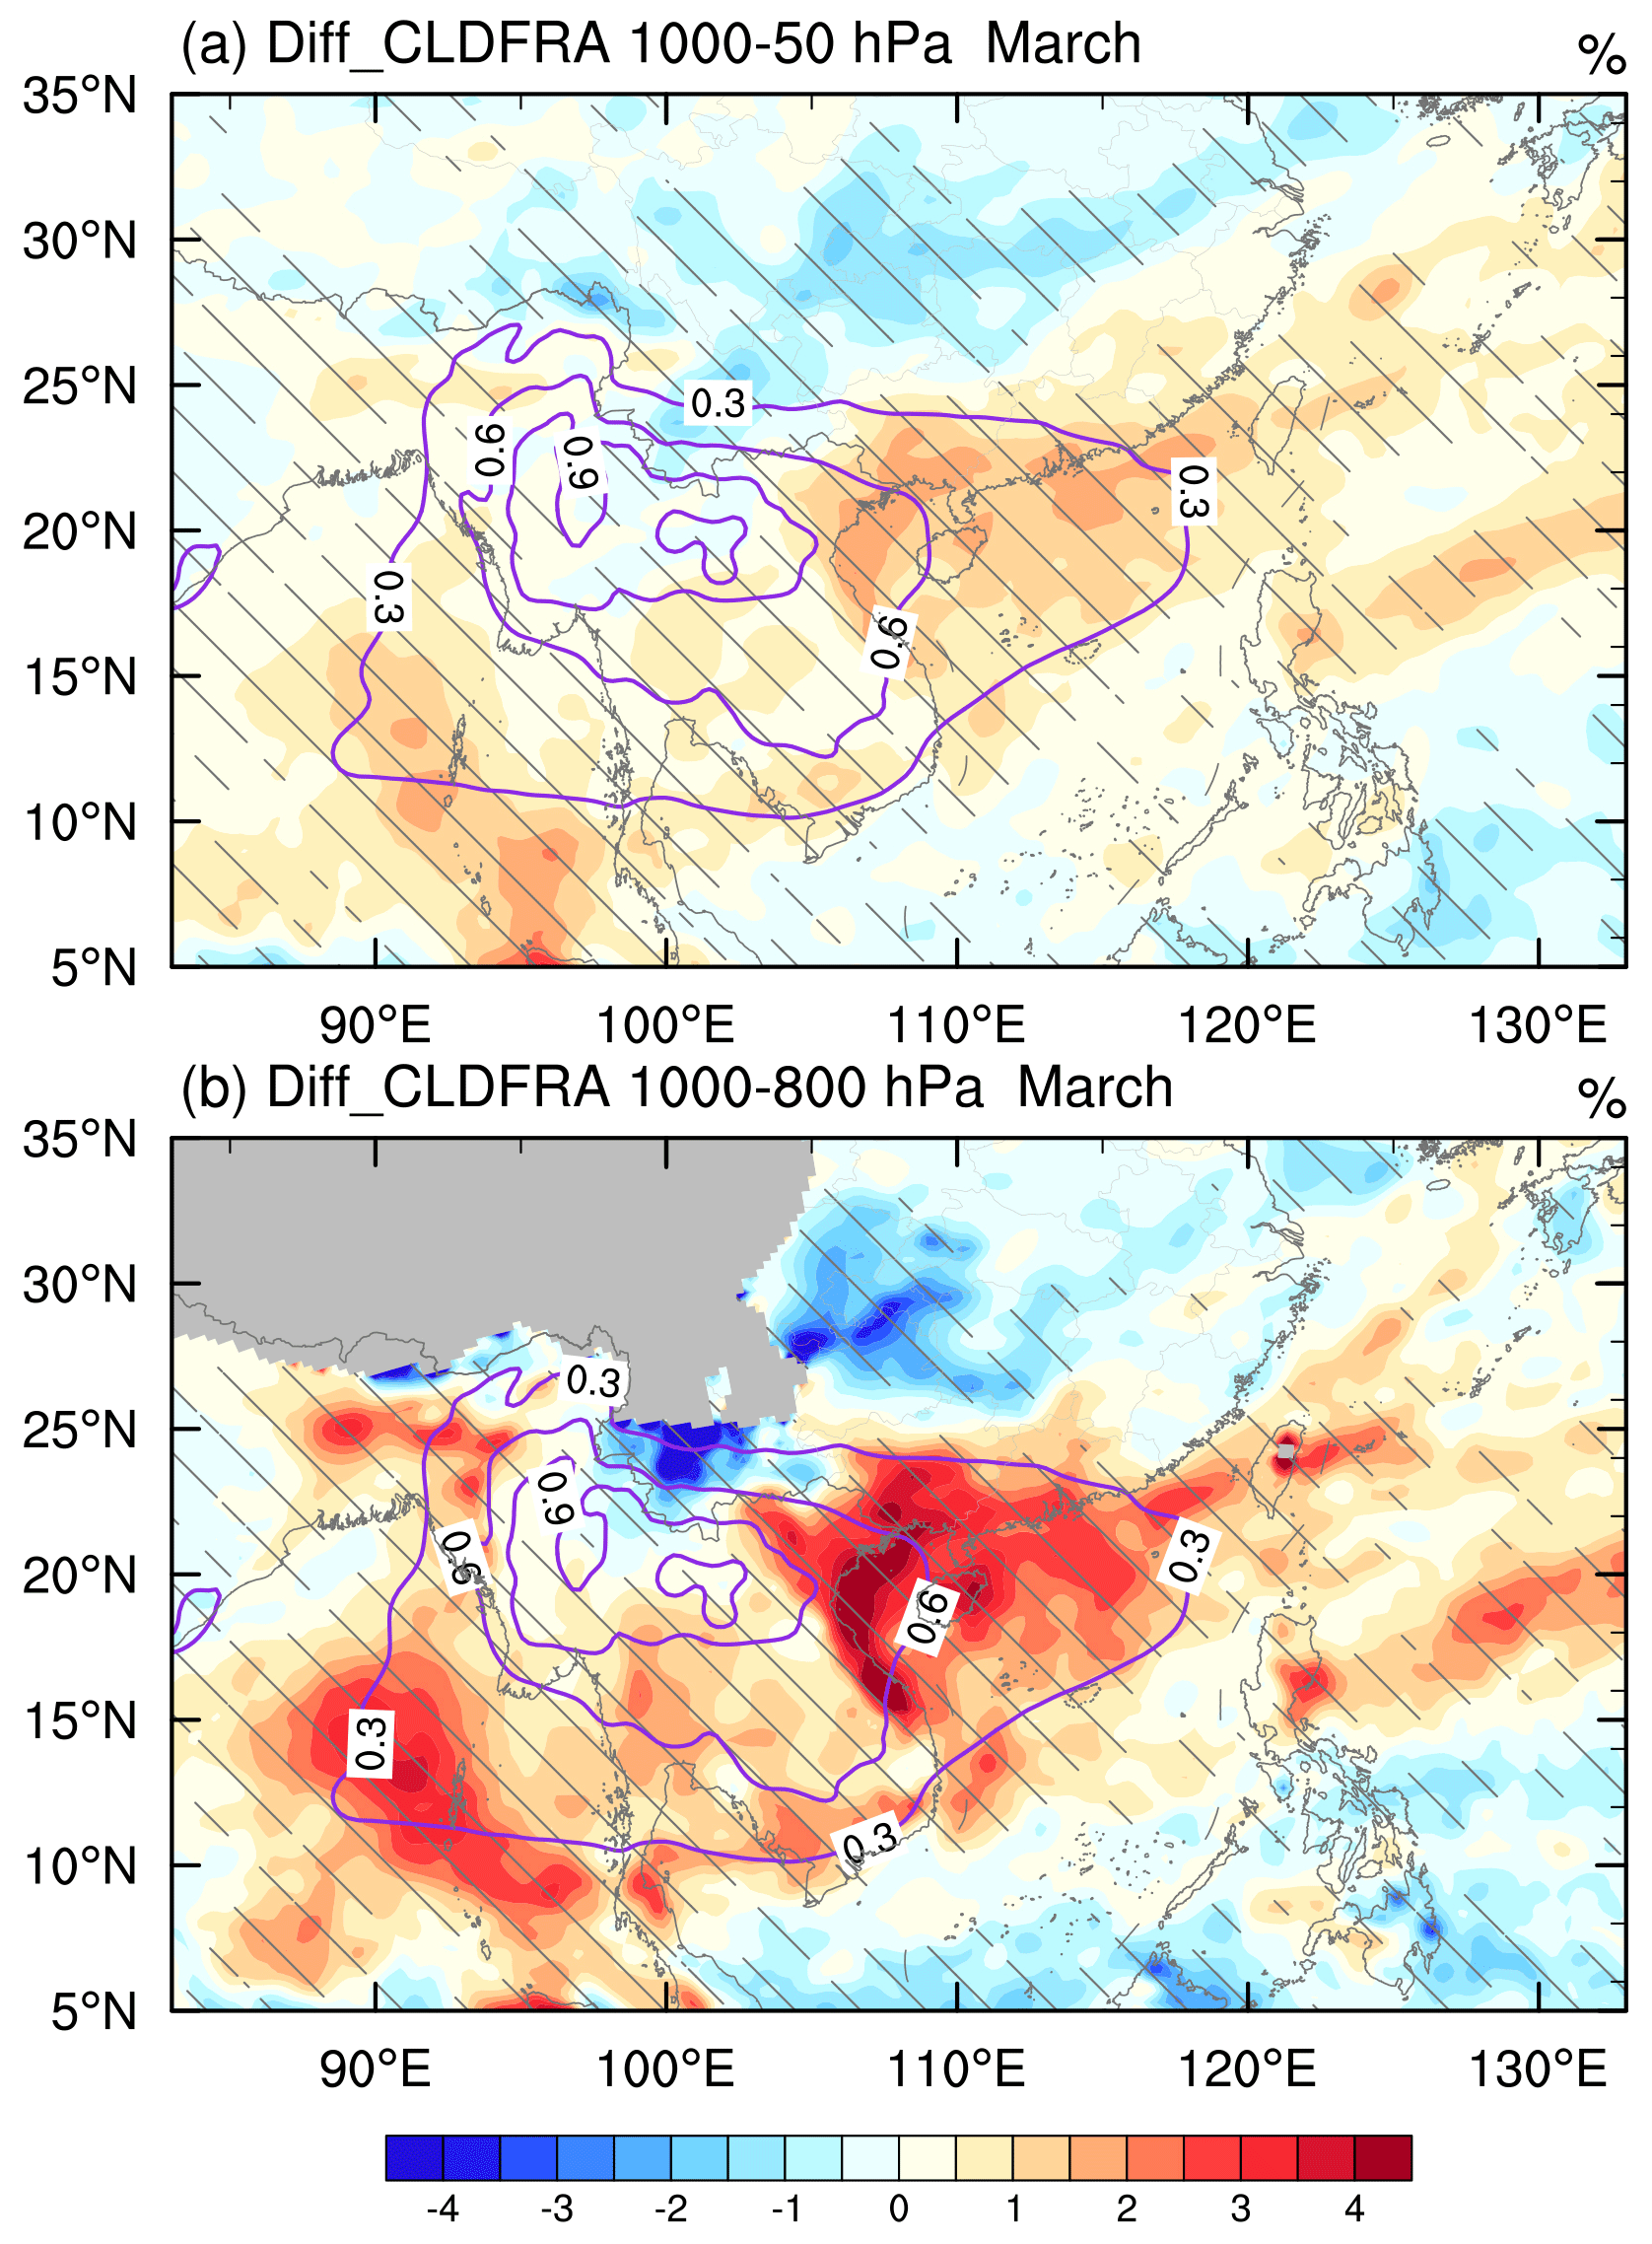
Figure 7Differences (CTRL minus BBER) in cloud fraction (shading; %) in the (a) entire atmospheric column (1000–50 hPa) and (b) lower troposphere (1000–800 hPa) in March 2010. The purple contours with an interval of 0.3 denote AOD differences. Hatching denotes that the cloud fraction change is statistically significant at the 95 % confidence level based on a Student's t test.
BB aerosols can dramatically alter the horizontal and vertical distributions of atmospheric temperatures through their radiative effects. Figure 8 shows the spatial pattern of BB aerosol-induced temperature changes from the surface to 500 hPa in March 2010. Due to the surface cooling effect of BB aerosols, the surface temperature was reduced by up to 1.6 K in the ICP, and the cooling could reach up to 850 hPa (Fig. 8a–b). The BB aerosol-induced warming at 700 hPa can be widely found from the Bay of Bengal across the ICP, the SCS, and southern China to the East China Sea, with a magnitude between 0.4 and 2.0 K (Fig. 8c), and such a warming pattern generally follows the AOD anomaly pattern. As a result, the BB aerosol-induced surface cooling and 700 hPa warming acted to increase the low-level atmospheric stability. In addition, a weak atmospheric cooling effect was found in the mid troposphere (500 hPa) over the ICP (Fig. 8d).
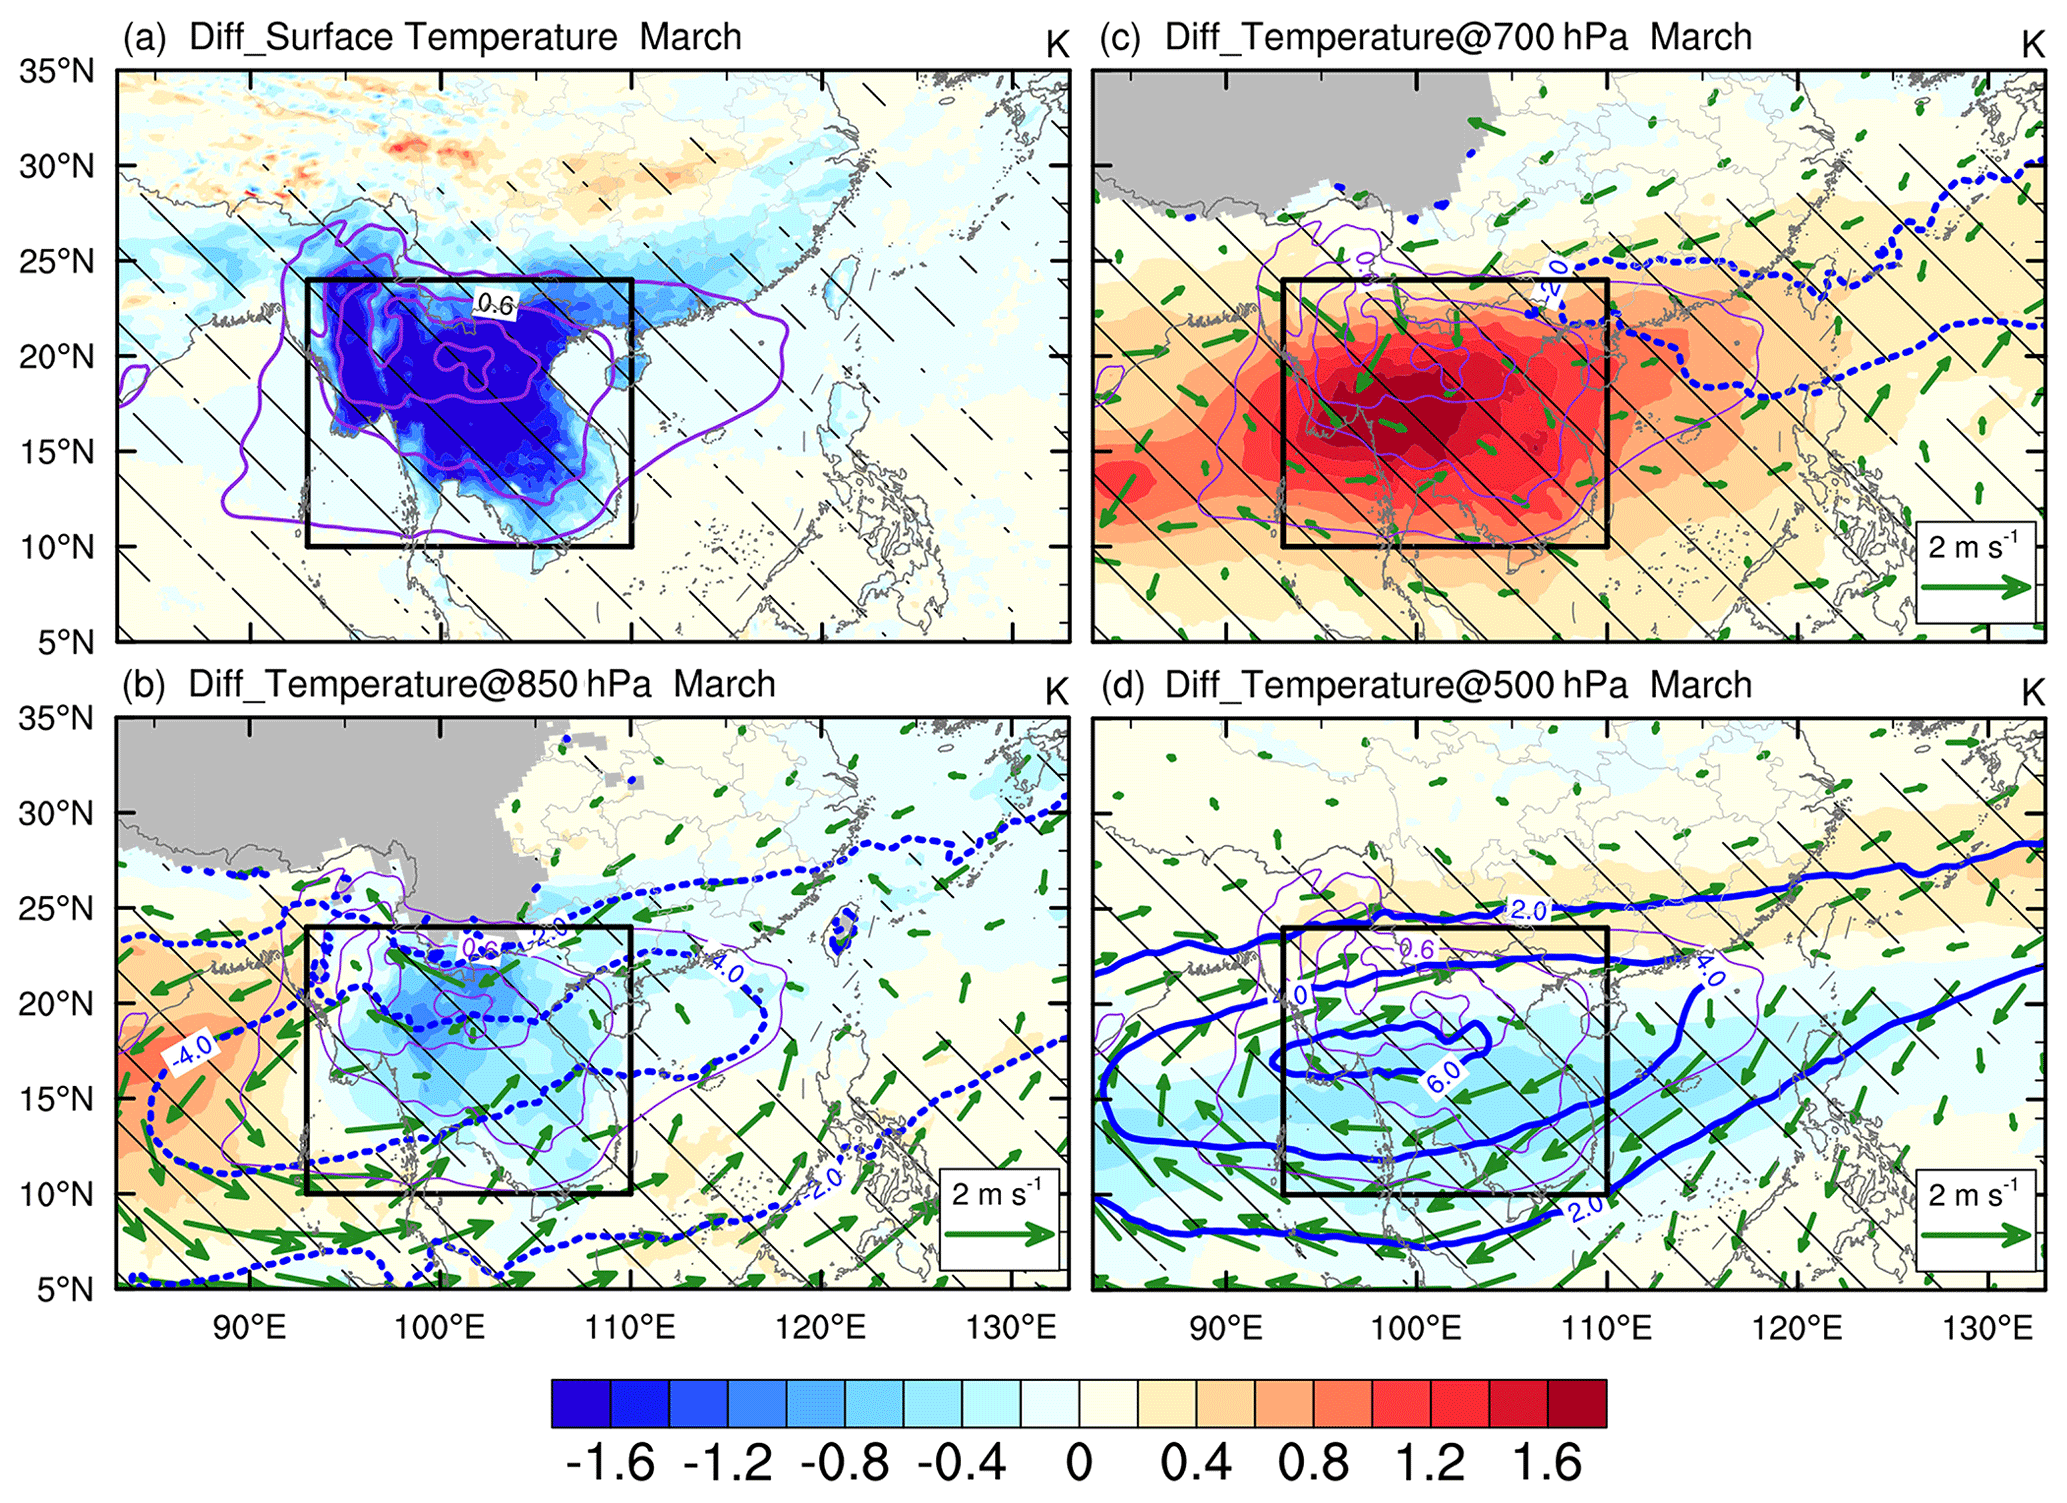
Figure 8Differences (CTRL minus BBER) in (a) surface temperature (shading; K), (b–d) horizontal wind (vector; m s−1), geopotential height (thick blue contours with an interval of 2 dagpm; the dashed contours are for negative values and the zero contour is omitted for clarity), and temperature (shading; K) at (b) 850 hPa, (c) 700 hPa, and (d) 500 hPa in March 2010. Purple contours with an interval of 0.3 denote AOD differences. The hatching and green vectors denote temperature, and wind changes are statistically significant at the 95 % confidence level, respectively, based on a Student's t test. The black box outlines the main Indochina Peninsula (ICP; 93–110∘ E, 10–24∘ N).
To better explain such “cooling–warming–cooling” vertical temperature changes from the lower to upper troposphere, we show the vertical profiles of changes in the area-averaged atmospheric heating source in the ICP (93–110∘ E, 10–24∘ N; black box in Fig. 8) during March (Fig. 9a). As expected, SW radiative forcing was the major factor contributing to the atmospheric heating, which was strongest (exceeding 1.0 K d−1) near 650 hPa and diminished to zero near 400 hPa. Note that the height of the SW heating did not coincide with that of the BC mass concentration maximum, partially due to the amplification heating effect caused by the increased low cloud underneath the BB smoke plume (Fig. 9b). The surface cooling caused by the solar flux reduction tends to decrease surface evapotranspiration and reduce sensible and latent heat fluxes (Andreae et al., 2004; Feingold et al., 2005; X. Huang et al., 2016). As a result, the PBL processes dominate the cooling effect in the lower troposphere (1000–700 hPa). This can also explain why the PBL cooling was weaker over the ocean than over land (Fig. 8a–b), as the surface fluxes over the ocean were much less variable (Feingold et al., 2005). The latent heat shows a weak warming effect from ∼ 950 to 750 hPa, which can translate to promoting cloud formation by large-scale condensation and even moist convection. As shown in Figs. 7 and 9b, the increase in low clouds over the Beibu Gulf was concentrated below 850 hPa, while that over the southern ICP was at 850–750 hPa. Additionally, the latent heating also displayed a weak cooling effect at 700–500 hPa because of the reduced clouds in this layer via the cloud burn-off effect of BC (the semi-direct effect). The LW radiative forcing heating contributed to the atmospheric cooling from the surface to about 400 hPa. The net atmospheric heating (i.e., the sum of SW, LW, PBL, and latent heat) induced by BB aerosols generally exhibited a cooling effect below 850 hPa and a warming effect at 850–400 hPa. As a result, the colder temperature anomalies occurred from the surface to 800 hPa with a minimum reaching −0.76 K, while warmer anomalies with a maximum greater than 1 K were around 800–550 hPa (Fig. 9a). These temperature anomalies can markedly increase the atmospheric stability in the lower troposphere, leading to a more unstable mid troposphere.
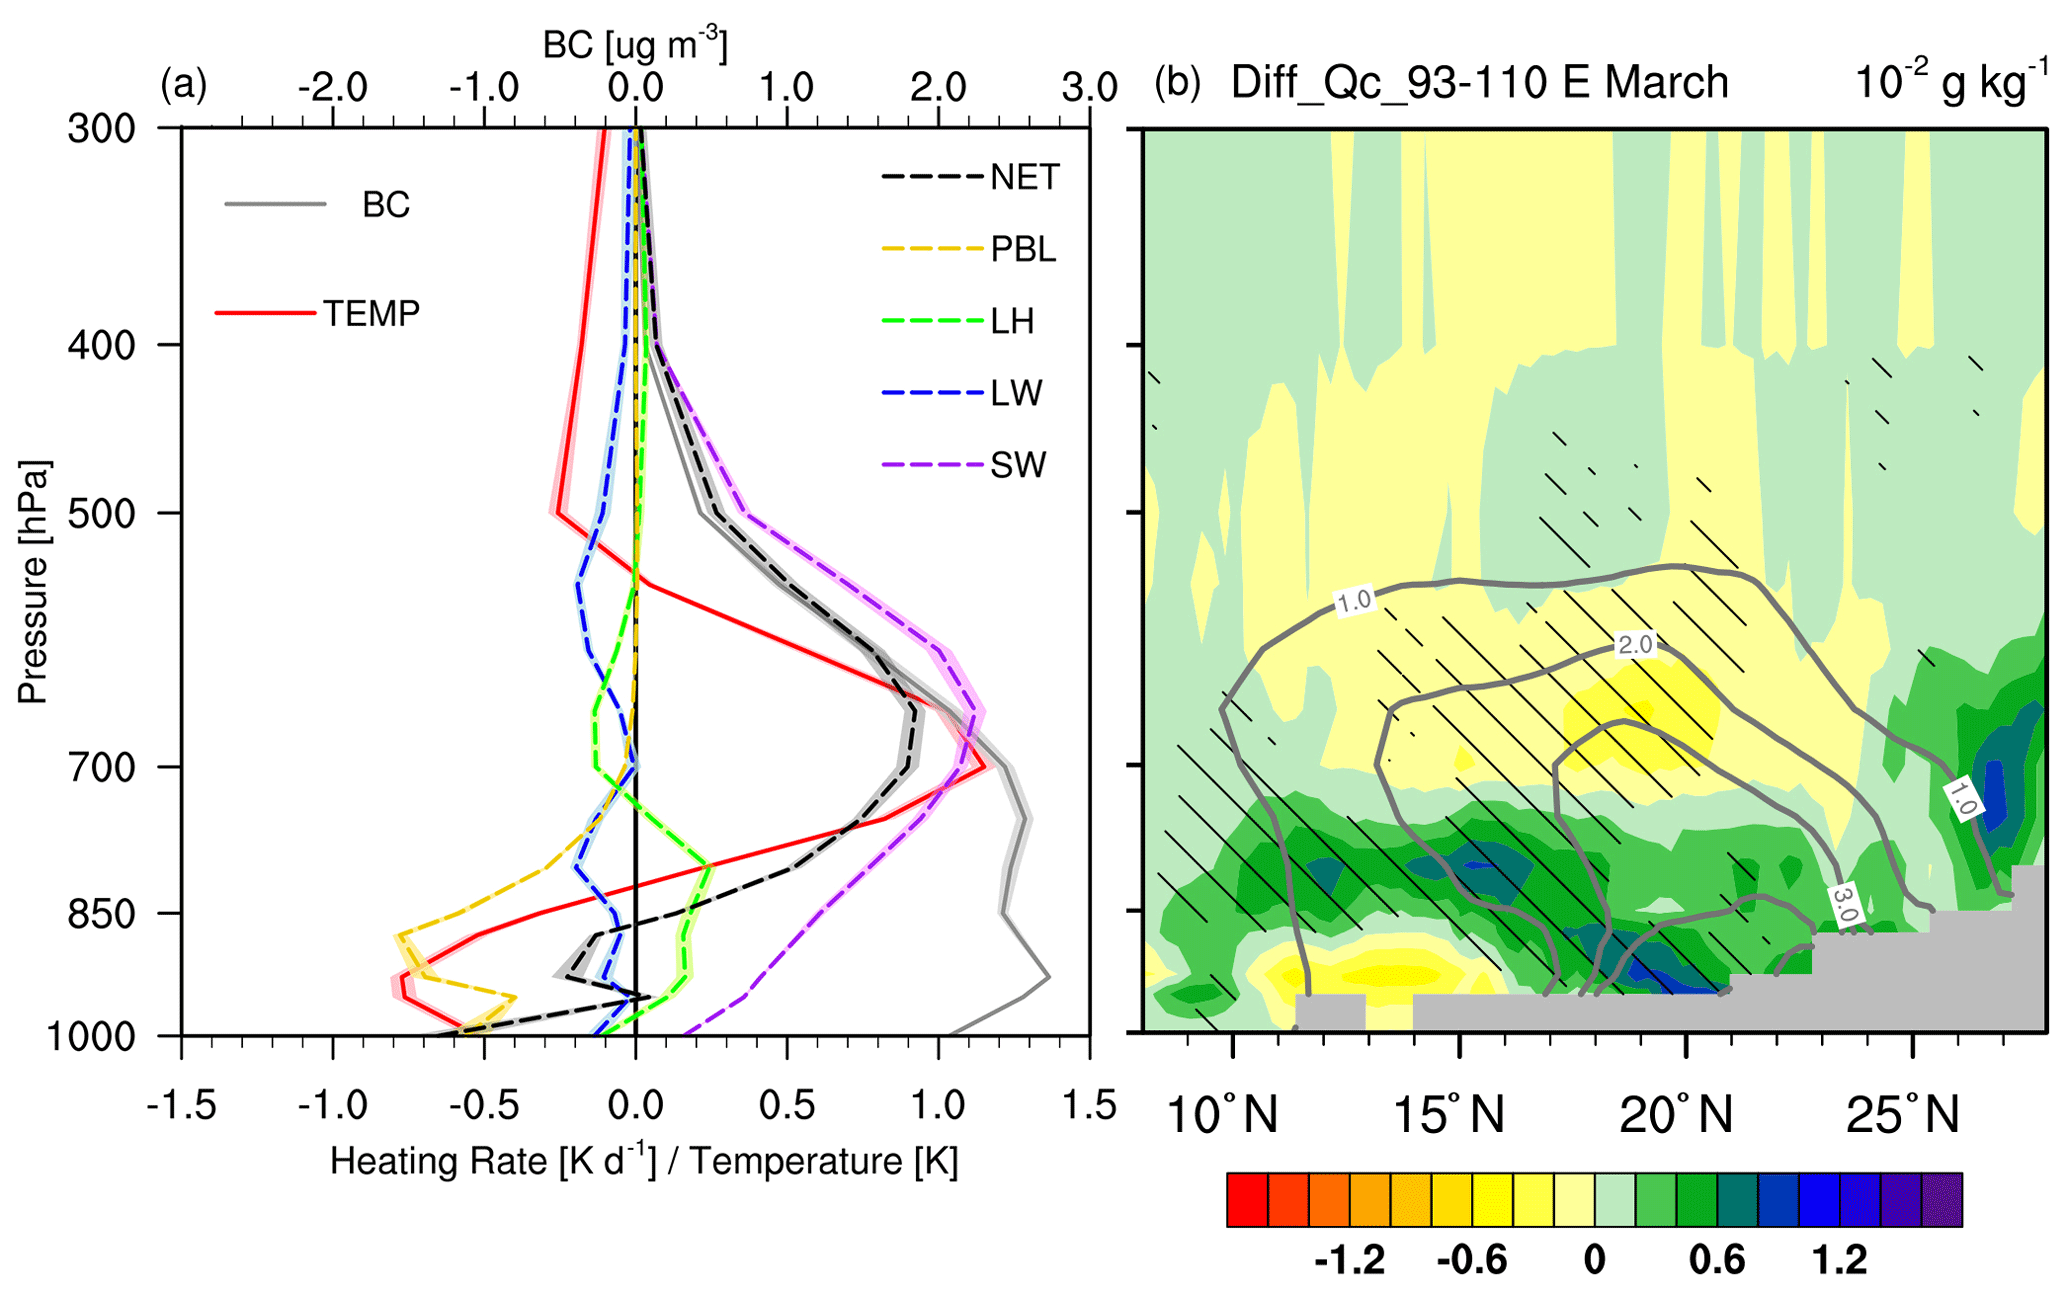
Figure 9(a) Vertical profiles of differences (CTRL minus BBER) in temperature (solid red line; K), BC mass concentration (solid grey line; µg m−3), and atmospheric heating rates (dashed line; K d−1) averaged over ICP (93–110∘ E, 10–24∘ N, as outlined in Fig. 8) in March 2010. Here, atmospheric heating rates include shortwave (SW) and longwave (LW) radiation heating, latent heating (LH, i.e., heating from the microphysics and cumulus scheme), and heating from the planetary boundary layer (PBL) scheme. Net heating rate (NET) = SW + LW + LH + PBL. (b) Vertical cross sections of differences (CTRL minus BBER) in cloud water-vapor content (shading; 10−2 g kg−1) and BC mass concentration (solid grey contours with an interval of 1.0 µg m−3) averaged over 93–110∘ E in March 2010. Shading in panel (a) denotes a single standard deviation of temperature, BC mass concentration and atmospheric heating rate. Hatching in panel (b) denotes that changes in cloud water-vapor content are statistically significant at the 95 % confidence level based on a Student's t test.
The BB aerosol-induced maximum net heating in the troposphere could reach up to 0.9 K d−1 (Fig. 9a), which was able to force anomalous atmospheric circulation. As suggested previously (Hoskins, 1991; Wu and Liu, 2000), the atmospheric response to an external diabatic heating can generate upward motion in the heating layer, cyclonic circulation in the lower atmosphere, and anticyclonic circulation in the upper troposphere. These anomalous circulations can be clearly seen in our simulation results shown in Fig. 8b–d. Furthermore, subject to atmospheric thermal adaptation (Wu and Liu, 2000; Liu et al., 2001), the “overshooting” air parcel induced by the inertial ascent from below the heating layer kept a constant potential temperature, forming the cold anticyclonic circulation to the northwest of the heat source in the upper troposphere (Fig. 10a–b). Accordingly, anomalous northerly (southerly) winds across the heating region in the upper (lower) troposphere (Fig. 10a) developed to balance the Coriolis force (Liu et al., 2001). To the north of the BB aerosol heating region (22–26∘ N), the negative meridional diabatic heating gradient produced a negative vorticity forcing and a secondary circulation at the upper level (Fig. 10a, c). The BB aerosol-induced two-cell structure meridional circulation is quite similar to the results in Lee and Kim (2010) and S. Yang et al. (2022). The sinking motion in the northern branch is consistent with the maximum precipitation anomaly in Fig. 5d. The anomalous northwesterly flow on the northern flank of the cyclonic circulation in the lower troposphere substantially weakened the water vapor transported from the Bay of Bengal to the northern ICP and southern China (20–30∘ N; also see Fig. 10a). However, more water vapor was lifted up from the Bay of Bengal and SCS into the mid troposphere via the Ekman pumping (Fig. 10b), which was partly transported to the central and southern ICP by anomalous southerly wind in the southern branch (Fig. 10a–b). Interestingly, precipitation was reduced in the central and southern ICP by the BB aerosols, despite the favorable water-vapor condition (Fig. 5d). This is because the increased atmospheric stability in the lower troposphere caused by the BB aerosols greatly enhanced the convection inhibition energy (CIN) (Fig. 10d), indicative of a higher threshold for the energy required to trigger convection (Mapes, 2000). As a result, the reduction in the local convective rainfall dominated the change in precipitation over the ICP (Fig. 11a), while large-scale (stratiform) precipitation presented a minor increase (Fig. 11b). The effects of BB aerosol-induced suppression of convective precipitation and mild enhancement of large-scale precipitation over the northern ICP are consistent with the modeling results of Wang et al. (2021).
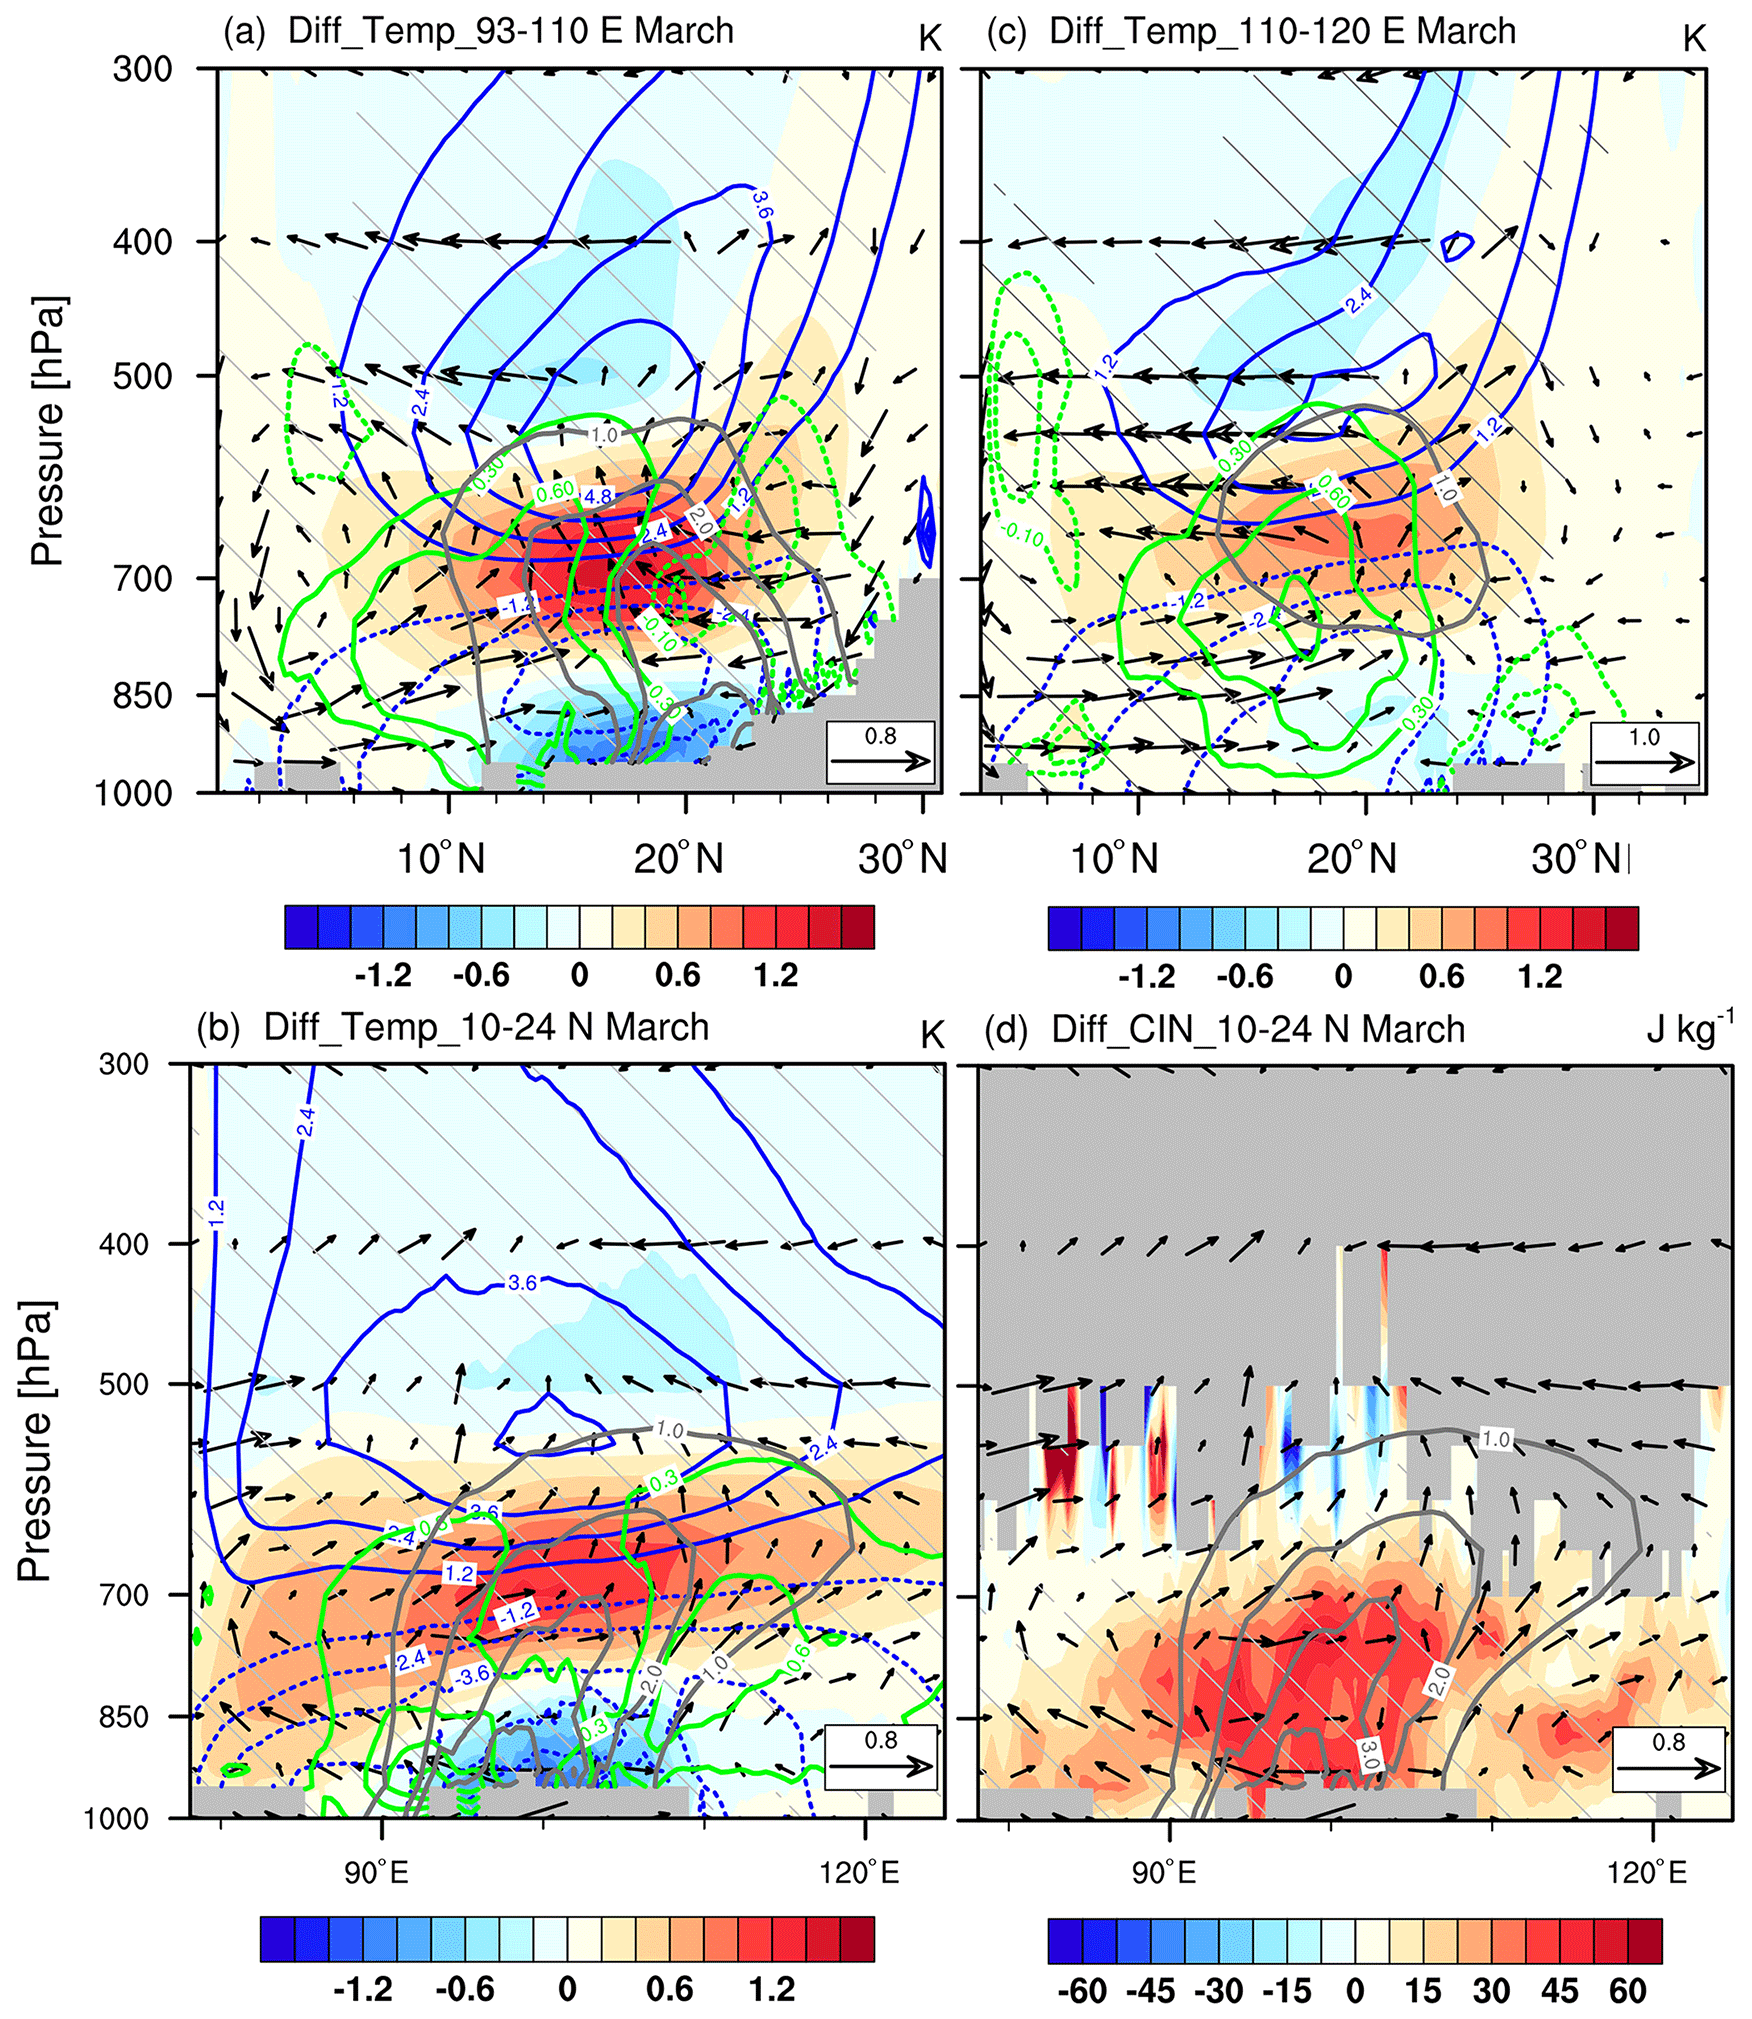
Figure 10(a–c) Vertical cross sections of differences (CTRL minus BBER) in temperature (shading; K), geopotential height (blue contours with an interval of 1.2 dagpm; the dashed contours are for negative values, and the zero contour is omitted for clarity), and water-vapor content (green contours with intervals of 0.3 g kg−1 for positive values and 0.1 g kg−1 for negative values, and the zero contour is omitted for clarity) averaged over (a) 93–110∘ E, (b) 10–24∘ N, and (c) 110–120∘ E in March 2010 together with (a, c) meridional or b zonal vertical velocity (vector; m s−1 and 10−2 m s−1, respectively) and BC mass concentration (solid grey contours with an interval of 1.0 µg m−3). (d) Same as (b) but for convective inhibition (CIN; shading; J kg−1). Hatching and vectors denote the shaded field, and wind changes are statistically significant at the 95 % confidence level, respectively, based on a Student's t test.
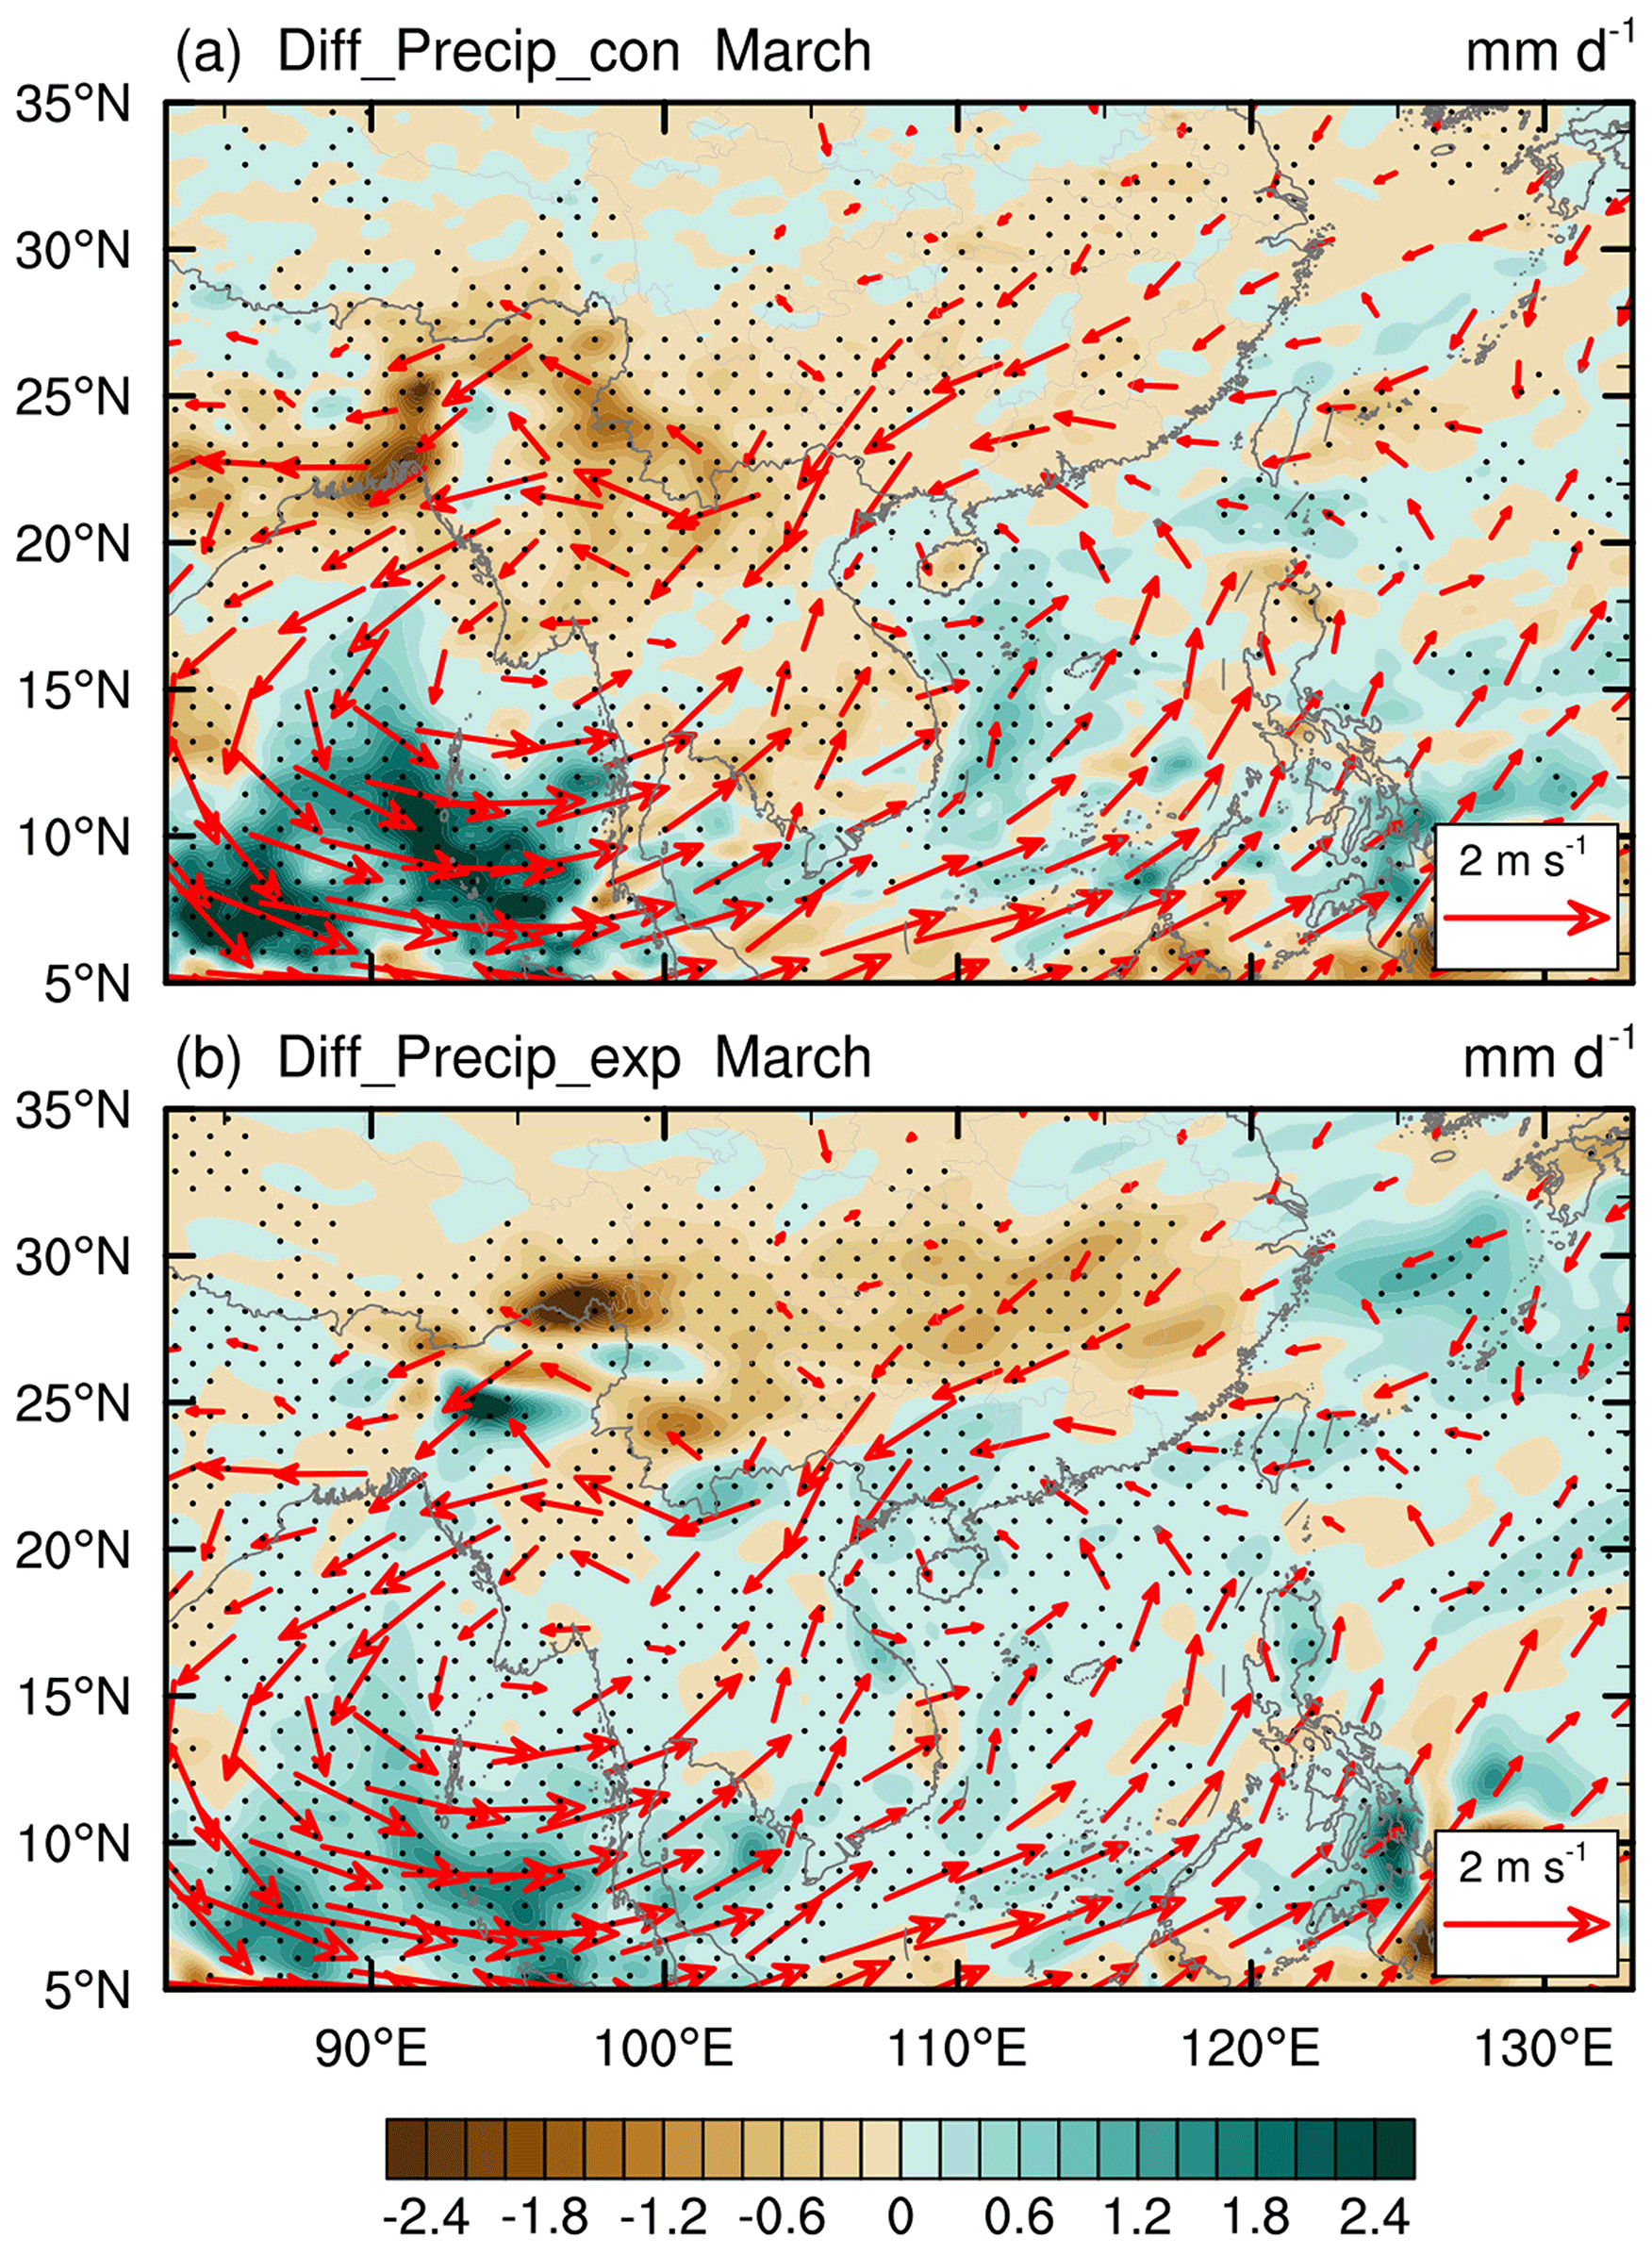
Figure 11Differences (CTRL minus BBER) in (a) convective precipitation and (b) non-convective precipitation (shading; mm d−1) in March 2010 together with the 850 hPa wind difference (vector; m s−1). Stippling and the red vector denote that precipitation and wind are statistically significant at the 95 % confidence level, respectively, based on a Student's t test.
For the SCS and its adjacent coastal water region (110–120∘ E), the PBL cooling was quite weak (Fig. 10c), resulting in little CIN change in the lower layers (Fig. 10d). Therefore, relatively favorable water-vapor conditions led to moderately enhanced precipitation (Fig. 5d). This is similar to the “elevated heat pump” (EHP) effect proposed by Lau et al. (2006), which hypothesized that the absorbing aerosols (dust and BC) stacked up on the southern slope of the Tibetan Plateau can heat up the mid to upper troposphere, leading to an earlier onset of the Indian summer monsoon and increased monsoon rainfall. Note that in our case the updraft caused by the low-level (700 hPa) heating only reached 500 hPa, leading to an invigoration of shallow convection, which differs from the original “EHP” effect with a high-level (500 hPa) heating and a resultant ascending air flow reaching 200 hPa.
4.3.2 Delayed effect
Compared to the instant effect, the delayed effect in the subsequent April should be closely related to the atmospheric circulation adjustment, as there were a few BB aerosols left from March. During the subsequent early April, the anomalous vertical temperature structure still persisted with a maximum warming of 0.4 K at 700 hPa and a cooling of −0.6 K at 925 hPa (Fig. 12a, c). Without the strong heating from the BB aerosols (Fig. 12c), the 850 hPa anomalous low over the ICP became weaker and split into a double-center system (Fig. 12b). This would increase moisture over the northern ICP and northern SCS by southerly anomalies, which facilitated precipitation over the northern ICP, southern China, and the northern SCS (Figs. 12b, d and 5e).
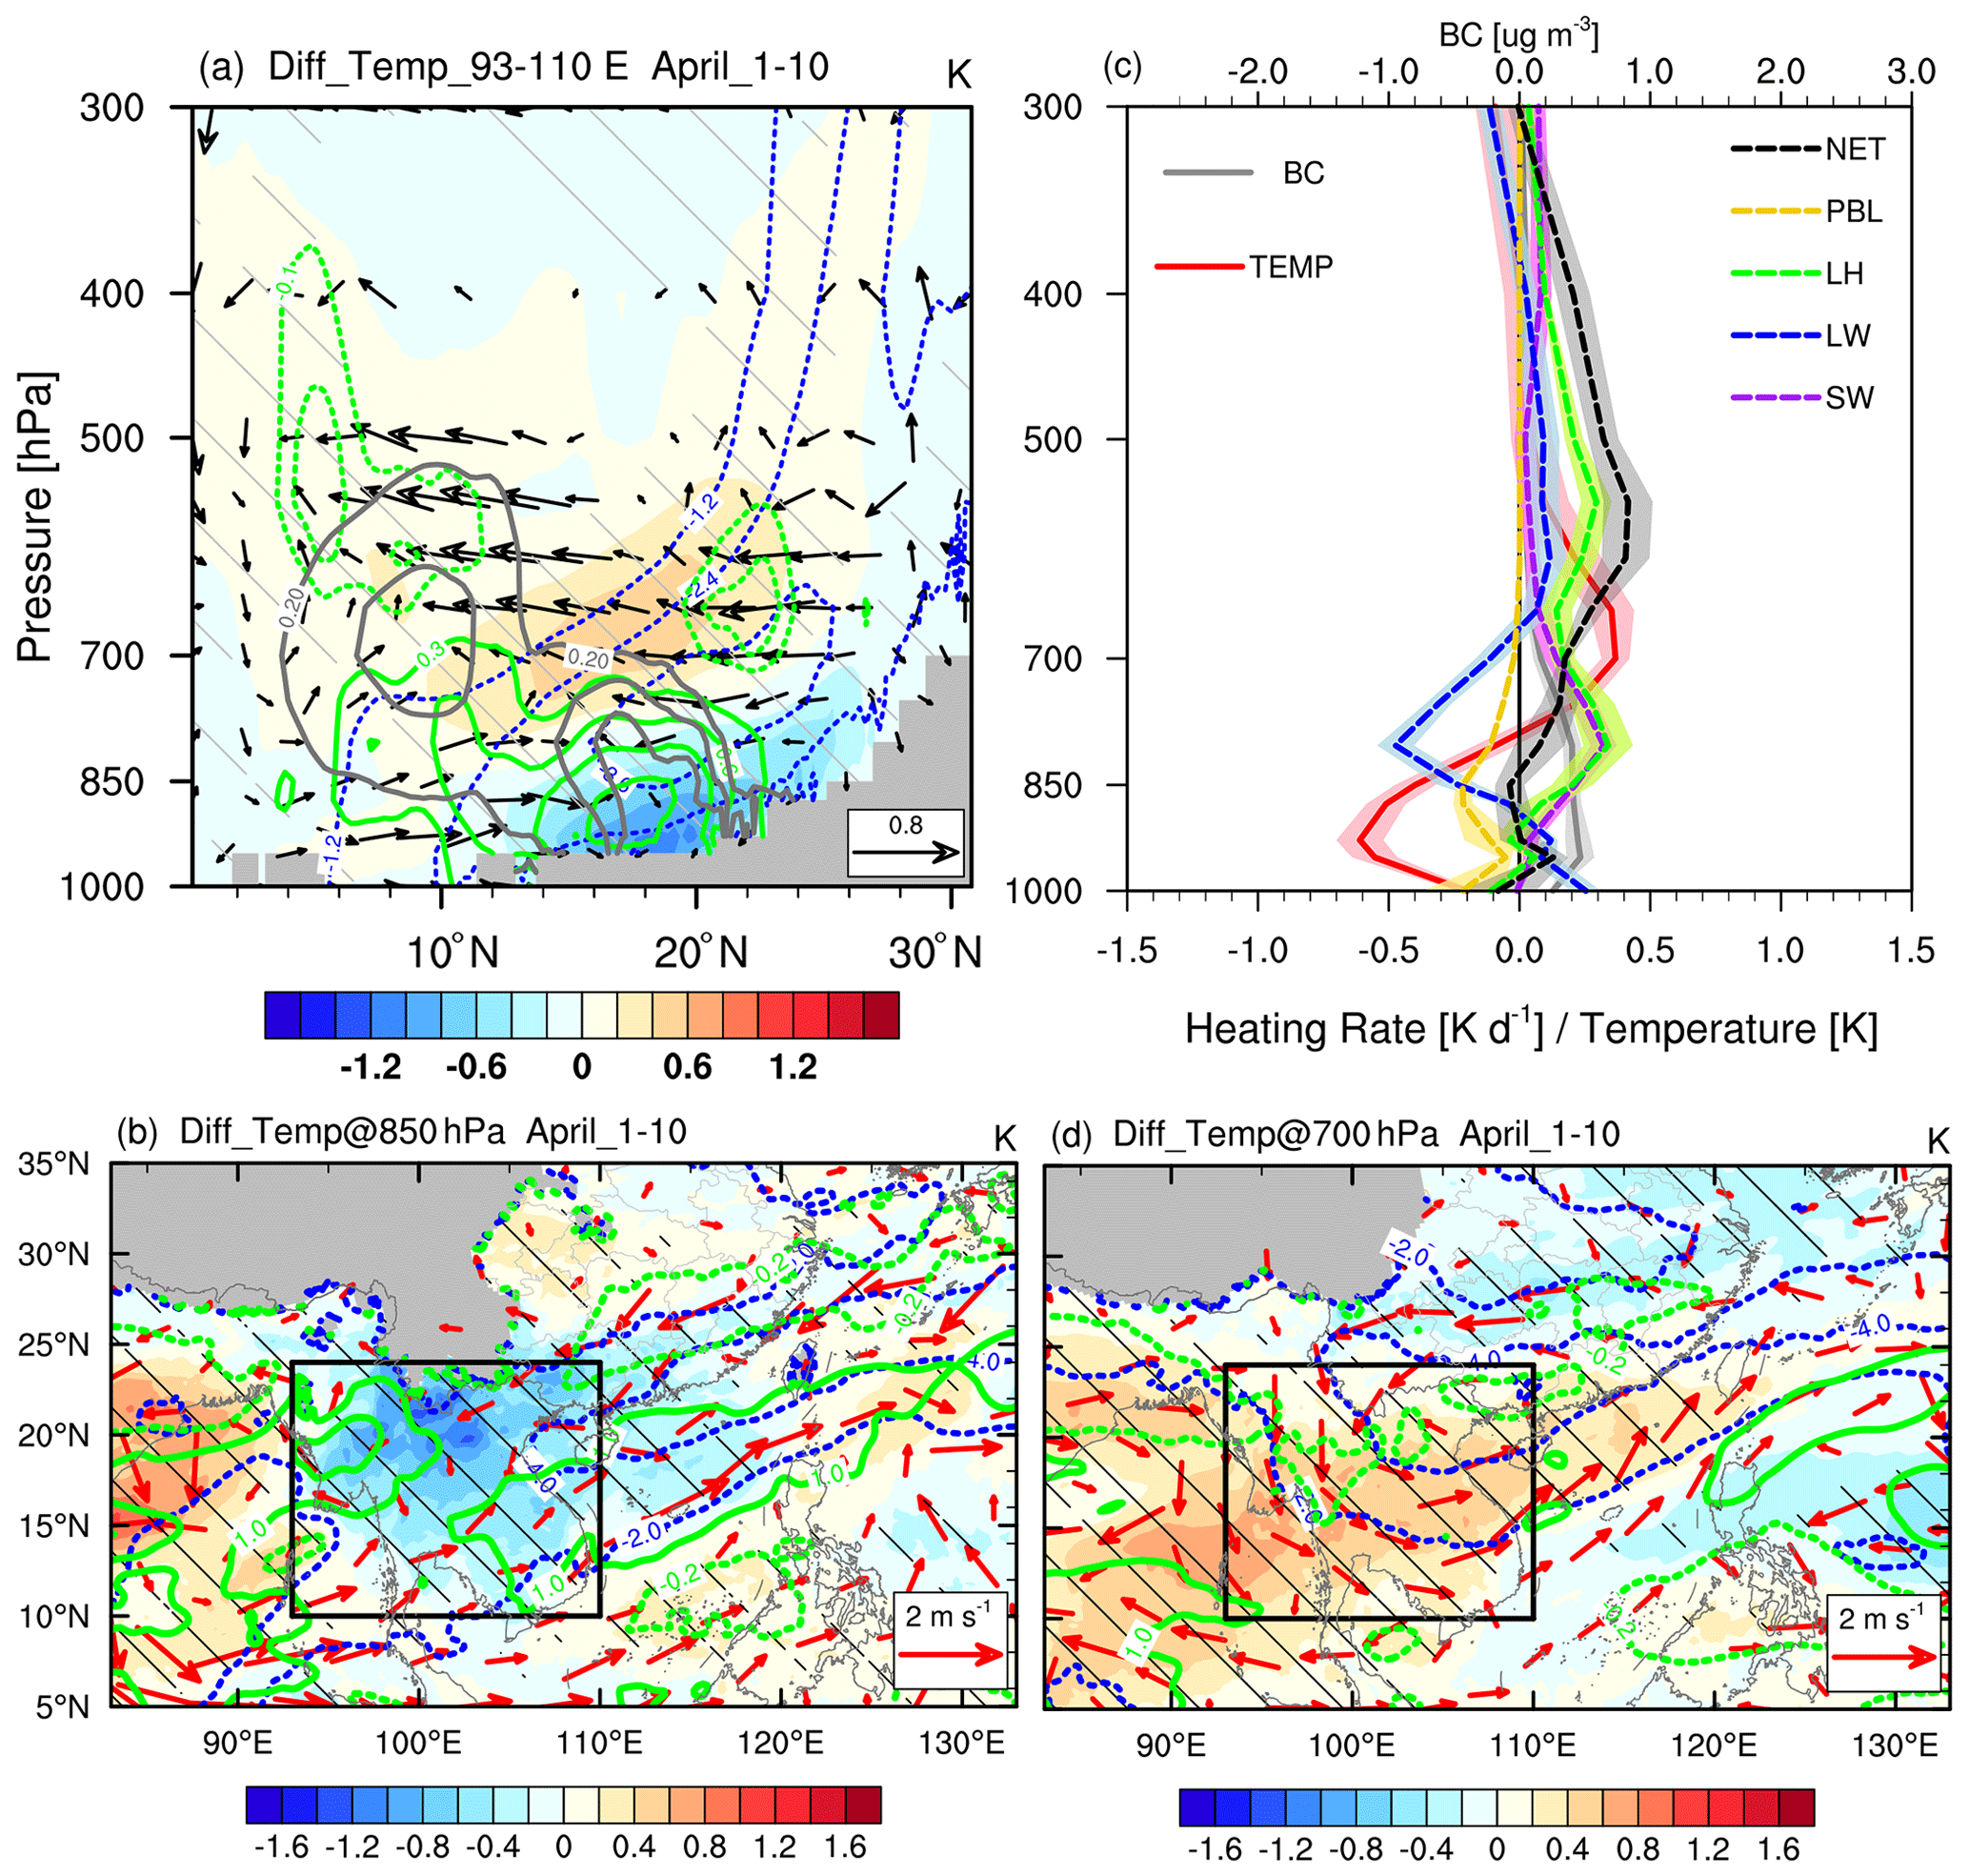
Figure 12(a) Vertical cross sections of differences (CTRL minus BBER) in temperature (shading; K), geopotential height (blue contours with an interval of 1.2 dagpm; the dashed contours are for negative values, and the zero contour is omitted for clarity), and water-vapor content (green contours with intervals of 0.3 g kg−1 for positive values and 0.1 g kg−1 for negative values, and the zero contour is omitted for clarity) together with meridional and vertical velocity (vector; m s−1 and 10−2 m s−1, respectively) and BC mass concentration (solid grey contours with an interval of 0.2 µg m−3) averaged over 93–110∘ E. (b) Differences (CTRL minus BBER) in 850 hPa wind (vector; m s−1), geopotential height (blue contours with an interval of 1.2 dagpm), water-vapor content (green contours with intervals of 1.0 g kg−1 for positive values and 0.2 g kg−1 for negative values, and the zero contour is omitted for clarity), and temperature (shading; K). (c) Vertical profiles of differences (CTRL minus BBER) in temperature (solid red line; K), BC mass concentration (solid grey line; µg m−3), and atmospheric heating rates (dashed lines; K d−1) averaged over the ICP (black box in panel b). (d) Same as (b) but at 700 hPa. Shading in panel (c) denotes a single standard deviation of temperature, BC mass concentration, and atmospheric heating rate. Hatching and the vector denote the shaded field, and wind changes are statistically significant at the 95 % confidence level, respectively, based on a Student's t test. All of them are averaged over 1–10 April 2010 (i.e., early April).
As analyzed in Sect. 4.3.1, the rainfall reduction over the ICP in March induced by BB aerosols resulted from competition between convection suppression by the stabilized atmosphere and favorable water-vapor conditions by a large-scale circulation response. For the delayed effect in early April, favorable water-vapor conditions due to atmospheric circulation adjustments increased significantly, as the low-level anomalous low weakened and the monsoon advanced. On the other hand, the convective instability above 850 hPa was significantly enhanced under the influence of water vapor (Fig. 13c), although the BB aerosol-induced anomalous vertical temperature structure remained. In other words, both conditions were conducive to the precipitation over the ICP in early April. Thus, the delayed effect acted to promote precipitation over the ICP, in contrast to inhibiting precipitation by the instant effects. In turn, the increased condensation heating associated with increased rainfall dominated the upper-air diabatic heating (Fig. 12c) via positive feedback. The adjustment in the net maximum heating layer height also led to an anomalous cyclonic circulation at 700 hPa (Fig. 12d). Due to the memory of the soil, the reduction in land surface variables such as soil temperature, soil moisture, and surface evaporation can last until this period and keep the cooling effect through the PBL process (Fig. 12c). Then, all these factors acted to maintain the anomalous vertical structure of PBL cooling, upper-air warming, and the anomalous circulation, so that the preceding atmospheric responses would not disappear immediately.
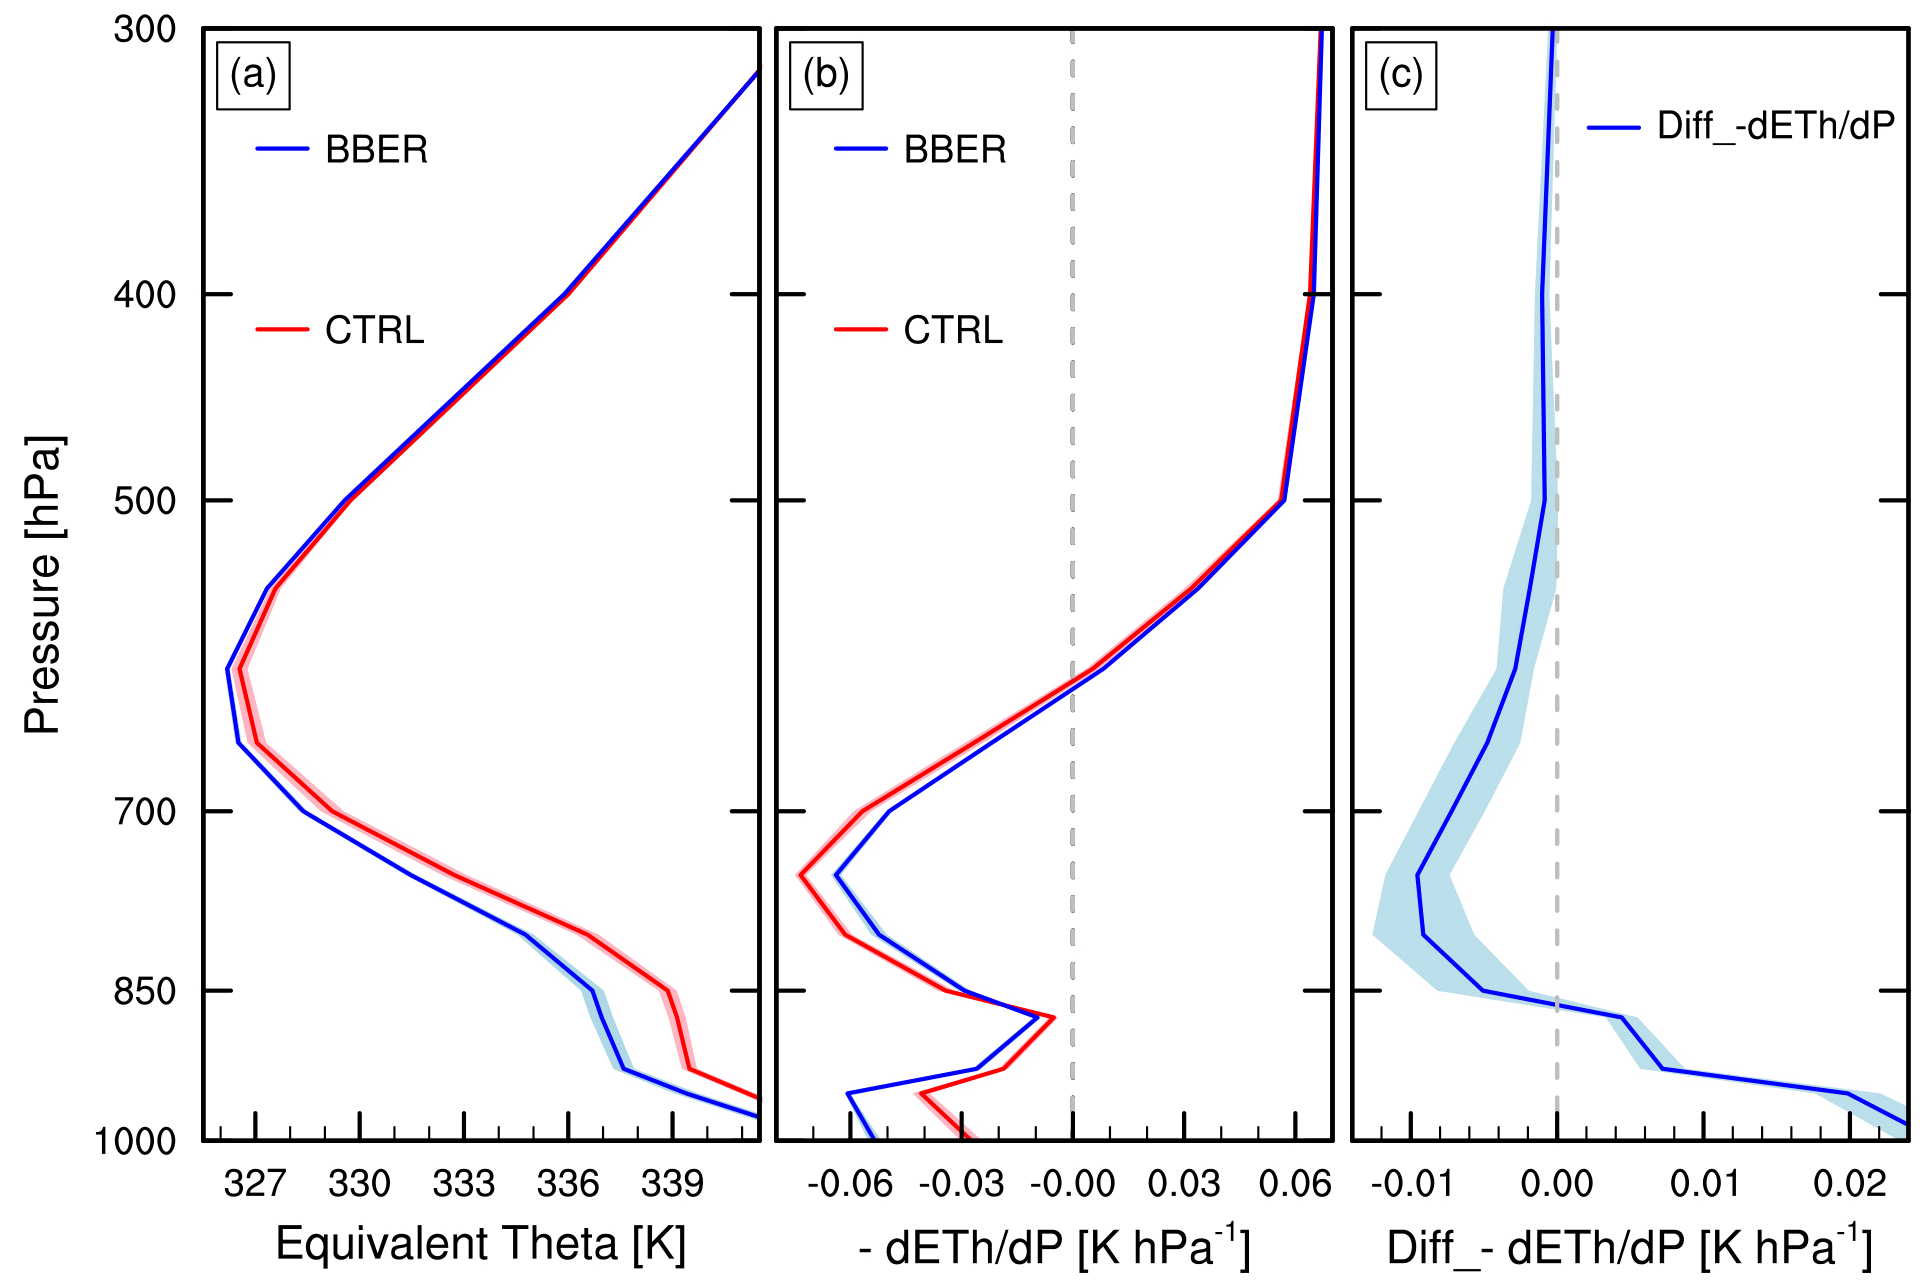
Figure 13Vertical profiles of (a) equivalent potential temperature (θe; K) and (b) convective stability (; K hPa−1) averaged over the ICP (as outlined in Fig. 12b) during 1–10 April 2010. The red and blue curves are for CTRL and BBER, respectively. (c) Differences (CTRL minus BBER) in the convective stability (blue curve; K hPa−1). Shading denotes a single standard deviation of equivalent potential temperature, convective stability, and differences in convective stability.
Without the anomalous heating from the BB aerosols during mid April, the anomalous vertical temperature structure was barely seen over the ICP (Fig. 14a, c). Meanwhile, as the 850 hPa anomalous low further dissipated, anomalous southerly wind transported more water vapor from the Bay of Bengal directly northward to the northwestern ICP (Fig. 14b). The moist air flows were then lifted by the southeastern Tibetan Plateau and thus converged and cooled, which enhanced orographic precipitation (Fig. 5f). Although the BB aerosol-induced anomalous low nearly disappeared over coastal Southeast China during mid April, the anomalous meridional circulation accompanied by enhanced precipitation over southern China (Fig. 5f) could be sustained through the feedback from the increased condensation heating.
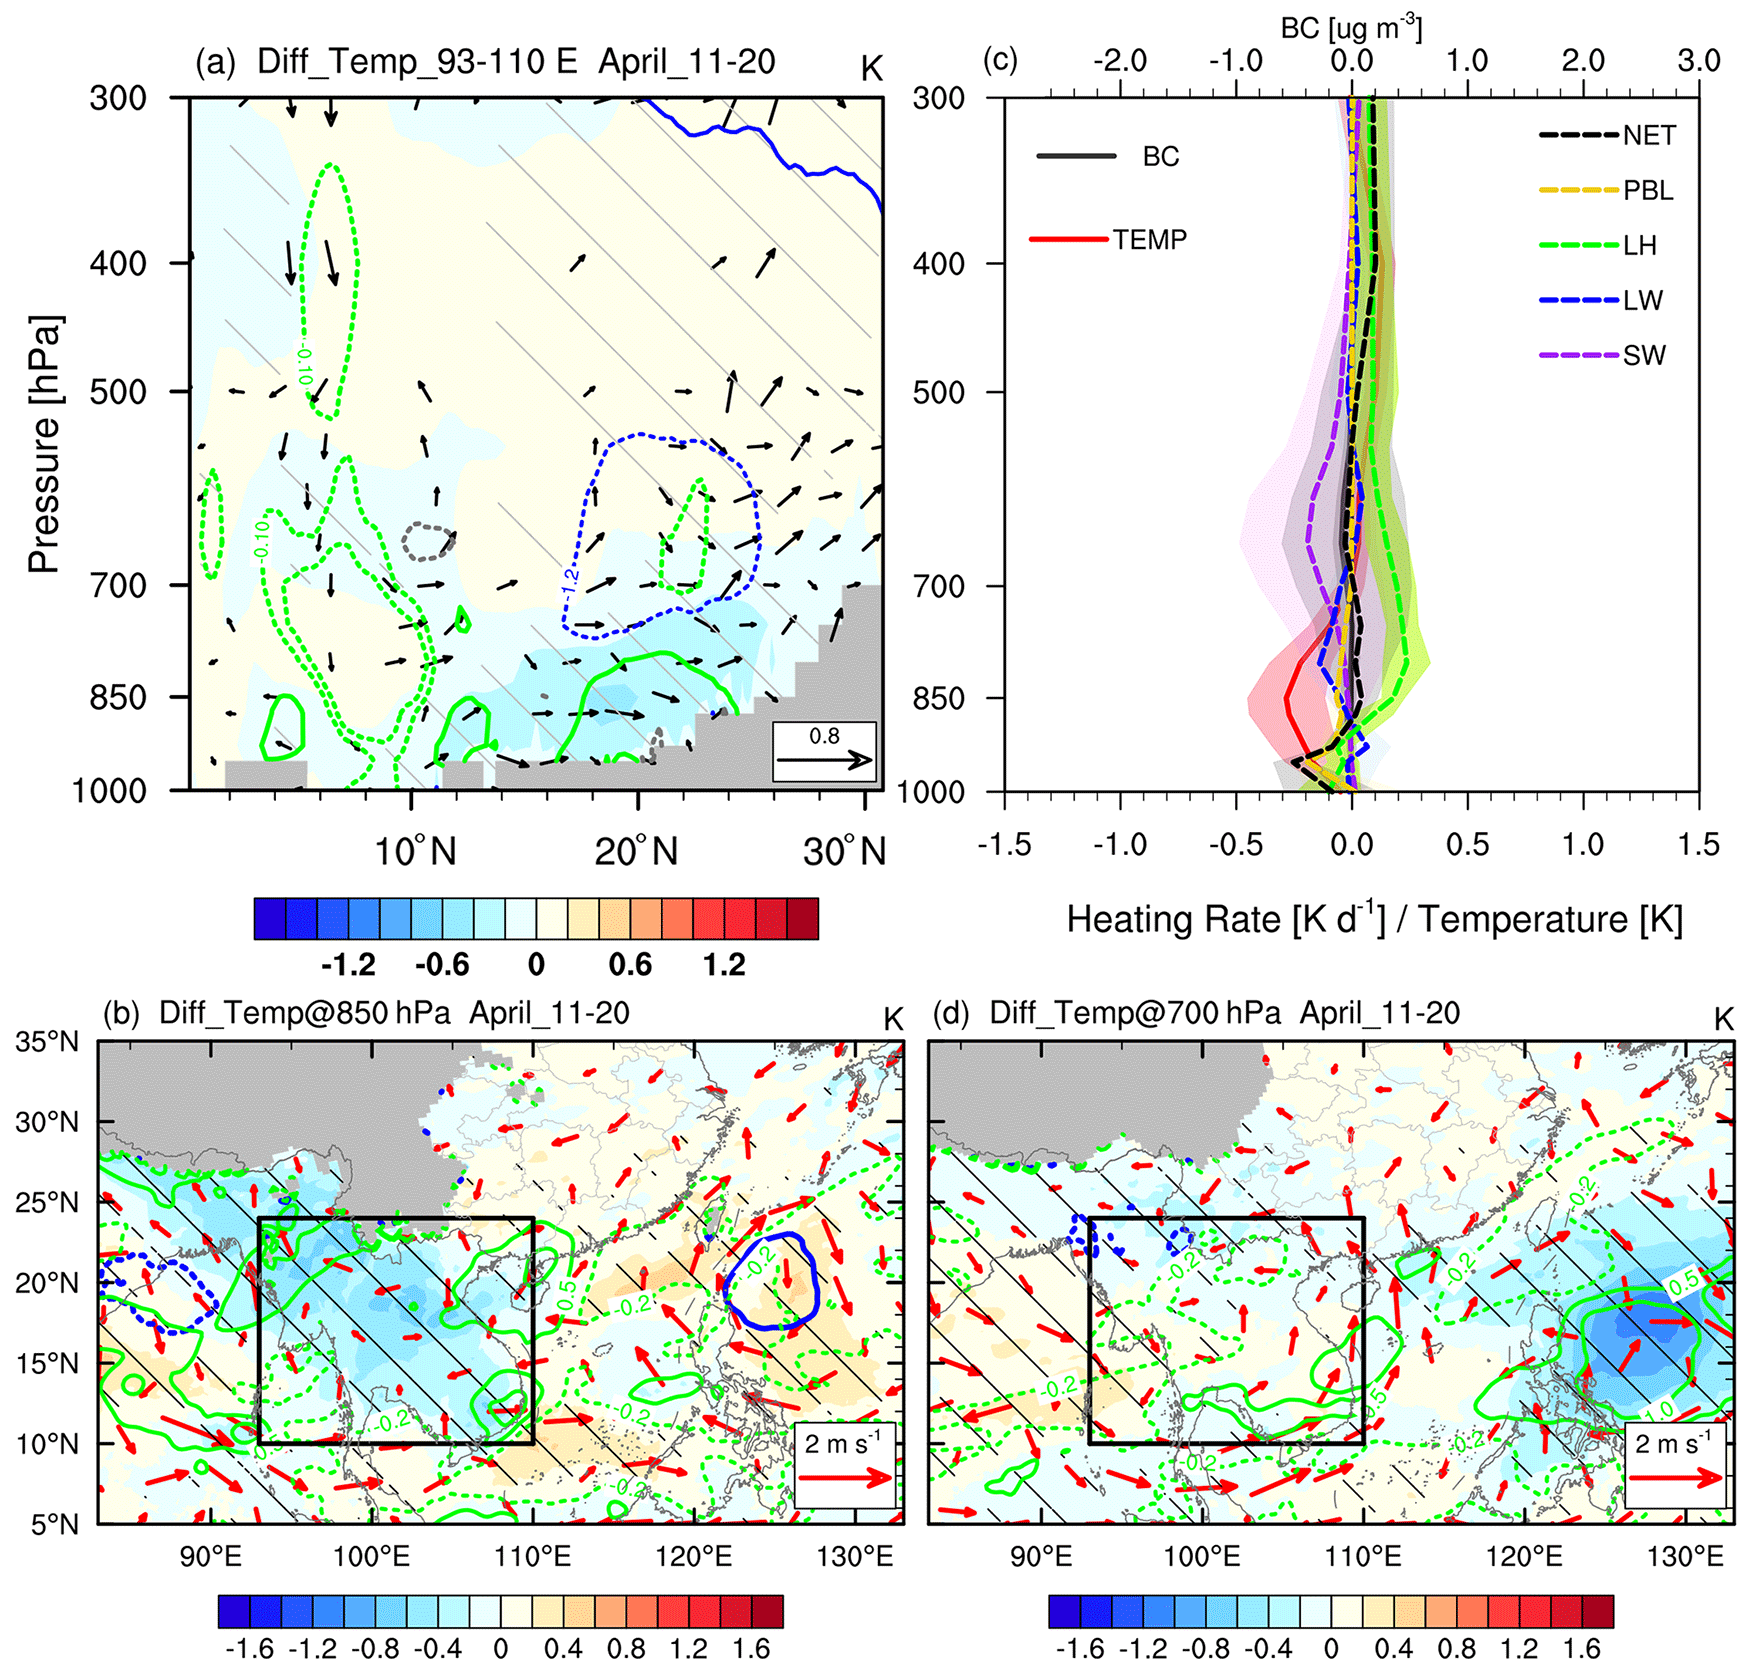
Figure 14Same as Fig. 12, but the fields are averaged over 11–20 April 2010 (i.e., mid April).
Large amounts of absorbing aerosols are injected into the atmosphere by extensive BB activities over the ICP during March, which can significantly affect the regional climate. Using observation data and the WRF-Chem model, we investigate the instant and delayed effects of the BB aerosols over the ICP in March on the regional circulation and precipitation in early spring. The main conclusions are summarized below.
The observations show that March BB aerosols are negatively correlated with the rainfall over the ICP, while such a correlation shifts to being positive in early and mid April, which is well captured by the WRF-Chem model. The simulation results reveal that BB aerosols emitted from the northern ICP trap a substantial proportion of solar radiation in the low to mid troposphere and decrease incoming solar radiation at the surface, followed by reduced surface heat fluxes associated with PBL processes. The energy perturbation leads to temperature changes in surface and lower-tropospheric (1000–850 hPa) cooling and lower- to mid-tropospheric (850–400 hPa) heating. Thus, the low atmosphere is stabilized and CIN is markedly intensified at 850–700 hPa, which acts to suppress local convective rainfall. The BB aerosol-induced heating in the low to mid troposphere can also cause an anomalous low-pressure system in the lower troposphere extending from the central Bay of Bengal across the ICP to the northern SCS. This is accompanied by a two-cell structure meridional circulation with rising motion over the ICP and two strong downward motions in the near-equatorial regions and the latitudes of 25–30∘ N. Over the ICP, the anomalous low in the lower troposphere tends to increase the mid-tropospheric moisture from the Bay of Bengal and SCS via moisture advection and Ekman pumping. On the southern flank of this anomalous low, the southerly wind conveys more water vapor to the ICP, causing a minor increase in large-scale precipitation. Thus, the BB aerosol-induced rainfall suppression in the ICP during March is a result of competition between the responses of local atmospheric stability and large-scale circulation to absorbing aerosols. For the SPRJ region, the anomalous northeasterly wind on the northern flank of the anomalous low would decrease the prevailing southwesterly wind and moisture transport, which is conducive to suppressing the rainfall over these regions. Meanwhile, the sinking motion in the northern branch of anomalous two-cell structure meridional circulation induced by BB aerosols would also help reduce the precipitation there. Over the SCS, the moderate precipitation increase is due to favorable water-vapor conditions, while the CIN increases very little because of the insignificant PBL cooling, which is caused by the underlying water surface.
During early April, the anomalous belt-shaped low pressure weakens and fragments into a double-center system, owing to a few BB aerosols remaining in March and the corresponding reduction in BB aerosol-induced atmospheric heating. Over the ICP, although the anomalous low weakens due to a lack of strong heating from the BB aerosols, it can still transport sufficient moisture from the Bay of Bengal as the monsoon advances. On the other hand, the convective instability above 850 hPa is enhanced under the influence of water vapor, although the vertical temperature anomaly structure remains. As a result, the effects of March BB aerosols on precipitation over the ICP shift from suppression in March to enhancement in early and mid April. In turn, the increased condensation heating associated with increased rainfall dominates the diabatic heating and sustains the anomalous circulation and vertical temperature structure via positive feedback. In mid April, without any anomalies directly related to BB aerosol-induced heating, the anomalous vertical temperature structure and low pressure in the lower troposphere nearly disappear, and only enhanced rainfall over the northwestern ICP and southern China can be seen due to the condensation heating.
Recently, S. Yang et al. (2022) investigated the effects of BB aerosols from the ICP during the whole emission season (1 March–17 April 2010). In this study, we further discuss the instant and delayed effects in the peak BB emission month of March. The instant effect of March BB aerosols on the atmospheric circulation is consistent with the results of S. Yang et al. (2022). Interestingly, S. Yang et al. (2022) noted that the April BB aerosols could significantly enhance the heavy rain events over the southern coast of southern China, while we show that the BB aerosol perturbation in March can induce a delayed increase in April precipitation over the same region. For the precipitation decrease over southern China, in addition to the cyclonic anomalies that reduce water-vapor transport as stated by S. Yang et al. (2022), we find that the sinking motion in the anomalous vertical meridional circulation induced by BB aerosol's heating also plays a role. Using an AGCM, Lee et al. (2014) suggested that the indirect effect is the main contributor to the BB aerosol-induced precipitation suppression over the ICP. In contrast, Ding et al. (2021) demonstrated that the indirect effects of BB aerosols play a less significant role in the low-cloud enhancement over subtropical Asia. Although both direct and indirect effects of aerosols are included in our experiments, we focus on the aerosol–radiation interaction (i.e., direct or semi-direct effect). The role of indirect effects needs to be investigated by setting up experiments with and without indirect effects further.
It is worth noting that this study examines the BB aerosol climate effects using the model by reducing BB emission, while another method is commonly used, namely, by turning on and off the aerosol climate feedback configuration (e.g., Ding et al., 2021; Wang et al., 2021). We have done a simple verification and found that the results obtained by the two methods are similar (Fig. S2). Additionally, although some quantitative results can be derived in this study, such as a 12.94(± 4.22) % reduction (the value after “±” is a single standard deviation, hereafter the same) in rainfall in the ICP (92–108∘ E, 12–27∘ N) due to March BB aerosols' instant effect and 15.40(± 5.11) % and 13.93(± 5.65) % enhancements from the delayed effect in early and mid April, respectively, these quantitative results would rely on the BB emission reduction rate in the sensitivity experiment. A supplementary sensitivity test with 50 % BB emission showed that the anomalous patterns of 850 hPa wind and rainfall are quite similar to those from BBER, but the rainfall anomalies are 72.73 %, 36.15 %, and 31.50 % of those from BBER in March and early and mid April, respectively (Fig. S3), indicating our qualitative conclusions are robust. As for quantitative results, this study is based on preliminary analysis; more experiments with different BB emission scenarios need to be designed to obtain more precise results in the future.
Note that the modeling results in this study only focus on the year of 2010, during which the AOD magnitude in March was above the average. The effects of aerosols on precipitation in the model (Fig. 5d–f) are not fully consistent with observations (Fig. 3d–f), especially for the delayed effects (Figs. 3e, f and 5e, f), due to the fact that the response patterns of large-scale circulation and precipitation to BB aerosols largely depend on both aerosols and meteorological conditions. Thus, multiyear simulations are needed to assess the robustness of our results on a longer timescale. In addition, uncertainty may also exist in the simulation. For instance, the overestimate of convective rainfall in the tropical Bay of Bengal and orographic precipitation in the southeastern Tibetan Plateau might introduce some uncertainty in the response of large-scale circulation to BB aerosols, which is strongly related to the cumulus convection parameterization scheme and the topographic complexity (Ma and Tan, 2009; Li et al., 2022). Therefore, further experiments at convection-resolved resolution need to be conducted to reduce such uncertainty.
The source codes of the WRF-Chem model are available on the University Corporation for Atmospheric Research (UCAR) website at https://www2.mmm.ucar.edu/wrf/users/download/get_source.html (UCAR, 2022a). The FNL data are available at https://rda.ucar.edu/datasets/ds083.2/ (NCEP, NWS, NOAA, U.S. DOC, 2000). The BB emission data of FINN version 1.5 are available at https://www.acom.ucar.edu/Data/fire/ (UCAR, 2022b). The MEIC and MIX anthropogenic emissions are available at http://meicmodel.org.cn/ (Tsinghua University, CEADs, CAEP, 2022). The ERA5 data are available at https://cds.climate.copernicus.eu/cdsapp#!/search?type=dataset (last access: 2 December 2022), https://doi.org/10.24381/cds.bd0915c6 (Hersbach et al., 2018). MERRA-2 aerosol reanalysis data (https://doi.org/10.5067/KLICLTZ8EM9D, GMAO, 2015), OMI AI (https://doi.org/10.5067/Aura/OMI/DATA3003, Torres, 2008), and TRMM precipitation (https://doi.org/10.5067/TRMM/TMPA/MONTH/7, TRMM, 2011; https://doi.org/10.5067/TRMM/TMPA/DAY/7, Huffman et al., 2016) are available at https://disc.gsfc.nasa.gov/datasets (last access: 2 December 2022). The MODIS AOD is available at https://doi.org/10.5067/MODIS/MOD08_M3.061 (Platnick et al., 2015). The BB emission data of GFEDv4 are available at https://doi.org/10.3334/ORNLDAAC/1293 (Randerson et al., 2018).
The supplement related to this article is available online at: https://doi.org/10.5194/acp-22-15425-2022-supplement.
HX and AZ conceptualized the research goals and aims. SH and AZ ran the simulations. AZ performed the data analysis and visualized the results. AZ, HX, JD, and JM wrote the initial draft.
The contact author has declared that none of the authors has any competing interests.
Publisher's note: Copernicus Publications remains neutral with regard to jurisdictional claims in published maps and institutional affiliations.
This work is jointly supported by the National Natural Science Foundation of China (41975106 and 42192562). We thank the High Performance Computing Center of Nanjing University of Information Science & Technology for their support of this work. We also thank all the corresponding institutions for providing their data for this study.
This research has been supported by the National Natural Science Foundation of China (grant nos. 41975106 and 42192562).
This paper was edited by Manish Shrivastava and reviewed by two anonymous referees.
Adam, M. G., Tran, P. T. M., Bolan, N., and Balasubramanian, R.: Biomass burning-derived airborne particulate matter in Southeast Asia: A critical review, J. Hazard. Mater., 407, 124760, https://doi.org/10.1016/j.jhazmat.2020.124760, 2021.
Andreae, M. O., Rosenfeld, D., Artaxo, P., Costa, A. A., Frank, G. P., Longo, K. M., and Silva-Dias, M. A. F.: Smoking rain clouds over the Amazon, Science, 303, 1337–1342, https://doi.org/10.1126/science.1092779, 2004.
Argüeso, D., Hidalgo-Muñoz, J. M., Gámiz-Fortis, S. R., Esteban-Parra, M. J., and Castro-Díez, Y.: High-resolution projections of mean and extreme precipitation over Spain using the WRF model (2070–2099 versus 1970–1999), J. Geophys. Res.-Atmos, 117, D12108, https://doi.org/10.1029/2011JD017399, 2012.
Ban-Weiss, G. A., Cao, L., Bala, G., and Caldeira, K.: Dependence of climate forcing and response on the altitude of black carbon aerosols, Clim. Dynam., 38, 897–911, https://doi.org/10.1007/s00382-011-1052-y, 2012.
Bao, Z., Wen, Z., and Wu, R.: Variability of aerosol optical depth over east Asia and its possible impacts, J. Geophys. Res.-Atmos., 114, D05203, https://doi.org/10.1029/2008jd010603, 2009.
Bohren, C. F. and Huffman, D. R.: Absorption and scattering of light by small particles, Wiley-VCH, Weinheim, Germany, https://doi.org/10.1002/9783527618156, 1998.
Bond, T. C., Streets, D. G., Yarber, K. F., Nelson, S. M., Woo, J.-H., and Klimont, Z.: A technology-based global inventory of black and organic carbon emissions from combustion, J. Geophys. Res.-Atmos., 109, D14203, https://doi.org/10.1029/2003JD003697, 2004.
Buchard, V., Randles, C. A., da Silva, A. M., Darmenov, A., Colarco, P. R., Govindaraju, R., Ferrare, R., Hair, J., Beyersdorf, A. J., Ziemba, L. D., and Yu, H.: The MERRA-2 aerosol reanalysis, 1980 onward. Part II: Evaluation and case studies, J. Climate, 30, 6851–6872, https://doi.org/10.1175/jcli-d-16-0613.1, 2017.
Caldwell, P., Chin, H.-N. S., Bader, D. C., and Bala, G.: Evaluation of a WRF dynamical downscaling simulation over California, Climatic Change, 95, 499–521, https://doi.org/10.1007/s10584-009-9583-5, 2009.
Chand, D., Wood, R., Anderson, T. L., Satheesh, S. K., and Charlson, R. J.: Satellite-derived direct radiative effect of aerosols dependent on cloud cover, Nat. Geosci., 2, 181–184, https://doi.org/10.1038/ngeo437, 2009.
Chavan, P., Fadnavis, S., Chakroborty, T., Sioris, C. E., Griessbach, S., and Müller, R.: The outflow of Asian biomass burning carbonaceous aerosol into the upper troposphere and lower stratosphere in spring: radiative effects seen in a global model, Atmos. Chem. Phys., 21, 14371–14384, https://doi.org/10.5194/acp-21-14371-2021, 2021.
Chen, Y., Yang, K., Zhou, D., Qin, J., and Guo, X.: Improving the Noah land surface model in arid regions with an appropriate parameterization of the thermal roughness length, J. Hydrol., 11, 995–1006, https://doi.org/10.1175/2010jhm1185.1, 2010.
de Graaf, M., Stammes, P., Torres, O., and Koelemeijer, R. B. A.: Absorbing Aerosol Index: Sensitivity analysis, application to GOME and comparison with TOMS, J. Geophys. Res.-Atmos., 110, D01201, https://doi.org/10.1029/2004JD005178, 2005.
Deng, X., Tie, X., Zhou, X., Wu, D., Zhong, L., Tan, H., Li, F., Huang, X., Bi, X., and Deng, T.: Effects of Southeast Asia biomass burning on aerosols and ozone concentrations over the Pearl River Delta (PRD) region, Atmos. Environ., 42, 8493–8501, https://doi.org/10.1016/j.atmosenv.2008.08.013, 2008.
Ding, K., Huang, X., Ding, A., Wang, M., Su, H., Kerminen, V.-M., Petäjä, T., Tan, Z., Wang, Z., Zhou, D., Sun, J., Liao, H., Wang, H., Carslaw, K., Wood, R., Zuidema, P., Rosenfeld, D., Kulmala, M., Fu, C., Pöschl, U., Cheng, Y., and Andreae, M. O.: Aerosol-boundary-layer-monsoon interactions amplify semi-direct effect of biomass smoke on low cloud formation in Southeast Asia, Nat. Commun., 12, 6416, https://doi.org/10.1038/s41467-021-26728-4, 2021.
Dong, X., Fu, J. S., Huang, K., Zhu, Q., and Tipton, M.: Regional climate effects of biomass burning and dust in East Asia: Evidence from modeling and observation, Geophys. Res. Lett., 46, 11490–11499, https://doi.org/10.1029/2019gl083894, 2019.
Feingold, G., Jiang, H., and Harrington, J. Y.: On smoke suppression of clouds in Amazonia, Geophys. Res. Lett., 32, L02804, https://doi.org/10.1029/2004GL021369, 2005.
Gautam, R., Hsu, N. C., Eck, T. F., Holben, B. N., Janjai, S., Jantarach, T., Tsay, S.-C., and Lau, W. K.: Characterization of aerosols over the Indochina peninsula from satellite-surface observations during biomass burning pre-monsoon season, Atmos. Environ., 78, 51–59, https://doi.org/10.1016/j.atmosenv.2012.05.038, 2013.
Gelaro, R., McCarty, W., Suárez, M. J., Todling, R., Molod, A., Takacs, L., Randles, C. A., Darmenov, A., Bosilovich, M. G., Reichle, R., Wargan, K., Coy, L., Cullather, R., Draper, C., Akella, S., Buchard, V., Conaty, A., da Silva, A. M., Gu, W., Kim, G.-K., Koster, R., Lucchesi, R., Merkova, D., Nielsen, J. E., Partyka, G., Pawson, S., Putman, W., Rienecker, M., Schubert, S. D., Sienkiewicz, M., and Zhao, B.: The modern-era retrospective analysis for research and applications, version 2 (MERRA-2), J. Climate, 30, 5419–5454, https://doi.org/10.1175/jcli-d-16-0758.1, 2017.
Global Modeling and Assimilation Office (GMAO): MERRA-2 tavg1_2d_aer_Nx: 2d,1-Hourly,Time-averaged,Single-Level,Assimilation, Aerosol Diagnostics V5.12.4, Goddard Earth Sciences Data and Information Services Center (GES DISC) [data set], https://doi.org/10.5067/KLICLTZ8EM9D, 2015.
Gonçalves, W. A., Machado, L. A. T., and Kirstetter, P.-E.: Influence of biomass aerosol on precipitation over the Central Amazon: an observational study, Atmos. Chem. Phys., 15, 6789–6800, https://doi.org/10.5194/acp-15-6789-2015, 2015.
Grell, G. A. and Freitas, S. R.: A scale and aerosol aware stochastic convective parameterization for weather and air quality modeling, Atmos. Chem. Phys., 14, 5233–5250, https://doi.org/10.5194/acp-14-5233-2014, 2014.
Guenther, A. B., Jiang, X., Heald, C. L., Sakulyanontvittaya, T., Duhl, T., Emmons, L. K., and Wang, X.: The Model of Emissions of Gases and Aerosols from Nature version 2.1 (MEGAN2.1): an extended and updated framework for modeling biogenic emissions, Geosci. Model Dev., 5, 1471–1492, https://doi.org/10.5194/gmd-5-1471-2012, 2012.
Gupta, P., Levy, R. C., Mattoo, S., Remer, L. A., and Munchak, L. A.: A surface reflectance scheme for retrieving aerosol optical depth over urban surfaces in MODIS Dark Target retrieval algorithm, Atmos. Meas. Tech., 9, 3293–3308, https://doi.org/10.5194/amt-9-3293-2016, 2016.
Heidinger, A. K., Foster, M. J., Walther, A., and Zhao, X.: The pathfinder atmospheres–extended AVHRR climate dataset, B. Am. Meteorol. Soc., 95, 909–922, https://doi.org/10.1175/bams-d-12-00246.1, 2014.
Herbert, R., Stier, P., and Dagan, G.: Isolating large-scale smoke impacts on cloud and precipitation processes over the Amazon with convection permitting resolution, J. Geophys. Res.-Atmos., 126, e2021JD034615, https://doi.org/10.1029/2021JD034615, 2021.
Hersbach, H. and Dee, D.: ERA5 reanalysis is in production, ECMWF Newsletter, 147, 5–6, 2016.
Hersbach, H., Bell, B., Berrisford, P., Biavati, G., Horányi, A., Muñoz Sabater, J., Nicolas, J., Peubey, C., Radu, R., Rozum, I., Schepers, D., Simmons, A., Soci, C., Dee, D., and Thépaut, J.-N.: ERA5 hourly data on pressure levels from 1959 to present, Copernicus Climate Change Service (C3S) Climate Data Store (CDS) [data set], https://doi.org/10.24381/cds.bd0915c6, 2018.
Hodnebrog, Ø., Myhre, G., Forster, P. M., Sillmann, J., and Samset, B. H.: Local biomass burning is a dominant cause of the observed precipitation reduction in southern Africa, Nat. Commun., 7, 11236, https://doi.org/10.1038/ncomms11236, 2016.
Holben, B. N., Eck, T. F., Slutsker, I., Tanré, D., Buis, J. P., Setzer, A., Vermote, E., Reagan, J. A., Kaufman, Y. J., Nakajima, T., Lavenu, F., Jankowiak, I., and Smirnov, A.: AERONET – A federated instrument network and data archive for aerosol characterization, Remote. Sens. Environ., 66, 1–16, https://doi.org/10.1016/S0034-4257(98)00031-5, 1998.
Hoskins, B. J.: Towards a PV-θ view of the general circulation, Tellus A, 43, 27–36, https://doi.org/10.3402/tellusa.v43i4.11936, 1991.
Huang, H.-Y., Wang, S.-H., Huang, W.-X., Lin, N.-H., Chuang, M.-T., da Silva, A. M., and Peng, C.-M.: Influence of synoptic-dynamic meteorology on the long-range transport of Indochina biomass burning aerosols, J. Geophys. Res.-Atmos., 125, e2019JD031260, https://doi.org/10.1029/2019JD031260, 2020.
Huang, K., Fu, J. S., Hsu, N. C., Gao, Y., Dong, X., Tsay, S.-C., and Lam, Y. F.: Impact assessment of biomass burning on air quality in Southeast and East Asia during BASE-ASIA, Atmos. Environ., 78, 291–302, https://doi.org/10.1016/j.atmosenv.2012.03.048, 2013.
Huang, W.-R., Wang, S.-H., Yen, M.-C., Lin, N.-H., and Promchote, P.: Interannual variation of springtime biomass burning in Indochina: Regional differences, associated atmospheric dynamical changes, and downwind impacts, J. Geophys. Res.-Atmos., 121, 10016–10028, https://doi.org/10.1002/2016jd025286, 2016.
Huang, X., Ding, A., Liu, L., Liu, Q., Ding, K., Niu, X., Nie, W., Xu, Z., Chi, X., Wang, M., Sun, J., Guo, W., and Fu, C.: Effects of aerosol–radiation interaction on precipitation during biomass-burning season in East China, Atmos. Chem. Phys., 16, 10063–10082, https://doi.org/10.5194/acp-16-10063-2016, 2016.
Huffman, G. J., Bolvin, D. T., Nelkin, E. J., Wolff, D. B., Adler, R. F., Gu, G., Hong, Y., Bowman, K. P., and Stocker, E. F.: The TRMM multisatellite precipitation analysis (TMPA): Quasi-global, multiyear, combined-sensor precipitation estimates at fine scales, J. Hydrol., 8, 38–55, https://doi.org/10.1175/jhm560.1, 2007.
Huffman, G. J., Bolvin, D. T., Nelkin, E. J., and Adler, R. F.: TRMM (TMPA) Precipitation L3 1 day 0.25 degree x 0.25 degree V7, Goddard Earth Sciences Data and Information Services Center (GES DISC) [data set], https://doi.org/10.5067/TRMM/TMPA/DAY/7, 2016.
Iacono, M. J., Delamere, J. S., Mlawer, E. J., Shephard, M. W., Clough, S. A., and Collins, W. D.: Radiative forcing by long-lived greenhouse gases: Calculations with the AER radiative transfer models, J. Geophys. Res.-Atmos., 113, D13103, https://doi.org/10.1029/2008JD009944, 2008.
Jacobson, M. Z.: Effects of biomass burning on climate, accounting for heat and moisture fluxes, black and brown carbon, and cloud absorption effects, J. Geophys. Res.-Atmos., 119, 8980–9002, https://doi.org/10.1002/2014JD021861, 2014.
Janjić, Z. I.: The step-mountain eta coordinate model: Further developments of the convection, viscous sublayer, and turbulence closure schemes, Mon. Weather Rev., 122, 927–945, https://doi.org/10.1175/1520-0493(1994)122<0927:tsmecm>2.0.co;2, 1994.
Jiang, Y., Yang, X.-Q., Liu, X., Qian, Y., Zhang, K., Wang, M., Li, F., Wang, Y., and Lu, Z.: Impacts of wildfire aerosols on global energy budget and climate: The role of climate feedbacks, J. Climate, 33, 3351–3366, https://doi.org/10.1175/jcli-d-19-0572.1, 2020.
Kahn, R. A., Gaitley, B. J., Martonchik, J. V., Diner, D. J., Crean, K. A., and Holben, B.: Multiangle Imaging Spectroradiometer (MISR) global aerosol optical depth validation based on 2 years of coincident Aerosol Robotic Network (AERONET) observations, J. Geophys. Res.-Atmos., 110, D10S04, https://doi.org/10.1029/2004JD004706, 2005.
Kaskaoutis, D. G., Nastos, P. T., Kosmopoulos, P. G., Kambezidis, H. D., Kharol, S. K., and Badarinath, K. V. S.: The Aura–OMI Aerosol Index distribution over Greece, Atmos. Res., 98, 28–39, https://doi.org/10.1016/j.atmosres.2010.03.018, 2010.
Koren, I., Kaufman, Y. J., Remer, L. A., and Martins, J. V.: Measurement of the effect of Amazon smoke on inhibition of cloud formation, Science, 303, 1342–1345, https://doi.org/10.1126/science.1089424, 2004.
Lau, K. M., Kim, M. K., and Kim, K. M.: Asian summer monsoon anomalies induced by aerosol direct forcing: the role of the Tibetan Plateau, Clim. Dynam., 26, 855–864, https://doi.org/10.1007/s00382-006-0114-z, 2006.
Lau, W. K. M.: The aerosol-monsoon climate system of Asia: A new paradigm, J. Meteorol. Res.-PRC., 30, 1–11, https://doi.org/10.1007/s13351-015-5999-1, 2016.
Lee, D., Sud, Y. C., Oreopoulos, L., Kim, K.-M., Lau, W. K., and Kang, I.-S.: Modeling the influences of aerosols on pre-monsoon circulation and rainfall over Southeast Asia, Atmos. Chem. Phys., 14, 6853–6866, https://doi.org/10.5194/acp-14-6853-2014, 2014.
Lee, H.-H. and Wang, C.: The impacts of biomass burning activities on convective systems over the Maritime Continent, Atmos. Chem. Phys., 20, 2533–2548, https://doi.org/10.5194/acp-20-2533-2020, 2020.
Lee, W.-S. and Kim, M.-K.: Effects of radiative forcing by black carbon aerosol on spring rainfall decrease over Southeast Asia, Atmos. Environ., 44, 3739–3744, https://doi.org/10.1016/j.atmosenv.2010.06.058, 2010.
LeGrand, S. L., Polashenski, C., Letcher, T. W., Creighton, G. A., Peckham, S. E., and Cetola, J. D.: The AFWA dust emission scheme for the GOCART aerosol model in WRF-Chem v3.8.1, Geosci. Model Dev., 12, 131–166, https://doi.org/10.5194/gmd-12-131-2019, 2019.
Levy, R. C., Remer, L. A., Kleidman, R. G., Mattoo, S., Ichoku, C., Kahn, R., and Eck, T. F.: Global evaluation of the Collection 5 MODIS dark-target aerosol products over land, Atmos. Chem. Phys., 10, 10399–10420, https://doi.org/10.5194/acp-10-10399-2010, 2010.
Li, G., Chen, H., Xu, M., Zhao, C., Zhong, L., Li, R., Fu, Y., and Gao, Y.: Impacts of topographic complexity on modeling moisture transport and precipitation over the Tibetan Plateau in summer, Adv. Atmos. Sci., 39, 1151–1166, https://doi.org/10.1007/s00376-022-1409-7, 2022.
Li, M., Liu, H., Geng, G., Hong, C., Liu, F., Song, Y., Tong, D., Zheng, B., Cui, H., Man, H., Zhang, Q., and He, K.: Anthropogenic emission inventories in China: a review, Natl. Sci. Rev., 4, 834–866, https://doi.org/10.1093/nsr/nwx150, 2017a.
Li, M., Zhang, Q., Kurokawa, J.-I., Woo, J.-H., He, K., Lu, Z., Ohara, T., Song, Y., Streets, D. G., Carmichael, G. R., Cheng, Y., Hong, C., Huo, H., Jiang, X., Kang, S., Liu, F., Su, H., and Zheng, B.: MIX: a mosaic Asian anthropogenic emission inventory under the international collaboration framework of the MICS-Asia and HTAP, Atmos. Chem. Phys., 17, 935–963, https://doi.org/10.5194/acp-17-935-2017, 2017b.
Li, Z., Lau, W. K.-M., Ramanathan, V., Wu, G., Ding, Y., Manoj, M. G., Liu, J., Qian, Y., Li, J., Zhou, T., Fan, J., Rosenfeld, D., Ming, Y., Wang, Y., Huang, J., Wang, B., Xu, X., Lee, S.-S., Cribb, M., Zhang, F., Yang, X., Zhao, C., Takemura, T., Wang, K., Xia, X., Yin, Y., Zhang, H., Guo, J., Zhai, P. M., Sugimoto, N., Babu, S. S., and Brasseur, G. P.: Aerosol and monsoon climate interactions over Asia, Rev. Geophy., 54, 866–929, https://doi.org/10.1002/2015RG000500, 2016.
Lin, C.-Y., Hsu, H.-m., Lee, Y. H., Kuo, C. H., Sheng, Y.-F., and Chu, D. A.: A new transport mechanism of biomass burning from Indochina as identified by modeling studies, Atmos. Chem. Phys., 9, 7901–7911, https://doi.org/10.5194/acp-9-7901-2009, 2009.
Lin, C.-Y., Zhao, C., Liu, X., Lin, N.-H., and Chen, W.-N.: Modelling of long-range transport of Southeast Asia biomass-burning aerosols to Taiwan and their radiative forcings over East Asia, Tellus B, 66, 23733, https://doi.org/10.3402/tellusb.v66.23733, 2014.
Liu, L., Cheng, Y., Wang, S., Wei, C., Pöhlker, M. L., Pöhlker, C., Artaxo, P., Shrivastava, M., Andreae, M. O., Pöschl, U., and Su, H.: Impact of biomass burning aerosols on radiation, clouds, and precipitation over the Amazon: relative importance of aerosol–cloud and aerosol–radiation interactions, Atmos. Chem. Phys., 20, 13283–13301, https://doi.org/10.5194/acp-20-13283-2020, 2020.
Liu, T., Mickley, L. J., Marlier, M. E., DeFries, R. S., Khan, M. F., Latif, M. T., and Karambelas, A.: Diagnosing spatial biases and uncertainties in global fire emissions inventories: Indonesia as regional case study, Remote Sens. Environ., 237, 111557, https://doi.org/10.1016/j.rse.2019.111557, 2020.
Liu, Y., Wu, G., Yu, R., and Liu, X.: Thermal adaptation, overshooting, dispersion, and subtropical anticyclone part II: Horizontal inhomogeneous heating and energy dispersion, Chinese J. Atmos. Sci., 25, 317–328, https://doi.org/10.3878/j.issn.1006-9895.2001.03.03, 2001 (in Chinese).
Lu, Z., Liu, X., Zhang, Z., Zhao, C., Meyer, K., Rajapakshe, C., Wu, C., Yang, Z., and Penner, J. E.: Biomass smoke from southern Africa can significantly enhance the brightness of stratocumulus over the southeastern Atlantic Ocean, P. Natl. Acad. Sci. USA, 115, 2924–2929, https://doi.org/10.1073/pnas.1713703115, 2018.
Ma, L.-M. and Tan, Z.-M.: Improving the behavior of the cumulus parameterization for tropical cyclone prediction: Convection trigger, Atmos. Res., 92, 190–211, https://doi.org/10.1016/j.atmosres.2008.09.022, 2009.
Mapes, B. E.: Convective inhibition, subgrid-scale triggering energy, and stratiform instability in a toy tropical wave model, J. Atmos. Sci., 57, 1515–1535, https://doi.org/10.1175/1520-0469(2000)057<1515:cisste>2.0.co;2, 2000.
Martins, J. A., Silva Dias, M. A. F., and Gonçalves, F. L. T.: Impact of biomass burning aerosols on precipitation in the Amazon: A modeling case study, J. Geophys. Res.-Atmos., 114, D02207, https://doi.org/10.1029/2007JD009587, 2009.
Morrison, H., Thompson, G., and Tatarskii, V.: Impact of cloud microphysics on the development of trailing stratiform precipitation in a simulated squall line: Comparison of one- and two-moment schemes, Mon. Weather Rev., 137, 991–1007, https://doi.org/10.1175/2008mwr2556.1, 2009.
Myhre, G., Stordal, F., Johnsrud, M., Kaufman, Y. J., Rosenfeld, D., Storelvmo, T., Kristjansson, J. E., Berntsen, T. K., Myhre, A., and Isaksen, I. S. A.: Aerosol-cloud interaction inferred from MODIS satellite data and global aerosol models, Atmos. Chem. Phys., 7, 3081–3101, https://doi.org/10.5194/acp-7-3081-2007, 2007.
National Centers for Environmental Prediction (NCEP), National Weather Service (NWS), NOAA, U.S. Department of Commerce (DOC): NCEP FNL Operational Model Global Tropospheric Analyses, continuing from July 1999, Research Data Archive at the NCEP, Computational and Information Systems Laboratory [data set], https://doi.org/10.5065/D6M043C6, 2000.
Ning, G., Wang, S., Ma, M., Ni, C., Shang, Z., Wang, J., and Li, J.: Characteristics of air pollution in different zones of Sichuan Basin, China, Sci. Total Environ., 612, 975–984, https://doi.org/10.1016/j.scitotenv.2017.08.205, 2018.
Pahlow, M., Parlange, M. B., and Porté-Agel, F.: On Monin–Obukhov similarity in the stable atmospheric boundary layer, Bound.-Lay. Meteorol., 99, 225–248, https://doi.org/10.1023/A:1018909000098, 2001.
Pan, X., Ichoku, C., Chin, M., Bian, H., Darmenov, A., Colarco, P., Ellison, L., Kucsera, T., da Silva, A., Wang, J., Oda, T., and Cui, G.: Six global biomass burning emission datasets: intercomparison and application in one global aerosol model, Atmos. Chem. Phys., 20, 969–994, https://doi.org/10.5194/acp-20-969-2020, 2020.
Pani, S. K., Wang, S.-H., Lin, N.-H., Lee, C.-T., Tsay, S.-C., Holben, B. N., Janjai, S., Hsiao, T.-C., Chuang, M.-T., and Chantara, S.: Radiative effect of springtime biomass-burning aerosols over northern Indochina during 7-SEAS/BASELInE 2013 campaign, Aerosol Air Qual. Res., 16, 2802–2817, https://doi.org/10.4209/aaqr.2016.03.0130, 2016.
Pani, S. K., Lin, N.-H., Chantara, S., Wang, S.-H., Khamkaew, C., Prapamontol, T., and Janjai, S.: Radiative response of biomass-burning aerosols over an urban atmosphere in northern peninsular Southeast Asia, Sci. Total Environ., 633, 892–911, https://doi.org/10.1016/j.scitotenv.2018.03.204, 2018.
Platnick, S., Hubanks, P., Meyer, K., and King, M. D.: MODIS Atmosphere L3 Monthly Product, NASA MODIS Adaptive Processing System, Goddard Space Flight Center, U.S.A. [data set], https://doi.org/10.5067/MODIS/MOD08_M3.061, 2015.
Qin, Y. and Xie, S. D.: Spatial and temporal variation of anthropogenic black carbon emissions in China for the period 1980–2009, Atmos. Chem. Phys., 12, 4825–4841, https://doi.org/10.5194/acp-12-4825-2012, 2012.
Randerson, J. T., Van Der Werf, G. R., Giglio, L., Collatz, G. J., and Kasibhatla, P. S.: Global fire emissions database, version 4.1 (GFEDv4), ORNL Distributed Active Archive Center [data set], https://doi.org/10.3334/ORNLDAAC/1293, 2017.
Randerson, J. T., van der Werf, G. R., Giglio, L.,Collatz, G. J., and Kasibhatla, P. S.: Global Fire Emissions Database, Version 4.1 (GFEDv4), ORNL DAAC, Oak Ridge, Tennessee, USA [data set], https://doi.org/10.3334/ORNLDAAC/1293, 2018.
Reid, J. S., Koppmann, R., Eck, T. F., and Eleuterio, D. P.: A review of biomass burning emissions part II: intensive physical properties of biomass burning particles, Atmos. Chem. Phys., 5, 799–825, https://doi.org/10.5194/acp-5-799-2005, 2005.
Requia, W. J., Amini, H., Mukherjee, R., Gold, D. R., and Schwartz, J. D.: Health impacts of wildfire-related air pollution in Brazil: a nationwide study of more than 2 million hospital admissions between 2008 and 2018, Nat. Commun., 12, 6555, https://doi.org/10.1038/s41467-021-26822-7, 2021.
Sakaeda, N., Wood, R., and Rasch, P. J.: Direct and semidirect aerosol effects of southern African biomass burning aerosol, J. Geophys. Res.-Atmos., 116, D12205, https://doi.org/10.1029/2010JD015540, 2011.
Shi, Y., Sasai, T., and Yamaguchi, Y.: Spatio-temporal evaluation of carbon emissions from biomass burning in Southeast Asia during the period 2001–2010, Ecol. Model., 272, 98–115, https://doi.org/10.1016/j.ecolmodel.2013.09.021, 2014.
Takeishi, A. and Wang, C.: Radiative and microphysical responses of clouds to an anomalous increase in fire particles over the Maritime Continent in 2015, Atmos. Chem. Phys., 22, 4129–4147, https://doi.org/10.5194/acp-22-4129-2022, 2022.
Torres, O., Tanskanen, A., Veihelmann, B., Ahn, C., Braak, R., Bhartia, P. K., Veefkind, P., and Levelt, P.: Aerosols and surface UV products from Ozone Monitoring Instrument observations: An overview, J. Geophys. Res.-Atmos., 112, D24S47, https://doi.org/10.1029/2007JD008809, 2007.
Torres, O. O.: OMI/Aura Near UV Aerosol Optical Depth and Single Scattering Albedo L3 1 day 1.0 degree x 1.0 degree V3, NASA Goddard Space Flight Center, Goddard Earth Sciences Data and Information Services Center (GES DISC) [data set], https://doi.org/10.5067/Aura/OMI/DATA3003, 2008.
Tropical Rainfall Measuring Mission (TRMM): TRMM (TMPA/3B43) Rainfall Estimate L3 1 month 0.25 degree x 0.25 degree V7, Goddard Earth Sciences Data and Information Services Center (GES DISC) [data set], https://doi.org/10.5067/TRMM/TMPA/MONTH/7, 2011.
Tsinghua University, China Carbon Emission Accounts and Datasets (CEADs) team, Chinese Academy of Environmental Planning of the Ministry of Ecology and Environment (CAEP): Multi-resolution Emission Inventory for China and MIX-Asia dataset, MEIC Data Platform [data set], http://meicmodel.org.cn/, last access: 2 December 2022.
Tummon, F., Solmon, F., Liousse, C., and Tadross, M.: Simulation of the direct and semidirect aerosol effects on the southern Africa regional climate during the biomass burning season, J. Geophys. Res.-Atmos., 115, D19206, https://doi.org/10.1029/2009JD013738, 2010.
University Corporation for Atmospheric Research (UCAR): WRF Source Codes and Graphics Software Downloads, UCAR [code], https://www2.mmm.ucar.edu/wrf/users/download/get_source.html, last access: 2 December 2022a.
University Corporation for Atmospheric Research (UCAR): Fire Emission Factors and Emission Inventories, UCAR [data set], https://www.acom.ucar.edu/Data/fire/, last access: 2 December 2022b.
Wang, J., jiang, Q., You, Y., Rao, X., Sheng, L., Gui, H., Hua, C., and Zhang, B.: Effects of biomass burning aerosol in Southeast Asia on haze and precipitation over China, Meteor. Mon., 47, 348–358, 2021 (in Chinese).
Wiedinmyer, C., Akagi, S. K., Yokelson, R. J., Emmons, L. K., Al-Saadi, J. A., Orlando, J. J., and Soja, A. J.: The Fire INventory from NCAR (FINN): a high resolution global model to estimate the emissions from open burning, Geosci. Model Dev., 4, 625–641, https://doi.org/10.5194/gmd-4-625-2011, 2011.
Wu, G. and Liu, Y.: Thermal adaptation, overshooting, dispersion, and subtropical anticyclone part I: Thermal adaptation and overshooting, Chinese J. Atmos. Sci., 24, 433–446, https://doi.org/10.3878/j.issn.1006-9895.2000.04.01, 2000 (in Chinese).
Wu, G., Li, Z., Fu, C., Zhang, X., Zhang, R., Zhang, R., Zhou, T., Li, J., Li, J., Zhou, D., Wu, L., Zhou, L., He, B., and Huang, R.: Advances in studying interactions between aerosols and monsoon in China, Sci. China Earth Sci., 59, 1–16, https://doi.org/10.1007/s11430-015-5198-z, 2016.
Yadav, I. C., Linthoingambi Devi, N., Li, J., Syed, J. H., Zhang, G., and Watanabe, H.: Biomass burning in Indo-China peninsula and its impacts on regional air quality and global climate change-a review, Environ. Pollut., 227, 414–427, https://doi.org/10.1016/j.envpol.2017.04.085, 2017.
Yang, Q., Zhao, T., Tian, Z., Kumar, K. R., Chang, J., Hu, W., Shu, Z., and Hu, J.: The cross-border transport of PM2.5 from the Southeast Asian biomass burning emissions and its impact on air pollution in Yunnan Plateau, Southwest China, Remote Sens.-Basel, 14, 1886, https://doi.org/10.3390/rs14081886, 2022.
Yang, S., Lau, W. K. M., Ji, Z., Dong, W., and Yang, S.: Impacts of radiative effect of pre-monsoon biomass burning aerosols on atmospheric circulation and rainfall over Southeast Asia and southern China, Clim. Dynam., 59, 417–432, https://doi.org/10.1007/s00382-021-06135-7, 2022.
Zaveri, R. A. and Peters, L. K.: A new lumped structure photochemical mechanism for large-scale applications, J. Geophys. Res.-Atmos., 104, 30387–30415, https://doi.org/10.1029/1999JD900876, 1999.
Zaveri, R. A., Easter, R. C., Fast, J. D., and Peters, L. K.: Model for simulating aerosol interactions and chemistry (MOSAIC), J. Geophys. Res.-Atmos., 113, D13204, https://doi.org/10.1029/2007JD008782, 2008.
Zhang, Y., Fu, R., Yu, H., Qian, Y., Dickinson, R., Silva Dias, M. A. F., da Silva Dias, P. L., and Fernandes, K.: Impact of biomass burning aerosol on the monsoon circulation transition over Amazonia, Geophys. Res. Lett., 36, L10814, https://doi.org/10.1029/2009GL037180, 2009.
Zhao, J., Ma, X., Wu, S., and Sha, T.: Dust emission and transport in Northwest China: WRF-Chem simulation and comparisons with multi-sensor observations, Atmos. Res., 241, 104978, https://doi.org/10.1016/j.atmosres.2020.104978, 2020.
Zhou, Y., Yan, H., and Luo, J.-J.: Impacts of amazon fire aerosols on the subseasonal circulations of the mid-high latitudes, Front. Earth Sci., 8, 609554, https://doi.org/10.3389/feart.2020.597865, 2021.
Zhu, A., Xu, H., Deng, J., Ma, J., and Li, S.: El Niño–Southern Oscillation (ENSO) effect on interannual variability in spring aerosols over East Asia, Atmos. Chem. Phys., 21, 5919–5933, https://doi.org/10.5194/acp-21-5919-2021, 2021.