the Creative Commons Attribution 4.0 License.
the Creative Commons Attribution 4.0 License.
 | 30 Nov 2022
Measurement report: Increasing trend of atmospheric ion concentrations in the boreal forest
Janne Lampilahti
Xuemeng Chen
Jenni Kontkanen
Tuomo Nieminen
Veli-Matti Kerminen
Tuukka Petäjä
Markku Kulmala
Katrianne Lehtipalo
The concentration of atmospheric ions affects the total aerosol particle number concentrations in the atmosphere as well as atmospheric new particle formation via ion-induced nucleation, ion–ion recombination, and effects on condensational growth. In this study, we investigate the concentrations and long-term trends of atmospheric ions in a boreal forest environment using 16 years of cluster ion (0.8–2 nm) and intermediate ion (2–7 nm) measurements and characterize the most important factors that explain those trends. We found that the median concentration of cluster ions in a boreal forest was 710 cm−3, the median concentration of 2–4 intermediate ions was 14 cm−3, and the median concentration of 4–7 nm intermediate ions was 9 cm−3. The concentrations of both cluster and intermediate ions have been increasing over the 16-year measurement period, with cluster ion concentrations increasing by about 1 % yr−1 and intermediate ion concentrations increasing 1.7 %–3.9 % yr−1. The increase in cluster ion concentrations can be best explained by the decrease in the coagulation sink caused by larger aerosol particles. Meanwhile, the dependence of intermediate ion concentrations on meteorological conditions is evident, but ionization sources and the coagulation sink do not seem to explain the increasing trend. This is likely because the dynamics of intermediate ions are more complicated, so that ionization sources and the coagulation sink alone cannot directly explain the variation. Season-specific analysis of the ion concentrations suggests that while the coagulation sink is the limiting factor for the ion concentrations in spring and summer, the dynamics are different in autumn and winter. Based on our findings, we recommend that a more comprehensive analysis is needed to determine if the increase in ambient ion concentrations, increasing temperature, and changing abundance of condensable vapors makes ion-mediated and ion-induced nucleation pathways in the boreal forest more relevant in the future.
- Article
(7294 KB) - Full-text XML
- BibTeX
- EndNote


Atmospheric ions are produced via the ionization of air molecules (Rutherford, 1897), and primary ions are typically formed from nitrogen and oxygen due to their abundance in the atmosphere (Israël, 1970). The three main atmospheric ionization sources are radon decay, terrestrial gamma radiation, and cosmic rays (Eisenbud and Gesell, 1997; Mironova et al., 2015; Bazilevskaya et al., 2008). Anthropogenic sources of ionizing radiation come mostly from radiation leaks from nuclear power plants and nuclear weapon detonations (WHO, 1968). The charge can then be neutralized by ion–ion recombination, lost to a foreign surface, or transferred to other charged or neutral molecules, clusters, or aerosol particles (Seinfeld and Pandis, 1998; Tammet et al., 2006). Of the charged particles, cluster ions (0.8–2 nm) exist in the atmosphere all the time (Venzac et al., 2007, 2008; Mirme et al., 2010). Intermediate ions (2–7 nm) are typically formed by the propagation of charge onto initially neutral particles of the same size (Tammet et al., 2013) or through ion-mediated nucleation (Hirsikko et al., 2011). All ion diameters mentioned here and further in the text are mobility diameters. Ions of this size are typically generated by atmospheric new particle formation (NPF), snowfall, or rain (Manninen et al., 2010; Kerminen et al., 2018; Leino et al., 2016).
Atmospheric ions are the carriers of electric charge in the atmosphere. The ability for air to conduct electricity was first discovered by Richmann (1751) and Coulomb (1785), and Faraday (1834) proposed an explanation for this by suggesting that neutral molecules are ionized. Early results focused on understanding the charging of air molecules and aerosols in specific charge events, such as thunderstorms and electrification of clouds (Canton, 1753; Franklin, 1751). It was not until after the discovery of radioactivity by Wilhelm Röntgen, Henri Becquerel, and Marie and Pierre Curie that the ionization of neutral air ions in fair weather conditions was successfully explained (Carlson and De Angelis, 2011; De Angelis, 2014; Wilson, 1895, 1899). Air ions were then subsequently used to measure radioactivity as well as air quality (Misaki et al., 1972a, b, 1975; Tuomi, 1989; Israelsson and Knudsen, 1986; Retalis and Pitta, 1989).
The phenomenon of atmospheric ions was historically studied in the field of atmospheric electricity (Israël, 1970) because measuring atmospheric ions and their flow allows for the measurement of the conduction current in the atmosphere (Harrison and Carslaw, 2003; Wilson, 1921). However, in the past 30 years, the relevance of atmospheric ions and aerosols has been recognized, and the role of charged aerosols in both cloud processes and NPF has been debated (Dickinson, 1975; Arnold, 1980; Nadytko et al., 2003, Kulmala and Tammet, 2007; Enghoff and Svensmark, 2008). The current view is that ions can contribute to both the formation (Kirkby et al., 2011, 2016) and growth of small particles (Lehtipalo et al., 2016; Leppä et al., 2011; Stolzenburg et al., 2020; Svensmark et al., 2017), but the overall significance of ion-induced nucleation in the present-day atmosphere is rather limited, at least in the continental boundary layer (Manninen et al., 2010; Kulmala et al., 2013; Dunne et al., 2016).
Despite the increased interest in atmospheric ion concentration in the past decades, there has been relatively little research on how atmospheric ion concentrations have changed over time. Hirsikko et al. (2011) compared ion concentration measurements around the world in different environments. Their study included measurements from several different time periods, but no analysis of the long-term changes in concentrations was done. Other studies have investigated the diurnal and seasonal cycles of atmospheric ions based on a few years of data at best (Chen et al., 2016, Manninen et al., 2009) or have been focused on characterizing the charged aerosol size distribution (Hõrrak, 2001). Long-term trends of atmospheric ions and their characteristic properties have not been properly assessed.
In this study, we investigate the long-term trends of atmospheric cluster (0.8–2 nm) and intermediate (2–7 nm) ions in the boreal forest and attempt to characterize the main drivers behind these trends. We use 16 years of cluster and intermediate ion concentration data from the SMEAR II station in Hyytiälä, Finland, as well as ionization rates calculated from gamma and radon measurements and cosmic ray models.
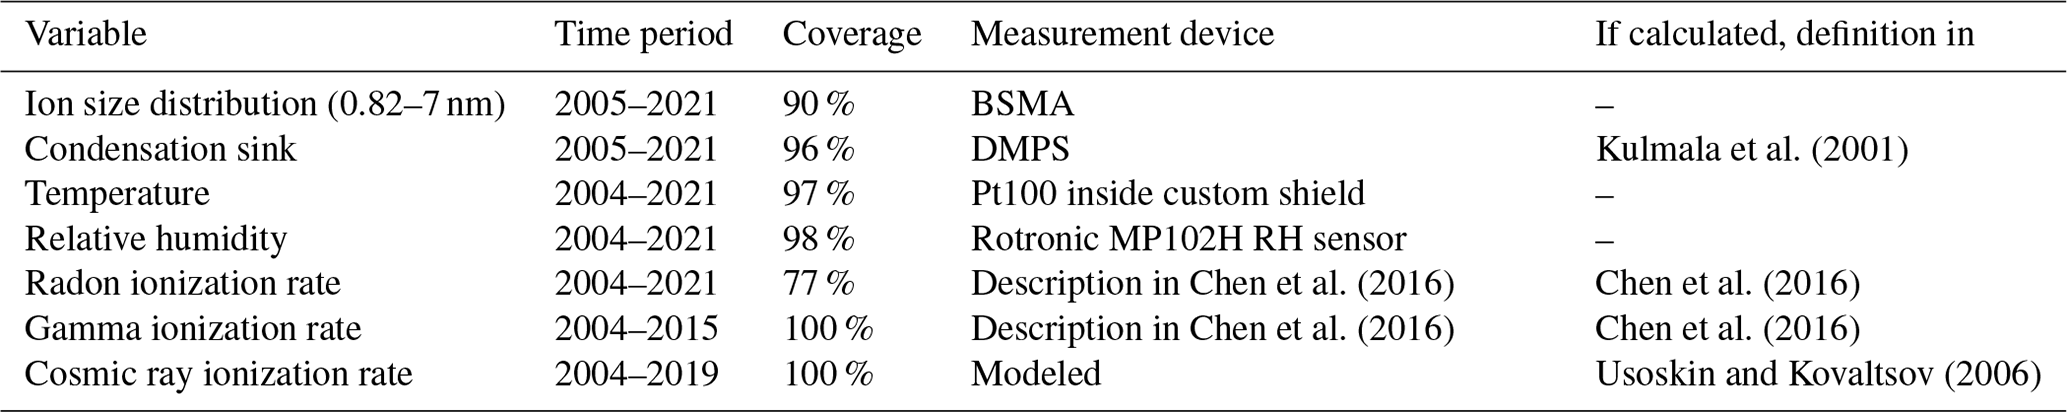
The data used in this study are from the SMEAR II station (Hari and Kulmala, 2005) in Hyytiälä, Finland (61∘50′00.0′′ N, 24∘17′00.0′′ E; 181 m a.s.l.). The station is considered a rural background station, with the largest urban settlement, Tampere, located about 60 km to the southwest. Scots pine forest surrounds the station. The station hosts a comprehensive set of long-term measurements, including aerosol, radiation, and meteorological measurements used in this study. The location of the ion measurements and the radiation measurements used to calculate the ionization rates is shown in Fig. 1. The measurement locations are between 45 and 125 m apart from each other at the site. The Balanced Scanning Mobility Analyzer (BSMA; Tammet, 2006) is at location A. The radiation measurements are currently located at site C but were at site B prior to 2019. Figure 2 and Table 1 show the data availability of all the variables used in this study, which includes the ion concentrations as well as their most important sources and sinks. Temperature and relative humidity are included as the most relevant meteorological variables.
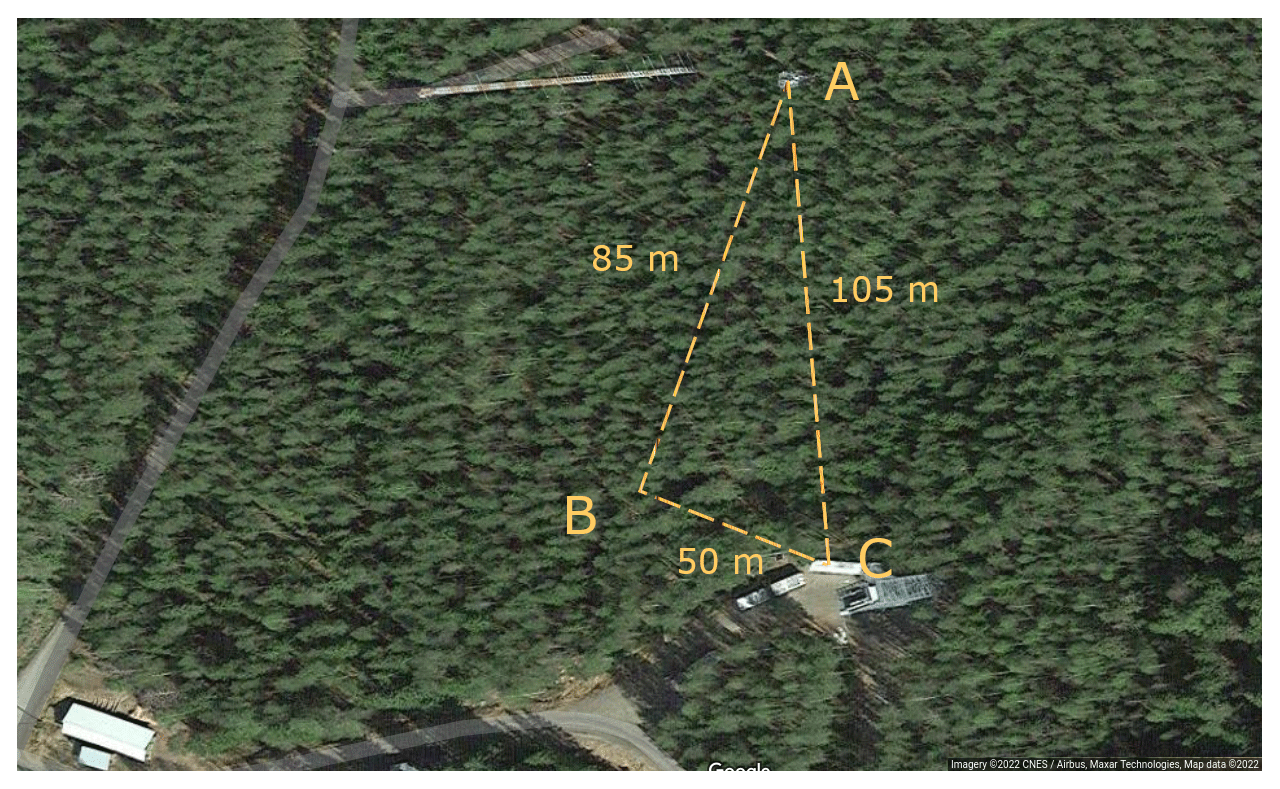
Figure 1The locations of the ion size distribution measurement at site A (BSMA) and the radiation measurements at site C (at site B prior to 2019) and their distances from one another (© Google Maps 2022).
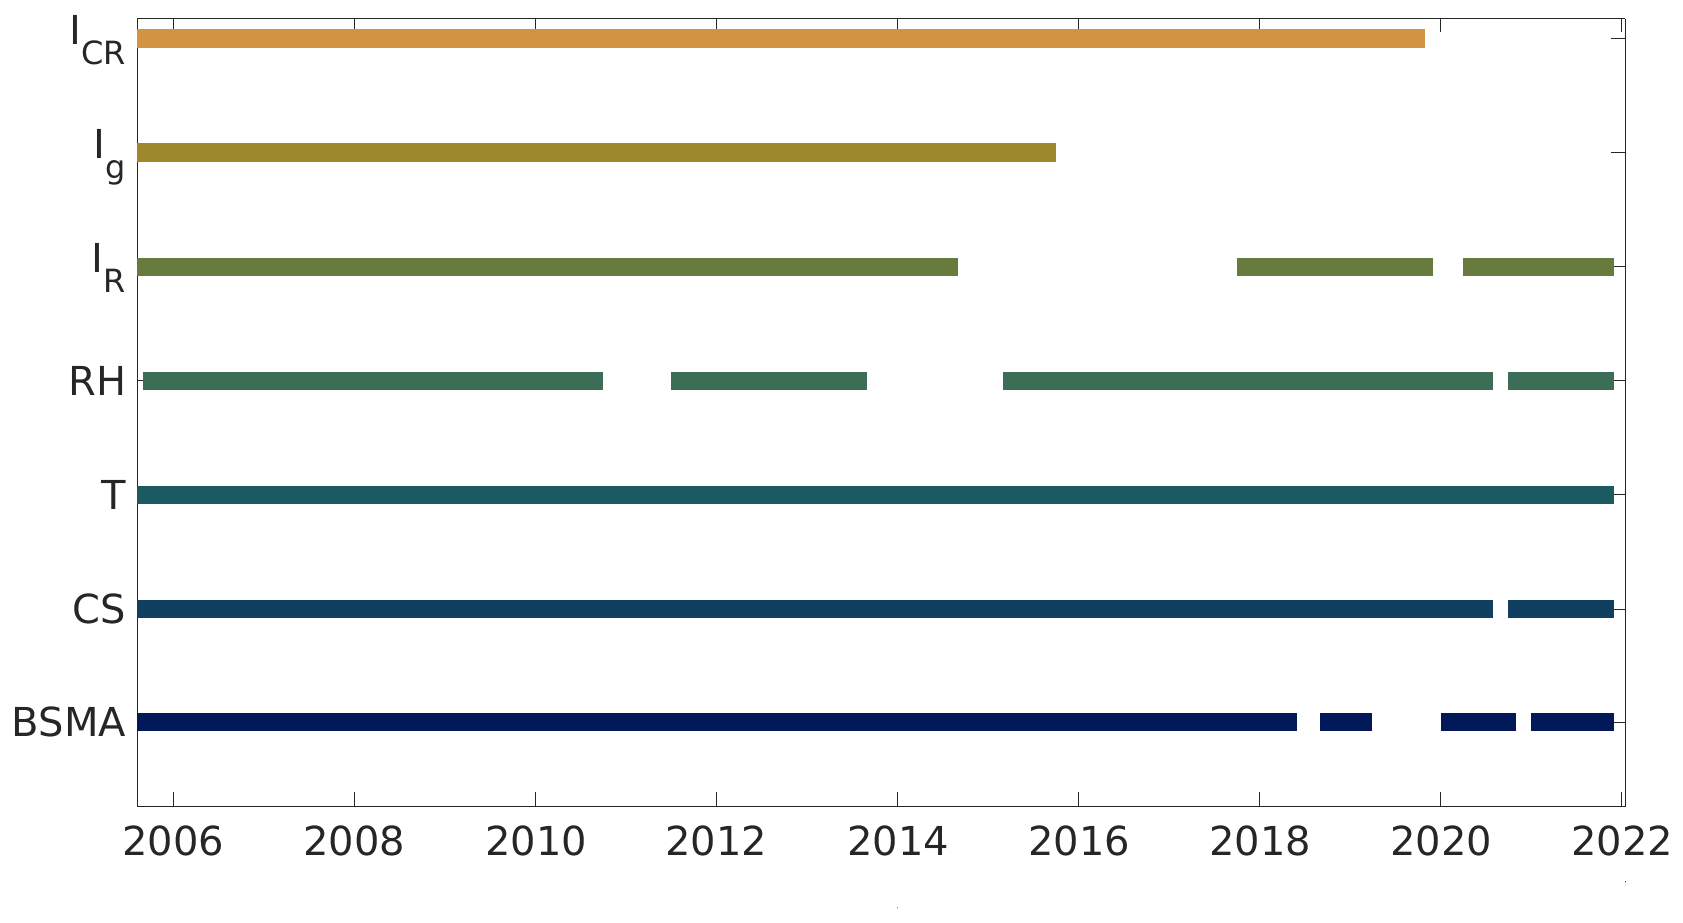
Figure 2Time periods when data are available for variables we used in our analysis. ICR is the cosmic ray ionization rate, Ig is the gamma ionization rate, IR is the radon ionization rate, RH is relative humidity, T is temperature, and CS is the condensation sink. BSMA is the ion spectrometer used in the study.
2.1 Measurements
2.1.1 Balanced Scanning Mobility Analyzer
The Balanced Scanning Mobility Analyzer (BSMA; Tammet, 2006) is a differential aspiration condenser with two parallel aspiration condensers connected as a balanced capacitance bridge. Because this eliminates the electrostatically induced current, the BSMA can continuously scan through a mobility range of 0.023–3.2 cm2 V−1 s−1, which corresponds to a mobility diameter range of 0.82 to 8.3 nm in Millikan diameters. The inlet flow rate is set to 2400 lpm (liters per minute) to reduce ion losses in the inlet. The time resolution of the instrument is around 10 min, which is the time it takes to complete one full scan of the mobility range. We utilized the particle size distribution up to 7 nm in size because our interest was in small and intermediate ions.
2.1.2 Ion sources and sinks
We have calculated the ionization rates from gamma radiation and radon decay using the method prescribed by Chen et al. (2016) and used the modeled cosmic ray ionization rate from http://cosmicrays.oulu.fi/CRII/CRII.html (last access: 17 September 2022) and calculated the relevant ionization rate at the atmospheric depth relevant to our station by interpolation (Kulmala et al., 2010). Other sources such as traffic emissions, power lines, rain, and lightning strikes can produce cluster and intermediate ions (Eisele 1989a, b; Haverkamp et al., 2004; Tammet et al., 2009), but we estimate that their effects are minor in the long term at our site because the durations of these events are in general quite short, and the measurement site is not in the vicinity of major power lines or traffic.
The main sink for cluster and intermediate ions is their coagulation with preexisting particles. The concentration of atmospheric cluster ions can be expressed as a balance equation:
in which n is the cluster ion concentration, q is the rate of air molecule ionization, CoagS is the coagulation sink coefficient (Kulmala et al., 2001), and α is the ion–ion recombination coefficient. The coagulation sink coefficient describes the rate at which cluster ions are lost via coagulation to larger particles, and this rate can be up to 2 times higher than the corresponding rate of neutral clusters of the same size (Mahfouz and Donahue, 2021). The dynamics of the intermediate ions are more complicated, as their concentration is dependent largely on the growth of smaller aerosols, which in turn is dependent on other factors such as meteorological conditions and the abundance of condensable vapors (Kerminen et al., 2018).
For sub-10 nm particles, the condensation sink (CS) can be used as a good estimate for the changes in the coagulation sink (CoagS) (Dal Maso et al., 2002). It is not necessary to know the absolute value of the coagulation sink because we are only attempting to gauge how the coagulation sink changes over time. As Lehtinen et al. (2007) show, the coagulation sink and CS are directly linked, and it can therefore be used to evaluate changes in the coagulation sink. The CS was calculated in this study by integrating over the aerosol size distribution as presented in Kulmala et al. (2001) from a combined particle number size distribution between 3 nm and 20 µm derived from the measurement with a differential mobility particle sizer (DMPS) and an aerodynamic particle sizer (APS).
2.1.3 Meteorological variables
Temperature and relative humidity (RH) data used in this study were acquired from the smartSMEAR portal (https://smear.avaa.csc.fi/ last access: 17 September 2022; Junninen et al., 2009) with a 1 s time resolution averaged to monthly or annual resolution, depending on our needs. Temperature and RH are typical indicators of the overall conditions in the ambient air, as changes in RH are linked to changes in cloud cover (Dada et al., 2017) and precipitation. BSMA as an instrument is also sensitive to changes in humidity (Tammet, 2006), and therefore it is monitored in this study. Temperature is linked to the growing season and biological activity in the surrounding forest (Nieminen et al., 2014), which affects the atmospheric composition and availability of vapors for particle formation and growth, but it can also have a direct effect on the ion-enhanced particle formation processes (Laakso et al., 2002; Curtius et al., 2006; Yu, 2010; Kürten et al., 2016).
Table 1The variables used to explain the variance in cluster and intermediate ion concentrations. Coverage is defined as the number of data points available in the time period given.
2.2 Data verification
Prior to trend analysis, time series need to be verified for consistency and breakpoints. Instrument upgrades, relocations, inlet changes, and such can cause breakpoints in which the time series has a discontinuity due to changes in instrument calibration, detection limit, activation probability, or sizing. Therefore, it is important to detect these breakpoints and, if possible, homogenize the time series before attempting trend analysis. The most common way to determine whether a time series has a breakpoint is visually (Collaud Coen et al., 2020), but care must be taken when looking for breakpoints in ion concentrations that include multichannel instruments and/or are interpolated to a specific size range from the initial inverted number size distribution. This is because the summing or interpolation can hide possible breakpoints. We investigated our measured ion number size distributions for the breakpoints in two ways, visually and by making sure the signal variance of the instruments remained steady over the measurement period.
The visual inspection of the BSMA time series revealed no notable breakpoints in the time series. This was further supported by the channel-by-channel signal of the time series, in which the variance for each channel remained steady over the entire measurement period (see Appendix, Fig. A1). The variance increased slightly over time due to the instrument getting older, but this was not a notable change. However, the variance of the signal increased significantly as RH increased towards 100 (Fig. A2), and we therefore excluded data points where the RH was over 80.
The sparsity of the in situ radiation measurements makes it difficult to detect breakpoints, but visual inspection revealed no breakpoints in the data. However, missing data periods in the radiation data can possibly hide breakpoints, and changes due to the change in the measurement location cannot be conclusively dismissed. The condensation sink and meteorological data time series did not exhibit any visually noticeable breakpoints.
2.3 Size selection
Ions are traditionally split according to their size into small, intermediate, and large ions (Hirsikko et al., 2011). Cluster ions, also called small ions, are typically smaller than 2 nm, while intermediate ions are between 2 and 7 nm, and large ions are larger than that (Hirsikko et al., 2011; Hõrrak et al., 2000, 2003). We chose to use three size ranges in our analysis: one for the cluster ions (0.8–2 nm) and two for the intermediate ions (2–4 and 4–7 nm). We split the intermediate ions into two size ranges because earlier studies have shown that the 2–4 nm ion concentration is typically the most sensitive to NPF (Leino et al., 2016), while depending on growth rate, it can take several hours for the newly formed particles to reach 4 nm.
2.4 Trend analysis and multiple linear regression analysis
When investigating trends from atmospheric time series, it is important to account for autocorrelation which exists in most atmospheric variables. For time series that we could reasonably assume to be monotonic in trend, we used the 3PW algorithm described in Collaud Coen et al. (2020) to remove the autocorrelation before applying the Mann–Kendall (MK) test with seasonality correction (Hirsch et al., 1982) on the prewhitened time series. The 3PW method removes the autocorrelation typically present in atmospheric time series and then uses the MK test on the prewhitened data to determine the statistical significance of the trend. The trend-free prewhitening (TFPW) method data are used to test for significance due to their high test power. The yearly trend is then calculated using Sen's slope (Gilbert,1987) on the variance-corrected trend-free prewhitened data (VCTFPW) and presented as an annual change. The VCTFPW method produces an unbiased slope estimate, making it appropriate for this analysis (Wang et al., 2015).
We also calculated the dynamic regression for each time series, including those that could not be assumed to be monotonic, using a dynamic linear model (Laine, 2020). The model used assumes a trend and years as well as half-year seasonal variation and monthly medians, which were calculated from the data. The structural parameters of the model were calculated using Markov chain–Monte Carlo methods.
Finally, we tested the effect of various factors on the concentration of cluster and intermediate ions in the atmosphere using multiple linear regression from the MATLAB Statistics and Machine Learning toolbox.
3.1 Cluster and intermediate ion concentrations
In this section we present and analyze the time series of cluster and intermediate ion concentrations in the boreal forest.
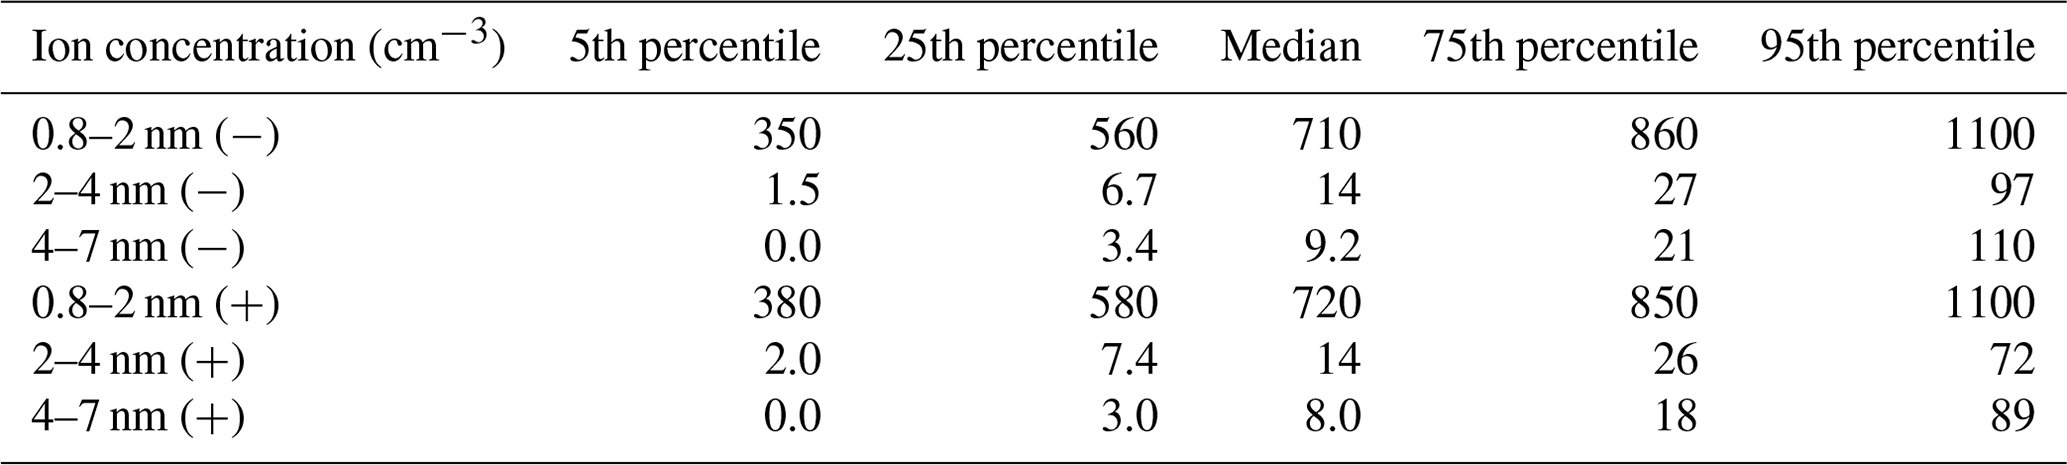
The median concentrations and variability of ions measured with BSMA are presented in Table 2 and as violin plots in Fig. 3. Negative and positive ion concentrations are very similar to one another, with the exception that the 4–7 nm negative ion concentrations are more spread out, with higher concentrations being more common (Fig. 3). This might suggest that more negative particles are created by ion-induced nucleation than positive particles or that the negative ions grow faster to the 4–7 nm size bin before being neutralized or lost.
Our measured concentrations agree well with concentrations reported by previous studies. Komppula et al. (2007) reported mean cluster ion concentrations in Hyytiälä to be typically around 840 cm−3 for positive ions and 770 cm−3 for negative ions when measured with the air ion spectrometer (AIS) (Mirme et al., 2007) and Hirsikko et al. (2005) reported the monthly mean values to be between 600 and 800 cm−3 for both polarities, measured with the BSMA. Leino et al. (2016) reported intermediate ion concentrations at Hyytiälä to be between 1 and 25 cm−3 for negative ions measured with a neutral cluster and air ion spectrometer (NAIS), and Manninen et al. (2009) reported median 1.8–3 nm ion concentrations measured with the same instrument to be between 1 and 10 cm−3, with the negative ion concentration being slightly higher. Hirsikko et al. (2005) reported the intermediate ion concentrations measured with the BSMA to be between 0 and 25 cm−3. The concentrations measured by the BSMA in this study are very similar when averaged over the whole time period of 2004–2021.

Figure 3Measured ion concentrations. Negative polarity is on the left in blue, and positive polarity is on the right in orange. The cluster ion (0.8–2 nm) concentrations are in (a), and intermediate ion concentrations are in (b) and (c), 2–4 and 4–7 nm, respectively. The white dot is the median concentration, and the whiskers mark the location of the 95th and 5th percentile data points.
Table 2Descriptive statistics of the ion measurements dataset between 2005 and 2021.
3.2 Trend analysis
3.2.1 Long-term trends
The long-term ion concentration trends are shown in Fig. 4 and Table 3. We observe a slight positive trend of 1 % annual change for the cluster ion concentration in both polarities, corresponding to a median increase of 7.1 cm−3 yr−1. The trends are very similar in both polarities and within the confidence limits for each other. For the intermediate ions, the BSMA time series exhibits a positive trend of around 3.5 %–3.9 % yr−1 for 2–4 nm ions in both polarities (median increase of 0.55 cm−3 yr−1) and a positive trend of around 1.7 %–1.9 % yr−1 for 4–7 nm ions in both polarities (median increase of 0.17 cm−3 yr−1).
Table 3The relative change in ion concentration for BSMA for 2004–2020. The relative changes per year have been calculated from Sen's slopes. The values in brackets are the confidence intervals for the trend at a 90 % level.
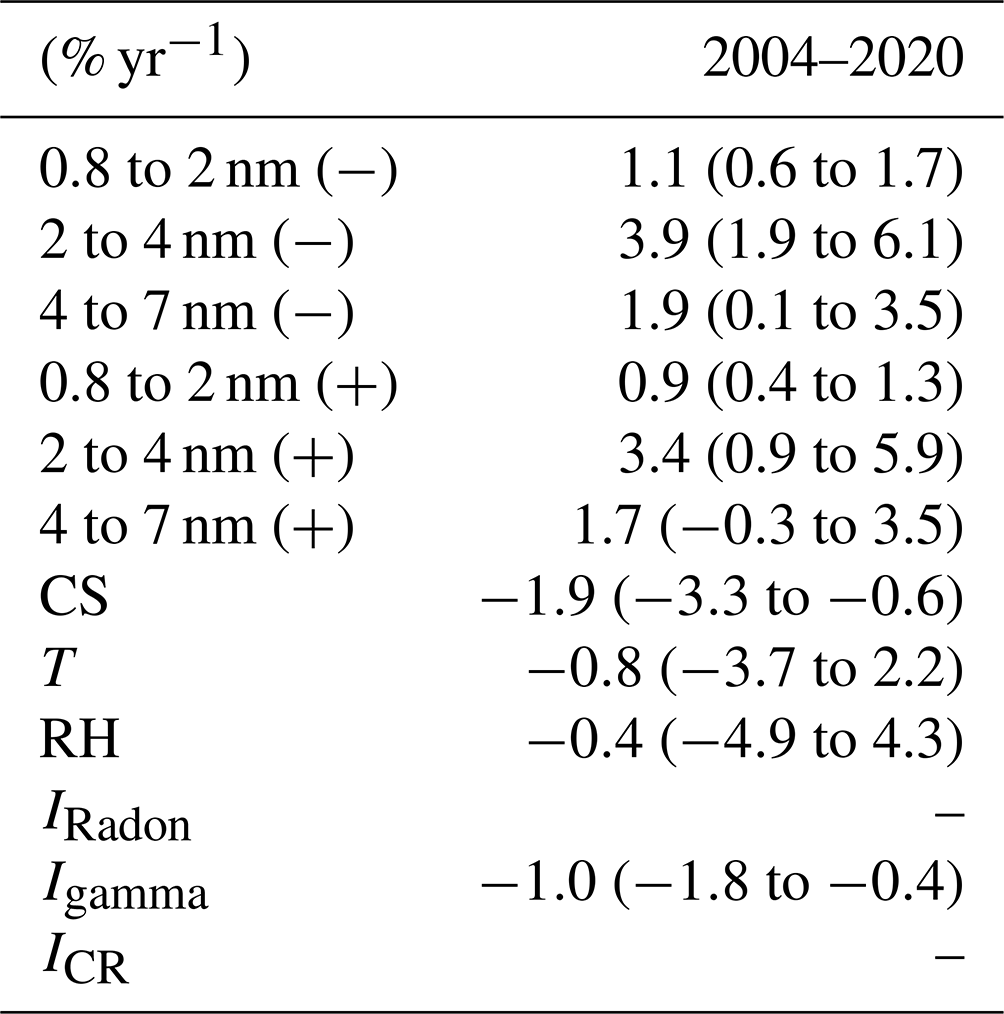
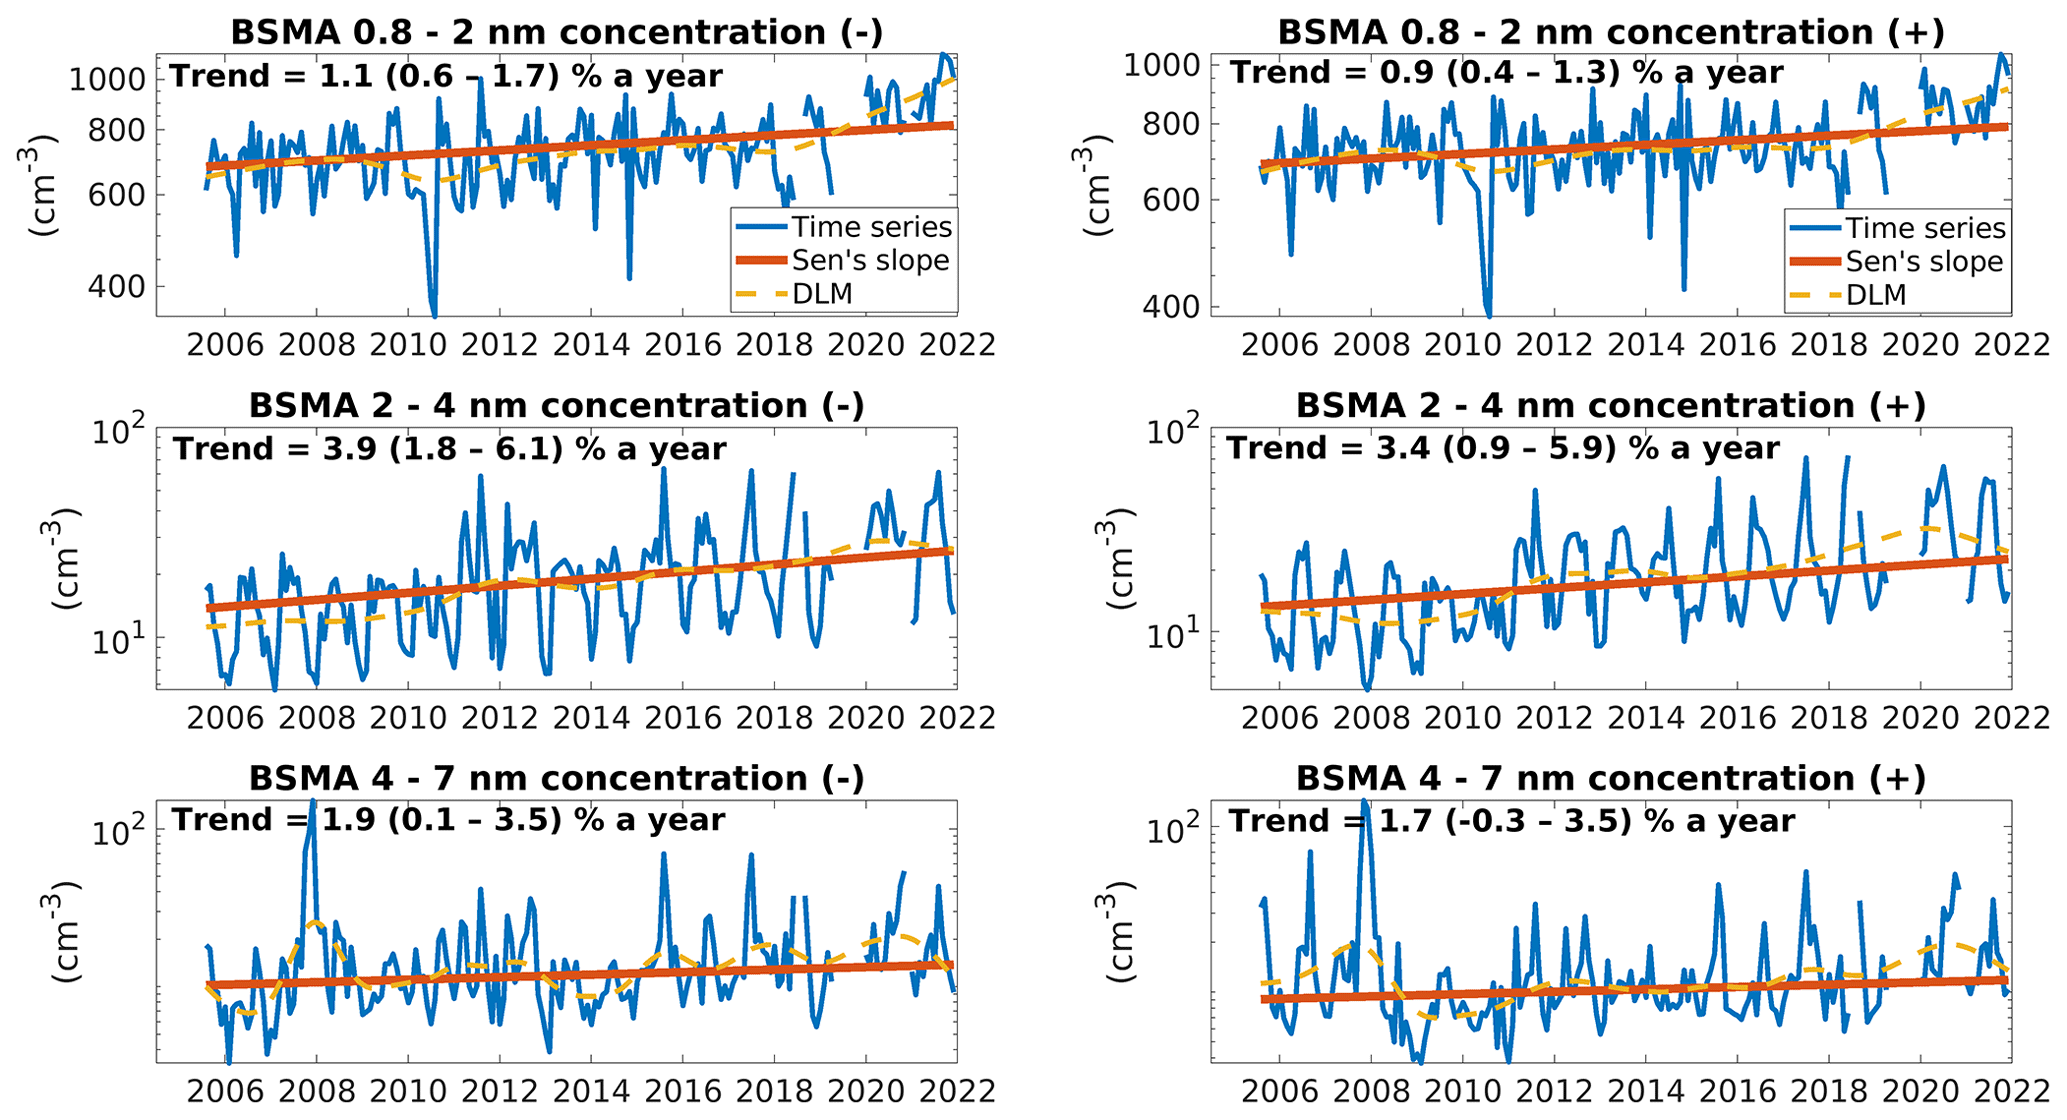
Figure 4The time series of the cluster and intermediate ion concentrations. The relative changes per year have been calculated from Sen's slopes. The values in brackets are the confidence intervals for the trend at a 90 % level.
Out of the three main ionization sources (radon, gamma, and cosmic ray ionization), radon and gamma ionization rates exhibit generally decreasing trends before 2015 (Fig. 5, Table 3), which would suggest that cluster ion concentrations should be decreasing during this period. However, our observations do not follow this. The main sink for cluster and intermediate ions, the sink from larger aerosol particles, which is described here by the CS (see Sect. 2.1.3.), also exhibits a decreasing trend. Therefore, the competing influence of the decreasing trends will be further analyzed in Sect. 3.2.3. to identify the most important factor to the ion concentrations in the boreal forest. Unfortunately, there is a large fraction of missing ionization rate data in the later part of the analyzed time period. Radon and cosmic ray ionization rates exhibit multi-year sinusoidal behavior, and we do not list a trend for them here. This is expected for the cosmic ray ionization rate, but the reason for the changes in radon ionization rate is unclear. Temperature and relative humidity both exhibit no significant trends (Fig. 5).
3.2.2 Seasonal cycle
We investigated the annual variability in the ion concentrations by calculating the median seasonal cycle of the ions in both polarities (Fig. 6) and ion sources and sinks as well as T and RH (Fig. 7). Cluster ions (0.8–2 nm) in both polarities have an annual maximum in the late autumn in October and a local maximum in spring in May. Chen et al. (2016) and Hirsikko et al. (2005) observed similar maxima for cluster ions in a boreal forest. The 2–4 nm intermediate ion concentration has an annual maximum in spring in May in both polarities, which coincides with the known annual maximum for NPF event frequency (Nieminen et al., 2014). The negative 2–4 nm ion concentration has a second, smaller maximum in September, coinciding with the second annual maximum in NPF event frequency (Nieminen et al., 2014). This is in good agreement with the result that 2–4 nm ions in particular are good indicators for NPF events (Leino et al., 2016). The fall maximum is not clearly observed in the positive 2–4 nm ion concentration. This may suggest that there is different chemistry involved in autumn NPF than in spring, but further analysis of this is outside the scope of the paper. The 4–7 nm ion concentration in both polarities has an annual maximum in March and a second local maximum in September, which matches the maxima observed by Leino et al. (2016) for 2–7 nm ions.
CS has an annual maximum in the summer (Fig. 7a), which has been suggested to suppress NPF during the summer (Buenrostro Mazon et al., 2016; Nieminen et al., 2014). The annual minimum is in December, with a local minimum in March. This roughly follows the seasonal behavior of CS reported previously (Lyubovtseva et al. (2005); Vana et al., 2016). Temperature has a maximum in the summer (Fig. 7b) as expected, while RH has a minimum in the summer (Fig. 7c; Lyubovtseva et al., 2005; Hirsikko et al., 2005). The radon ionization rate has an annual maximum in February and a second local maximum in September (Fig. 7d). This has been connected to changes in the mixing layer depth in Chen et al. (2016). The gamma ionization on the other hand has a local minimum in February and March (Fig. 7e), which coincides with the typical maximum snow depth at the station, which suppresses gamma radiation from the soil (Chen et al., 2016). Finally, the cosmic radiation ionization rate remains practically constant (Fig. 7f), as its changes are known to occur in an 11-year period, and a median annual value should appear fairly constant.

Figure 5The time series of main sources and sinks as well as temperature and relative humidity. The relative changes per year have been calculated from Sen's slopes. The values in brackets are the confidence intervals for the trend at a 90 % level.
3.2.3 Multiple linear regression
We investigated the reasons behind the variations in ion concentrations by fitting a simple multivariate linear regression model. Our assumption was that cluster and intermediate ion concentration variation is caused by the interplay of their sources and sinks. Additionally, concentrations can be modulated by the prevailing meteorological conditions, which are connected to atmospheric air composition and ion processes. The degrees of freedom in the model were adjusted to reflect the number of explanatory variables included. The explanatory variables used are listed in Table 1.
We defined our linear model as
where ω, β, γ, δ, θ, and μ are model coefficients, and ε is the error estimate.
The Belsley collinearity test revealed that ICR exhibited multicollinearity with RH. We therefore eliminated ICR from the model and redefined it as

Figure 6The annual variance of ion concentrations in the size bins 0.8–2, 2–4, and 4–7 nm. The left-hand-side box plots are in the negative polarity, and the right-hand-side box plots are in the positive polarity. The numbers on the x axis are month numbers (January–December). The red line is the median concentration, and the blue box contains 50 % (25th to 75th percentile) of all data points. The whiskers mark the location of the 95th and 5th percentile data points. The red crosses are outliers.
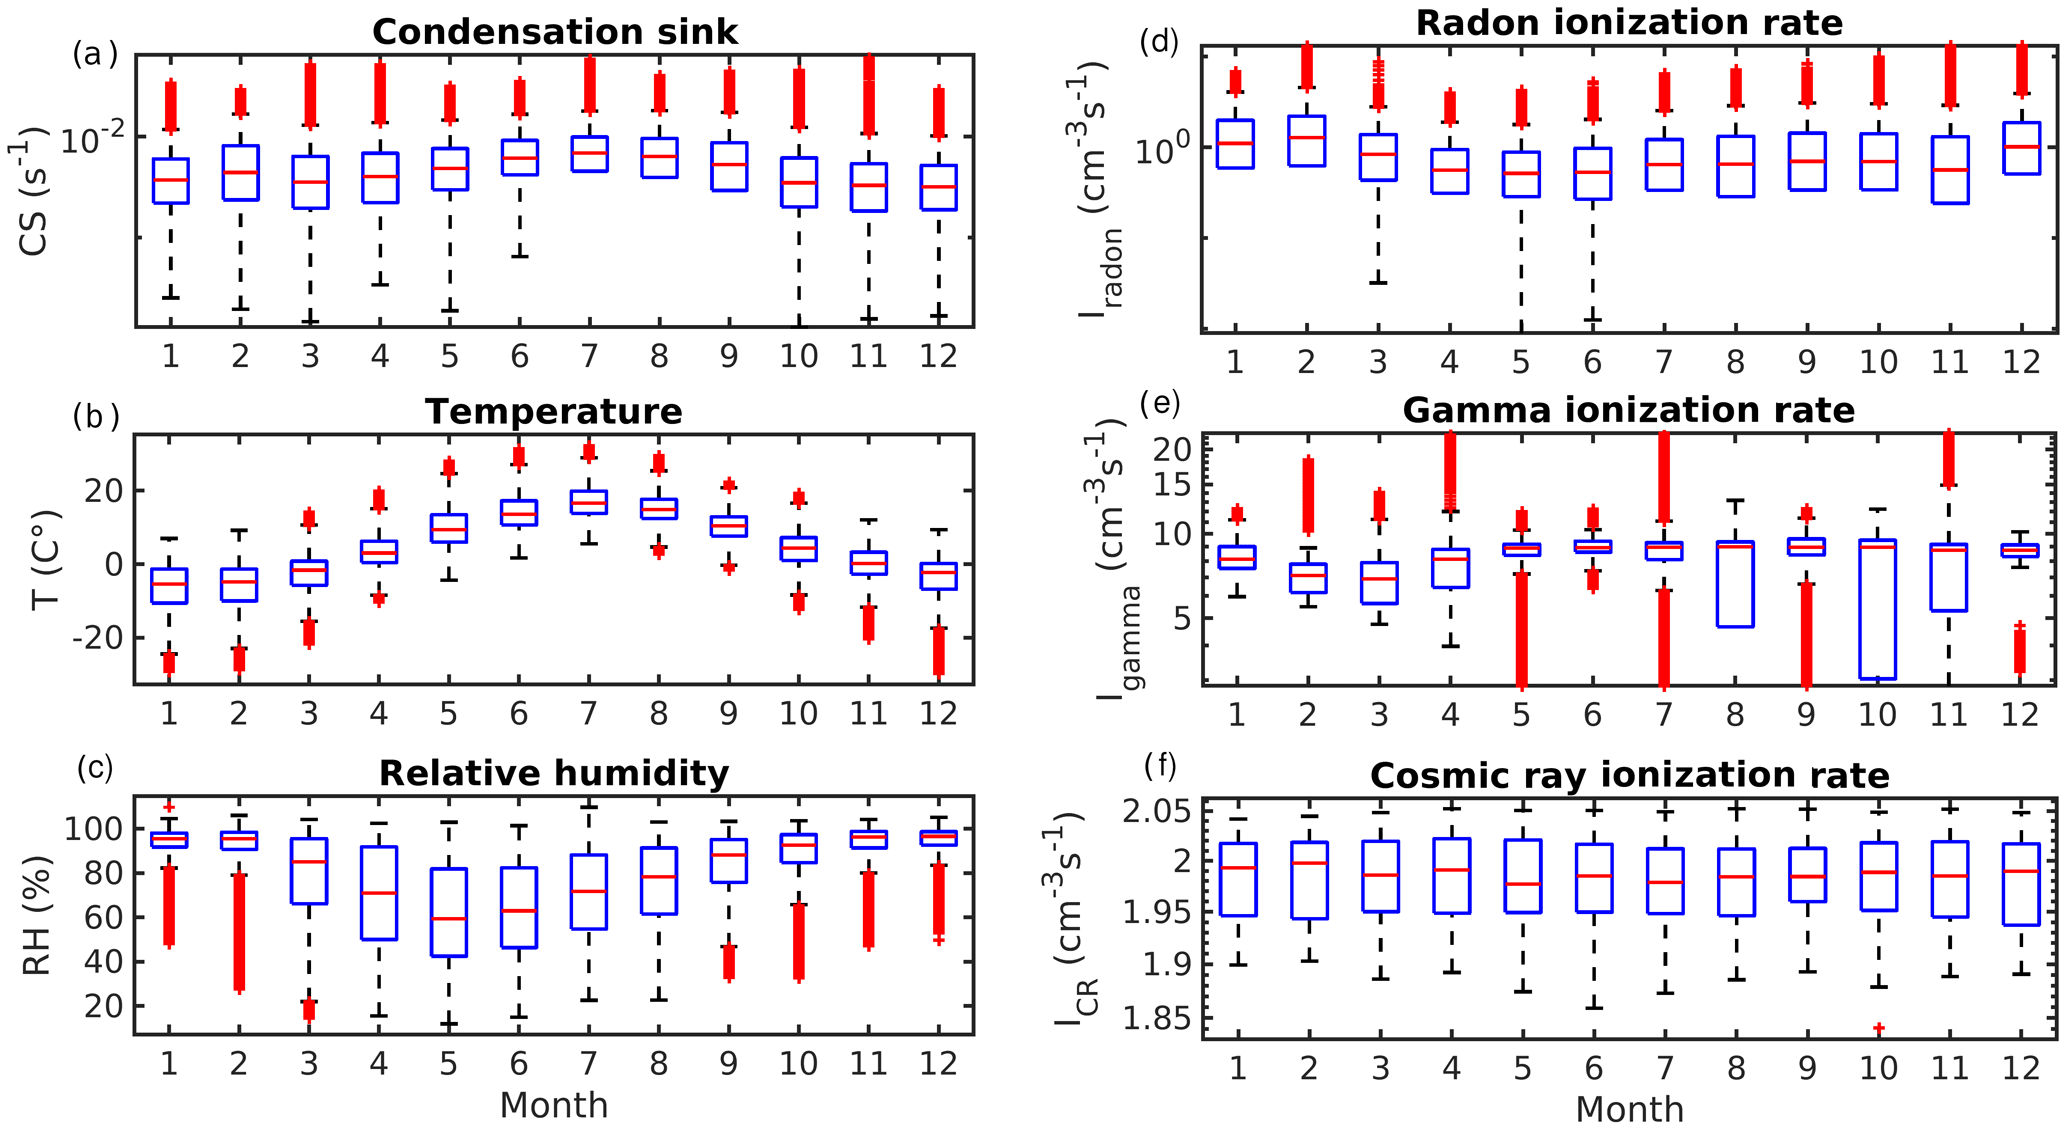
Figure 7The annual variation of CS, T, RH, IR, Ig, and ICR. The red line is the median concentration, and the blue box contains 50 % (25th to 75th percentile) of all data points. The whiskers mark the location of the 95th and 5th percentile data points. The numbers on the x axis are month numbers. The red crosses are outliers.
The model assumes that the inputs are normally distributed and independent and that the variance of the factors is roughly proportional. To account for this, each factor was normalized by using the formula
where xnorm is the normalized data, x is the original data, min(x) is the minimum value of the data, and max(x) is the maximum value of the data. The normalized data were then input into the model. The residuals of the models were normally distributed, and we concluded that the model is usable for our analysis. The coefficients of the models are listed in Table A1 in the Appendix.
The percentage of variability explained by each explanatory variable is presented in Fig. 8. Our model explains between 34 % and 52 % of the variance in the ion concentrations. About 25 % of the cluster ion concentration variability is explained by changes in CS, which corroborates the assumption in the previous chapter that the decrease in CS could be the main reason for the observed negative trend in ion concentrations. The second most important factor was temperature. Intermediate ion concentrations, both 2–4 and 4–7 nm, are best explained by a combination of sources and meteorological variability. However, the combination is different for negative and positive ions. The chemical composition of the negative and positive ions is known to be different (Luts et al., 2011; Ehn et al., 2011), and it is possible that humidity as well as chemical differences in condensable vapors can cause differences in the dynamics of the negative and positive ions. It is clear that we are not capturing all of the long-term variance with the model.

Figure 8The amount of variation explained by our chosen explanatory variables for each size range and polarity for BSMA. The symbol (−) denotes negative polarity, (+) a positive polarity, and (±) the sum of both polarities. The bolded red values are statistically significant (p<0.05).
However, because of strong seasonal effects in ion processes, the variation of ion concentrations could be dominated by different factors in different seasons. For this reason, we also investigated how these factors explained the variation in ion concentrations in different seasons. In Figs. A3–A6 (See Appendix) we show the amount of variability explained by our selected variables when isolating the different seasons.
The different seasons each have some characteristics that are not directly visible in the variation of the entire time series. In spring, the variation in cluster ion concentrations is most strongly explained by CS, about 25%. Radon ionization rate explains a further 15 %–18 % of the variance in spring. For summer, radon ionization rate explains about 40% of the variation, while other factors in our model fail to explain much of the variation. In autumn, RH explains 13 %–40 % of the variation in cluster ion concentrations, while ion sources and sinks contribute less to the variation. Radon ionization rate, however, does contribute roughly 34 % to the negative cluster ion concentration variance. Our chosen variables fail to explain the changes in cluster ion concentrations in winter well. Gamma and radon ionization rates explain about 20 %–30 % of the variation cluster ion concentrations in winter. The fraction of variance explained in autumn and winter suggests that our chosen variables are not ideally suited to explaining the variance in those seasons. Other factors such as the abundance of relevant chemical vapors to grow the ions into the size ranges considered here may be more important during these seasons.
The intermediate ion variation in spring is in general explained best by the radon ionization rate and RH. Temperature has the least effect in spring and summer. Summer and autumn intermediate ion concentration variation is explained by meteorology. RH explains 7 %–47 % of the variance in intermediate ion concentration in the summer, while in the autumn RH explains 62 %–68 % of the variation, but we fail to capture a large portion of the variation. In winter, the variation in intermediate ion concentration is explained by a combination of radon and gamma ionization rates and temperature, likely linked to varying snow depth and its suppressive effect on the ionization rates (Chen et al., 2016). However, the wintertime values are not statistically significant.
We also analyzed the seasonal variation using median concentrations calculated for each month. By calculating the median monthly concentrations of our data, we have a median yearly cycle for each factor from which we can investigate how much of the seasonal variation in ion concentration is explained by our model (Fig. 9). The variance in cluster ion concentration in the negative polarity is explained by a combination of CS (35 %) and temperature (36 %). Meanwhile, in the positive polarity the variation is best explained by CS (28 %) and Ig (14 %), but the values are not statistically significant. The variance in intermediate ion concentrations is explained in both polarities by a combination of Ig and the meteorological variables T and RH. The 2–4 nm intermediate ion concentrations are particularly dependent on the variance in RH. This can be explained by the tendency of NPF events to occur during clear-sky and thus low-RH days (Dada et al., 2017). The dependency is clearer in the seasonal variation because the seasonal RH variation is larger than its interannual variation.
All in all, the effect of ionization rates on the trends and the variability of ion concentrations were surprisingly low. It could be that although the ionization rates control the production of primary ions, the measured concentrations, even in the smallest size bin studied here, depend largely on the factors affecting ion dynamics and growth to large enough sizes to be detected by our instruments, which in turn depend on multiple other factors such as air composition (Chen et al., 2016).
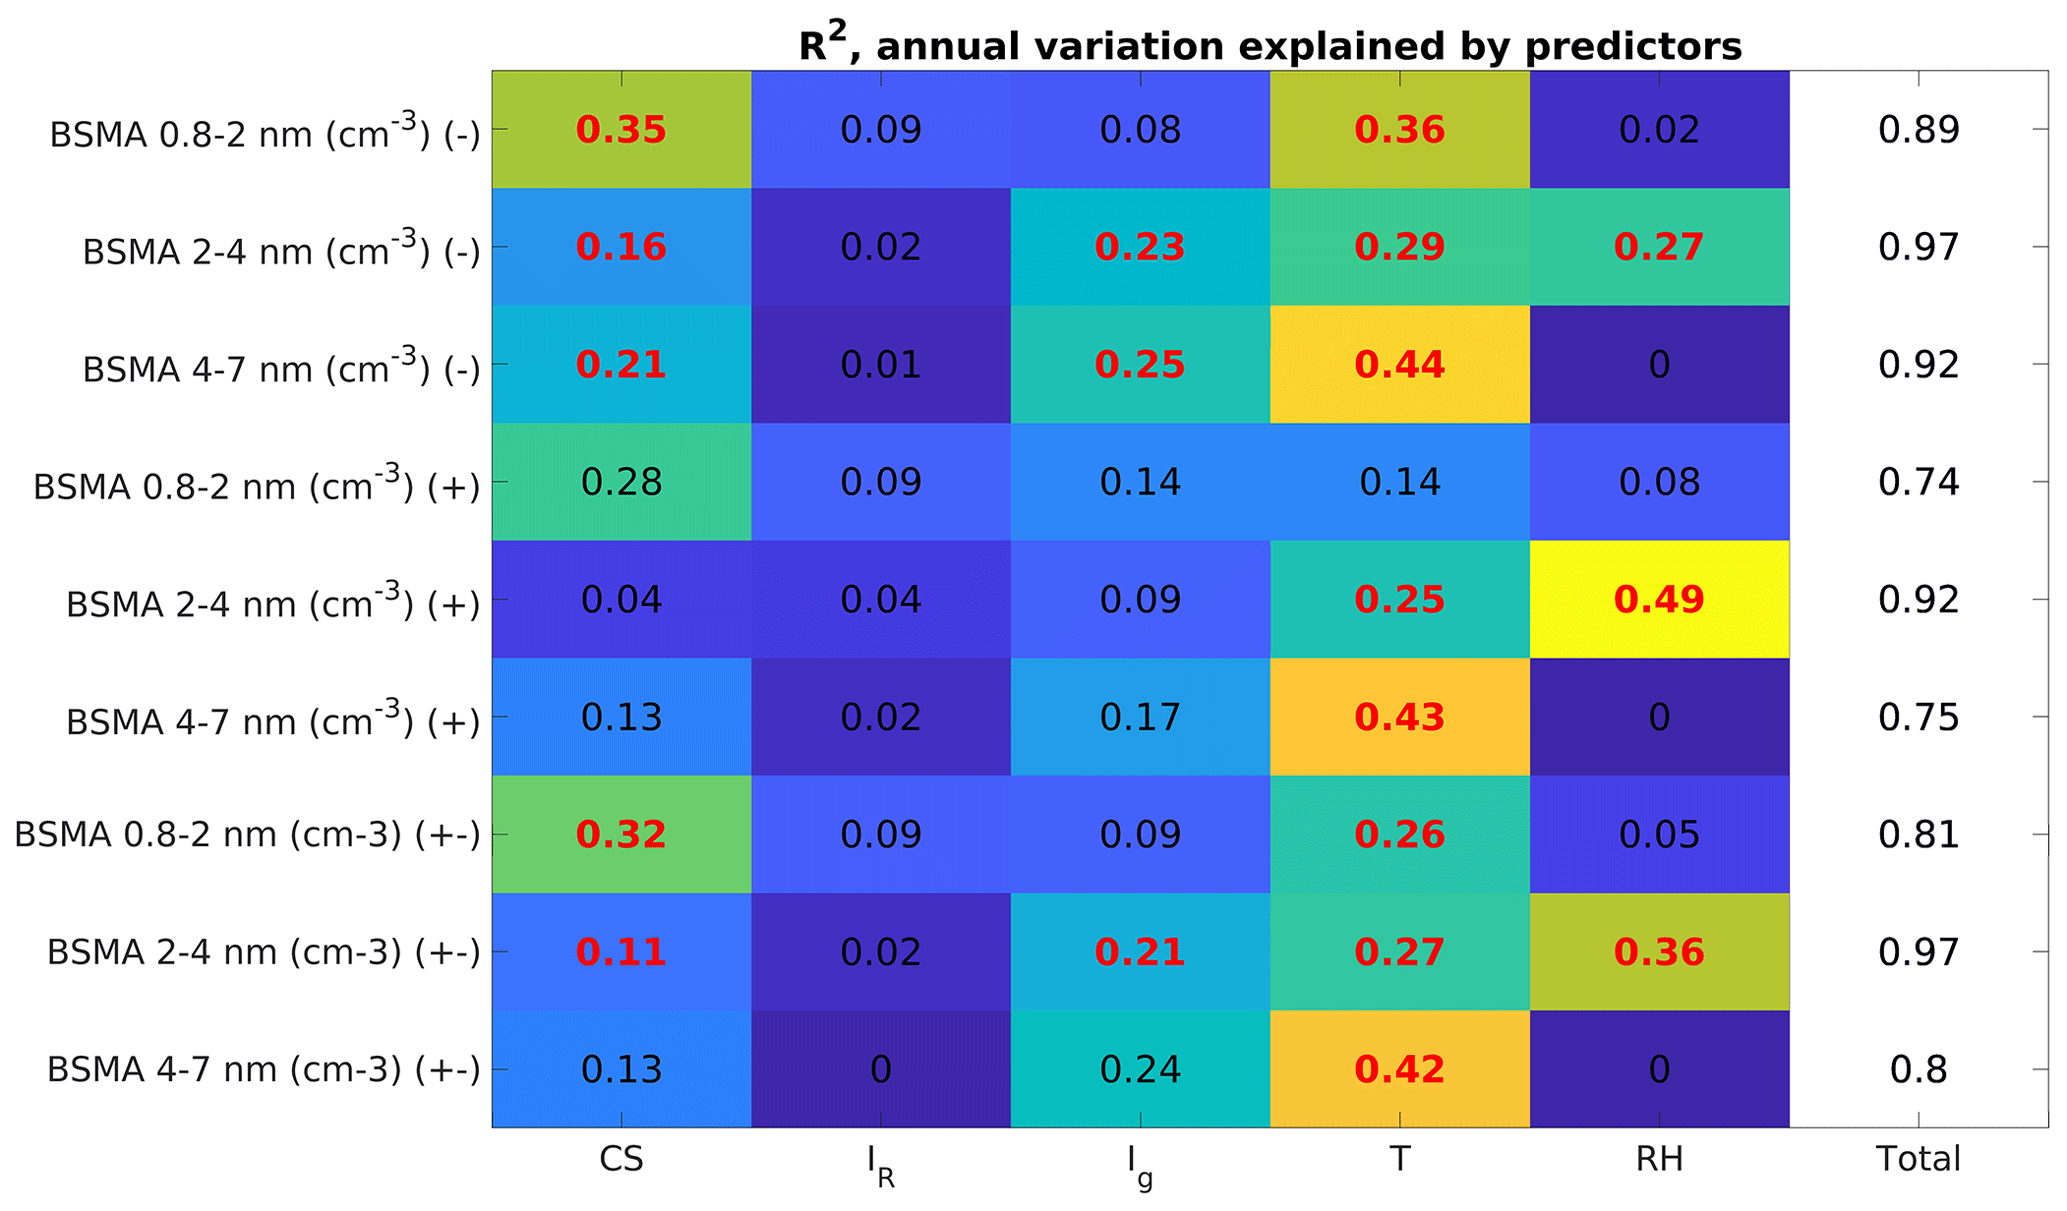
Figure 9The amount of seasonal variation explained by our chosen explanatory variables for each size range and polarity. The symbol (−) denotes negative polarity, (+) a positive polarity, and (±) the sum of both polarities. The bolded red values are statistically significant (p<0.05).
In this work we have presented a 16-year-long time series of ion concentrations at SMEAR II station in southern Finland. Using this unique dataset, we investigated long-term trends of cluster and intermediate ion concentrations in the atmosphere at a boreal forest. A connection between the steadily increasing ambient cluster ion concentrations and decreasing CoagS, estimated in this analysis with CS, appears clear. The decreasing CoagS is likely due to an overall decreasing level of anthropogenic aerosols in boreal forest (Luoma et al., 2019), but possible changes in the air mass origins cannot be easily dismissed and were not investigated here. Although some trends were evident in the ambient ionization sources as well, they did not explain the overall trend of the ambient cluster ion concentrations.
The reasons for the rise of ambient intermediate ion concentration are more complex. This is to be expected, as the dynamics of 2–7 nm aerosols are much more complicated, not only dependent on formation and loss, but also ion–ion recombination, ion–aerosol attachment, and ion growth (Kulmala et al., 2013). And because growth is dependent on many factors, such as the availability of condensable vapors and favorable meteorological conditions, the dependencies will not be as simple (Kerminen et al., 2018). The connection to meteorological conditions is evident in our analysis as well, whereas the season-specific analysis of variation suggests that while our chosen variables appear to be the limiting factors during the summer and spring months, other factors may be more important to the intermediate ion concentration in autumn and especially winter. These factors include boundary layer dynamics and the abundance of condensable vapors (Hao et al., 2018, 2021; Kirkby et al., 2011; Almeida et al., 2013; Vakkari et al., 2015).
Our analysis has several sources of uncertainty worth noting. As mentioned previously, because the BSMA data with RH above 80 % were excluded, our analysis does not include any possible dynamics related to precipitation, which also is known to produce intermediate ions. Therefore, NPF events are likely overrepresented in the data. Additionally, we are missing 3 years of radon ionization rate data and 5 years of gamma ionization data. This makes comparing trends over the entire time period difficult and introduces uncertainty in our interpretation of the results. Also, for detailed studies on the ion balance and transfer of charge from primary ions to cluster ions, the measurements of primary ion size distribution below 0.8 nm would be needed (Chen et al., 2016). Increase in ion concentrations can mostly be attributed to a decreasing CS. The changes in the ionization rates explain the observed trend to a lesser degree. It is possible that this is simply because the ion sink is the dominant limiting factor to the formation of cluster and intermediate ions. However, several open questions remain. Although studies indicate that the neutral pathway dominates NPF in the boreal forest, the role of ions is not totally clear (Wagner et al., 2017). Ion-induced nucleation can be significant in certain conditions, e.g., when the sulfuric acid concentration is low (Rose et al., 2018; Yan et al., 2018; Gagné et al., 2010). Additionally, ion–ion recombination can create neutral aerosols. It is possible that ions are especially important in the initial stages of NPF, which is difficult to measure with current instrumentation. It will have to be determined in the future whether the number of aerosols produced by ion–ion recombination (Kontkanen et al., 2013; Franchin et al., 2015) is affected by the changes in ion concentrations. It can be speculated that the increasing ion concentrations, decreasing concentrations of sulfuric acid in boreal forest (Nieminen et al., 2014), and increasing temperatures will make the ion-induced or ion-mediated NPF pathways more important in future. A more comprehensive analysis of this is needed.

Figure A1Moving variance of the concentration time series of the BSMA size channels. The symbol n indicates the number of closest data points used for the calculation of the variance at each point. The time resolution is the time resolution of the instrument, which is 12 min.
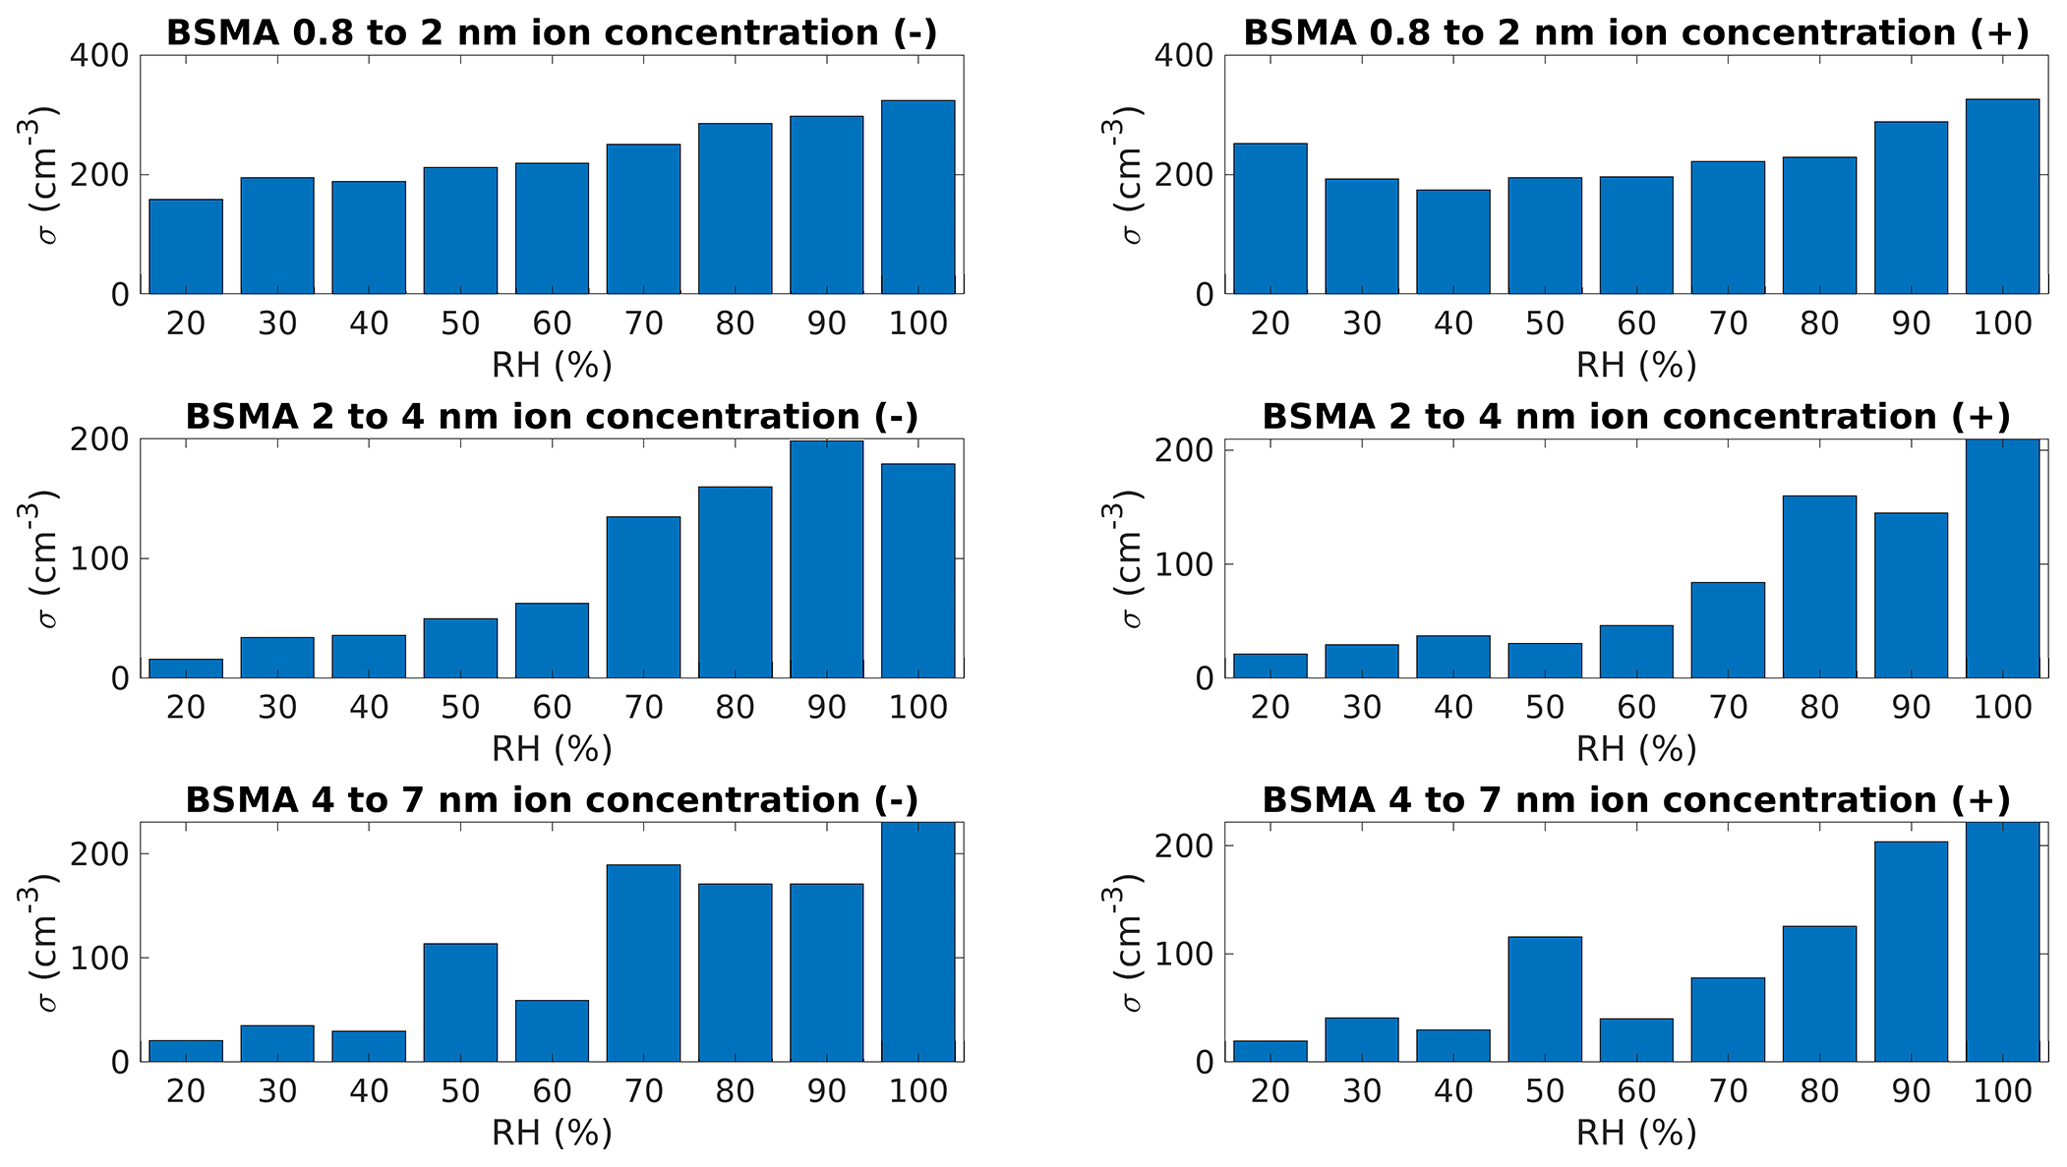
Figure A2The standard deviation of ion concentrations measured by BSMA in different RH conditions.
Table A1The coefficients of the multiple linear regression model used in the study.
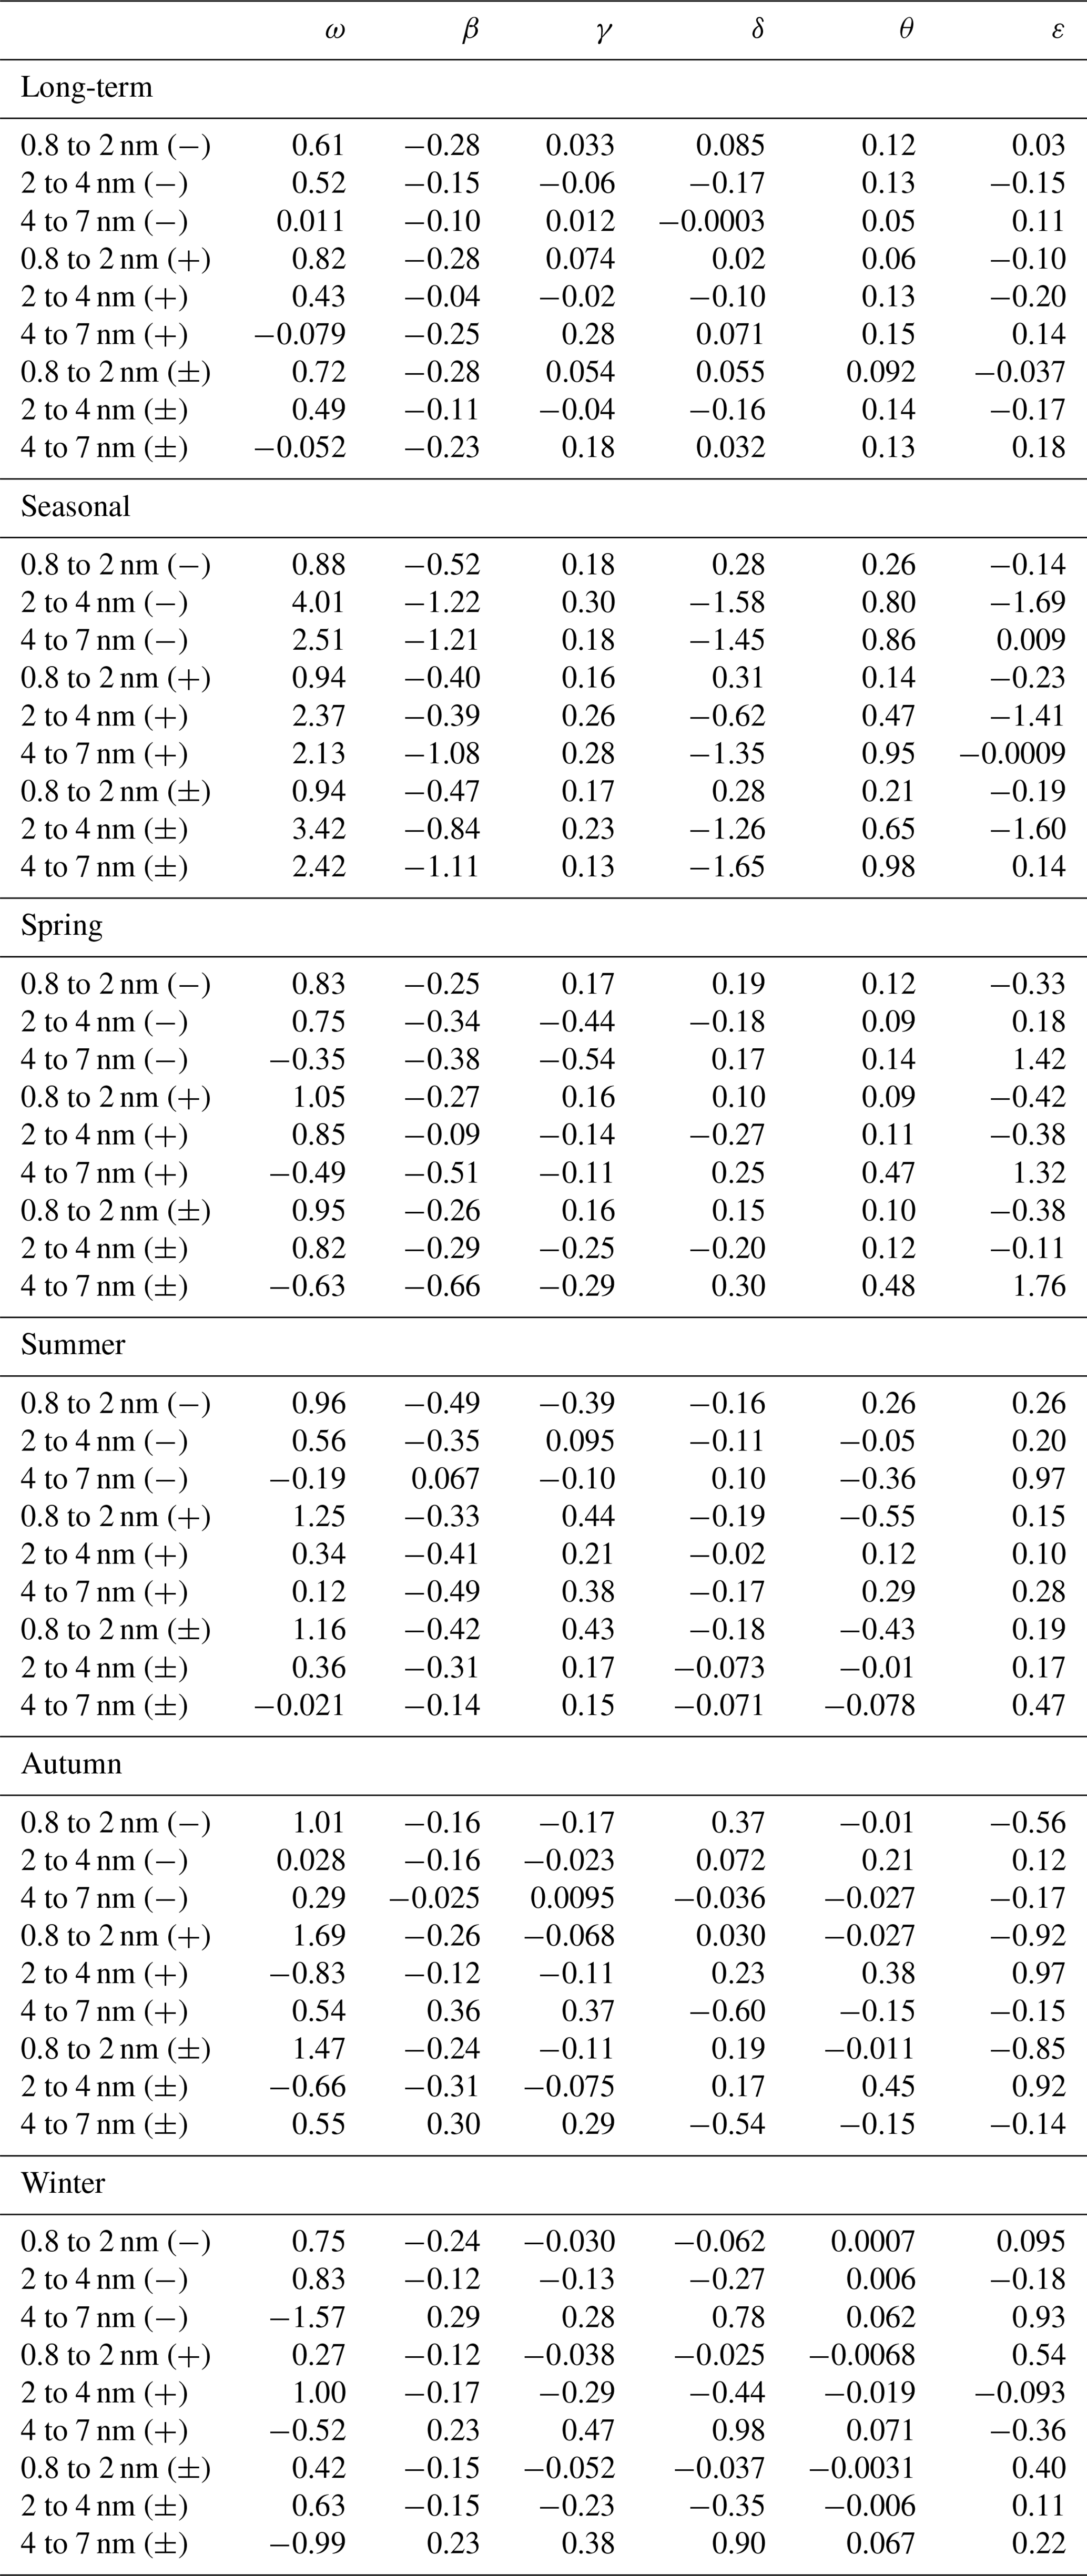
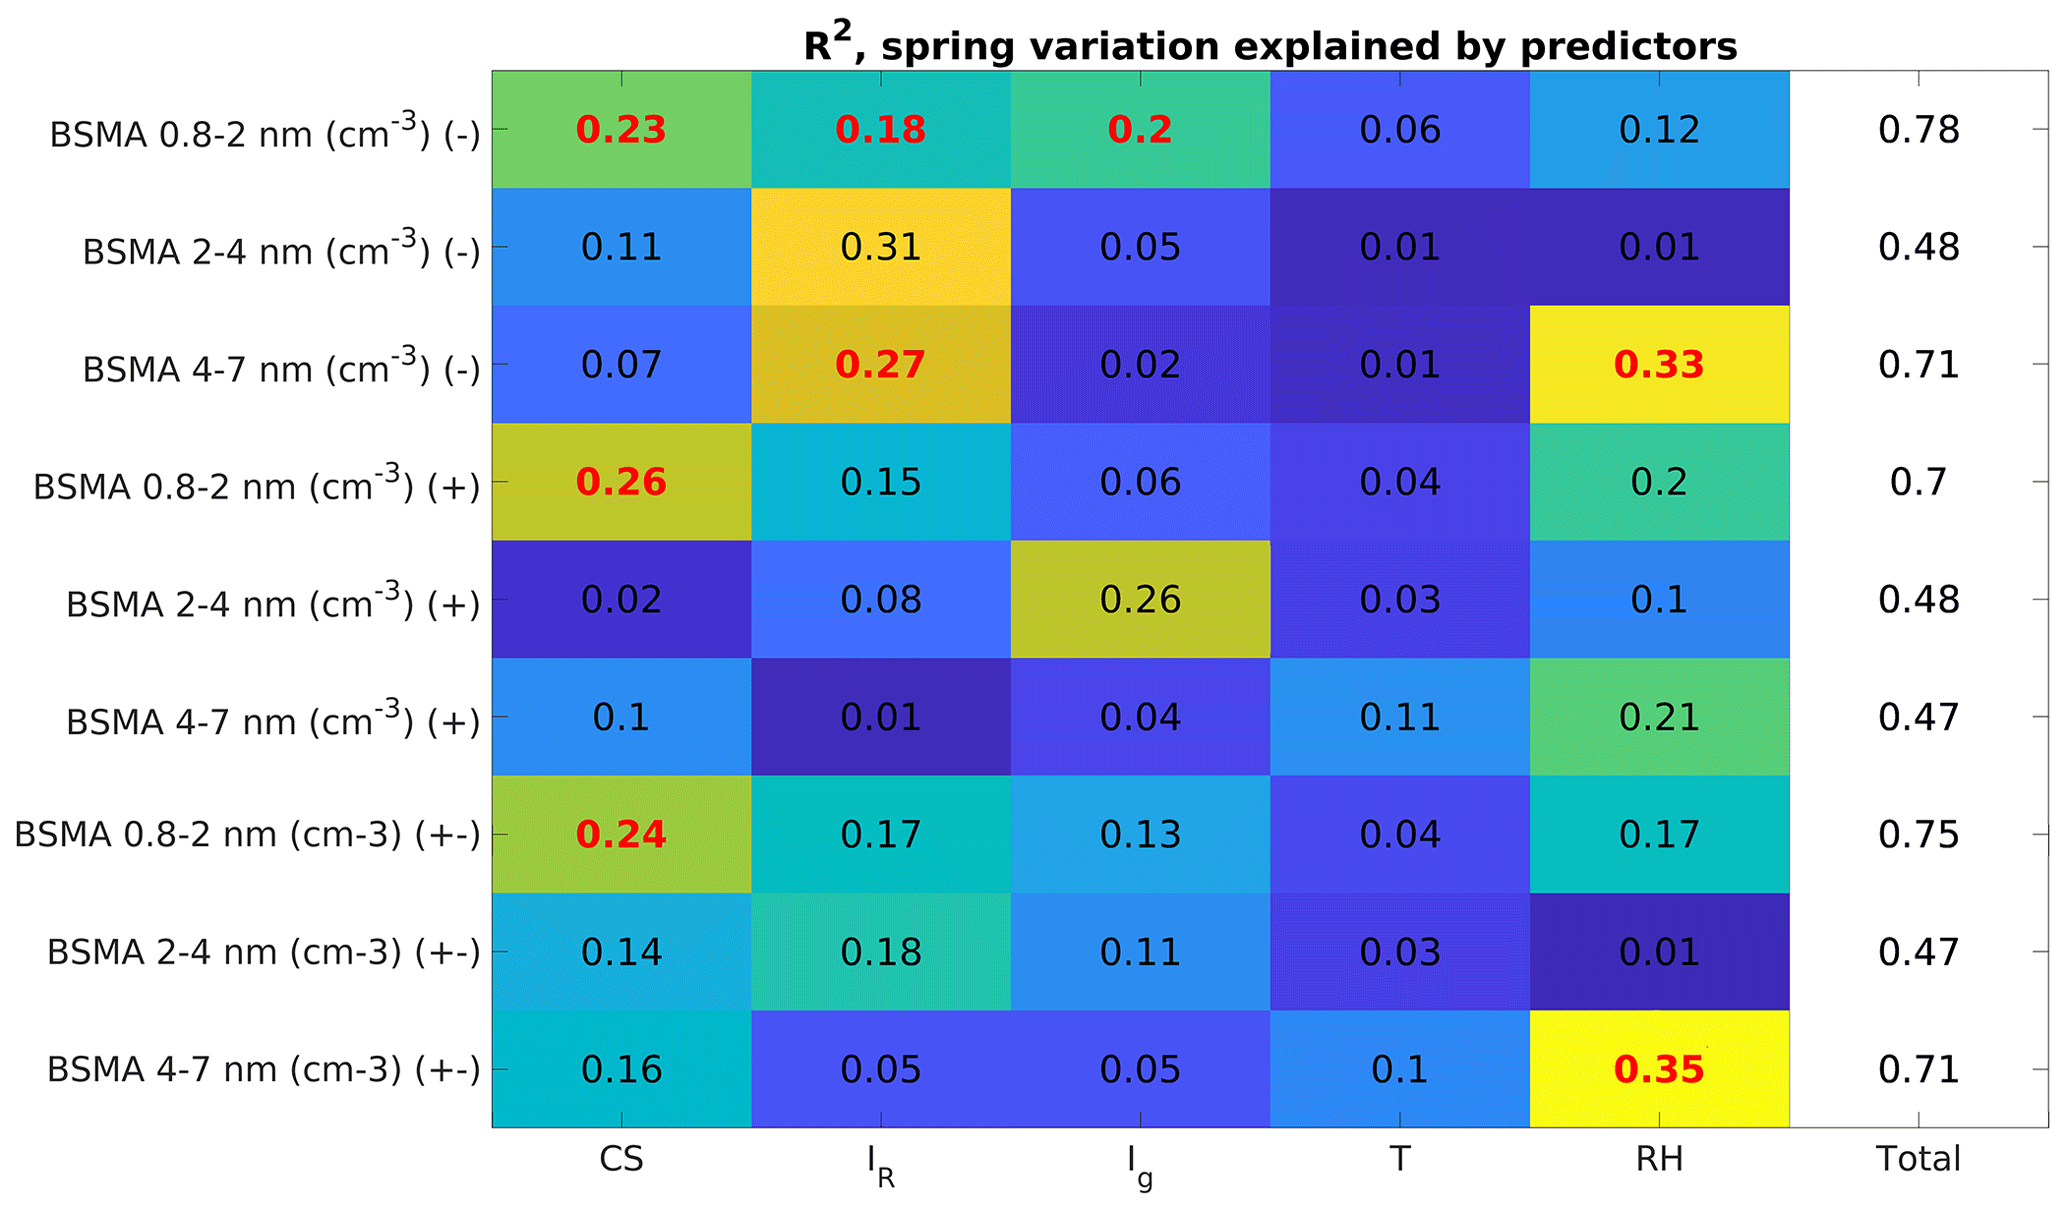
Figure A3The amount of variation explained by our chosen explanatory variables for each size range and polarity. The data points selected are only between March and May and represent changes in springtime concentrations. The symbol (−) denotes negative polarity, (+) a positive polarity, and (±) the sum of both polarities. The bolded red values are statistically significant (p<0.05).
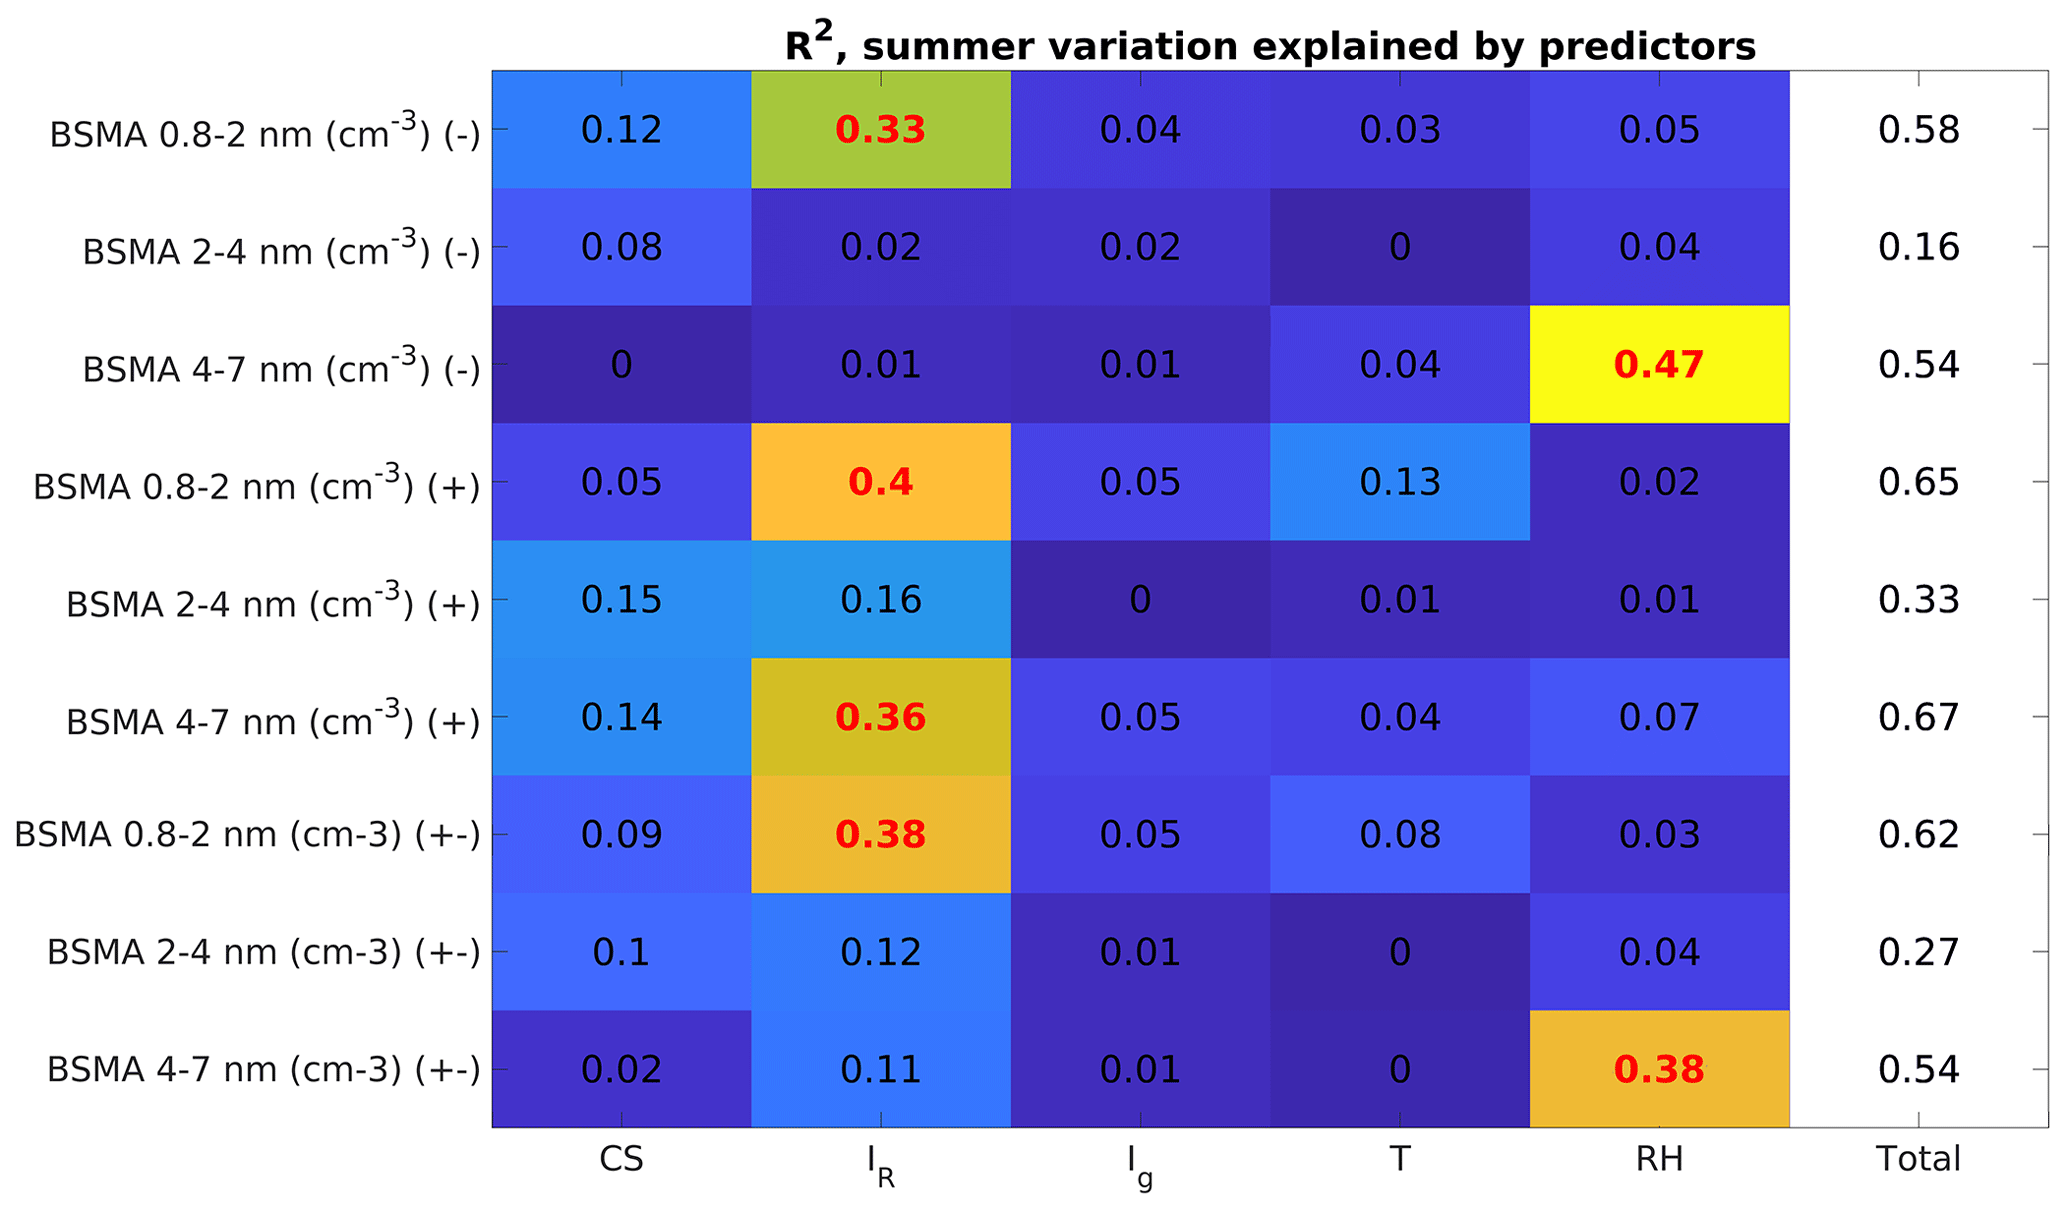
Figure A4The amount of variation explained by our chosen explanatory variables for each size range and polarity. The data points selected are only between June and August and represent changes in summertime concentrations. The symbol (−) denotes negative polarity, (+) a positive polarity, and (±) the sum of both polarities. The bolded red values are statistically significant (p<0.05).
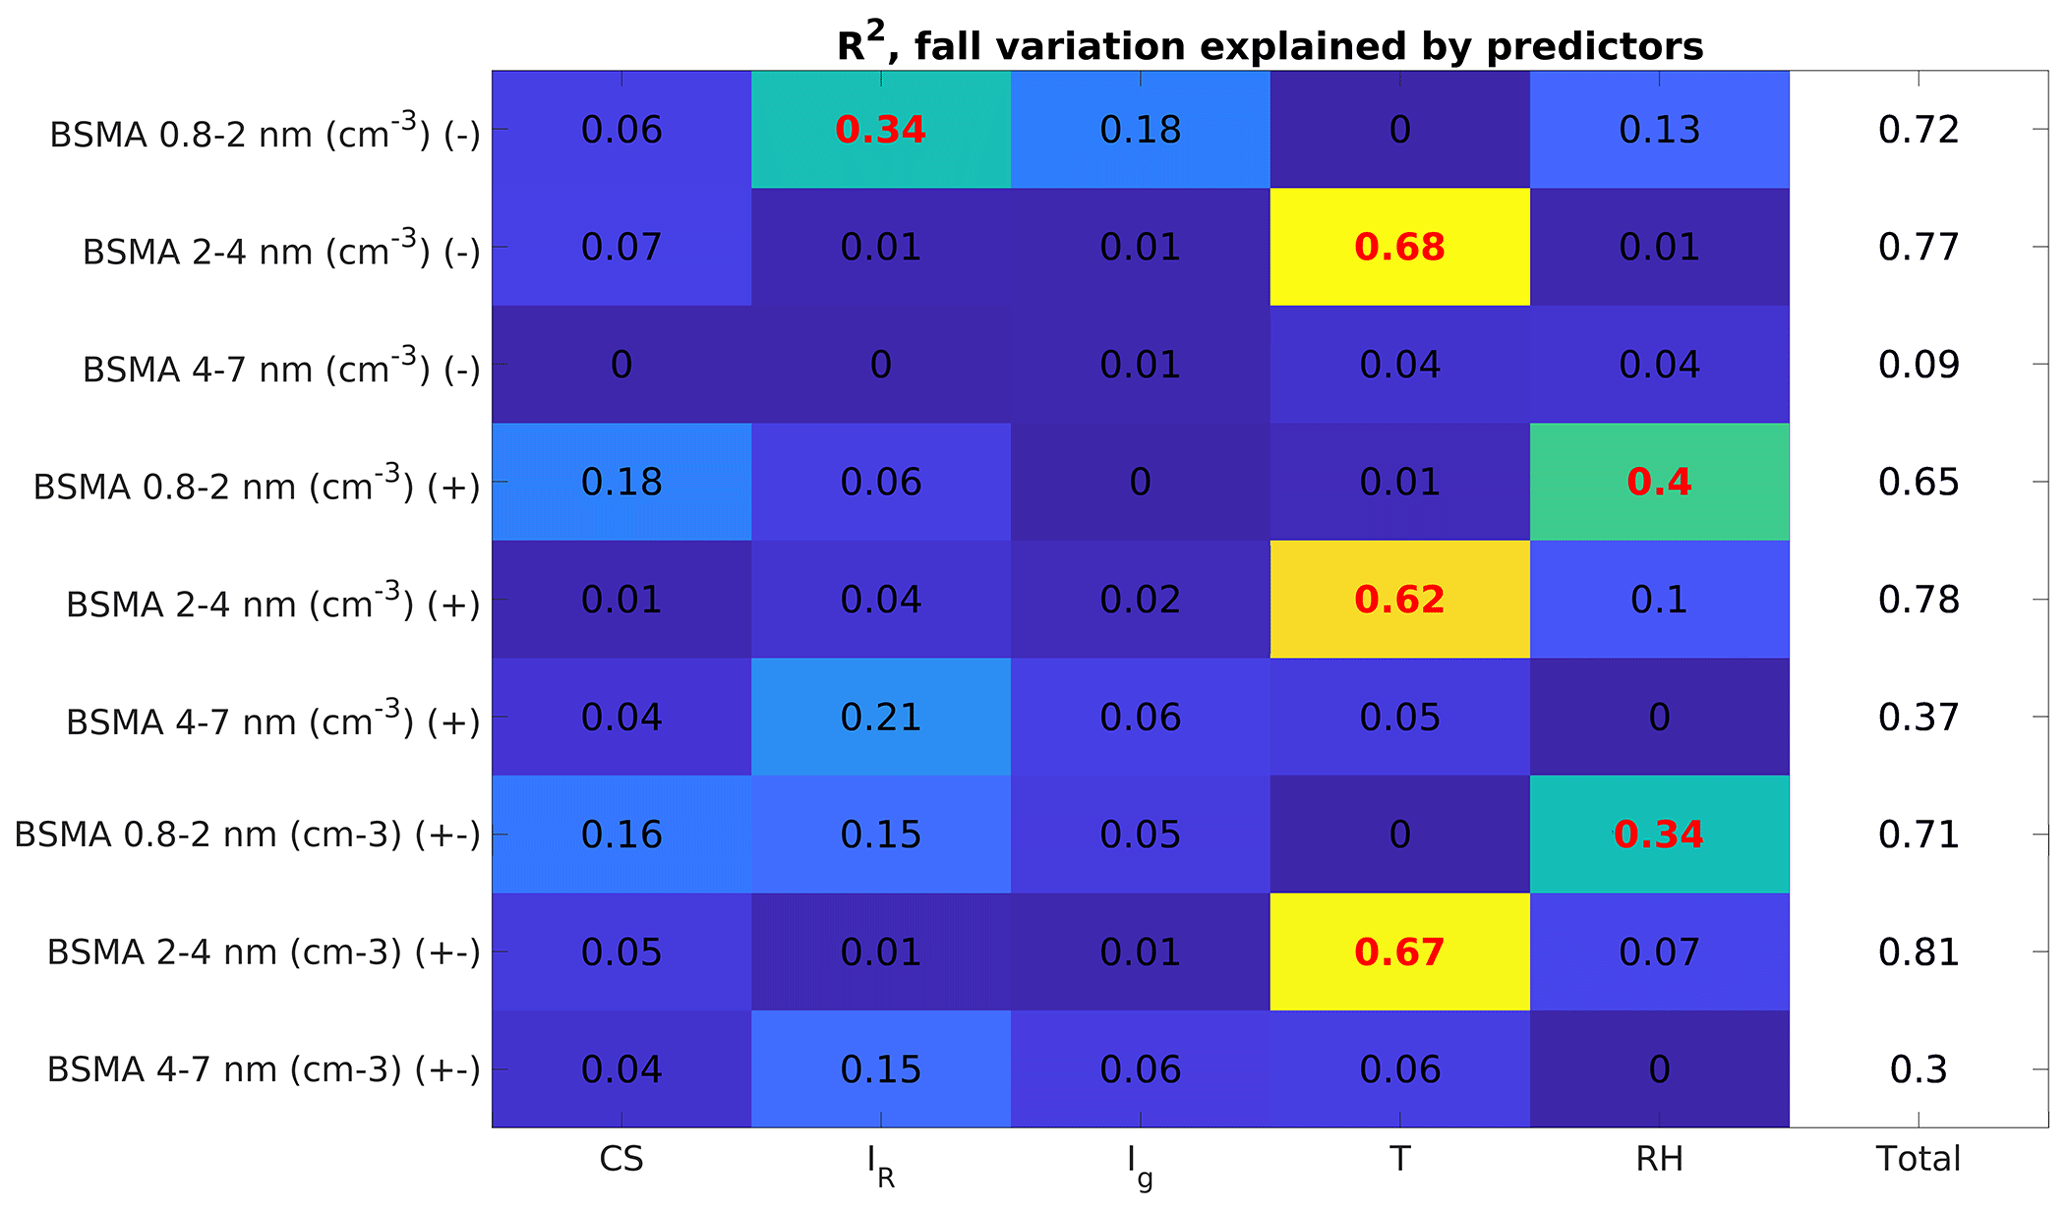
Figure A5The amount of variation explained by our chosen explanatory variables for each size range and polarity. The data points selected are only between September and November and represent changes in autumn concentrations. The symbol (−) denotes negative polarity, (+) a positive polarity, and (±) the sum of both polarities. The bolded red values are statistically significant (p<0.05).
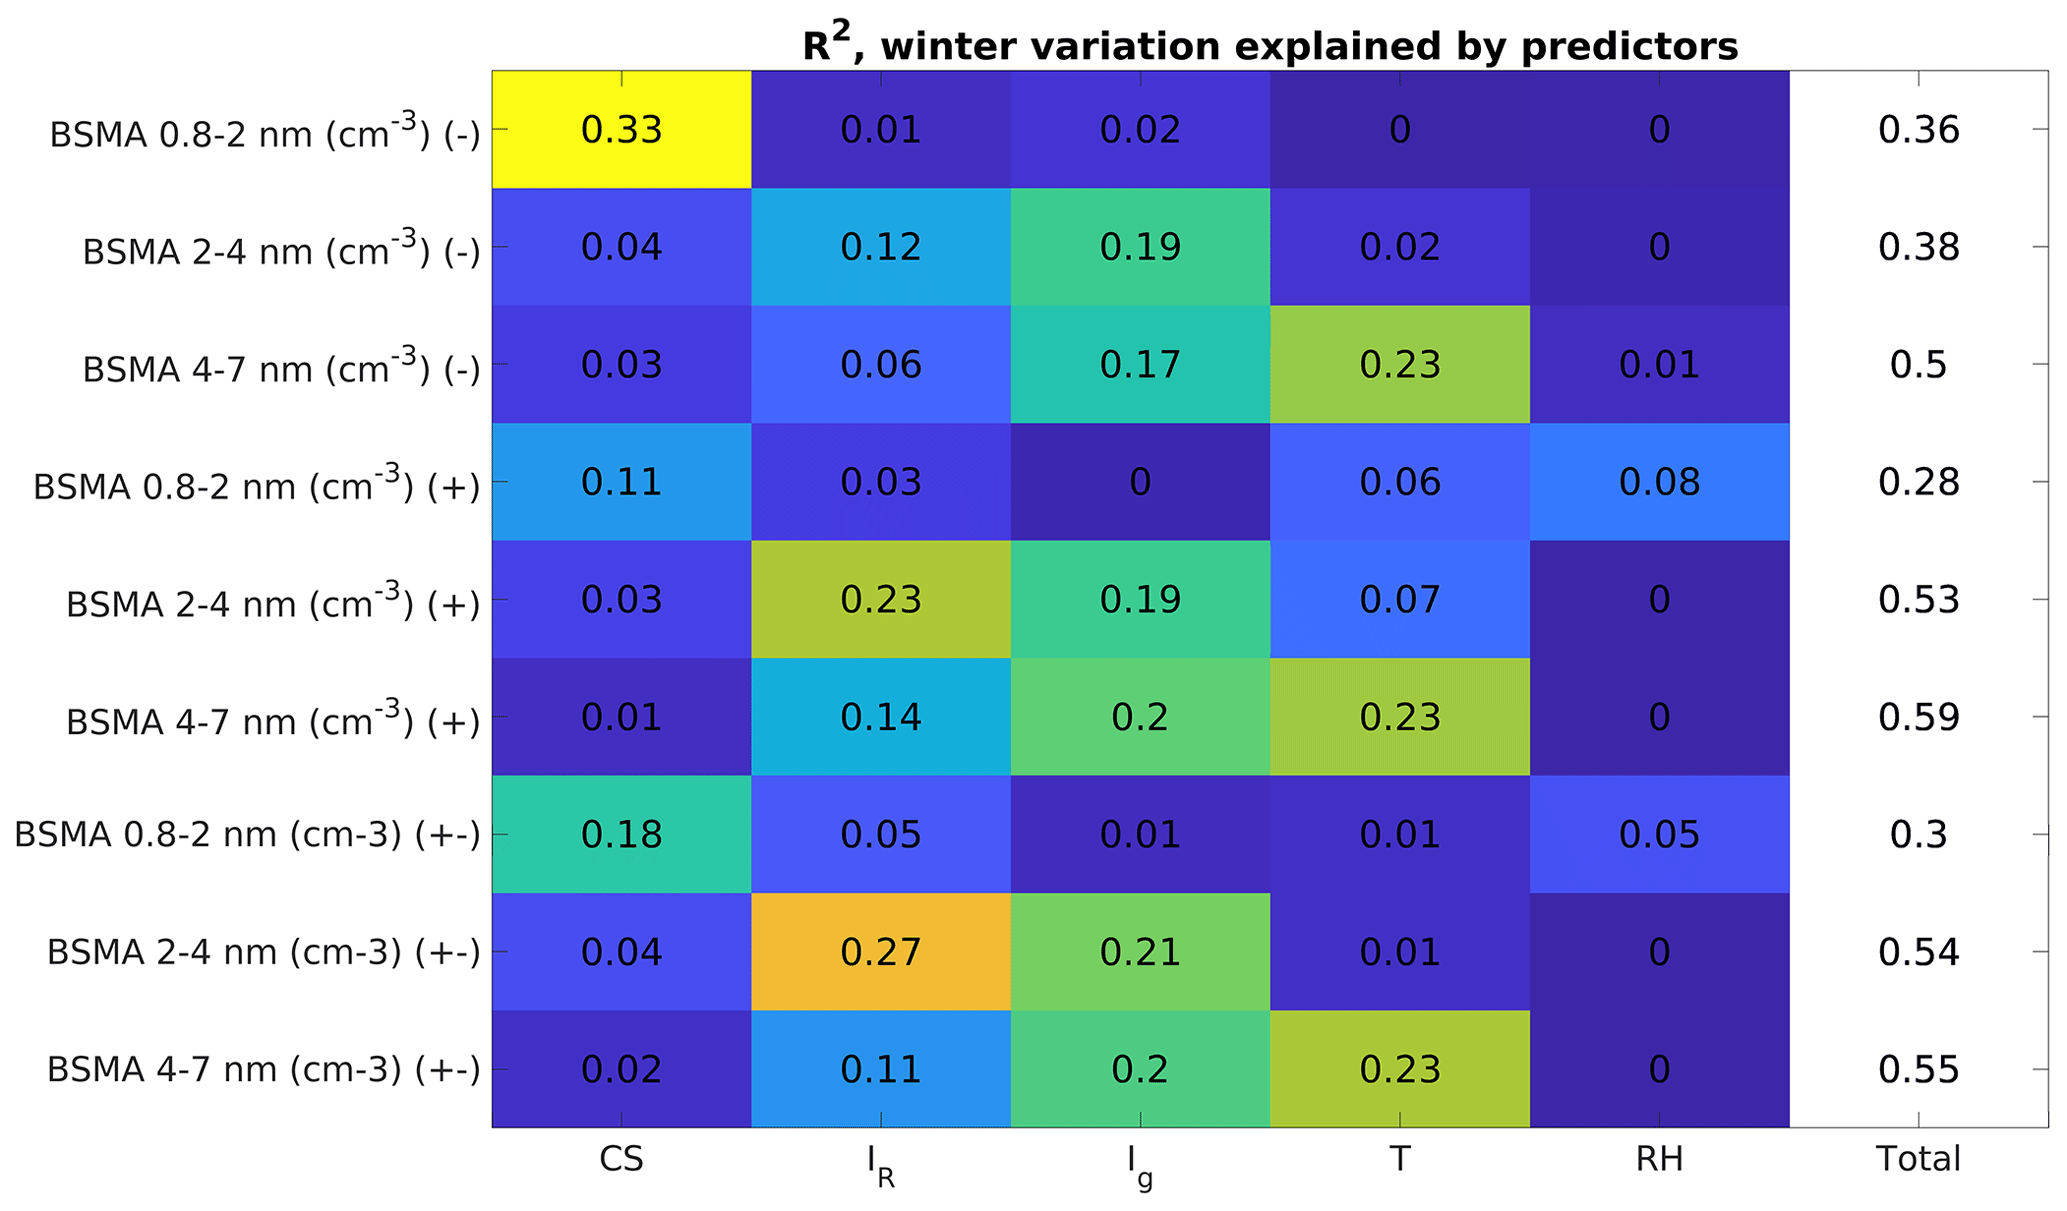
Figure A6The amount of variation explained by our chosen explanatory variables for each size range and polarity. The data points selected are only between December and February and represent changes in wintertime concentrations. The symbol (−) denotes negative polarity, (+) a positive polarity, and (±) the sum of both polarities. The bolded red values are statistically significant (p<0.05).
The meteorological data from the SMEAR II station can be accessed from the smartSMEAR website: https://smear.avaa.csc.fi/ (last access: 28 February 2022) (Junninen et al., 2009). The ion concentration data, the ionization rates, and condensation sink data are available at https://doi.org/10.5281/zenodo.6597201 (Sulo et al., 2022). The data are licensed under a Creative Commons 4.0 Attribution (CC BY) license.
JS performed the data analysis and wrote the paper. JL was responsible for the ion measurements, JL and JS handled the ion data inversion, XC calculated the radon and gamma ionization rates, and TN calculated the cosmic ray ionization rate. JK, VMK, and KL designed the study and provided supervision. All authors contributed to the discussion of the results and provided comments on the paper.
At least one of the (co-)authors is a member of the editorial board of Atmospheric Chemistry and Physics. The peer-review process was guided by an independent editor, and the authors also have no other competing interests to declare.
Publisher’s note: Copernicus Publications remains neutral with regard to jurisdictional claims in published maps and institutional affiliations.
Hanna E. Manninen, Stephany Buenrostro Mazon, Jussi Paatero, the SMEAR II technical and scientific staff, and everyone else contributing to the ion and radiation measurements are gratefully acknowledged.
This research has been supported by the Academy of Finland (grant nos. 337549, 302958, 1325656, 316114, and 325647) and the European Research Council, H2020 European Research Council (grant no. ATM-GTP (742206)).
Open-access funding was provided by the Helsinki University Library.
This paper was edited by Andreas Petzold and reviewed by Santtu Mikkonen and one anonymous referee.
Almeida, J., Schobesberger, S., Kürten, A., Ortega, I., Kupiainen-Määttä, O., Praplan, A., Adamov, A., Amorim, A., Bianchi, F., Breitenlechner, M., David, A., Dommen, J., Donahue, N., Downard, A., Dunne, E., Duplissy, J., Ehrhart, S., Flagan, R., Franchin, A., Guida, R., Hakala, J., Hansel, A., Heinritzi, M., Henschel, H., Jokinen, T., Junninen, H., Kajos, M., Kangasluoma, J., Keskinen, H., Kupc, A., Kurtén, T., Kvashin, A., Laaksonen, A., Lehtipalo, K., Leiminger, M., Leppä, J., Loukonen, V., Makhmutov, V., Mathot, S., McGrath, M., Nieminen, T., Olenius, T., Onnela, A., Petäjä, T., Riccobono, F., Riipinen, I., Rissanen, M., Rondo, L., Ruuskanen, T., Santos, F., Sarnela, N., Schallhart, S., Schnitzhofer, R., Seinfeld, J., Simon, M., Sipilä, M., Stozhkov, Y., Stratmann, F., Tomé, A., Tröstl, J., Tsagkogeorgas, G., Vaattovaara, P., Viisanen, Y., Virtanen, A., Vrtala, A., Wagner, P., Weingartner, E., Wex, H., Williamson, C., Wimmer, D., Ye, P., Yli-Juuti, T., Carslaw, K., Kulmala, M., Curtius, J., Baltensperger, U., Worsnop, D., Vehkamäki, H., and Kirkby, J.: Molecular understanding of sulphuric acid–amine particle nucleation in the atmosphere, Nature, 502, 359–363, https://doi.org/10.1038/nature12663, 2013.
Arnold, F.: Multi-ion complexes in the stratosphere-implications for trace gases and aerosol, Nature, 284, 610–611, 1980.
Arnold, F.: Atmospheric Ions and Aerosol Formation, Space Sci. Rev., 137, 225–239, 2008.
Bazilevskaya, G. A., Usoskin, I. G., Fluckiger, E. O., Harrison, R. G., Desorgher, L., Butikofer, R., Krainev, M. B., Makhmutov, V. S., Stozhkov, Y. I., Svirzhevskaya, A. K., Svirzhevsky, N. S., and Kovaltsov, G. A.: Cosmic Ray Induced Ion Production in the Atmosphere, Space Sci. Rev., 137, 149–173, 2008.
Buenrostro Mazon, S., Kontkanen, J., Manninen, H. E., Nieminen, T., Kerminen, V.-K., and Kulmala, M: A long-term comparison of nighttime cluster events and daytime ion formation in a boreal forest, Boreal Env. Res., 21, 242–261, 2016.
Canton, J.: Electrical Experiments, with an Attempt to Account for Their Several Phaenomena; Together with Some Observations on Thunder-Clouds, Phil. Trans., 48, 350–358, 1753.
Carlson, P. and De Angelis, A.: Nationalism and internationalism in science: the case of the discovery of cosmic rays, Eur. Phys. J. H., 35, 309–329, https://doi.org/10.1140/epjh/e2011-10033-6, 2011.
Chen, X., Kerminen, V.-M., Paatero, J., Paasonen, P., Manninen, H. E., Nieminen, T., Petäjä, T., and Kulmala, M.: How do air ions reflect variations in ionising radiation in the lower atmosphere in a boreal forest?, Atmos. Chem. Phys., 16, 14297–14315, https://doi.org/10.5194/acp-16-14297-2016, 2016.
Collaud Coen, M., Andrews, E., Bigi, A., Martucci, G., Romanens, G., Vogt, F. P. A., and Vuilleumier, L.: Effects of the prewhitening method, the time granularity, and the time segmentation on the Mann–Kendall trend detection and the associated Sen's slope, Atmos. Meas. Tech., 13, 6945–6964, https://doi.org/10.5194/amt-13-6945-2020, 2020.
Coulomb, C. A.: Troisieme Mèmoire sur l'Electricité et lé Magnetisme, Histoire de l'Académie Royale des Sciences, l'Académie Royale des Sciences Paris, 612–638, 1785.
Curtius, J., Lovejoy, E. R., and Froyd, K. D.: Atmospheric ioninduced aerosol nucleation, Space Sci. Rev., 125, 159–167, 2006
Dada, L., Paasonen, P., Nieminen, T., Buenrostro Mazon, S., Kontkanen, J., Peräkylä, O., Lehtipalo, K., Hussein, T., Petäjä, T., Kerminen, V.-M., Bäck, J., and Kulmala, M.: Long-term analysis of clear-sky new particle formation events and nonevents in Hyytiälä, Atmos. Chem. Phys., 17, 6227–6241, https://doi.org/10.5194/acp-17-6227-2017, 2017.
Dal Maso, M., Kulmala, M., Lehtinen, K. E. J., Mäkelä, J. M., Aalto, P., and O'Dowd, C. D., Condensation and coagulation sinks and formation of nucleation mode particles in coastal and boreal forest boundary layers, J. Geophys. Res., 107, PAR 2-1-PAR 2-10, https://doi.org/10.1029/2001JD001053, 2002.
De Angelis, A.: Atmospheric ionization and cosmic rays: studies and measurements before 1912, Astropart. Phys., 53, 19–26, https://doi.org/10.1016/j.astropartphys.2013.05.010, 2014.
Dickinson, R.: Solar Variability and the Lower Atmosphere, B. Am. Meteorol. Soc., 56, 1240-1248, https://doi.org/10.1175/1520-0477(1975)056< 1240:svatla>2.0.co;2, 1975.
Ehn, M., Junninen, H., Schobesberger, S., Manninen, H., Franchin, A., Sipilä, M., Petäjä, T., Kerminen, V., Tammet, H., Mirme, A., Mirme, S., Hõrrak, U., Kulmala, M. and Worsnop, D.: An Instrumental Comparison of Mobility and Mass Measurements of Atmospheric Small Ions, Aerosol Sci. Tech., 45, 522–532, https://doi.org/10.1080/02786826.2010.547890, 2011.
Eisele, F. L.: Natural and atmospheric negative ions in the troposphere, J. Geophys. Res., 94, 2183–2196, 1989a.
Eisele, F. L.: Natural and transmission line produced positive ions, J. Geophys. Res., 94, 6309–6318, 1989b.
Eisenbud, M. and Gesell, T.: Environmental Radioactivity: From Natural, Industrial, and Military Sources. 4th ed. San Diego: San Diego Academic Press, ISBN 9780080505800, 1997.
Enghoff, M. B. and Svensmark, H.: The role of atmospheric ions in aerosol nucleation – a review, Atmos. Chem. Phys., 8, 4911–4923, https://doi.org/10.5194/acp-8-4911-2008, 2008.
Faraday, M.: Experimental researches on electricity, 7th series, Philos. T. Roy. Soc., 124, 77–122, 1834.
Franklin, B.: A Letter of Benjamin Franklin, Esq; to Mr. Peter Collinson, F. R. S. concerning an Electrical Kite, Phil. Trans., 47, 565–567, 1751.
Franchin, A., Ehrhart, S., Leppä, J., Nieminen, T., Gagné, S., Schobesberger, S., Wimmer, D., Duplissy, J., Riccobono, F., Dunne, E. M., Rondo, L., Downard, A., Bianchi, F., Kupc, A., Tsagkogeorgas, G., Lehtipalo, K., Manninen, H. E., Almeida, J., Amorim, A., Wagner, P. E., Hansel, A., Kirkby, J., Kürten, A., Donahue, N. M., Makhmutov, V., Mathot, S., Metzger, A., Petäjä, T., Schnitzhofer, R., Sipilä, M., Stozhkov, Y., Tomé, A., Kerminen, V.-M., Carslaw, K., Curtius, J., Baltensperger, U., and Kulmala, M.: Experimental investigation of ion–ion recombination under atmospheric conditions, Atmos. Chem. Phys., 15, 7203–7216, https://doi.org/10.5194/acp-15-7203-2015, 2015.
Gagné, S., Nieminen, T., Kurtén, T., Manninen, H. E., Petäjä, T., Laakso, L., Kerminen, V.-M., Boy, M., and Kulmala, M.: Factors influencing the contribution of ion-induced nucleation in a boreal forest, Finland, Atmos. Chem. Phys., 10, 3743–3757, https://doi.org/10.5194/acp-10-3743-2010, 2010.
Gilbert, R. O.: Statistical Methods for Environmental Pollution Monitoring, Van Nostrand Reinhold Company, New York, ISBN 978-0-471-28878-7, 1987.
Hao, L., Garmash, O., Ehn, M., Miettinen, P., Massoli, P., Mikkonen, S., Jokinen, T., Roldin, P., Aalto, P., Yli-Juuti, T., Joutsensaari, J., Petäjä, T., Kulmala, M., Lehtinen, K. E. J., Worsnop, D. R., and Virtanen, A.: Combined effects of boundary layer dynamics and atmospheric chemistry on aerosol composition during new particle formation periods, Atmos. Chem. Phys., 18, 17705–17716, https://doi.org/10.5194/acp-18-17705-2018, 2018.
Hari, P. and Kulmala, M.: Station for measuring ecosystematmosphere relations (SMEAR II), Boreal Environ. Res., 10, 315–322, 2005.
Harrison, R. G. and Carslaw, K. S.: Ion-aerosol-cloud processes in the lower atmosphere, Rev. Geophys., 41, 1012, https://doi.org/10.1029/2002RG000114, 2003.
Haverkamp, H., Wilhelm, S., Sorokin, A., and Arnold, F.: Positive and negative ion measurements in jet aircraft engine exhaust: concentrations, sizes and implications for aerosol formation, Atmos. Environ., 38, 2879–2884, 2004.
Hirsch, R. M., Slack, J. R., and Smith, R. A.: Techniques of trend analysis for monthly water quality data, Water Resour. Res., 18, 107–121, 1982.
Hirsikko, A., Laakso, L, Horrak, U., Aalto, P. P., Kerminen, V.-M., and Kulmala, M.: Annual and size dependent variation of growth rates and ion concentrations in boreal forest, Boreal Environ. Res., 10, 357–369, 2005.
Hirsikko, A., Nieminen, T., Gagné, S., Lehtipalo, K., Manninen, H. E., Ehn, M., Hõrrak, U., Kerminen, V.-M., Laakso, L., McMurry, P. H., Mirme, A., Mirme, S., Petäjä, T., Tammet, H., Vakkari, V., Vana, M., and Kulmala, M.: Atmospheric ions and nucleation: a review of observations, Atmos. Chem. Phys., 11, 767–798, https://doi.org/10.5194/acp-11-767-2011, 2011.
Hoppel, W. A. and Frick, G. M.: Ion-aerosol attachment coefficients and the steady-state charge distribution on aerosols in a bipolar ion environment, Aerosol Sci. Technol., 5, 1–21, 1986.
Hõrrak, U.: Air ion mobility spectrum at a rural area, PhD, Institute of Environmental Physics, University of Tartu, Tartu, Estonia, 81 pp., 2001.
Israel, H.: Atmospheric Electricity, Israel Program for Scientific Translations, Jerusalem, 1, 317 pp., 1970.
Israelsson, S. and Knudsen, E.: Effects of radioactive fallout from a nuclear power plant accident on electrical parameters, J. Geophys. Res., 91, 11909–11910, 1986.
Junninen, H., Lauri, A., Keronen, P., Aalto, P., Hiltunen, V., Hari, P., and Kulmala, M.: Smart-SMEAR: on-line data exploration and visualization tool for SMEAR stations, [data set], Boreal Environ. Res., 14, 447–457, 2009.
Kirkby, J., Curtius, J., Almeida, J., Dunne, E., Duplissy, J., Ehrhart, S., Franchin, A., Gagné, S., Ickes, L., Kürten, A., Kupc, A., Metzger, A., Riccobono, F., Rondo, L., Schobesberger, S., Tsagkogeorgas, G., Wimmer, D., Amorim, A., Bianchi, F., Breitenlechner, M., David, A., Dommen, J., Downard, A., Ehn, M., Flagan, R., Haider, S., Hansel, A., Hauser, D., Jud, W., Junninen, H., Kreissl, F., Kvashin, A., Laaksonen, A., Lehtipalo, K., Lima, J., Lovejoy, E., Makhmutov, V., Mathot, S., Mikkilä, J., Minginette, P., Mogo, S., Nieminen, T., Onnela, A., Pereira, P., Petäjä, T., Schnitzhofer, R., Seinfeld, J., Sipilä, M., Stozhkov, Y., Stratmann, F., Tomé, A., Vanhanen, J., Viisanen, Y., Vrtala, A., Wagner, P., Walther, H., Weingartner, E., Wex, H., Winkler, P., Carslaw, K., Worsnop, D., Baltensperger, U. and Kulmala, M.: Role of sulphuric acid, ammonia and galactic cosmic rays in atmospheric aerosol nucleation, Nature, 476, 429–433, https://doi.org/10.1038/nature10343, 2011.
Kerminen, V., Chen, X., Vakkari, V., Petäjä, T., Kulmala, M. and Bianchi, F.: Atmospheric new particle formation and growth: review of field observations, Environ. Res. Lett., 13, 103003, https://doi.org/10.1088/1748-9326/aadf3c, 2018.
Knief, U. and Forstmeier, W. Violating the normality assumption may be the lesser of two evils, Behav. Res., 53, 2576–2590, https://doi.org/10.3758/s13428-021-01587-5, 2021.
Komppula, M., Vana, M., Kerminen, V.-M., Lihavainen, H., Viisanen, Y., Hõrrak, U., Komsaare, K., Tamm, E., Hirsikko, A., Laakso, L., and Kulmala, M.: Size distributions of atmospheric ions in the Baltic Sea region, Boreal Env. Res., 12, 323–336, 2007.
Kontkanen, J., Lehtinen, K. E. J., Nieminen, T., Manninen, H. E., Lehtipalo, K., Kerminen, V.-M., and Kulmala, M.: Estimating the contribution of ion–ion recombination to sub-2 nm cluster concentrations from atmospheric measurements, Atmos. Chem. Phys., 13, 11391–11401, https://doi.org/10.5194/acp-13-11391-2013, 2013.
Kulmala, M., Dal Maso, M., Mäkelä, J.M., Pirjola, L., Väkevä, M., Aalto, P., Miikkulainen, P., Hameri, K., and O'Dowd, C.: On the formation, growth and composition of nucleation mode particles, Tellus B, 53, 479–490, 2001.
Kulmala, M. and Tammet, H.: Finnish-Estonian air ion and aerosol workshops, Boreal Environ. Res., 12, 237–245, 2007.
Kulmala, M., Kontkanen, J., Junninen, H., Lehtipalo, K., Manninen, H., Nieminen, T., Petäjä, T., Sipilä, M., Schobesberger, S., Rantala, P., Franchin, A., Jokinen, T., Järvinen, E., Äijälä, M., Kangasluoma, J., Hakala, J., Aalto, P., Paasonen, P., Mikkilä, J., Vanhanen, J., Aalto, J., Hakola, H., Makkonen, U., Ruuskanen, T., Mauldin, R., Duplissy, J., Vehkamäki, H., Bäck, J., Kortelainen, A., Riipinen, I., Kurtén, T., Johnston, M., Smith, J., Ehn, M., Mentel, T., Lehtinen, K., Laaksonen, A., Kerminen, V. and Worsnop, D.: Direct Observations of Atmospheric Aerosol Nucleation, Science, 339, 943–946, https://doi.org/10.1126/science.1227385, 2013.
Laakso, L., Mäkelä, J. M., Pirjola, L., and Kulmala, M.: Model studies on ion-induced nucleation in the atmosphere, J. Geophys. Res., 107, 4427, https://doi.org/10.1029/2002JD002140, 2002.
Laine, M. : Introduction to Dynamic Linear Models for Time Series Analysis, in book: Geodetic Time Series Analysis in Earth Sciences, 139–156, https://doi.org/10.1007/978-3-030-21718-1_ 4, 2020.
Leino, K., Nieminen, T., Manninen, H. E., Petäjä, T., Kerminen, V.-M., and Kulmala, M.: Intermediate ions as a strong indicator for new particle formation bursts in a boreal forest, Boreal Env. Res., 21, 274–286, 2016.
Leppä, J., Anttila, T., Kerminen, V.-M., Kulmala, M., and Lehtinen, K. E. J.: Atmospheric new particle formation: real and apparent growth of neutral and charged particles, Atmos. Chem. Phys., 11, 4939–4955, https://doi.org/10.5194/acp-11-4939-2011, 2011.
Luoma, K., Virkkula, A., Aalto, P., Petäjä, T., and Kulmala, M.: Over a 10-year record of aerosol optical properties at SMEAR II, Atmos. Chem. Phys., 19, 11363–11382, https://doi.org/10.5194/acp-19-11363-2019, 2019.
Luts, A., Parts, T., Hõrrak, U., Junninen, H., and Kulmala, M.: Composition of negative air ions as a function of ion age and selected trace gases: Mass- and mobility distribution, J. Aerosol Sci., 42, 820–838, https://doi.org/10.1016/j.jaerosci.2011.07.007, 2011.
Lyubovtseva, Y. S., Sogacheva, L., Dal Maso, M., Bonn, B., Keronen, P., and Kulmala, M.: Seasonal variation of trace gases, meteorological parameters, and formation of aerosols in boreal forests, Boreal Env. Res., 10, 493–510, 2005.
Mahfouz, N. G. A. and Donahue, N. M.: Technical note: The enhancement limit of coagulation scavenging of small charged particles, Atmos. Chem. Phys., 21, 3827–3832, https://doi.org/10.5194/acp-21-3827-2021, 2021.
Manninen, H. E., Petäjä, T., Asmi, E., Riipinen, I., Niemnen, T., Mikkilä, J., Hõrrak, U., Mirme, A., Mirme, S., Laakso, L., Kerminen, V.-M., and Kulmala, M.: Long-time field measurements of charged and neutral clusters using Neutral cluster and Air Ion Spectrometer (NAIS), Boreal Environ. Res., 14, 591–605, 2009.
Manninen, H. E., Nieminen, T., Asmi, E., Gagné, S., Häkkinen, S., Lehtipalo, K., Aalto, P., Vana, M., Mirme, A., Mirme, S., Hõrrak, U., Plass-Dülmer, C., Stange, G., Kiss, G., Hoffer, A., Törő, N., Moerman, M., Henzing, B., de Leeuw, G., Brinkenberg, M., Kouvarakis, G. N., Bougiatioti, A., Mihalopoulos, N., O'Dowd, C., Ceburnis, D., Arneth, A., Svenningsson, B., Swietlicki, E., Tarozzi, L., Decesari, S., Facchini, M. C., Birmili, W., Sonntag, A., Wiedensohler, A., Boulon, J., Sellegri, K., Laj, P., Gysel, M., Bukowiecki, N., Weingartner, E., Wehrle, G., Laaksonen, A., Hamed, A., Joutsensaari, J., Petäjä, T., Kerminen, V.-M., and Kulmala, M.: EUCAARI ion spectrometer measurements at 12 European sites – analysis of new particle formation events, Atmos. Chem. Phys., 10, 7907–7927, https://doi.org/10.5194/acp-10-7907-2010, 2010.
Mirme, A., Tamm, E., Mordas, G., Vana, M., Uin, J., Mirme, S., Bernotas, T., Laakso, L., Hirsikko, A., and Kulmala, M.: A widerange multi-channel Air Ion Spectrometer, Boreal Environ. Res., 12, 247–264, 2007.
Mirme, S., Mirme, A., Minikin, A., Petzold, A., Hõrrak, U., Kerminen, V.-M., and Kulmala, M.: Atmospheric sub-3 nm particles at high altitudes, Atmos. Chem. Phys., 10, 437–451, https://doi.org/10.5194/acp-10-437-2010, 2010.
Mirme, S. and Mirme, A.: The mathematical principles and design of the NAIS – a spectrometer for the measurement of cluster ion and nanometer aerosol size distributions, Atmos. Meas. Tech., 6, 1061–1071, https://doi.org/10.5194/amt-6-1061-2013, 2013.
Mironova, I. A., Aplin, K. L., Arnold, F., Bazilevskaya, G. A., Harrison, R. G., Krivolutsky, A. A., and Usoskin, I. G.: Energetic particle influence on the Earth's atmosphere, Space Sci. Rev., 194, 1–96, https://doi.org/10.1007/s11214-015-0185-4, 2016.
Misaki, M., Ohtagaki, M., and Kanazawa, I.: Mobility spectrometry of the atmospheric pollution, Pure Appl. Geophys., 100, 133–145, 1972a.
Misaki, M., Ikegami, M., and Kanazawa, I.: Atmospheric electrical conductivity measurement in the Pasific Ocean, exploring the background level of global pollution, J. Meteorol. Soc. Jpn., 50, 497–500, 1972b.
Misaki, M., Ikegami, M., and Kanazawa, I.: Deformation of the size distribution of aerosol particles dispersing from land to ocean, J. Meteorol. Soc. Jpn., 53, 111–120, 1975.
Nadykto, A. B. and Yu, F.: Uptake of neutral polar vapor molecules by charged clusters/particles: Enhancement due to dipole-charge interaction, J. Geophys. Res., 108, 4717, https://doi.org/10.1029/2003JD003664, 2003.
Nieminen, T., Asmi, A., Dal Maso, M., Aalto, P., Keronen, P., Petäjä, T., Kulmala, M., and Kerminen, V.-M.: Trends in atmospheric new-particle formation: 16 years of observations in a boreal-forest environment, Boreal Environ. Res., 19, 191–214, 2014.
Retalis, D. and Pitta, A.: Effects of electrical parameters at Athens Greece by radioactive fallout from a nuclear power plant accident, J. Geophys. Res., 94, 13093–13097, 1989.
Richmann, G. W.: De electricitate in corporibus producenda nova tentamina, Commentarii Acad. Sci. Imper. Petropolitanae., 14, 299–326, 1751.
Rose, C., Zha, Q., Dada, L., Yan, C., Lehtipalo, K., Junninen, H., Mazon, S. B., Jokinen, T., Sarnela, N., Sipilä, M., Petäjä, T., Kerminen, V.-M., Bianchi, F., and Kulmala, M.: Observations of biogenic ion-induced cluster formation in the atmosphere, Sci. Adv., 4, 1–11, https://doi.org/10.1126/sciadv.aar5218, 2018.
Rutherford, E.: The velocity and rate of recombination of the ions of gases exposed to Rontgen radiation, Philos. Mag., 44, 422–440, 1897.
Seinfeld, J. H. and Pandis, S. N.: Atmospheric chemistry and physics: From air pollution to climate change, John Wiley & Sons, Inc., New York, USA, ISBN 978-1-118-94740-1, 1998.
Stolzenburg, D., Simon, M., Ranjithkumar, A., Kürten, A., Lehtipalo, K., Gordon, H., Ehrhart, S., Finkenzeller, H., Pichelstorfer, L., Nieminen, T., He, X.-C., Brilke, S., Xiao, M., Amorim, A., Baalbaki, R., Baccarini, A., Beck, L., Bräkling, S., Caudillo Murillo, L., Chen, D., Chu, B., Dada, L., Dias, A., Dommen, J., Duplissy, J., El Haddad, I., Fischer, L., Gonzalez Carracedo, L., Heinritzi, M., Kim, C., Koenig, T. K., Kong, W., Lamkaddam, H., Lee, C. P., Leiminger, M., Li, Z., Makhmutov, V., Manninen, H. E., Marie, G., Marten, R., Müller, T., Nie, W., Partoll, E., Petäjä, T., Pfeifer, J., Philippov, M., Rissanen, M. P., Rörup, B., Schobesberger, S., Schuchmann, S., Shen, J., Sipilä, M., Steiner, G., Stozhkov, Y., Tauber, C., Tham, Y. J., Tomé, A., Vazquez-Pufleau, M., Wagner, A. C., Wang, M., Wang, Y., Weber, S. K., Wimmer, D., Wlasits, P. J., Wu, Y., Ye, Q., Zauner-Wieczorek, M., Baltensperger, U., Carslaw, K. S., Curtius, J., Donahue, N. M., Flagan, R. C., Hansel, A., Kulmala, M., Lelieveld, J., Volkamer, R., Kirkby, J., and Winkler, P. M.: Enhanced growth rate of atmospheric particles from sulfuric acid, Atmos. Chem. Phys., 20, 7359–7372, https://doi.org/10.5194/acp-20-7359-2020, 2020.
Sulo, J., Sarnela, N., Kontkanen, J., Ahonen, L., Paasonen, P., Laurila, T., Jokinen, T., Kangasluoma, J., Junninen, H., Sipilä, M., Petäjä, T., Kulmala, M., and Lehtipalo, K.: Long-term measurement of sub-3 nm particles and their precursor gases in the boreal forest, Atmos. Chem. Phys., 21, 695–715, https://doi.org/10.5194/acp-21-695-2021, 2021.
Sulo, J., Lampilahti, J., Chen, X., Kontkanen, J., Nieminen, T., Kerminen, V.-M., Petäjä, T., Kulmala, M., and Lehtipalo, K.: Dataset from measurement report: Increasing trend of atmospheric ion concentrations in the boreal forest, Zenodo [data set], https://doi.org/10.5281/zenodo.6597201, 2022.
Svensmark, H., Enghoff, M., Shaviv, N., and Svensmark, J.: Increased ionization supports growth of aerosols into cloud condensation nuclei, Nat. Commun., 8, 2199, https://doi.org/10.1038/s41467-017-02082-2, 2017.
Tammet, H.: Continuous scanning of the mobility and size distribution of charged clusters and nanometer particles in atmospheric air and the Balanced Scanning Mobility Analyzer BSMA, Atmos. Res., 82, 523–535, https://doi.org/10.1016/j.atmosres.2006.02.009, 2006.
Tammet, H.: A joint dataset of fair-weather atmospheric electricity, Atmos. Res., 91, 194–200, https://doi.org/10.1016/j.atmosres.2008.01.012, 2009.
Tammet, H.: Symmetric Inclined Grid Mobility Analyzer for the Measurement of Charged Clusters and Fine Nanoparticles in Atmospheric Air, Aerosol Sci. Technol., 45, 468–479, https://doi.org/10.1080/02786826.2010.546818, 2011.
Tammet, H., Hõrrak, U., Laakso, L., and Kulmala, M.: Factors of air ion balance in a coniferous forest according to measurements in Hyytiälä, Finland, Atmos. Chem. Phys., 6, 3377–3390, https://doi.org/10.5194/acp-6-3377-2006, 2006.
Tammet, H., Komsaare, K., Hõrrak, U.: Intermediate ions in the atmosphere, Atmos. Res., 135, 263–273, https://doi.org/10.1016/j.atmosres.2012.09.009, 2013.
Tuomi, T. J.: Ten year summary 1977–1986 of atmospheric electricity measured at Helsinki-Vantaa airport, Finland, Geophysica, 25, 1–20, 1989.
Vakkari, V., O'Connor, E. J., Nisantzi, A., Mamouri, R. E., and Hadjimitsis, D. G.: Low-level mixing height detection in coastal locations with a scanning Doppler lidar, Atmos. Meas. Tech., 8, 1875–1885, https://doi.org/10.5194/amt-8-1875-2015, 2015.
Vana, M., Komsaare, K., Hõrrak, U., Mirme, S., Nieminen, T., Kontkanen, J., Manninen, H. E., Petäjä, T., Noe, S. M., and Kulmala, M.: Characteristics of new-particle formation at three SMEAR stations, Boreal Env. Res., 21, 345–362, 2016.
Venzac, H., Sellegri, K., and Laj, P.: Nucleation events detected at the high altitude site of the Puy de Dome Research Station, France, Boreal Environ. Res., 12, 345–359, 2007.
Venzac, H., Sellegri, K., Laj, P., Villani, P., Bonasoni, P., Marinoni, A., Cristofanelli, P., Calzolari, F., Fuzzi, S., Decesari, S., Facchini, M.-C., Vuillermoz, E., and Verza, G. P.: High frequency new particle formation in the Himalayas, P. Natl. Acad. Sci. USA, 105, 15666–15671, 2008.
Wagner, R., Yan, C., Lehtipalo, K., Duplissy, J., Nieminen, T., Kangasluoma, J., Ahonen, L. R., Dada, L., Kontkanen, J., Manninen, H. E., Dias, A., Amorim, A., Bauer, P. S., Bergen, A., Bernhammer, A.-K., Bianchi, F., Brilke, S., Mazon, S. B., Chen, X., Draper, D. C., Fischer, L., Frege, C., Fuchs, C., Garmash, O., Gordon, H., Hakala, J., Heikkinen, L., Heinritzi, M., Hofbauer, V., Hoyle, C. R., Kirkby, J., Kürten, A., Kvashnin, A. N., Laurila, T., Lawler, M. J., Mai, H., Makhmutov, V., Mauldin III, R. L., Molteni, U., Nichman, L., Nie, W., Ojdanic, A., Onnela, A., Piel, F., Quéléver, L. L. J., Rissanen, M. P., Sarnela, N., Schallhart, S., Sengupta, K., Simon, M., Stolzenburg, D., Stozhkov, Y., Tröstl, J., Viisanen, Y., Vogel, A. L., Wagner, A. C., Xiao, M., Ye, P., Baltensperger, U., Curtius, J., Donahue, N. M., Flagan, R. C., Gallagher, M., Hansel, A., Smith, J. N., Tomé, A., Winkler, P. M., Worsnop, D., Ehn, M., Sipilä, M., Kerminen, V.-M., Petäjä, T., and Kulmala, M.: The role of ions in new particle formation in the CLOUD chamber, Atmos. Chem. Phys., 17, 15181–15197, https://doi.org/10.5194/acp-17-15181-2017, 2017.
Wang, W., Chen, Y., Becker, S., and Liu, B.: Variance correction pre-whitening method for trend detection in auto-correlated data, J. Hydrol. Eng., 20, 04015033, https://doi.org/10.1061/(ASCE)HE.1943-5584.0001234, 2015.
Wilson, C. T. R.: The effect of rontgen's rays on cloudy condensation, Philos. T. Roy. Soc., 59, 338–339, 1895.
Wilson, C. T. R.: On the condensation nuclei produced in gases by the action of rontgen rays, uranium rays, ultra-violet light, and other agents, Philos. T. Roy. Soc., 192, 403–453, 1899.
Wilson, C. T. R.: Investigations on lightning discharges and on the electric field of thunderstorms, Philos. T. Roy. Soc., 221, 73–115, 1921.
WHO: Routine surveillance for radionuclides in air and water, 64 pp., 1968.
Wu, H., Li, Z., Li, H., Luo, K., Wang, Y., Yan, P., Hu, F., Zhang, F., Sun, Y., Shang, D., Liang, C., Zhang, D., Wei, J., Wu, T., Jin, X., Fan, X., Cribb, M., Fischer, M., Kulmala, M. and Petäjä, T.: The impact of the atmospheric turbulence-development tendency on new particle formation: a common finding on three continents, Nat. Sci. Rev., 8, nwaa157, https://doi.org/10.1093/nsr/nwaa157, 2020.
Yan, C., Dada, L., Rose, C., Jokinen, T., Nie, W., Schobesberger, S., Junninen, H., Lehtipalo, K., Sarnela, N., Makkonen, U., Garmash, O., Wang, Y., Zha, Q., Paasonen, P., Bianchi, F., Sipilä, M., Ehn, M., Petäjä, T., Kerminen, V.-M., Worsnop, D. R., and Kulmala, M.: The role of H2SO4-NH3 anion clusters in ion-induced aerosol nucleation mechanisms in the boreal forest, Atmos. Chem. Phys., 18, 13231–13243, https://doi.org/10.5194/acp-18-13231-2018, 2018.
Yu, F., Luo, G., Bates, T. S., Andersson, B., Clarke, A., Kapustin, V., Yantosca, R. M., Wang, Y., and Wu, S.: Spatial distributions of particle number concentrations in the global troposphere: Simulations, observations, and implications for nucleation mechanism, J. Geophys. Res., 115, D17205, https://doi.org/10.1029/2009JD013473, 2010.