the Creative Commons Attribution 4.0 License.
the Creative Commons Attribution 4.0 License.
 | 25 Nov 2022
Survival probabilities of atmospheric particles: comparison based on theory, cluster population simulations, and observations in Beijing
Santeri Tuovinen
Runlong Cai
Veli-Matti Kerminen
Jingkun Jiang
Markku Kulmala
Jenni Kontkanen
Atmospheric new particle formation (NPF) events are regularly observed in urban Beijing, despite high concentrations of background particles which, based on theory, should inhibit NPF due to high values of coagulation sink (CoagS). The survival probability, which depends on both CoagS and particle growth rate (GR), is a key parameter in determining the occurrence of NPF events as it describes the fraction of newly formed particles that survive from a smaller diameter to a larger diameter. In this study, we investigate and compare survival probabilities from 1.5 to 3 nm (), from 3 to 6 nm (), and from 6 to 10 nm () based on analytical formulae, cluster population simulations, and atmospheric observations from Beijing. We find that survival probabilities based on the cluster population simulations and one of the analytical formulae are in a good agreement. However, at low ratios between the background condensation sink (CS) and GR, and at high concentrations of sub-3 nm clusters, cluster–cluster collisions efficiently lower survival probabilities in the cluster population simulations. Due to the large concentrations of clusters and small particles required to considerably affect the survival probabilities, we consider it unlikely that cluster–cluster collisions significantly affect atmospheric survival probabilities. The values of observed in Beijing show high variability, most likely due to influences of primary particle emissions, but are on average in relatively good agreement with the values based on the simulations and the analytical formulae. The observed values of are mostly lower than those predicted based on the simulations and the analytical formulae, which could be explained by uncertainties in CS and GR. The observed values of at high CS GR are much higher than predicted based on the simulations and the analytical formulae. We argue that uncertainties in GR or CS are unlikely to solely explain the observed values of under high CS conditions. Thus, further work is needed to better understand the factors influencing survival probabilities of sub-3 nm atmospheric particles in polluted environments.
- Article
(1448 KB) - Full-text XML
-
Supplement
(488 KB) - BibTeX
- EndNote


Atmospheric new particle formation (NPF), consisting of the formation of stable clusters and their subsequent growth to larger sizes by the condensation of precursor vapors, has been frequently observed in many different environments (Kerminen et al., 2018). Aerosol particles affect both climate and human health (Pöschl, 2005; Rosenfeld et al., 2014; Shiraiwa et al., 2017; Bellouin et al., 2020) and NPF events significantly contribute to atmospheric concentrations of aerosol particles (Spracklen et al., 2010). Thus, NPF events can influence the effects of aerosol particles on climate and health. For example, they can increase the cloud condensation nuclei concentrations, thereby influencing climate and other properties of clouds (Spracklen et al., 2008; Yue et al., 2011). In addition, NPF events can contribute to haze episodes and lead to a degrading air quality (Guo et al., 2014; Kulmala et al., 2021, 2022).
The survival probability of molecular clusters and small aerosol particles is one of the key parameters that determine whether an NPF event occurs or not. It also determines the fraction of newly formed clusters, which are eventually able to contribute to the preexisting particle population and thereby potentially affect haze and aerosol–cloud interactions. In practice, the survival probability describes the fraction of particles or clusters formed at diameter d1 that grow to a larger diameter d2. It can be determined as the ratio of the formation rates of particles of diameters d1 and d2 (Pierce and Adams, 2007; Kulmala et al., 2017). The survival probability is governed by the growth rate (GR) and loss rate of small particles and clusters (Kerminen and Kulmala, 2002; Kulmala et al., 2017). GR depends on the concentrations of condensable precursor vapors (Kulmala et al., 2005; Sihto et al., 2006; Wang et al., 2015; Stolzenburg et al., 2020) and population dynamics such as cluster–cluster collisions (Kontkanen et al., 2022). In addition, chemical reactions in the particle may affect GR (Apsokardu and Johnston, 2018; Kulmala et al., 2022). The losses of atmospheric new particles can be characterized by the coagulation sink, denoted by “CoagS”, which describes the loss rate of small particles to larger particles by coagulation (Dal Maso et al., 2002; Kulmala et al., 2001). The value of CoagS depends on the diameter of the particle and is higher for smaller particles (Kulmala et al., 2001; Dal Maso et al., 2002). Condensation sink, denoted by “CS”, describes the loss rate of condensable vapor, often sulfuric acid, on particles, and it is frequently used as a proxy for the CoagS (Dal Maso et al., 2002; Kerminen and Kulmala, 2002). If the ratio of CoagS, or CS, to GR is low, the survival probability is high and high fractions of small particles are able to survive to larger sizes (Kulmala et al., 2017). This can result in an NPF event being observed if the initial concentrations of clusters are sufficiently high.
In this study, we focus on the survival of new particles in the polluted atmosphere in Beijing, China, where NPF events have been observed to occur frequently despite the high CoagS (Chu et al., 2019; Deng et al., 2020; Cai et al., 2021b). The median CS during NPF days in Beijing was found to be ∼0.02 s−1 (Deng et al., 2020; Wu et al., 2008; Zhou et al., 2020). Previous studies have shown that the survival probabilities in Beijing and other megacities are significantly higher than theoretically predicted under high CoagS and CS conditions (Kulmala et al., 2017; Yao et al., 2018). For example, in Beijing, NPF events have been observed to occur even when the ratio of CS to GR is so high (e.g., >50 nm−1) that theoretically no formation of 3 nm particles should be possible (Kulmala et al., 2017). This indicates a gap in the current understanding of NPF and this is why the survival probabilities of small particles in polluted environments are of great interest.
Here, we will investigate survival probabilities in the diameter ranges 1.5–3, 3–6, and 6–10 nm based on observations from Beijing, cluster population simulations using Atmospheric Cluster Dynamics Code (ACDC) (McGrath et al., 2012; Olenius and Riipinen, 2017), and analytical formulae. Three different size ranges of the survival probability will be investigated, as motivated by the size dependency of the survival probability (Kerminen and Kulmala, 2002) in order to find out whether there is an agreement between the observations, simulations, and analytical formulae, and how this depends on the size range. The observations are based on particle number size distribution measurements from 1 year (2018), from which CS, GR, and the formation rates of 1.5, 3, 6, and 10 nm particles will be derived. The formation rates will then be used to determine survival probabilities. Cluster population simulations make it possible to consider the effects of particle population dynamics on survival probabilities (Kontkanen et al., 2022). Two different sets of simulations will be conducted: first, assuming that there are no collisions between newly formed particles (i.e., particles grow only by collisions of vapor molecules) and then allowing collisions between new particles to occur. Theoretical predictions for survival probabilities are determined according to analytical formulae by Kerminen and Kulmala (2002), Lehtinen et al. (2007), and Korhonen et al. (2014). These equations relate the formation rate at a larger diameter to the formation rate at a smaller diameter, and since survival probability can be expressed as a ratio of formation rates, they can be used to determine survival probabilities from a smaller diameter to a larger diameter. The difference between the equations by Lehtinen et al. (2007) and Korhonen et al. (2014) is that the former assumes a constant GR while the latter assumes a linear or a power-law dependency of the GR on the particle diameter. The Kerminen and Kulmala (2002) equation also assumes a constant GR; however, it differs from the equation by Lehtinen et al. (2007) by relying on CS instead of CoagS and by handling the size dependency of the sink term differently.
The main objectives of this study are (1) to investigate if, and how, the survival probabilities of sub-10 nm particles differ between observations, cluster population simulations, and analytical formulae; (2) to evaluate the effect of uncertainties in the observed parameters on our results; and to (3) discuss other possible explanations, such as ineffective CoagS or enhanced GR. In practice, we will first compare theoretical survival probabilities, the survival probabilities from cluster population simulations, both with and without cluster–cluster collisions, and the observed survival probabilities. Then we will investigate how large of an uncertainty in GR or CS is needed to explain the observed survival probabilities and consider some reasons for the inaccuracy of CoagS and GR, including the measurement uncertainty and some assumptions made in determining CoagS or GR. Finally, other explanations for our results will be briefly discussed. Based on our results, we can get a better understanding of NPF in polluted megacities and gain more insight into the reasons behind disagreements between the predicted and observed survival probabilities.
2.1 Theoretical survival probability
The survival probability of atmospheric particles or clusters describes the probability, or fraction, of particles of a smaller diameter d1 growing to a larger diameter d2 (Pierce and Adams, 2007). In other words, it is the probability that a growing particle, initially of diameter d1, is not lost due to coagulation scavenging and other loss mechanisms, such as dry deposition, before it reaches the diameter d2. Coagulation scavenging, described by the CoagS, is usually the most important sink for sub-10 nm particles, and in this study, it is the only loss mechanism of particles we consider.
The best method to determine the survival probability from observations depends on particle size distribution and its temporal evolution (Cai et al., 2022). In this study, we have determined the survival probability as a ratio of formation rates J1 and J2 (Kerminen and Kulmala, 2002; Kulmala et al., 2017). This method is able to produce accurate survival probabilities for a steady-state or a quasi-steady-state size distribution, and has been shown to give relatively accurate survival probabilities in Beijing during NPF events (Cai et al., 2022).
In this study we consider three different survival probabilities: from 1.5 to 3 nm (), from 3 to 6 nm (), and from 6 to 10 nm (). Based on Kerminen and Kulmala (2002), the survival probability against coagulation scavenging from d1 to d2 is
where GR is the growth rate between d1 and d2 and CS, CS is the condensation sink of sulfuric acid, and D is the diffusion coefficient of sulfuric acid. CS is used as a proxy for the CoagS. Parameter η is a semi-empirically derived quantity taking into account the influence of the background particle size distribution on the size dependency of the CoagS. It is approximately equal to 0.23 nm2 m2 h−1.
The survival probability can also be determined based on the formulations by Lehtinen et al. (2007) and Korhonen et al. (2014), which directly use the CoagS instead of the CS to describe the particle scavenging losses. Based on these two studies, can be written as
where CoagS1 is the coagulation sink at the smaller diameter d1. If is determined based on Lehtinen et al. (2007), the growth rate (GR) is assumed to be constant, GR = GR1−2, and GR1−2 is the growth rate from the smaller diameter d1 to the larger diameter d2. In this case
Here, the parameter m depends on the background particle distribution, and it is defined as
CoagS2 is the coagulation sink of the larger particle with diameter d2. In this work, if not otherwise stated, we assume that when making predictions for the survival probabilities based on the analytical formulae. The effects of this assumption will be considered in Sect. 3.2, where the sensitivity of the survival probability on m is briefly investigated.
If the survival probability is determined based on Korhonen et al. (2014), GR is either assumed to have a linear or power-law size dependency on the particle diameter. In this study, we only considered the case with power-law size dependency, in which case GR in Eq. (2) is the growth rate at the smaller size d1, GR = GR1, and
The parameter n, related to the size dependency of GR, is analogous to the parameter m, and it is defined as
where GR2 is the growth rate at diameter d2.
From here on, we will refer to the predicted survival probabilities based on Kerminen and Kulmala (2002), Lehtinen et al. (2007), and Korhonen et al. (2014) with KK-2002, L-2007, and K-2014, respectively.
2.2 Formation rate of atmospheric clusters and particles
The particle formation rate (Ji) is one of the parameters used to characterize NPF. It describes the flux of growing particles past some diameter di. Using the formulation derived on the basis of the aerosol general dynamic equation, Ji can be determined from the particle number size distribution using (Kulmala et al., 2012)
Here,is the particle number concentration between diameters di and du, excluding the upper limit du. is the growth rate and CoagS is the coagulation sink of the particles in the size range. To account for the coagulation effects and their influence on Ji more accurately, Ji can be calculated based on an improved formulation of Eq. (7) proposed by Cai and Jiang (2017):
Here, dj is the lower limit of jth measured size bin, K(j,g) is the coagulation coefficient for collisions between particles with diameters dj and dg, dmin is the lowest measured particle diameter, nu is the particle size distribution function, and GRu is the growth rate at du.
2.3 Growth rate and condensation and coagulation sinks
The particle GR describes the rate of change of particle diameter with time. In this study, the value of GR was determined using the appearance time method (Lehtipalo et al., 2014; Olenius et al., 2014). This method is based on finding a corresponding time of appearance (tapp,i) for each particle size bin i, usually defined as the time that the number concentration in that size bin reaches 50 % of its maximum value during an NPF event. The GR is then estimated using the slope of the diameters versus the corresponding tapp
GR derived from the appearance times can be affected by processes other than the particle growth such as coagulation scavenging, which can lead to an overestimation of GR (Stolzenburg et al., 2005; Cai et al., 2021a). Thus, in this work GR was corrected for the influence of background CoagS according to the procedure presented by Cai et al. (2021a).
CS, which describes the loss rate of condensing vapor to background particles, can be determined from the particle number size distribution (Dal Maso et al., 2002)
where βj is the transition regime correction factor (Fuchs and Sutugin, 1971). CoagSi, which describes the loss rate of small particles of diameter di to larger background particles, is obtained from the following equation:
where Ki,j is the coagulation coefficient between collisions of the particles i and j. Due to the similar dependency on the particle number size distribution, CoagS can be determined from the CS using the parameter m, which was introduced in Sect. 2.1. Thus,
where dmon is the diameter of the condensing monomer. Because of this relation between the CS and the CoagS, and the size dependency of the CoagS, we have chosen to use CS GR (nm−1), where the CS is for sulfuric acid, to represent the ratio between coagulation scavenging and particle growth. The survival probabilities in this study will thus be presented with respect to CS GR.
2.4 Cluster population simulations
We investigated the agreement between survival probabilities from analytical formulae, atmospheric observations, and cluster population simulations using Atmospheric Cluster Dynamics Code (ACDC). These simulations were used as an intermediate step between the theory and the atmospheric observations. In addition, they provide valuable information on the agreement between the survival probabilities from analytical predictions and cluster population simulations, which to our knowledge have not been published before.
The ACDC program models the first steps of the atmospheric cluster and particle formation by solving the aerosol general dynamic equation (McGrath et al., 2012; Olenius and Riipinen, 2017):
where Ki,j is the coagulation coefficient between collisions of clusters or i and j, Ei→j is the evaporation coefficient from the cluster i to two smaller clusters, the other of which is the cluster j. Qi describes external sources of clusters i while Si describes their external losses, such as wall losses, other than CoagSi, which describes the coagulation losses of clusters to a background particle population. In our simulations Qi and Si were set to 0. The coagulation coefficients were determined assuming hard sphere collisions with an accommodation (sticking) factor of unity. Note that in this study particles and clusters are referred to as clusters, regardless of their size, when concerning the cluster population simulations.
We assumed monomer of the model substance to have properties corresponding to a cluster consisting of one sulfuric acid and one dimethylamine molecule, similar to the approach by Kontkanen et al. (2018). This corresponds to a situation where every sulfuric acid molecule is bound to a dimethylamine molecule. Sulfuric acid and dimethylamine cluster formation has been observed to be the main pathway of the initial formation of atmospheric clusters in Beijing (Cai et al., 2021b). Dimethylamine effectively stabilizes sulfuric acid clusters, if its concentration is sufficient with respect to the atmospheric sulfuric acid concentration (Jen et al., 2014; Kürten et al., 2014). We assumed that the formation of clusters occurred at a kinetic limit, which means that evaporation from clusters is negligible and cluster formation and growth are governed by kinetic collisions. Thus, in Eq. (13) E=0.
Two different simulation sets were considered. In the first simulation set, later referred to as Case 1, collisions only occurred between the monomers and the clusters, which means that in Eq. (13) , only when the cluster j is the monomer (j=1). In the second simulation set, referred to as Case 2, collisions between the clusters were also allowed to occur. Thus, while in Case 1 the cluster growth was only due to condensation, in Case 2 smaller clusters also contributed to the growth and, at the same time, larger clusters contributed to the losses of the smaller clusters.
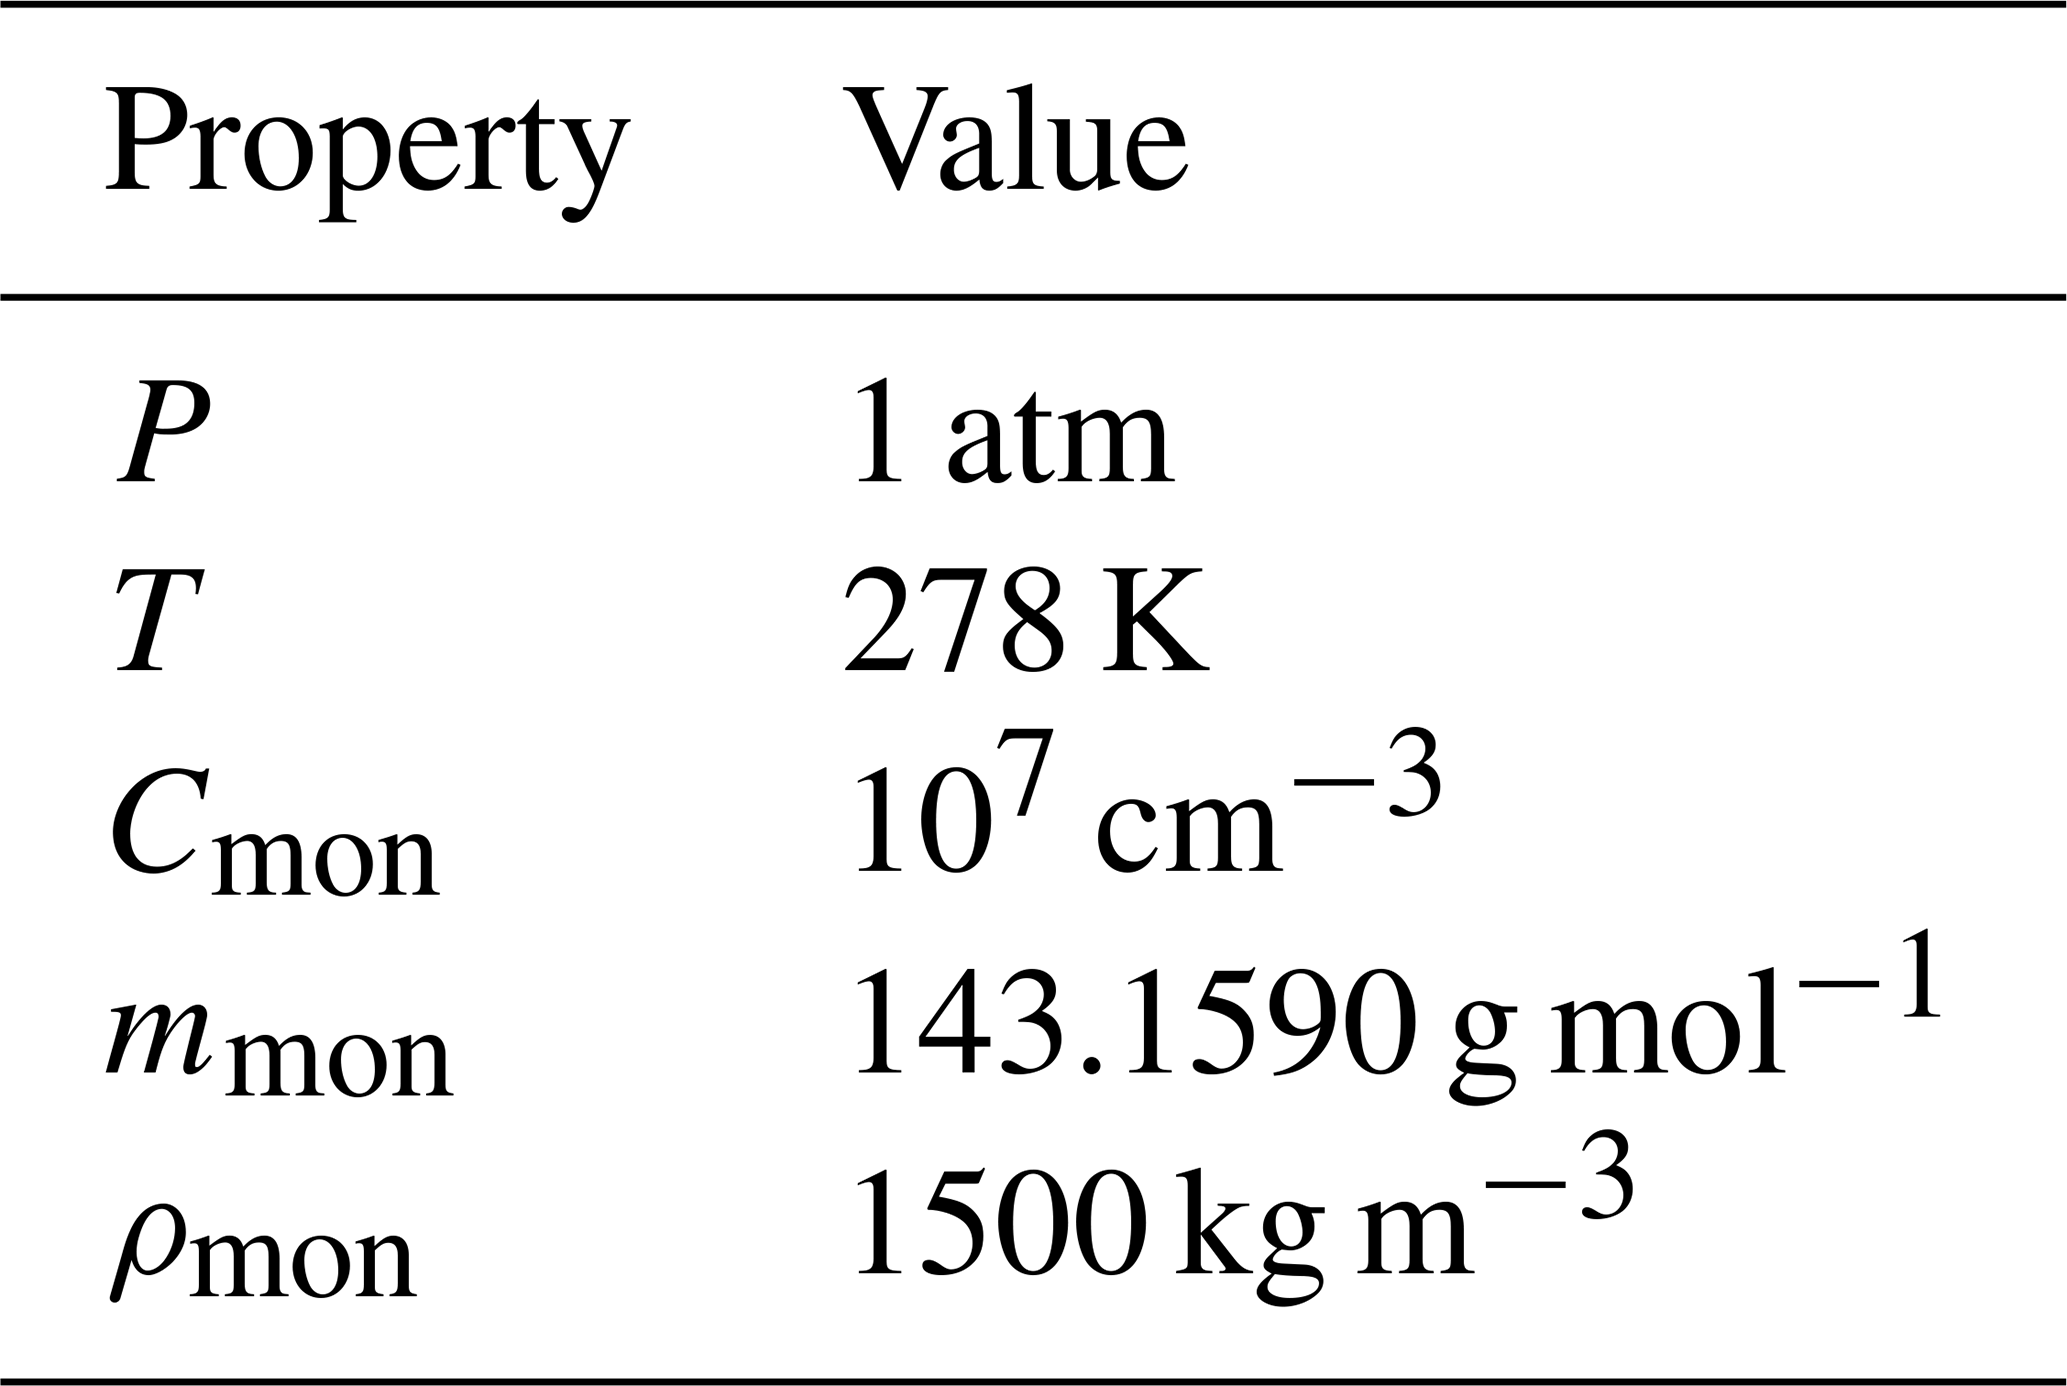
The monomer concentration (Cmon) was kept constant during all the simulations at cm−3, the value of which was chosen based on previous studies of sulfuric acid concentrations in Beijing (Yue et al., 2010; Lu et al., 2019; Li et al., 2020). We note that while the lifetime of sulfuric acid in Beijing is short due to high CS, sulfuric acid concentration can be assumed to be relatively constant during the time it takes, for example, for a 1.5 nm particle to grow to 3 nm. The largest modeled clusters in the simulations consisted of 4000 monomers and were over 10 nm in diameter. The background CS of the monomer, which was given as an input to the program, was varied between and 0.02 s−1 within the simulation sets. The model calculated the corresponding background CoagS of clusters based on Eq. (12). The properties of the monomer and other constant properties are presented in Table 1. We note that while the typical CS in Beijing is much higher than the lowest CS values used in this study, we have selected them so that the resulting CS GR values are in a comparable range with the observed values.
ACDC was run until steady state, i.e., until the concentrations of clusters with diameters up to 10 nm did not considerably change with time anymore (). The simulated steady-state size distributions for both Case 1 and Case 2 are presented in Figs. S2 and S3 in the Supplement. The cluster formation rates at the diameters 1.5, 3, 6, and 10 nm, which we needed to determine the survival probabilities, were returned by the program as the cluster flux past these sizes. The cluster fluxes were determined by the program based on the cluster and monomer concentrations and the collision rates between the different clusters or between the clusters and the monomers. In addition, formation rates were also determined based on Eq. (7). Steady-state formation rates from Eq. (7) were determined using the concentrations in different size bins, which the program returned as an output file. CoagS was approximated by CoagS of a cluster with a geometric mean diameter of the upper and lower limits of the considered diameter range. Since the particle size distributions are at the steady state, the change of the cluster concentration with time is 0 in Eq. (7). The upper du limit for J1.5, J3, and J6 is 10 nm, and for J10 it is 10.7 nm, corresponding to the largest clusters with non-zero number concentrations in the system.
The GR was determined based on the appearance time method (see Sect. 2.3). Both polynomial regression and linear regression with three size ranges (1.5–3, 3–6, 6–10 nm) were used to determine GR from the appearance times. Unless otherwise stated, the values of GR presented in this study are based on polynomial regression due to the strong size dependency of GR, and if a constant GR is used, such as for the ratio CS GR, it is based on arithmetic mean GR.
Table 1Temperature (T), ambient pressure (P), vapor monomer concentration (Cmon), vapor monomer mass (mmon), and vapor monomer density (ρmon) used in Atmospheric Cluster Dynamics Code simulations in this study.
2.5 Measured survival probability in Beijing
In this work we used measured particle number size distributions and measurement-based values of CS, GR, and formation rates from Beijing to determine the survival probabilities , , and and the corresponding ratios between CS and GR. All the data were based on measurements at the station of Beijing University of Chemical Technology (39∘56′31′′ N, 116∘17′50′′ E, Beijing) during 2018. The particle number size distribution between 1 nm and 1 µm was measured with a diethylene glycol scanning mobility particle sizer and a custom-made particle size distribution system (Jiang et al., 2011; Liu et al., 2016; Cai et al., 2017a). The formation rates for 1.5 nm (J1.5), 3 nm (J3), 6 nm (J6), and 10 nm (J10) particles were determined using Eq. (8). The upper limit for the determination of formation rate, du, was 3 nm for J1.5 and 25 nm for the other J. More details on the measurement site and measurements can be found in Zhou et al. (2020).
Days were classified as NPF event days if a new mode below 25 nm appeared and its growth to larger sizes was observed within the following hours (Dal Maso et al., 2005). Only the NPF event days with a clear appearance of sub-3 nm particles and growth up to over 10 nm sizes were included in the analysis. We determined the formation rates for survival probability calculation with a time delay in order to account for the non-steady-state aerosol size distributions during NPF. The time delay between the formation of particles of diameter d1 and particles of diameter d2 was determined based on the GR between these two sizes:
This time delay was then used to choose the formation rate at d2 (J2) corresponding to formation rate at the diameter d1(J1). Thus, survival probability from d1 to d2 is
The value of CS for the ratio CS GR corresponding to the survival probability was calculated as the median value between t1 and t2. All the times were chosen so that the earliest and the last J1.5 value from the day corresponded to the approximate start and end of formation of 1.5 nm particles, which were based on a visual analysis of the event day particle number size distributions. We used only one daily GR value for a certain size range and assumed that throughout the day GR from a smaller size d1 to a larger size d2 remains the same. In addition to inaccuracies in CS GR, this assumption also affects the values of the survival probabilities themselves as we have used the GR to select the formation rates. The atmospheric particle GR can be expected to vary, for example, due to changes in the concentrations of different condensing vapors.
The values of GR were determined on the basis of the appearance time method (see Sect. 2.3) and they were determined based on linear regression for limits 1.5–3 nm (GR1.5−3), 3–7 nm (GR3−7), and 7–25 nm (GR7−25). For calculating the survival probabilities and , GR1.5−3 and GR3−7 were used, respectively, whereas for calculating , the weighted mean value of GR3−7 and GR7−25 was used. These same values of GR were also used to determine CS GR corresponding to the survival probabilities.
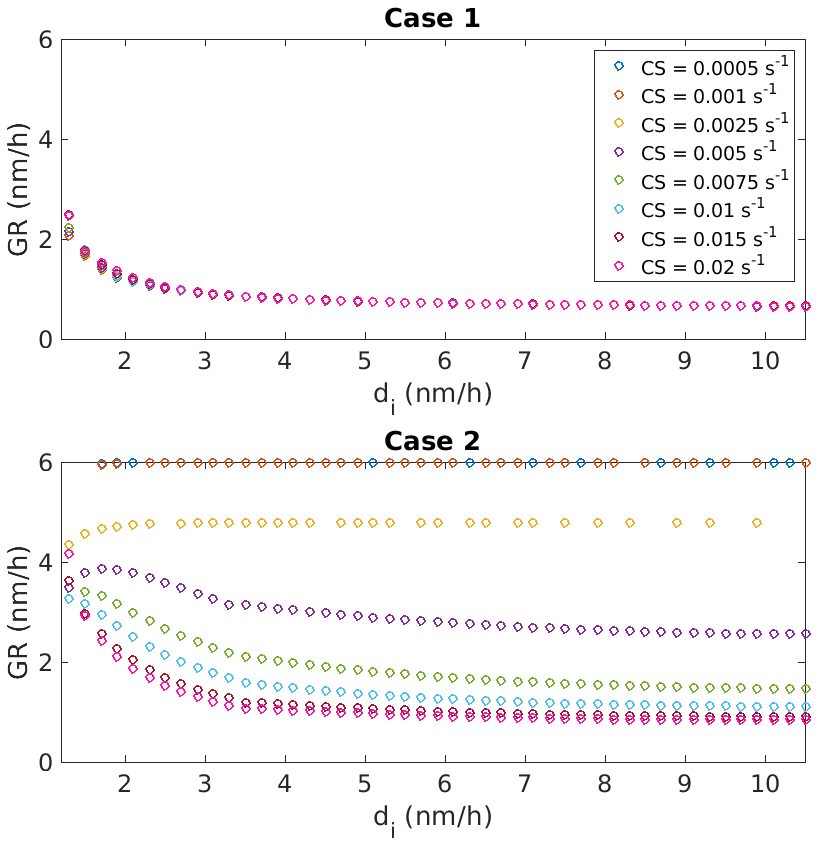
Figure 1Appearance time method-based growth rates (GRs) for ACDC simulations with constant monomer concentration Cmon=107 cm−3 as a function of the cluster diameter di. GRs were determined based on polynomial regression. Case 1 includes no cluster–cluster collisions, while in Case 2 cluster–cluster collision were allowed to occur. Different model runs had different input background condensation sinks (CS) and these have been marked with the different colors.
3.1 Formation rates and growth rates in cluster population simulations
Figure 1 shows GRs based on multi-degree polynomial regression from the cluster population simulations for both Case 1 and Case 2 for different input background CS. In Case 1 collisions between clusters did not occur while in Case 2 they did. In Case 1, the GR has very similar values at all CS values since growth only occurs through condensation and Cmon is constant. GR depends on di so that smaller di has a larger GR. This size dependency is stronger at smaller diameters, while for larger di GR is almost constant. This observed behavior of GR in the simulations for Case 1 results from the coalescence with the monomer increasing the size of a smaller cluster relatively more than that of a larger cluster (Nieminen et al., 2010).
Figure 1 also shows the GR for Case 2. When including cluster–cluster collisions, GR as a function of di shows very different behavior depending on the background CS. When CS is small, GR is much higher for all the cluster sizes compared to Case 1. With increasing CS, GR becomes smaller, with the change being larger for larger di. If CS = 0.02 s−1, GR is significantly larger for Case 2 compared to Case 1 at small di, the difference being over 1 nm h−1 at di=1.5 nm. With the same background CS, the difference in GR for the two cases is approximately 0.2 nm h−1 at di>3 nm. In Case 2 the GR depends strongly on background CS since at smaller background CS, the concentrations of clusters are higher and the cluster–cluster collisions contribute more to the growth. On the contrary, when the background CS is larger, the cluster concentrations remain small and the effect of cluster–cluster collisions on the cluster growth remains minor. The cluster GR can be significantly enhanced by cluster–cluster collisions if the cluster concentrations are sufficiently high in comparison with CS. Lehtipalo et al. (2016) have previously shown that if the concentrations of stabilizing vapors such as dimethylamine are high, resulting in low or negligible evaporation rates, cluster–cluster collisions can have a major contribution to the growth of clusters and particles, especially if CS is low. The same has also been observed in studies utilizing cluster population simulations (Kontkanen et al., 2022).
It should be noted that while we do not explicitly account for the effect of cluster–cluster collisions on the coagulation losses of the clusters in this study, the loss rates of the clusters can also be considerably affected by the cluster–cluster collisions if the background CS is small and cluster concentrations are high.
ACDC determines the output formation rates directly based on the cluster growth fluxes over the threshold diameters, whereas the formation rates from the atmospheric observations are determined based on the measured particle number size distribution (see Sect. 2.2). To investigate whether this difference in method to determine the formation rate could result in disagreements between the cluster population simulations and the observations, we compared the cluster population model steady-state formation rates from the fluxes with the formation rates calculated on the basis of Eq. (7) for both Case 1 and Case 2.

Figure 2The formation rates (J) from ACDC simulations based on fluxes and Eq. (8) (marked in red) for a case with no cluster–cluster collisions (Case 1) and a case including cluster–cluster collisions (Case 2). The 1:1 line is included and shown with the dotted black line. J values are determined at the steady state and thus in Eq. (8) the change of the cluster number concentration with time is 0.
For Case 1, Fig. 2 shows that for all the sizes, the two formation rates for Case 1 are approximately within a factor of 2. J3, J6, and J10 are very close to the same value despite the method used for its determination. However, the majority of the values of J1.5 are smaller if the formation rates are determined based on Eq. (7) compared to if they are based on the fluxes, which we assume to be caused by the mean GR between 1.5 and 10 nm underestimating the growth slightly. Thus, whether we determine formation rate based on fluxes or Eq. (7) does not cause a significant difference in the values of or for Case 1. Determining based on the formation rates from Eq. (7) results in a larger value than if the formation rates are directly based on the cluster growth fluxes. However, the differences are relatively minor. For Case 2, Fig. 2 shows that when the formation rates are high, and CS is low, the formation rates based on Eq. (7) are lower than those based on fluxes. This is because Eq. (7) uses only one value of CoagS to approximate the coagulation losses between the upper and lower limits of the diameter range. The CoagS that is used underestimates these losses because in Case 2 other clusters contribute to the losses of clusters in addition to the background CS. As the observed formation rates are based on Eq. (8), which includes a more detailed description of coagulation scavenging compared with Eq. (7), we assume that the observed survival probabilities are comparable to both Case 1 and Case 2 survival probabilities.
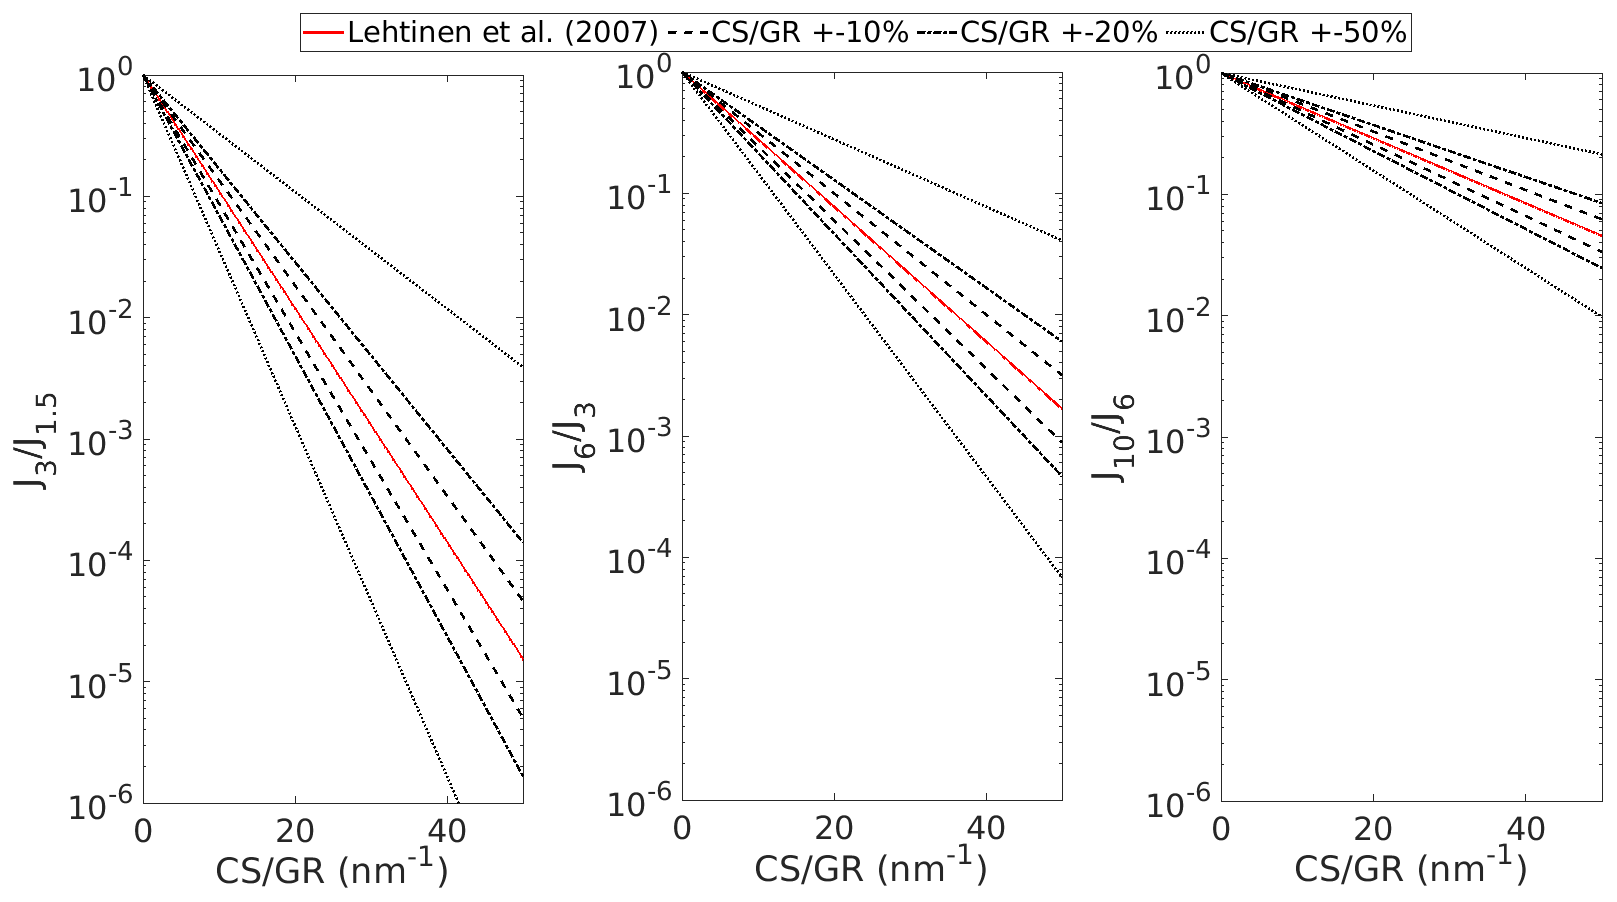
Figure 3Predictions for the survival probabilities from 1.5 to 3 nm (), from 3 to 6 nm (), and from 6 to 10 nm () according to the formulation by Lehtinen et al. (2007). Values with accurate CS GR are marked with the red line; the black lines correspond to the survival probabilities with CS GR being 10 %, 20 %, and 50 % lower, or higher, than assumed.
3.2 Sensitivity of survival probability to CS GR and m-parameter
We investigated the sensitivity of L-2007 survival probability to the ratio CS GR and the parameter m. Figure 3 illustrates the sensitivity of the survival probabilities to CS GR and shows how uncertainties in CS, or GR, can lead to disagreements between the observed survival probability and theoretical survival probability. For example, if CS GR is 40, can be underestimated by almost 3 orders of magnitude if the true CS GR is 50 % of the assumed value. Similarly, if the true CS GR is 50 % larger than the assumed CS GR of 40, we can overestimate by 2 orders of magnitude. The survival probability is less sensitive to CS GR when CS GR is low, and thus the error in CS GR results in a larger error in the survival probability at high CS GR. If either the GR or CS determined based on measurements is inaccurate, the predicted theoretical survival probability can be significantly different from the one we observe. This is especially true for highly polluted environments where CS GR is often quite high.
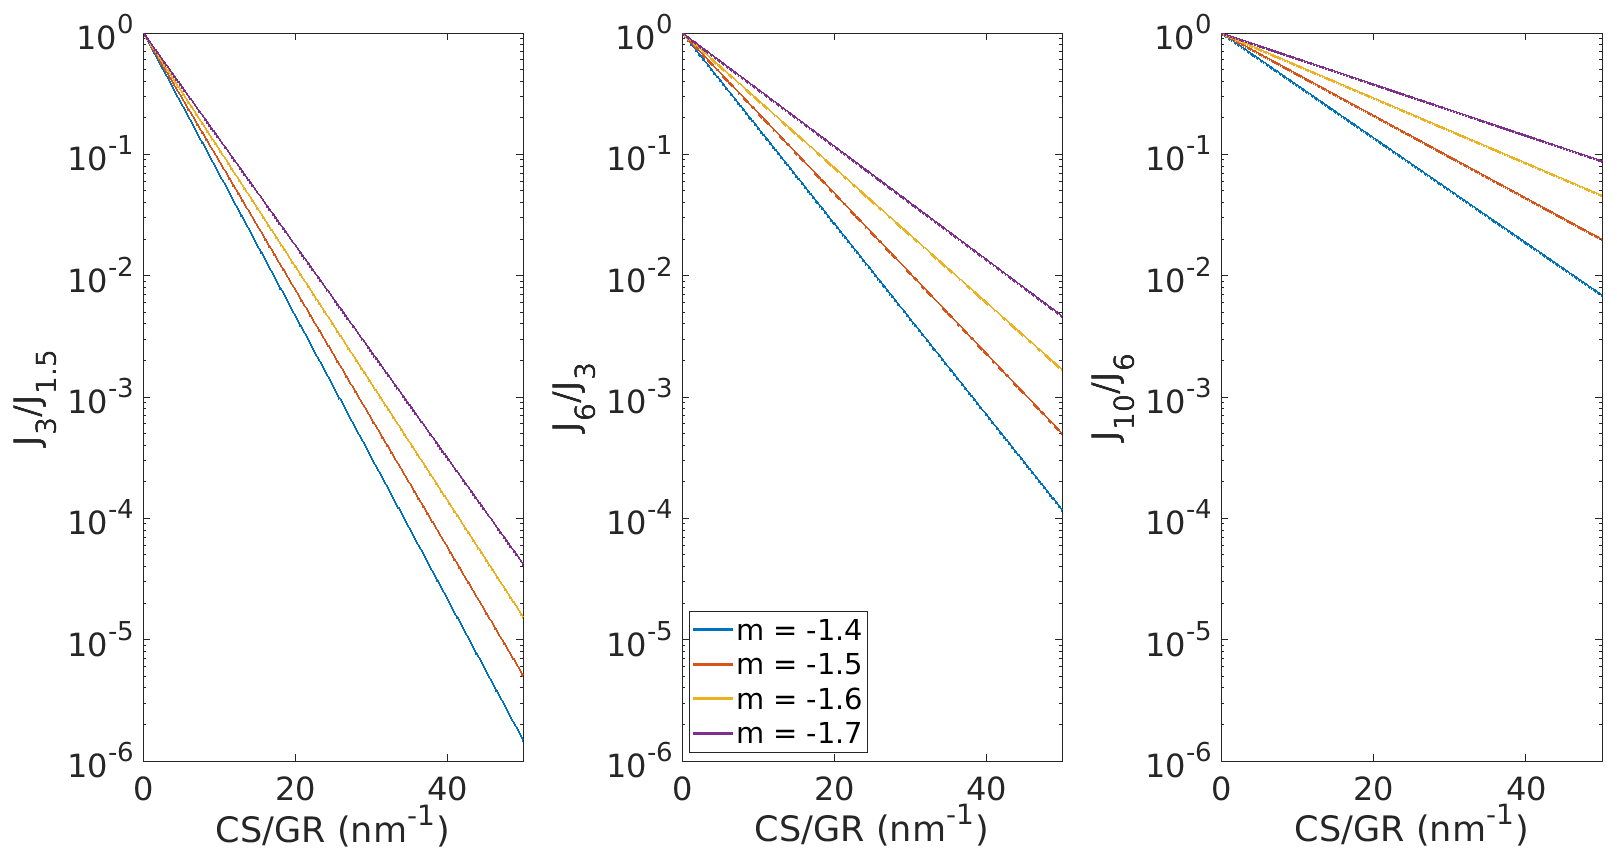
Figure 4Predictions for the survival probabilities from 1.5 to 3 nm (), from 3 to 6 nm (), and from 6 to 10 nm () according to the formulation by Lehtinen et al. (2007). Horizontal axis is the ratio of condensation sink and growth rate (CS GR). Four different values for the parameter m have been used.
Additionally, we investigated the sensitivity of L-2007 survival probability to the parameter m (Fig. 4). and are more sensitive to m compared with . The parameter m varies to some extent as the number size distribution of larger particles changes, which can also affect the survival probability of particles or clusters. For example, when CS GR is around 20, is approximately 0.02, 0.05, and 0.08 when , −1.5, and −1.6, respectively. However, considering the uncertainties associated with the measured formation rates, CS and GR, we may assume that the effect of our assumption that on our results is relatively minor. We discuss this further in Sect. 3.4.
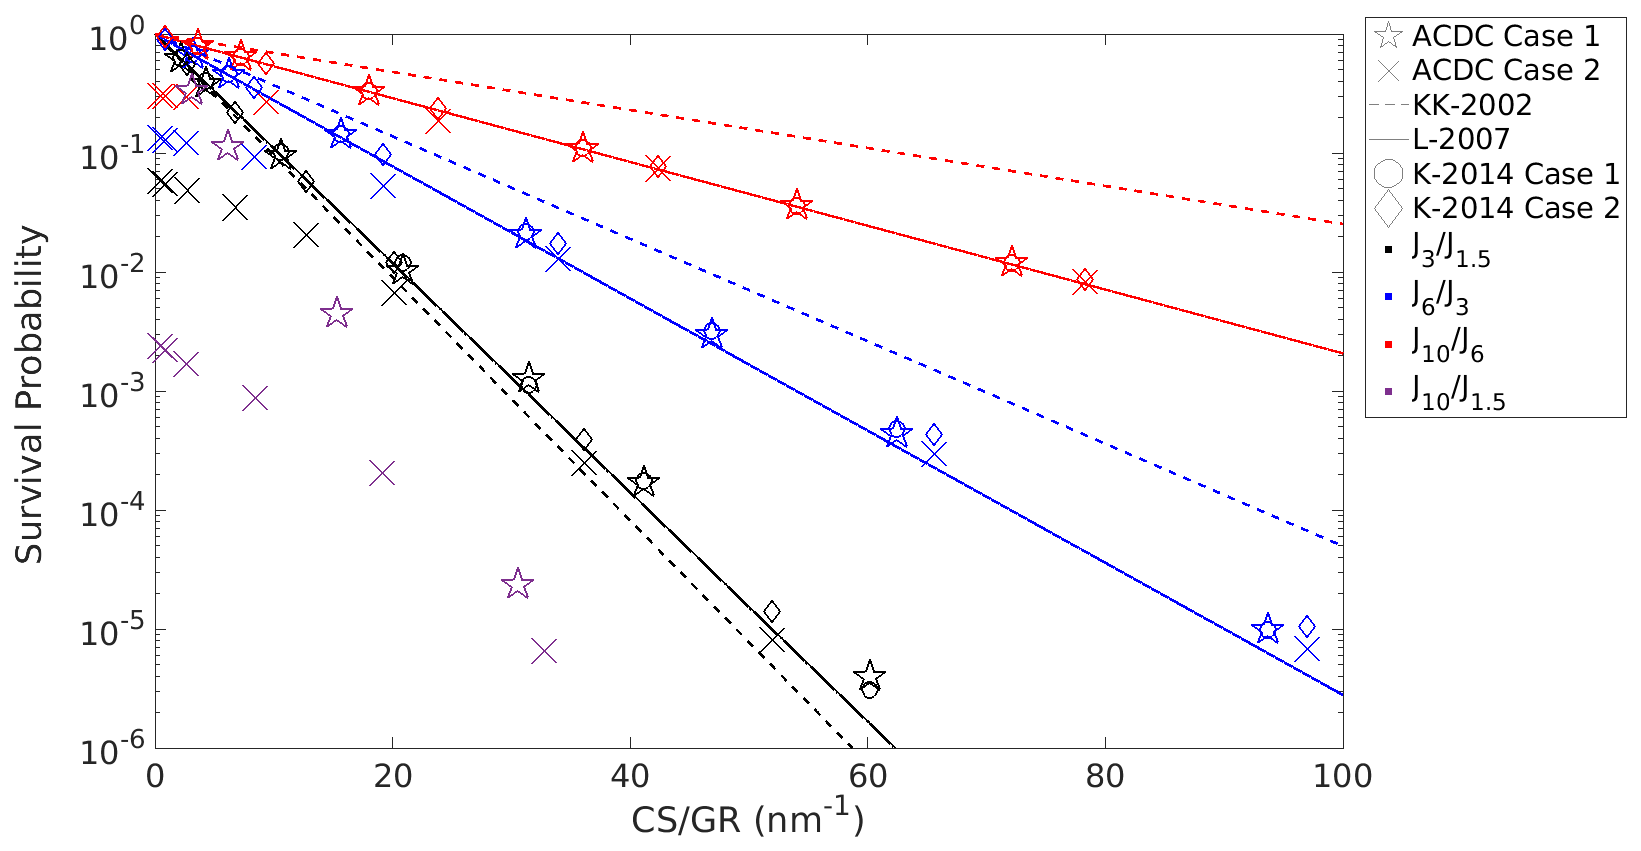
Figure 5Survival probabilities from 1.5 to 3 nm (), from 3 to 6 nm (), from 6 to 10 nm (), and from 1.5 to 10 nm (). Horizontal axis is expressed in terms of background condensation sink of sulfuric acid (CS) and the mean growth rate (GR) in the size range. Survival probabilities based on Atmospheric Cluster Dynamics Code (ACDC) simulation results and theoretical predictions are included. The ACDC survival probabilities are divided into two different cases: in Case 1 no collisions between clusters occur and in Case 2 collisions between clusters are also allowed to occur. In both Cases 1 and 2, monomer concentration is cm−3. GR is based on multi-degree polynomial regression. The theoretical predictions are based on Kerminen and Kulmala (2002) (KK-2002) and Lehtinen et al. (2007) (L-2007) formulations, which assume constant GR, and on Korhonen et al. (2014) (K-20014) formulation, assuming a power-law size dependency of the GR (see Eqs. 1 and 2).
3.3 Survival probabilities in cluster population model simulations
Figure 5 shows the survival probabilities , , and based on the cluster population model simulations and analytical formulae (see Sect. 2.1) as a function of CS GR. In addition, based on the cluster population model simulations is shown. Note that CS in CS GR is the background CS, which for the ACDC Case 1 corresponds to the total loss rate. The ratio CS GR corresponding to the values of survival probabilities from the cluster population model simulations was determined by the appearance time method based on multi-degree polynomial regression (see Sects. 2.3 and 2.4). Additionally, results with GR determined on the basis of linear regression are shown in Fig. S1.
We see that for Case 1 with no cluster–cluster collisions, the ratio CS GR corresponding to a value of the survival probability is higher if GR is based on the linear regression of the appearance times (Fig. S1) than on multi-degree polynomial regression (Fig. 5), which is especially apparent at higher CS. As GR is highly size dependent at smaller diameters, determining it based on the linear fit leads to a higher uncertainty in GR between 1.5 and 3 nm. This underestimation of GR increases at certain CS GR. While GR based on the linear regression of the appearance times is at most approximately 30 % lower than GR based on the multi-degree polynomial regression of the appearance times, the effect on the interpretation of our results is significant: at similar CS GR the value of can seem to be much higher. Similar observations can be made about ACDC Case 2 with cluster–cluster collisions at high CS. As discussed in Sect. 3.2, survival probabilities are highly sensitive to uncertainties in CS and GR, and thus GR should always be determined as accurately as possible. For this reason, further discussion of the cluster population model survival probabilities is focused on the results with GR based on the multi-degree polynomial regression of the appearance times.
For Case 1 with no cluster–cluster collisions, we can see that from the cluster population simulations is higher than the KK-2002 ; however, the difference is relatively small. and from the simulations are considerably lower than the KK-2002 and . The L-2007 survival probabilities are closer to the cluster population simulation survival probabilities and the only notable, but still relatively small, differences are observed at high CS GR for and . The ACDC Case 1 is higher than the L-2007 by a bit more than a factor of 2 at its largest value.
The differences in the KK-2002 and the L-2007 survival probabilities are due to the formula by Kerminen and Kulmala (2002) having a less accurate size dependency of CoagS. This is because in the derivation of the formula by Kerminen and Kulmala (2002), a power-law dependency of CoagS with an exponent of −2 was assumed. The assumption is then corrected by a semi-empirically derived correction parameter, while the Lehtinen et al. (2007) formulation directly accounts for the size dependency of CoagS.
Both the KK-2002 and the L-2007 survival probabilities are determined using a constant GR, which in this case is the arithmetic mean GR in the relevant size range. Since GR for Case 1 in the cluster population simulations is highly size dependent (see Fig. 1), the small differences between the L-2007 and the ACDC Case 1 survival probabilities are probably explained by this assumption of a constant GR. This is supported by the K-2014 survival probabilities, which were determined assuming a power-law size dependency of GR, being approximately the survival probabilities from the cluster population simulations for the three size ranges. We note that as ACDC Case 1 survival probabilities show only minor differences compared to L-2007 survival probabilities; the mean GR in a size range appears to represent the growth term in CS GR well. Thus, we assume that the values of CS GR from ACDC model simulations are comparable to the observed values of CS GR.
Figure 5 shows , , and for ACDC Case 2. In Case 2, collisions between clusters occurred in addition to the collisions between the monomers and the clusters. We see that for larger CS GR, the behavior of the survival probabilities is similar to Case 1. However, for CS GR roughly below 20, , , and are considerably smaller than the survival probabilities based on the analytical formulae and from Case 1. The Case 2 is smaller than the Case 1 by more than 1 order of magnitude when CS GR <7. In addition, Fig. 5 shows for both Case 1 and Case 2. It is clear that the survival rates from 1.5 up to 10 nm are considerably decreased by cluster–cluster collisions when background CS is low. This is because when CS is low and the concentrations of clusters are high, cluster–cluster collisions reduce the cluster number concentrations more efficiently than they increase the survivability of clusters from coagulation scavenging due to enhanced growth. A similar decrease in survival probabilities due to high numbers of collisions between clusters has been previously shown in model simulations and CLOUD chamber experiments by Xiao et al. (2021).
Based on our results we cannot directly say whether, and to what extent, particle and cluster survival probabilities in atmospheric environments are affected by cluster–cluster collisions. However, we have shown that if the concentrations of sub-10 nm particles and clusters are high, the survival probabilities can be considerably influenced by the increased loss rates. In addition, the dependency of survival probability on the background CS can be weakened due to high rates of collisions between sub-10 nm particles and clusters.
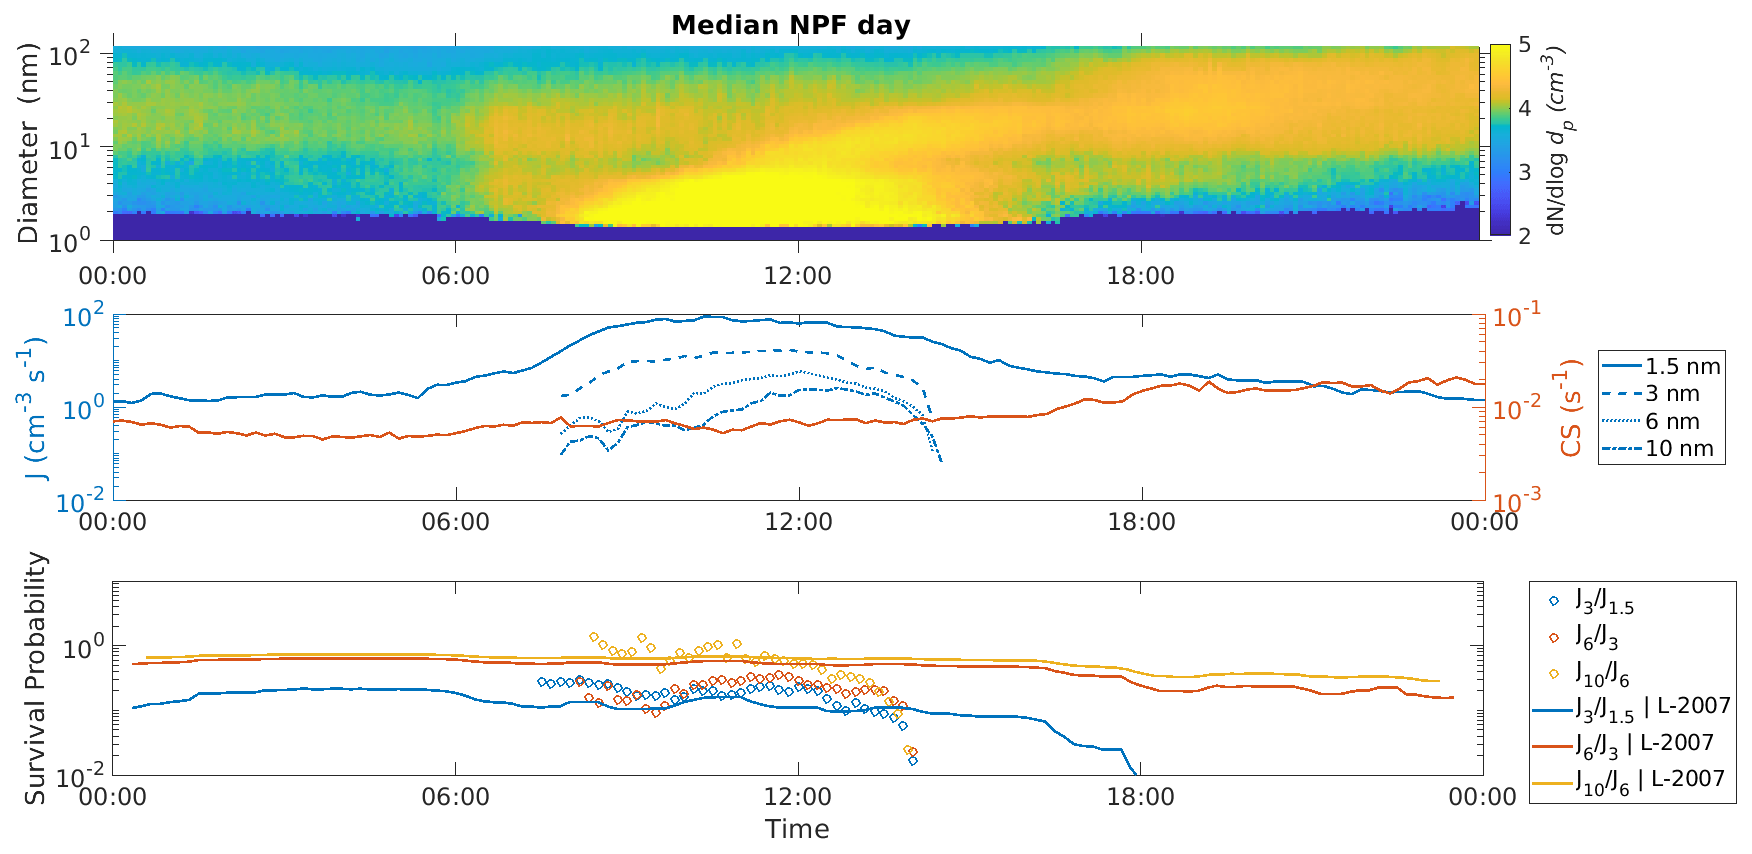
Figure 6The median particle number size distribution and the median survival probabilities from 1.5 to 3 nm (), from 3 to 6 nm (), and from 6 to 10 nm () during an NPF event day in Beijing, China. Theoretical predictions (L-2007) for survival probability based on the Lehtinen et al. (2007) formulation (see Eq. 2) determined on the basis of the median condensation sink (CS) and the median growth rate (GR) are also shown. The median GR is 2.48 nm h−1 between 1.5 and 3 nm, 4.81 nm h−1 between 3 and 6 nm, and 3.37 nm h−1 between 6 and 10 nm.
3.4 Survival probabilities in Beijing
3.4.1 Survival probabilities during a median new particle formation event
In the following, we will consider a median NPF event day in Beijing (Fig. 6), by which we mean that the median diurnal variation of values was determined by calculating median values for each 10 min time interval based on the data from all the investigated dates. The median formation rates and survival probabilities for the three investigated size ranges are shown in Fig. 6 alongside the L-2007 survival probabilities (see Sect. 2.1). The values of the median survival probabilities and CS GR ratio were determined based on Eqs. (13) and (14). During the median event, the GR between 1.5 and 3 nm is 2.5 nm h−1, between 3 and 6 nm it is 4.9 nm h−1, and between 6 and 10 nm it is 3.4 nm h−1. Between 07:00 and 14:00 (local time) the CS GR ratio corresponding to the survival probability varies approximately between 8 and 11, while the CS GR ratios corresponding to and vary approximately between 4 and 6, and 6 and 8, respectively. The variability in CS GR during the median day is quite minor; however, it should be noted that the variability during separate days can be considerably larger.
Figure 6 illustrates how the formation rates and the survival probabilities vary during an NPF event. At first the formation rates increase during the event, reaching a peak after which they start to decrease. J1.5 reaches the peak value first, followed by J3, J6, and J10 demonstrating the time delay between the formation of different diameters. The value of CS during the median NPF event varies little and because of the following low variability of CS GR, the predicted survival probabilities are relatively constant during the event. The median is mostly higher than the L-2007 except in the afternoon when clusters do not appear to grow to larger sizes effectively. However, the difference is relatively small, less than by a factor of 3 at its highest. The median is always lower than the L-2007 and most of the time the difference is larger than for At its peak value, when the difference is the smallest, the median is ∼70 % of the predicted . When the median event is first observable, the median is higher than the L-2007 . However, this is likely due to the influence of other sources, such as traffic emissions, on formation rates rather than due to NPF. For a large fraction of the time, the observed median and the L-2007 agree relatively well.
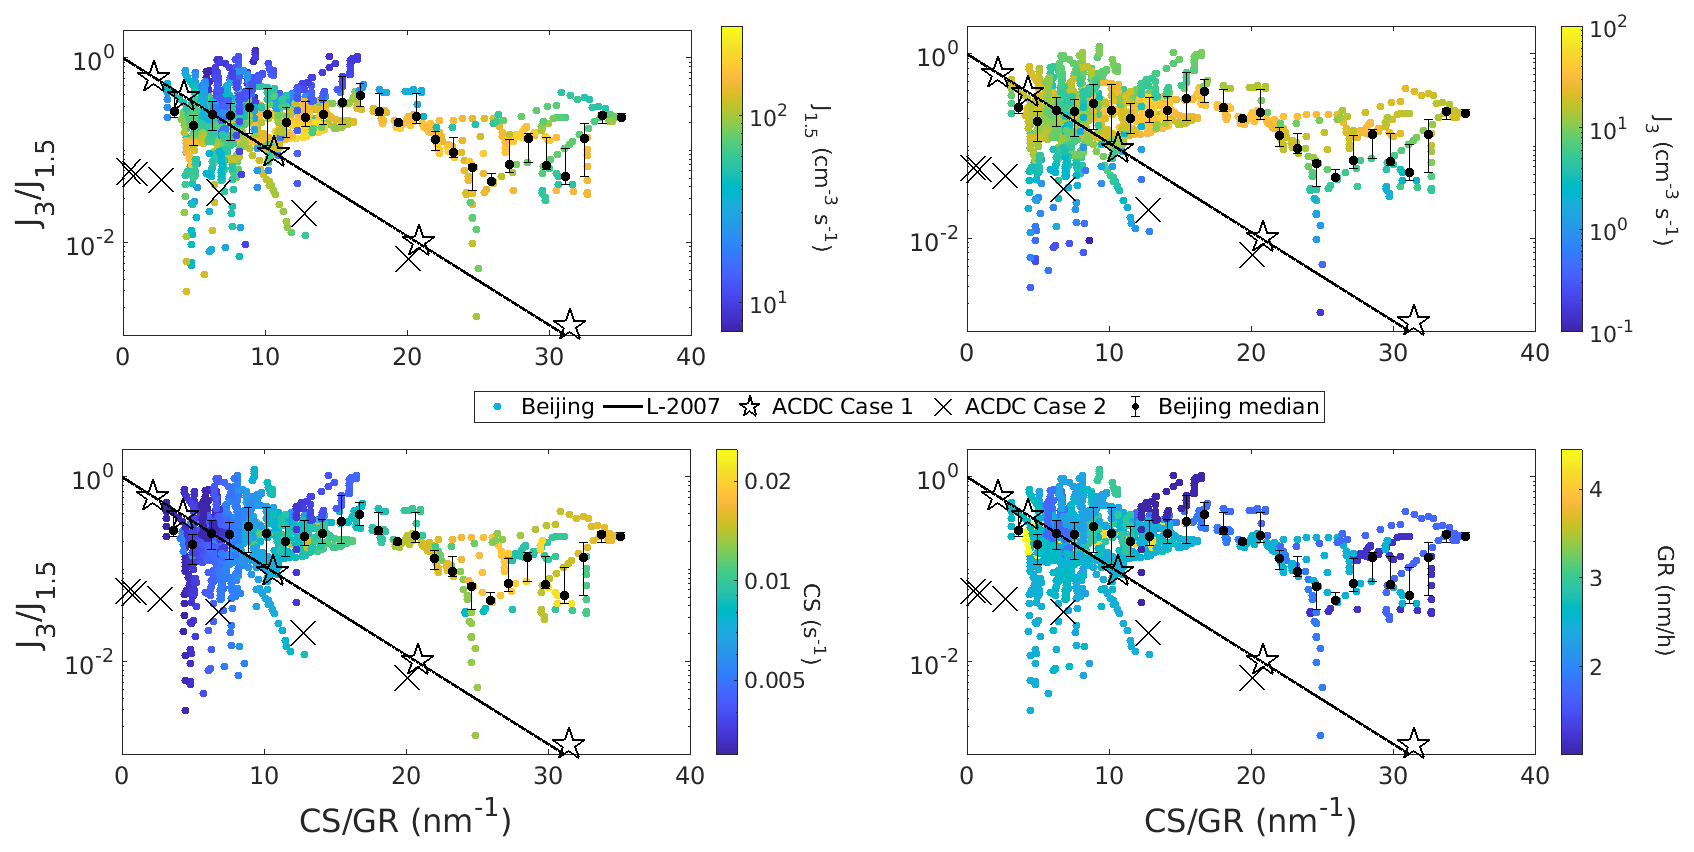
Figure 7Survival probability from 1.5 to 3 nm () as a function of the ratio of the condensation sink and the growth rate (CS GR). Survival probabilities from Beijing, China, the ACDC model simulations, and the predictions based on the theoretical formulation by Lehtinen et al. (2007) (L-2007) are included. ACDC Case 1 refers to simulations with no collisions between the clusters, while in Case 2 simulations, cluster–cluster collisions also occurred. The median values for the observed have been determined based on a bin division of horizontal values and the quartiles are shown as the error bars. The top left figure is shaded with the J1.5 while the top right, the bottom left, and the bottom right are shaded with the J3, the CS, and the GR, respectively.
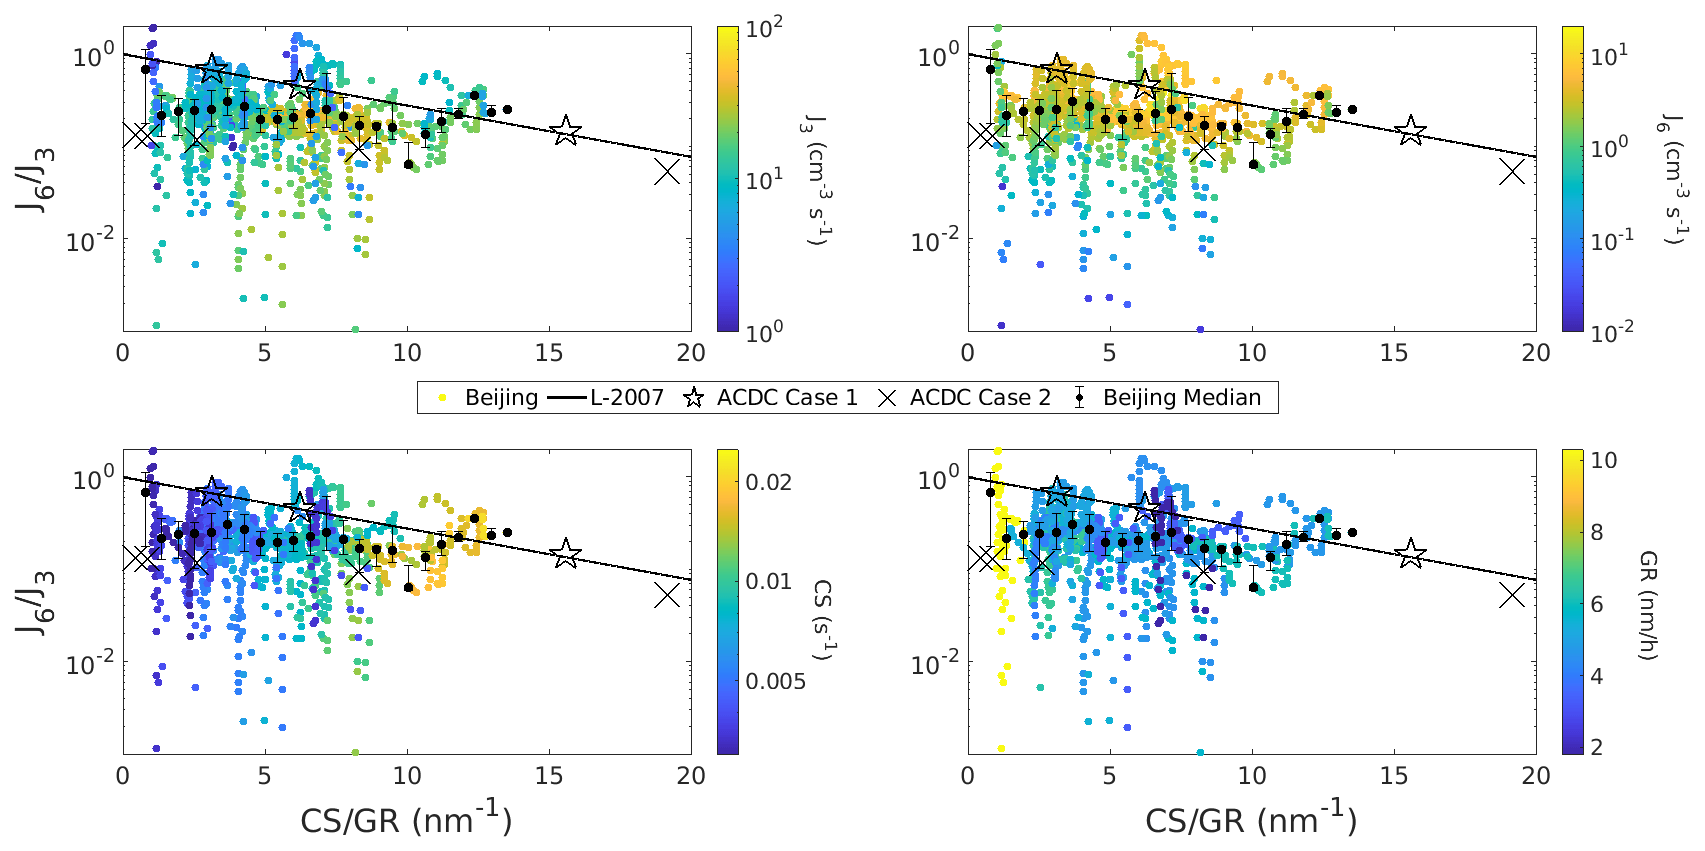
Figure 8Survival probability from 3 to 6 nm () as a function of the ratio of condensation sink and growth rate (CS GR). Survival probabilities from Beijing, China, ACDC model simulations, and the predictions based on the theoretical formulation by Lehtinen et al. (2007) (L-2007) are included. ACDC Case 1 refers to simulations with no collisions between the clusters, while in Case 2 simulations, cluster–cluster collisions also occurred. Median values for observed have been determined based on a bin division of horizontal values and the quartiles are shown as the error bars. The top left figure is shaded with the J3 while the top right, the bottom left, and the bottom right are shaded with the J6, the CS, and the GR, respectively.
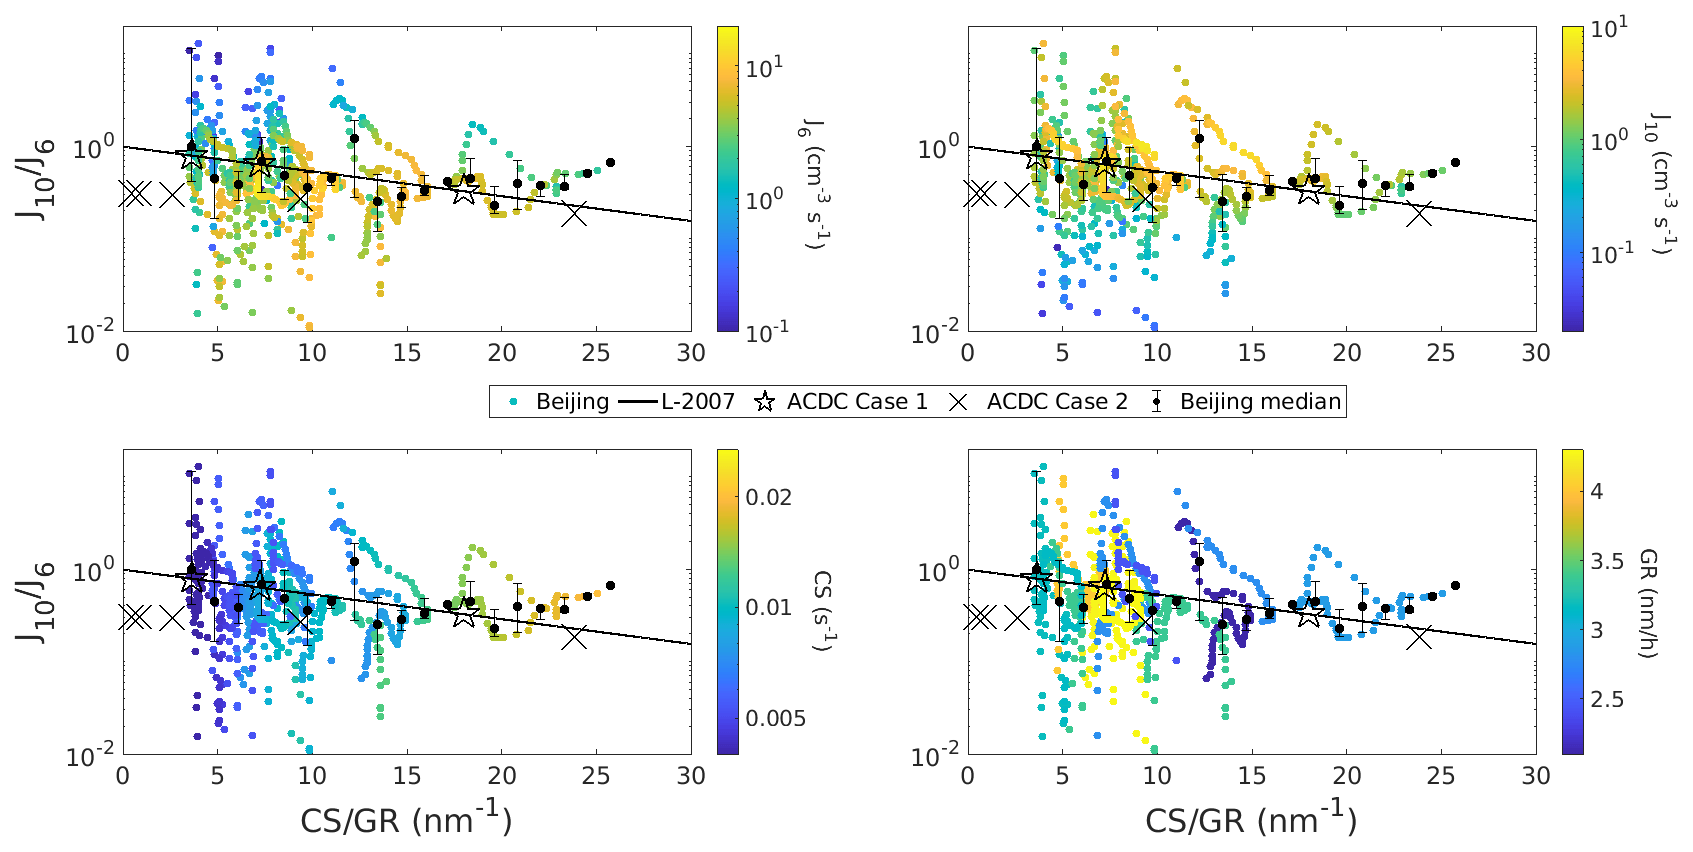
Figure 9Survival probability from 6 to 10 nm () as a function of the ratio of condensation sink and growth rate (CS GR). Survival probabilities from Beijing, China, ACDC model simulations, and the predictions based on the theoretical formulation by Lehtinen et al. (2007) (L-2007) are included. ACDC Case 1 refers to simulations with no collisions between clusters, while in Case 2 simulations, cluster–cluster collisions also occurred. Median values for observed have been determined based on bin division of horizontal values and the quartiles are shown as the error bars. The top left figure is shaded with the J6 while the top right, bottom left, and bottom right are shaded with the J10, the CS, and the GR, respectively.
3.4.2 Survival probabilities and particle growth and losses
Figures 7, 8, and 9 show the observed survival probabilities , , and in Beijing, China, as a function of CS GR. The survival probabilities from the cluster population simulations for both Cases 1 and 2, corresponding to the cases with no collisions between the clusters and including them, are also shown for comparison. Finally, the L-2007 survival probabilities are shown. Figures 7, 8, and 9 also show J, CS, and GR corresponding to the observed survival probabilities. Note that while the CS for ACDC Case 2 represents the background CoagS, and neglects the losses due to coagulation between the clusters, we assume that this does not affect the comparability to the observed survival probabilities since CS in Beijing is mostly governed by accumulation mode particles (Cai et al., 2017b).
A majority of the observed are larger than predicted by the L-2007 and the ACDC Case 1 and Case 2 (Fig. 7). When the ratio CS GR ≈10, the median of the observed , while the ACDC Case 1 and the L-2007 and the ACDC Case 2 . When CS GR ≈20, the corresponding median observed . At a similar CS GR, ACDC Case 1 and L-2007 predict that , and the ACDC Case 2 . At CS GR ≥20, the differences in between the observations and theory are considerably larger than at lower CS GR, and a much higher fraction of the particles appears to grow from 1.5 to 3 nm than what L-2007 or the cluster population simulations predict.
The ACDC Case 1 and the L-2007 have a strong exponential dependency on CS GR, which is not apparent in the observed . While appears to be on average lower when CS GR is higher, the difference is much less than expected. The same is true for ACDC Case 2 . It might be possible that at sufficiently low background CS, the effect of collisions with other small particles considerably decreases the atmospheric , explaining the weak dependency of observed survival probability on CS. However, this would mean that without these additional losses due to coagulation with other small particles, the observed would be even higher at low CS GR, further increasing the disagreement between the theoretical predictions and atmospheric observations. In addition, Xiao et al. (2021) showed that the van der Waals attraction force, which we have not taken into account, enhances GR and leads to a weaker dependency of survival probability on CS, which could in part explain the weak dependency of the observed on CS.
Unlike for , the observed is on average lower than the L-2007 and the ACDC Case 1 (Fig. 8). When CS GR ≈5, L-2007 and the ACDC Case 1 , while most of the observed are lower than that, and the median of the observed . The observed , like , does not show a strong dependency on the ratio CS GR. The ACDC Case 2 values of are smaller than most of the observed ; however, the difference between the observed median and the ACDC Case 2 is mostly within a factor of 2. In addition, the dependency on CS GR is similar both for the observations and for the ACDC Case 2 within the range of relevant values of CS GR. Thus, the observed could be explained quite well by assuming high rates of collisions between sub-10 nm particles when CS GR is relatively low. The median values of the observed are relatively close to the values of based on ACDC Case 1, Case 2, and L-2007 (Fig. 9). However, the observed varies significantly and a notable fraction of the values are above unity. At this size range, particle emissions from traffic can considerably affect the observed J, thereby influencing , as indicated by size-resolved particle number emissions determined for the same measurement station (Kontkanen et al., 2020). We assume that most of the variability in the observed can be explained by some combination of emissions of sub-10 nm particles and measurement inaccuracies and thus our analysis and discussion focus more on and .
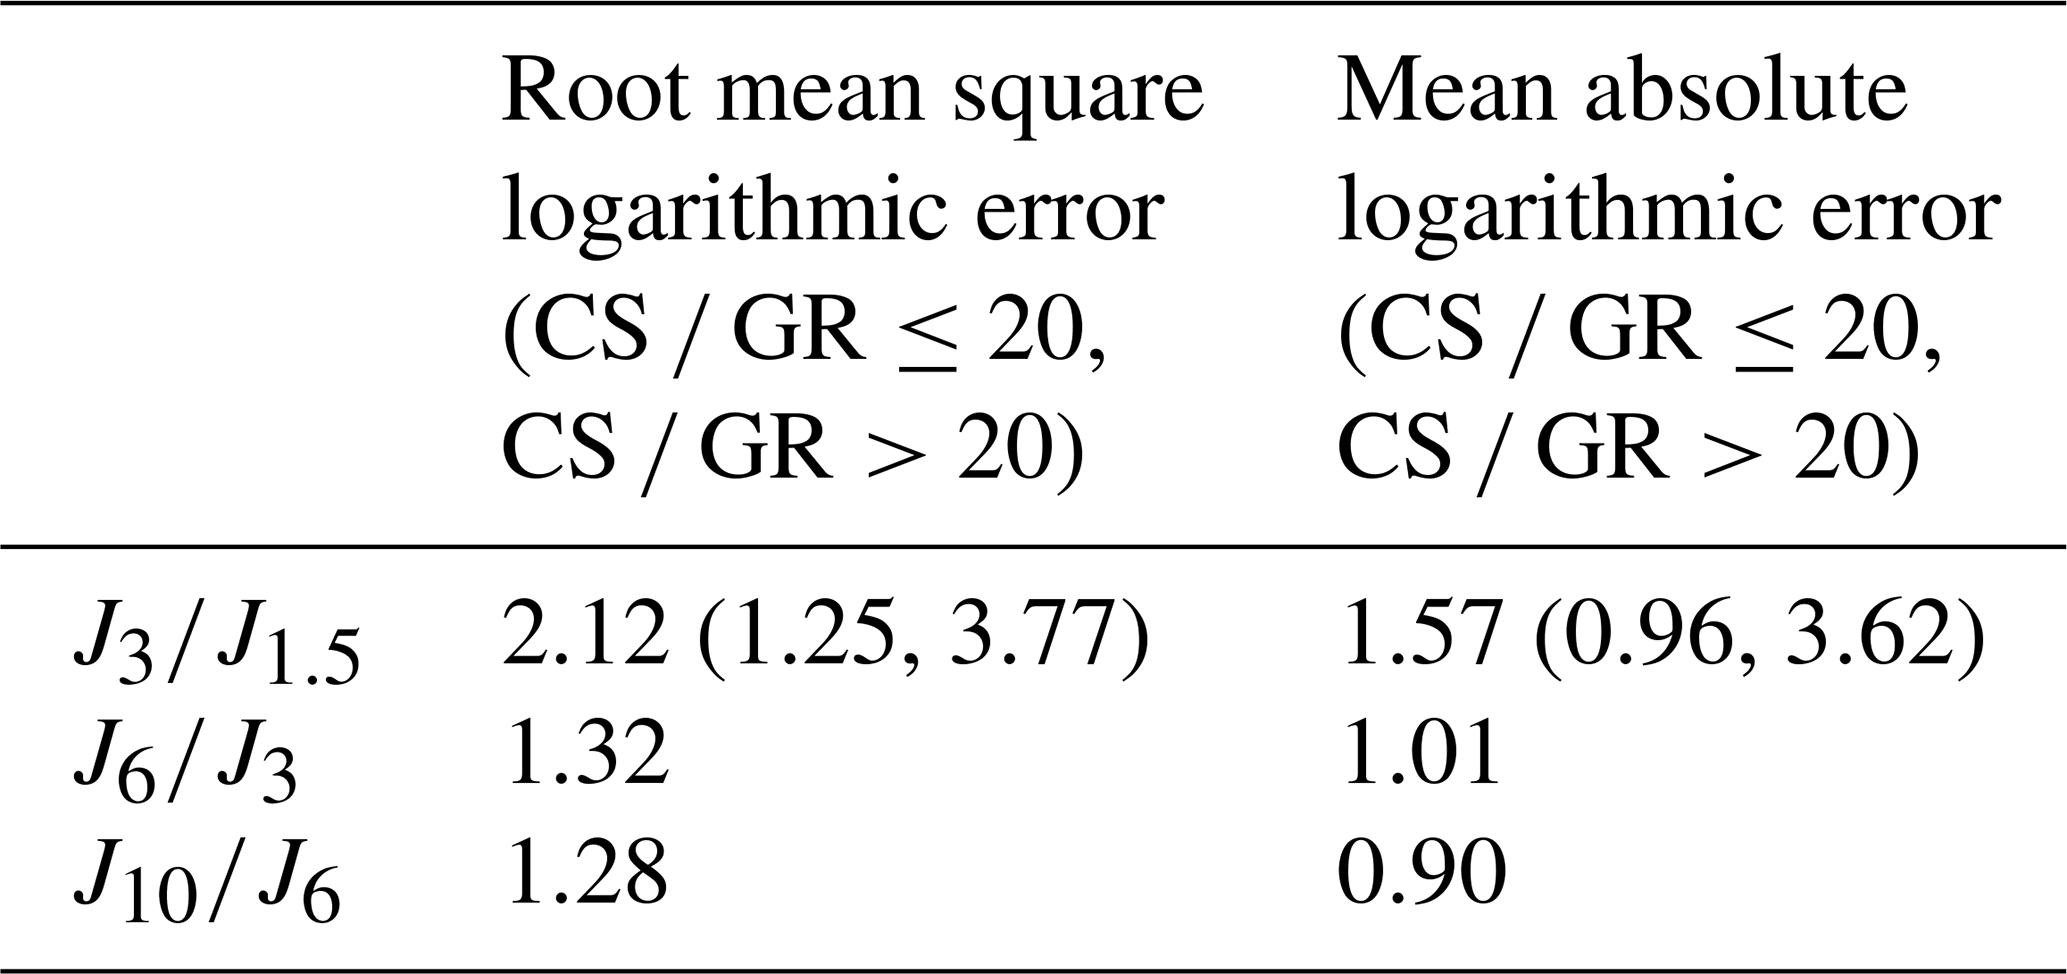
Table 2 shows the root mean square logarithmic error and absolute mean error of the observed survival probabilities to the L-2007 survival probabilities. L-2007 describes the observed best while the disagreement is highest for . It is also clear that L-2007 is closer in describing the observed when CS GR is 20 or lower. It is notable that when CS GR is 20 or lower, is even slightly better predicted by theory than . This is in agreement with Fig. 6, which showed a relatively good agreement between the median NPF day and L-2007.
If we investigate the observed with CS GR >20, which diverges from the predictions the most, we can see that the corresponding values of CS are quite high, while GR values are relatively small (Fig. 7). In addition, the formation rates, especially J1.5, tend to be high. However, with the highest disagreements between the observations and the predictions are mainly characterized by high values of CS. These results indicate that a potential reason for the disagreement between the observed and the predicted is due to CS not corresponding to the actual coagulation scavenging rates during these events. Another explanations for the disagreement could be considerable underestimation of sub-3 nm GR in high CS conditions or inhomogeneities in the particle formation. These will be discussed further in Sect. 3.4.3.
From Fig. 8 we can see that the disagreement between the L-2007, ACDC Case 1, and the observed is largest when CS is low and the disagreement does not seem to vary strongly depending on the value of GR. This supports the possibility of coagulation between sub-10 nm particles at low CS having a considerable effect on the survivability of particles between 3 and 6 nm. However, current research does not support self-coagulation having such a large contribution to the observed values of survival probabilities since the required concentrations of sub-10 nm particles are high (Anttila et al., 2010; Yue et al., 2010). In our simulations, the concentrations of sub-3 nm particles need to exceed 3×106 cm−3 before the values of ACDC Case 2 survival probabilities are considerably lower than the values of ACDC Case 1 and the L-2007 survival probabilities due to cluster–cluster collisions. Based on previous studies, the concentrations of cluster and nucleation mode particles in Beijing during NPF event days are an order of magnitude lower than that (Zhou et al., 2020; Cai et al., 2021b), although the concentrations contain high uncertainties (Kangasluoma et al., 2020). In addition, if self-coagulation of sub-10 nm particles does lower atmospheric survival probabilities, we would assume it to also be evident at smaller sizes. Despite this, it is still possible that self-coagulation does influence the observed survival probabilities to some extent, and more research is needed to quantify the effect of population dynamics such as cluster–cluster collisions on survival probabilities of sub-10 nm particles.
3.4.3 Effect of uncertainties and assumptions on survival probabilities
J, GR, and CS are determined based on measured particle number size distributions. There can be considerable uncertainties in the measured number size distributions, especially at the sub-10 nm size range (Wiedensohler et al., 2012; Kangasluoma et al., 2020). CS in Beijing is dominated by accumulation mode particles and the uncertainty of the measured particle number size distribution in this size range is estimated to be ±10 % (Wiedensohler et al., 2012); thus we assume that the uncertainty in CS is similar. The uncertainty in the measured particle number size distributions of sub-10 nm particles is significantly higher and has been estimated to be ±50 %–70 % (Kangasluoma et al., 2020). As J in Beijing is mainly contributed by the concentration of new particles and CS (Cai and Jiang, 2017), we assume the uncertainty in J to be in the same range. The uncertainty in GR is also high, and we estimate that it can be up to ±100 %. Here, the influence of uncertainties in J, CS, or GR on survival probabilities and their comparison to theoretical predictions are considered. First, we discuss the uncertainties in the formation rates, and their effect on the observed survival probabilities. Then we discuss the uncertainties in CS and GR, and their effect on the comparison of the observed survival probabilities with theoretical survival probability. Figures 10 and 11 show the effect of inaccurate CS and GR, respectively, on the L-2007 survival probabilities.
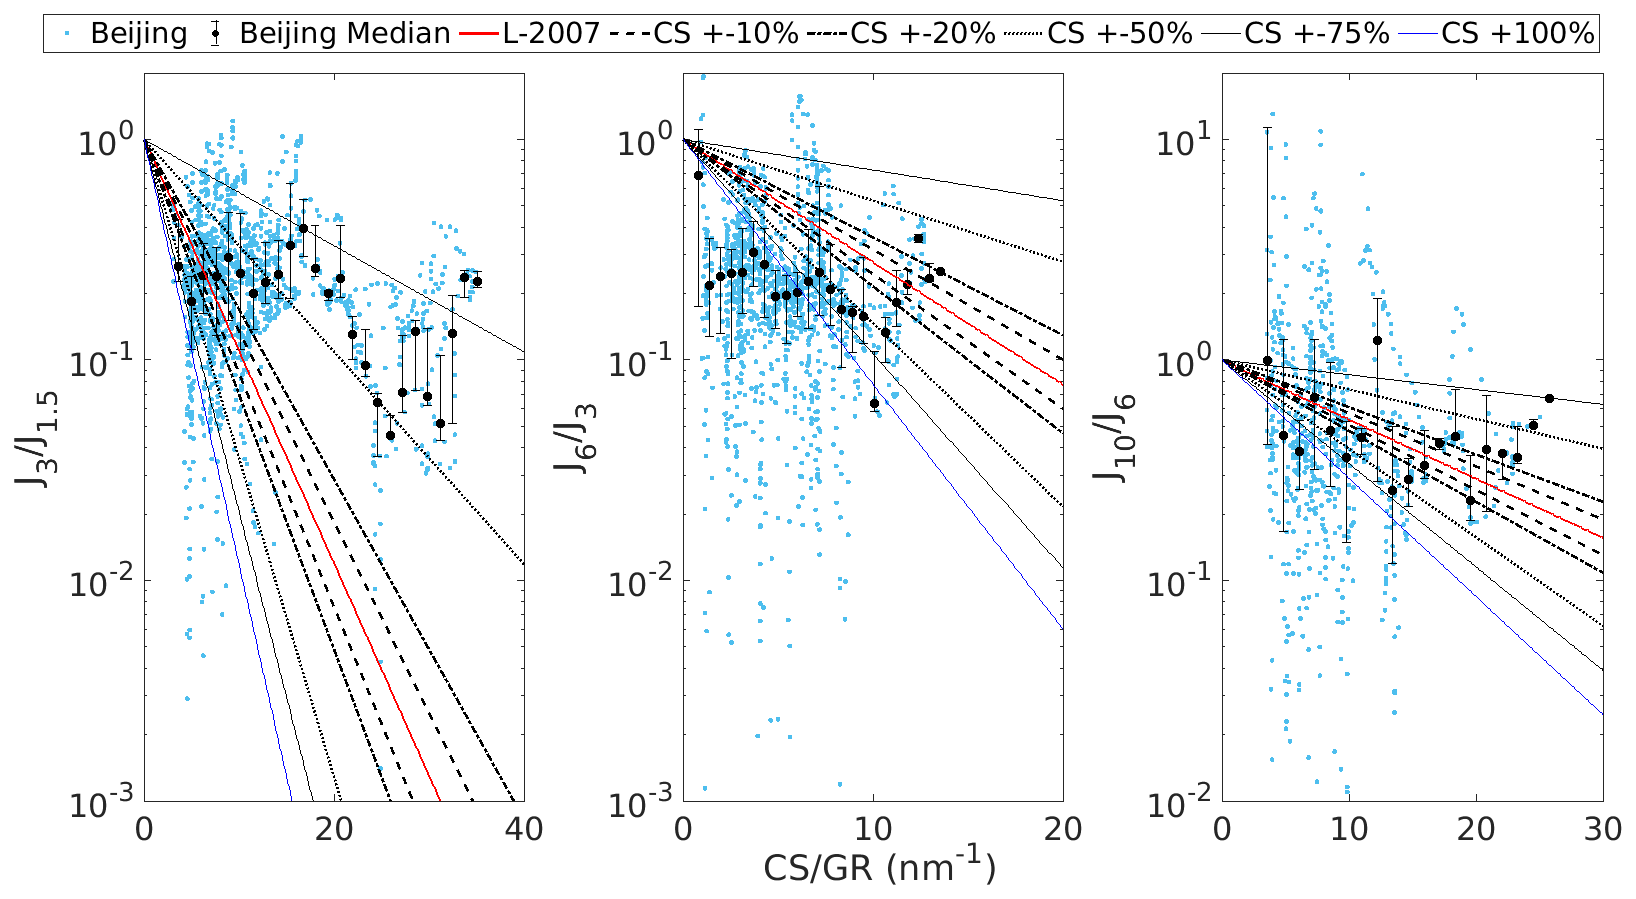
Figure 10Survival probabilities from 1.5 to 3 nm (), from 3 to 6 nm (), and from 6 to 10 nm () as a function of the ratio of condensation sink and growth rate (CS GR). Survival probabilities based on the Lehtinen et al. (2007) (L-2007) equation with varying error of CS are presented. The observed survival probabilities from Beijing, China, are shown with their median values marked in black.
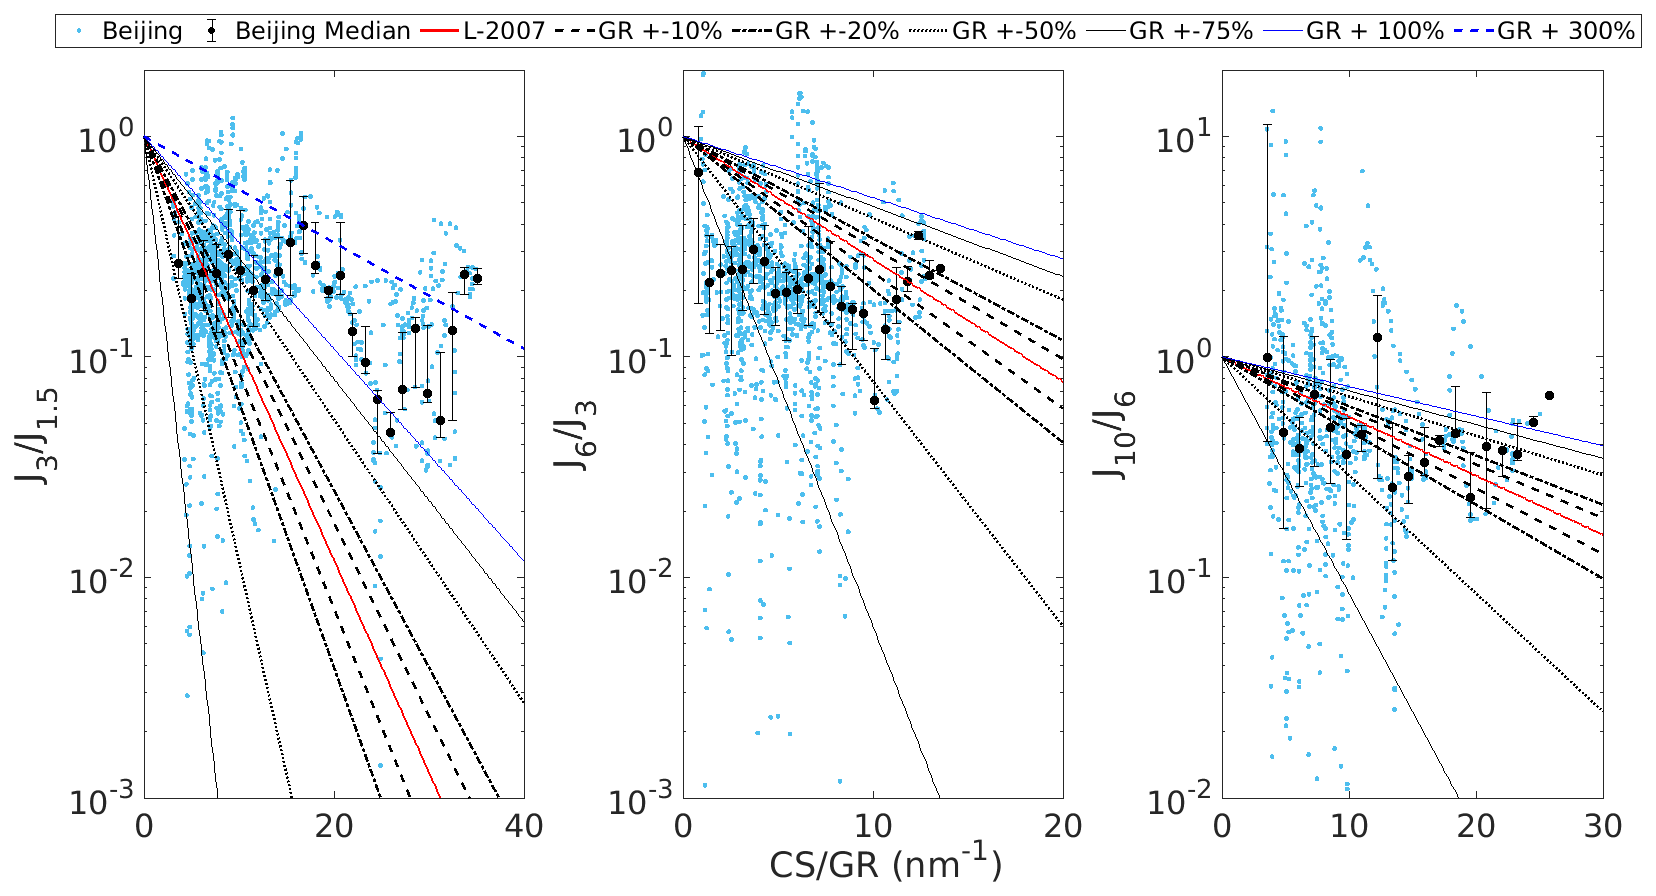
Figure 11Survival probabilities from 1.5 to 3 nm (), from 3 to 6 nm (), and from 6 to 10 nm () as a function of the ratio of condensation sink and growth rate (CS GR). Survival probabilities based on the Lehtinen et al. (2007) equation with varying error of GR are presented. The observed survival probabilities from Beijing, China, are shown with their median values marked in black.
We estimate, based on Kangasluoma et al. (2020), that the uncertainties in J are approximately ±50 %–70 %, increasing with a decreasing particle diameter. At low CS GR, a majority of the observed could thus be explained by uncertainties in J. The observed being on average larger than L-2007 predictions could be due to larger systematic uncertainties in J1.5 compared to J3. However, when CS GR is larger, the observed are up to 2 magnitudes of order higher than the L-2007 predictions, and uncertainties in the observed values of J cannot explain such a discrepancy. Most of the observed values of are approximately 2–4 times lower than the L-2007 predictions, so that while uncertainties in J surely contribute to the variance of the observed and thus have a potentially considerable contribution to the observed discrepancy, they are unlikely to be the only explanation for the latter.
Based on Fig. 10, for at CS GR ≥20 CS must be between 50 % and 75 % lower than assumed to explain the discrepancy between the observed and L-2007 . A large fraction of the observed at CS GR <20 would also require CS to be less than half of the assumed CS to be explained by inaccuracy of CS. Most of the observed at CS GR <20 can be explained if the assumed CS is between 50 % lower and 50 % higher than the true CS. Assuming that the contribution of self-coagulation is minor, to explain most of the observed by inaccuracy of CS, CS must be more than 100 % higher. Thus, we argue that the uncertainty of CS due to the uncertainties in the measured particle concentrations cannot solely explain the observed or .
Figure 11 considers the uncertainty of GR instead of the uncertainty of CS. Most of the observed at CS GR <20 can be explained by GR ±50 %–75 % × GR. However, to explain most of the observed at CS GR ≥20, and a large fraction at CS GR <20, GR would have to be higher by at least 100 % and in some cases up to 300\%̇. Thus, while most of the observed at CS GR <20 can be explained by the uncertainty of GR if GR ±100 % × GR, a much higher uncertainty is needed to explain most of the observed at CS GR ≥20. To explain most of the GR would have to be overestimated by 25 %–75 %. Thus, it is possible that the disagreement between the ACDC Case 1, the L-2007, and the observed is due to the estimated uncertainty of GR. However, due to the higher uncertainty required to explain the observed , and the opposite direction of the required inaccuracies, it appears less likely that the uncertainty of GR could also explain, at least fully, the disagreements between the theoretical and the observed .
CoagS could be overestimated or underestimated if some assumptions made when determining it are inaccurate. We have neglected the enhancement of coagulation due to van der Waals forces, which can result in underestimating CoagS. The van der Waals enhancement factor of CoagS is expected to lie between 1.0 and 2.0 (Kerminen, 1994). While this alone cannot explain the majority of the differences in between observations and predictions (Fig. 10), it could be a partial reason for the observed being lower than those predicted based on ACDC Case 1 and L-2007. In addition, all the collisions between new particles and the background particles are assumed to result in coagulation. However, it is possible that only a fraction of all the collisions lead to coagulation due to, e.g., chemical properties of the particles. This is analogous to the effectiveness of CS in removing condensable vapors such as sulfuric acid (Tuovinen et al., 2021, 2020), which has been shown to be higher for ammonium-nitrate-rich background particles (Du et al., 2022). If the effectiveness of CoagS for particles between 1.5 and 3 nm varies between 0.25 and 1.0, almost all of the observed that are larger than predicted based on the simulations or L-2007 can be explained. However, for ineffective CoagS to explain the observed , the effectiveness of CoagS would have to be strongly size dependent since the observed values of and do not support CoagS being lower than assumed between 3 and 10 nm.
In the atmosphere, conditions are constantly changing. We have assumed that GR is constant throughout the event, which can result in inaccuracies in both CS GR and the survival probabilities themselves. The effects of this assumption on our results are less than straightforward to evaluate. However, in Fig. 7, for example, the highest disagreements between the predicted and the observed are characterized by high CS and thus while the time dependency of GR might contribute to the disagreements between predictions and observations in some way, it cannot explain the large disagreements for at CS GR ≥20. The particle number size distribution of background particles is also constantly changing and while we have accounted for the time dependency of CS we have not considered the time dependency of the parameter m but have assumed a constant m of −1.6. We expect the uncertainty from this assumption to be relatively small (see Fig. 4) and the effect on our main results to be minor.
While NPF events may take place regionally, the air masses where NPF occurs are not completely homogeneous, especially in urban areas with a variety of local emission sources. Because of this the values of CS, GR, and J can have spatial variations. For example, GR could on a local scale be higher or lower than what we determine based on the measured particle number size distributions. This can result in locally higher survival rates of sub-10 nm particles, which could affect the observed survival probabilities due to the increased total concentrations of new particles. Increased GR on a local scale could be due to, e.g., larger concentrations of precursor vapors owing to the proximity to emission sources. Wang et al. (2020) and Marten et al. (2022) showed that new particles can grow very rapidly despite high CS and have survival probabilities close to unity in the presence of gas-phase nitric acid and ammonia under controlled laboratory conditions, which could be relevant for inhomogeneous urban environments with local emission sources such as traffic. Thus, while brief but rapid growth of new particles on a small local scale might have no effect on the observed GR at the measurement location, it could result in significantly higher values of observed survival probabilities causing apparent discrepancy between the observations and theory.
Another factor relevant in urban environments to be considered is the effect of primary particle emissions from traffic on the measured particle number size distributions. Traffic emissions have been shown to significantly contribute to number concentrations of particles as small as below 3 nm in diameter (Rönkkö et al., 2017). However, Deng et al. (2022) showed that the influence of traffic emissions on the concentration of sub-3 nm particles at the observation site is negligible compared to the influence of NPF. Thus, the effect of primary particle and cluster emissions from traffic on is likely minor.
We note that it should be considered when interpreting our results that we are only able to observe NPF events when both the survival probabilities and the formation rates themselves are sufficiently high. Thus, it is likely that our results are biased toward higher survival probability values, which could make the discrepancy between the observed and the predicted appear more significant. If we were also able to accurately describe the growth and formation rates of sub-10 nm particles outside these events, we would have a more complete picture of survival probabilities and their dependency on coagulation scavenging and particle growth rates in urban Beijing.
Table 2Root mean square logarithmic error and mean absolute logarithmic error between the observed survival probabilities from 1.5 to 3 nm (), from 3 to 6 nm (), and from 6 to 10 nm () in Beijing, China and theoretical predictions based on formulation by Lehtinen et al. (2007).
We compared cluster or aerosol particle survival probabilities from 1.5 to 3 nm (), from 3 to 6 nm (), and from 6 to 10 nm () between predictions based on analytical formulae, cluster population simulations using Atmospheric Cluster Dynamics Code (ACDC), and observations in Beijing, China, and discussed possible reasons for the corresponding differences. The survival probabilities based on theory and the cluster population simulations agree relatively well for all of the three size ranges if no cluster–cluster collisions occur in the simulations or if their contribution to growth and losses of clusters are negligible. However, if CS is low, the inclusion of cluster–cluster collisions in the cluster population simulations results in significantly lower survival probabilities for all the investigated size ranges, and in a weaker dependency of the survival probability on CS due to the increased loss rate of clusters and particles.
A majority of the observed values of are higher than those obtained from the cluster population simulations or based on analytical formulae, and the largest discrepancies were observed at high values of CS. At low CS GR a majority of the observed values of can be explained if uncertainties in CS GR reach approximately ±75 %, a reasonable estimate for an error in atmospheric CS GR. However, at higher CS GR the value of CS needs to be lower by more than 50 % or the value of GR needs to be higher by more than 100 % to explain the observed values of . Unlike for , a majority of the observed are lower than theoretical and the discrepancy is even higher than for when CS is low. The disagreement between the theoretical and the observed can be explained if CS is underestimated by more than 100 % or if GR is overestimated by approximately 25 %–75 %. However, the observed and from the cluster population simulations with cluster–cluster collisions are closer, mostly within a factor of 2 from each other. The median values of the observed are relatively close to the theoretical values and to from the cluster population simulations, both with or without cluster–cluster collisions. However, the variance of these values is high, which we attribute both to measurement uncertainties and to the influence of emissions of sub-10 nm particles to the observed formation rates. Thus, only the survival probability from 1.5 to 3 nm appears to be on average higher than predicted under high CS, while the survival probabilities between larger sizes did not show a similar trend.
Based on our results it appears unlikely that the effect of cluster–cluster collisions on survival probability explains the observed discrepancies between theory and observations. However, more research is needed to quantify the role of complex dynamic interactions between sub-10 nm particles on survival probability. A reasonable overestimation within the limits of estimated uncertainties in GR can potentially explain the observed values of if the influence of cluster–cluster collisions is assumed to be negligible. While a large fraction of the observed values of can be explained by the uncertainties of measured CS and GR, it seems probable that at high CS conditions, other factors also contribute to the observed survival probabilities. Possible explanations for the observed values of under high background particle concentrations include overestimation of CS due to ineffective coagulation scavenging of sub-3 nm particles, or strongly enhanced growth of sub-3 nm particles on a local scale, which is not visible in the observed GR at the measurement location. More research is still required to determine the mechanisms behind enhanced survival probability of sub-3 nm particles in polluted conditions.
Simulation datasets and the observed survival probabilities, along with the corresponding CS and GR, are available at https://doi.org/10.5281/zenodo.7247561 (Tuovinen, 2022).
The supplement related to this article is available online at: https://doi.org/10.5194/acp-22-15071-2022-supplement.
JK conceptualized the original idea. ST performed the analysis with help from JK, RC, VMK, and MK. CY, MK, and JJ collected the data. ST prepared and edited the manuscript with contributions from all co-authors.
At least one of the (co-)authors is a member of the editorial board of Atmospheric Chemistry and Physics. The peer-review process was guided by an independent editor, and the authors also have no other competing interests to declare.
Publisher's note: Copernicus Publications remains neutral with regard to jurisdictional claims in published maps and institutional affiliations.
We acknowledge the following projects: ACCC Flagship funded by the Academy of Finland grant number 337549, Academy professorship funded by the Academy of Finland (grant no. 302958), Academy of Finland project nos. 1325656, 311932, 316114, 332547,325647, and 332547; “Quantifying carbon sink, CarbonSink+ and their interaction with air quality” INAR project funded by Jane and Aatos Erkko Foundation, European Research Council (ERC) project ATM-GTP Contract No. 742206. Technical and scientific staff in Beijing, AHL/BUCT laboratory are acknowledged.
This research has been supported by the Academy of Finland (grant nos. 337549, 302958, 1325656, 311932, 316114, 332547, 325647, and 332547), the European Research Council, H2020 European Research Council (ATM-GTP (grant no. 742206)), and the Jane ja Aatos Erkon Säätiö (Quantifying carbon sink, CarbonSink+ and their interaction with air quality).
Open-access funding was provided by the Helsinki University Library.
This paper was edited by Markus Petters and reviewed by two anonymous referees.
Anttila, T., Kerminen, V.-M., and Lehtinen, K. E. J.: Parameterizing the formation rate of new particles: The effect of nuclei self-coagulation, J. Aerosol Sci., 41, 621–636, https://doi.org/10.1016/j.jaerosci.2010.04.008, 2010.
Apsokardu, M. J. and Johnston, M. V.: Nanoparticle growth by particle-phase chemistry, Atmos. Chem. Phys., 18, 1895–1907, https://doi.org/10.5194/acp-18-1895-2018, 2018.
Bellouin, N., Quaas, J., Gryspeerdt, E., Kinne, S., Stier, P., Watson-Parris, D., Boucher, O., Carslaw, K. S., Christensen, M., Daniau, A. -L., Dufresne, J. -L., Feingold, G., Fiedler, S., Forster, P., Gettelman, A., Haywood, J. M., Lohmann, U., Malavelle, F., Mauritsen, T., McCoy, D. T., Myhre, G., Mülmenstädt, J., Neubauer, D., Possner, A., Rugenstein, M., Sato, Y., Schulz, M., Schwartz, S. E., Sourdeval, O., Storelvmo, T., Toll, V., Winker, D., and Stevens, B.: Bounding Global Aerosol Radiative Forcing of Climate Change, Rev. Geophys., 58, e2019RG000660, https://doi.org/10.1029/2019RG000660, 2020.
Cai, R. and Jiang, J.: A new balance formula to estimate new particle formation rate: reevaluating the effect of coagulation scavenging, Atmos. Chem. Phys., 17, 12659–12675, https://doi.org/10.5194/acp-17-12659-2017, 2017.
Cai, R., Chen, D.-R., Hao, J., and Jiang, J.: A miniature cylindrical differential mobility analyzer for sub-3 nm particle sizing, J. Aerosol Sci., 106, 111–119, https://doi.org/10.1016/j.jaerosci.2017.01.004, 2017a.
Cai, R., Yang, D., Fu, Y., Wang, X., Li, X., Ma, Y., Hao, J., Zheng, J., and Jiang, J.: Aerosol surface area concentration: a governing factor in new particle formation in Beijing, Atmos. Chem. Phys., 17, 12327–12340, https://doi.org/10.5194/acp-17-12327-2017, 2017b.
Cai, R., Li, C., He, X.-C., Deng, C., Lu, Y., Yin, R., Yan, C., Wang, L., Jiang, J., Kulmala, M., and Kangasluoma, J.: Impacts of coagulation on the appearance time method for new particle growth rate evaluation and their corrections, Atmos. Chem. Phys., 21, 2287–2304, https://doi.org/10.5194/acp-21-2287-2021, 2021a.
Cai, R., Yan, C., Yang, D., Yin, R., Lu, Y., Deng, C., Fu, Y., Ruan, J., Li, X., Kontkanen, J., Zhang, Q., Kangasluoma, J., Ma, Y., Hao, J., Worsnop, D. R., Bianchi, F., Paasonen, P., Kerminen, V.-M., Liu, Y., Wang, L., Zheng, J., Kulmala, M., and Jiang, J.: Sulfuric acid–amine nucleation in urban Beijing, Atmos. Chem. Phys., 21, 2457–2468, https://doi.org/10.5194/acp-21-2457-2021, 2021b.
Cai, R., Deng, C., Stolzenburg, D., Li, C., Guo, J., Kerminen, V.-M., Jiang, J., Kulmala, M., and Kangasluoma, J.: Survival probability of atmospheric new particles: closure between theory and measurements from 1.4 to 100 nm, Atmos. Chem. Phys. Discuss. [preprint], https://doi.org/10.5194/acp-2022-476, in review, 2022.
Chu, B., Kerminen, V.-M., Bianchi, F., Yan, C., Petäjä, T., and Kulmala, M.: Atmospheric new particle formation in China, Atmos. Chem. Phys., 19, 115–138, https://doi.org/10.5194/acp-19-115-2019, 2019.
Dal Maso, M., Kulmala, M., Lehtinen, K. E. J., Mäkelä, J. M., Aalto, P., and O'Dowd, C. D.: Condensation and coagulation sinks and formation of nucleation mode particles in coastal and boreal forest boundary layers, J. Geophys. Res.-Atmos., 107, PAR 2-1–PAR 2-10, https://doi.org/10.1029/2001JD001053, 2002.
Dal Maso, M., Kulmala, M., Riipinen, I., Wagner, R., Hussein, T., Aalto, P. P., and Lehtinen, K. E. J.: Formation and growth of fresh atmospheric aerosols: eight years of aerosol size distribution data from SMEAR II, Hyytiälä, Finland, Boreal Environ. Res., 10, 15, 2005.
Deng, C., Fu, Y., Dada, L., Yan, C., Cai, R., Yang, D., Zhou, Y., Yin, R., Lu, Y., Li, X., Qiao, X., Fan, X., Nie, W., Kontkanen, J., Kangasluoma, J., Chu, B., Ding, A., Kerminen, V.-M., Paasonen, P., Worsnop, D. R., Bianchi, F., Liu, Y., Zheng, J., Wang, L., Kulmala, M., and Jiang, J.: Seasonal Characteristics of New Particle Formation and Growth in Urban Beijing, Environ. Sci. Technol., 54, 8547–8557, https://doi.org/10.1021/acs.est.0c00808, 2020.
Deng, C., Li, Y., Yan, C., Wu, J., Cai, R., Wang, D., Liu, Y., Kangasluoma, J., Kerminen, V.-M., Kulmala, M., and Jiang, J.: Measurement report: Size distributions of urban aerosols down to 1 nm from long-term measurements, Atmos. Chem. Phys., 22, 13569–13580, https://doi.org/10.5194/acp-22-13569-2022, 2022.
Du, W., Cai, J., Zheng, F., Yan, C., Zhou, Y., Guo, Y., Chu, B., Yao, L., Heikkinen, L. M., Fan, X., Wang, Y., Cai, R., Hakala, S., Chan, T., Kontkanen, J., Tuovinen, S., Petäjä, T., Kangasluoma, J., Bianchi, F., Paasonen, P., Sun, Y., Kerminen, V.-M., Liu, Y., Daellenbach, K. R., Dada, L., and Kulmala, M.: Influence of Aerosol Chemical Composition on Condensation Sink Efficiency and New Particle Formation in Beijing, Environ. Sci. Technol. Lett., 9, 375–382, https://doi.org/10.1021/acs.estlett.2c00159, 2022.
Fuchs, N. A. and Sutugin, A. G.: Highly dispersed aerosols, in: Topics in Current Aerosol Research, vol. 2, edited by: Hidy, G. M. and Brock, J. R., Pergamon, 1971.
Guo, S., Hu, M., Zamora, M. L., Peng, J., Shang, D., Zheng, J., Du, Z., Wu, Z., Shao, M., Zeng, L., Molina, M. J., and Zhang, R.: Elucidating severe urban haze formation in China, P. Natl. Acad. Sci. USA, 111, 17373–17378, https://doi.org/10.1073/pnas.1419604111, 2014.
Jen, C. N., McMurry, P. H., and Hanson, D. R.: Stabilization of sulfuric acid dimers by ammonia, methylamine, dimethylamine, and trimethylamine, J. Geophys. Res. Atmos., 119, 7502–7514, https://doi.org/10.1002/2014JD021592, 2014.
Jiang, J., Chen, M., Kuang, C., Attoui, M., and McMurry, P. H.: Electrical Mobility Spectrometer Using a Diethylene Glycol Condensation Particle Counter for Measurement of Aerosol Size Distributions Down to 1 nm, Aerosol. Sci. Technol., 45, 510–521, https://doi.org/10.1080/02786826.2010.547538, 2011.
Kangasluoma, J., Cai, R., Jiang, J., Deng, C., Stolzenburg, D., Ahonen, L. R., Chan, T., Fu, Y., Kim, C., Laurila, T. M., Zhou, Y., Dada, L., Sulo, J., Flagan, R. C., Kulmala, M., Petäjä, T., and Lehtipalo, K.: Overview of measurements and current instrumentation for 1–10 nm aerosol particle number size distributions, J. Aerosol Sci., 148, 105584, https://doi.org/10.1016/j.jaerosci.2020.105584, 2020.
Kerminen, V.-M.: Simulation of Brownian Coagulation in the Presence of van der Waals Forces and Viscous Interactions, Aerosol Sci. Technol., 20, 207–214, https://doi.org/10.1080/02786829408959677, 1994.
Kerminen, V.-M. and Kulmala, M.: Analytical formulae connecting the “real” and the “apparent” nucleation rate and the nuclei number concentration for atmospheric nucleation events, J. Aerosol Sci., 33, 609–622, https://doi.org/10.1016/S0021-8502(01)00194-X, 2002.
Kerminen, V.-M., Chen, X., Vakkari, V., Petäjä, T., Kulmala, M., and Bianchi, F.: Atmospheric new particle formation and growth: review of field observations, Environ. Res. Lett., 13, 103003, https://doi.org/10.1088/1748-9326/aadf3c, 2018.
Kontkanen, J., Olenius, T., Kulmala, M., and Riipinen, I.: Exploring the potential of nano-Köhler theory to describe the growth of atmospheric molecular clusters by organic vapors using cluster kinetics simulations, Atmos. Chem. Phys., 18, 13733–13754, https://doi.org/10.5194/acp-18-13733-2018, 2018.
Kontkanen, J., Deng, C., Fu, Y., Dada, L., Zhou, Y., Cai, J., Daellenbach, K. R., Hakala, S., Kokkonen, T. V., Lin, Z., Liu, Y., Wang, Y., Yan, C., Petäjä, T., Jiang, J., Kulmala, M., and Paasonen, P.: Size-resolved particle number emissions in Beijing determined from measured particle size distributions, Atmos. Chem. Phys., 20, 11329–11348, https://doi.org/10.5194/acp-20-11329-2020, 2020.
Kontkanen, J., Stolzenburg, D., Olenius, T., Yan, C., Dada, L., Ahonen, L., Simon, M., Lehtipalo, K., and Riipinen, I.: What controls the observed size-dependency of the growth rates of sub-10 nm atmospheric particles?, Environ. Sci.-Atmos., 2, 449–468, https://doi.org/10.1039/D1EA00103E, 2022.
Korhonen, H., Kerminen, V.-M., Kokkola, H., and Lehtinen, K. E. J.: Estimating atmospheric nucleation rates from size distribution measurements: Analytical equations for the case of size dependent growth rates, J. Aerosol Sci., 69, 13–20, https://doi.org/10.1016/j.jaerosci.2013.11.006, 2014.
Kulmala, M., Maso, M. D., Mäkelä, J. M., Pirjola, L., Väkevä, M., Aalto, P., Miikkulainen, P., Hämeri, K., and O'dowd, C. D.: On the formation, growth and composition of nucleation mode particles, Tellus B, 53, 479–490, https://doi.org/10.1034/j.1600-0889.2001.530411.x, 2001.
Kulmala, M., Petäjä, T., Mönkkönen, P., Koponen, I. K., Dal Maso, M., Aalto, P. P., Lehtinen, K. E. J., and Kerminen, V.-M.: On the growth of nucleation mode particles: source rates of condensable vapor in polluted and clean environments, Atmos. Chem. Phys., 5, 409–416, https://doi.org/10.5194/acp-5-409-2005, 2005.
Kulmala, M., Petäjä, T., Nieminen, T., Sipilä, M., Manninen, H. E., Lehtipalo, K., Dal Maso, M., Aalto, P. P., Junninen, H., Paasonen, P., Riipinen, I., Lehtinen, K. E. J., Laaksonen, A., and Kerminen, V.-M.: Measurement of the nucleation of atmospheric aerosol particles, Nat. Protoc., 7, 1651–1667, https://doi.org/10.1038/nprot.2012.091, 2012.
Kulmala, M., Kerminen, V.-M., Petäjä, T., Ding, A. J., and Wang, L.: Atmospheric gas-to-particle conversion: why NPF events are observed in megacities?, Faraday Discuss., 200, 271–288, https://doi.org/10.1039/C6FD00257A, 2017.
Kulmala, M., Dada, L., Daellenbach, K. R., Yan, C., Stolzenburg, D., Kontkanen, J., Ezhova, E., Hakala, S., Tuovinen, S., Kokkonen, T. V., Kurppa, M., Cai, R., Zhou, Y., Yin, R., Baalbaki, R., Chan, T., Chu, B., Deng, C., Fu, Y., Ge, M., He, H., Heikkinen, L., Junninen, H., Liu, Y., Lu, Y., Nie, W., Rusanen, A., Vakkari, V., Wang, Y., Yang, G., Yao, L., Zheng, J., Kujansuu, J., Kangasluoma, J., Petäjä, T., Paasonen, P., Järvi, L., Worsnop, D., Ding, A., Liu, Y., Wang, L., Jiang, J., Bianchi, F., and Kerminen, V.-M.: Is reducing new particle formation a plausible solution to mitigate particulate air pollution in Beijing and other Chinese megacities?, Faraday Discuss., 226, 334–347, https://doi.org/10.1039/D0FD00078G, 2021.
Kulmala, M., Cai, R., Stolzenburg, D., Zhou, Y., Dada, L., Guo, Y., Yan, C., Petäjä, T., Jiang, J., and Kerminen, V.-M.: The contribution of new particle formation and subsequent growth to haze formation, Environ. Sci.-Atmos., 2, 352–361, https://doi.org/10.1039/D1EA00096A, 2022.
Kürten, A., Jokinen, T., Simon, M., Sipilä, M., Sarnela, N., Junninen, H., Adamov, A., Almeida, J., Amorim, A., Bianchi, F., Breitenlechner, M., Dommen, J., Donahue, N. M., Duplissy, J., Ehrhart, S., Flagan, R. C., Franchin, A., Hakala, J., Hansel, A., Heinritzi, M., Hutterli, M., Kangasluoma, J., Kirkby, J., Laaksonen, A., Lehtipalo, K., Leiminger, M., Makhmutov, V., Mathot, S., Onnela, A., Petäjä, T., Praplan, A. P., Riccobono, F., Rissanen, M. P., Rondo, L., Schobesberger, S., Seinfeld, J. H., Steiner, G., Tomé, A., Tröstl, J., Winkler, P. M., Williamson, C., Wimmer, D., Ye, P., Baltensperger, U., Carslaw, K. S., Kulmala, M., Worsnop, D. R., and Curtius, J.: Neutral molecular cluster formation of sulfuric acid–dimethylamine observed in real time under atmospheric conditions, P. Natl. Acad. Sci. USA, 111, 15019–15024, https://doi.org/10.1073/pnas.1404853111, 2014.
Lehtinen, K. E. J., Dal Maso, M., Kulmala, M., and Kerminen, V.-M.: Estimating nucleation rates from apparent particle formation rates and vice versa: Revised formulation of the Kerminen–Kulmala equation, J. Aerosol Sci., 38, 988–994, https://doi.org/10.1016/j.jaerosci.2007.06.009, 2007.
Lehtipalo, K., Leppä, J., Kontkanen, J., Kangasluoma, J., Franchin, A., Wimmer, D., Schobesberger, S., Junninen, H., Petäjä, T., Sipilä, M., Mikkilä, J., Vanhanen, J., Worsnop, D. R., and Kulmala, M.: Methods for determining particle size distribution and growth rates between 1 and 3 nm using the Particle Size Magnifier, Boreal Env. Res., 19, 215–236, 2014.
Lehtipalo, K., Rondo, L., Kontkanen, J., Schobesberger, S., Jokinen, T., Sarnela, N., Kürten, A., Ehrhart, S., Franchin, A., Nieminen, T., Riccobono, F., Sipilä, M., Yli-Juuti, T., Duplissy, J., Adamov, A., Ahlm, L., Almeida, J., Amorim, A., Bianchi, F., Breitenlechner, M., Dommen, J., Downard, A. J., Dunne, E. M., Flagan, R. C., Guida, R., Hakala, J., Hansel, A., Jud, W., Kangasluoma, J., Kerminen, V.-M., Keskinen, H., Kim, J., Kirkby, J., Kupc, A., Kupiainen-Määttä, O., Laaksonen, A., Lawler, M. J., Leiminger, M., Mathot, S., Olenius, T., Ortega, I. K., Onnela, A., Petäjä, T., Praplan, A., Rissanen, M. P., Ruuskanen, T., Santos, F. D., Schallhart, S., Schnitzhofer, R., Simon, M., Smith, J. N., Tröstl, J., Tsagkogeorgas, G., Tomé, A., Vaattovaara, P., Vehkamäki, H., Vrtala, A. E., Wagner, P. E., Williamson, C., Wimmer, D., Winkler, P. M., Virtanen, A., Donahue, N. M., Carslaw, K. S., Baltensperger, U., Riipinen, I., Curtius, J., Worsnop, D. R., and Kulmala, M.: The effect of acid–base clustering and ions on the growth of atmospheric nano-particles, Nat. Commun., 7, 11594, https://doi.org/10.1038/ncomms11594, 2016.
Li, X., Zhao, B., Zhou, W., Shi, H., Yin, R., Cai, R., Yang, D., Dällenbach, K., Deng, C., Fu, Y., Qiao, X., Wang, L., Liu, Y., Yan, C., Kulmala, M., Zheng, J., Hao, J., Wang, S., and Jiang, J.: Responses of gaseous sulfuric acid and particulate sulfate to reduced SO2 concentration: A perspective from long-term measurements in Beijing, Sci. Total Environ., 721, 137700, https://doi.org/10.1016/j.scitotenv.2020.137700, 2020.
Liu, J., Jiang, J., Zhang, Q., Deng, J., and Hao, J.: A spectrometer for measuring particle size distributions in the range of 3 nm to 10 µm, Front. Environ. Sci. Eng., 10, 63–72, https://doi.org/10.1007/s11783-014-0754-x, 2016.
Lu, Y., Yan, C., Fu, Y., Chen, Y., Liu, Y., Yang, G., Wang, Y., Bianchi, F., Chu, B., Zhou, Y., Yin, R., Baalbaki, R., Garmash, O., Deng, C., Wang, W., Liu, Y., Petäjä, T., Kerminen, V.-M., Jiang, J., Kulmala, M., and Wang, L.: A proxy for atmospheric daytime gaseous sulfuric acid concentration in urban Beijing, Atmos. Chem. Phys., 19, 1971–1983, https://doi.org/10.5194/acp-19-1971-2019, 2019.
Marten, R., Xiao, M., Rörup, B., Wang, M., Kong, W., He, X.-C., Stolzenburg, D., Pfeifer, J., Marie, G., S. Wang, D., Scholz, W., Baccarini, A., Ping Lee, C., Amorim, A., Baalbaki, R., M. Bell, D., Bertozzi, B., Caudillo, L., Chu, B., Dada, L., Duplissy, J., Finkenzeller, H., Gonzalez Carracedo, L., Granzin, M., Hansel, A., Heinritzi, M., Hofbauer, V., Kemppainen, D., Kürten, A., Lampimäki, M., Lehtipalo, K., Makhmutov, V., E. Manninen, H., Mentler, B., Petäjä, T., Philippov, M., Shen, J., Simon, M., Stozhkov, Y., Tomé, A., C. Wagner, A., Wang, Y., K. Weber, S., Wu, Y., Zauner-Wieczorek, M., Curtius, J., Kulmala, M., Möhler, O., Volkamer, R., M. Winkler, P., R. Worsnop, D., Dommen, J., C. Flagan, R., Kirkby, J., M. Donahue, N., Lamkaddam, H., Baltensperger, U., and Haddad, I. E.: Survival of newly formed particles in haze conditions, Environ. Sci.-Atmos., 2, 491–499, https://doi.org/10.1039/D2EA00007E, 2022.
McGrath, M. J., Olenius, T., Ortega, I. K., Loukonen, V., Paasonen, P., Kurtén, T., Kulmala, M., and Vehkamäki, H.: Atmospheric Cluster Dynamics Code: a flexible method for solution of the birth-death equations, Atmos. Chem. Phys., 12, 2345–2355, https://doi.org/10.5194/acp-12-2345-2012, 2012.
Nieminen, T., Lehtinen, K. E. J., and Kulmala, M.: Sub-10 nm particle growth by vapor condensation – effects of vapor molecule size and particle thermal speed, Atmos. Chem. Phys., 10, 9773–9779, https://doi.org/10.5194/acp-10-9773-2010, 2010.
Olenius, T. and Riipinen, I.: Molecular-resolution simulations of new particle formation: Evaluation of common assumptions made in describing nucleation in aerosol dynamics models, Aerosol Sci. Technol., 51, 397–408, https://doi.org/10.1080/02786826.2016.1262530, 2017.
Olenius, T., Riipinen, I., Lehtipalo, K., and Vehkamäki, H.: Growth rates of atmospheric molecular clusters based on appearance times and collision–evaporation fluxes: Growth by monomers, J. Aerosol Sci., 78, 55–70, https://doi.org/10.1016/j.jaerosci.2014.08.008, 2014.
Pierce, J. R. and Adams, P. J.: Efficiency of cloud condensation nuclei formation from ultrafine particles, Atmos. Chem. Phys., 7, 1367–1379, https://doi.org/10.5194/acp-7-1367-2007, 2007.
Pöschl, U.: Atmospheric Aerosols: Composition, Transformation, Climate and Health Effects, Angewandte Chemie International Edition, 44, 7520–7540, https://doi.org/10.1002/anie.200501122, 2005.
Rönkkö, T., Kuuluvainen, H., Karjalainen, P., Keskinen, J., Hillamo, R., Niemi, J. V., Pirjola, L., Timonen, H. J., Saarikoski, S., Saukko, E., Järvinen, A., Silvennoinen, H., Rostedt, A., Olin, M., Yli-Ojanperä, J., Nousiainen, P., Kousa, A., and Dal Maso, M.: Traffic is a major source of atmospheric nanocluster aerosol, P. Natl. Acad. Sci. USA, 114, 7549–7554, https://doi.org/10.1073/pnas.1700830114, 2017.
Rosenfeld, D., Sherwood, S., Wood, R., and Donner, L.: Climate Effects of Aerosol-Cloud Interactions, Science, 343, 379–380, https://doi.org/10.1126/science.1247490, 2014.
Shiraiwa, M., Ueda, K., Pozzer, A., Lammel, G., Kampf, C. J., Fushimi, A., Enami, S., Arangio, A. M., Fröhlich-Nowoisky, J., Fujitani, Y., Furuyama, A., Lakey, P. S. J., Lelieveld, J., Lucas, K., Morino, Y., Pöschl, U., Takahama, S., Takami, A., Tong, H., Weber, B., Yoshino, A., and Sato, K.: Aerosol Health Effects from Molecular to Global Scales, Environ. Sci. Technol., 51, 13545–13567, https://doi.org/10.1021/acs.est.7b04417, 2017.
Sihto, S.-L., Kulmala, M., Kerminen, V.-M., Dal Maso, M., Petäjä, T., Riipinen, I., Korhonen, H., Arnold, F., Janson, R., Boy, M., Laaksonen, A., and Lehtinen, K. E. J.: Atmospheric sulphuric acid and aerosol formation: implications from atmospheric measurements for nucleation and early growth mechanisms, Atmos. Chem. Phys., 6, 4079–4091, https://doi.org/10.5194/acp-6-4079-2006, 2006.
Spracklen, D. V., Carslaw, K. S., Kulmala, M., Kerminen, V.-M., Sihto, S.-L., Riipinen, I., Merikanto, J., Mann, G. W., Chipperfield, M. P., Wiedensohler, A., Birmili, W., and Lihavainen, H.: Contribution of particle formation to global cloud condensation nuclei concentrations, Geophys. Res. Lett., 35, L06808, https://doi.org/10.1029/2007GL033038, 2008.
Spracklen, D. V., Carslaw, K. S., Merikanto, J., Mann, G. W., Reddington, C. L., Pickering, S., Ogren, J. A., Andrews, E., Baltensperger, U., Weingartner, E., Boy, M., Kulmala, M., Laakso, L., Lihavainen, H., Kivekäs, N., Komppula, M., Mihalopoulos, N., Kouvarakis, G., Jennings, S. G., O'Dowd, C., Birmili, W., Wiedensohler, A., Weller, R., Gras, J., Laj, P., Sellegri, K., Bonn, B., Krejci, R., Laaksonen, A., Hamed, A., Minikin, A., Harrison, R. M., Talbot, R., and Sun, J.: Explaining global surface aerosol number concentrations in terms of primary emissions and particle formation, Atmos. Chem. Phys., 10, 4775–4793, https://doi.org/10.5194/acp-10-4775-2010, 2010.
Stolzenburg, D., Simon, M., Ranjithkumar, A., Kürten, A., Lehtipalo, K., Gordon, H., Ehrhart, S., Finkenzeller, H., Pichelstorfer, L., Nieminen, T., He, X.-C., Brilke, S., Xiao, M., Amorim, A., Baalbaki, R., Baccarini, A., Beck, L., Bräkling, S., Caudillo Murillo, L., Chen, D., Chu, B., Dada, L., Dias, A., Dommen, J., Duplissy, J., El Haddad, I., Fischer, L., Gonzalez Carracedo, L., Heinritzi, M., Kim, C., Koenig, T. K., Kong, W., Lamkaddam, H., Lee, C. P., Leiminger, M., Li, Z., Makhmutov, V., Manninen, H. E., Marie, G., Marten, R., Müller, T., Nie, W., Partoll, E., Petäjä, T., Pfeifer, J., Philippov, M., Rissanen, M. P., Rörup, B., Schobesberger, S., Schuchmann, S., Shen, J., Sipilä, M., Steiner, G., Stozhkov, Y., Tauber, C., Tham, Y. J., Tomé, A., Vazquez-Pufleau, M., Wagner, A. C., Wang, M., Wang, Y., Weber, S. K., Wimmer, D., Wlasits, P. J., Wu, Y., Ye, Q., Zauner-Wieczorek, M., Baltensperger, U., Carslaw, K. S., Curtius, J., Donahue, N. M., Flagan, R. C., Hansel, A., Kulmala, M., Lelieveld, J., Volkamer, R., Kirkby, J., and Winkler, P. M.: Enhanced growth rate of atmospheric particles from sulfuric acid, Atmos. Chem. Phys., 20, 7359–7372, https://doi.org/10.5194/acp-20-7359-2020, 2020.
Stolzenburg, M. R., McMurry, P. H., Sakurai, H., Smith, J. N., Mauldin III, R. L., Eisele, F. L., and Clement, C. F.: Growth rates of freshly nucleated atmospheric particles in Atlanta, J. Geophys. Res.-Atmos., 110, D22S05, https://doi.org/10.1029/2005JD005935, 2005.
Tuovinen, S.: Data for Survival probabilities of atmospheric particles: comparison based on theory, cluster population simulations, and observations in Beijing (Version 1), Zenodo [data set], https://doi.org/10.5281/zenodo.7247561, 2022.
Tuovinen, S., Kontkanen, J., Jiang, J., and Kulmala, M.: Investigating the effectiveness of condensation sink based on heterogeneous nucleation theory, J. Aerosol Sci., 149, 105613, https://doi.org/10.1016/j.jaerosci.2020.105613, 2020.
Tuovinen, S., Kontkanen, J., Cai, R., and Kulmala, M.: Condensation sink of atmospheric vapors: the effect of vapor properties and the resulting uncertainties, Environ. Sci.-Atmos., 1, 543–557, https://doi.org/10.1039/D1EA00032B, 2021.
Wang, M., Kong, W., Marten, R., He, X.-C., Chen, D., Pfeifer, J., Heitto, A., Kontkanen, J., Dada, L., Kürten, A., Yli-Juuti, T., Manninen, H. E., Amanatidis, S., Amorim, A., Baalbaki, R., Baccarini, A., Bell, D. M., Bertozzi, B., Bräkling, S., Brilke, S., Murillo, L. C., Chiu, R., Chu, B., De Menezes, L.-P., Duplissy, J., Finkenzeller, H., Carracedo, L. G., Granzin, M., Guida, R., Hansel, A., Hofbauer, V., Krechmer, J., Lehtipalo, K., Lamkaddam, H., Lampimäki, M., Lee, C. P., Makhmutov, V., Marie, G., Mathot, S., Mauldin, R. L., Mentler, B., Müller, T., Onnela, A., Partoll, E., Petäjä, T., Philippov, M., Pospisilova, V., Ranjithkumar, A., Rissanen, M., Rörup, B., Scholz, W., Shen, J., Simon, M., Sipilä, M., Steiner, G., Stolzenburg, D., Tham, Y. J., Tomé, A., Wagner, A. C., Wang, D. S., Wang, Y., Weber, S. K., Winkler, P. M., Wlasits, P. J., Wu, Y., Xiao, M., Ye, Q., Zauner-Wieczorek, M., Zhou, X., Volkamer, R., Riipinen, I., Dommen, J., Curtius, J., Baltensperger, U., Kulmala, M., Worsnop, D. R., Kirkby, J., Seinfeld, J. H., El-Haddad, I., Flagan, R. C., and Donahue, N. M.: Rapid growth of new atmospheric particles by nitric acid and ammonia condensation, Nature, 581, 184–189, https://doi.org/10.1038/s41586-020-2270-4, 2020.
Wang, Z. B., Hu, M., Pei, X. Y., Zhang, R. Y., Paasonen, P., Zheng, J., Yue, D. L., Wu, Z. J., Boy, M., and Wiedensohler, A.: Connection of organics to atmospheric new particle formation and growth at an urban site of Beijing, Atmos. Environ., 103, 7–17, https://doi.org/10.1016/j.atmosenv.2014.11.069, 2015.
Wiedensohler, A., Birmili, W., Nowak, A., Sonntag, A., Weinhold, K., Merkel, M., Wehner, B., Tuch, T., Pfeifer, S., Fiebig, M., Fjäraa, A. M., Asmi, E., Sellegri, K., Depuy, R., Venzac, H., Villani, P., Laj, P., Aalto, P., Ogren, J. A., Swietlicki, E., Williams, P., Roldin, P., Quincey, P., Hüglin, C., Fierz-Schmidhauser, R., Gysel, M., Weingartner, E., Riccobono, F., Santos, S., Grüning, C., Faloon, K., Beddows, D., Harrison, R., Monahan, C., Jennings, S. G., O'Dowd, C. D., Marinoni, A., Horn, H.-G., Keck, L., Jiang, J., Scheckman, J., McMurry, P. H., Deng, Z., Zhao, C. S., Moerman, M., Henzing, B., de Leeuw, G., Löschau, G., and Bastian, S.: Mobility particle size spectrometers: harmonization of technical standards and data structure to facilitate high quality long-term observations of atmospheric particle number size distributions, Atmos. Meas. Tech., 5, 657–685, https://doi.org/10.5194/amt-5-657-2012, 2012.
Wu, Z., Hu, M., Lin, P., Liu, S., Wehner, B., and Wiedensohler, A.: Particle number size distribution in the urban atmosphere of Beijing, China, Atmos. Environ., 42, 7967–7980, https://doi.org/10.1016/j.atmosenv.2008.06.022, 2008.
Xiao, M., Hoyle, C. R., Dada, L., Stolzenburg, D., Kürten, A., Wang, M., Lamkaddam, H., Garmash, O., Mentler, B., Molteni, U., Baccarini, A., Simon, M., He, X.-C., Lehtipalo, K., Ahonen, L. R., Baalbaki, R., Bauer, P. S., Beck, L., Bell, D., Bianchi, F., Brilke, S., Chen, D., Chiu, R., Dias, A., Duplissy, J., Finkenzeller, H., Gordon, H., Hofbauer, V., Kim, C., Koenig, T. K., Lampilahti, J., Lee, C. P., Li, Z., Mai, H., Makhmutov, V., Manninen, H. E., Marten, R., Mathot, S., Mauldin, R. L., Nie, W., Onnela, A., Partoll, E., Petäjä, T., Pfeifer, J., Pospisilova, V., Quéléver, L. L. J., Rissanen, M., Schobesberger, S., Schuchmann, S., Stozhkov, Y., Tauber, C., Tham, Y. J., Tomé, A., Vazquez-Pufleau, M., Wagner, A. C., Wagner, R., Wang, Y., Weitz, L., Wimmer, D., Wu, Y., Yan, C., Ye, P., Ye, Q., Zha, Q., Zhou, X., Amorim, A., Carslaw, K., Curtius, J., Hansel, A., Volkamer, R., Winkler, P. M., Flagan, R. C., Kulmala, M., Worsnop, D. R., Kirkby, J., Donahue, N. M., Baltensperger, U., El Haddad, I., and Dommen, J.: The driving factors of new particle formation and growth in the polluted boundary layer, Atmos. Chem. Phys., 21, 14275–14291, https://doi.org/10.5194/acp-21-14275-2021, 2021.
Yao, L., Garmash, O., Bianchi, F., Zheng, J., Yan, C., Kontkanen, J., Junninen, H., Mazon, S. B., Ehn, M., Paasonen, P., Sipilä, M., Wang, M., Wang, X., Xiao, S., Chen, H., Lu, Y., Zhang, B., Wang, D., Fu, Q., Geng, F., Li, L., Wang, H., Qiao, L., Yang, X., Chen, J., Kerminen, V.-M., Petäjä, T., Worsnop, D. R., Kulmala, M., and Wang, L.: Atmospheric new particle formation from sulfuric acid and amines in a Chinese megacity, Science, 361, 278–281, https://doi.org/10.1126/science.aao4839, 2018.
Yue, D. L., Hu, M., Zhang, R. Y., Wang, Z. B., Zheng, J., Wu, Z. J., Wiedensohler, A., He, L. Y., Huang, X. F., and Zhu, T.: The roles of sulfuric acid in new particle formation and growth in the mega-city of Beijing, Atmos. Chem. Phys., 10, 4953–4960, https://doi.org/10.5194/acp-10-4953-2010, 2010.
Yue, D. L., Hu, M., Zhang, R. Y., Wu, Z. J., Su, H., Wang, Z. B., Peng, J. F., He, L. Y., Huang, X. F., Gong, Y. G., and Wiedensohler, A.: Potential contribution of new particle formation to cloud condensation nuclei in Beijing, Atmos. Environ., 45, 6070–6077, https://doi.org/10.1016/j.atmosenv.2011.07.037, 2011.
Zhou, Y., Dada, L., Liu, Y., Fu, Y., Kangasluoma, J., Chan, T., Yan, C., Chu, B., Daellenbach, K. R., Bianchi, F., Kokkonen, T. V., Liu, Y., Kujansuu, J., Kerminen, V.-M., Petäjä, T., Wang, L., Jiang, J., and Kulmala, M.: Variation of size-segregated particle number concentrations in wintertime Beijing, Atmos. Chem. Phys., 20, 1201–1216, https://doi.org/10.5194/acp-20-1201-2020, 2020.