the Creative Commons Attribution 4.0 License.
the Creative Commons Attribution 4.0 License.
 | 24 Nov 2022
Chromophores and chemical composition of brown carbon characterized at an urban kerbside by excitation–emission spectroscopy and mass spectrometry
Feng Jiang
Junwei Song
Jonas Bauer
Linyu Gao
Magdalena Vallon
Reiner Gebhardt
Thomas Leisner
Stefan Norra
The optical properties, chemical composition, and potential chromophores of brown carbon (BrC) aerosol particles were studied during typical summertime and wintertime at a kerbside in downtown Karlsruhe, a city in central Europe. The average absorption coefficient and mass absorption efficiency at 365 nm (Abs365 and MAE365) of methanol-soluble BrC (MS-BrC) were lower in the summer period (1.6 ± 0.5 Mm−1, 0.5 ± 0.2 m2 g−1) than in the winter period (2.8 ± 1.9 Mm−1, 1.1 ± 0.3 m2 g−1). Using a parallel factor (PARAFAC) analysis to identify chromophores, two different groups of highly oxygenated humic-like substances (HO-HULIS) dominated in summer and contributed 96 ± 6 % of the total fluorescence intensity. In contrast, less-oxygenated HULIS (LO-HULIS) dominated the total fluorescence intensity in winter with 57 ± 12 %, followed by HO-HULIS with 31 ± 18 %. Positive matrix factorization (PMF) analysis of organic compounds detected in real time by an online aerosol mass spectrometer (AMS) led to five characteristic organic compound classes. The statistical analysis of PARAFAC components and PMF factors showed that LO-HULIS chromophores were most likely emitted from biomass burning in winter. HO-HULIS chromophores could be low-volatility oxygenated organic aerosol from regional transport and oxidation of biogenic volatile organic compounds (VOCs) in summer.
Five nitro-aromatic compounds (NACs) were identified by a chemical ionization mass spectrometer (C7H7O3N, C7H7O4N, C6H5O5N, C6H5O4N, and C6H5O3N), which contributed 0.03 ± 0.01 % to the total organic mass but can explain 0.3 ± 0.1 % of the total absorption of MS-BrC at 365 nm in winter. Furthermore, we identified 316 potential brown carbon molecules which accounted for 2.5 ± 0.6 % of the organic aerosol mass. Using an average mass absorption efficiency (MAE365) of 9.5 m2g−1 for these compounds, we can estimate their mean light absorption to be 1.2 ± 0.2 Mm−1, accounting for 32 ± 15 % of the total absorption of MS-BrC at 365 nm. This indicates that a small fraction of brown carbon molecules dominates the overall absorption. The potential BrC molecules assigned to the LO-HULIS component had a higher average molecular weight (265 ± 2 Da) and more nitrogen-containing molecules (62 ± 1 %) than the molecules assigned to the HO-HULIS components. Our analysis shows that the LO-HULIS, with a high contribution of nitrogen-containing molecules originating from biomass burning, dominates aerosol fluorescence in winter, and HO-HULIS, with fewer nitrogen-containing molecules as low-volatility oxygenated organic aerosol from regional transport and oxidation of biogenic volatile organic compounds (VOC), dominates in summer.
- Article
(1672 KB) - Full-text XML
-
Supplement
(2186 KB) - BibTeX
- EndNote


Carbonaceous aerosols (CAs) significantly affect air quality and the planetary radiation budget. Black carbon (BC) represents the best-studied absorbing fraction of CAs, while organic aerosol (OA) is typically considered to be non-light-absorbing, or ”white”, hence only contributing to scattering of solar radiation. However, coloured OA compounds, known as brown carbon (BrC), also absorb solar radiation in the near-ultraviolet (UV) and visible spectral range (Laskin et al., 2015; Shrivastava et al., 2017; Moise et al., 2015; Saleh, 2020). Therefore, it has a direct impact on radiative forcing (Jacobson, 2012; Wang et al., 2018). A global study finds BrC accounting for approximately 7 %–48 % of direct radiative forcing by comparing all absorbing CAs (Zeng et al., 2020). Moreover, a global simulation suggests that the annual mean contribution of BrC to aerosol particle absorption is 7 %–19 % (Feng et al., 2013).
Sources of BrC are primary emissions e.g. from incomplete combustion, but also secondary formation in the atmosphere. The major primary sources of BrC are biomass burning (Liu et al., 2021; Brown et al., 2021; Kasthuriarachchi et al., 2020) and fossil fuel combustion (Olson et al., 2015). Major secondary sources of BrC are the oxidation of anthropogenic and biogenic volatile organic compounds (VOCs) (He et al., 2021; Xie et al., 2017; Montoya-Aguilera et al., 2017). Secondary BrC formation is an important source, especially at high NOx levels in urban areas (Hecobian et al., 2010; Nakayama et al., 2013). As typical chromophores and chemical compounds of BrC, e.g. nitro-aromatic compounds, humic-like substances (HULIS), protein-like substances, and polycyclic aromatic hydrocarbons have been identified (Wu et al., 2018; Salvador et al., 2021; Huang et al., 2018; Chen et al., 2016). Furthermore, Saleh (2020) proposed an optical framework to clarify BrC by grouping BrC into four broad categories: very weakly absorbing BrC (VW-BrC), weakly absorbing BrC (W-BrC), moderately absorbing BrC (M-BrC), and strongly absorbing BrC (S-BrC). However, due to the complex mixture of chemical compounds (Yan et al., 2018) and the heterogeneous structure of BrC aerosol particles (Laskin et al., 2015) resulting from the diversity of sources, it is still far from being well understood (Moise et al., 2015).
Excitation emission matrix (EEM) fluorescence spectroscopy is a useful method to investigate the light absorption and characteristic fluorescence of chromophores. It was initially used to characterize sources and different types of dissolved organic carbon (DOM) including chromophores in aqueous systems like rivers, lakes, and oceans (Murphy et al., 2013; Stubbins et al., 2014). However, this technique can also be used to study atmospheric organic aerosol, e.g. chromophores, extracted from OA (Yan and Kim, 2017; Laskin et al., 2015). Furthermore, parallel factor analysis (PARAFAC) can be applied to the excitation fluorescence spectra to distinguish between different chromophore types and to potentially identify sources and structures of the chromophores dissolved (Chen et al., 2020, 2021; Matos et al., 2015; Chen et al., 2016; Pucher et al., 2019). For example, major types of fluorophores have variable relative contents in atmospheric particles from different sources, e.g. biomass burning, coal combustion, and vehicle emission (Tang et al., 2020). Fluorescent components related to HULIS contribute the majority of the total fluorescence intensity of organic aerosol particles during a 1-year observation in Seoul, Korea (Yan and Kim, 2017). Therefore, these fluorescence studies can help to distinguish different components of BrC. However, this method is limited to soluble fluorescing classes of components. Therefore, it should be combined with other methods like aerosol particle mass spectrometry to confirm sources and to perform a chemical characterization of the chromophores.
The aerosol mass spectrometer (AMS) is widely used to investigate sources and the chemical characteristics of OA. Positive matrix factorization (PMF) is commonly applied for AMS data analysis (Crippa et al., 2014; Mohr et al., 2012; Shen et al., 2019). According to PMF analysis, OA can be separated into e.g. hydrocarbon-like OA (HOA), cooking-related OA (COA), biomass burning OA (BBOA), semi-volatile oxygenated OA (SV-OOA), and low-volatility oxygenated OA (LV-OOA). Therefore, complementary data from AMS-PMF and EEM-PARAFAC analysis allow for a better interpretation of sources and chemical characteristics of BrC. For example, the water-soluble chromophores extracted from urban, forest, and marine aerosol were associated with different oxidation states and functional groups by and AMS factor analysis (Chen et al., 2016). Chen et al. (2020, 2021) investigated chromophore sources and species in different aerosol samples (combustion source samples, secondary organic aerosols, and ambient aerosols) by using EEM spectroscopy, different chemical analysis, and the PARAFAC model. However, the combination of these methods does not allow identifying specific molecules as the AMS measurement involves strong fragmentation of individual compounds.
The filter inlet for gases and aerosols coupled to a high-resolution time-of-flight chemical ionization mass spectrometer (FIGAERO–HR-ToF-CIMS) can provide new insights into the molecular composition of OA (Lopez-Hilfiker et al., 2014). This has been shown in several studies investigating the molecular composition of BrC by HR-ToF-CIMS (Jiang et al., 2019; Palm et al., 2020; Yuan et al., 2016). For example, five nitrated phenol compounds were detected by HR-ToF-CIMS and assigned to account for 4 ± 2 % of UV light absorption in Detling, United Kingdom, during the winter (Mohr et al., 2013). A few studies also investigated the chemical mechanisms of nitro-aromatic compound formation by CIMS, e.g. source emissions, formation pathways, and photolysis rates (Salvador et al., 2021; Song et al., 2021). Therefore, HR-ToF-CIMS is a useful method to investigate the chemical composition of BrC aerosol particles. However, this method also requires validation with standards and reference techniques to identify more potential BrC molecules. Lin et al. (2016, 2018) developed a method to identify potential brown carbon molecules by correlating the number of double bond equivalents with the number of carbon atoms per molecule. A few studies used this method to find more brown carbon molecules. For example, there are good correlations (r=0.9) between mass absorption efficiency at 365 nm (MAE365) and potential brown carbon molecules of large molecular weight (Tang et al., 2020). Xu et al. (2020) used this method to find 149 nitrogen-containing potential BrC chromophores in the Tibetan Plateau. Therefore, combining the number of carbon atoms per molecule and the molecular double bond equivalent can provide a first insight to find more potential BrC molecules by CIMS.
Several studies investigated BrC in moderately polluted European cities. For example, wood burning emissions dominated the OA absorption in the city of Zürich, Switzerland (Moschos et al., 2018). Absorption Ångström exponents (AAE) of BrC at 300–400 nm in winter and summer were found to be around 4.5 and 5.1, significantly higher than AAE (∼ 1) of BC (Moschos et al., 2018). BrC contributed 13 %–20 % to the absorption of solar radiation by total carbonaceous aerosols during winter in Magadino, Switzerland (Moschos et al., 2021). On the molecular level, average contributions of water-soluble nitro-aromatic compounds (NACs) to BrC absorption was 0.13 % at a forest site (Waldstein) in summer and 1.13 % at an urban site in Leipzig in winter (both in Germany). Both measurements were done by electrospray ionization mass spectrometry (Teich et al., 2017). Linke et al. (2016) found that residential wood burning in the evening hours increased the organic carbonaceous (OC) fraction in the carbonaceous aerosol and increased the shortwave MAE at Durlacher Tor in the city of Karlsruhe, Germany. Furthermore, MAE of refractory BC at 450, 532, and 660 nm was determined to be 12.9 ± 2.8, 8.4 ± 3.1, and 7.5 ± 4.9 m2 g−1, respectively (Linke et al., 2016). Those studies show interesting information about absorbing carbonaceous aerosol, but the links to chromophores and the chemical composition of BrC in moderately polluted European cities are still quite unclear.
To understand the chemical composition and the major chromophore types that contribute to BrC at different seasons in a typical urban environment in western Europe, we combined the aforementioned methods. Firstly, the seasonal variation of optical properties of BrC extracted by methanol will be investigated. Secondly, the chromophoric types and sources will be identified by the fluorescence technique and aerosol mass spectrometer measurements. Thirdly, absorption contributions from typical chromophore molecules will be estimated, which are detected by chemical ionization mass spectrometer. Finally, correlations of chromophore types and chemical composition will be discussed.
2.1 Measurement site
We performed particle and trace gas measurements from 6–26 July 2019 and 26 February–25 March 2020 in downtown Karlsruhe, Germany (49∘00′33.9′′ N 8∘25′02.3′′ E), a city with a population of about 300 000. The measurement site at the Durlacher Tor is located at a central traffic junction with a three-lane road and a street crossing. Therefore, it can be classified as a typical urban kerbside. As shown in Fig. S1, there are several industrial emission sources within ∼ 10 to 15 km of the measurement site, including a refinery with a 15.5 Mt yr−1 capacity in the southwest and a 1450 MW hard-coal-fired power plant in the west (Hagemann et al., 2014). The largest part of the city, including larger residential areas, is located southwest of the measurement site and may be expected to be a source of biomass burning emissions, especially in the heating season. The Hardtwald forest, an area surrounding Karlsruhe, is ∼ 3 km to the north and northeast and ∼ 10 km southwest of the measurement site. This forest emits biogenic volatile organic compounds, especially in summer.
2.2 Filter sampling
During the measurement campaigns, the quartz filter samples were collected by a low-volume sampler (LVS, ComdeDerenda GmbH). There were 13 daily filters collected in summer and 21 daily filters in winter. The daily filters were analysed by a microbalance (Sartorius AG, Germany) for the PM2.5 mass concentration. In addition, three quartz filters were collected for each morning, afternoon, and nighttime in winter from 18–20 March 2020. The sampling times are shown in Table S4 in the Supplement. During each campaign, two–three blank filter samples were collected to correct for the backgrounds. Before sampling, these filters were wrapped in aluminium foil and pre-baked at 450 ∘C for 5 h. After sampling, they were stored in a freezer at –20 ∘C until analysis for optical properties.
Before collecting particles, Teflon filters (polytetrafluoroethylene (PTFE), 1 µm, SKC Inc.) were baked at 200 ∘C for 6 h to remove potential contamination constitutes from the filter matrix. Only 11 Teflon filters were collected in winter from 17–20 March 2020, including 4 filters in the morning, 4 filters in the afternoon, and 3 filters at nighttime (see Table S3 in the Supplement). The sampling flow for particle deposition on the Teflon filter was 6 L min−1, and a rotameter was used to keep the total flow of 16.7 L min−1 at the PM2.5 inlet. In order to avoid any mass loading effects, the deposition time usually varied from about 50–270 min to obtain similar organic mass loadings based on concurrent AMS measurements (Huang et al., 2019). The sampling tubes and the PM2.5 inlet have been described in a previous study (Song et al., 2022). The Teflon filters were stored in a freezer at –20 ∘C until analysis for organic composition by the FIGAERO–CIMS.
2.3 Meteorological, aerosol particle, and traces gas instruments
All instruments were set up in a temperature-controlled measurement container about 5 m west of the road. All sampling inlets (PM2.5, TSP) were located 3.7 m above ground level and 1.5 m above the container roof. An overview of the instruments used and the parameters measured is given in Tables S1 and S2 of the Supplement.
Temperature, relative humidity (RH), pressure, wind speed, wind direction, precipitation, and global radiation were measured by a meteorological sensor (WS700, Lufft GmbH; see Tables S1 and S2) on a mast 2 m above the container roof. The main wind directions during the campaign were southwest and northeast in both summer and winter, since winds were channelled by the Rhine River valley. Please note that wind directions at the container location are also channelled by tall buildings at mainly west of the container. The actual general wind directions were measured on the rooftop of a nearby building at 65 m above ground level. O3 and NO2 were measured with standard gas monitors (Table S1). PM2.5 was measured by an optical particle counter (OPC-FIDAS 200, Palas Inc.). PM2.5 mass concentrations measured by gravimetric analysis of collected quartz filters show a good agreement with online PM2.5 measurement by the optical particle counter (FIDAS). The Pearson's correlations of the two particle mass measurements were 0.9 in summer and winter (Fig. S6a and b). Black carbon (BC) concentrations were measured with aethalometers (AE51 and MA200; Aethlabs Inc). While the AE51 was measuring light attenuation at 880 nm, the MA200 did it at five wavelengths (375, 470, 528, 625, 880 nm) allowing us to distinguish between BrC and BC. However, during this measurement campaign, the MA200 unusually showed many measurement errors due to wrong settings, so we did not calculate wavelength dependence absorptions from the MA200. The mass concentrations of non-refractory (NR) PM2.5 components (sulfate, nitrate, ammonium, and organics) were measured online by a high-resolution time-of-flight aerosol mass spectrometer (HR-ToF-AMS, Aerodyne Inc., hereafter AMS) at a time resolution of 0.5 min. The detailed information on AMS data analysis is shown in Sect. 2 in the Supplement. We used the online AMS data to calculate major source factors for organic aerosol components employing PMF (Song et al., 2022). Please note that the online NR–PM2.5 measured by AMS agrees well with the offline measurements of PM2.5 via gravimetric analysis of the quartz filter samples (Song et al., 2022). In winter, the volatile organic compounds were measured by a proton transfer reaction time-of-flight mass spectrometer (PTR-MS 4000, IONICON). Detailed information about PTR-MS was shown in a previous study (Song et al., 2022).
2.4 Offline FIGAERO–CIMS analysis
The Teflon filters were analysed by a filter inlet for gases and aerosols coupled to a high-resolution time-of-flight chemical ionization mass spectrometer (FIGAERO–HR-ToF-CIMS, Aerodyne Research Inc, hereafter CIMS) employing iodide ions for chemical ionization (Lopez-Hilfiker et al., 2014), which can provide organic molecular compositions of the particle phase. The instrument we used has been described in detail (Huang et al., 2019). During the analysis, particles collected on the Teflon filter were desorbed by a flow of ultra-high-purity (99.9999 %) nitrogen heated from 25 to 200 ∘C over the course of 35 min (Lopez-Hilfiker et al., 2014). Each sample filter was heated two times and the second heating cycle was regarded as the background (Siegel et al., 2021). The raw data were analysed by using the toolkit Tofware (v3.1.2, Tofwerk, Thun, Switzerland, and Aerodyne, Billerica) with the Igor Pro software (v7.08, Wavemetrics, Portland, OR). The molecular signals obtained were integrated over the thermal desorption process after background subtraction. We assume the same sensitivity of 22 cps ppt−1 for all compounds (Lopez-Hilfiker et al., 2016), except for five nitro-aromatic compounds (NACs). For NACs, we did four NAC calibrations in a similar way as done by Salvador et al. (2021). The calibration results are given in the Supplement (Fig. S2). The sum of the filter-deposited particle mass of all molecules detected by CIMS has good correlations (r=0.6) with organic concentrations measured by AMS.
2.5 Absorption and EEM fluorescence spectra of methanol-soluble compounds
Methanol-soluble organic carbon (MSOC) was extracted from the quartz filters with 5 mL methanol (for analysis purity, Merck) via ultrasonication of filter punches for 30 min. All the extracts were filtered through a 0.45 µm polytetrafluoroethylene membrane into a glass bottle to remove the insoluble material. Please note that the MSOC contains methanol-soluble but also water-soluble compounds since water-soluble compounds are also partially soluble in methanol. We did this direct methanol extraction in order to dissolve a maximum number of compounds facilitating a good comparison with the mass spectrometric analysis in which there is no differentiation between different solubilities. However, this has to be kept in mind when comparing our results with studies that separated the water- and methanol-soluble fractions. Absorption and excitation–emission spectra of these extracts were measured by an Aqualog fluorometer (HORIBA Scientific, USA). The absorption wavelength ranges from 239 to 800 nm with a 3 nm resolution. The light absorption coefficients of methanol-extracted brown carbon at 365 nm were calculated through the absorption (Aλ) of the solution
where A700 and Aλ are measured by Aqualog, Vextract (m3) is the solvent volume, Vair (m3) is the sampling volume corresponding to the extracted filter, and L is the optical path length of the quartz cuvette (1 cm).
The mass absorption efficiency (MAE; m2 g−1) of the methanol-soluble BrC (MS-BrC) fractions in the extracts as functions of the wavelength was calculated according to Hecobian et al. (2010):
where Absλ (Mm−1) is the light absorption coefficient. C (µg m−3) represents the atmospheric concentration of organic aerosol detected by AMS, assuming that all organic aerosol components can be dissolved into methanol.
The absorption Ångström exponent (AAE) is an important parameter to characterize the wavelength dependence of light absorption which fits a power law as follows:
where K is a concentration- and composition-related constant. In this study, AAE was fitted in the range of 300–450 nm.
For all Aqualog measurements, we used an excitation wavelength range from 239–500 nm and an emission wavelength range from 247–700 nm to have ranges comparable to Tang et al. (2020). The wavelength increments of the scans for excitation were 3 nm and the emission wavelength increments used were 4.66 and 2.33 nm in summer and winter, respectively. The resulting excitation–emission spectra were analysed with the PARAFAC model to identify potential chromophoric components in MSOC. We used the staRdom package for R version 4.0.5 of the PARAFAC model (Pucher et al., 2019; Murphy et al., 2013), which was downloaded from https://cran.r-project.org/web/packages/staRdom/vignettes/PA-RAFAC_analysis_of_EEM.html (last access: 8 October 2021). The details of the data analysis procedure are given by Pucher et al. (2019) and Murphy et al. (2013). In brief, light absorption measurements were used to correct the EEM for inner-filter effects. The highest absorbance was not greater than 2 (mostly below 0.5 at 237 nm), which is appropriate for inner-filter corrections of the EEMs. Afterwards, all EEMs were normalized to the Raman peak area of water so that their unit is in Raman units (RU) whose excitation wavelength was 350 nm. Additionally, an interpolation method was used to remove the signals of the first-order Rayleigh and Raman scattering as well as the second-order Rayleigh scattering in the EEMs. The integral fluorescence volume (FV, RU-nm2) of the methanol extracts was calculated for the excitation wavelength of 239–500 nm and in the emission wavelength of 247–700 nm. The integral fluorescence volume was normalized by the organic concentration of the extracts obtained from AMS measurements to the normalized fluorescence volume (NFV, RU-nm2 [mg L−1]−1). Please note that after analysing the summer filter samples, we realized that we initially set a wavelength increment that was too large and reduced the wavelength increment for the analysis of the samples from winter. However, the increments of EEM spectra can be changed by the function (eem_extend2largest) in RStudio staRdom. We used this function to reduce the wavelength increments for the summer samples and ensure the same wavelengths for all samples. This is explained in more detail with the software package: https://cran.r-project.org/web/packages/staRdom/vignettes/PARAFAC_analysis_of_EEM.html (last access: 8 October 2021). Using all 49 EEMs obtained for summer and winter in the PARAFAC analysis, four different components were adopted by comparisons of the residual errors and by visual inspection for the three- to seven-component PARAFAC model (Fig. 3). They successfully passed the split-half validation with the split style of S4C6T3 for the 49 samples (Fig. S3). The corresponding model parameters are shown in Table S5.
In Sect. 3.1, we provide an overview of meteorological parameters, trace gas concentrations, particle masses, and aerosol particle optical properties in summer and winter. In Sect. 3.2, we mainly discuss the optical properties of MS-BrC. In Sect. 3.3, we discuss the characteristics and seasonal variations of chromophore components. In Sect. 3.4, we discuss sources and formation mechanisms of chromophore components. Finally, in Sect. 3.5, we determine the absorption contributions from brown carbon molecules and discuss the molecular characteristics of chromophore components for the winter period.
3.1 Overview of the field observations
Figures S1, S4, and S5 give an overview of meteorological parameters, trace gases, and particle concentrations during the campaigns. In summer 2019 and winter 2020, the major wind directions were northeast and southwest (Fig. S1) caused by the channelling of the wind in the Rhine valley. The average wind speeds were 3.6 ± 1.8 (average ± standard deviation) and 6.6 ± 1.8 m s−1, respectively. Depending on meteorological conditions, local sources and regional transport had an impact on air quality in Karlsruhe (Shen et al., 2019). As shown in Figs. S4 and S5, temperature showed diurnal variations with an average of (21.7 ± 6.7) ∘C in summer and (9.5 ± 1.5) ∘C in winter. Furthermore, the temperatures slowly increased from the beginning to the end of both campaigns. The relative humidity (RH) showed diurnal variations in summer with peaks at nighttime. In contrast, the RH had high values before the middle of the campaign in winter due to windy conditions with almost continuous rain. Therefore, general air pollution including PM2.5 and black carbon was low before 14 March 2021 because of precipitation scavenging of aerosol particles (Song et al., 2022; Zikova and Zdimal, 2016). NO2 and O3 were typically anti-correlated with peaks of NO2 in the night and peaks of O3 in the afternoon. The average concentrations of NO2 and O3 were higher in summer (18.6 ± 12.5, 66.5 ± 37.2 µg m−3) than in winter (9.6 ± 7.4, 27.3 ± 10.6 µg m−3). Please note that the lower NO2 concentrations in this winter period may not be typical as this was a relatively windy and rainy period.
3.2 Optical properties of MS-BrC
Figure 1 shows the time series of wind speeds, precipitations, particle mass concentrations, absorption coefficient, and mass absorption efficiency of methanol-soluble particle components at 365 nm (Abs365 and MAE365), non-refractory aerosol particle compounds, and BC-to-OA ratios (BC OA) in summer and winter at this measurement site. The third panel shows the temporal variation of Abs365 and MAE365 in summer and winter. The MAE365 had higher values (0.6–1.1 m2 g−1) from 13–16 July 2019 and lower values (0.3–0.4 m2 g−1) towards the end of the summer period. In contrast, MAE365 showed higher values during the whole winter campaign. The MAE365 had a relatively good correlation (Pearson's r=0.4) with the BC OA ratio (Fig. S7), indicating BrC became darker (higher MAE365) with increasing BC OA ratios (Saleh, 2020). The reason is that a fraction of BrC comprises organic precursors of BC whose conversion to BC was not completed during the combustion process (Saleh, 2020). Furthermore, the average BC OA ratio in winter was 0.3 ± 0.2 higher than 0.2 ± 0.1 in summer.
The average Abs365 in Karlsruhe was 2.8 ± 1.9 and 1.6 ± 0.5 M m−1 during winter and summer (see Table S6). The average Abs365 values measured in Karlsruhe during winter were lower compared with European cities like Leipzig, Germany (6.8 ± 3.9 M m−1), and also rural sites like Melpitz, Germany (6.6 ± 3.5 M m−1) (Teich et al., 2017), and Magadino, Switzerland (5.6 ± 3.7 M m−1), but closer to observations in the city of Zurich, Switzerland (2.2 ± 1.6 M m−1) (Moschos et al., 2018). The main reason for the relatively lower absorption observed during winter in Karlsruhe is the substantial impact of storms and rain during almost half of the winter campaign (Fig. 1.), which is therefore not really comparable. In contrast, the Abs365 values in summer show similar values (1–2 M m−1) in measurements at urban cities, rural areas, and forest regions in Europe (Moschos et al., 2018; Teich et al., 2017).
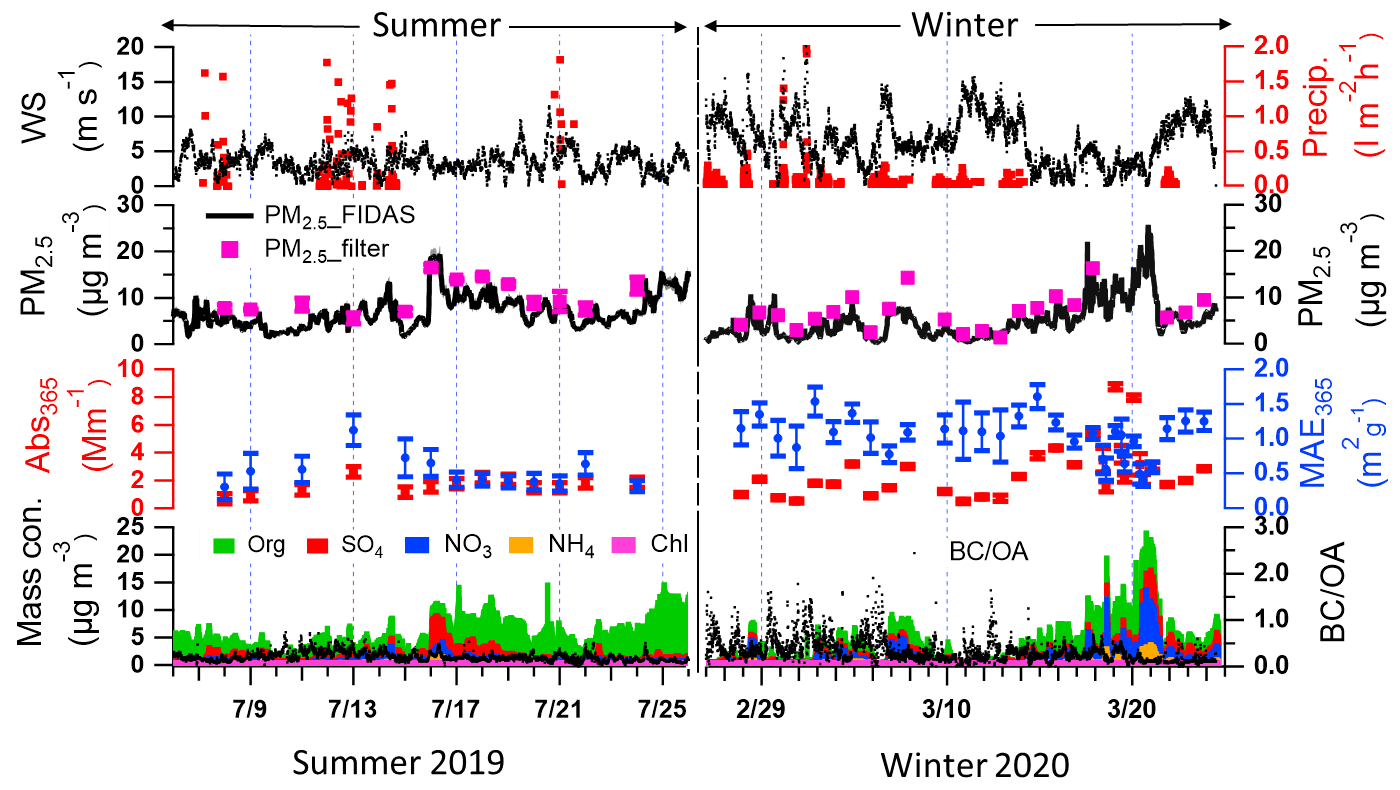
Figure 1Time series of wind speed, precipitation, PM2.5 mass concentrations from FIDAS optical particle sizer and gravimetric analysis of filter samples, optical properties of methanol-soluble aerosol particle compounds (Aqualog), concentrations of non-refractory aerosol particle compounds (AMS), and ratios of in summer 2019 and the following winter.
The average MAE365 in winter was 1.1 ± 0.3 m2 g−1 higher than 0.5 ± 0.2 m2 g−1 in summer (see Table S6). And the average MAE from ultraviolet to visible wavelengths in summer was lower than in winter (Fig. 2b). The higher MAE values in winter indicate that the organic aerosol has a stronger absorbing capacity (Laskin et al., 2015). Similar values of MAE365 were reported for Melpitz, Leipzig, Magadino, and Zurich ranging between 1.0–1.5 and 0.3–0.5 m2 g−1 during winter and summer, respectively (Moschos et al., 2018; Teich et al., 2017). The potential reasons are that similar sources contribute to OA in central Europe. The absorption Ångström exponents in the range of 300–450 nm (AAE300−450) in summer and winter were 4.7 ± 0.4 and 5.5 ± 1.5, respectively (Fig. 2a). The AAE300−400 values show similar values measured at Zurich, which are 4.5 and 5.1 in winter and summer, respectively. However, lower values of 3.8 were observed in Magadino during winter (Moschos et al., 2018). Furthermore, comparing AAE300−450 and log (MAE405), the BrC in summer and winter can be classified as weakly absorptive BrC (W-BrC) and moderately absorptive BrC (M-BrC), respectively (Fig. 2c). Zeng et al. (2022) found that the brown carbon in western United States wildfires was mainly moderately absorptive BrC. And Saleh (2020) found that the secondary BrC from aromatic volatile organic compound oxidation and biomass burning contributes to the very weakly or weakly absorptive BrC classes. The optical properties of BrC had seasonal characteristics due to different sources in winter and summer. In the following, we will discuss the potential MS-BrC sources and chromophore characteristics.
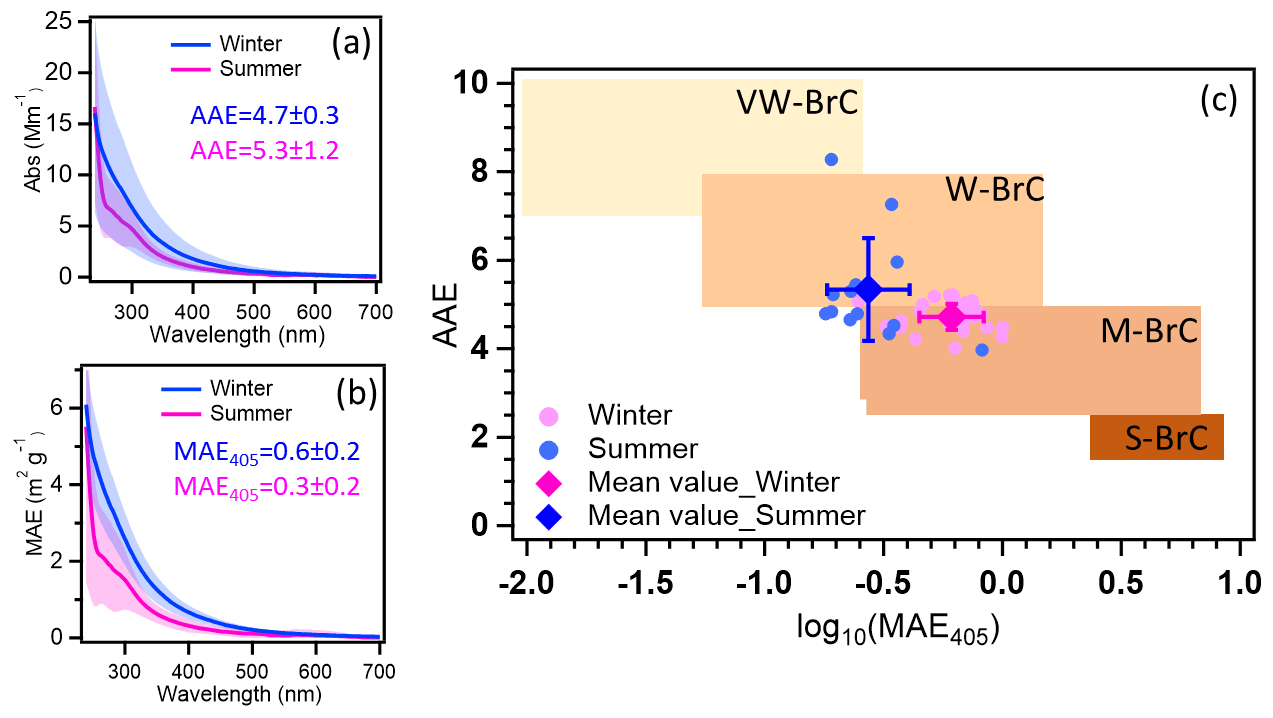
Figure 2The average Abs (a) and MAE (b) of MS-BrC in winter (blue) and summer (pink). (c) Graphical representation of optical-based BrC classes in AAE-log10 (MAE405) space with summer and winter data (Saleh, 2020; Hettiyadura et al., 2021). VW-BrC, W-BrC, M-BrC, and S-BrC, are very weakly absorbing, weakly absorbing, moderately absorbing, and strongly absorbing BrC. AAE reported in this work is calculated for a wavelength range of 300–450 nm. Please note that the small shoulder peak at ∼ 300 nm for the average summer sample (a, b) is most likely due to some contamination e.g. from the filter. However, it only occurred in a few filter samples and does not affect our main results.
3.3 EEM spectra and chromophores of methanol-soluble organic carbon
We used fluorescence spectra and a PARAFAC model to investigate chromophores and their potential sources of methanol-soluble organic carbon (MSOC) extracted from aerosol particles (Chen et al., 2019). With this approach, we identified four different characteristic components named C1, C2, C3, and C4 hereafter (Figs. 3 and S8, and Table S7). The excitation (Ex) and emission (Em) wavelengths of C1 range between <240–330 nm and 350–395 nm, with peak (Ex Em) values of <240 and 363 nm, respectively. Compared with previous studies, a methanol-soluble chromophore component (Ex: <250, Em: 388 nm) similar to C1 was enriched in biomass burning aerosol (Tang et al., 2020). Furthermore, Chen et al. (2016) characterized a similar water-soluble chromophore component as less-oxygenated humic-like substances (HULIS) by correlation analysis of PARAFAC components and AMS data.
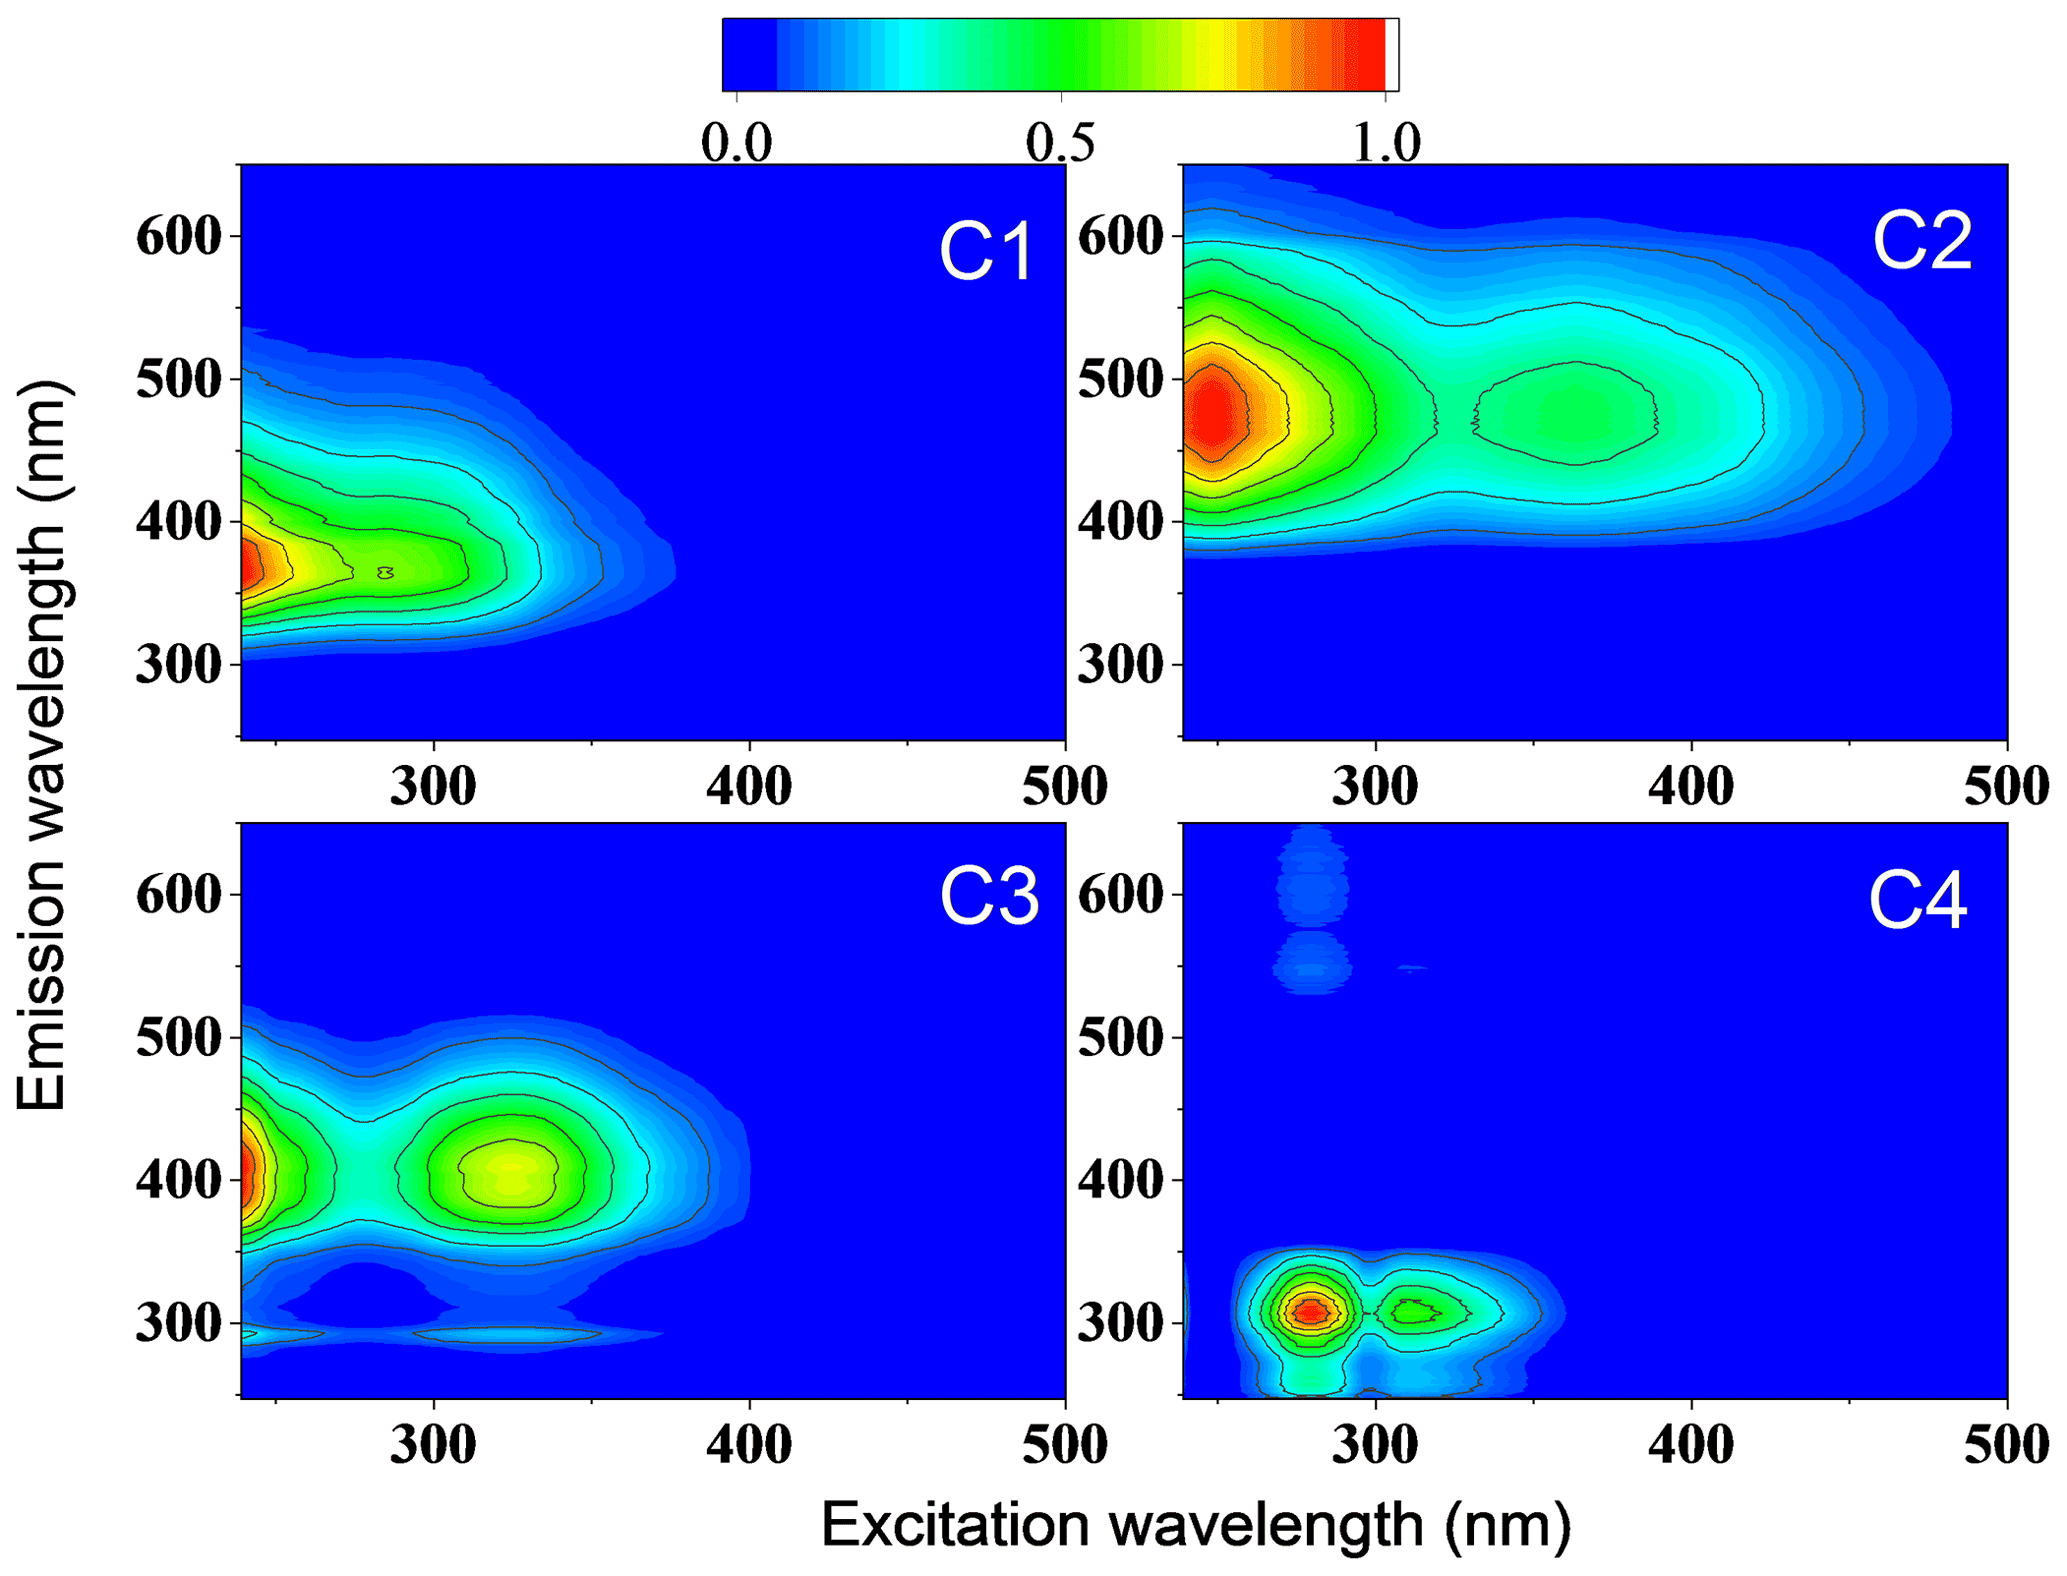
Figure 3The four components were identified by the PARAFAC model analysis of the excitation–emission spectra from all filter extracts collected in summer and winter.
In contrast to C1, the maximum emission wavelengths of C2 and C3 range above 400 nm. This indicates that these emissions probably originate from conjugated systems (Cory and McKnight, 2005; Matos et al., 2015). Two fluorescence peaks of C2 at nm (Ex) and 469 nm (Em) and two fluorescence peaks of C3 at nm (Ex) and 408 nm (Em) were observed. Components with similar excitation and emission wavelengths as C2 and C3 were found in water-soluble organic carbon and considered highly oxygenated humic-like substances (Chen et al., 2016; Yan and Kim, 2017; Chen et al., 2021). The fluorescence peak (Ex/Em: 266/307 nm) of component C4 was located at the protein-like region which contains phenol and naphthalene compounds (Chen et al., 2016; Mladenov et al., 2011), since the peaks of shorter excitation wavelength (<250 nm) and shorter emission wavelength (<350 nm) were associated with aromatic proteins like tyrosine (Cory and McKnight, 2005). There was a low fluorescence peak at the right of the main peak in C4 component spectra. This could be the first-order Rayleigh scattering effect, but it does not affect the main results. Due to the significant similarity of the characteristic spectra identified using the PARAFAC model with literature data, we consider C1 to be a less-oxygenated HULIS (LO-HULIS) component, C2 to be a highly oxygenated HULIS (HO-HULIS) component, C3 to be a second HO-HULIS component, and C4 to be a phenol- and naphthalene-like component.
As shown in Figs. 4 and 5a, there were different relative contributions of chromophore components in summer and winter. The LO-HULIS component (C1) has a high relative contribution of (57 ± 12) % in winter, but a low contribution of (2 ± 3) % in summer. The less-oxygenated HULIS originates most likely from primary emissions such as biomass burning, industrial sources, and other combustion sources (Chen et al., 2020). A similar chromophore component as C1 has also been identified in water-soluble organic carbon from the urban aerosol in Aveiro, Portugal, showing relatively low contributions in a 1-year average (Matos et al., 2015). Therefore, primary emissions can be considered important sources for chromophore components in winter, but not in summer. In contrast, the HO-HULIS components C2 and C3 dominated (96 ± 6) % in summer and had much less but still substantial contributions with (31 ± 8) % in winter. Chen et al. (2020) and Lee et al. (2013) found that optically similar components as C2 and C3 had a high contribution in biogenic or anthropogenic secondary organic aerosol (SOA). Therefore, the chromophores from biogenic or anthropogenic SOA seem to have a substantial contribution in summer and still be significant in winter. The phenol- and naphthalene-like component C4 shows only lower contributions with (2 ± 4) % and (11 ± 9) % in summer and winter, respectively. A component optically similar to C4 has been identified in aerosol particles related to vehicle emissions (Tang et al., 2020). To substantiate this analysis including a first, yet not very specific, source apportionment, we will combine these findings with results from our high-solution time-of-flight aerosol mass spectrometer (HR-ToF-AMS, hereafter AMS).
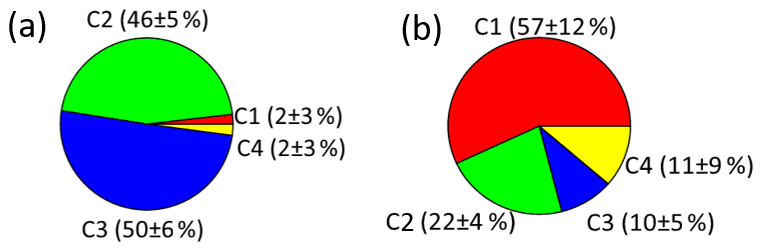
Figure 4A comparison of relative contributions of the four components identified by PARAFAC model analysis to total fluorescence for summer (a) and winter (b).
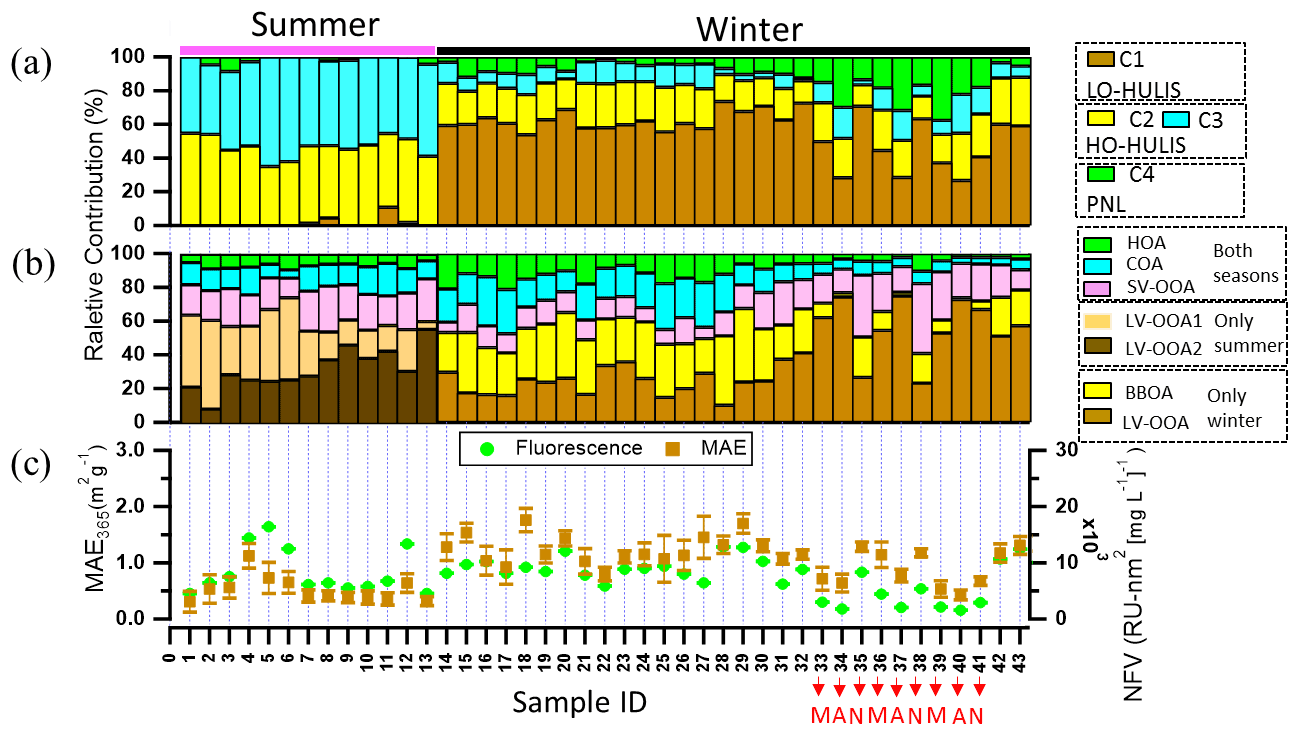
Figure 5(a, b) Relative abundances of (a) the chromophore components, i.e. C1 is associated with less-oxygenated humic-like substances, C2 and C3 are associated with highly oxygenated HULIS, and C4 is associated with phenol- and naphthalene-like substance; (b) AMS-PMF factors, i.e. HOA, COA, SV-OOA, and LV-OOA1 for both seasons, LV-OOA2 only in summer, and BBOA and LV-OOA only in winter; and (c) the normalized fluorescence volume (NFV) (normalized to organic aerosol concentration) and mass absorption efficiency at 365 nm (MAE365). Sample IDs 1–13 in summer and Sample IDs 14–43 in winter. Sample IDs 33, 36, and 39 in the morning (M); Sample IDs 34, 37, and 40 in the afternoon (A); Sample IDs 35, 38, and 41 at night (N). Sample IDs 1–32 and 42–43 for the whole day.
3.4 Sources of chromophores and organic aerosol
There are several factors of OA determined by PMF analysis of organic fragments measured by AMS in summer and winter (Figs. S9 and S10) (Ulbrich et al., 2009). As shown in Fig. 5b, in brief, the HOA and COA were observed in summer and winter, classified as the primary organic aerosol. The HOA can be considered to stem mainly from traffic emissions in urban areas (Kasthuriarachchi et al., 2020). The contributions to total OA were on average (7 ± 2) % and (9 ± 6) % in summer and winter, respectively. The COA was associated with cooking activities in urban areas (Moschos et al., 2018; Mohr et al., 2012) and contributes on average (13 ± 4) % and (14 ± 8) % to total OA in summer and winter, respectively. The BBOA was only detected in winter and the average contribution to total OA was (23 ± 8) %. The BBOA can be considered to stem mainly from wood combustion used for residential heating during the wintertime in Europe (Moschos et al., 2018, 2021). The SV-OOA and LV-OOA were observed both in summer and winter, mainly classified as secondary organic aerosol (Xiao et al., 2011). The average contributions of SV-OOA to total OA were (20 ± 4) % and (17 ± 8) % in summer and winter respectively. During the summer measurement, two different types of LV-OOA were observed LV-OOA1 (: 0.70) and LV-OOA2 (: 0.72). The average contributions of LV-OOA1 and LV-OOA2 to total OA were (28 ± 14) % and (32 ± 12) % respectively. Song et al. (2022) found that LV-OOA1 was mainly from regional transport and LV-OOA2 was mainly from oxidation of biogenic VOC in summer. In contrast, the LV-OOA contributes on average (37 ± 20) % of the total OA during the winter period. Song et al. (2022) found that the LV-OOA in winter could be from regional transport. More details on the PMF analysis of AMS data are shown by Song et al. (2022).
To potentially identify chromophore sources, we compared the factors from PMF analysis of AMS mass spectra and the components determined by the PARAFAC analysis of the excitation–emission spectra using a Pearson's correlation analysis based on relative abundances, as shown in Figs. S11 and S12. A significant correlation (r=0.8, p<0.01) can be seen between BBOA and LO-HULIS components in winter. Therefore, we consider LO-HULIS in winter to be mainly related to biomass burning organic aerosol. This is in agreement with a study that found the HULIS fraction of BrC was primarily related to biomass burning. This study conducted a dual carbon (13C and 14C) isotopic analysis on isolated HULIS (Yan and Kim, 2017). Residential wood burning was found to be the main source for HULIS in winter based on a strong correlation with K (R2>0.7) (Baduel et al., 2010). The HO-HULIS-1 component (C2) had a strong correlation (r=0.9, p<0.01) with LV-OOA1, which is related to regional transport in summer. In addition, the HO-HULIS-2 component (C3) showed a significant correlation with LV-OOA2 (r=0.7, p<0.01), which is related to oxidation of biogenic VOC in summer. Therefore, the HO-HULIS could be the low-volatility oxygenated organic aerosol from regional transport and oxidation of biogenic VOC in summer. Consistently, HULIS was also from secondary formation in summer, which is substantiated by a strong correlation with oxalic acid (R2>0.7) (Baduel et al., 2010). As shown in Fig. 5a, the phenol- and naphthalene-like component C4 had higher contributions to total fluorescence intensity for samples ID 33 to 41 (from 18 to 20 March 2020). Phenol in the gas phase also showed higher concentrations (Fig. S13) during this period. Furthermore, as shown in Fig. S13, the phenol- and naphthalene-like components had a good correlation (r=0.7) with phenol, which most likely originates from biomass burning and fossil fuel combustion (Sekimoto et al., 2013; Laskin et al., 2015). Therefore, the phenol- and naphthalene-like component C4 may be related to biomass burning and fossil fuel combustion.
The LO-HULIS and HO-HULIS components had variations of relative contributions during the winter campaign, especially diurnal variations. As shown in Table S4 in the Supplement, the samples with ID 33–41 were collected during different times of the day, such as morning (sample ID 33, 36, 39), afternoon (sample ID 34, 37, 40), and nighttime (sample ID 35, 38, 41). The contributions of LO-HULIS were lower in the morning and afternoon, but increased during the night. In contrast, HO-HULIS and phenol- and naphthalene-like chromophores showed an anti-correlation with this diurnal evolution. Deng et al. (2022) also found that LO-HULIS components contributed more at nighttime and HO-HULIS obviously increased in daytime during the winter in Tianjin, northern China. The characteristics of LO-HULIS are a low oxidizing state and high double bond equivalent. Furthermore, there is a negative correlation (Pearson's ) between LO-HULIS and O3 concentrations (Fig. S14a). The HO-HULIS components (C2 and C3) have a high oxidation state and low double bond equivalents. They have significant correlations (Pearson's r=0.7, p<0.01) with O3 in the wintertime (Fig. S14b and c). Therefore, we consider that LO-HULIS may be oxidized into HO-HULIS. This is consistent with other studies (Deng et al., 2022; Chen et al., 2021).
The normalized fluorescence volume (NFV) has a high intensity in samples ID 5 and 6 but MAE365 (Fig. 5c) is not significantly enhanced. This could be due to either contamination or specific species in these samples, as indicated e.g. by a higher fraction of LV-OOA1. During the wintertime measurements, the NFV and MAE365 had high correlation coefficients (r=0.9 and 0.8, p<0.01) with BBOA. Chen et al. (2016) found that the MAE266 and NFV values of water-soluble organic matter were positively correlated with C2H4O, an ion associated with organics from BBOA. In addition, MAE365 and NFV of MS-BrC were higher at nighttime and lowest in the afternoon. Satish et al. (2017) found that the absorption at 365 nm was higher in late evening, attributed to biomass burning, and lower in the middle of the day due to photobleaching and volatilization of BrC as well as rising boundary layer height. The sources of chromophores were identified well by combining chromophore components and AMS–PMF factors, but the BrC molecules are still unknown. The FIGAERO–CIMS can provide further insight into the aerosol (BrC) molecular composition.
3.5 Molecular composition of brown carbon during winter
3.5.1 Concentration and light absorption of nitro-aromatic compounds
Nitro-aromatic compounds (NACs) are typical brown carbon molecules. Therefore, we give here an overview of the main NACs we observed with their MAE365, concentration range, and average concentration (Table 1). The highest average concentration showed 4-nitrocatechol with 0.6 ± 0.4 ng m−3, followed by 2-methyl-4-nitrocatechol with 0.5 ± 0.4 ng m−3. Lower average concentrations were observed for 2-methyl-4-nitrophenol, 2-nitrophloroglucinol, and 4-nitrophenol, all with about ∼ 0.2 ng m−3. The sum of the five NACs varied between 0.7–3.6 ng m−3, with an average concentration of 1.6 ± 0.9 ng m−3, and contributes (0.02–0.08) % to the total organic mass concentrations measured by AMS. Teich et al. (2017) found mean NAC concentrations of 14.0 ng m−3 in the city of Leipzig and somewhat lower values of 11.1 ng m−3 at the rural site of Melpitz, both Germany, during a winter campaign. NACs contributed on average ∼ 0.5 % of the total organic aerosol with a mean value of 20 ng m−3 in Detling, UK, in winter (Mohr et al., 2013). All these previous observations at different European locations show somewhat higher average NAC concentrations than we have observed. However, we think this difference can be explained mainly by the meteorological conditions during our winter campaign with long stormy periods with substantial precipitation. In contrast, the average concentrations of NACs were 173 ± 137 ng m−3, with values ranging from 19 to 585 ng m−3 in Beijing, in winter (Li et al., 2020). This is just one example of more polluted regions of the world. Therefore, we conclude that NAC concentrations have levels between 1–20 ng m−3 in western Europe, which are substantially lower than in polluted regions. We calculated the light absorption of NACs by using molecular MAE365 (Xie et al., 2017). Based on this, the mean light absorption of the sum of the five NACs was calculated to be 0.014 ± 0.009 Mm−1, contributing to 0.3 ± 0.1 % of MS-BrC absorption at 365 nm, but they only contributed 0.03 ± 0.01 % of the total organic mass. Mohr et al. (2013) found that the sum of five NACs they found accounted for 4 ± 2 % of UV light absorption by brown carbon, only contributing on average ∼ 0.5 % of the total OA mass. Li et al. (2020) found that the sum of 12 NACs contributed 17 % of the total absorption by MS-BrC at 370 nm in Beijing, only accounting for 0.6 % of the organic matter. Therefore, NACs are typical brown carbon molecules with typically lower mass contributions to total organic aerosol but relatively higher contributions to the total absorption.
Table 1Nitro-aromatic compounds detected during the winter in Karlsruhe, including chemical formula, tentative structures, mass absorption efficiency at 365 nm (MAE365), concentration range, and average concentration (mean ± standard deviation).
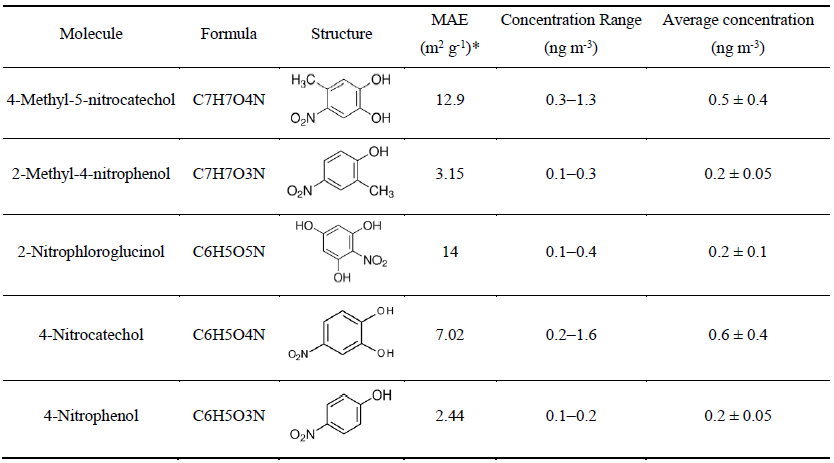
* Xie et al. (2017).
3.5.2 Concentration and light absorption of the potential brown carbon molecules
In order to identify potential brown carbon molecules besides the NAC from the about 2000 oxygenated organic molecules detected in the mass spectra of the FIGAERO–CIMS, we used the method described by Lin et al. (2018). From plotting a double bond equivalent (DBE) vs. a number of carbon atoms per molecule, we assigned 321 potential BrC molecules. Detailed information about this method is shown in Supplement Sect. 2 and Fig. S15. The mass fraction of potential BrC in 10 filters only accounted for 2.5 ± 0.6 % of organic aerosol measured by AMS (Fig. 6b). The mass of the total potential BrC molecules shows a good correlation (r2=0.7) with MS-BrC absorption at 365 nm (Fig. 6a). Furthermore, most of the individual potential BrC molecules correlated well with MS-BrC absorption at 365 nm (Table S8). Therefore, this method seems to be useful to find potential or unknown brown carbon molecules in high-resolution mass spectra. Also applying the method described by Lin et al. (2018), Tang et al. (2020) found that high-molecular-weight potential brown carbon molecules had good correlations (r=0.9) with MAE365. Xu et al. (2020) found 149 nitrogen-containing potential BrC chromophores from biomass burning emissions in the Tibetan Plateau. Since the MAE365 of most potential brown carbon molecules is still unknown, we assumed an average MAE365 of 9.5 m2 g−1 for 316 potential brown carbon molecules. This is the average MAE365 of 12 typical NACs (Table S9) (Xie et al., 2020). Based on this assumption, we calculated a mean light absorption of the 316 potential BrC molecules of 1.2 ± 0.2 Mm−1, accounting for 32 ± 15 % of MS-BrC absorption at 365 nm (Fig. 6c).

Figure 6The correlation of Abs365 and total potential BrC (a). Mass (b) and absorption (c) contribution of the total potential BrC. The red pie: BrC; the green pie: No_BrC.
3.5.3 Correlation of PARAFAC components with the potential BrC molecules
The potential BrC molecules could be assigned to the four different chromophore factors (C1–C4) identified by the PARAFAC analysis based on their individual correlations. The detailed correlation and assignments are shown in Supplement Sect. 3 and Table S10. The molecular weight, , DBE, and modified aromaticity index (AImod) in Table S11 are intensity-weighted mean values. As shown in Table S11, 29 % of the total potential BrC molecules are associated with LO-HULIS (component C1) and accounted for 17 ± 4 % of the total potential BrC mass concentration. These molecules comprised 55 CxHyOzN1 molecules which accounted for 62 ± 1 % of their mass concentration. Furthermore, these molecules show a relatively high average molecular weight of 265 ± 2 Da, a high DBE (5.8 ± 0.04), a high AImod (0.23 ± 0.02), and a relatively low average ratio of 0.8 ± 0.01 (Fig. 7a, Table S11). The LO-HULIS components were enriched with nitrogen-containing molecules with relatively high molecular weight and a relatively low oxidation state. The molecules associated with HO-HULIS-1 (C2) accounted for 14 ± 2 % of the total potential BrC mass concentration. The CxHyOzN1 molecules only account for 9 ± 0.3 % of their mass concentration. The average ratio, molecular weight, DBE, and AImod were 0.9 ± 0.01, 170 ± 1 Da, 3.6 ± 0.03, and 0.16 ± 0.01 respectively (Fig. 7b and Table S11). Therefore, HO-HULIS-1 compounds are highly oxidized and have substantially lower nitrogen-containing molecules, as well as a lower molecular weight. In contrast, the molecules associated with HO-HULIS-2 (C3) accounted for 34 ± 4 % of the total potential BrC mass concentration. These molecules comprised 16 CxHyOzN1 molecules which only accounted for 9 ± 0.3 % mass concentration. The average molecular weight, ratio, DBE, and AImod of the HO-HULIS-2 molecules were 166 ± 1 Da, 1.0 ± 0.02, 3.4 ± 0.02, and 0.10 ± 0.01 respectively (Fig. 7c, Table S11). The HO-HULIS components had a relatively low molecular mass and a lower fraction of nitrogen-containing molecules compared to the LO-HULIS component. The phenol- and naphthalene-like components (C4) were associated with a few molecules which only accounted for 5 ± 1 % of the total potential BrC mass concentration. The average ratio, molecular weight, DBE, and AImod were 0.8 ± 0.03, 163 ± 8 Da, 3.8 ± 0.02, and 0.10 ± 0.01 (Fig. 7d, Table S11). The CxHyOzN1 molecules account for 32 ± 2 % of their mass concentration. In the above discussion, we conclude that NACs and the potential BrC molecules had a low contribution to organic mass concentration, but can explain a high contribution of absorption coefficients of BrC at 365 nm. The LO-HULIS-associated molecules had a higher molecular weight, a higher DBE, a higher AImod, and higher contributions of nitrogen-containing molecules compared to molecules associated with HO-HULIS chromophores.
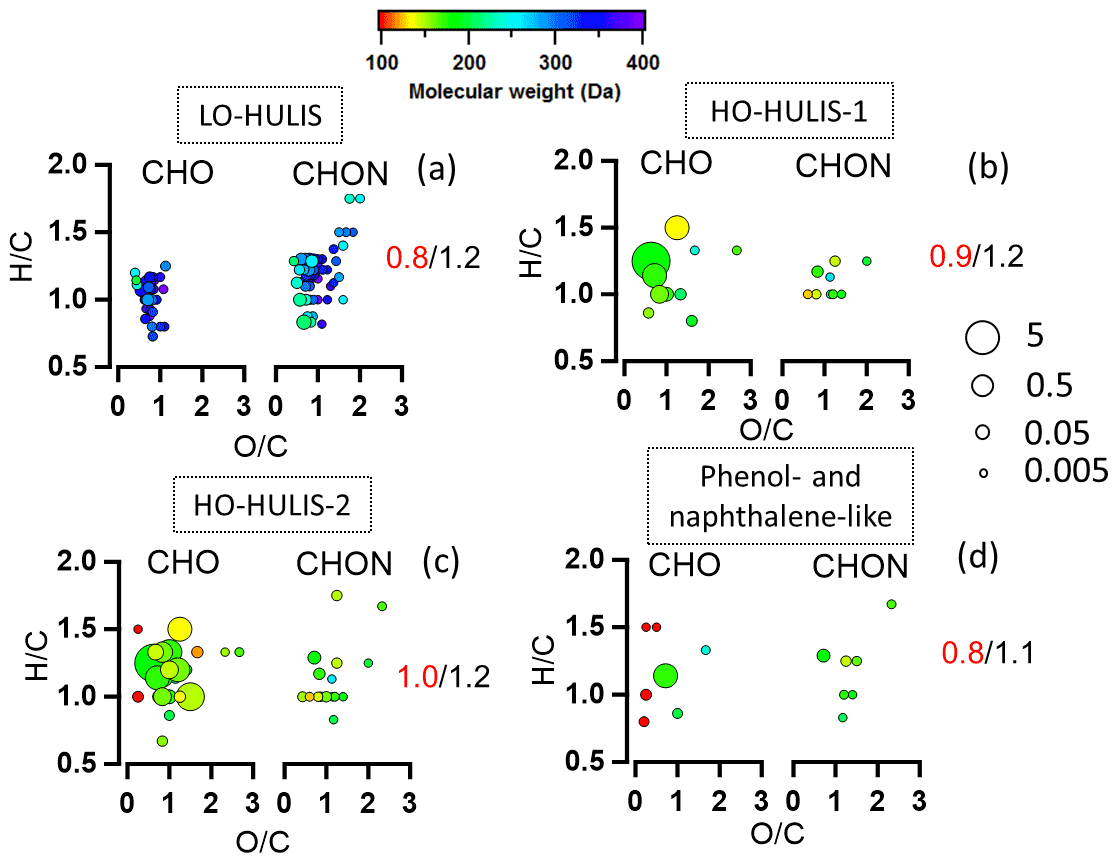
Figure 7The van Krevelen plots of molecule families associated with each PARAFAC component (C1–C4). Data points are coloured by molecular weight. The molecules are split by CxHyOz and CxHyOzN1. The values in each plot are ratios (red) and ratios (black). The size of the circles is the relative contribution to the total brown carbon signals of each compound. (a) Molecules associated with the LO-HULIS component; (b) molecules associated with the HO-HULIS-1 component; (c) molecules associated with the HO-HULIS-2 component; (d) molecules associated with the phenol- and naphthalene-like component.
In this paper, the optical properties and chromophores of methanol-soluble brown carbon (MS-BrC) aerosol particles were investigated during July 2019 and February–March 2020 in downtown Karlsruhe, a city of 300 000 inhabitants in southwestern Germany. The average Abs365 and MAE365 of MS-BrC were lower in the summer period (1.6 ± 0.5 Mm−1, 0.5 ± 0.2 m2 g−1) than in the winter period (2.8 ± 1.9 Mm−1, 1.1 ± 0.3 m2 g−1). In addition, the optical properties of MS-BrC in summer and winter can be classified as weakly absorptive BrC and moderately absorptive BrC, respectively, corresponding to the higher abundance and strong light absorption of BrC in winter.
The excitation–emission analysis of the methanol-soluble aerosol particle fraction showed that chromophores like HO-HULIS (C2 and C3) dominated the total fluorescence in summer with a relative fraction of 96 ± 6 %. In winter, the LO-HULIS (C1) dominated the total fluorescence with 57 ± 12 %, while the HO-HULIS still had a fraction of 31 ± 18 %. This shows that the chromophore types substantially differ for winter and summer. The statistical analysis of AMS data (PMF) and Aqualog excitation–emission spectra (PARAFAC) showed that the LO-HULIS components in winter were mainly emitted from biomass burning. In contrast, the HO-HULIS components dominating in summer could be low-volatility oxygenated organic aerosol from regional transport and oxidation of biogenic volatile organic compounds (VOC).
Furthermore, five nitro-aromatic compounds (NACs) were identified by CIMS (C7H7O3N, C7H7O4N, C6H5O5N, C6H5O4N, and C6H5O3N) which contributed 0.03 ± 0.01 % of the total organic mass, but can explain 0.3 ± 0.1 % of the absorption coefficients of MS-BrC at 365 nm in winter. A total of 316 potential brown carbon molecules were assigned, accounting for 2.5 ± 0.6 % of the organic mass but explaining 32 ± 15 % of the absorption at 365 nm if assuming an average MAE365 of 9.5 m2 g−1. This shows that a small fraction of brown carbon molecules dominates the overall absorption. This indicates the great importance of identifying these molecules to predict aerosol absorption. The potential BrC molecules assigned to LO-HULIS chromophores included more nitrogen-containing molecules (62 ± 1 %), a higher average molecular weight (265 ± 2 Da), a higher double bond equivalent (5.8 ± 0.04), and a higher modified aromaticity index (0.23 ± 0.02) than the molecules assigned to the HO-HULIS chromophores.
As discussed above, our results suggest that LO-HULIS was emitted from biomass burning in winter and the dominating HO-HULIS could be low-volatility oxygenated organic aerosol from regional transport and oxidation of biogenic volatile organic compounds (VOCs) in summer. However, the latter has significantly lower light absorption coefficients. Furthermore, the results show that five NACs and 316 potential brown carbon molecules only account for relatively low mass concentrations, but they have a substantial contribution to total light absorption at 365 nm. And the LO-HULIS-associated molecules had a high molecular weight, a high double bond equivalent, a high modified aromaticity index, and high contributions of nitrogen-containing molecules. However, HO-HULIS-associated molecules have a low molecular weight, a low double bond equivalent, a low modified aromaticity index, and low contributions of nitrogen-containing molecules. Excitation–emission spectroscopy is a useful tool to investigate the optical properties and chromophores of brown carbon. Especially with the combination of mass spectrometry, it can provide new insights into potential sources and the chemical composition of chromophores. Overall, this study provides good insight into the optical properties and chemical characteristics of brown carbon in central Europe by using excitation–emission spectroscopy and mass spectrometry.
The data are available via the repository KITopen (https://doi.org/10.5445/IR/1000152116, Jiang et al., 2022). Data are available upon request to the corresponding author.
The supplement related to this article is available online at: https://doi.org/10.5194/acp-22-14971-2022-supplement.
FJ operated aethalometers and took the filter samples during the winter campaign, analysed the filters by CIMS and Aqualog in the laboratory, did the CIMS and Aqualog data analysis, produced all figures, and wrote and edited the paper; JS operated the AMS and analysed the AMS data including PMF. JB took the daily quartz filter samples; LG operated AMS and took the CIMS filter samples during the field campaigns; MV took the CIMS filter samples during the campaigns; RG helped to install the container and to do the daily filter sampling; SN and TL gave general advice and comments for this paper. HS organized the campaigns and did the trace gas, particle number and size distribution, and meteorological data analysis. All authors provided suggestions for the data analysis, interpretation, and discussion, and contributed to the final text.
At least one of the (co-)authors is a member of the editorial board of Atmospheric Chemistry and Physics. The peer-review process was guided by an independent editor, and the authors also have no other competing interests to declare.
Publisher's note: Copernicus Publications remains neutral with regard to jurisdictional claims in published maps and institutional affiliations.
The authors gratefully thank the staff at IMK-AAF and KIT-IGG for providing substantial technical support during the two field campaigns. Furthermore, Feng Jiang, Junwei Song, and Linyu Gao are thankful for the support from the China Scholarship Council (CSC).
The article processing charges for this open-access publication were covered by the Karlsruhe Institute of Technology (KIT).
This paper was edited by Theodora Nah and reviewed by three anonymous referees.
Baduel, C., Voisin, D., and Jaffrezo, J. L.: Seasonal variations of concentrations and optical properties of water soluble HULIS collected in urban environments, Atmos. Chem. Phys., 10, 4085–4095, https://doi.org/10.5194/acp-10-4085-2010, 2010.
Brown, H., Liu, X., Pokhrel, R., Murphy, S., Lu, Z., Saleh, R., Mielonen, T., Kokkola, H., Bergman, T., Myhre, G., Skeie, R. B., Watson-Paris, D., Stier, P., Johnson, B., Bellouin, N., Schulz, M., Vakkari, V., Beukes, J. P., van Zyl, P. G., Liu, S., and Chand, D.: Biomass burning aerosols in most climate models are too absorbing, Nat. Commun., 12, 277, https://doi.org/10.1038/s41467-020-20482-9, 2021.
Chen, Q. C., Miyazaki, Y., Kawamura, K., Matsumoto, K., Coburn, S., Volkamer, R., Iwamoto, Y., Kagami, S., Deng, Y. G., Ogawa, S., Ramasamy, S., Kato, S., Ida, A., Kajii, Y., and Mochida, M.: Characterization of Chromophoric Water-Soluble Organic Matter in Urban, Forest, and Marine Aerosols by HR-ToF-AMS Analysis and Excitation Emission Matrix Spectroscopy, Environ. Sci. Technol., 50, 10351–10360, https://doi.org/10.1021/acs.est.6b01643, 2016.
Chen, Q. C., Mu, Z., Song, W. H., Wang, Y. Q., Yang, Z. H., Zhang, L. X., and Zhang, Y. L.: Size-Resolved Characterization of the Chromophores in Atmospheric Particulate Matter From a Typical Coal-Burning City in China, J. Geophys. Res.-Atmos., 124, 10546–10563, https://doi.org/10.1029/2019jd031149, 2019.
Chen, Q. C., Li, J. W., Hua, X. Y., Jiang, X. T., Mu, Z., Wang, M. M., Wang, J., Shan, M., Yang, X. D., Fan, X. J., Song, J. Z., Wang, Y. Q., Guan, D. J., and Du, L.: Identification of species and sources of atmospheric chromophores by fluorescence excitation-emission matrix with parallel factor analysis, Sci. Total Environ., 718, 137322, https://doi.org/10.1016/j.scitotenv.2020.137322, 2020.
Chen, Q. C., Hua, X. Y., Li, J. W., Chang, T., and Wang, Y. Q.: Diurnal evolutions and sources of water-soluble chromophoric aerosols over Xi'an during haze event, in Northwest China, Sci. Total Environ., 786, 147412, https://doi.org/10.1016/j.scitotenv.2021.147412, 2021.
Cory, R. M. and McKnight, D. M.: Fluorescence spectroscopy reveals ubiquitous presence of oxidized and reduced quinones in dissolved organic matter, Environ. Sci. Technol., 39, 8142–8149, https://doi.org/10.1021/es0506962, 2005.
Crippa, M., Canonaco, F., Lanz, V. A., Aijala, M., Allan, J. D., Carbone, S., Capes, G., Ceburnis, D., Dall'Osto, M., Day, D. A., DeCarlo, P. F., Ehn, M., Eriksson, A., Freney, E., Hildebrandt Ruiz, L., Hillamo, R., Jimenez, J. L., Junninen, H., Kiendler-Scharr, A., Kortelainen, A. M., Kulmala, M., Laaksonen, A., Mensah, A., Mohr, C., Nemitz, E., O'Dowd, C., Ovadnevaite, J., Pandis, S. N., Petaja, T., Poulain, L., Saarikoski, S., Sellegri, K., Swietlicki, E., Tiitta, P., Worsnop, D. R., Baltensperger, U., and Prevot, A. S. H.: Organic aerosol components derived from 25 AMS data sets across Europe using a consistent ME-2 based source apportionment approach, Atmos. Chem. Phys., 14, 6159–6176, https://doi.org/10.5194/acp-14-6159-2014, 2014.
Deng, J. J., Ma, H., Wang, X. F., Zhong, S. J., Zhang, Z. M., Zhu, J. L., Fan, Y. B., Hu, W., Wu, L. B., Li, X. D., Ren, L. J., Pavuluri, C. M., Pan, X. L., Sun, Y. L., Wang, Z. F., Kawamura, K., and Fu, P. Q.: Measurement report: Optical properties and sources of water-soluble brown carbon in Tianjin, North China insights from organic molecular compositions, Atmos. Chem. Phys., 22, 6449–6470, https://doi.org/10.5194/acp-22-6449-2022, 2022.
Feng, Y., Ramanathan, V., and Kotamarthi, V. R.: Brown carbon: a significant atmospheric absorber of solar radiation?, Atmos. Chem. Phys., 13, 8607–8621, https://doi.org/10.5194/acp-13-8607-2013, 2013.
Hagemann, R., Corsmeier, U., Kottmeier, C., Rinke, R., Wieser, A., and Vogel, B.: Spatial variability of particle number concentrations and NOx in the Karlsruhe (Germany) area obtained with the mobile laboratory “AERO-TRAM”, Atmos. Environ., 94, 341–352, https://doi.org/10.1016/j.atmosenv.2014.05.051, 2014.
He, Q. F., Tomaz, S., Li, C. L., Zhu, M., Meidan, D., Riva, M., Laskin, A., Brown, S. S., George, C., Wang, X. M., and Rudich, Y.: Optical Properties of Secondary Organic Aerosol Produced by Nitrate Radical Oxidation of Biogenic Volatile Organic Compounds, Environ. Sci. Technol., 55, 2878–2889, https://doi.org/10.1021/acs.est.0c06838, 2021.
Hecobian, A., Zhang, X., Zheng, M., Frank, N., Edgerton, E. S., and Weber, R. J.: Water-Soluble Organic Aerosol material and the light-absorption characteristics of aqueous extracts measured over the Southeastern United States, Atmos. Chem. Phys., 10, 5965–5977, https://doi.org/10.5194/acp-10-5965-2010, 2010.
Hettiyadura, A. P. S., Garcia, V., Li, C., West, C. P., Tomlin, J., He, Q., Rudich, Y., and Laskin, A.: Chemical Composition and Molecular-Specific Optical Properties of Atmospheric Brown Carbon Associated with Biomass Burning, Environ. Sci. Technol., 55, 2511–2521, https://doi.org/10.1021/acs.est.0c05883, 2021.
Huang, R.-J., Yang, L., Cao, J., Chen, Y., Chen, Q., Li, Y., Duan, J., Zhu, C., Dai, W., Wang, K., Lin, C., Ni, H., Corbin, J. C., Wu, Y., Zhang, R., Tie, X., Hoffmann, T., O'Dowd, C., and Dusek, U.: Brown Carbon Aerosol in Urban Xi'an, Northwest China: The Composition and Light Absorption Properties, Environ. Sci. Technol., 52, 6825–6833, https://doi.org/10.1021/acs.est.8b02386, 2018.
Huang, W., Saathoff, H., Shen, X. L., Ramisetty, R., Leisner, T., and Mohr, C.: Seasonal characteristics of organic aerosol chemical composition and volatility in Stuttgart, Germany, Atmos. Chem. Phys., 19, 11687–11700, https://doi.org/10.5194/acp-19-11687-2019, 2019.
Jacobson, M. Z.: Investigating cloud absorption effects: Global absorption properties of black carbon, tar balls, and soil dust in clouds and aerosols, J. Geophys. Res.-Atmos., 117, D06205, https://doi.org/10.1029/2011jd017218, 2012.
Jiang, H. H., Frie, A. L., Lavi, A., Chen, J. Y., Zhang, H. F., Bahreini, R., and Lin, Y. H.: Brown Carbon Formation from Nighttime Chemistry of Unsaturated Heterocyclic Volatile Organic Compounds, Environ. Sci. Technol. Lett., 6, 184–190, https://doi.org/10.1021/acs.estlett.9b00017, 2019.
Jiang, F., Song, J., Bauer, J., Gao, L., Vallon, M., Gebhardt, R., Leisner, T., and Saathoff, H.: Chromophores and chemical composition of brown carbon characterized at an urban kerbside by excitation-emission spectroscopy and mass spectrometry, KITopen [data set], https://doi.org/10.5445/IR/1000152116, 2022.
Kasthuriarachchi, N. Y., Rivellini, L. H., Adam, M. G., and Lee, A. K. Y.: Light Absorbing Properties of Primary and Secondary Brown Carbon in a Tropical Urban Environment, Environ. Sci. Technol., 54, 10808–10819, https://doi.org/10.1021/acs.est.0c02414, 2020.
Laskin, A., Laskin, J., and Nizkorodov, S. A.: Chemistry of Atmospheric Brown Carbon, Chem. Rev., 115, 4335–4382, https://doi.org/10.1021/cr5006167, 2015.
Lee, H. J., Laskin, A., Laskin, J., and Nizkorodov, S. A.: Excitation-Emission Spectra and Fluorescence Quantum Yields for Fresh and Aged Biogenic Secondary Organic Aerosols, Environ. Sci. Technol., 47, 5763–5770, https://doi.org/10.1021/es400644c, 2013.
Li, X., Wang, Y. J., Hu, M., Tan, T. Y., Li, M. R., Wu, Z. J., Chen, S. Y., and Tang, X. Y.: Characterizing chemical composition and light absorption of nitroaromatic compounds in the winter of Beijing, Atmos. Environ., 237, 117712, https://doi.org/10.1016/j.atmosenv.2020.117712, 2020.
Lin, P., Aiona, P. K., Li, Y., Shiraiwa, M., Laskin, J., Nizkorodov, S. A., and Laskin, A.: Molecular Characterization of Brown Carbon in Biomass Burning Aerosol Particles, Environ. Sci. Technol., 50, 11815–11824, https://doi.org/10.1021/acs.est.6b03024, 2016.
Lin, P., Fleming, L. T., Nizkorodov, S. A., Laskin, J., and Laskin, A.: Comprehensive Molecular Characterization of Atmospheric Brown Carbon by High Resolution Mass Spectrometry with Electrospray and Atmospheric Pressure Photoionization, Anal. Chem., 90, 12493–12502, https://doi.org/10.1021/acs.analchem.8b02177, 2018.
Linke, C., Ibrahim, I., Schleicher, N., Hitzenberger, R., Andreae, M. O., Leisner, T., and Schnaiter, M.: A novel single-cavity three-wavelength photoacoustic spectrometer for atmospheric aerosol research, Atmos. Meas. Tech., 9, 5331–5346, https://doi.org/10.5194/amt-9-5331-2016, 2016.
Liu, D., Li, S., Hu, D., Kong, S., Cheng, Y., Wu, Y., Ding, S., Hu, K., Zheng, S., Yan, Q., Zheng, H., Zhao, D., Tian, P., Ye, J., Huang, M., and Ding, D.: Evolution of Aerosol Optical Properties from Wood Smoke in Real Atmosphere Influenced by Burning Phase and Solar Radiation, Environ. Sci. Technol., 55, 5677–5688, https://doi.org/10.1021/acs.est.0c07569, 2021.
Lopez-Hilfiker, F. D., Mohr, C., Ehn, M., Rubach, F., Kleist, E., Wildt, J., Mentel, T. F., Lutz, A., Hallquist, M., Worsnop, D., and Thornton, J. A.: A novel method for online analysis of gas and particle composition: description and evaluation of a Filter Inlet for Gases and AEROsols (FIGAERO), Atmos. Meas. Tech., 7, 983–1001, https://doi.org/10.5194/amt-7-983-2014, 2014.
Lopez-Hilfiker, F. D., Iyer, S., Mohr, C., Lee, B. H., D'Ambro, E. L., Kurten, T., and Thornton, J. A.: Constraining the sensitivity of iodide adduct chemical ionization mass spectrometry to multifunctional organic molecules using the collision limit and thermodynamic stability of iodide ion adducts, Atmos. Meas. Tech., 9, 1505–1512, https://doi.org/10.5194/amt-9-1505-2016, 2016.
Matos, J. T. V., Freire, S., Duarte, R., and Duarte, A. C.: Natural organic matter in urban aerosols: Comparison between water and alkaline soluble components using excitation-emission matrix fluorescence spectroscopy and multiway data analysis, Atmos. Environ., 102, 1–10, https://doi.org/10.1016/j.atmosenv.2014.11.042, 2015.
Mladenov, N., Alados-Arboledas, L., Olmo, F. J., Lyamani, H., Delgado, A., Molina, A., and Reche, I.: Applications of optical spectroscopy and stable isotope analyses to organic aerosol source discrimination in an urban area, Atmos. Environ., 45, 1960–1969, https://doi.org/10.1016/j.atmosenv.2011.01.029, 2011.
Mohr, C., DeCarlo, P. F., Heringa, M. F., Chirico, R., Slowik, J. G., Richter, R., Reche, C., Alastuey, A., Querol, X., Seco, R., Penuelas, J., Jimenez, J. L., Crippa, M., Zimmermann, R., Baltensperger, U., and Prevot, A. S. H.: Identification and quantification of organic aerosol from cooking and other sources in Barcelona using aerosol mass spectrometer data, Atmos. Chem. Phys., 12, 1649–1665, https://doi.org/10.5194/acp-12-1649-2012, 2012.
Mohr, C., Lopez-Hilfiker, F. D., Zotter, P., Prevot, A. S. H., Xu, L., Ng, N. L., Herndon, S. C., Williams, L. R., Franklin, J. P., Zahniser, M. S., Worsnop, D. R., Knighton, W. B., Aiken, A. C., Gorkowski, K. J., Dubey, M. K., Allan, J. D., and Thornton, J. A.: Contribution of Nitrated Phenols to Wood Burning Brown Carbon Light Absorption in Detling, United Kingdom during Winter Time, Environ. Sci. Technol., 47, 6316–6324, https://doi.org/10.1021/es400683v, 2013.
Moise, T., Flores, J. M., and Rudich, Y.: Optical Properties of Secondary Organic Aerosols and Their Changes by Chemical Processes, Chem. Rev., 115, 4400–4439, https://doi.org/10.1021/cr5005259, 2015.
Montoya-Aguilera, J., Horne, J. R., Hinks, M. L., Fleming, L. T., Perraud, V., Lin, P., Laskin, A., Laskin, J., Dabdub, D., and Nizkorodov, S. A.: Secondary organic aerosol from atmospheric photooxidation of indole, Atmos. Chem. Phys., 17, 11605–11621, https://doi.org/10.5194/acp-17-11605-2017, 2017.
Moschos, V., Kumar, N. K., Daellenbach, K. R., Baltensperger, U., Prevot, A. S. H., and El Haddad, I.: Source Apportionment of Brown Carbon Absorption by Coupling Ultraviolet-Visible Spectroscopy with Aerosol Mass Spectrometry, Environ. Sci. Technol. Lett., 5, 302–308, https://doi.org/10.1021/acs.estlett.8b00118, 2018.
Moschos, V., Gysel-Beer, M., Modini, R. L., Corbin, J. C., Massabo, D., Costa, C., Danelli, S. G., Vlachou, A., Daellenbach, K. R., Szidat, S., Prati, P., Prevot, A. S. H., Baltensperger, U., and El Haddad, I.: Source-specific light absorption by carbonaceous components in the complex aerosol matrix from yearly filter-based measurements, Atmos. Chem. Phys., 21, 12809–12833, https://doi.org/10.5194/acp-21-12809-2021, 2021.
Murphy, K. R., Stedmon, C. A., Graeber, D., and Bro, R.: Fluorescence spectroscopy and multi-way techniques. PARAFAC, Anal. Method., 5, 6557–6566, https://doi.org/10.1039/c3ay41160e, 2013.
Nakayama, T., Sato, K., Matsumi, Y., Imamura, T., Yamazaki, A., and Uchiyama, A.: Wavelength and NOx dependent complex refractive index of SOAs generated from the photooxidation of toluene, Atmos. Chem. Phys., 13, 531–545, https://doi.org/10.5194/acp-13-531-2013, 2013.
Olson, M. R., Garcia, M. V., Robinson, M. A., Van Rooy, P., Dietenberger, M. A., Bergin, M., and Schauer, J. J.: Investigation of black and brown carbon multiple-wavelength-dependent light absorption from biomass and fossil fuel combustion source emissions, J. Geophys. Res.-Atmos., 120, 6682–6697, https://doi.org/10.1002/2014jd022970, 2015.
Palm, B. B., Peng, Q. Y., Fredrickson, C. D., Lee, B., Garofalo, L. A., Pothier, M. A., Kreidenweis, S. M., Farmer, D. K., Pokhrel, R. P., Shen, Y. J., Murphy, S. M., Permar, W., Hu, L., Campos, T. L., Hall, S. R., Ullmann, K., Zhang, X., Flocke, F., Fischer, E. V., and Thornton, J. A.: Quantification of organic aerosol and brown carbon evolution in fresh wildfire plumes, P. Natl. Acad. Sci. USA, 117, 29469–29477, https://doi.org/10.1073/pnas.2012218117, 2020.
Pucher, M., Wunsch, U., Weigelhofer, G., Murphy, K., Hein, T., and Graeber, D.: staRdom: Versatile Software for Analyzing Spectroscopic Data of Dissolved Organic Matter in R, Water, 11, 2366, https://doi.org/10.3390/w11112366, 2019.
Saleh, R.: From Measurements to Models: Toward Accurate Representation of Brown Carbon in Climate Calculations, Curr. Pollut. Rep., 6, 90–104, https://doi.org/10.1007/s40726-020-00139-3, 2020.
Salvador, C. M. G., Tang, R. Z., Priestley, M., Li, L. J., Tsiligiannis, E., Le Breton, M., Zhu, W. F., Zeng, L. M., Wang, H., Yu, Y., Hu, M., Guo, S., and Hallquist, M.: Ambient nitro-aromatic compounds – biomass burning versus secondary formation in rural China, Atmos. Chem. Phys., 21, 1389–1406, https://doi.org/10.5194/acp-21-1389-2021, 2021.
Satish, R., Shamjad, P., Thamban, N., Tripathi, S., and Rastogi, N.: Temporal Characteristics of Brown Carbon over the Central Indo-Gangetic Plain, Environ. Sci. Technol., 51, 6765–6772, https://doi.org/10.1021/acs.est.7b00734, 2017.
Sekimoto, K., Inomata, S., Tanimoto, H., Fushimi, A., Fujitani, Y., Sato, K., and Yamada, H.: Characterization of nitromethane emission from automotive exhaust, Atmos. Environ., 81, 523–531, https://doi.org/10.1016/j.atmosenv.2013.09.031, 2013.
Shen, X., Vogel, H., Vogel, B., Huang, W., Mohr, C., Ramisetty, R., Leisner, T., Prévôt, A. S. H., and Saathoff, H.: Composition and origin of PM2.5 aerosol particles in the upper Rhine valley in summer, Atmos. Chem. Phys., 19, 13189–13208, https://doi.org/10.5194/acp-19-13189-2019, 2019.
Shrivastava, M., Cappa, C. D., Fan, J. W., Goldstein, A. H., Guenther, A. B., Jimenez, J. L., Kuang, C., Laskin, A., Martin, S. T., Ng, N. L., Petaja, T., Pierce, J. R., Rasch, P. J., Roldin, P., Seinfeld, J. H., Shilling, J., Smith, J. N., Thornton, J. A., Volkamer, R., Wang, J., Worsnop, D. R., Zaveri, R. A., Zelenyuk, A., and Zhang, Q.: Recent advances in understanding secondary organic aerosol: Implications for global climate forcing, Rev. Geophys., 55, 509–559, https://doi.org/10.1002/2016rg000540, 2017.
Siegel, K., Karlsson, L., Zieger, P., Baccarini, A., Schmale, J., Lawler, M., Salter, M., Leck, C., Ekman, A. M. L., Riipinen, I., and Mohr, C.: Insights into the molecular composition of semi-volatile aerosols in the summertime central Arctic Ocean using FIGAERO-CIMS, Environ. Sci. Atmos., 1, 161–175, https://doi.org/10.1039/d0ea00023j, 2021.
Song, J. W., Saathoff, H., Gao, L. Y., Gebhardt, R., Jiang, F., Vallon, M., Bauer, J., Norra, S., and Leisner, T.: Variations of PM2.5 sources in the context of meteorology and seasonality at an urban street canyon in Southwest Germany, Atmos. Environ., 282, 119147, https://doi.org/10.1016/j.atmosenv.2022.119147, 2022.
Song, K., Guo, S., Wang, H., Yu, Y., Wang, H., Tang, R., Xia, S., Gong, Y., Wan, Z., Lv, D., Tan, R., Zhu, W., Shen, R., Li, X., Yu, X., Chen, S., Zeng, L., and Huang, X.: Measurement report: Online measurement of gas-phase nitrated phenols utilizing a CI-LToF-MS: primary sources and secondary formation, Atmos. Chem. Phys., 21, 7917–7932, https://doi.org/10.5194/acp-21-7917-2021, 2021.
Stubbins, A., Lapierre, J. F., Berggren, M., Prairie, Y. T., Dittmar, T., and del Giorgio, P. A.: What's in an EEM? Molecular Signatures Associated with Dissolved Organic Fluorescence in Boreal Canada, Environ. Sci. Technol., 48, 10598–10606, https://doi.org/10.1021/es502086e, 2014.
Tang, J., Li, J., Su, T., Han, Y., Mo, Y. Z., Jiang, H. X., Cui, M., Jiang, B., Chen, Y. J., Tang, J. H., Song, J. Z., Peng, P. A., and Zhang, G.: Molecular compositions and optical properties of dissolved brown carbon in biomass burning, coal combustion, and vehicle emission aerosols illuminated by excitation-emission matrix spectroscopy and Fourier transform ion cyclotron resonance mass spectrometry analysis, Atmos. Chem. Phys., 20, 2513–2532, https://doi.org/10.5194/acp-20-2513-2020, 2020.
Teich, M., van Pinxteren, D., Wang, M., Kecorius, S., Wang, Z. B., Muller, T., Mocnik, G., and Herrmann, H.: Contributions of nitrated aromatic compounds to the light absorption of water-soluble and particulate brown carbon in different atmospheric environments in Germany and China, Atmos. Chem. Phys., 17, 1653–1672, https://doi.org/10.5194/acp-17-1653-2017, 2017.
Ulbrich, I. M., Canagaratna, M. R., Zhang, Q., Worsnop, D. R., and Jimenez, J. L.: Interpretation of organic components from Positive Matrix Factorization of aerosol mass spectrometric data, Atmos. Chem. Phys., 9, 2891–2918, https://doi.org/10.5194/acp-9-2891-2009, 2009.
Wang, X., Heald, C. L., Liu, J. M., Weber, R. J., Campuzano-Jost, P., Jimenez, J. L., Schwarz, J. P., and Perring, A. E.: Exploring the observational constraints on the simulation of brown carbon, Atmos. Chem. Phys., 18, 635–653, https://doi.org/10.5194/acp-18-635-2018, 2018.
Wu, G., Wan, X., Gao, S., Fu, P., Yin, Y., Li, G., Zhang, G., Kang, S., Ram, K., and Cong, Z.: Humic-like substances (HULIS) in aerosols of central Tibetan Plateau (Nam Co, 4730 m a.s.l.): Abundance, light absorption properties and sources, Environ. Sci. Technol., 52, 7203–7211, https://pubs.acs.org/doi/10.1021/acs.est.8b01251, 2018.
Xiao, R., Takegawa, N., Zheng, M., Kondo, Y., Miyazaki, Y., Miyakawa, T., Hu, M., Shao, M., Zeng, L., Gong, Y., Lu, K., Deng, Z., Zhao, Y., and Zhang, Y. H.: Characterization and source apportionment of submicron aerosol with aerosol mass spectrometer during the PRIDE-PRD 2006 campaign, Atmos. Chem. Phys., 11, 6911–6929, https://doi.org/10.5194/acp-11-6911-2011, 2011.
Xie, M., Chen, X., Hays, M. D., Lewandowski, M., Offenberg, J., Kleindienst, T. E., and Holder, A. L.: Light Absorption of Secondary Organic Aerosol: Composition and Contribution of Nitroaromatic Compounds, Environ. Sci. Technol., 51, 11607–11616, https://doi.org/10.1021/acs.est.7b03263, 2017.
Xie, M. J., Zhao, Z. Z., Holder, A. L., Hays, M. D., Chen, X., Shen, G. F., Jetter, J. J., Champion, W. M., and Wang, Q. G.: Chemical composition, structures, and light absorption of N-containing aromatic compounds emitted from burning wood and charcoal in household cookstoves, Atmos. Chem. Phys., 20, 14077–14090, https://doi.org/10.5194/acp-20-14077-2020, 2020.
Xu, J. Z., Hettiyadura, A. P. S., Liu, Y. M., Zhang, X. H., Kang, S. C., and Laskin, A.: Regional Differences of Chemical Composition and Optical Properties of Aerosols in the Tibetan Plateau, J. Geophys. Res.-Atmos., 125, e2019JD031226, https://doi.org/10.1029/2019jd031226, 2020.
Yan, G. and Kim, G.: Speciation and Sources of Brown Carbon in Precipitation at Seoul, Korea: Insights from Excitation-Emission Matrix Spectroscopy and Carbon Isotopic Analysis, Environ. Sci. Technol., 51, 11580–11587, https://doi.org/10.1021/acs.est.7b02892, 2017.
Yan, J., Wang, X., Gong, P., Wang, C., and Cong, Z.: Review of brown carbon aerosols: Recent progress and perspectives, Sci. Total Environ., 634, 1475–1485, https://doi.org/10.1016/j.scitotenv.2018.04.083, 2018.
Yuan, B., Liggio, J., Wentzell, J., Li, S. M., Stark, H., Roberts, J. M., Gilman, J., Lerner, B., Warneke, C., Li, R., Leithead, A., Osthoff, H. D., Wild, R., Brown, S. S., and de Gouw, J. A.: Secondary formation of nitrated phenols: insights from observations during the Uintah Basin Winter Ozone Study (UBWOS) 2014, Atmos. Chem. Phys., 16, 2139–2153, https://doi.org/10.5194/acp-16-2139-2016, 2016.
Zeng, L., Dibb, J., Scheuer, E., Katich, J. M., Schwarz, J. P., Bourgeois, I., Peischl, J., Ryerson, T., Warneke, C., Perring, A. E., Diskin, G. S., DiGangi, J. P., Nowak, J. B., Moore, R. H., Wiggins, E. B., Pagonis, D., Guo, H., Campuzano-Jost, P., Jimenez, J. L., Xu, L., and Weber, R. J.: Characteristics and evolution of brown carbon in western United States wildfires, Atmos. Chem. Phys., 22, 8009–8036, https://doi.org/10.5194/acp-22-8009-2022, 2022.
Zeng, L. H., Zhang, A. X., Wang, Y. H., Wagner, N. L., Katich, J. M., Schwarz, J. P., Schill, G. P., Brock, C., Froyd, K. D., Murphy, D. M., Williamson, C. J., Kupc, A., Scheuer, E., Dibb, J., and Weber, R. J.: Global Measurements of Brown Carbon and Estimated Direct Radiative Effects, Geophys. Res. Lett., 47, e2020GL088747, https://doi.org/10.1029/2020gl088747, 2020.
Zikova, N. and Zdimal, V.: Precipitation scavenging of aerosol particles at a rural site in the Czech Republic, Tellus B, 68, 27343, https://doi.org/10.3402/tellusb.v68.27343, 2016.