the Creative Commons Attribution 4.0 License.
the Creative Commons Attribution 4.0 License.
 | 23 Nov 2022
Vertical profiles of cloud condensation nuclei number concentration and its empirical estimate from aerosol optical properties over the North China Plain
Rui Zhang
Zhanqing Li
Zhibin Wang
Russell R. Dickerson
Xinrong Ren
Fei Wang
Ying Gao
Xi Chen
Jialu Xu
Yafang Cheng
To better understand the characteristics of aerosol activation ability and optical properties, a comprehensive airborne campaign was conducted over the North China Plain (NCP) from 8 May to 11 June 2016. Vertical profiles of cloud condensation nuclei (CCN) number concentration (NCCN) and aerosol optical properties were measured simultaneously. Seventy-two-hour air mass back trajectories show that during the campaign, the measurement region was mainly influenced by air masses from the northwest and southeast. Air mass sources, temperature structure, anthropogenic emissions, and terrain distribution are factors influencing NCCN profiles. Cloud condensation nuclei spectra suggest that the ability of aerosol to activate into CCN is stronger in southeasterly air masses than in northwesterly air masses and stronger in the free atmosphere than near the surface. Vertical distributions of the aerosol scattering Ångström exponent (SAE) indicate that aerosols near the surface mainly originate from primary emissions consisting of more fine particles. The long-distance transport decreases SAE and makes it vary more in the free troposphere than near the surface. To parameterize NCCN, the equation is used to fit the relationship between NCCN and the aerosol scattering coefficient (σ) at 450 nm. The fitting parameters β and γ have linear relationships with the SAE. Empirical estimates of NCCN at 0.7 % water vapor supersaturation (SS) from aerosol optical properties are thus retrieved for the two air masses: for northwesterly air masses and for southeasterly air masses. The estimated NCCN at 0.7 % SS agrees with that measured, although the performance differs between low and high concentrations in the two air masses. The results highlight the important impact of aerosol sources on the empirical estimate of NCCN from aerosol optical properties.
- Article
(2383 KB) - Full-text XML
-
Supplement
(2925 KB) - BibTeX
- EndNote


Defined as the mixture of solid and liquid particles suspended in the air, aerosols have a great impact on Earth's climate system via their direct and indirect effects (IPCC, 2021). They not only alter Earth's radiation budget by absorbing and scattering solar radiation directly (e.g., Bond et al., 2013) but also affect the radiation budget indirectly by serving as cloud condensation nuclei (CCN), modifying the microphysical properties of clouds (e.g., Lohmann and Feichter, 2005; Andreae and Rosenfeld, 2008). This is referred to as aerosol–cloud interactions (ACIs). Many studies suggest that good knowledge of the CCN activation ability is the key to quantitatively evaluating ACI and its radiative forcing in models (e.g., Rosenfeld et al., 2014, 2016; Z. Li et al., 2016, 2019; Liu and Li, 2014). However, this is uncertain because of the lack of comprehensive observations.
Cloud condensation nuclei are a subset of aerosols that can be activated at a certain water vapor supersaturation (SS). The activation ability is mainly determined by three aerosol properties, namely, particle size, chemical composition, and mixing state (e.g., Farmer et al., 2015; F. Zhang et al., 2017; Cai et al., 2018; Y. Wang et al., 2018). Previous studies have reported that these three factors have large spatiotemporal variabilities over different regions in the world (e.g., Juranyi et al., 2011; Paramonov et al., 2015; Schmale et al., 2018), especially in fast-developing countries like China (Z. Li et al., 2019). This increases the uncertainty of estimates of ACIs.
To evaluate the effect of aerosols on air quality and atmospheric radiative forcing in China, many field experiments have been carried out in recent years in some developed regions, such as the Pearl River Delta (PRD) (e.g., Rose et al., 2010), the Yangtze River Delta (YRD) (e.g., Leng et al., 2013), and the North China Plain (NCP) (e.g., Guo et al., 2015; F. Zhang et al., 2017; Ren et al., 2018). Some of these studies including measurements of CCN aimed at investigating the characteristics of CCN activation properties and the factors that influence them or establishing reasonable estimation schemes for CCN number concentration (NCCN). For example, Guo et al. (2015) discussed the change in CCN activation properties in a long-lasting severe fog and haze episode. F. Zhang et al. (2017) conducted NCCN closure experiments, finding that NCCN was well estimated using the data of aerosol size number concentration and bulk chemical composition, but it was influenced by the aerosol aging level. Ren et al. (2018) suggested that it is better to predict NCCN using aerosol size-resolved data rather than bulk chemical composition data. However, most of these studies were based on ground-based observations, which could not characterize the vertical distributions of CCN properties and NCCN profiles. The CCN activation ability and NCCN below cloud bases are key in quantifying ACIs (Rosenfeld et al., 2014; Z. Li et al., 2016). Therefore, it is necessary to do more studies about CCN profiles in China.
A commonly used platform to observe vertical distributions of NCCN and CCN activation ability is an aircraft (e.g., J. Li et al., 2015b; Jayachandran et al., 2020a; Manoj et al., 2021; Z. Cai et al., 2022). However, limited by high costs and technological complexity, current aircraft measurements are insufficient to quantify ACIs. Some studies have thus attempted to estimate NCCN using aerosol optical data that are much more plentiful (e.g., Andreae, 2009; Liu and Li, 2014; Tao et al., 2018). For example, Andreae (2009) built an exponential function between NCCN and aerosol optical depth (AOD). Liu and Li (2014) found that the relationship between NCCN and AOD becomes invalid when the relative humidity (RH) exceeds 75 %, and they developed new parameterized relationships to estimate NCCN accounting for RH, particle size, and single scattering albedo (SSA). Tao et al. (2018) established a lookup table that includes σ, hygroscopicity parameter (κ), and Ångström exponent (Å) for estimating NCCN based on the measurement of a three-wavelength humidified nephelometer system. The vertical profiles of NCCN were also predicted using lidar data. For example, Mamouri and Ansmann (2016) investigated the potential of polarization lidar data to estimate vertical distributions of NCCN. Lv et al. (2018) developed an algorithm for profiling NCCN using backscatter coefficients at 355, 532, and 1064 nm and extinction coefficients at 355 and 532 nm from multiwavelength lidar systems. Satellite lidar data of the Cloud–Aerosol Lidar and Infrared Pathfinder Satellite Observations (CALIPSO) have also been employed to retrieve NCCN (Choudhury and Tesche, 2022). Most of the retrieved NCCN profiles are yet to be validated against in situ NCCN profile measurements.
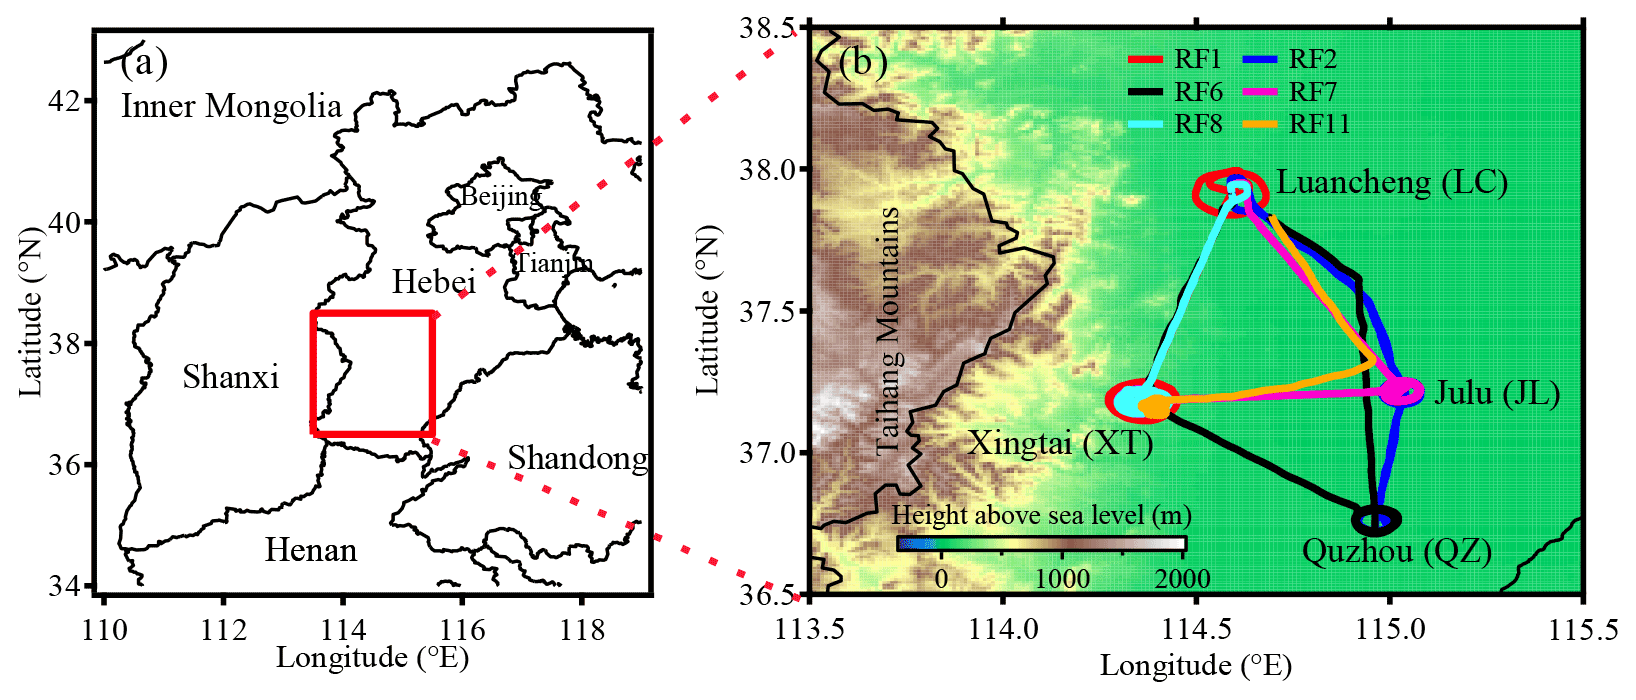
Figure 1(a) The geographic location of Hebei Province and (b) flight tracks of six flights conducted over the southern plain of Hebei Province from 8 May to 11 June 2016. The colored background shows terrain heights above sea level (unit: m). The number after “RF” indicates the research flight number.
Over the past few decades, rapid industrialization and urbanization have made the NCP one of the most heavily polluted regions in China. The large number of aerosols and gases emitted by human activities deteriorated air quality, strongly impacting the regional climate (e.g., Fan et al., 2016; Chen et al., 2022). The aerosol activation ability and optical properties in the NCP have drawn much attention (e.g., Zhang et al., 2016, 2017; Y. Wang et al., 2018). In light of this, we undertook a comprehensive airborne campaign in the NCP under the aegis of a project called Air chemistry Research In Asia (ARIAs). We directly measured profiles of NCCN and aerosol optical properties from an aircraft and analyzed the CCN activation property and relationships between NCCN and aerosol optical properties. The in situ measurements presented here are beneficial in validating lidar or satellite-based NCCN retrieval algorithms (e.g., Choudhury and Tesche, 2022). Moreover, this study will provide a perspective to improve aerosol–cloud parameterizations applied in the NCP. Analytical methods developed here will also be applicable to other regions of the world.
This paper is structured as follows. Details about the airborne campaign, instruments, and air mass sources are given in Sect. 2. Section 3 discusses and analyzes NCCN profiles at 0.7 % SS, vertical distributions of CCN spectra, and possible relationships between NCCN and aerosol optical properties. Section 4 summarizes the major conclusions of this study.
2.1 Airborne campaign
Hebei Province (36∘05′–42∘40′ N, 113∘27′–119∘50′ E) is located north of the Yellow River and east of the Taihang Mountains in the NCP. It surrounds the Beijing and Tianjin megacities, and borders Shangdong Province to the east, Shanxi Province to the west, Henan Province to the south, and the Inner Mongolia Autonomous Region to the north (Fig. 1a). The terrain of Hebei Province is high in the northwest and low in the southeast, with the altitude generally decreasing from the northwest to the southeast. The plain area covers most of Hebei Province, located in the eastern foothills of the Taihang Mountains.
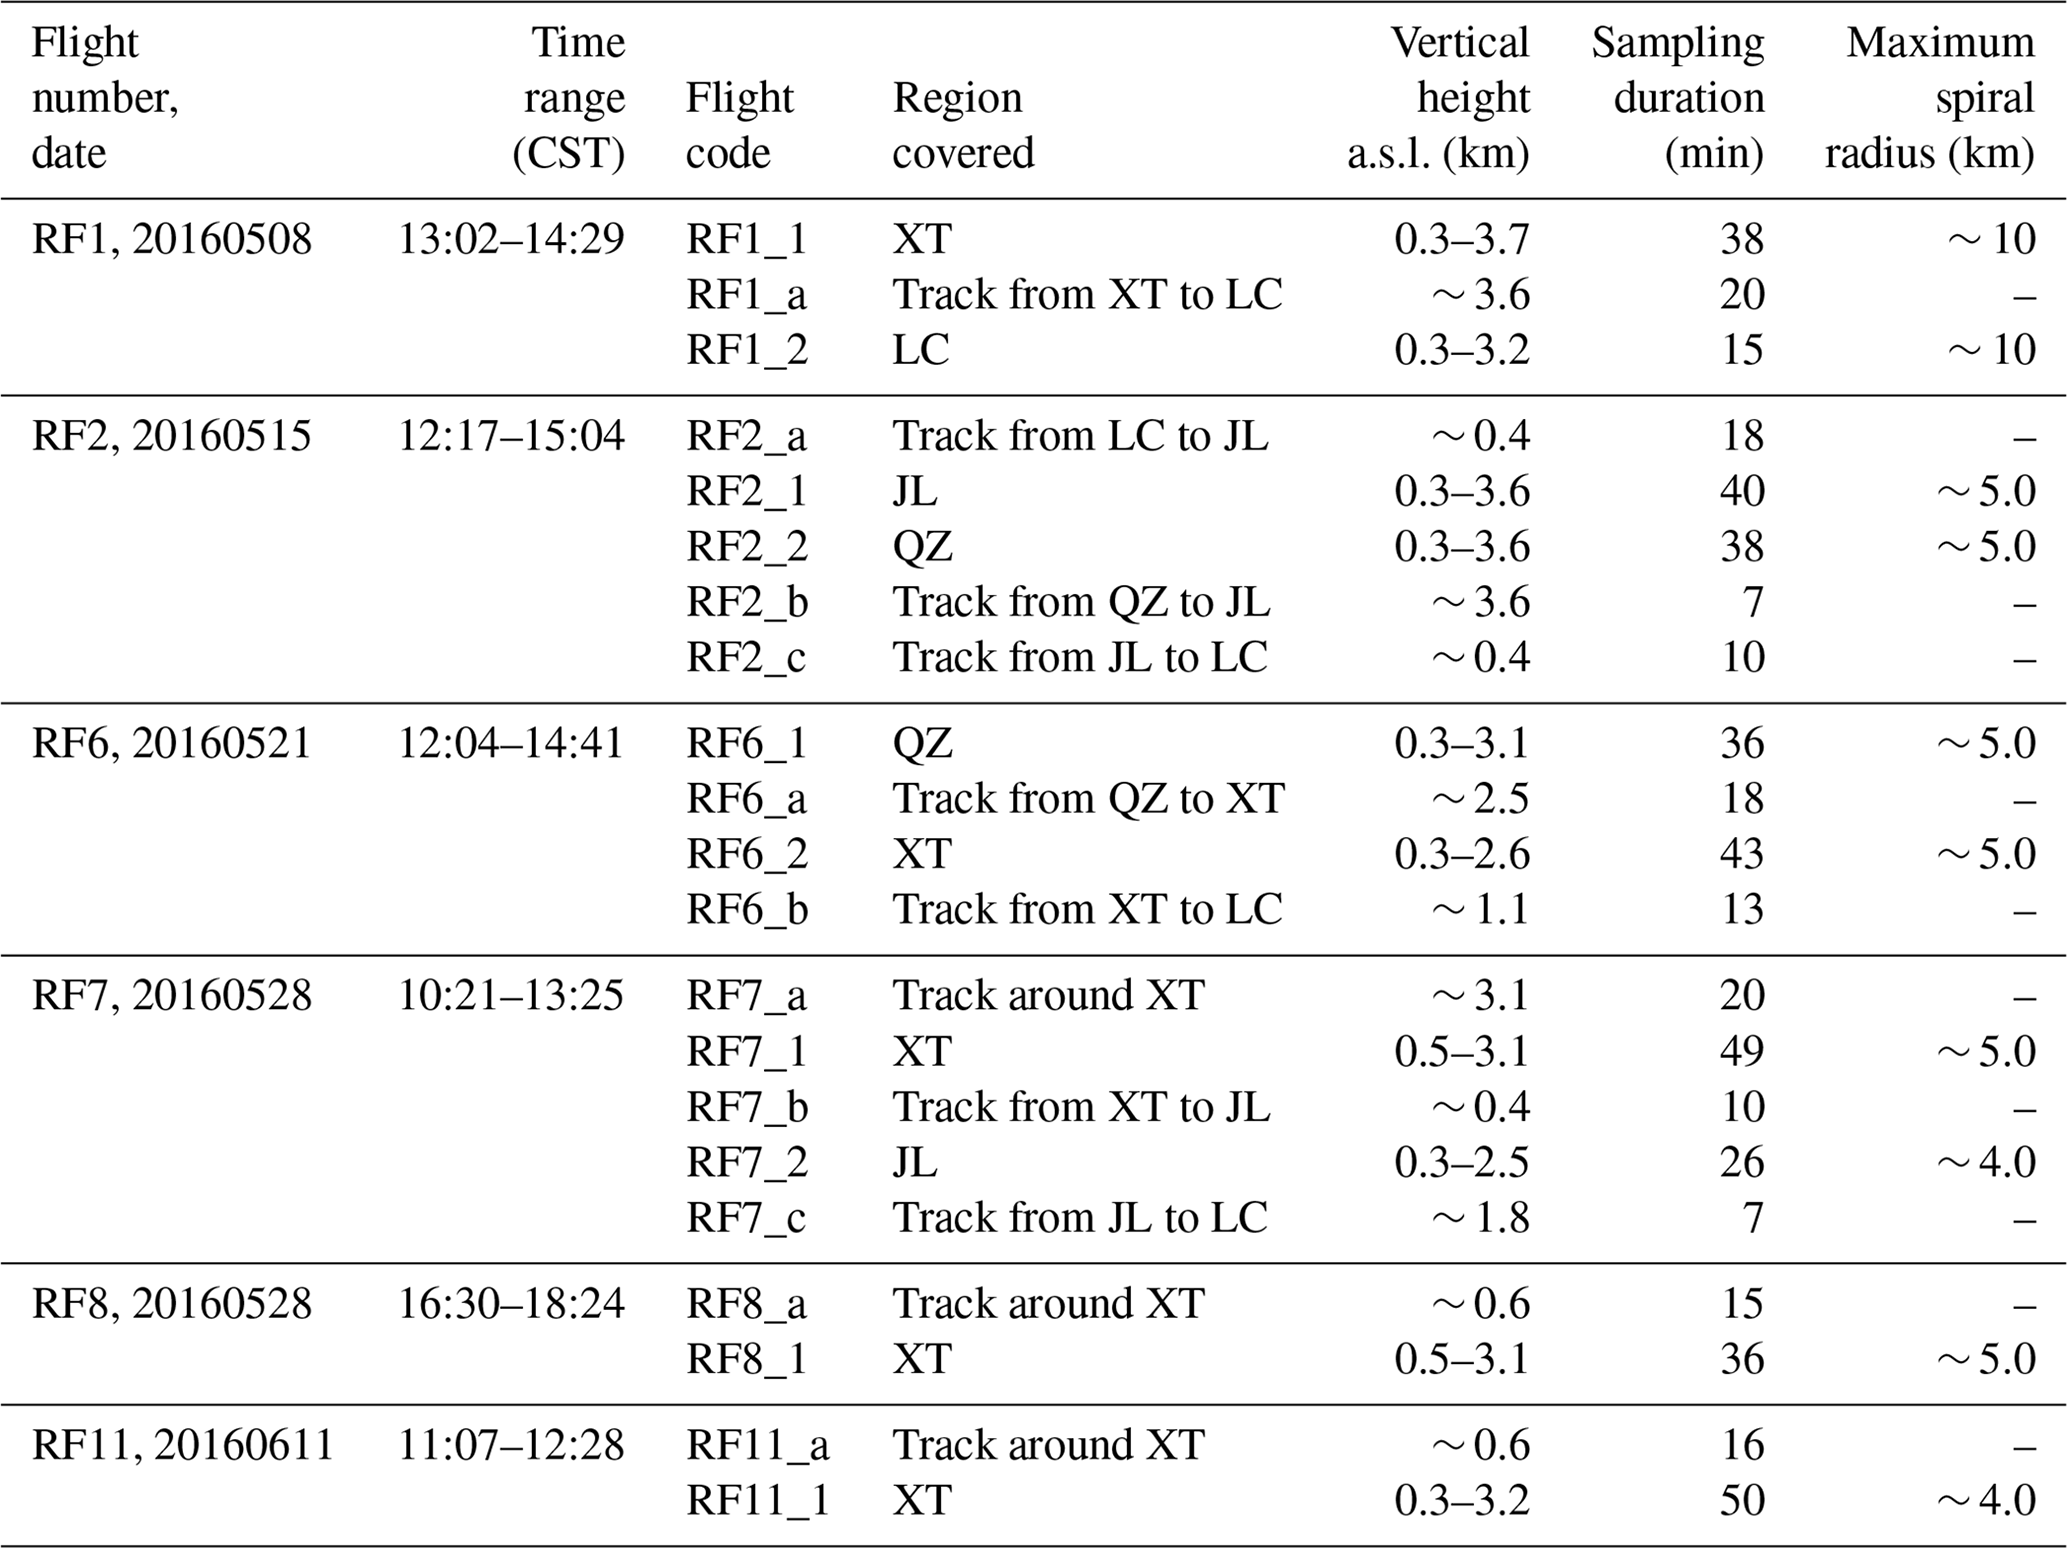
The ARIAs campaign was carried out from 8 May to 11 June 2016 in the southern plain area of Hebei Province using a Y-12 turboprop airplane operated by the Weather Modification Office of the Hebei Meteorological Bureau. The details of the flight plans and initial investigations into the impact of air mass on air chemistry have been published (Benish et al., 2020, 2021; F. Wang et al., 2018). The sampling method was summarized in the supplement. The influence of air mass and regional transport as MAX-DOAS and LIDAR has been presented (Wang et al., 2019). This previous work identified coal combustion, industrial processes, vehicular traffic, and biomass burning as contributors to poor air quality. Luancheng (LC, 114.36∘ E, 37.18∘ N; 182 m above mean sea level, or a.s.l.), Xingtai (XT, 114.36∘ E, 37.18∘ N; 182 m a.s.l.), Julu (JL, 115.02∘ E, 37.22∘ N; 20 m a.s.l.), and Quzhou (QZ, 114.96∘ E, 36.76∘ N; 40 m a.s.l.) are the four central sampling sites (Fig. 1b), all to the east of the Taihang Mountains. Six flights (RF1, RF2, RF6, RF7, RF8, and RF11) measuring NCCN and aerosol optical properties are used in this study. In all the flights, the Y-12 airplane conducted vertical spiral flights from ∼0.3 to ∼3.5 km near one or two central sampling sites and level flights at different fixed altitudes between different central sampling sites. Every flight obtained several NCCN profiles at one or two sites and NCCN data at several fixed altitudes. Table 1 lists details about the flight tracks (also see Fig. 1b).
Altitudes are distances a.s.l. in this study. All aircraft flights except RF8 (conducted from 16:30–18:24 CST; CST stands for China standard time, which is 8h ahead of UTC) were conducted around noon (10:00–15:00 CST), when the planetary boundary layer (PBL) height was fully developed.
Table 1Detailed information about the flight tracks deployed during the campaign. Flight code (third column): The number after “RF” indicates the research flight number, the number after “_” indicates the number of vertical spiral flights, and the letter after “_” indicates the number of level transects.
2.2 Instruments
To satisfy the needs of this study, the Y-12 airplane was equipped with a dual-column CCN counter (CCNc), a three-wavelength integrating nephelometer, and a Cloud Water Inertial Probe (CWIP). All instruments were calibrated rigorously prior to the airborne campaign. Table 2 summarizes the instruments equipped on the airplane.
Table 2Instruments equipped on the Y-12 airplane used in this study.
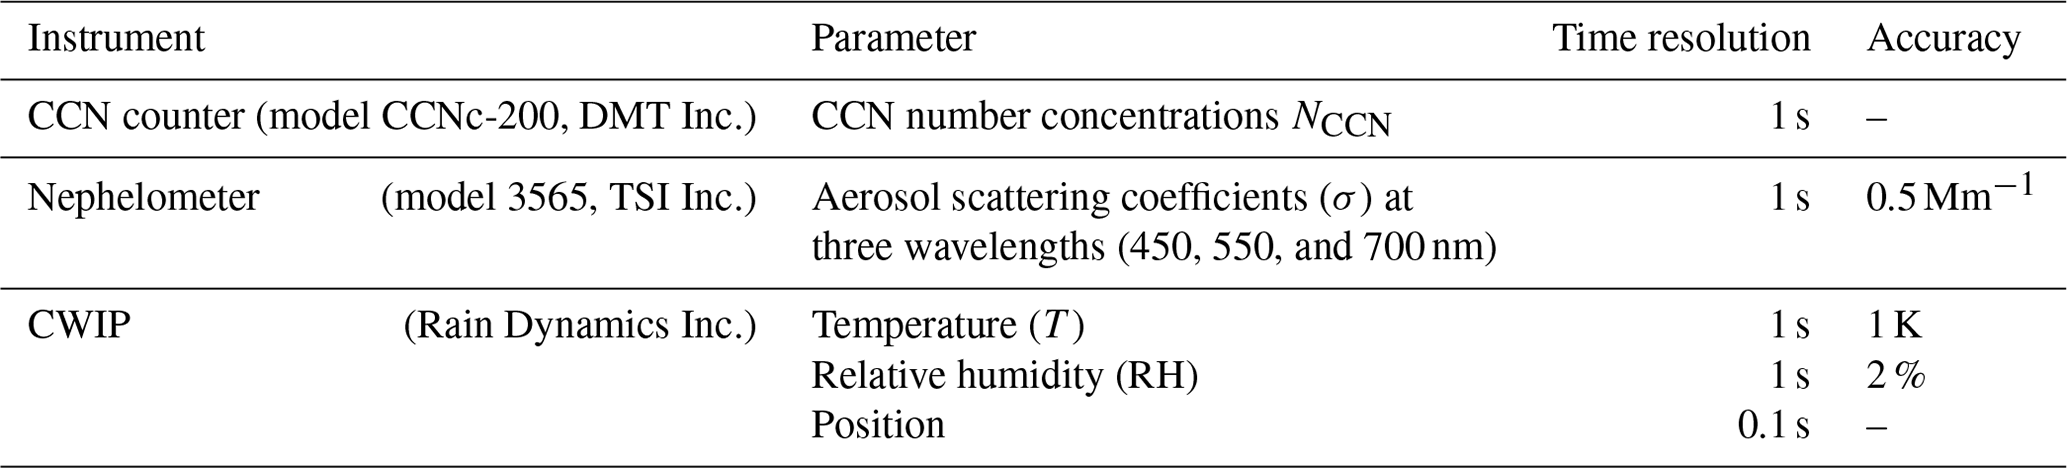
The NCCN was measured by a dual-column continuous-flow thermal-gradient cloud condensation nuclei counter (model CCNc-200, DMT Inc.) with a time resolution of 1 s. It is equipped with two columns that can simultaneously measure NCCN at two different SS levels without mutual interference. In this campaign, only one SS level is set in the first column during all flights, but eight different SS levels are set in the second column with a measurement time interval of 90 s for each SS level. The CCNc data with instable sample or sheath flow are excluded. Considering the time reaching equilibrium at different SS levels, data acquired in the final 30 s at any SS level in the cycle for the second column is used in this study. The SS level in columns was calibrated with pure ammonium sulfate following procedures developed by Rose et al. (2008). The SS level in the first column was corrected to 0.7 % and the SS levels in the second column were corrected to 0.44 %, 0.56 %, 0.68 %, 0.80 %, 0.92 %, 1.04 %, 1.16 %, and 1.28 %. The NCCN profiles at 0.7 % SS and NCCN data at different SS levels were thus available.
The integrating nephelometer (model 3565, TSI Inc.) can continuously measure aerosol scattering coefficients (σ) at three wavelengths (450, 550, and 700 nm) with a time resolution of 1 s. Previous studies have shown that σ becomes larger with increasing relative humidity (RH) due to aerosol hygroscopic growth (e.g., L. Zhang et al., 2015; Ren et al., 2021). Hence, the scattering values were adjusted using a correction factor (Anderson and Ogren, 1998). The nephelometer was calibrated and tested rigorously prior to the airborne campaign using carbon dioxide gas and filtered zero air. Anderson and Ogren (1998) have provided details about the calibration methods and measurement uncertainties of the integrating nephelometer. Aerosol scattering Ångström exponent (SAE) is calculated as follows:
where σ (λ1) and σ (λ2) are aerosol scattering coefficients at two given wavelengths (λ1=450 nm and λ2=700 nm). The SAE is often used to qualitatively assess the dominant size mode of aerosols, reflecting the particle number size distribution (PNSD) pattern (e.g., Hamonou et al., 1999). A large SAE (>2) generally implies that fine-mode aerosols are dominant (e.g., smoke particles), while a small SAE (<1) means that the coarse-mode aerosols are dominant (e.g., dust particles).
Ambient temperature (T) and RH were measured by a CWIP (Rain Dynamics Inc.) with a time resolution of 1 s during flights. Real-time flight position data such as longitude, latitude, and altitude were recorded by a global positioning system (GPS) and the CWIP with a time resolution of 0.1 s. The CWIP time was calibrated and synchronized with the GPS time prior to deployment.
2.3 Air mass sources
Previous studies have suggested that differences in air masses will lead to spatiotemporal differences in CCN activation ability and aerosol optical properties (e.g., Xu et al., 2020; Jayachandran et al., 2020b). To better understand air mass sources and aerosol transport pathways over the measurement area, 72-hour air mass back trajectories for all NCCN profiles at 0.5, 1.5, 2.5, and 3.5 km are analyzed using the NOAA Hybrid Single-Particle Lagrangian Integrated Trajectory (HYSPLIT) model (Stein et al., 2015). Results show that the sampling region is mainly influenced by two distinct air masses, namely, northwesterly air masses and southeasterly air masses (Fig. 2). Northwesterly air masses (Fig. 2a) originate from arid or semi-arid land, including five NCCN profiles whose flight codes are RF1_1, RF1_2, RF2_1, RF2_2, and RF11_1. Before these trajectories approach the sampling area, most of these air masses flow around or are forced to lift due to the influence of the Taihang Mountains. However, southeasterly air masses (Fig. 2b) originate from coastal or marine areas, also including five NCCN profiles whose flight codes are RF6_1, RF6_2, RF7_1, RF7_2, and RF8_1. Air masses in place during the RF7_1, RF7_2, and RF8_1 flights originate from coastal areas, and those during the RF6_1 and RF6_2 flights originate from the Western Pacific. Southeast trajectories pass over the densely populated plain region to the east and south of the sampling area, which is easily impacted by anthropogenic emissions. These trajectories are also easily affected by differences in land and sea thermal properties, raising the air masses gradually before reaching the sampling area (Fig. S1 in the Supplement).
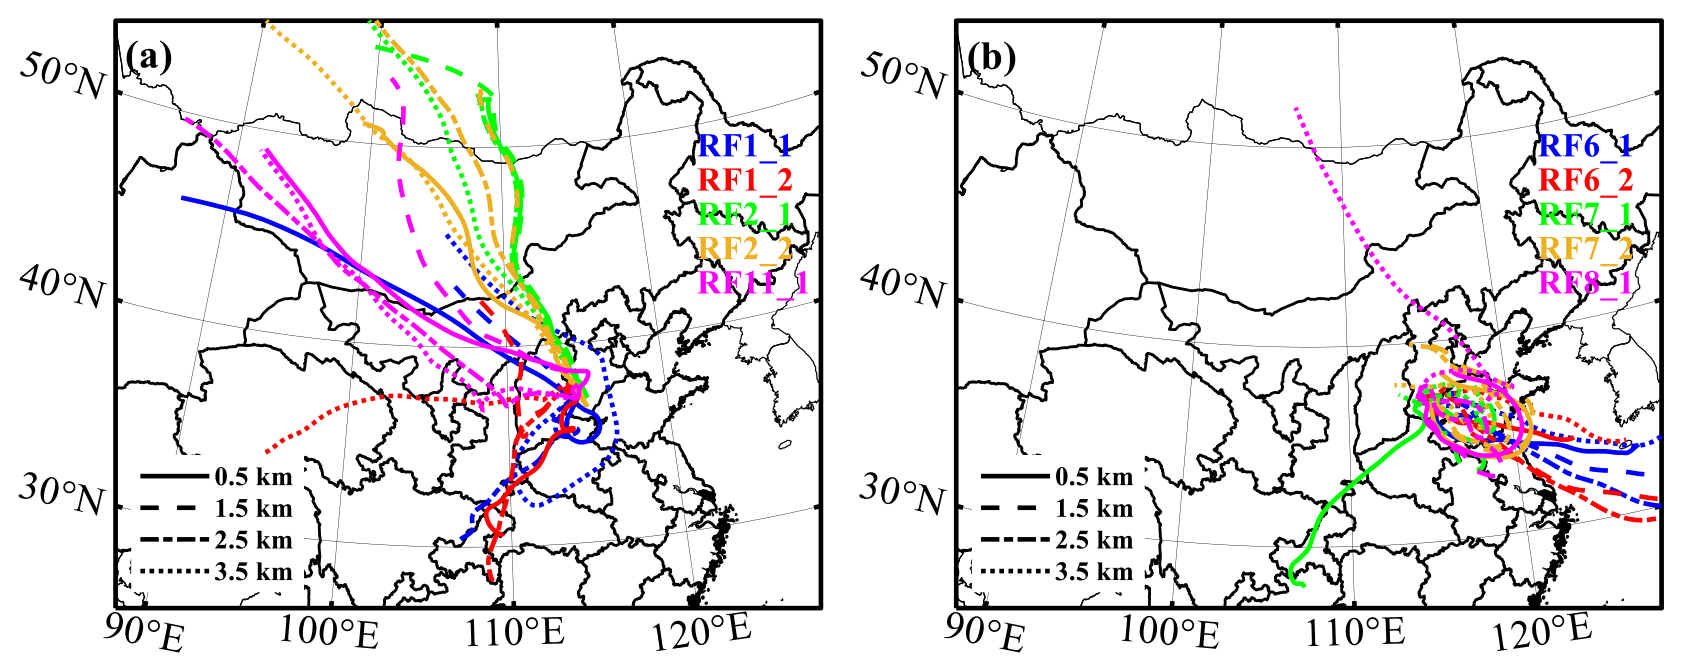
Figure 272-hour HYSPLIT back trajectories over the sampling region: (a) northwesterly air masses and (b) southeasterly air masses. The color of trajectories indicates different flight codes associated with NCCN profiles. The line type shows trajectories with different starting altitudes (0.5, 1.5, 2.5, and 3.5 km).
3.1 Vertical distributions of NCCN
3.1.1 Effect of the temperature inversion layer (TIL) on NCCN profiles
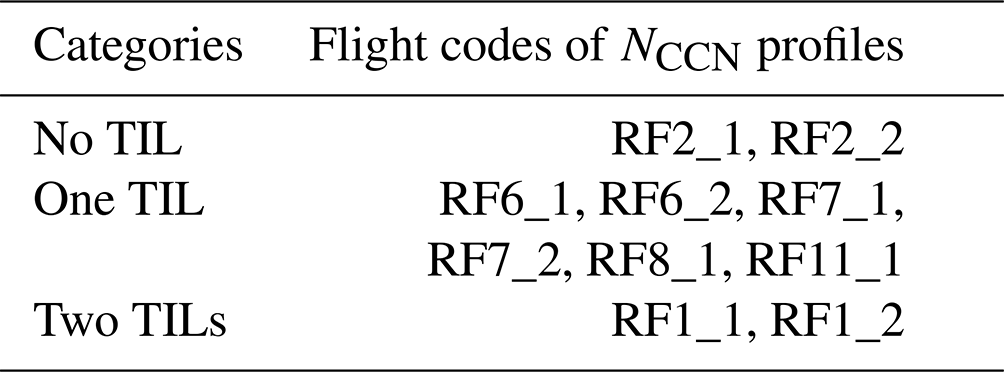
Previous studies have demonstrated the significant impact of the temperature inversion layer's (TIL) structure on the vertical distributions of aerosols and NCCN (e.g., Janhäll et al., 2006; J. Li et al., 2015a, b). Here, NCCN profiles are classified into three categories according to the number of TILs (Table 3). Three typical NCCN profiles at 0.7 % SS (RF2_1, RF6_1, and RF1_1) with different numbers of TILs are chosen for comparison purposes (Fig. 3; NCCN profiles associated with the other three flight codes are shown in Figs. S2–4).
Table 3Classification of different NCCN profiles based on the number of TILs.
No TIL: Figure 3a shows vertical profiles of temperature (T) and potential temperature (θ) for the RF2_1 NCCN profile (Fig. 3b). Temperature decreases with altitude in the absence of a TIL while the variation in θ with altitude ( is generally small below ∼2.3 km (Fig. 3a). These meteorological conditions are favorable for the upward transport of aerosols below ∼2.3 km. The larger above ∼2.3 km suggests a more stable atmosphere, suppressing the upward transport of aerosols (Yau and Rogers, 1998). This is why NCCN peaks at ∼2.3 km and decreases rapidly above (Fig. 3b). However, a second NCCN peak is observed at ∼ 3.2 km, with a small in the vicinity. The 72-hour back trajectory shows that the air mass in this case originates from the northwestern arid/semi-arid parts of Mongolia (Fig. 2a). The long-distance transport of aerosols (like dust particles) may be responsible for the NCCN peak at ∼ 3.2 km. In another NCCN profile with no TIL (RF2_2), a weak NCCN peak also appears at ∼ 3.2 km (Fig. S2b). The RF11_1 NCCN profile with similar back trajectories as RF2_1 and RF2_2 also has a weak NCCN peak at ∼ 3.2 km. This suggests that the long-distance transport of aerosols plays an important role in NCCN in the free troposphere over the NCP under the influence of northwesterly air masses. Note that high NCCN in the free troposphere has an important impact on cloud microphysical properties (Rosenfeld et al., 2008).
One TIL: The T profile in Fig. 3c shows a ∼ 0.4 km-deep TIL at ∼ 1.8 km. A thick TIL hinders the upward transport of aerosols and facilitate the vertical mixing of NCCN below the TIL. Therefore, NCCN varies little with altitude below the TIL, with a mean NCCN at 0.7 % SS of 5140 cm−3 (Fig. 3d). The θ profile in Fig. 3c suggests that above the TIL is much larger than below the TIL, meaning a more stable atmosphere above the TIL. The NCCN quickly decreases by an order of magnitude from below to above the TIL (from 5542 cm−3 at ∼ 1.8 km to 365 cm−3 at ∼ 2.2 km). Overall, the presence of a thick TIL has a large impact on the NCCN profile.
Two TILs: The T profile in Fig. 3e depicts two shallow TILs with the same depth of ∼ 0.2 km, appearing at ∼ 0.8 and ∼ 2.5 km, respectively. Due to the hindering effect of a TIL on the vertical transport of aerosols, only a small amount of CCN break through the first TIL and diffuse to higher altitudes. Figure 3f suggests that NCCN increases with altitude from near the surface to the bottom of the first TIL. A large amount of CCN accumulate below the first TIL, peaking at its bottom. The second TIL makes NCCN accumulate again between the two TILs. Under the combined effect of two TILs, the upward transport of CCN becomes difficult. The θ profile in Fig. 3e also shows that is always positive, varying slightly with height. The NCCN generally experiences a declining trend with altitude between the two TILs (from 6380 cm−3 at 0.9 km to 635 cm−3 at 2.5 km). Above the second TIL, NCCN remains low and stable, with concentrations on the order of 102 cm−3.
In summary, the TIL structure has an important impact on the vertical distribution of NCCN. Moreover, NCCN in the free troposphere are easily impacted by the long-distance transport of aerosols under the influence of northwesterly air masses.
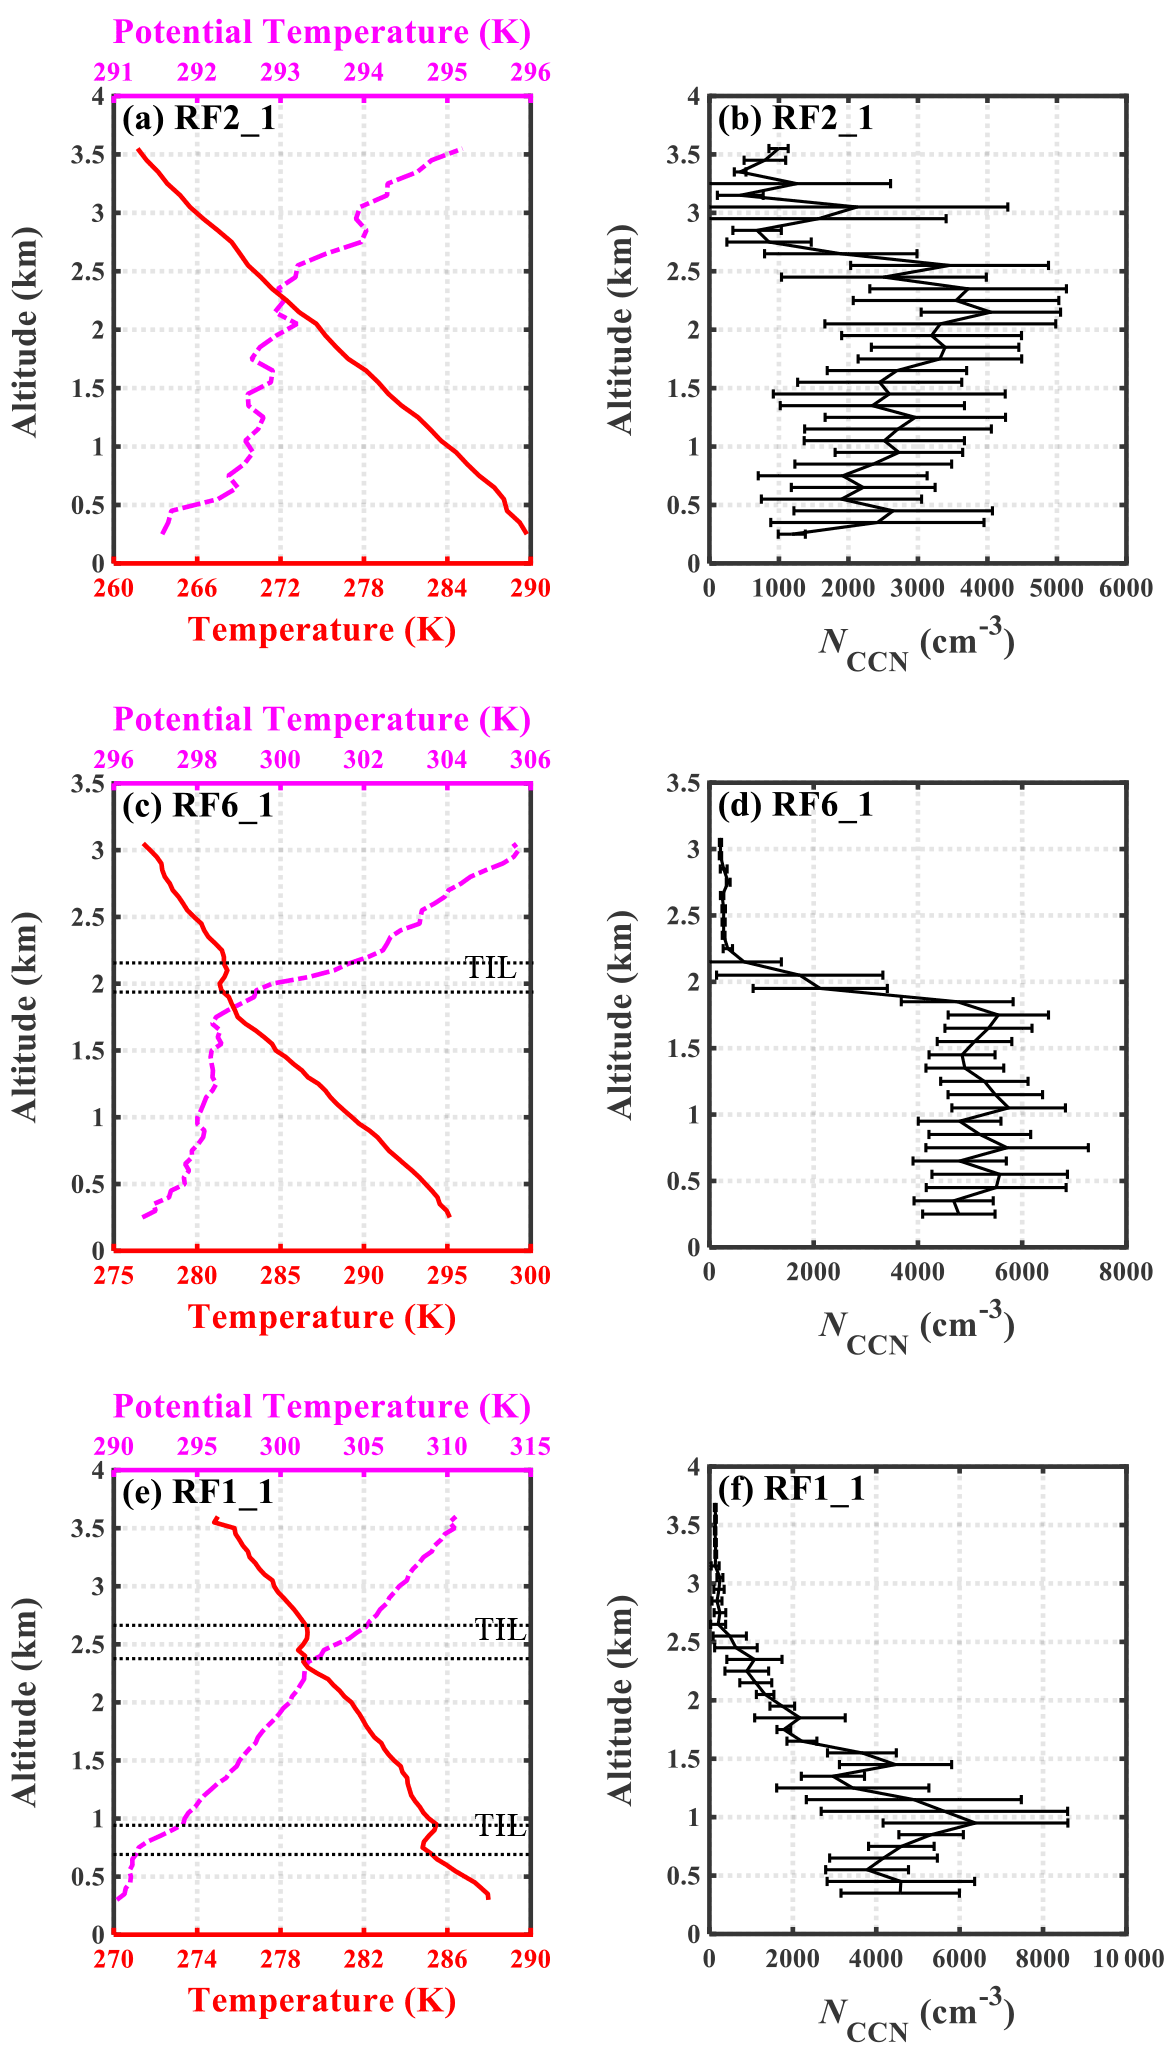
Figure 3Vertical distributions of temperature (T) and potential temperature (θ) (a, c, e), and NCCN at 0.7 % SS (b, d, f) for RF2_1, RF6_1, and RF1_1 NCCN profiles with (from top to bottom) no temperature inversion layer (TIL), one TIL, and two TILs. T and θ are averaged in the intervals of 50 m in altitude. Horizontal error bars of NCCN represent standard deviations of NCCN at 0.7 % SS at altitude intervals of 100 m.
3.1.2 Influence of air masses on NCCN profiles
To further investigate the influence of air masses on NCCN profiles, the mean NCCN at 0.7% SS in different altitude ranges in two distinct air masses is analyzed (Fig. 4). In general, the mean NCCN at 0.7 % SS has a declining trend with increasing altitude in both air masses (Fig. 4a). The NCCN in southeasterly air masses is higher than in northwesterly air masses below 1.5 km, indicating more aerosol particles that can be activated as CCN in southeasterly air masses. Section 2.3 indicates that southeasterly air masses always pass over the densely populated plain area. This means that massive anthropogenic emissions can clearly increase NCCN near the surface. However, NCCN above 2 km is much lower in southeasterly air masses than in northwesterly air masses. This further indicates that the long-distance transport of aerosols under the influence of northwesterly air masses contributes significantly to NCCN in the free troposphere.
Figure 4b and c depict the mean NCCN at 0.7 % SS in different altitude ranges in northwestly and southeasterly air masses, respectively. Under the influence of northwesterly air masses, the temperature structure varies, leading to different NCCN profiles (Fig. 4b). For RF2_1 and RF2_2 NCCN profiles with no TIL (Figs. 3b and S2b), the combined effect of upward and long-distance transport of aerosols increases NCCN at 0.7 % SS above 2 km. The NCCN from 2 to 2.5 km is even higher than near the surface. For the RF11_1 NCCN profile with one TIL, NCCN at 0.7 % SS varies slightly with altitude. For RF1_1 and RF1_2 NCCN profiles with two TILs, NCCN at 0.7 % SS above 2 km is much lower than near the surface.
Under the influence of southeasterly air masses, the thermal structure for all NCCN profiles is similar with one TIL (Table 3). The NCCN profile patterns are thus similar, showing much lower NCCN above 2 km than near the surface (Fig. 4c). Figure 4c also suggests that NCCN at 0.7 % SS below 2 km is higher in the RF6_1 and RF6_2 NCCN profiles than in the other three NCCN profiles (i.e., RF7_1, RF7_2, and RF8_1). As discussed in Sect. 2.3, air masses during RF6_1 and RF6_2 originate from the Western Pacific, while the others originate from coastal areas. All these air masses pass over the densely populated area before reaching the measurement region. This suggests the impact of marine aerosols, biomass burning, and fossil fuel combustion as possible reasons for high NCCN in the RF6_1 and RF6_2 NCCN profiles. Figure 4c also shows that the NCCN below 2 km is much higher at XT than at QZ and JL during the same flights (RF6_2 vs. RF6_1, and RF7_1 vs. RF7_2). Figure 1b shows that the XT site is closer to the Taihang Mountains than the QZ and JL sites. This implies that the terrain-blocking effect of the Taihang Mountains on aerosols accumulates aerosols, resulting in higher NCCN at XT.
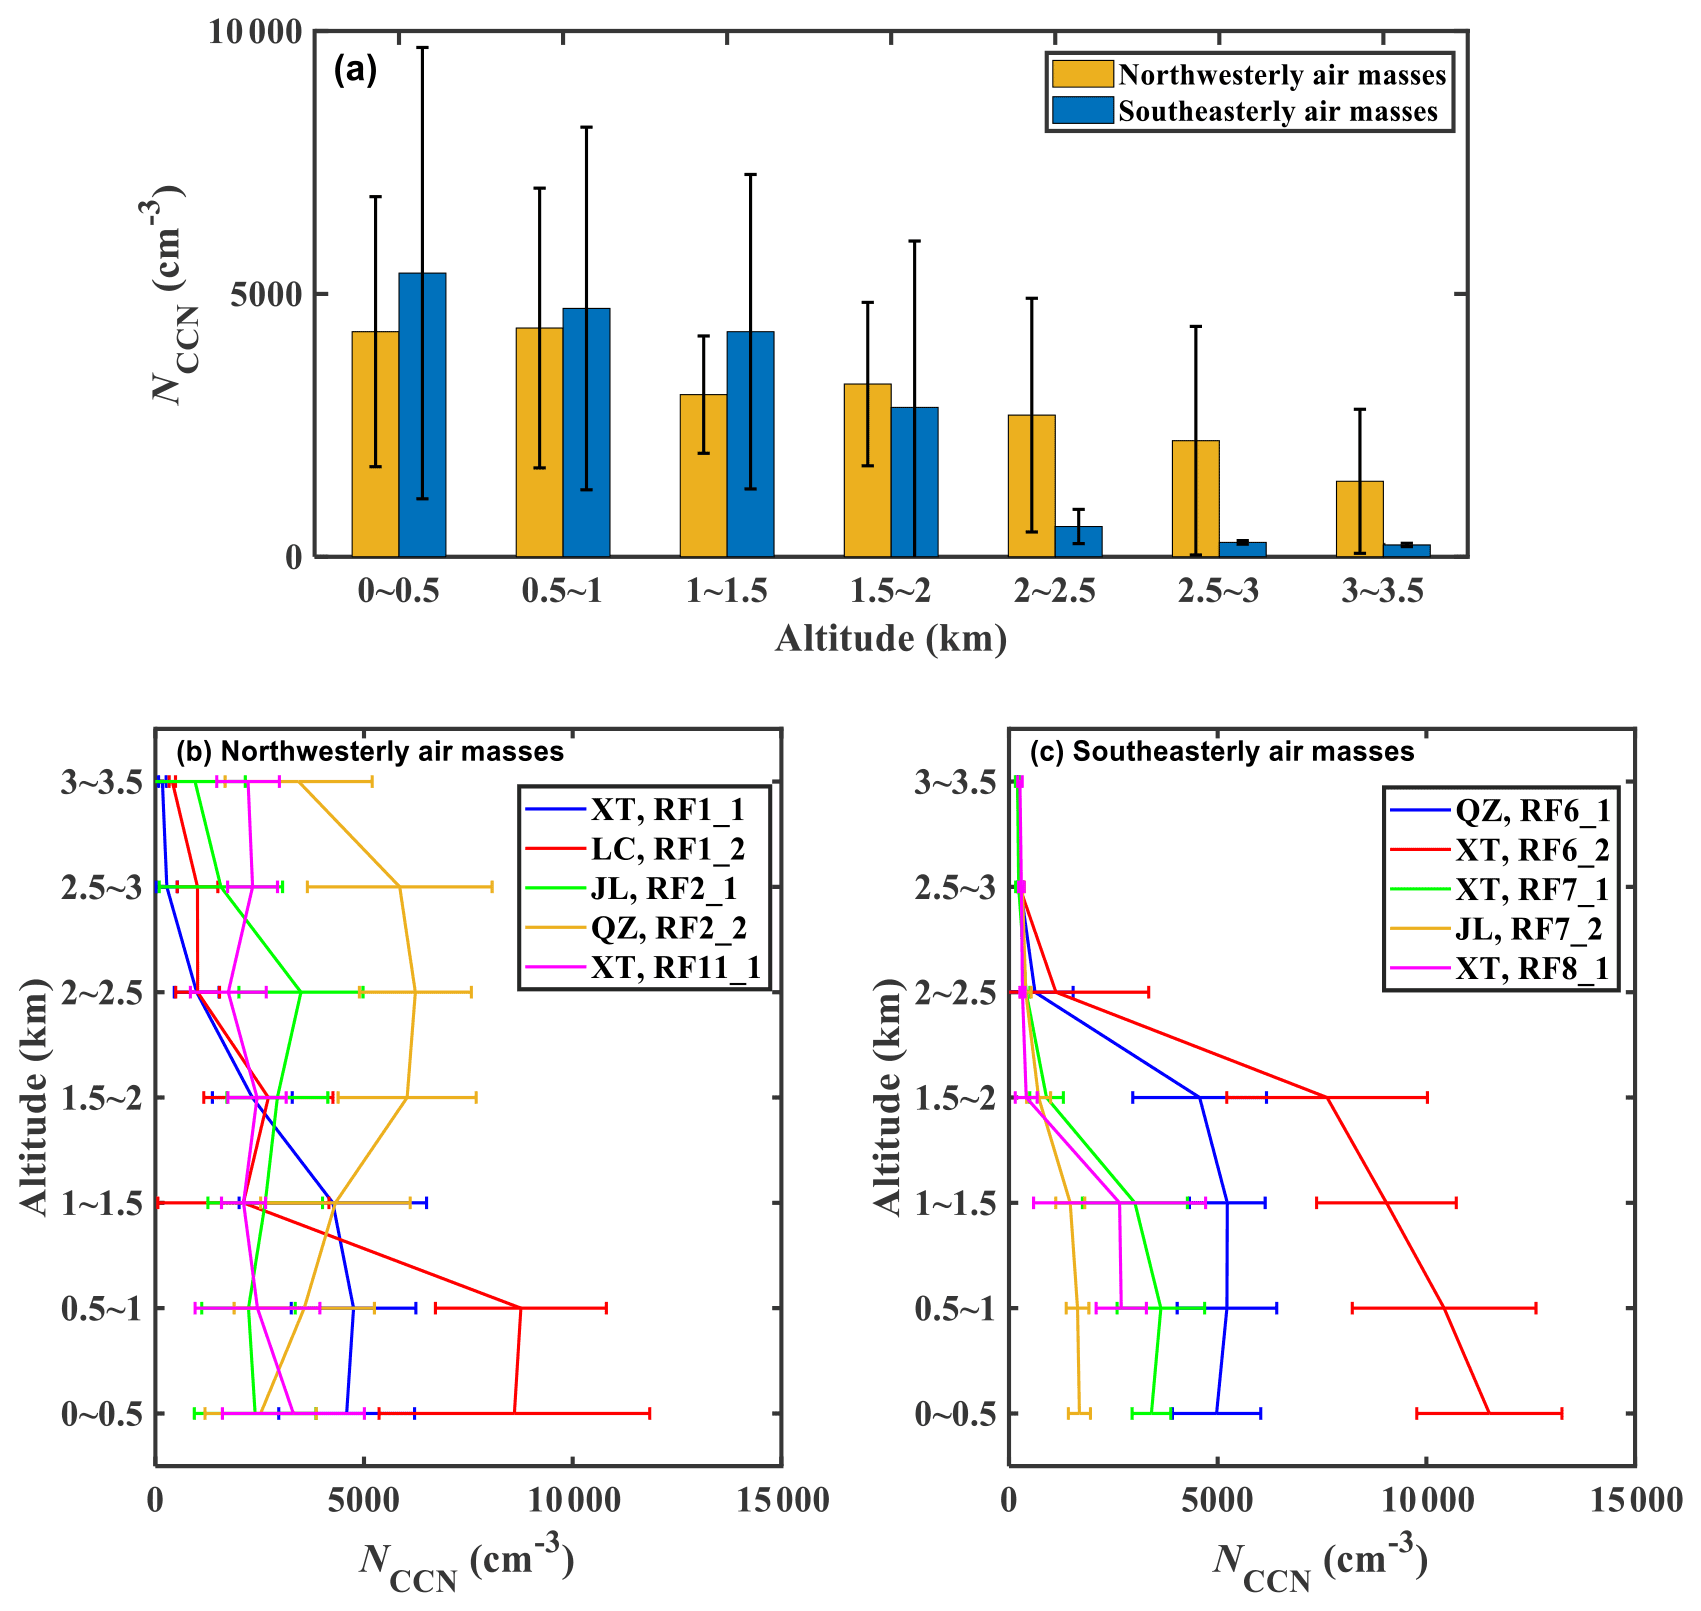
Figure 4(a) Mean NCCN at 0.7 % SS in different altitude ranges (ranging from 0 to 3.5 km at intervals of 0.5 km) in northwesterly and southeasterly air masses, and for different NCCN profiles at 0.7 % SS in (b) northwesterly air masses and (c) southeasterly air masses. The different colors in (b) and (c) are for different flights. Error bars represent standard deviations of NCCN at 0.7% SS.
In summary, NCCN profiles are influenced by multiple factors over the NCP. The TIL structure, long-distance transport of aerosols, and anthropogenic emissions lead to differences in the NCCN profiles in different air masses. Even in the same air masses, diverse aerosol sources and terrain distributions cause large differences in NCCN.
3.2 Vertical distributions of CCN spectra in different air masses
The CCN spectrum is usually defined as a function of NCCN to SS. Twomey (1959) first reported an exponential relationship between NCCN and SS. Since then, a variety of such functions have been proposed, thanks to a large number of observations made which are all necessary given the nature of empirical relationships whose validity is generally limited. For example, Ji and Shaw (1998) provided a three-parameter function, while Gunthe et al. (2011) suggested a logarithmic function to fit CCN spectra. In this study, NCCN measurements made at different SS during 11 level flights are used to fit CCN spectra. Twomey's relation (Twomey, 1959; Cohard et al., 1998) is used to fit the relationship between NCCN and SS according to the least-squares method:
where NCCN (SS) is the NCCN at a specified SS, and C and k are two fitting coefficients. Table S1 lists the fitting results for the 11 level flights. In Eq. (1), the C value represents NCCN at 1.0 % SS, and the shape of the CCN spectrum is determined by the k value. Previous studies have suggested that k is closely related to the shape of PNSD and aerosol hygroscopicity (e.g., Hegg et al., 1991; Jefferson, 2010). A lower k value means a stronger aerosol activation ability (i.e., more coarse-mode particles or stronger aerosol hygroscopicity), and vice versa.
Figure 5 shows CCN spectra at different altitudes during three level flights (RF2, RF6, and RF7). The 72-hour back trajectories (Fig. 2a) suggest that the RF2 flight is influenced by northwesterly air masses. The CCN spectra during three level flights (RF2_a, RF2_b, and RF2_c; Fig. 5a) show that C and k are lower at 3.6 km (RF2_b) than at 0.4 km (RF2_a and RF2_c), indicating smaller NCCN but stronger aerosol activation ability in the free atmosphere than near the surface. At the same altitude (0.4 km) during the RF2_c flight (6560 cm−3), C is more than 2 times that during the RF2_a flight (3029 cm−3), with different k values (1.75 and 1.71, respectively). This indicates the regional variation of NCCN and the weak aerosol activation ability near the surface.
Figure 5b and 5c show CCN spectra during flights RF6 and RF7, which are influenced by southeasterly air masses (Fig. 2b). The k values associated with southeasterly air masses (Fig. 5b and c) are always lower than those associated with northwesterly air masses (Fig. 5a). Therefore, aerosols in southeasterly air masses have a stronger activation ability than those in northwesterly air masses. This is likely because aerosols from the southeast are mostly from anthropogenic emissions including more secondary particle matters such as sulfate and nitrate, while aerosols from the northwest contain more natural components such as mineral dust (Xia et al., 2019; Q. Wang et al., 2022). Figure 5c also shows that during the RF7 flight, k decreases from 0.65 at 0.4 km to 0.37 at 1.8 km, increasing to 0.62 at 3.1 km. Figures S3c and 3e show that the altitude of the TIL during the RF7 flight is ∼ 2 km. This suggests that the aerosol activation ability near the TIL is stronger than that near the surface and in the free atmosphere above the TIL. The implication here is that the hindering effect of the TIL promotes aerosol aging processes, enhancing the aerosol activation ability (Y. Wang et al., 2018).
Overall, CCN spectra clearly vary with altitude over the NCP. The fitting coefficients of CCN spectra (C and k) are closely related to air mass sources, regional aerosol properties, and temperature structure.
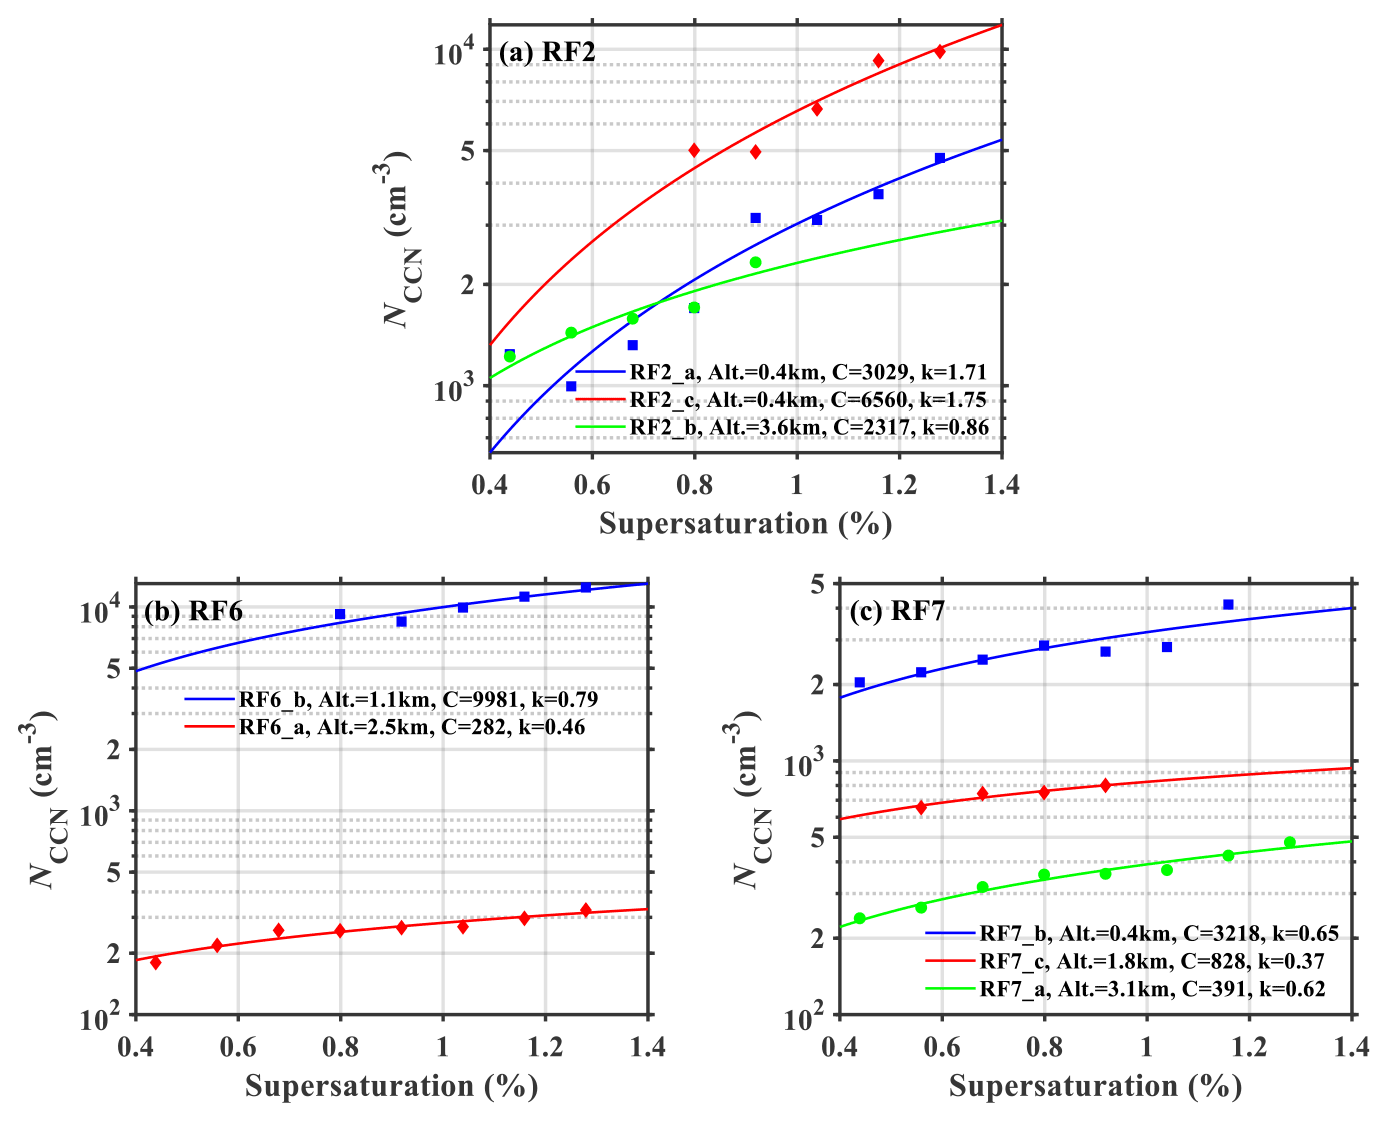
Figure 5Fitted CCN spectra at different altitudes during three flights: (a) RF2, (b) RF6, and (c) RF7. The flight code, flight altitude (Alt.), and the two fitting coefficients from Twomey's relation (C and k) are given in each panel. Solid lines are the fitting lines described by Eq. (1). The y axis is logarithmic.
3.3 The relationship between NCCN and aerosol optical properties
3.3.1 Vertical distributions of SAE
Figure 6a shows the vertical distributions of SAE during the vertical spiral flights. Three profiles (RF2_1, RF2_2, and RF11_1) are not shown due to the lack of aerosol optical data. In general, SAE decreases gradually with altitude, while its standard deviation increases with altitude. This is likely because aerosols near the surface are easily influenced by primary emissions from anthropogenic sources, consisting of more fine particles. The frequent appearance of a TIL at ∼ 2 km suppresses the upward transport of fine particles, leading to the rapid decrease of SAE above the TIL. The long-distance transport of coarse-mode aerosols (like dust particles) also decreases SAE in the free troposphere. As mentioned before, aerosol sources above 2 km are complex, which is why the standard deviation of SAE is larger above ∼ 2 km.
Figure 6b shows profiles of NCCN and σ (data used here were collected at 0.7 % SS and 450 nm, respectively) during the RF1_1 spiral flight. Figure S5 shows profiles from the other spiral flights. In general, the vertical variation of σ is synchronous with that of NCCN, indicating that they are correlated to some degree.
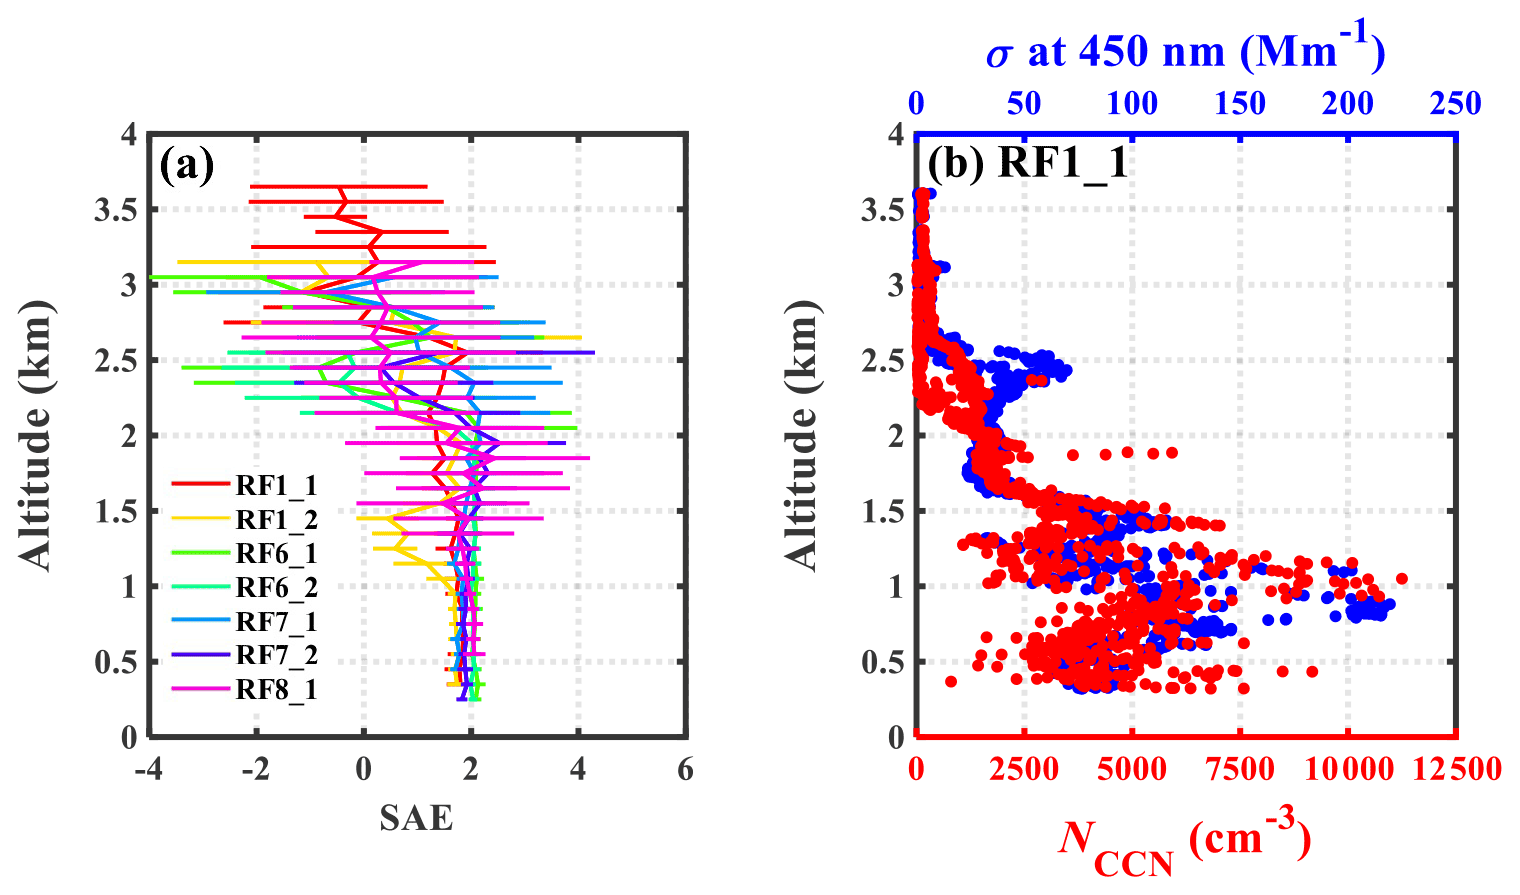
Figure 6Vertical distributions of (a) aerosol scattering Ångström exponent (SAE) during the vertical spiral flights (error bars are standard deviations of SAE) and (b) NCCN at 0.7 % SS (red dots) and aerosol scattering coefficient (σ) at 450 nm (blue dots) during the RF1_1 vertical spiral flight.
3.3.2 Parameterizing NCCN in terms of aerosol optical properties
Both NCCN and aerosol optical properties are affected by the same factors (e.g., PNSD and chemical composition). Therefore, numerous studies attempted to estimate NCCN for aerosol optical properties, although there was no directly physical connection between them (e.g., Andreae, 2009; Liu and Li, 2014; Tao et al., 2018). Previous studies indicated that the relationship between NCCN and σ was non-linear, mainly due to the variation of PNSD patterns (e.g., Andreae, 2009; Shinozuka et al., 2015). As discussed in Sect. 3.3.1, SAE can be used to reflect the PNSD pattern. The clear vertical variation of SAE (Fig. 6a) suggests a complex and variable relationship between NCCN at 0.7 % SS and σ at 450 nm at different altitudes. Shinozuka et al. (2015) identified NCCN at 0.4 %±0.1 % SS with , where σext is the 500 nm extinction coefficient by dried particles and α is the extinction Angstrom exponent. According to our measurements, a modified parameterization is used in this study:
where σ is the aerosol scattering coefficient at 450 nm, and β and γ are two fitting parameters. Shinozuka et al. (2015) suggested that β and γ were correlated to SAE, but the degree of correlation differed in different regions. In this study, NCCN at 0.7 % SS and SAE data points are paired to derive β and γ. NCCN at other SS levels are too little to do this work because of the loop measurement of different SS levels in the second column of CCNc-200.
Figure S6 shows the relationships between SAE and β and SAE and γin two air masses – β is negatively correlated with SAE, while γ is positively correlated with SAE. The correlation coefficients (R) are lower in northwesterly air masses than in southeasterly air masses, likely due to more complex aerosol sources in northwesterly air masses. Empirical estimates of NCCN at 0.7 % SS from aerosol optical properties are determined as follows:
Figure 7 shows the comparisons of measured NCCN at 0.7 % SS and estimated NCCN at 0.7 % SS using Eqs. (4) and (5) for different vertical spiral flights in northwesterly and southeasterly air masses. For both air masses, most points approach the 1:1 line, indicating reasonable estimates using Eqs. (4) and (5) to parameterize NCCN. For northwesterly air masses (Fig. 7a), NCCN estimates are better under high-concentration conditions than under low-concentration conditions. However, for southeasterly air masses (Fig. 7b), NCCN estimates are better under low-concentration conditions than under high-concentration conditions. This is likely related to various aerosol sources at different altitudes. As previously discussed, most low NCCN values are observed in the upper atmosphere above the TIL, while high NCCN values are observed below the TIL. In northwesterly air masses, aerosol sources in the upper atmosphere are diverse, including the upward and long-distance transport of aerosols. This is why NCCN estimates worsen under low NCCN conditions. In southeasterly air masses, a single but thick TIL makes most aerosols accumulate in the lower atmosphere, where local emissions and the impact of marine aerosols exacerbate NCCN estimates. These results highlight the important impact of aerosol sources on the empirical estimate of NCCN from aerosol optical properties.
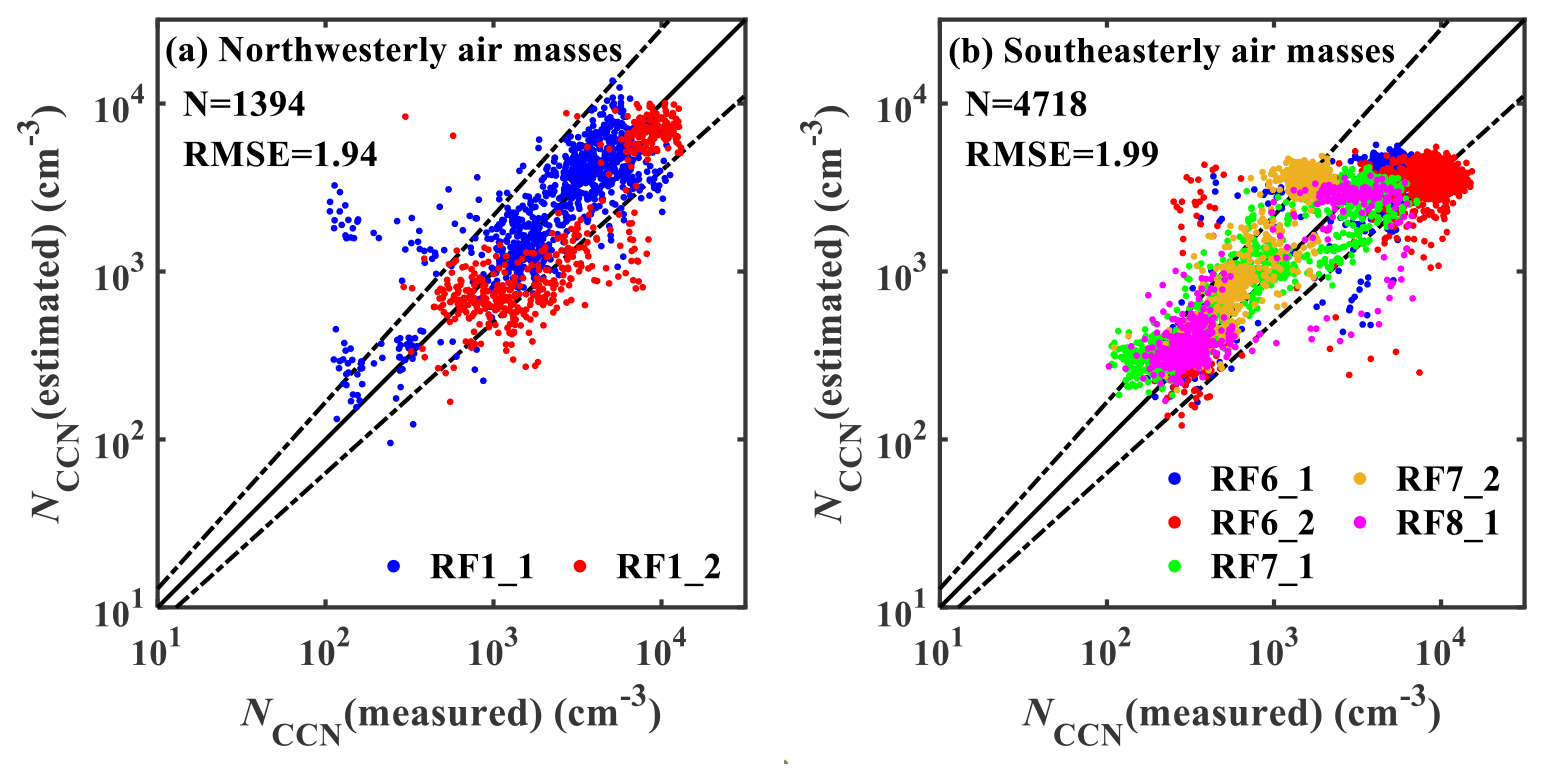
Figure 7Comparisons between measured NCCN at 0.7 % SS and estimated NCCN at 0.7 % SS using Eqs. (4) and (5) for different vertical spiral flights in (a) northwesterly and (b) southeasterly air masses. The black solid lines are 1:1 lines and the dashed lines indicate the boundaries representing ±10 % deviations of NCCN (estimated) from NCCN (measured) in the log–log plot. The 10 % deviation means that the deviation of individual data points is typically within a factor of 1.26 of the best estimates. The point number (N) and root mean square error (RMSE) in each panel are given.
A comprehensive airborne campaign was conducted over the North China Plain (NCP) under the aegis of a project called Air chemistry Research In Asia (ARIAs). Seventy-two-hour air mass back trajectories show that the region of study during this campaign was mainly influenced by air masses from the arid/semi-arid regions to the northwest or air masses from the coastal/marine areas associated with densely populated and industrialized plains to the southeast. In this study, the profiles of cloud condensation nuclei number concentration (NCCN) and their estimates from aerosol optical properties are analyzed.
We found that NCCN profiles at the water vapor supersaturation (SS) of 0.7 % are impacted largely by the temperature structure in the atmosphere. In general, the presence of a temperature inversion layer (TIL) suppresses the upward transport of aerosols from near the surface, which is affected by the number and thickness of TILs. In addition, air mass sources have a significant impact on NCCN profile characteristics. Under the influence of northwesterly air masses, NCCN in the free troposphere are easily impacted by the long-distance transport of aerosols. However, under the influence of southeasterly air masses, atmospheric thermal structures for all NCCN profiles are similar, with one TIL present in all cases. The patterns of NCCN profiles are also similar, showing much lower NCCN above the TIL than near the surface. In addition to the impact of anthropogenic emissions, the transport of marine aerosols is another reason for the high NCCN near the surface when a southeasterly air mass is present. Moreover, comparisons of NCCN profiles during the same flights suggest that the terrain-blocking effect of the Taihang Mountains on aerosols accumulates aerosols, resulting in high NCCN near the mountains.
The Twomey's relation (NCCN (SS) , where C and k are two fitting coefficients) is used to analyze CCN spectra and aerosol activation ability in this study. In general, there is a clear change in CCN spectra with altitude. The aerosol activation ability in southeasterly air masses is stronger than in northwesterly air masses, mainly due to the different chemical composition associated with diverse air masses. In addition, the aerosol activation ability is stronger in the free atmosphere than near the surface. The hindering effect of a TIL on the upward transport of aerosols promotes aerosol aging processes, enhancing the aerosol activation ability near the TIL. The vertical distribution of aerosol scattering Ångström exponent (SAE) indicates that aerosols near the surface are easily influenced by primary emissions, consisting of more fine particles. The long-distance transport decreases SAE and makes it vary more in the free troposphere than near the surface.
The comparison of NCCN at 0.7 % SS and aerosol scattering coefficient (σ) at 450 nm suggests that the vertical variation of σ is synchronous with that of NCCN. The equation and γ are two fitting parameters) is used to parameterize NCCN, with the parameters β and γ being linearly correlated with the SAE. Empirical estimates of NCCN at 0.7 % SS from aerosol optical properties are thus retrieved ( for northwesterly air masses, and for southeasterly air masses). The closure between the estimated and measured NCCN at 0.7 % SS is acceptable although different performances are seen under low- and high-concentration conditions for the two air masses. Results suggest the important impact of aerosol sources on the empirical estimate of NCCN from aerosol optical properties.
The NCCN profiles in the NCP are impacted by multiple factors, including temperature structure, air mass sources, anthropogenic emissions, and terrain distribution. These factors make estimating NCCN from aerosol optical properties more difficult. In the future, more aircraft measurement data will be needed to establish a more reasonable parameterization scheme for NCCN at different SS. This study may also be useful for studying aerosol activation ability in other regions of the world.
Measurement data from the field campaign used in this study are available from the corresponding author upon request (yuyingwang@nuist.edu.cn).
The supplement related to this article is available online at: https://doi.org/10.5194/acp-22-14879-2022-supplement.
ZL and YW determined the main goal of this study. RZ and YW conceived the study and prepared this paper. ZL, RD, HS, and YC led the airborne campaign, ZW, XR, HH, and FW conducted this airborne campaign. HS, YC, and ZW provided the CCN data. YG, XC, and JX processed the measurement data. All co-authors participated in science discussions and suggested analyses.
The contact author has declared that none of the authors has any competing interests.
Publisher's note: Copernicus Publications remains neutral with regard to jurisdictional claims in published maps and institutional affiliations.
We thank all participants in the campaign for their tireless work and cooperation, especially the help from the Hebei Weather Modification Office.
This research has been supported by the National Natural Science Foundation of China (NSFC) research projects (grant nos. 42005067, 42030606, and 92044303) and the National Science Foundation of the United States (grant no. 1558259).
This paper was edited by Matthias Tesche and reviewed by two anonymous referees.
Anderson, T. L. and Ogren, J. A.: Determining aerosol radiative properties using the TSI 3563 integrating nephelometer, Aerosol Sci. Technol., 29, 57–69, https://doi.org/10.1080/02786829808965551, 1998.
Andreae, M. O.: Correlation between cloud condensation nuclei concentration and aerosol optical thickness in remote and polluted regions, Atmos. Chem. Phys., 9, 543–556, https://doi.org/10.5194/acp-9-543-2009, 2009.
Andreae, M. O. and Rosenfeld, D.: Aerosol–cloud–precipitation interactions. Part 1. The nature and sources of cloud-active aerosols, Earth-Sci. Rev., 89, 13–41, https://doi.org/10.1016/j.earscirev.2008.03.001, 2008.
Benish, S. E., He, H., Ren, X., Roberts, S. J., Salawitch, R. J., Li, Z., Wang, F., Wang, Y., Zhang, F., Shao, M., Lu, S., and Dickerson, R. R.: Measurement report: Aircraft observations of ozone, nitrogen oxides, and volatile organic compounds over Hebei Province, China, Atmos. Chem. Phys., 20, 14523–14545, https://doi.org/10.5194/acp-20-14523-2020, 2020.
Benish, S. E., Salawitch, R. J., Ren, X., He, H., and Dickerson, R. R.: Airborne Observations of CFCs Over Hebei Province, China in Spring 2016, J. Geophys. Res.-Atmos., 126, e2021JD035152, https://doi.org/10.1029/2021JD035152, 2021.
Bond, T. C., Doherty, S. J., Fahey, D. W., Forster, P. M., Berntsen, T., DeAngelo, B. J., Flanner, M. G., Ghan, S., Kärcher, B., Koch, D., Kinne, S., Kondo, Y., Quinn, P. K., Sarofim, M. C., Schultz, M. G., Schulz, M., Venkataraman, C., Zhang, H., Zhang, S., Bellouin, N., Guttikunda, S. K., Hopke, P. K., Jacobson, M. Z., Kaiser, J. W., Klimont, Z., Lohmann, U., Schwarz, J. P., Shindell, D., Storelvmo, T., Warren, S. G., and Zender, C. S.: Bounding the role of black carbon in the climate system: A scientific assessment, J. Geophys. Res.-Atmos., 118, 5380–5552, https://doi.org/10.1002/jgrd.50171, 2013.
Cai, M., Tan, H., Chan, C. K., Qin, Y., Xu, H., Li, F., Schurman, M. I., Liu, L., and Zhao, J.: The size-resolved cloud condensation nuclei (CCN) activity and its prediction based on aerosol hygroscopicity and composition in the Pearl Delta River (PRD) region during wintertime 2014, Atmos. Chem. Phys., 18, 16419–16437, https://doi.org/10.5194/acp-18-16419-2018, 2018.
Cai, Z., Li, Z., Li, P., Li, J., Sun, H., Yang, Y., Gao, X., Ren, G., Ren, R., and Wei, J.: Vertical distributions of aerosol microphysical and optical properties based on aircraft measurements made over the Loess Plateau in China, Atmos. Environ., 270, 118888, https://doi.org/10.1016/j.atmosenv.2021.118888, 2022.
Chen, C., Qiu, Y., Xu, W., He, Y., Li, Z., Sun, J., Ma, N., Xu, W., Pan, X., Fu, P., Wang, Z., and Sun, Y.: Primary emissions and secondary aerosol processing during wintertime in rural area of North China Plain, J. Geophys. Res.-Atmos., 127, e2021JD035430, https://doi.org/10.1029/2021JD035430, 2022.
Choudhury, G. and Tesche, M.: Estimating cloud condensation nuclei concentrations from CALIPSO lidar measurements, Atmos. Meas. Tech., 15, 639–654, https://doi.org/10.5194/amt-15-639-2022, 2022.
Cohard, J.-M., Pinty, J.-P., and Bedos, C.: Extending Twomey's analytical estimate of nucleated cloud droplet concentrations from CCN spectra, J. Atmos. Sci., 55, 3348–3357, https://doi.org/10.1175/1520-0469(1998)055<3348:Etsaeo>2.0.Co;2, 1998.
Fan, J., Wang, Y., Rosenfeld, D., and Liu, X.: Review of aerosol–cloud interactions: mechanisms, significance, and challenges, J. Atmos. Sci., 73, 4221–4252, https://doi.org/10.1175/jas-d-16-0037.1, 2016.
Farmer, D. K., Cappa, C. D., and Kreidenweis, S. M.: Atmospheric processes and their controlling influence on cloud condensation nuclei activity, Chem. Rev., 115, 4199–4217, https://doi.org/10.1021/cr5006292, 2015.
Gunthe, S. S., Rose, D., Su, H., Garland, R. M., Achtert, P., Nowak, A., Wiedensohler, A., Kuwata, M., Takegawa, N., Kondo, Y., Hu, M., Shao, M., Zhu, T., Andreae, M. O., and Pöschl, U.: Cloud condensation nuclei (CCN) from fresh and aged air pollution in the megacity region of Beijing, Atmos. Chem. Phys., 11, 11023–11039, https://doi.org/10.5194/acp-11-11023-2011, 2011.
Guo, L., Guo, X., Fang, C., and Zhu, S.: Observation analysis on characteristics of formation, evolution and transition of a long-lasting severe fog and haze episode in North China, Sci. China Earth Sci., 58, 329–344, https://doi.org/10.1007/s11430-014-4924-2, 2015.
Hamonou, E., Chazette, P., Balis, D., Dulac, F., Schneider, X., Galani, E., Ancellet, G., and Papayannis, A.: Characterization of the vertical structure of Saharan dust export to the Mediterranean basin, J. Geophys. Res.-Atmos., 104, 22257–22270, https://doi.org/10.1029/1999jd900257, 1999.
Hegg, D. A., Radke, L. F., and Hobbs, P. V.: Measurements of Aitken nuclei and cloud condensation nuclei in the marine atmosphere and their relation to the DMS-Cloud-climate hypothesis, J. Geophys. Res.-Atmos., 96, 18727–18733, https://doi.org/10.1029/91JD01870, 1991.
IPCC: Climate Change 2021: ”The Physical Science Basis, sixth assessment of the Inter-governmental Panel on Climate Change, edited by: Masson-Delmotte, V., P. Zhai, A., Pirani, S. L., Connors, C., Péan, S., Berger, N., Caud, Y., Chen, L., Goldfarb, M. I., Gomis, M., Huang, K., Leitzell, E., Lonnoy, J. B. R., Matthews, T. K., Maycock, T., Waterfield, O., Yelekçi, R., Yu., and Zhou, B., Cambridge University Press, Cambridge, United Kingdom and New York, NY, USA, in press, https://doi.org/10.1017/9781009157896, 2021.
Janhäll, S., Olofson, K. F. G., Andersson, P. U., Pettersson, J. B. C., and Hallquist, M.: Evolution of the urban aerosol during winter temperature inversion episodes, Atmos. Environ., 40, 5355–5366, https://doi.org/10.1016/j.atmosenv.2006.04.051, 2006.
Jayachandran, V. N., Suresh Babu, S. N., Vaishya, A., Gogoi, M. M., Nair, V. S., Satheesh, S. K., and Krishna Moorthy, K.: Altitude profiles of cloud condensation nuclei characteristics across the Indo-Gangetic Plain prior to the onset of the Indian summer monsoon, Atmos. Chem. Phys., 20, 561–576, https://doi.org/10.5194/acp-20-561-2020, 2020a.
Jayachandran, V. N., Varghese, M., Murugavel, P., Todekar, K. S., Bankar, S. P., Malap, N., Dinesh, G., Safai, P. D., Rao, J., Konwar, M., Dixit, S., and Prabha, T. V.: Cloud condensation nuclei characteristics during the Indian summer monsoon over a rain-shadow region, Atmos. Chem. Phys., 20, 7307–7334, https://doi.org/10.5194/acp-20-7307-2020, 2020b.
Jefferson, A.: Empirical estimates of CCN from aerosol optical properties at four remote sites, Atmos. Chem. Phys., 10, 6855–6861, https://doi.org/10.5194/acp-10-6855-2010, 2010.
Ji, Q. and Shaw, G. E.: On supersaturation spectrum and size distributions of cloud condensation nuclei, Geophys. Res. Lett., 25, 1903–1906, https://doi.org/10.1029/98GL01404, 1998.
Juranyi, Z., Gysel, M., Weingartner, E., Bukowiecki, N., Kammermann, L., and Baltensperger, U.: A 17 month climatology of the cloud condensation nuclei number concentration at the high alpine site Jungfraujoch, J. Geophys. Res.-Atmos., 116, D10204, https://doi.org/10.1029/2010JD015199, 2011.
Leng, C., Cheng, T., Chen, J., Zhang, R., Tao, J., Huang, G., Zha, S., Zhang, M., Fang, W., Li, X., and Li, L.: Measurements of surface cloud condensation nuclei and aerosol activity in downtown Shanghai, Atmos. Environ., 69, 354–361, https://doi.org/10.1016/j.atmosenv.2012.12.021, 2013.
Li, J., Chen, H., Li, Z., Wang, P., Cribb, M., and Fan, X.: Low-level temperature inversions and their effect on aerosol condensation nuclei concentrations under different large-scale synoptic circulations, Adv. Atmos. Sci., 32, 898–908, https://doi.org/10.1007/s00376-014-4150-z, 2015a.
Li, J., Yin, Y., Li, P., Li, Z., Li, R., Cribb, M., Dong, Z., Zhang, F., Li, J., Ren, G., Jin, L., and Li, Y.: Aircraft measurements of the vertical distribution and activation property of aerosol particles over the Loess Plateau in China, Atmos. Res., 155, 73–86, https://doi.org/10.1016/j.atmosres.2014.12.004, 2015b.
Li, Z., Lau, W. K.-M., Ramanathan, V., Wu, G., Ding, Y., Manoj, M. G., Liu, J., Qian, Y., Li, J., Zhou, T., Fan, J., Rosenfeld, D., Ming, Y., Wang, Y., Huang, J., Wang, B., Xu, X., Lee, S.-S., Cribb, M., Zhang, F., Yang, X., Zhao, C., Takemura, T., Wang, K., Xia, X., Yin, Y., Zhang, H., Guo, J., Zhai, P. M., Sugimoto, N., Babu, S. S., and Brasseur, G. P.: Aerosol and monsoon climate interactions over Asia, Rev. Geophys., 54, 866–929, https://doi.org/10.1002/2015RG000500, 2016.
Li, Z., Wang, Y., Guo, J., Zhao, C., Cribb, M. C., Dong, X., Fan, J., Gong, D., Huang, J., Jiang, M., Jiang, Y., Lee, S. S., Li, H., Li, J., Liu, J., Qian, Y., Rosenfeld, D., Shan, S., Sun, Y., Wang, H., Xin, J., Yan, X., Yang, X., Yang, X.-Q., Zhang, F., and Zheng, Y.: East Asian Study of Tropospheric Aerosols and their Impact on Regional Clouds, Precipitation, and Climate (EAST-AIRCPC), J. Geophys. Res.-Atmos., 124, 13026–13054, https://doi.org/10.1029/2019JD030758, 2019.
Liu, J. and Li, Z.: Estimation of cloud condensation nuclei concentration from aerosol optical quantities: influential factors and uncertainties, Atmos. Chem. Phys., 14, 471–483, https://doi.org/10.5194/acp-14-471-2014, 2014.
Liu, L., Cheng, Y., Wang, S., Wei, C., Pöhlker, M. L., Pöhlker, C., Artaxo, P., Shrivastava, M., Andreae, M. O., Pöschl, U., and Su, H.: Impact of biomass burning aerosols on radiation, clouds, and precipitation over the Amazon: relative importance of aerosol–cloud and aerosol–radiation interactions, Atmos. Chem. Phys., 20, 13283–13301, https://doi.org/10.5194/acp-20-13283-2020, 2020.
Lohmann, U. and Feichter, J.: Global indirect aerosol effects: a review, Atmos. Chem. Phys., 5, 715–737, https://doi.org/10.5194/acp-5-715-2005, 2005.
Lv, M., Wang, Z., Li, Z., Luo, T., Ferrare, R., Liu, D., Wu, D., Mao, J., Wan, B., Zhang, F., and Wang, Y.: Retrieval of Cloud Condensation Nuclei Number Concentration Profiles From Lidar Extinction and Backscatter Data, J. Geophys. Res.-Atmos., 123, 6082–6098, https://doi.org/10.1029/2017JD028102, 2018.
Mamouri, R.-E. and Ansmann, A.: Potential of polarization lidar to provide profiles of CCN- and INP-relevant aerosol parameters, Atmos. Chem. Phys., 16, 5905–5931, https://doi.org/10.5194/acp-16-5905-2016, 2016.
Manoj, M. R., Satheesh, S. K., Moorthy, K. K., Trembath, J., and Coe, H.: Measurement report: Altitudinal variation of cloud condensation nuclei activation across the Indo-Gangetic Plain prior to monsoon onset and during peak monsoon periods: results from the SWAAMI field campaign, Atmos. Chem. Phys., 21, 8979–8997, https://doi.org/10.5194/acp-21-8979-2021, 2021.
Paramonov, M., Kerminen, V.-M., Gysel, M., Aalto, P. P., Andreae, M. O., Asmi, E., Baltensperger, U., Bougiatioti, A., Brus, D., Frank, G. P., Good, N., Gunthe, S. S., Hao, L., Irwin, M., Jaatinen, A., Jurányi, Z., King, S. M., Kortelainen, A., Kristensson, A., Lihavainen, H., Kulmala, M., Lohmann, U., Martin, S. T., McFiggans, G., Mihalopoulos, N., Nenes, A., O'Dowd, C. D., Ovadnevaite, J., Petäjä, T., Pöschl, U., Roberts, G. C., Rose, D., Svenningsson, B., Swietlicki, E., Weingartner, E., Whitehead, J., Wiedensohler, A., Wittbom, C., and Sierau, B.: A synthesis of cloud condensation nuclei counter (CCNC) measurements within the EUCAARI network, Atmos. Chem. Phys., 15, 12211–12229, https://doi.org/10.5194/acp-15-12211-2015, 2015.
Ren, J., Zhang, F., Wang, Y., Collins, D., Fan, X., Jin, X., Xu, W., Sun, Y., Cribb, M., and Li, Z.: Using different assumptions of aerosol mixing state and chemical composition to predict CCN concentrations based on field measurements in urban Beijing, Atmos. Chem. Phys., 18, 6907–6921, https://doi.org/10.5194/acp-18-6907-2018, 2018.
Ren, R., Li, Z., Yan, P., Wang, Y., Wu, H., Cribb, M., Wang, W., Jin, X., Li, Y., and Zhang, D.: Measurement report: The effect of aerosol chemical composition on light scattering due to the hygroscopic swelling effect, Atmos. Chem. Phys., 21, 9977–9994, https://doi.org/10.5194/acp-21-9977-2021, 2021.
Rose, D., Gunthe, S. S., Mikhailov, E., Frank, G. P., Dusek, U., Andreae, M. O., and Pöschl, U.: Calibration and measurement uncertainties of a continuous-flow cloud condensation nuclei counter (DMT-CCNC): CCN activation of ammonium sulfate and sodium chloride aerosol particles in theory and experiment, Atmos. Chem. Phys., 8, 1153–1179, https://doi.org/10.5194/acp-8-1153-2008, 2008.
Rose, D., Nowak, A., Achtert, P., Wiedensohler, A., Hu, M., Shao, M., Zhang, Y., Andreae, M. O., and Pöschl, U.: Cloud condensation nuclei in polluted air and biomass burning smoke near the mega-city Guangzhou, China – Part 1: Size-resolved measurements and implications for the modeling of aerosol particle hygroscopicity and CCN activity, Atmos. Chem. Phys., 10, 3365–3383, https://doi.org/10.5194/acp-10-3365-2010, 2010.
Rosenfeld, D., Lohmann, U., Raga, G. B., O'Dowd, C. D., Kulmala, M., Fuzzi, S., Reissell, A., and Andreae, M. O.: Flood or drought: How do aerosols affect precipitation?, Science, 321, 1309–1313, https://doi.org/10.1126/science.1160606, 2008.
Rosenfeld, D., Sherwood, S., Wood, R., and Donner, L.: Climate effects of aerosol-cloud interactions, Science, 343, 379–380, https://doi.org/10.1126/science.1247490, 2014.
Rosenfeld, D., Zheng, Y., Hashimshoni, E., Pöhlker, M. L., Jefferson, A., Pöhlker, C., Yu, X., Zhu, Y., Liu, G., Yue, Z., Fischman, B., Li, Z., Giguzin, D., Goren, T., Artaxo, P., Barbosa, H. M. J., Pöschl, U., and Andreae, M. O.: Satellite retrieval of cloud condensation nuclei concentrations by using clouds as CCN chambers, P. Natl. Acad. Sci. USA, 113, 5828–5834, https://doi.org/10.1073/pnas.1514044113, 2016.
Schmale, J., Henning, S., Decesari, S., Henzing, B., Keskinen, H., Sellegri, K., Ovadnevaite, J., Pöhlker, M. L., Brito, J., Bougiatioti, A., Kristensson, A., Kalivitis, N., Stavroulas, I., Carbone, S., Jefferson, A., Park, M., Schlag, P., Iwamoto, Y., Aalto, P., Äijälä, M., Bukowiecki, N., Ehn, M., Frank, G., Fröhlich, R., Frumau, A., Herrmann, E., Herrmann, H., Holzinger, R., Kos, G., Kulmala, M., Mihalopoulos, N., Nenes, A., O'Dowd, C., Petäjä, T., Picard, D., Pöhlker, C., Pöschl, U., Poulain, L., Prévôt, A. S. H., Swietlicki, E., Andreae, M. O., Artaxo, P., Wiedensohler, A., Ogren, J., Matsuki, A., Yum, S. S., Stratmann, F., Baltensperger, U., and Gysel, M.: Long-term cloud condensation nuclei number concentration, particle number size distribution and chemical composition measurements at regionally representative observatories, Atmos. Chem. Phys., 18, 2853–2881, https://doi.org/10.5194/acp-18-2853-2018, 2018.
Shinozuka, Y., Clarke, A. D., Nenes, A., Jefferson, A., Wood, R., McNaughton, C. S., Ström, J., Tunved, P., Redemann, J., Thornhill, K. L., Moore, R. H., Lathem, T. L., Lin, J. J., and Yoon, Y. J.: The relationship between cloud condensation nuclei (CCN) concentration and light extinction of dried particles: indications of underlying aerosol processes and implications for satellite-based CCN estimates, Atmos. Chem. Phys., 15, 7585–7604, https://doi.org/10.5194/acp-15-7585-2015, 2015.
Stein, A. F., Draxler, R. R., Rolph, G. D., Stunder, B. J. B., Cohen, M. D., and Ngan, F.: NOAA's HYSPLIT Atmospheric Transport and Dispersion Modeling System, B. Am. Meteorol. Soc., 96, 2059–2077, https://doi.org/10.1175/BAMS-D-14-00110.1, 2015.
Tao, J., Zhao, C., Kuang, Y., Zhao, G., Shen, C., Yu, Y., Bian, Y., and Xu, W.: A new method for calculating number concentrations of cloud condensation nuclei based on measurements of a three-wavelength humidified nephelometer system, Atmos. Meas. Tech., 11, 895–906, https://doi.org/10.5194/amt-11-895-2018, 2018.
Twomey, S.: The nuclei of natural cloud formation.Ppart II: The supersaturation in natural clouds and the variation of cloud droplet concentration, Geofis. Pura Appl., 43, 243–249, https://doi.org/10.1007/BF01993560, 1959.
Wang, F., Li, Z., Ren, X., Jiang, Q., He, H., Dickerson, R. R., Dong, X., and Lv, F.: Vertical distributions of aerosol optical properties during the spring 2016 ARIAs airborne campaign in the North China Plain, Atmos. Chem. Phys., 18, 8995–9010, https://doi.org/10.5194/acp-18-8995-2018, 2018.
Wang, Q., Du, W., Sun, Y., Wang, Z., Tang, G., and Zhu, J.: Submicron-scale aerosol above the city canopy in Beijing in spring based on in-situ meteorological tower measurements, Atmos. Res., 271, 106128, https://doi.org/10.1016/j.atmosres.2022.106128, 2022
Wang, Y., Li, Z., Zhang, Y., Du, W., Zhang, F., Tan, H., Xu, H., Fan, T., Jin, X., Fan, X., Dong, Z., Wang, Q., and Sun, Y.: Characterization of aerosol hygroscopicity, mixing state, and CCN activity at a suburban site in the central North China Plain, Atmos. Chem. Phys., 18, 11739–11752, https://doi.org/10.5194/acp-18-11739-2018, 2018.
Wang, Y., Dörner, S., Donner, S., Böhnke, S., De Smedt, I., Dickerson, R. R., Dong, Z., He, H., Li, Z., Li, Z., Li, D., Liu, D., Ren, X., Theys, N., Wang, Y., Wang, Y., Wang, Z., Xu, H., Xu, J., and Wagner, T.: Vertical profiles of NO2, SO2, HONO, HCHO, CHOCHO and aerosols derived from MAX-DOAS measurements at a rural site in the central western North China Plain and their relation to emission sources and effects of regional transport, Atmos. Chem. Phys., 19, 5417–5449, https://doi.org/10.5194/acp-19-5417-2019, 2019.
Xia, C., Sun, J., Qi, X., Shen, X., Zhong, J., Zhang, X., Wang, Y., Zhang, Y., and Hu, X.: Observational study of aerosol hygroscopic growth on scattering coefficient in Beijing: A case study in March of 2018, Sci. Total Environ., 685, 239–247, https://doi.org/10.1016/j.scitotenv.2019.05.283, 2019.
Xu, W., Ovadnevaite, J., Fossum, K. N., Lin, C., Huang, R.-J., O'Dowd, C., and Ceburnis, D.: Aerosol hygroscopicity and its link to chemical composition in the coastal atmosphere of Mace Head: marine and continental air masses, Atmos. Chem. Phys., 20, 3777–3791, https://doi.org/10.5194/acp-20-3777-2020, 2020.
Yau, M. K. and Rogers, R. R.: A short course in cloud physics, Third Edition, edited by: ter Haar, D., Elsevier, ISBN 0750632151, 28–42, 1996.
Zhang, F., Li, Z., Li, Y., Sun, Y., Wang, Z., Li, P., Sun, L., Wang, P., Cribb, M., Zhao, C., Fan, T., Yang, X., and Wang, Q.: Impacts of organic aerosols and its oxidation level on CCN activity from measurement at a suburban site in China, Atmos. Chem. Phys., 16, 5413–5425, https://doi.org/10.5194/acp-16-5413-2016, 2016.
Zhang, F., Wang, Y., Peng, J., Ren, J., Collins, D., Zhang, R., Sun, Y., Yang, X., and Li, Z.: Uncertainty in predicting CCN activity of aged and primary aerosols, J. Geophys. Res.-Atmos., 122, 11723–11736, https://doi.org/10.1002/2017jd027058, 2017.
Zhang, L., Sun, J. Y., Shen, X. J., Zhang, Y. M., Che, H., Ma, Q. L., Zhang, Y. W., Zhang, X. Y., and Ogren, J. A.: Observations of relative humidity effects on aerosol light scattering in the Yangtze River Delta of China, Atmos. Chem. Phys., 15, 8439–8454, https://doi.org/10.5194/acp-15-8439-2015, 2015.