the Creative Commons Attribution 4.0 License.
the Creative Commons Attribution 4.0 License.
 | 22 Nov 2022
Fluxes, patterns and sources of phosphorus deposition in an urban–rural transition region in Southwest China
Yuanyuan Chen
Jiang Liu
Jiangyou Ran
Rong Huang
Chunlong Zhang
Xuesong Gao
Wei Zhou
Ting Lan
Dinghua Ou
Yan He
Yalan Xiong
Lu Wang
Ouping Deng
Understanding the patterns of atmospheric phosphorus (P) deposition is essential for assessing the global P biogeochemical cycle. Atmospheric P is an essential source of P in agricultural activities as well as eutrophication in waters; however, the information on P deposition is paid relatively less attention, especially in the anthropogenic influencing region. Therefore, this study chose a typical urban–rural transition as a representative case to monitor the dry and wet P depositions for 2 years. The results showed that the fluxes of atmospheric total P deposition ranged from 0.50 to 1.06 kg P hm−2 yr−1, and the primary form was atmospheric dry P deposition (76.1 %, 0.76–0.84 kg P hm−2 yr−1). Moreover, it was found that the monthly variations of P deposition were strongly correlated with meteorological factors, including precipitation, temperature and relative humidity. However, the fluxes of dry P deposition and total P deposition were more affected by land use, which increased with the agro-facility, town and paddy field areas but decreased with the forest and country road areas. These findings suggested that dry P deposition was the primary form of total P deposition, and P deposition could be affected both by meteorological factors and land-use types. Thus, proper management of land use may help mitigate the pollution caused by P deposition.
- Article
(7438 KB) - Full-text XML
-
Supplement
(390 KB) - BibTeX
- EndNote


Phosphorus (P) is generally considered the essential nutrient and growth-limiting element in terrestrial and aquatic ecosystems (Vitousek et al., 2010; Peñuelas et al., 2013). Over the past few decades, with the increasing application of P fertilizers and fossil fuel combustion, substantial anthropogenic P has been emitted into the atmosphere (Wang et al., 2015; Du et al., 2016). Moreover, the deposition of atmospheric P on terrestrial surfaces overfertilizes some natural and seminatural ecosystems (Camarero and Catalan, 2012; Cleveland et al., 2013; Wang et al., 2015), especially aquatic ecosystems (Pollman et al., 2002; Tong et al., 2017). However, P deficiency was also found in a large proportion (43 %) of land area, in which P input, such as deposition, will significantly increase the productivity of plants (Elser et al., 2007; Du et al., 2020; Hou et al., 2020). Hence, estimating the deposition characteristics of atmospheric P is important to understand the biogeochemical process of P and could provide information on water nutrient pollution control.
Several research efforts have quantified P deposition fluxes from the field scale to the global scale, and the results showed large uncertainty. For instance, a recent meta-analysis of 394 sites from a global scale covering the period 1959–2020 observed that the average value of atmospheric total P deposition was 0.58 ± 0.72 kg hm−2 yr−1 (Pan et al., 2021). It has been reported that total P deposition fluxes range from 0.002 to 2.53 kg P hm−2 yr−1 at 41 sites across China (Zhu et al., 2016). In addition, the overall average fluxes of total P deposition during 2008–2018 at four sites located in Southwest China ranged from 0.12 to 4.15 kg P hm−2 yr−1 (Song et al., 2022). Previous studies have identified that P deposition rates vary at local scales. Therefore, P deposition exists with temporal and spatial variations at a regional scale, and measurements across different areas are needed to better understand the role of P deposition in the global P cycle.
Different land-use types and the resulting landscape perturbations largely determine P deposition (Peñuelas et al., 2011). For instance, the application of P fertilizer could be the main source of higher P deposition in agricultural areas (Winter et al., 2002; Anderson and Downing, 2006). At rural sites, biogenic sources are the primary contributor to atmospheric P deposition, whereas anthropogenic sources (such as the application of P fertilizer) have a larger effect on atmospheric P deposition at suburban sites (Chiwa, 2020). Additionally, a previous study revealed that sites characterized by land-use types, such as areas under intensive agricultural management, contributed more P deposition (3.22 kg P hm−2 yr−1), which was higher than in rural, urban and forest areas (0.20–1.07 kg P hm−2 yr−1; Song et al., 2022). In addition, P deposition in forested sites significantly increased with decreasing distance to the nearest large cities (Du et al., 2016). Additionally, field studies have observed that meteorological factors, including precipitation and temperature, could influence temporal variations of atmospheric P deposition (Tipping et al., 2014; Zhu et al., 2016; Chiwa et al., 2020). There is still great uncertainty about how these influencing factors affect the variation in P deposition. Further comprehensive identification of the variation drivers of atmospheric P deposition on a regional scale is needed.
Atmospheric P mainly occurs in the form of aerosols rather than in a stable gaseous phase (Mahowald et al., 2008). Hence, larger and heavier P-containing aerosols are mainly contributed by local sources because they can only be transported over short distances, while fine dust can originate from thousands of kilometers (Tipping et al., 2014). Further, P-containing aerosols originating in different ways are likely to be deposited on the terrestrial surface in distinct ways. Atmospheric P-containing aerosols that were scavenged in and below clouds by precipitation and deposited on the terrestrial surface were defined as wet deposition (Yang et al., 2012). These were removed and deposited onto the terrestrial surface by the adsorption of water droplets under the action of gravity, which was defined as dry deposition (Grantz et al., 2003). However, most reported measurements are based on bulk deposition, which includes wet deposition plus a fraction of dry deposition. Meanwhile, the measurements of dry deposition are quite sparse. Hence, it is essential to collect wet deposition and dry deposition separately, which can enrich the P database and clarify the global P deposition pattern.
Urban–rural transition regions are formed commonly in the process of urbanization and are deeply influenced by human beings. The patterns and sources of P deposition are more complex here than in natural ecosystems. However, P deposition studies are limited here. Therefore, a typical urban–rural transition region in southwestern China was selected, and 2 years' monitoring of wet and dry P depositions in this region was conducted. The aims of this study are (1) to determine the spatial and temporal characteristics of P deposition fluxes in urban–rural transition areas, (2) to identify the factors affecting P deposition fluxes in urban–rural transition areas and (3) to reveal the “source–sink” relationship between P deposition and local land use. The results of this study are important for understanding the process of regional P deposition and regional P management with source–sink land use.
2.1 Sampling sites
This study was conducted from March 2015 to February 2017 at nine sites that were chosen to explore atmospheric P deposition, spanning a transect covering urban areas (UAs), intensive agricultural areas (IAAs) and rural areas (RAs) in the southwestern Chengdu Plain (Fig. 1, Table S1, Deng et al., 2019). Urban areas, including Shangnan Street (SS), Yongkang Street (YS) and Xihe Bridge (XB) sites, are located in Chongzhou, which has 74.4 km2 of urban land and 130 000 permanent dwellers. Intensive agricultural areas, including the Caichang (CC), Liaoyuan (LY) and Qiquan (QQ) sites, covered 1.8 km2 of the agro-facility land-use type, which accounted for approximately 69.9 % of the total in nine sites. Rural areas, including Yuantong (YT), Liujie (LJ) and Huaiyuan (HY) sites, covered 13.59 km2 of forest, which accounted for approximately 96.2 % of the total in nine sites. The total area of one land-use type was calculated by adding the values in each column, as shown in Table 1, where each column indicates the area occupied by each land-use type in nine sites. More details about the study sites are shown in Table 1. The climate at the sites is subtropical monsoon humid, with monthly precipitation, ambient temperature, relative humidity and wind speed at nine sites varying from 0.6 to 238.63 mm, 5.83 to 27. ∘C, 66.0 % to 89.3 % and 0.5 to 1.80 m s−1, respectively. The meteorological data used in this study are from the Chongzhou Meteorological Bureau, Sichuan Province, China.
Table 1The types of land use and areas were divided as follows: agricultural area (paddy field, dry land, yard and agro-facility area), built-up area (urban, town and village), road (highway and country road), water and forest.
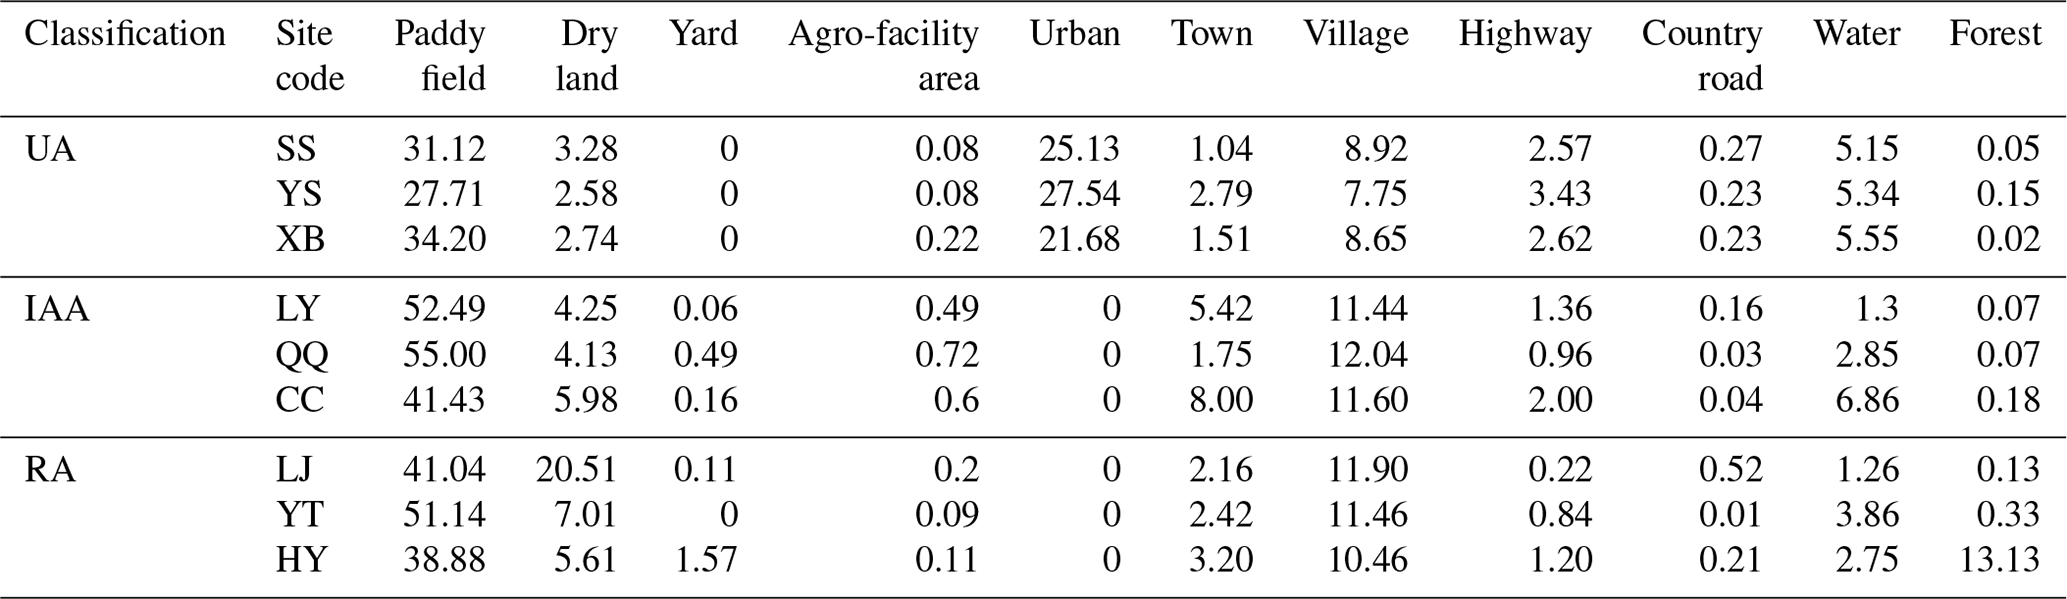
SS, Shangnan Street; YS, Yuantong Street; XB, Xihe Bridge; CC, Caichang; LY, Liaoyuan; QQ, Qiquan; YT, Yuantong; LJ, Liujie; HY, Huaiyuan. UA, urban area; IAA, intensive agricultural area; RA, rural area.
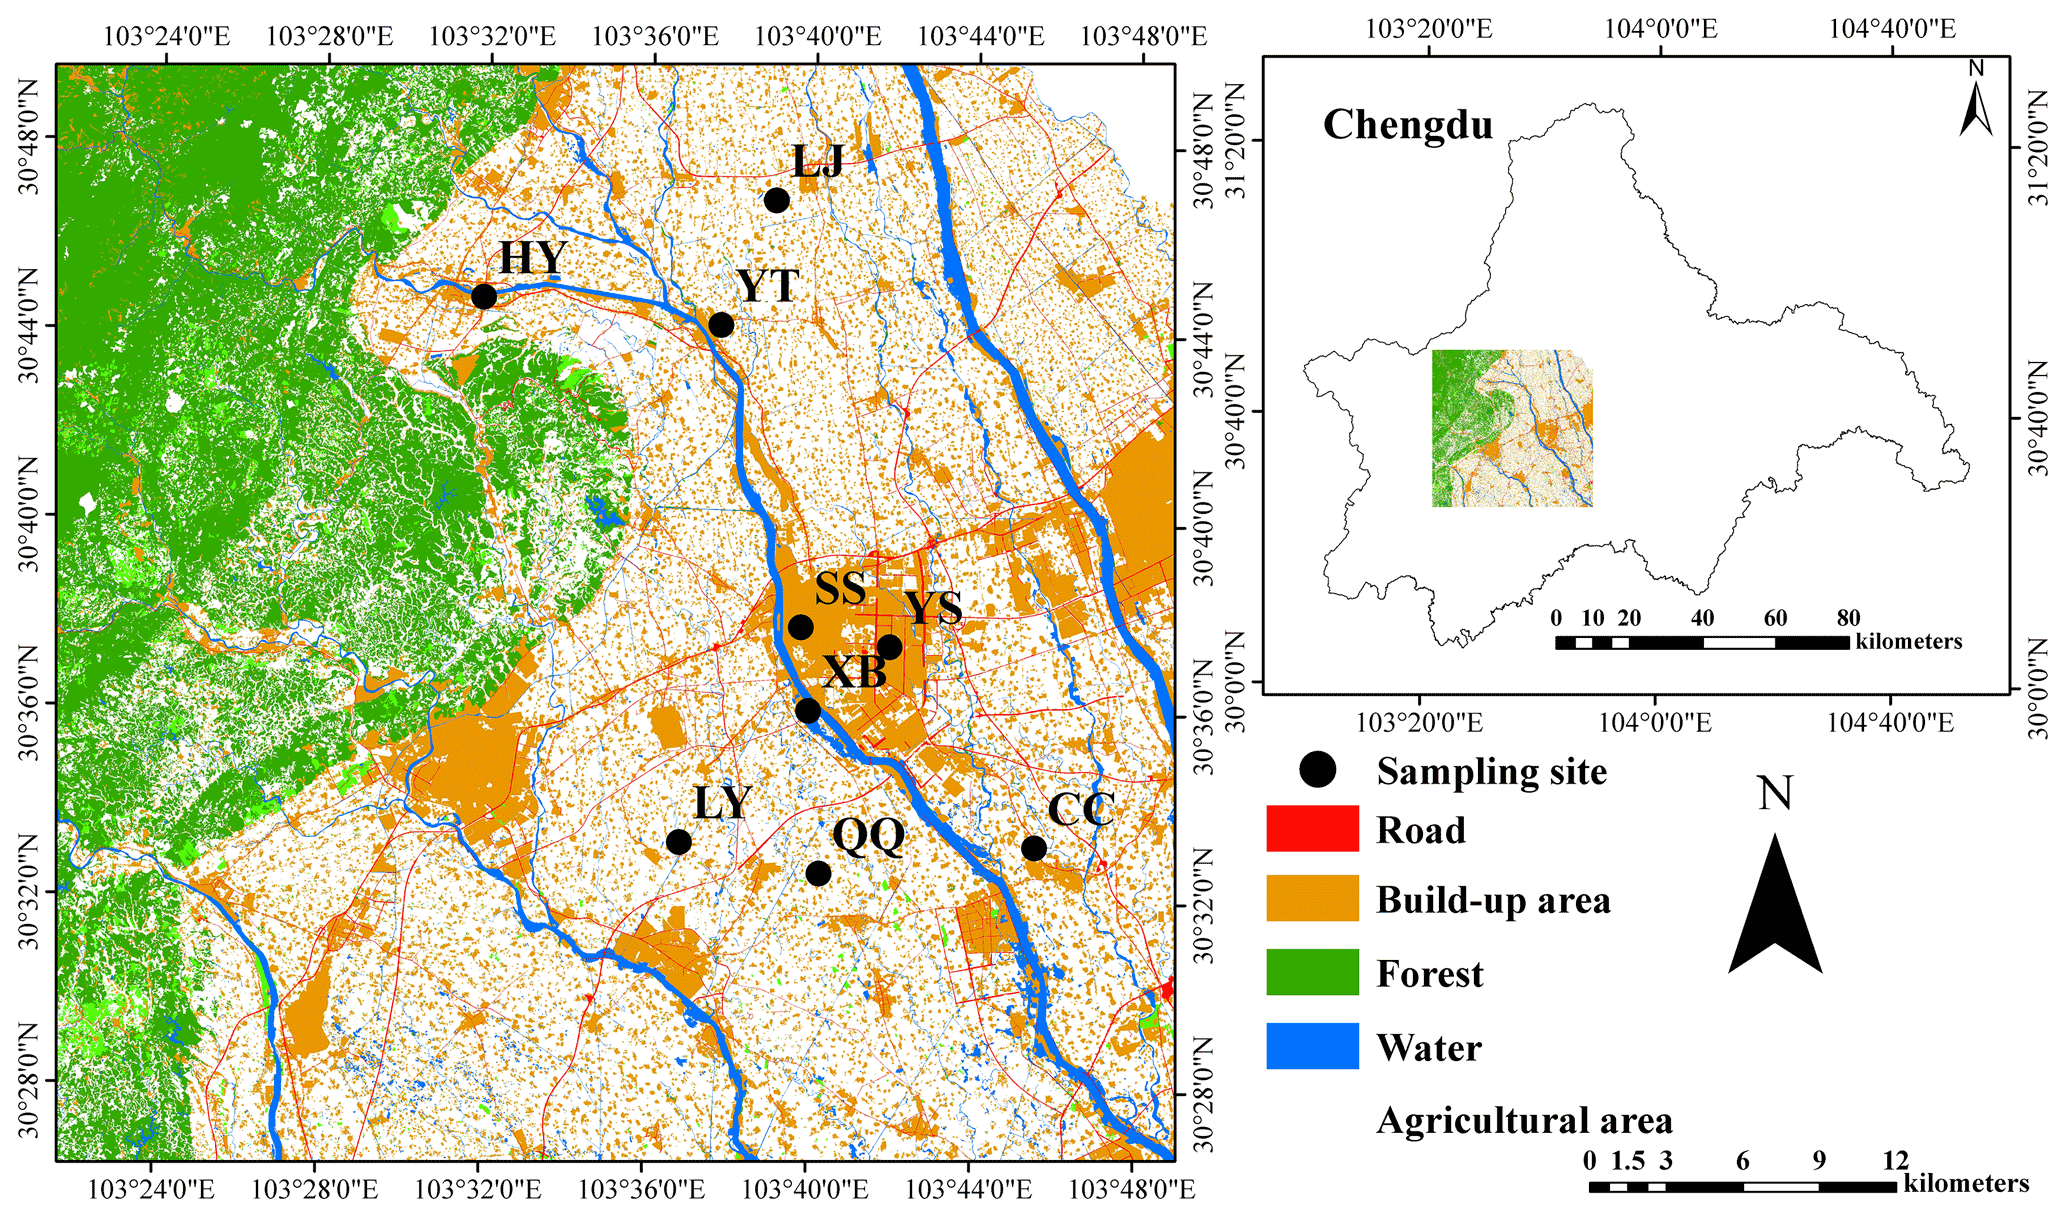
Figure 1Location of the sampling sites. SS, Shangnan Street; YS, Yongkang Street; XB, Xihe Bridge; CC, Caichang; LY, Liaoyuan; QQ, Qiquan; YT, Yuantong; LJ, Liujie; HY, Huaiyuan (Deng et al., 2019).
2.2 Sample collection and analysis
Both dry deposition (from gases, aerosols and particles) and wet deposition (from rain and snow) of P were monitored. In addition, three parallel collectors were used at each site to collect atmospheric wet and dry deposition to ensure three replicate data, respectively. Dry deposition was determined by the aqueous surface method (Anderson and Downing, 2006). Briefly, three precleaned glass cylinders (inner diameter × height of 10.5 cm × 14.5 cm) were used as dry collectors at each site. All the collectors were placed 1.2 m above the ground with no obstacles and tall buildings around each site. A stainless-steel net (pore size, 0.02 × 0.02 m2) was used to avoid any disturbance and pollution from birds and crops. The cylinder was filled with ultrapure water and examined if a refill was needed on a 4 or 6 h basis (4 h in summer and 6 h in other seasons) to keep the water depth at a level of about 10 cm (Wang et al., 2016). Dry-deposition sampling was conducted for 5 consecutive days at the end of the month, avoiding continuous rainfall as much as possible. Samples were collected in precleaned glass bottles with lids at 08:00 during these 5 d periods. In the case of rainfall, the lid on top of the collector was manually closed to eliminate the effect of wet deposition. At the end of sampling every month, samples collected during the 5 d were mixed and transported to the laboratory to determine total P (TP) concentrations on the same day.
A total of 5 consecutive days per month with a relative frequency of rainfall events were selected for wet-deposition collection, based on weather forecasts every month. Wet deposition was collected at the end of each rainfall event (Oladosu et al., 2017). If the volume of samples (100 mL) collected in one rainfall event was too little, samples from continuous rainfall events were pooled as one mixed sample. The duration (min) and rainfall capacity (mm) were recorded for each rainfall event. Rainfall samples collected monthly were mixed and transferred to the laboratory to determine total P (TP) concentrations on the same day.
During the sampling period, a total of 1026 deposition samples were collected, with half of the dry-deposition and half of the wet-deposition samples. Changes in sample volume and air exposure were minimized. Moreover, river water samples from the Xihe River (30∘36′02′′ N, 103∘39′57′′ E; XB) were collected to measure the P concentration. The total P in the collected samples was digested using potassium persulfate at 120∘ to convert TP to PO and then analyzed PO using ammonium molybdate using an ultraviolet spectrophotometer at 700 nm.
2.3 Calculations of MDP, MWP and MTP
Monthly dry deposition (MDP) was calculated as the product of the amount of sampling fluid and the concentrations of TP in the sampling fluid.
where MDP is the dry-deposition flux of TP in month d (kg P hm−2 per month), Cd is the concentration of TP in the monthly sampling fluid (mg P L−1), Vd is the sampling fluid amount (mL), d represents each month, N is the total number of days per month (d), S is the surface area of the sampling cylinder (m2), and 5 is the sampling days per month.
Monthly wet deposition (MWP) was calculated as the product of the monthly precipitation amount and the concentrations of TP in wet precipitation.
where MWP is the wet-deposition flux of TP in month i (kg P hm−2 per month); Ci is the concentration of TP in monthly wet precipitation, which was mixed with all samples for a month (mg P L−1); Pi is the monthly precipitation amount, all from weather stations within 2 km (mm); and i represents each month.
Monthly total deposition (MTP) is the sum of MDP and MWP.
where MTP is the total deposition flux of TP in each month (kg P hm−2 per month), and MDP and MWP are calculated from Eqs. (1) and (2).
2.4 Land-use data and analysis
The land-use data (2016) used in this study were provided by the Center of Land Acquisition and Consolidation in Sichuan Province. Land-use types were divided as follows: agricultural area (paddy field, dry farm, yard and agro-facility area), built-up area (urban, town and village), road (highway and country road), forest and water (Fig. 1). Taking the sampling point as the center and extracting the land-use type area with a radius of 5 km from the center, ArcGIS 10.6 was used. Correlation analysis was used to study the covariation between the fluxes of atmospheric total, dry and wet P deposition and land-use areas.
2.5 Statistical analyses
One-way analysis of variance (ANOVA) was performed to determine the spatial and temporal variation among the three areas. Statistically significant differences were set at P<0.05. Pearson's correlation analysis with a two-tailed significance test was used to examine the relationship between the fluxes of atmospheric total, dry and wet P deposition, land-use types and meteorological factors. All analyses were conducted using SPSS® 20.0 (SPSS Inc., Chicago, USA).
3.1 Monthly variations of P deposition and its constituents
Monthly variations of atmospheric total, dry and wet P deposition fluxes at nine study sites were monitored for 24 months (Fig. 2). For wet deposition, the fluxes peaked in July 2016 (0.06–0.15 kg P hm−2 per month), and the lowest fluxes were found in February 2017 (0.00–0.00 kg P hm−2 per month) (Fig. 2a). In contrast, the highest fluxes of dry P deposition occurred in November 2015 (0.07–0.24 kg P hm−2 per month), and the lowest values occurred in April 2016 (0.01–0.02 kg P hm−2 per month) (Fig. 2b). A similar variation trend was observed in total P deposition, but it reached its lowest value in April 2015 (0.01–0.03 kg P hm−2 per month) (Fig. 2c). Additionally, the monthly contribution rates of dry P deposition to total P deposition varied from 25.0 % to 99.7 % temporally (Fig. 3). Atmospheric dry P deposition constituted more than half of the total P deposition, except in April and August 2015 and May and July 2016, in which heavy rains accounting for 20.37 % of the total precipitation were observed.
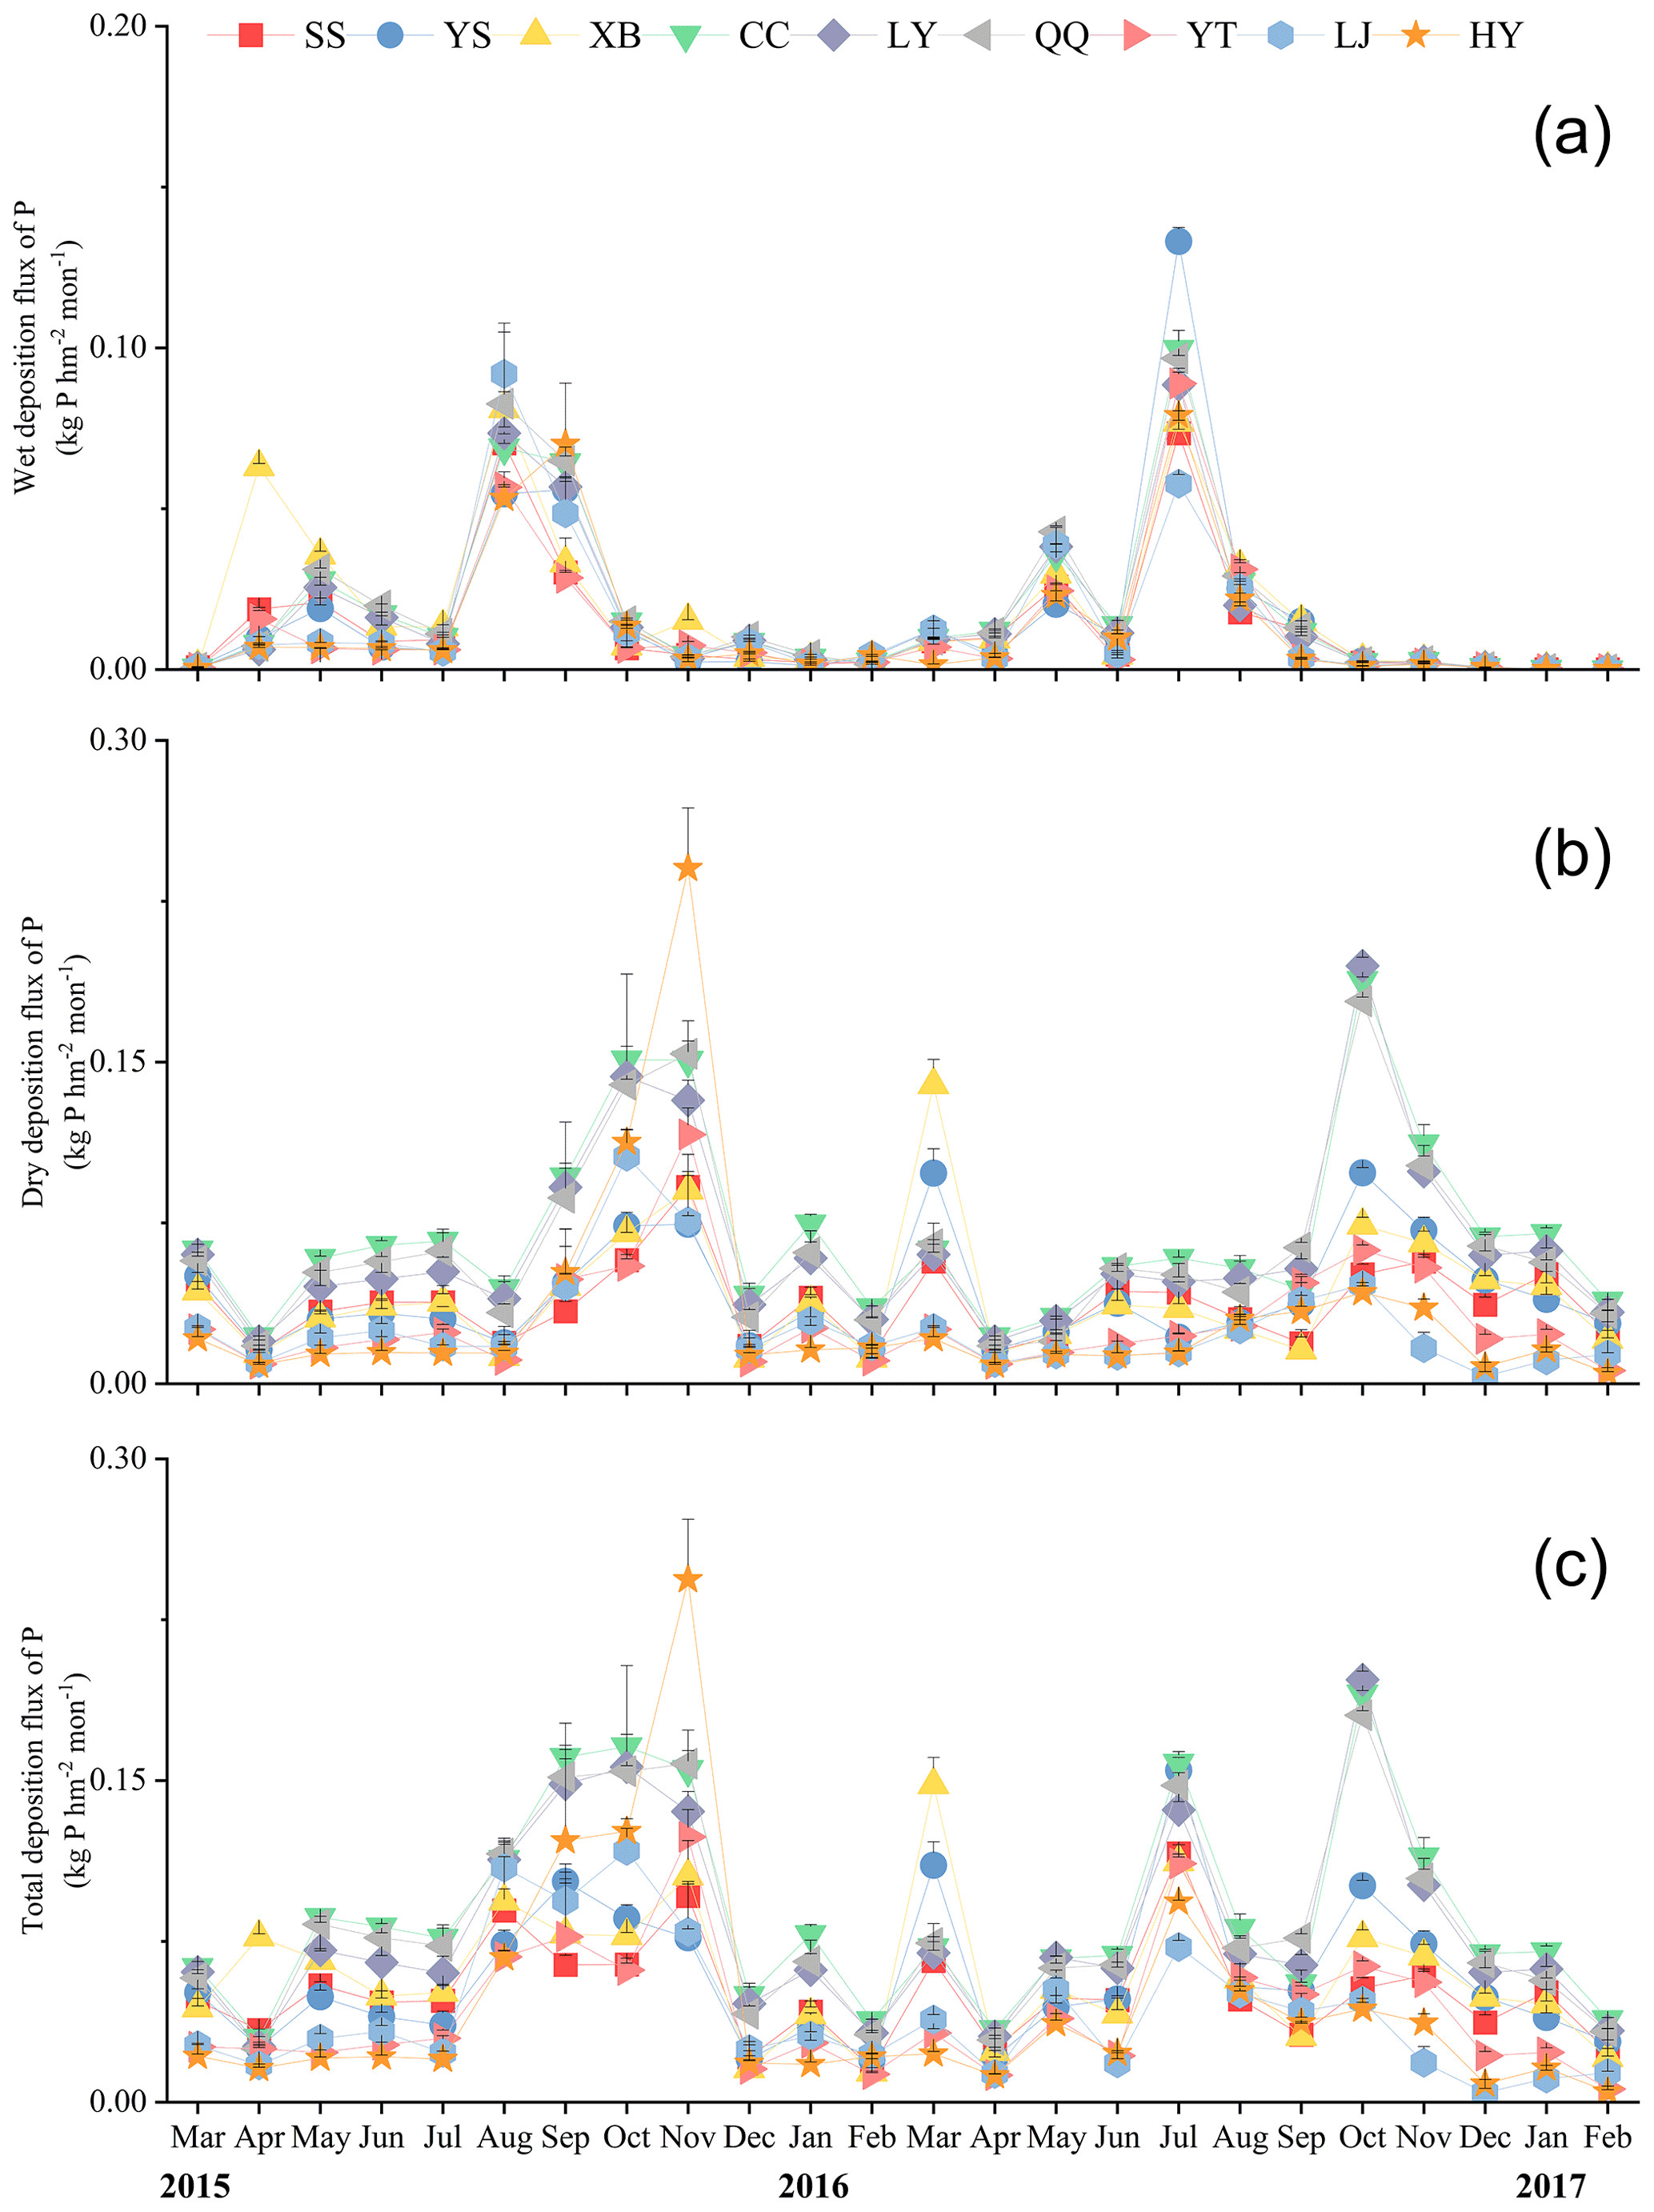
Figure 2Monthly deposition fluxes of wet (a), dry (b) and total (c) deposition of P at nine study sites. Error bars represent the standard deviations of three replicates.
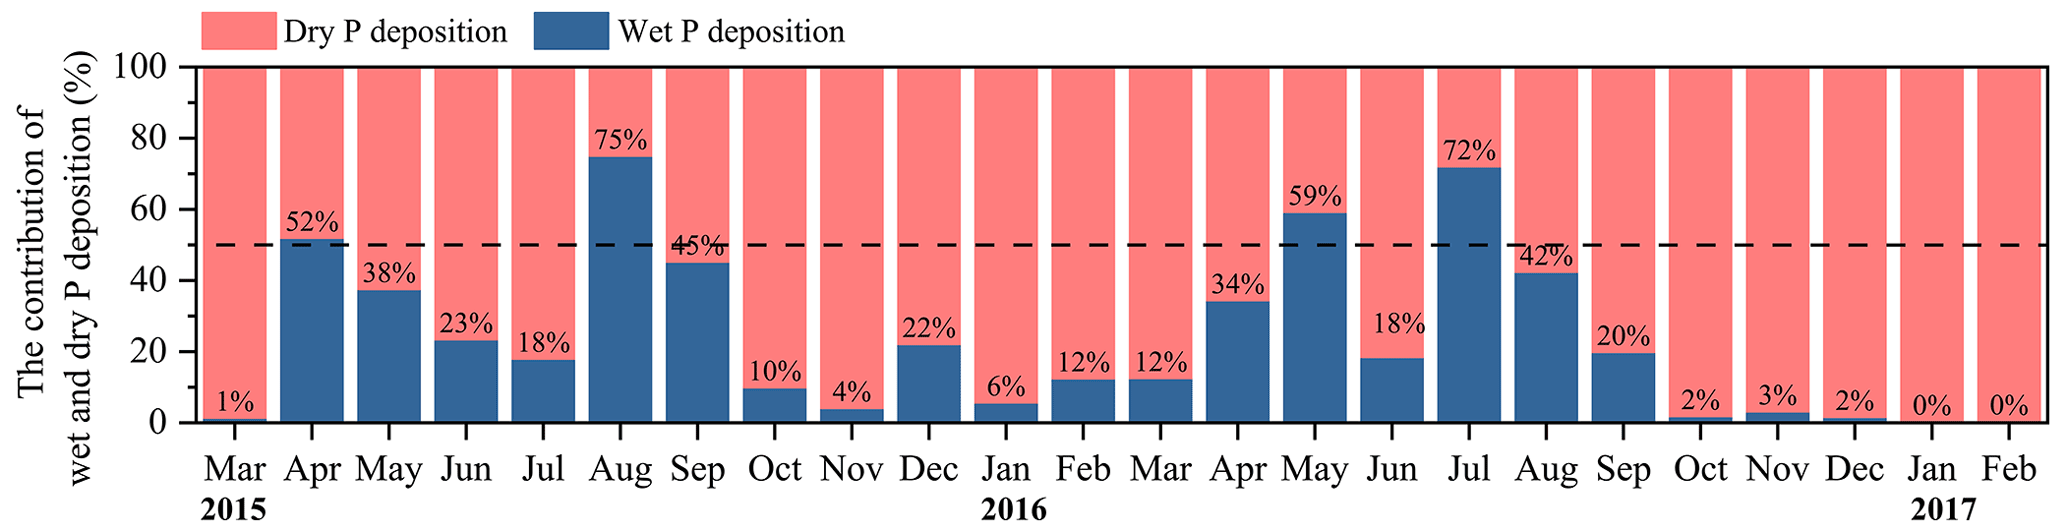
Figure 3The contribution ratio of wet P deposition and dry P deposition to total P deposition. The middle-dashed line indicates each contributes 50 %. The value represents the monthly contribution rate of wet P deposition to total P deposition.
3.2 Seasonal variations of P deposition
The fluxes of atmospheric wet P deposition in summer (including June, July and August in this study) are 2.5–17.1 times higher than those in other seasons (P<0.05, Fig. 4a). Conversely, the fluxes of dry P deposition and total P deposition in autumn are significantly higher than those in other seasons (by 1.4–2.9 times, P<0.05; Fig. 4b, c). Summer (June to August) is the key season for wet P deposition, while autumn (September to November) is the key season for dry P deposition and total P deposition. The study area belongs to the subtropical monsoon climate zone, with high rainfall, temperature and humidity in summer and autumn, which contribute to the emission and deposition of P. Thus, correlation analysis between three types of depositions (atmospheric wet, dry and total P deposition) and meteorological factors (precipitation, wind speed, temperature and relative humidity) was adopted. The fluxes of wet P deposition were positively correlated with precipitation (R=0.917) and temperature (R=0.574) (P<0.01), while the values of dry P deposition have a positive correlation with relative humidity (R=0.439) (P<0.01). Additionally, significant correlations were found between total P deposition fluxes and precipitation (R=0.360), relative humidity (R=0.481) (P<0.01) and temperature (R=0.294) (P<0.05) (Table S2).
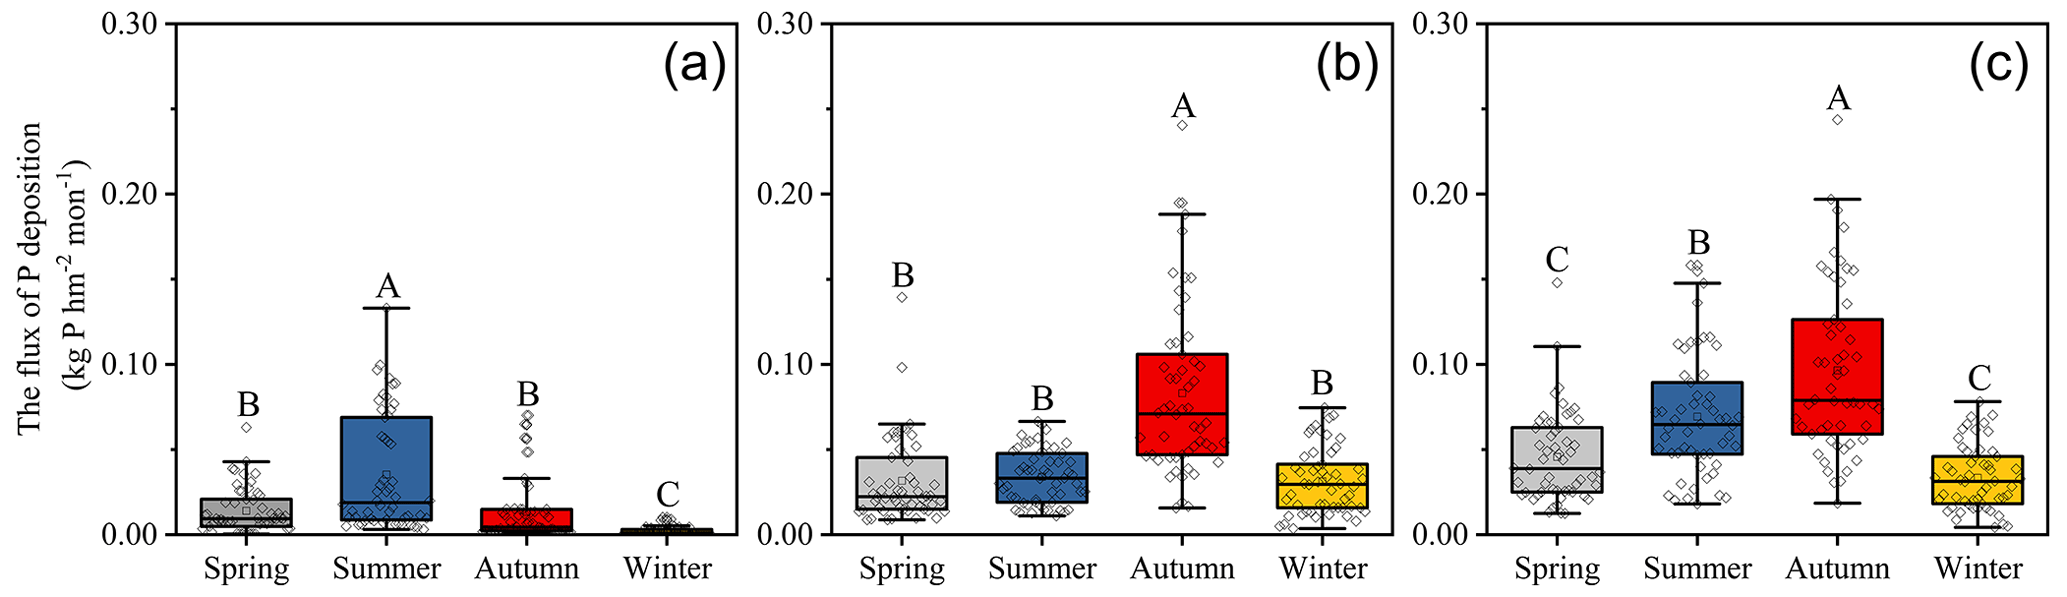
Figure 4Monthly phosphorus flux of wet (a), dry (b) and total (c) deposition in four seasons. Different capital letters indicate that the differences among seasons are significant (one-way ANOVA, p <0.05).
3.3 Spatial variation of annual P deposition among nine sites
The average atmospheric wet P deposition rates at the nine sites showed no significant spatial variations (Fig. 5a), whereas the dry P deposition and total P deposition were observed to have significant spatial variations across the study urban–rural transition (Fig. 5b, c) (P<0.05). Specifically, the annual fluxes of dry P deposition in CC, LY and QQ (0.76–0.84 kg hm−2 yr−1) were significantly higher than those in SS, YS and XB and YT, LJ and HY (0.32–0.49 kg P hm−2 yr−1) (P<0.05). The average rate of dry P deposition among the nine sites was 0.54±0.18 kg P hm−2 yr−1. In addition, the annual fluxes of total P deposition decreased in the order CC, LY and QQ (0.97–1.06 kg P hm−2 yr−1) > SS, YS and XB (0.61–0.71 kg P hm−2 yr−1) > YT, LJ and HY (0.50–0.55 kg P hm−2 yr−1).

Figure 5Average monthly phosphorus wet (a), dry (b) and total (c) deposition fluxes at nine sites. Each box contains 24 months of P deposition fluxes. Different capital letters suggest that the difference in the fluxes among the nine sites is significant (p<0.05) (n=24 for each box). In addition, different colored columns represent different areas.
3.4 Relationship between land-use types and P deposition
To better understand the potential sources of P deposition, the correlations between monthly fluxes of P deposition and areas of land-use types were analyzed (Fig. 6). The monthly atmospheric wet P deposition fluxes were significantly positively correlated with the agro-facility areas in the five months (P<0.05) (Fig. 6a), and the monthly dry P deposition and total P deposition fluxes were significantly positively correlated with the agro-facility areas for almost the whole year (P<0.05) (Fig. 6b, c). Meanwhile, the annual fluxes of atmospheric total, dry and wet P deposition all were strongly positively correlated with the agro-facility areas (R=0.765, R=0.898 and R=0.903, P<0.05).
In addition, dry P deposition and total P deposition both had a positive correlation with the town and paddy field during almost the whole year; the town was significant in February and October, and the paddy field was significant in almost the whole year (P<0.05). Conversely, there was a negative correlation with country roads and forests during the whole year, with country roads being significant in November (P<0.05).
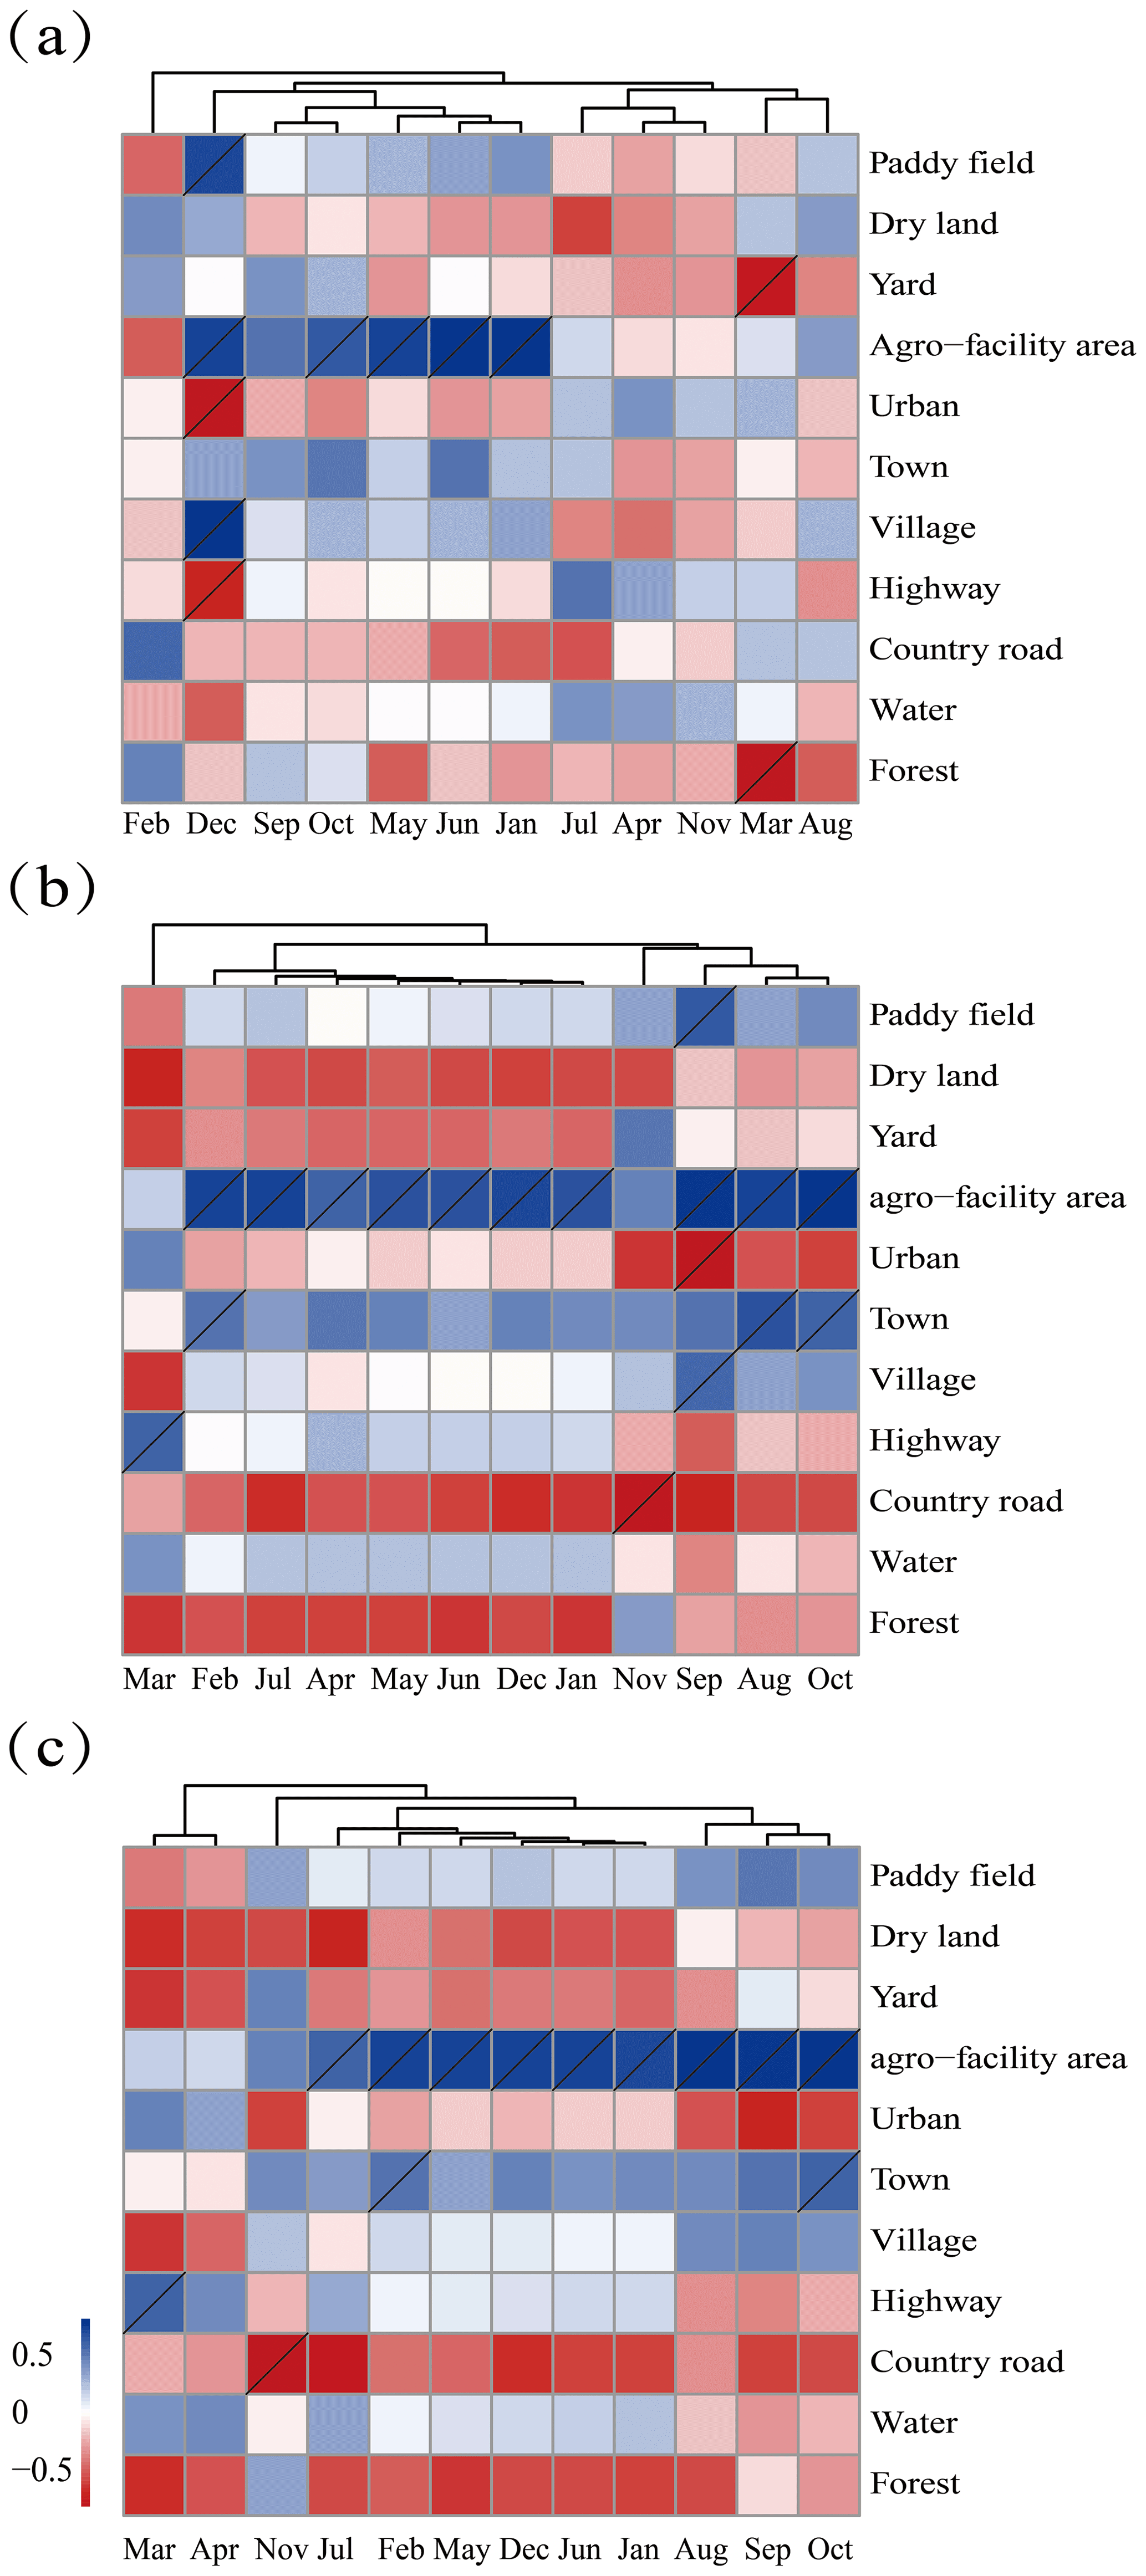
Figure 6Pearson's correlation between monthly wet (a), dry (b) and total (c) fluxes and areas of different land-use types. Gray slash indicates significance at p<0.05.
4.1 Temporal variability of P deposition
More atmospheric P was deposited through wet deposition in summer than in other seasons (P<0.05). This phenomenon occurred due to the fluxes of atmospheric wet P deposition having a significantly positive correlation with monthly precipitation and temperature (Table S2). In this study area, summer accounted for approximately 51.46 % of the annual precipitation, which would allow more P-containing aerosols to be scavenged in and below clouds by precipitation and deposited on the terrestrial surface, resulting in higher fluxes in summer as well. Similarly, precipitation did have a positive impact on the monthly P deposition fluxes in previous studies (Tsukuda et al., 2005; Zhu et al., 2016; Wang et al., 2018). In addition, the temperature in summer was approximately 7.44–17.19∘C higher than that in other seasons. High temperatures can decrease the stability of the atmosphere and increase the activity of P-containing aerosols, which can enlarge their contact area with the atmosphere. This causes more aerosols containing P to be adsorbed and dissolved in the air (Tipping et al., 2014).
The fluxes of dry P deposition showed varied seasonal variation with those of wet P deposition and had the highest values in autumn than in other seasons (P<0.05) (Fig. 5). In theory, the seasonal variation of dry deposition is mainly controlled by ambient concentration and dry-deposition velocity. On the one hand, high ambient concentrations could be caused by high ambient emissions. In this study, the application of P fertilizer was conducted in autumn, causing higher ambient emissions than in other seasons. On the other hand, dry-deposition velocity was more affected by meteorological factors. Previous studies found that P-containing aerosols were the main components of dry P deposition collected by the alternative surface method and were changed with relative humidity (Qi et al., 2005). In this study, the fluxes of dry P deposition were strongly correlated with relative humidity (Table S2). An increase in relative humidity would lead to an enlargement in particle size and an increase in hygroscopic growth. This growth can significantly increase the particle deposition rate (Mohan, 2016). There are two reasons as follows: on the one hand, P-containing aerosol contact areas with water droplets will be enlarged, which will cause more aerosols to deposit. On the other hand, aerosols can absorb more moisture and increase particle size (hygroscopic growth), making them deposit quickly. Overall, wet deposition was affected by precipitation and temperature. In contrast, dry deposition was influenced by relative humidity and ambient concentration.
4.2 Analysis of deposition composition characteristics
Several studies divided P deposition into dry and wet deposition separately for monitoring, and the results demonstrated that the percentage of dry deposition was in the range of 50–85 % (Hou et al., 2012; Tipping et al., 2014). Similarly, this phenomenon was observed in this study. To explain this, first, only a fraction of P-containing aerosols was water-soluble (Herut et al., 2005; Nenes et al., 2011), causing it to likely be deposited as dry deposition. Second, it was observed that the months dominated by wet deposition all followed higher precipitation during the whole year. As discussed earlier, precipitation accelerates wet deposition. Third, the composition characteristics indicated various P sources. The fine dust from desert and soil is more likely to be transported over a long distance and deposited as wet deposition. However, it originated from intensively farmed, especially arable, soil fertilized with P and was more likely to be deposited as dry deposits (Mahowald et al., 2008; Das et al., 2011; Gross et al., 2016). The factor is that the fraction of soil lost as dust is small and likely to be enriched, thus increasing the content of P aerosols and increasing their size (Field et al., 2010). In general, the contribution of wet and dry deposition to the total deposition was impacted by the solubility of P depositions and meteorological factors.
4.3 Spatial variation of annual P deposition fluxes
Due to the varied mechanisms of wet- and dry-deposition processes, the fluxes of atmospheric wet and dry P deposition showed distinct spatial variation trends (Fig. 5). The annual atmospheric P dry deposition in CC, LY and QQ (0.76–0.84 kg hm−2 yr−1) was significantly higher than in other areas (0.32–0.49 kg hm−2 yr−1) (P<0.05), but the wet P deposition did not show significant spatial variation.
In general, dry P deposition is dominated by local sources, while a considerable proportion of wet P deposition comes from long-distance P-particle sources (Mahowald et al., 2008; Das et al., 2011; Gross et al., 2016). In this study, more local P aerosols were emitted into the atmosphere in CC, LY and QQ for high-intensity agricultural production, such as large-scale livestock and poultry breeding. These local P aerosols were deposited as local resources, causing a higher value of dry P deposition. Hence, to further clarify the influencing factors from multiple land-use types on P deposition, the analysis of the correlation between land-use types and P deposition was carried out as follows in this study.
Moreover, the annual total P deposition fluxes in CC, LY and QQ (0.97–1.06 kg hm−2 yr−1) were significantly higher than those in YT, LJ, and HY (0.50–0.55 kg hm−2 yr−1) (Fig. 4c; P<0.05). They were also higher than a large number of fluxes on a global scale, such as in Chinese forests (0.69 kg P hm−2 yr−1; Du et al., 2016) and a French tropical forest (0.62 kg P hm−2 yr−1; Van Langenhove et al., 2020). Additionally, here, compared with the global total P deposition rates compiled from 396 published observations during the period 1959 to 2020, including in North America (0.26 kg hm−2 yr−1), Europe (0.29 kg hm−2 yr−1), Asia (0.41 kg hm−2 yr−1), Oceania (0.19 kg hm−2 yr−1), South America (0.40 kg P hm−2 yr−1) and Africa (0.58 kg P hm−2 yr−1) (Pan et al., 2021), the fluxes in CC, LY and QQ in this study showed much higher values. To explain this phenomenon, first, the level of economic development and natural environmental conditions in different regions varied between regions. For instance, in developed regions, substantial anthropogenic P has been emitted into the atmosphere and transported to surrounding areas with the application of P fertilizer on farmlands and the combustion of fuels (Wang et al., 2015; Du et al., 2016). Additionally, this study was compared with the prior findings that were all carried out under multiple land-use types. On the one hand, lands can also be noted that nearly all measurements above refer to natural or seminatural locations. On the other hand, the land-use types at the nine sites in this study were different from each other. A previous study revealed that the sites characterized by land use in an agro-facility contributed more P deposition (3.22 kg hm−2 yr−1), which was higher than that in rural, urban and forest areas (0.20–1.07 kg hm−2 yr−1; Song et al., 2022). Furthermore, the collecting methods utilized for P deposition can also be used to explain the causes of the discrepancies between the experimental results of various studies. In this study, wet- deposition and dry-deposition samples were collected separately, while most reported measurements were based on bulk deposition, which generally ignored dry deposition (Helliwell et al., 1998; Tipping et al., 2014). Additionally, the actual rates could be underestimated with a decrease in collection frequency due to the evaporation of water that would remove the P deposition, which would also be on the wall of the cup. Therefore, differences in the method of sample collection could cause variability among the regions discussed above.
In general, several factors could contribute to the spatial variation of P deposition. As discussed before, the flux of P deposition in this study area is at a high level. Excessive P deposition poses a certain threat to the ecosystem (Wang et al., 2015). Therefore, the potential risk of P deposition in this study area cannot be ignored. More attention needs to be paid to effectively managing P inputs and cycles.
4.4 Relationship between land use and phosphorus deposition
Lands show a tradeoff effect on atmospheric P deposition. On the one hand, agro-facility areas, towns and highways were positively correlated with P deposition, suggesting that those land-use types might be a source for P deposition. On the other hand, there was a negative correlation between country road, forest and P deposition, indicating that they may be sink land-use types for P deposition.
This study showed that P deposition had a strong positive correlation with the agro-facility (Fig. 6). In this study, the area of agro-facility around CC, LY and QQ was approximately 4.5 times larger than the other sites (Table 3). Commonly, agro-facility areas include land designated for livestock and poultry breeding, fertilizer plants, greenhouses with vegetable production and aquaculture (current land-use classification, GB/T 21010–2007). Meanwhile, the survey of this study found that livestock and poultry breeding and fertilizer industries dominated the land use of agro-facility, and there were few greenhouses due to the lack of light. Livestock production and manure generation could be contributors to P deposition (Ma et al., 2011; Tong et al., 2017; Zhang et al., 2019). Many previous studies reported the relationship between P deposition and agricultural production. For instance, P deposition originated from intensive agricultural management and extraction of rock phosphate in Sichuan suburban areas (Song et al., 2022). In areas with a high density of livestock husbandry in Germany, P deposition originated from agricultural emissions from livestock farming (Tipping et al., 2014). Furthermore, emissions from the phosphate fertilizer industry will cause high phosphorus concentrations in the air layer and increase total P deposition fluxes (Rodríguez et al., 2011). This study demonstrated that the land use of agro-facility acts as a main source affecting P deposition almost year-round.
In addition, the monthly fluxes of atmospheric dry P deposition had a significantly positive correlation with the town areas in February, August and October (Fig. 6b, c; P<0.05) during the Spring Festival and National Day. During these important festivals, custom fireworks could induce more harmful gases and dust, thereby increasing combustion emissions of dissolved P, dust emissions and organic P contained in bioaerosol emissions entering the atmosphere (Kanakidou et al., 2020). In addition, monthly dry P deposition and total P deposition fluxes had a positive correlation with paddy field areas during almost the whole year and were significant in the fertilizer period (September, P<0.05). This phenomenon is mainly caused by agricultural phosphorus emissions to a certain extent. Agricultural activities have intensely disturbed paddy field disturbances (Anderson and Downing, 2006). P deposition may originate from local agricultural sources (Tipping et al., 2014). A previous study reported that P deposition increased after P fertilizer application (Gao et al., 2009).
Notably, monthly fluxes of dry P deposition and total P deposition both had a negative correlation with forest and country roads (Fig. 6b, c). Firstly, a negative correlation indicates lower levels of P sources for P deposition in road and forest than in other land use such as agro-facility and agricultural areas. Secondly, it is well known that forests can absorb harmful gas, aerosols and dust particles, including P-containing aerosols, which is attributed to the porous sponge-like underlying surface, high productivity and strong microbial activity (Oladosu et al., 2017; Wang et al., 2017; Zhai et al., 2019). However, forest canopies could elevate P deposition by trapping atmospheric P in the form of dust and particulates (Zhou et al., 2018). Therefore, in this study, a negative correlation indicated that canopy P absorption was greater than the trapping of atmospheric P (Parron et al., 2011). Above all, the sink land use denotes a lower level of P sources and a higher level of P sinks than other land use. Due to similar reasons, paved country roads without hardening showed a similar correlation with P deposition.
In general, land use plays a vital role in P deposition. It was suggested that agro-facility, town and paddy fields were source land types, while forest and country roads were sink land types for P deposition. Furthermore, the key land use for P deposition is the agro-facility in a typical urban–rural transition.
4.5 Management practice of regional P
The need for region P deposition control will increase in the future, with the control of N emissions and deposition. The results of this study indicate a range of feasible regional P management measures. Adjusting the land-use structure is the first step, ranging from increasing areas of forests to controlling the scale of aquaculture and livestock farming. The next step is to increase the use of ecological materials and reduce road hardening in the process of road construction. Third, to manage fertilization effectively, more attention should be given to four major fertilization factors (the 4Rs): right rate, right source, right placement and right timing. Last, a policy of prohibition and restriction on fireworks should be implemented (Hochmuth et al., 2022).
From the perspective of temporal and spatial analysis, a study was carried out to understand the patterns of atmospheric P deposition in this region. The first major finding is that P deposition showed seasonal variability under the influence of meteorological factors. Wet deposition was mainly impacted by precipitation and temperature, with significantly higher fluxes in summer than in other seasons (P<0.05), while dry deposition was affected by relative humidity and ambient concentration and was significantly higher in autumn (P<0.05). Dry deposition dominated the total P deposition. Furthermore, the monthly fluxes of dry P deposition present a significant spatial variation under different land-use types (P<0.05) because intensive agricultural-related sites (CC, LY and QQ) could emit more particulate P depositions, which would result in more dry depositions. Based on correlation analysis, it was found that source land use might be agro-facility, town and paddy field areas, while sink land use, which denotes a lower level of P sources and a higher level of P sinks than others, might be forest and country road areas. Thus, to effectively control regional P, the source–sink relationship between P deposition and land-use types should be considered.
The data are available at https://doi.org/10.6084/m9.figshare.21571776.v1 (Deng and Chen, 2022). All other data are available on request from the corresponding author (Ouping Deng, ouping@sicau.edu.cn).
The supplement related to this article is available online at: https://doi.org/10.5194/acp-22-14813-2022-supplement.
OD, YC, JL, TL and CZ designed the research and collected data. JR, RH, LL and DO contributed visualization and validation. RH, XG and WZ carried out analysis and editing. CZ, YH, YX, LW and LL curated the data. The paper was written and reviewed by OD, YC and JL with contributions from all co-authors.
The contact author has declared that none of the authors has any competing interests.
Publisher’s note: Copernicus Publications remains neutral with regard to jurisdictional claims in published maps and institutional affiliations.
We thank the researchers for field sampling. We appreciate the meteorological data from the Chongzhou Meteorological Bureau, Sichuan Province, China. We also appreciate the land-use data (2016) provided by the Center of Land Acquisition and Consolidation in Sichuan Province.
This research has been supported by the Department of Science and Technology of Sichuan Province (grant nos. 2020YFH0163 and 2021YFS0277) and the National Natural Science Foundation of China (grant nos. 42007212 and 42107247).
This paper was edited by Leiming Zhang and reviewed by three anonymous referees.
Anderson, K. A. and Downing, J. A.: Dry and wet atmospheric deposition of nitrogen, phosphorus, and silicon in an agricultural region, Water Air Soil Pollut., 176, 351–374, https://doi.org/10.1016/j.envpol.2022.119298, 2006.
Camarero, L. and Catalan, J.: Atmospheric phosphorus deposition may cause lakes to revert from phosphorus limitation back to nitrogen limitation, Nat. Commun., 3, 1118, https://doi.org/10.1038/ncomms2125, 2012.
Chiwa, M.: Ten-year determination of atmospheric phosphorus deposition at three forested sites in Japan, Atmos. Environ., 223, 117247, https://doi.org/10.1016/j.atmosenv.2019.117247, 2020.
Cleveland, C. C., Houlton, B. Z., Smith, W. K., Marklein, A. R., Reed, S. C., Parton, W., Del Grosso, S. J., and Running, S. W.: Patterns of new versus recycled primary production in the terrestrial biosphere, P. Natl. Acad. Sci., 110, 12733–12737, https://doi.org/10.1073/pnas.1302768110, 2013.
Das, R., Lawrence, D., D'Odorico, P., and DeLonge, M.: Impact of land-use change on atmospheric P inputs in a tropical dry forest, J. Geophys. Res., 116, G01027, https://doi.org/10.1029/2010JG001403, 2011.
Deng, O. and Chen, Y.: Fluxes, patterns and sources of phosphorus deposition in an urban–rural transition region in Southwest China, Figshare [data set], https://doi.org/10.6084/m9.figshare.21571776.v1, 2022.
Deng, O., Zhang, S., Deng, L., Lan, T., Luo, L., Gao, X., and Zhou, W.: Atmospheric dry nitrogen deposition and its relationship with local land use in a high nitrogen deposition region, Atmos. Environ., 203, 114–120, https://doi.org/10.1016/j.atmosenv.2018.12.037, 2019.
Du, E., de Vries, W., Han, W., Liu, X., Yan, Z., and Jiang, Y.: Imbalanced phosphorus and nitrogen deposition in China's forests, Atmos. Chem. Phys., 16, 8571–8579, https://doi.org/10.5194/acp-16-8571-2016, 2016.
Du, E., Terrer, C., Pellegrini, A. F. A., Ahlstrom, A., van Lissa, C. J., Zhao, X., Xia, N., Wu, X., and Jackson, R. B.: Global patterns of terrestrial nitrogen and phosphorus limitation, Nat. Geosci., 13, 221–229, https://doi.org/10.1038/s41561-019-0530-4, 2020.
Elser, J. J., Bracken, M. E. S., Cleland, E. E., Gruner, D. S., Harpole, W. S., Hillebrand, H., Ngai, J. T., Seabloom, E. W., Shurin, J. B., and Smith, J. E.: Global analysis of nitrogen and phosphorus limitation of primary producers in freshwater, marine, and terrestrial ecosystems, Ecol. Lett., 10, 1135–1142, https://doi.org/10.1111/j.1461-0248.2007.01113.x, 2007.
Field, J. P., Belnap, J., Breshears, D. D., Neff, J. C., Okin, G. S., Whicker, J. J., Painter, T. H., Ravi, S., Reheis, M. C., and Reynolds, R. L.: The ecology of dust, Front. Ecol. Environ., 8, 423–430, https://doi.org/10.1890/090050, 2010.
Gao, Y., Zhu, B., Zhou, P., Tang, J., Wang, T., and Miao, C.: Effects of vegetation cover on phosphorus loss from a hillslope cropland of purple soil under simulated rainfall: a case study in China, Nutr. Cycl. Agroecosyst., 85, 263–273, https://doi.org/10.1007/s10705-009-9265-8, 2009.
Grantz, D. A., Garner, J. H. B., and Johnson, D. W.: Ecological effects of particulate matter, Environ. Int., 29, 213–239, https://doi.org/10.1016/S0160-4120(02)00181-2, 2003.
Gross, A., Turner, B. L., Goren, T., Berry, A., and Angert, A.: Tracing the sources of atmospheric phosphorus deposition to a tropical rain forest in Panama using stable oxygen isotopes, Environ. Sci. Technol., 50, 1147–1156, https://doi.org/10.1021/acs.est.5b04936, 2016.
Helliwell, R. C., Soulsby, C., Ferrier, R. C., Jenkins, A., and Harriman, R.: Influence of snow on the hydrology and hydrochemistry of the Allt a' Mharcaidh, Cairngorm mountains, Scotland, Sci. Total Environ., 217, 59–70, https://doi.org/10.1016/S0048-9697(98)00165-X, 1998.
Herut, B., Zohary, T., Krom, M. D., Mantoura, R. F. C., Pitta, P., Psarra, S., Rassoulzadegan, F., Tanaka, T., and Thingstad, T. F.: Response of east Mediterranean surface water to Saharan dust: On-board microcosm experiment and field observations, Deep-Sea Res. Pt. II, 52, 3024–3040, https://doi.org/10.1016/j.dsr2.2005.09.003, 2005.
Hochmuth, G., Rao, M., and Hanlon, A. E.: The four Rs of fertilizer management, UF/IFAS Extension, 1–4, https://edis.ifas.ufl.edu/publication/SS624, last access: 4 November 2022.
Hou, E., Luo, Y., Kuang, Y., Chen, C., Lu, X., Jiang, L., Luo, X., and Wen, D.: Global meta-analysis shows pervasive phosphorus limitation of aboveground plant production in natural terrestrial ecosystems, Nat. Commun., 11, 637, https://doi.org/10.1038/s41467-020-14492-w, 2020.
Hou, P., Ren, Y., Zhang, Q., Lu, F., Ouyang, Z., and Wang, X.: Nitrogen and phosphorous in atmospheric deposition and roof runoff, Environ. Sci. Ecol., 21, 1621–1627, 2012.
Kanakidou, M., Myriokefalitakis, S., and Tsagkaraki, M.: Atmospheric inputs of nutrients to the Mediterranean Sea, Deep-Sea Res. Pt. II, 171, 104606, https://doi.org/10.1016/j.dsr2.2019.06.014, 2020.
Mahowald, N., Jickell, T. D., Baker, A. R., Artaxo, P., Benitez-Nelson, C. R., Bergametti, G., Bond, T. C., Chen, Y., Cohen, D. D., Herut, B., Kubilay, N., Losno, R., Luo, C., Maenhaut, W., McGee, K. A., Okin, G. S., Siefert, R. L., and Tsukuda, S.: Global distribution of atmospheric phosphorus sources, concentrations and deposition rates, and anthropogenic impacts, Global Biogeochem. Cy., 22, GB4026, https://doi.org/10.1029/2008GB003240, 2008.
Mohan, S. M.: An overview of particulate dry deposition: measuring methods, deposition velocity and controlling factors, Int. J. Environ. Sci. Technol., 13, 387–402, https://doi.org/10.1007/s13762-015-0898-7, 2016.
Nenes, A., Krom, M. D., Mihalopoulos, N., Van Cappellen, P., Shi, Z., Bougiatioti, A., Zarmpas, P., and Herut, B.: Atmospheric acidification of mineral aerosols: a source of bioavailable phosphorus for the oceans, Atmos. Chem. Phys., 11, 6265–6272, https://doi.org/10.5194/acp-11-6265-2011, 2011.
Oladosu, N. O., Abayomi, A. A., Olayinka, K. O., and Alo, B. I.: Wet nitrogen and phosphorus deposition in the eutrophication of the Lagos Lagoon, Nigeria, Environ. Sci. Pollut. Res., 24, 8645–8657, https://doi.org/10.1007/s11356-017-8479-6, 2017.
Pan, Y., Liu, B., Gao, J., Liu, J., Tian, S., and Du, E.: Enhanced atmospheric phosphorus deposition in Asia and Europe in the past two decades, Atmos. Ocean. Sci. Lett., 14, 100051, https://doi.org/10.1016/j.aosl.2021.100051, 2021.
Parron, L. M., Cunha Bustamante, M. M., and Markewitz, D.: Fluxes of nitrogen and phosphorus in a gallery forest in the Cerrado of central Brazil, Biogeochemistry, 10, 89–104, https://doi.org/10.1007/s10533-010-9537-z, 2011.
Peñuelas, J., Poulter, B., Sardans, J., Ciais, P., Van der Velde, M., Bopp, L., Boucher, O., Godderis, Y., Hinsinger, P., Llusia, J. Nardin, E., Vicca, S., Obersteiner, M., and Janssens, I. A.: Human-induced nitrogen-phosphorus imbalances alter natural and managed ecosystems across the globe, Nat. Commun., 4, 2934, https://doi.org/10.1038/ncomms3934, 2013.
Peñuelas, J., Sardans, J., Rivas-ubach, A., and Janssens, I. A.: The human-induced imbalance between C, N, and P in Earth's life system, Glob. Change Biol., 18, 3–6, https://doi.org/10.1111/j.1365-2486.2011.02568.x, 2011.
Pollman, C. D., Landing, W. M., and Perry Jr., J. J.: Wet deposition of phosphorus in Florida, Atmos. Environ., 36, 2309–2318, https://doi.org/10.1016/S1352-2310(02)00199-1, 2002.
Qi, J., Li, P., Li, X., Feng, L., and Zhang, M.: Estimation of dry deposition fluxes of particulate species to the water surface in the Qingdao area, using a model and surrogate surfaces, Atmos. Environ., 39, 2081–2088, https://doi.org/10.1016/j.atmosenv.2004.12.017, 2005.
Rodríguez, S., Alastuey, A., Alonso-Pérez, S., Querol, X., Cuevas, E., Abreu-Afonso, J., Viana, M., Pérez, N., Pandolfi, M., and Rosa, J. D. L.: Transport of desert dust mixed with north african industrial pollutants in the subtropical Saharan Air Layer, Atmos. Chem. Phys., 11, 6663–6685, https://doi.org/10.5194/acp-11-6663-2011, 2011.
Song, L., Kuang, F., Zhou, M., Zhu, B., and Skiba, U.: Bulk phosphorous deposition at four typical land use sites in Southwest China, Chemosphere, 288, 132424, https://doi.org/10.1016/j.chemosphere.2021.132424, 2022.
Tipping, E., Benham, S., Boyle, J. F., Crow, P., Davies, J., Fischer, U., Guyatt, H., Helliwell, R., Jackson-Blake, L., Lawlor, A. J., Monteith, D. T., Rowe, E. C., and Toberman, H.: Atmospheric deposition of phosphorus to land and freshwater, Environ. Sci., 16, 1608–1617, https://doi.org/10.1039/C3EM00641G, 2014.
Tong, Y., Zhang, W., Wang, X., Couture, R. M., Larssen, T., Zhao, Y., Li, J., Liang, H., Liu, X., Bu, X., He, W., Zhang, Q., and Lin, Y.: Decline in Chinese lake phosphorus concentration accompanied by shift in sources since 2006, Nat. Geosci., 10, 507–511, https://doi.org/10.1038/ngeo2967, 2017.
Tsukuda, S., Sugiyama, M., Harita, Y., and Nishimura, K.: Atmospheric bulk deposition of soluble phosphorus in Ashiu Experimental Forest, Central Japan: source apportionment and sample contamination problem, Atmos. Environ., 39, 823–836, https://doi.org/10.1016/j.atmosenv.2004.10.028, 2005.
Van Langenhove, L., Verryckt, L. T., Bréchet, L., Courtois, E. A., Stahl, C., Hofhansl, F., Bauters, M., Sardans, J., Boeckx, P., Fransen, E., Peñuelas, J., and Janssens, I. A.: Atmospheric deposition of elements and its relevance for nutrient budgets of tropical forests, Biogeochemistry, 149, 175–193, https://doi.org/10.1007/s10533-020-00673-8, 2020.
Vitousek, P. M., Porder, S., Houlton, B. Z., and Chadwick, O. A.: Terrestrial phosphorus limitation: mechanisms, implications, and nitrogen–phosphorus interactions, Ecol. Appl., 20, 5–15, https://doi.org/10.1890/08-0127.1, 2010.
Wang, H., Yang, F., Shi, G., Tian, M., Zhang, L, Zhang, L, and Fu, C.: Ambient concentration and dry deposition of major inorganic nitrogen species at two urban sites in Sichuan Basin, China, Environ. Pollut., 219, 235–244, https://doi.org/10.1016/j.envpol.2016.10.016, 2016.
Wang, R., Balkanski, Y., Boucher, O., Ciais, P., Peñuelas, J., and Tao, S.: Significant contribution of combustion-related emissions to the atmospheric phosphorus budget, Nat. Geosci., 8, 48–54, https://doi.org/10.1038/ngeo2324, 2015.
Wang, W., Liu, X., Xu, J., Dore, A. J., and Xu, W.: Imbalanced nitrogen and phosphorus deposition in the urban and forest environments in southeast Tibet, Atmos. Pollut. Res., 9, 774–782, https://doi.org/10.1016/j.apr.2018.02.002, 2018.
Winter, J. G., Dillon, P. J., Futter, M. N., Nicholls, K. H., Scheider, W. A., and Scott, L. D.: Total Phosphorus Budgets and Nitrogen Loads: Lake Simcoe, Ontario (1990 to 1998), J. Gt. Lakes Res., 28, 301–314, https://doi.org/10.1016/S0380-1330(02)70586-8, 2002.
Ma, X., Li, Y., Zhang, M., Zheng, F., and Du, S.: Assessment and analysis of non-point source nitrogen and phosphorus loads in the Three Gorges Reservoir Area of Hubei Province, China, Sci. Total Environ., 412/413, 154–161, https://doi.org/10.1016/j.scitotenv.2011.09.034, 2011.
Yang, F., Tan, J., Shi, Z., Cai, Y., He, K., Ma, Y., Duan, F., Okuda, T., Tanaka, S., and Chen, G.: Five-year record of atmospheric precipitation chemistry in urban Beijing, China, Atmos. Chem. Phys., 12, 2025–2035, https://doi.org/10.5194/acp-12-2025-2012, 2012.
Zhai, J., Cong, L., Yan, G., Wu, Y., Liu, J., Wang, Y., Ma, W., and Zhang, Z.: Dry Deposition of Particulate Matter and Ions in Forest at Different Heights, Int. J. Environ. Res., 13, 117–130, https://doi.org/10.1007/s41742-018-0158-z, 2019.
Zhang, X., Lin, C., Zhou, X., Lei, K., Guo, B., Gao, Y., Lu, S., Liu, X., and He, M.:. Concentrations, fluxes, and potential sources of nitrogen and phosphorus species in atmospheric wet deposition of the Lake Qinghai Watershed, China, Sci. Total Environ., 682, 523–531, https://doi.org/10.1016/j.scitotenv.2019.05.224, 2019
Zhou, K., Lu, X., Mori, T., Mao, Q., Wang, C., Zheng, M., Mo, H., Hou, E., and Mo, J.: Effects of long-term nitrogen deposition on phosphorus leaching dynamics in a mature tropical forest, Biogeochemistry, 138, 215–224, https://doi.org/10.1007/s10533-018-0442-1, 2018.
Zhu, J., Wang, Q., He, N., Smith, M.D., Elser, J.J., Du, J., Yuan, G., Yu, G., and Yu, Q.: Imbalanced atmospheric nitrogen and phosphorus depositions in China: Implications for nutrient limitation: Imbalanced N and P Depositions in China, J. Geophys. Res.-Biogeo., 121, 1605–1616, https://doi.org/10.1002/2016JG003393, 2016.