the Creative Commons Attribution 4.0 License.
the Creative Commons Attribution 4.0 License.
 | 18 Nov 2022
Measurement report: Contrasting elevation-dependent light absorption by black and brown carbon: lessons from in situ measurements from the highly polluted Sichuan Basin to the pristine Tibetan Plateau
Suping Zhao
Shaofeng Qi
Ye Yu
Shichang Kang
Longxiang Dong
Jinbei Chen
Daiying Yin
Scientific knowledge about light absorption by aerosols is extremely limited at the eastern slope of the Tibetan Plateau (ESTP). We conducted the first aerosol field experiment at six sites (Chengdu, Sanbacun, Wenchuan, Lixian, Maerkang, Hongyuan) along the ESTP, ranging in elevation from 500 to 3500 m. The fraction of light absorption by brown carbon (BrC) to total carbon increases from 20 % to 50 % with altitude, and the mass absorption efficiency (MAE) of BrC over the Tibetan Plateau (TP) is 2–3 times higher than that inside the Sichuan Basin (SCB), especially in winter. In contrast, the MAE of elemental carbon (EC) in winter decreases with altitude. The contrasting variation of EC and BrC MAE with altitude is mainly attributed to source differences between the TP and SCB. Emissions from the more urban sources (motor vehicles, industries, etc.) inside the SCB fail to be transported to the TP due to the stable air in winter inside the basin, which is also favourable for aerosol ageing to enhance absorption efficiency. The radiative forcing of BrC relative to EC varies from 0.10 to 0.42 as altitude increases with the higher organic carbon (OC) to EC ratio over the TP than SCB. Thus, the reason for the enhanced relative BrC to EC radiative forcing from polluted SCB to pristine TP is that the BrC concentration decreases more slowly than the EC concentration with altitude. This study contributes to the understanding of the difference in light absorption by EC and BrC with altitude, from polluted lower-altitude basins to the pristine TP, and provides a data set for regional climate model validation.
- Article
(10838 KB) - Full-text XML
-
Supplement
(4166 KB) - BibTeX
- EndNote


Some in situ observations, available satellite data and model simulations indicate that a great surface warming trend over time occurs at high altitudes in mountainous regions worldwide (Gao et al., 2018; Guo et al., 2019; Mountain Research Initiative EDW Working Group, 2015; Palazzi et al., 2017; Pepin et al., 2019; Rangwala and Miller, 2012; You et al., 2020). Rangwala and Miller (2012) reviewed elevation-dependent warming (EDW) and its possible causes over four high mountain regions: the Swiss Alps, Colorado Rocky Mountains, Tibetan Plateau (TP) and the tropical Andes. The available observations indicate that some mountain regions show much greater warming rates at seasonal scales than others. The mechanisms that can produce enhanced warming rates at high altitudes may be related to the differential sensitivities of surface warming to changes in climate drivers, such as snow and ice cover, clouds, atmospheric water vapour, aerosols, land use, and vegetation, at different elevations (Rangwala and Miller, 2012; You et al., 2020).
The TP, known as the “third pole”, is an ideal location to examine EDW and its mechanism (Guo et al., 2021). The warming rates (rising temperature per 10 years) over the TP were found to be the most notable in winter and autumn (Liu and Chen, 2000), especially for the central and eastern plateaus (Duan and Wu, 2006), which may be partly associated with human activities, such as more anthropogenic emissions in the sub-regions (Lu et al., 2010). The effect of carbonaceous aerosols on regional and even global climate is more uncertain because of their shorter life than long-lived aerosols, such as carbon dioxide and methane (Chung et al., 2012; Ramanathan and Carmichael, 2008). Absorbing aerosols (black carbon and dust) from local emissions or long-range transport heat the atmosphere in two ways (Tian et al., 2018). They absorb radiation and decrease the surface albedo when deposited on snow and ice (Kang et al., 2019; Lau et al., 2010; Xu et al., 2009). Ramanathan and Carmichael (2008) suggested that black carbon (BC) in the Himalayas, arising from anthropogenic activities in the Indo-Gangetic Plain (IGP), could account for half of the local warming during the past several decades. In addition to the well-known BC, the recent work by Wu et al. (2018) suggested that the light absorption efficiency (LAE) of brown carbon (BrC, a certain type of organic aerosol) in winter is 2–3 times higher than that in summer for the central TP. However, scientific knowledge of the optical properties of carbonaceous aerosols (elemental carbon (EC), BrC) over the eastern TP is extremely limited, and in situ aerosol measurements at varying altitudes from the heavily polluted Sichuan Basin to the relatively clean TP are crucial for better understanding their light absorption.
Previous in situ measurements have primarily focussed on the southern and northern slopes (Cong et al., 2015; Huang et al., 2007; Kang et al., 2020), whereas fewer observations have been conducted on the eastern slope of the TP (ESTP). The Sichuan Basin (SCB) – a highly polluted region in China caused by rapid economic development – is located on the eastern side of the TP (Zhao et al., 2018). The BrC LAE was strong inside the basin (Peng et al., 2020), especially in rural areas, because of increased biomass and coal burning impacts (Zhao et al., 2021). Our previous studies indicated that aerosols from the SCB are transported upslope along the ESTP and reach the eastern part of the TP by gradient in situ observations at the ESTP (Yin et al., 2020). The recent study by S. Zhao et al. (2020) suggested the strong light-absorbing BrC from biomass and coal burning inside the basin can be transported to the main part of the TP by the enhanced “heat pump” in response to rapid warming over the TP. The aerosols over the TP from local emissions and long-range transport from the surrounding highly polluted areas affect its weather, climate and water cycle (C. F. Zhao et al., 2020). Clouds and radiation are particularly sensitive to aerosols over pristine regions (Garrett and Zhao, 2006; Zhang et al., 2021). However, it is unclear whether the light absorption and radiative forcing of carbonaceous aerosols change from the highly polluted SCB to the cleaner TP.
In this study, we investigated the changes in the light absorption of carbonaceous aerosols (EC, BrC) and calculated the relative radiative forcing of BrC to EC aerosols from the SCB to TP in the four seasons. The sources and origins were also determined using statistical methods and the hybrid single-particle Lagrangian integrated trajectory (HYSPLIT) model. We aimed to understand the difference in EC or BrC light absorption between the highly polluted basin and the clean TP, to reveal the causes of the difference, and to generate a basic data set for the optimisation of regional climate modelling.
2.1 Observation sites and aerosol sampling
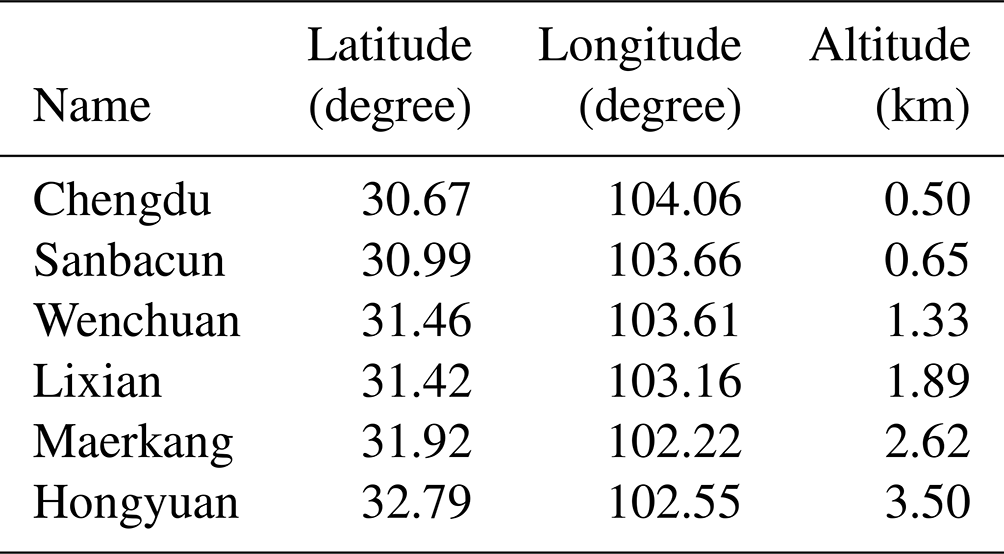
Compared to that of the coarser fraction of particulate matter (PM), the size of strong light-absorbing carbonaceous particles was primarily in the submicrometre range. Therefore, samples of particulate matter with an aerodynamic diameter smaller than 1 µm (PM1) were collected at six sites (Chengdu, Sanbacun, Wenchuan, Lixian, Maerkang, and Hongyuan) from the western SCB to the eastern part of the TP at elevations varying from 500 to 3500 m (Fig. 1, Table 1). Each sampling site was selected to represent the background level at the local scale as completely as possible without local emission impacts. A total of 1024 PM1 samples were collected from 21 December 2018 to 18 December 2019 on a day–night pattern using an aerosol sampler (LY-2034, Laoying Instrument Co., Ltd., China) at a flow rate of 100 L min−1. The samples were stored frozen in pre-baked glass jars until further analysis (Kawamura et al., 2010). Meteorological variables (temperature, relative humidity, wind speed and direction) were downloaded from the China Meteorological Data Service Center (http://data.cma.cn/, last access: 15 October 2022). PM1 samples were collected near meteorological observation sites; thus, the meteorological variables could represent the situation in the study region. MODIS active fire data (https://earthdata.nasa.gov/active-fire-data, last access: 23 June 2022) were used in this study.
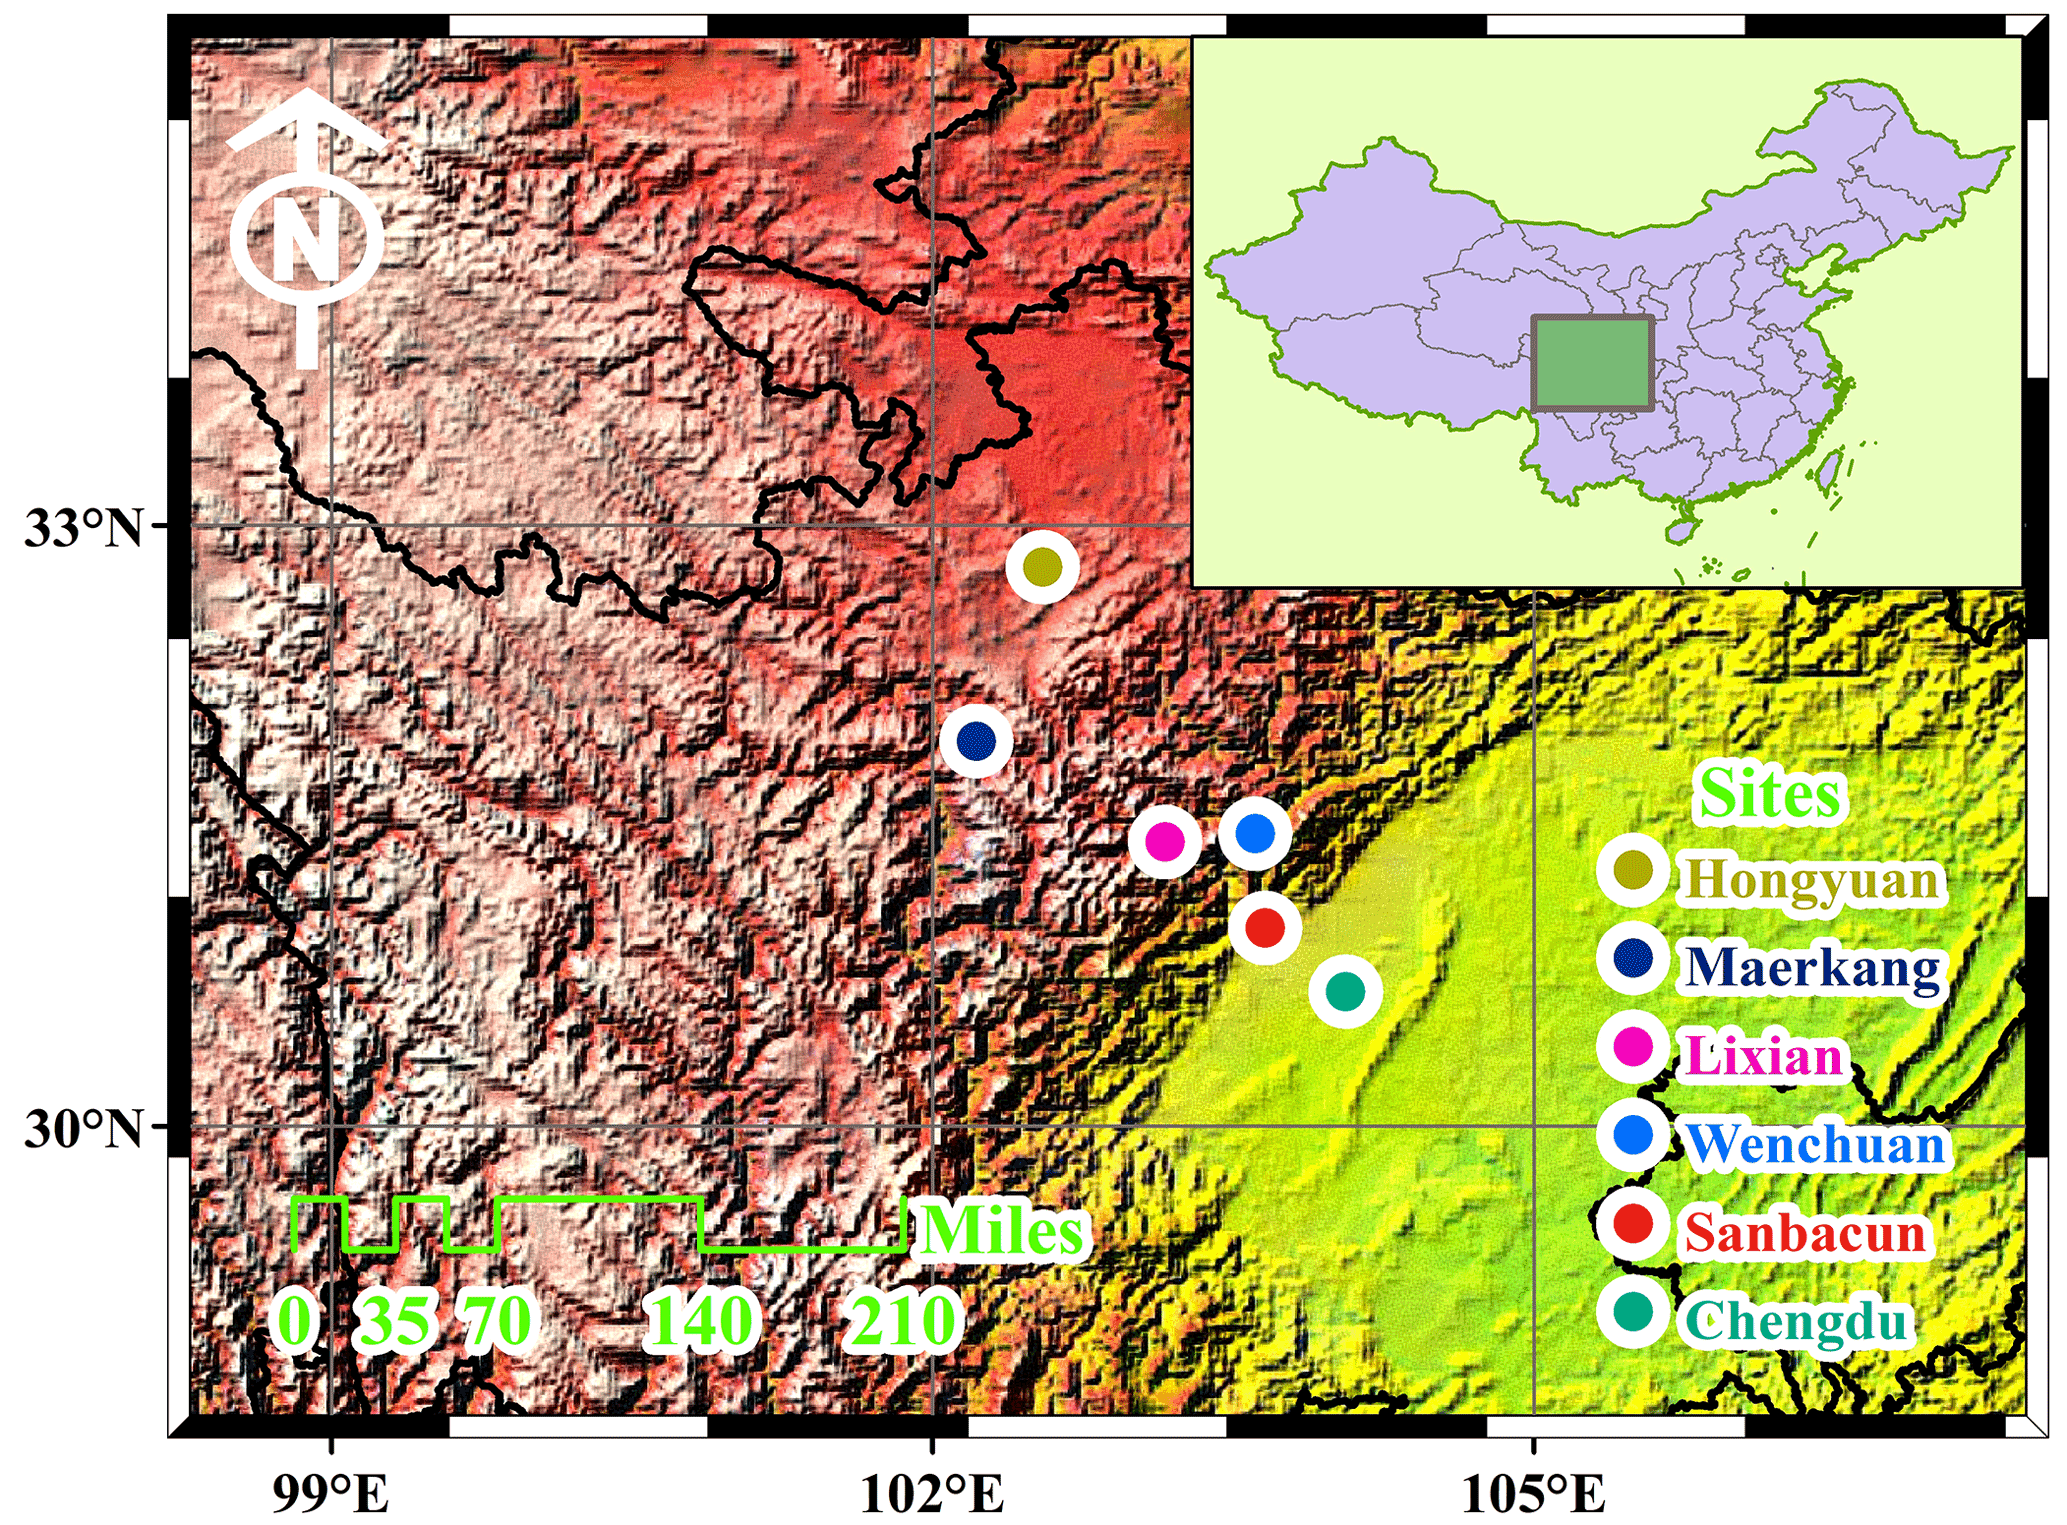
Figure 1Geographic location of the six in situ measurement sites (Chengdu, Sanbacun, Wenchuan, Lixian, Maerkang and Hongyuan) along the ESTP. The map is a pure reproduction of Google Maps with added marks for our study locations. Copyright © Google Maps. Publisher's note: Please note that the above figure contains disputed territories.
Table 1Summary of the measurement sites (name, location and altitude).
2.2 Chemical analysis
A quarter of each filter was used to analyse water-soluble inorganic ions (Na+, NH, K+, Ca2+, Mg2+, F−, Cl−, SO, and NO, and the ions were extracted and filtered using ultrapure water and a 0.45 µm pore syringe filter. The concentrations of cations and anions were measured using ion chromatography (DX-600 & ICS-2500, Dionex, USA). Carbonaceous aerosols, that is, organic carbon (OC) and EC, were analysed using a seven-wavelength carbon analyser (Model-2015, DRI, USA). The carbon analyser measured the OC and EC concentrations using the thermal/optical reflectance method (Chow et al., 2007). Briefly, was determined by progressively heating the subfilter. The OC fractions were determined by heating at 120 ∘C (OC1), 250 ∘C (OC2), 450 ∘C (OC3) and 550 ∘C (OC4) in a pure He atmosphere. The EC fractions were measured at 550 ∘C (EC1), 700 ∘C (EC2) and 800 ∘C (EC3) in an oxidising atmosphere of 2 % O2 and 98 % He. The carbon involved is oxidised to CO2 and then reduced to CH4 for detection by a flame ionisation detector. The pyrolysed organic carbon (OPC) was monitored when the reflected laser signal returned to its initial value after the introduction of O2 into the analysis atmosphere. OC was defined as the sum of OC1, OC2, OC3, OC4, and OPC, whereas EC was defined as EC1 + EC2 + EC3 − OPC. The EC and BrC were derived from the light absorption coefficient (babs) depending on the transmittance attenuation. For the seven-wavelength carbon analyser, the filter transmittance (FRλ, fraction of light transmitted through the filter) uncertainties ranged from 5 % to 18 %, with the best precision observed at 450 and 808 nm (Chen et al., 2015). This uncertainty is attributed to the quality of the laser and the sensitivity of the photodiode detector for different wavelengths.
The coefficient of variation (CV), in conjunction with correlation coefficients (r), can be used to characterise the intra-location variability of chemical species (Zhao et al., 2021). The CV was calculated using the following equation:
where xij and xik are the average concentrations of chemical component i at sites j and k, respectively, and p is the number of samples. CV values of zero and approaching one indicate no difference and absolute heterogeneity between the two sites for the specific chemical component, respectively. A CV lower than 0.2 is usually considered to represent a relatively similar spatial pattern (Wang et al., 2018).
2.3 Calculation of light absorption parameters
BrC light absorption increases sharply as the wavelength decreases, and thus it can be separated from the EC (Peng et al., 2020). The light absorption induced by carbonaceous aerosols (the sum of EC and BrC) on a quartz filter was estimated using an algorithm of transmittance attenuation (ATN):
where FTλ,a and FTλ,b represent the filter transmittance after and before thermal analysis for the specific wavelength (λ), respectively. Referring to the work by Chen et al. (2015), the relationship between ATN and the absorption optical depth (τa) can be given as follows:
This study uses the two coefficients (aλ and cλ) reported by Chen et al. (2015). The light absorption coefficients (babs) were calculated using the following equation:
where A and V are the filter area and the sampling volume, respectively. The total babs can be separated into EC and BrC using a simplified two-component model (Chen et al., 2015):
where K1 and K2 are fitting coefficients. AAEEC and AAEBrC represent the EC and BrC absorption Ångström exponents (AAE), respectively. They do not change with wavelength. AAEEC was assumed to be 1 (Bond, 2001), and the other three parameters in Eq. (5) were obtained for AAEBrC values between 2 and 8 with an increment of 0.1 by least-square linear regression. The AAEBrC that led to the overall best result in terms of R2 was selected as the effective AAEBrC. The mass absorption efficiency (MAE) was obtained from the ratio of light absorption coefficients ( or to the corresponding EC or OC mass concentrations (Olson et al., 2015). The estimated MAEBrC was much lower than the true value by replacing BrC with OC because BrC accounts for only a small fraction of OC. The main shortcoming of the separation of the total aerosol absorption into EC and BrC (Eq. 5) does not consider mineral dust impact. According to a recent study by Zhang et al. (2021), mineral dust may be important atmospheric aerosol species over the TP. However, the study region is located on the eastern slope of the TP, which is more easily affected by anthropogenic sources from the heavily polluted SCB than natural sources such as mineral dust (Yin et al., 2020) as compared to the northern areas close to the Taklimakan and Gobi deserts. The main aim of this study was to reveal the gradient distributions of aerosol optical properties from the pollution of the SCB to the eastern TP; thus, the impact of this shortcoming may be negligible when studying the spatial heterogeneity of aerosol optical properties at a relatively small spatial scale. Additionally, the AAE of EC was assumed to be 1, and the ageing of EC was not considered when separating the total aerosol absorption into EC and BrC (Eq. 5) in our study.
The light absorbed by the carbonaceous component can be estimated as follows (Huang et al., 2018):
where 405 nm is the reference wavelength λ0 and CEC and COC represent the EC and OC concentrations, respectively. The planetary boundary layer (PBL) height was obtained from the HYSPLIT model, and no vertical gradients were assumed within the PBL. This assumption might overestimate the radiative forcing of aerosols, which may have a small effect on the radiative forcing of BrC relative to EC (f) that can be estimated using the following equation (Zhao et al., 2019):
where I0(λ) is the wavelength-dependent solar emission flux, which is the clear sky air mass global horizontal solar irradiance (Levinson et al., 2010). Light absorption by BrC at 405 and 445 nm is much stronger than that at longer wavelengths inside the SCB (Zhao et al., 2021). The 405 nm wavelength was the lower limit of detection of the DRI-2015 instrument. Therefore, fraction (f) was obtained by numerical integration of the above formula in the wavelength ranges of 405–980 nm and 405–445 nm for each sample. Nighttime samples were excluded when calculating the radiative forcing of the BrC relative to the EC.
The exponential function was selected to fit the relationship between BrC MAE and altitude (AT). The equation is as follows:
where aλ and b are the fitted coefficients. The EC MAE can be parameterised with the altitude by replacing the subscript of BrC with EC in Eq. (9).
2.4 HYSPLIT model
The HYSPLIT model developed by the National Oceanic and Atmospheric Administration is a complete system for computing simple air parcel trajectories (Stein et al., 2015). It is one of the most extensively used atmospheric transport and dispersion models. A common application is back-trajectory analysis to determine the origin of air masses and establish source–receptor relationships. In this study, the HYSPLIT model was used to determine the potential source regions of air pollutants during the four seasons at the six sites. The 96 h backward trajectories arriving at 500 m above ground level and initialising each hour of the day were calculated with the 0.25∘ × 0.25∘ Global Data Assimilation System data from the National Centers for Environmental Prediction. The gridded back-trajectory frequencies were calculated using the Openair package in Rplot.
2.5 PMF receptor model
The EPA positive matrix factorization (PMF) receptor model (version 5.0) is a mathematical approach for quantifying the contribution of sources to samples based on their composition or fingerprints. A specialised data set can be viewed as a data matrix X of i×j dimensions, in which i number of samples and j chemical species were measured, with uncertainties u. The goal of the PMF model was to determine the chemical mass balance between the measured species concentrations and source profiles, as shown in Eq. (10), with the number of factors p, species profile f of each source and amount of mass g contributed by each factor to each sample:
where eij is the residual of each sample or species. In this study, the uncertainties of the chemical species concentrations were estimated using Eq. (11):
where MDL is the species-specific method detection limit. The water-soluble ions and carbonaceous aerosols in the four seasons at the six sites were used as input variables to run the PMF model. The MDL of the species uses data from Cui et al. (2019).
3.1 Light absorption of EC and BrC
Table 2 summarises the seasonally mean OC and EC concentrations, light absorption coefficients, efficiencies (babs, MAE) of EC and BrC at 405 nm, and the meteorological variables at the six sites during the campaign. The average winter EC concentration ranges from 2.2 µg m−3 at Maerkang to 7.9 µg m−3 at Sanbacun, which is 2–6 times higher than that in the other seasons in response to more primary emissions in winter with similar wind speeds (Table 2). The much higher ratios at the plateau sites than those at the basin sites suggest that more secondary OC is formed by chemical reactions over the TP, which has been corroborated by Wu et al. (2018). High ratios with increasing altitude can also result from strong EC emissions at low altitudes. Combined with those obtained from previous studies, the winter OC concentration was found to vary from 15.0 to 20.1 µg m−3, whereas EC ranged between 4.3 and 4.7 µg m−3 at urban areas inside the SCB, which was substantially lower than that at the IGP (Table S1 in the Supplement). However, OC and EC concentrations in the eastern TP were much more abundant than those in the western and southern TP sites because of the denser population and widespread industrial activities (Table S1). Thus, carbonaceous aerosol pollution is much more severe inside the SCB than over the TP, indicating that large amounts of air pollutants are trapped inside the deep basin because of calm and stable air.
Table 2Seasonally averaged values (mean ± SD) of OC and EC concentrations, light absorption coefficient (babs), mass absorption efficiency (MAE) and meteorological variables (wind speed (WS), temperature (Tem.), relative humidity (RH)) at the six sites during the measurement campaign. There is no babs or MAE reported for Maerkang and Hongyuan in summer and autumn as the used DRI instrument does not work at the two wavelengths of 405 and 445 nm when the samples are measured, and thus separation of EC and BrC cannot be conducted by Eq. (5). Chengdu, Sanbacun, Wenchuan, Lixian, Maerkang and Hongyuan are abbreviated as CD, SBC, WC, LX, MEK and HY, respectively.
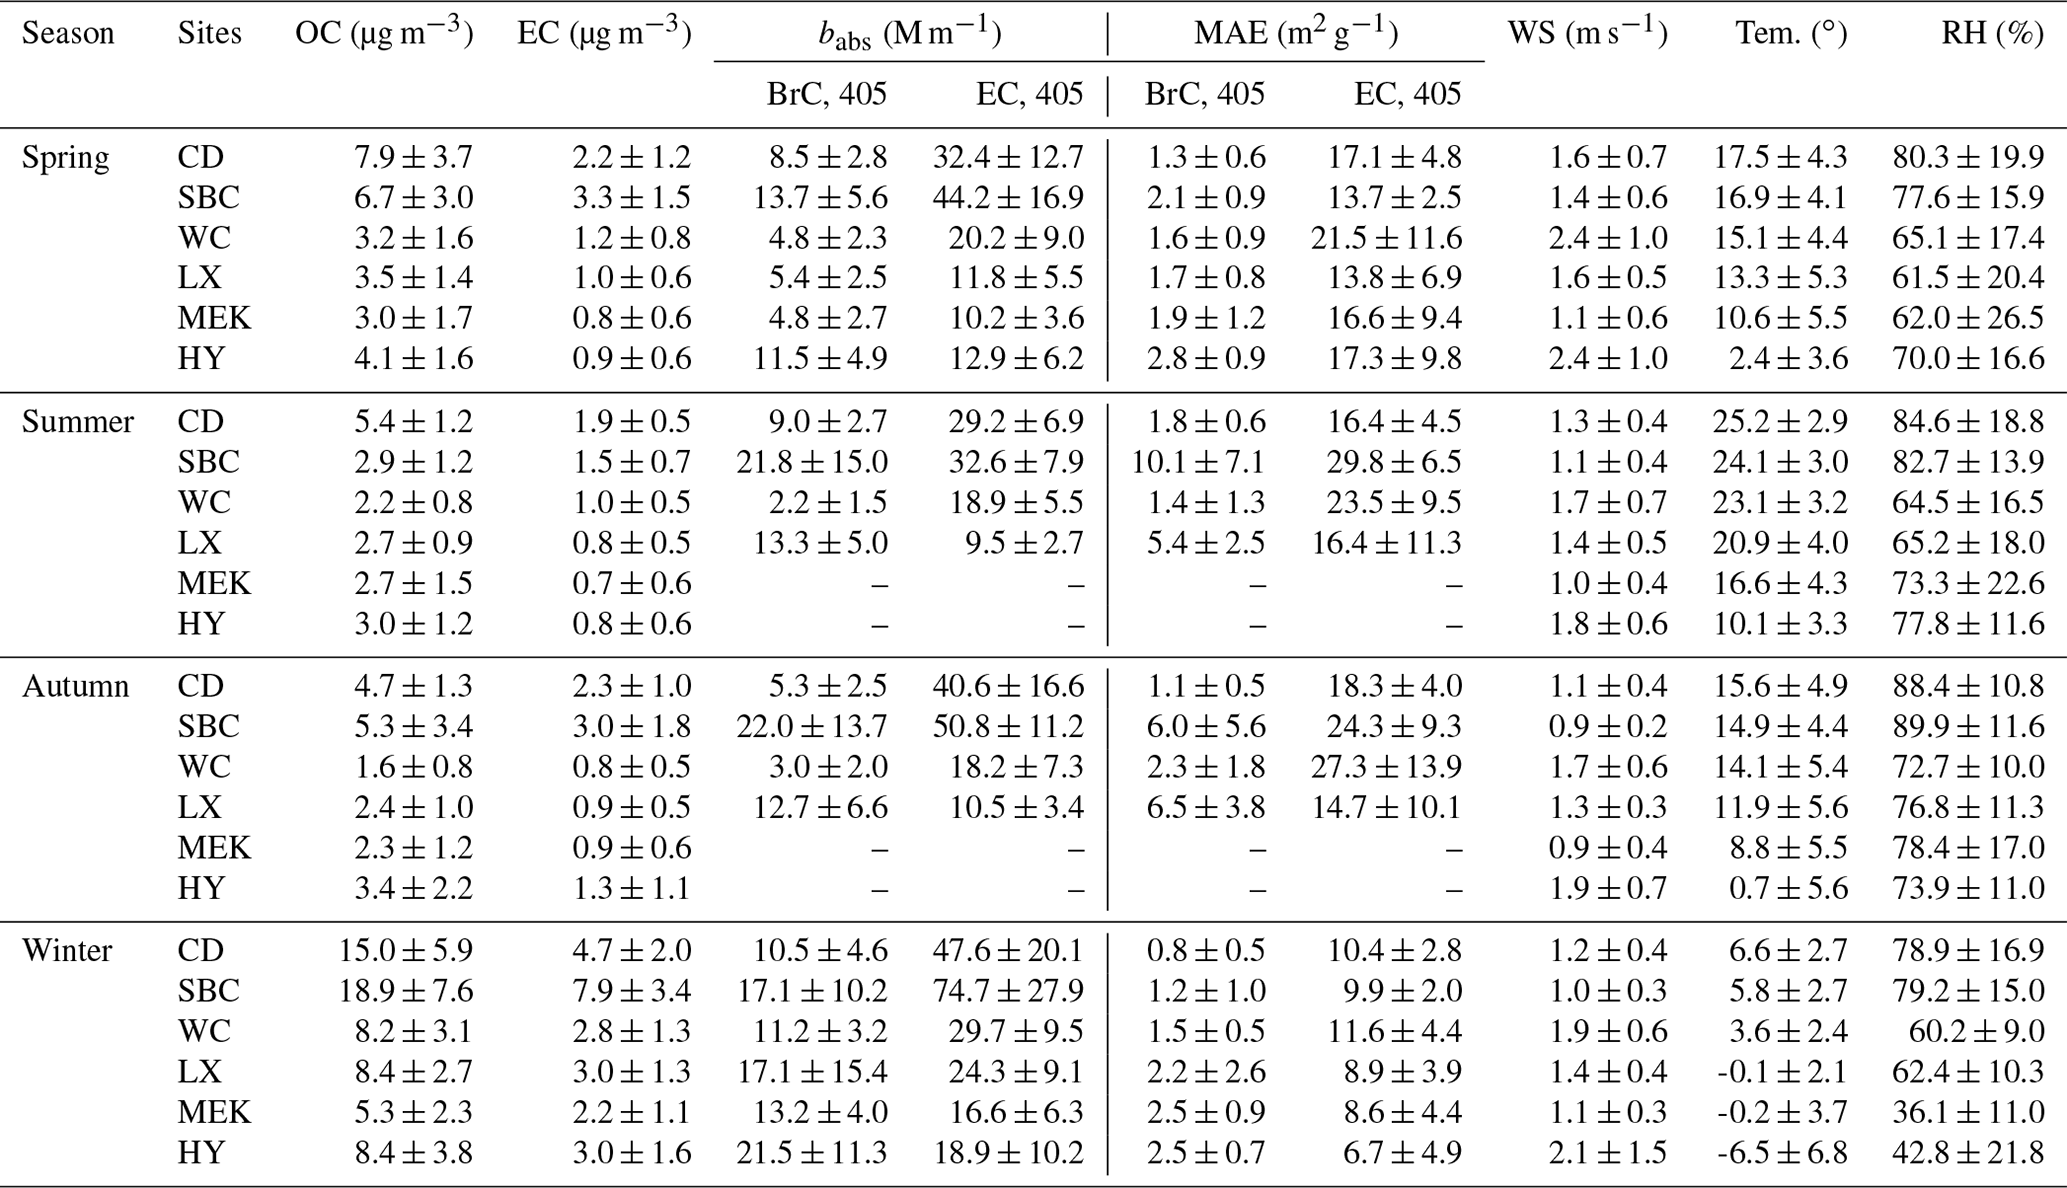
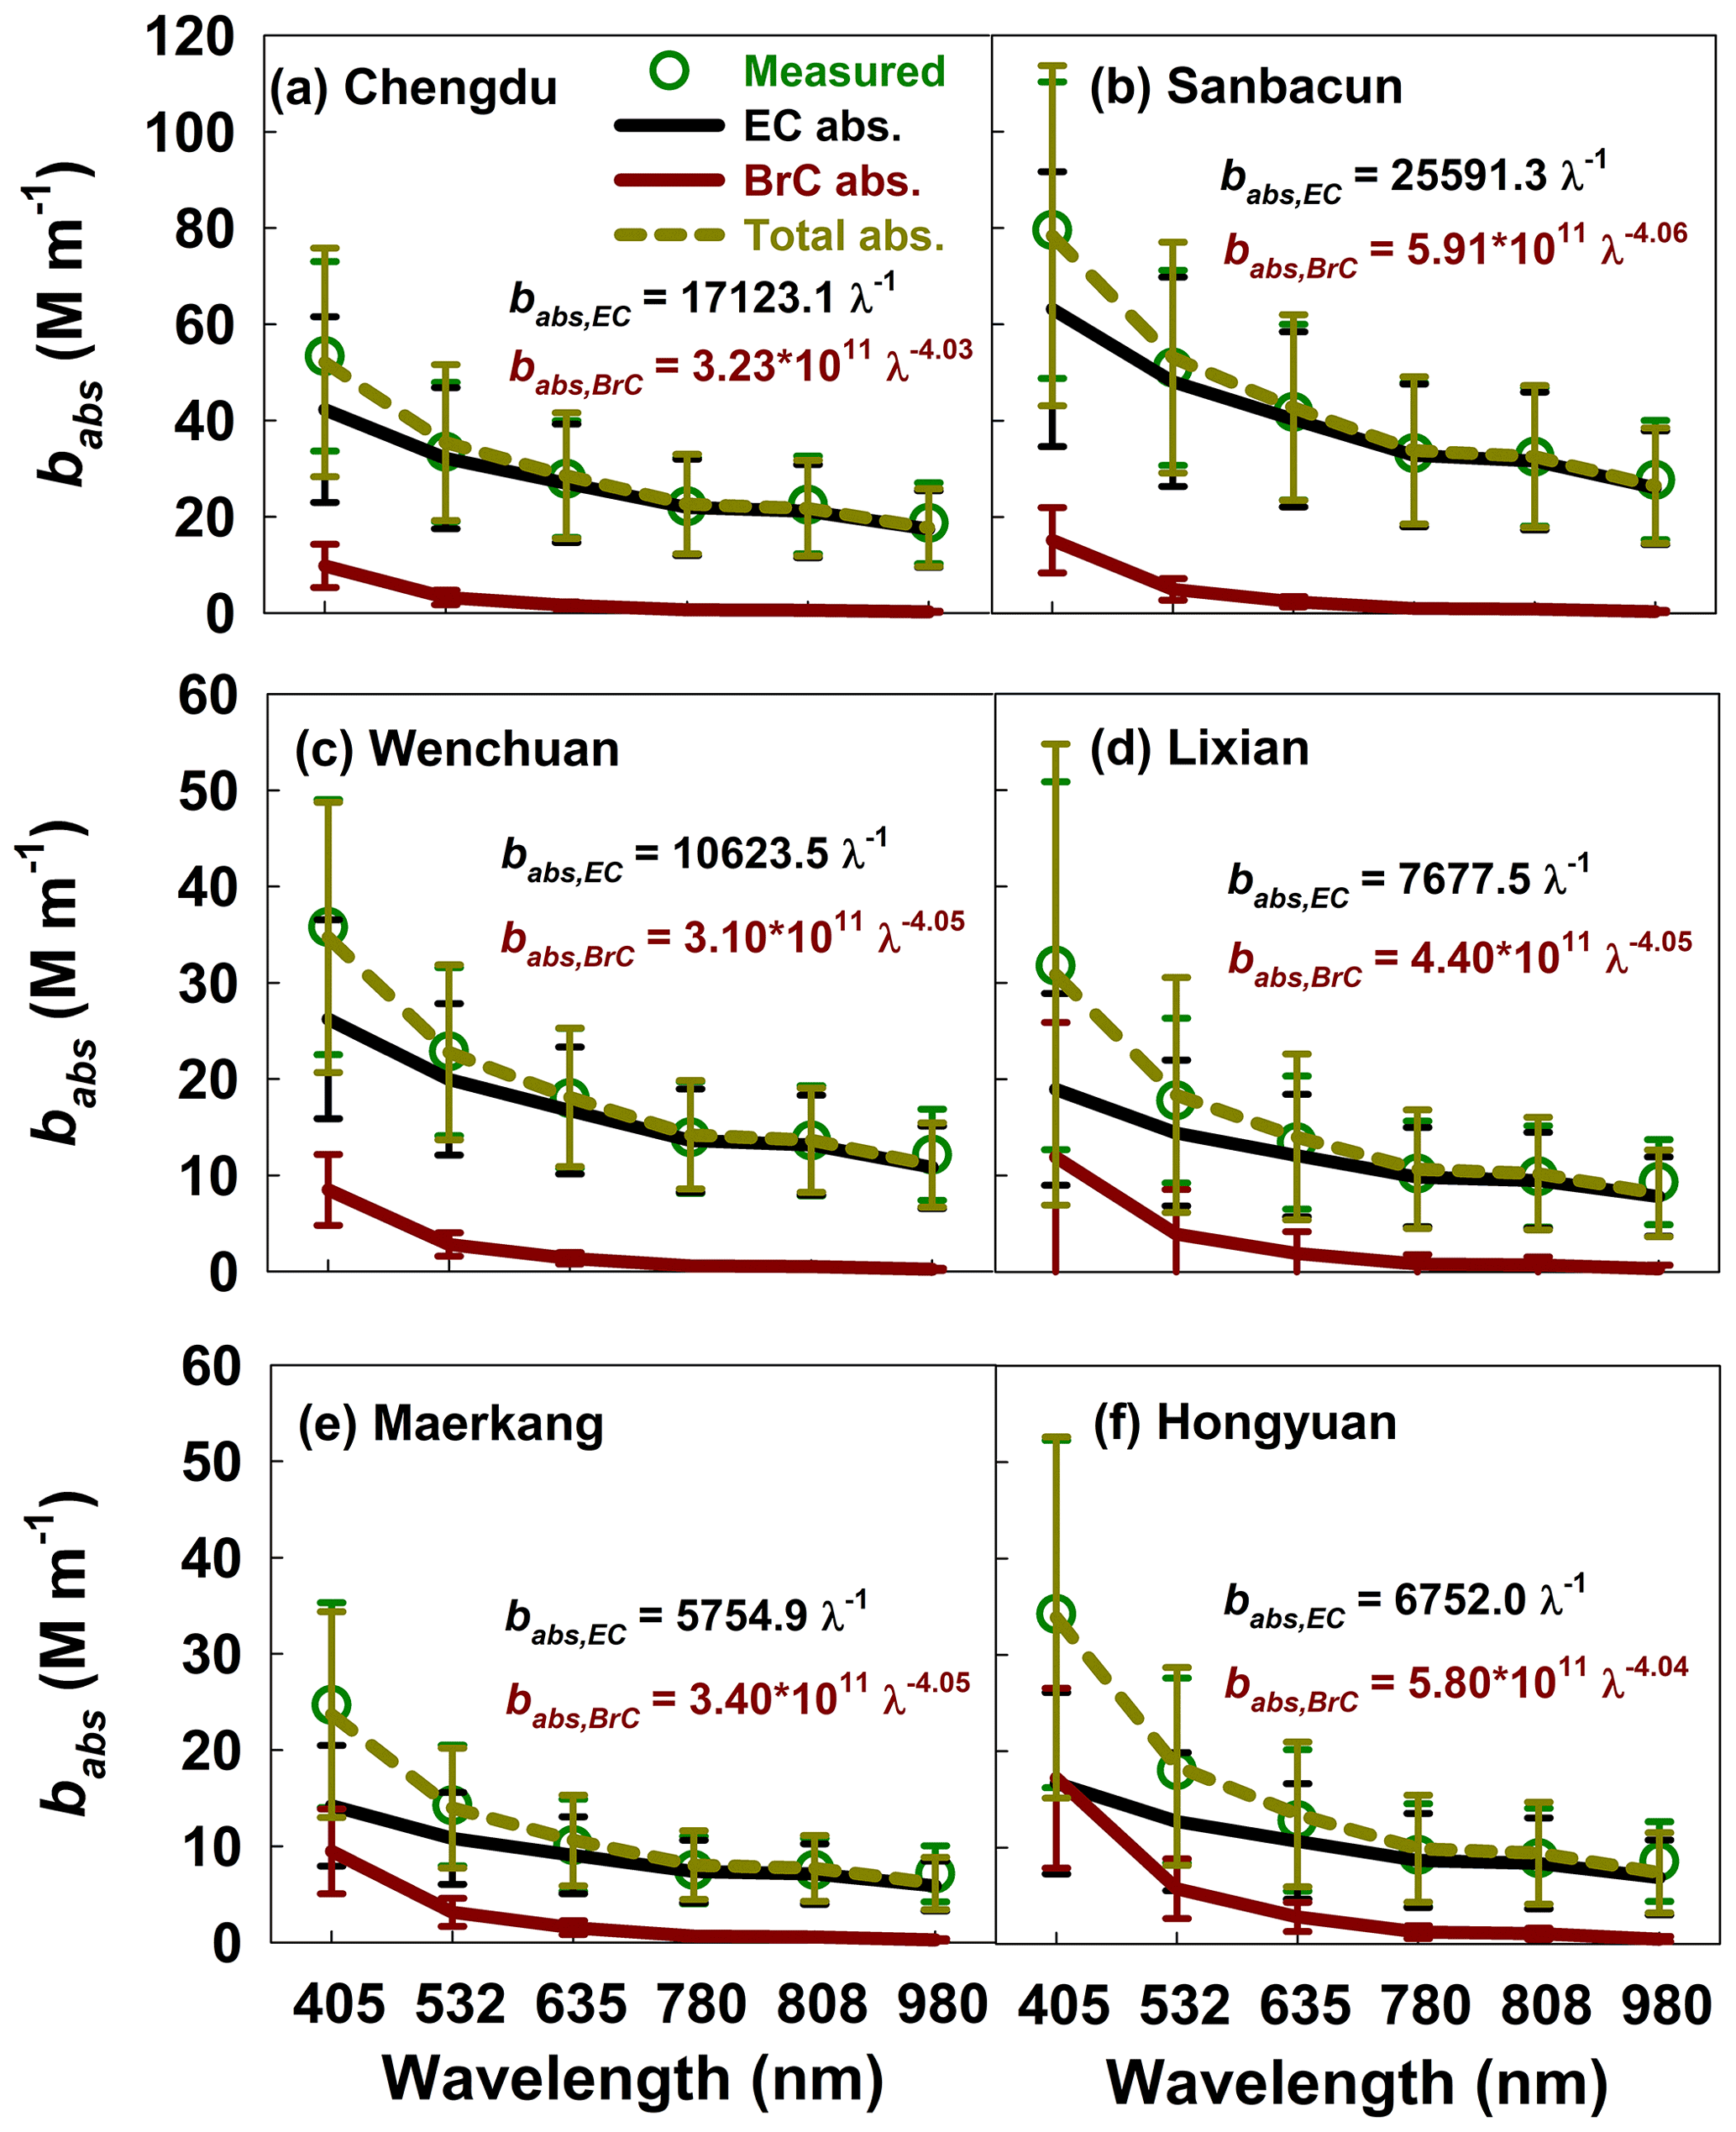
Figure 2Spectral light absorption coefficients (babs) by EC and BrC in spring and winter at the six sites along the ESTP. The subplots depict the decomposition of total light absorption by EC and BrC with the model given in Eq. (4). Error bars represent uncertainties derived from replicate analyses and lower quantifiable limits.
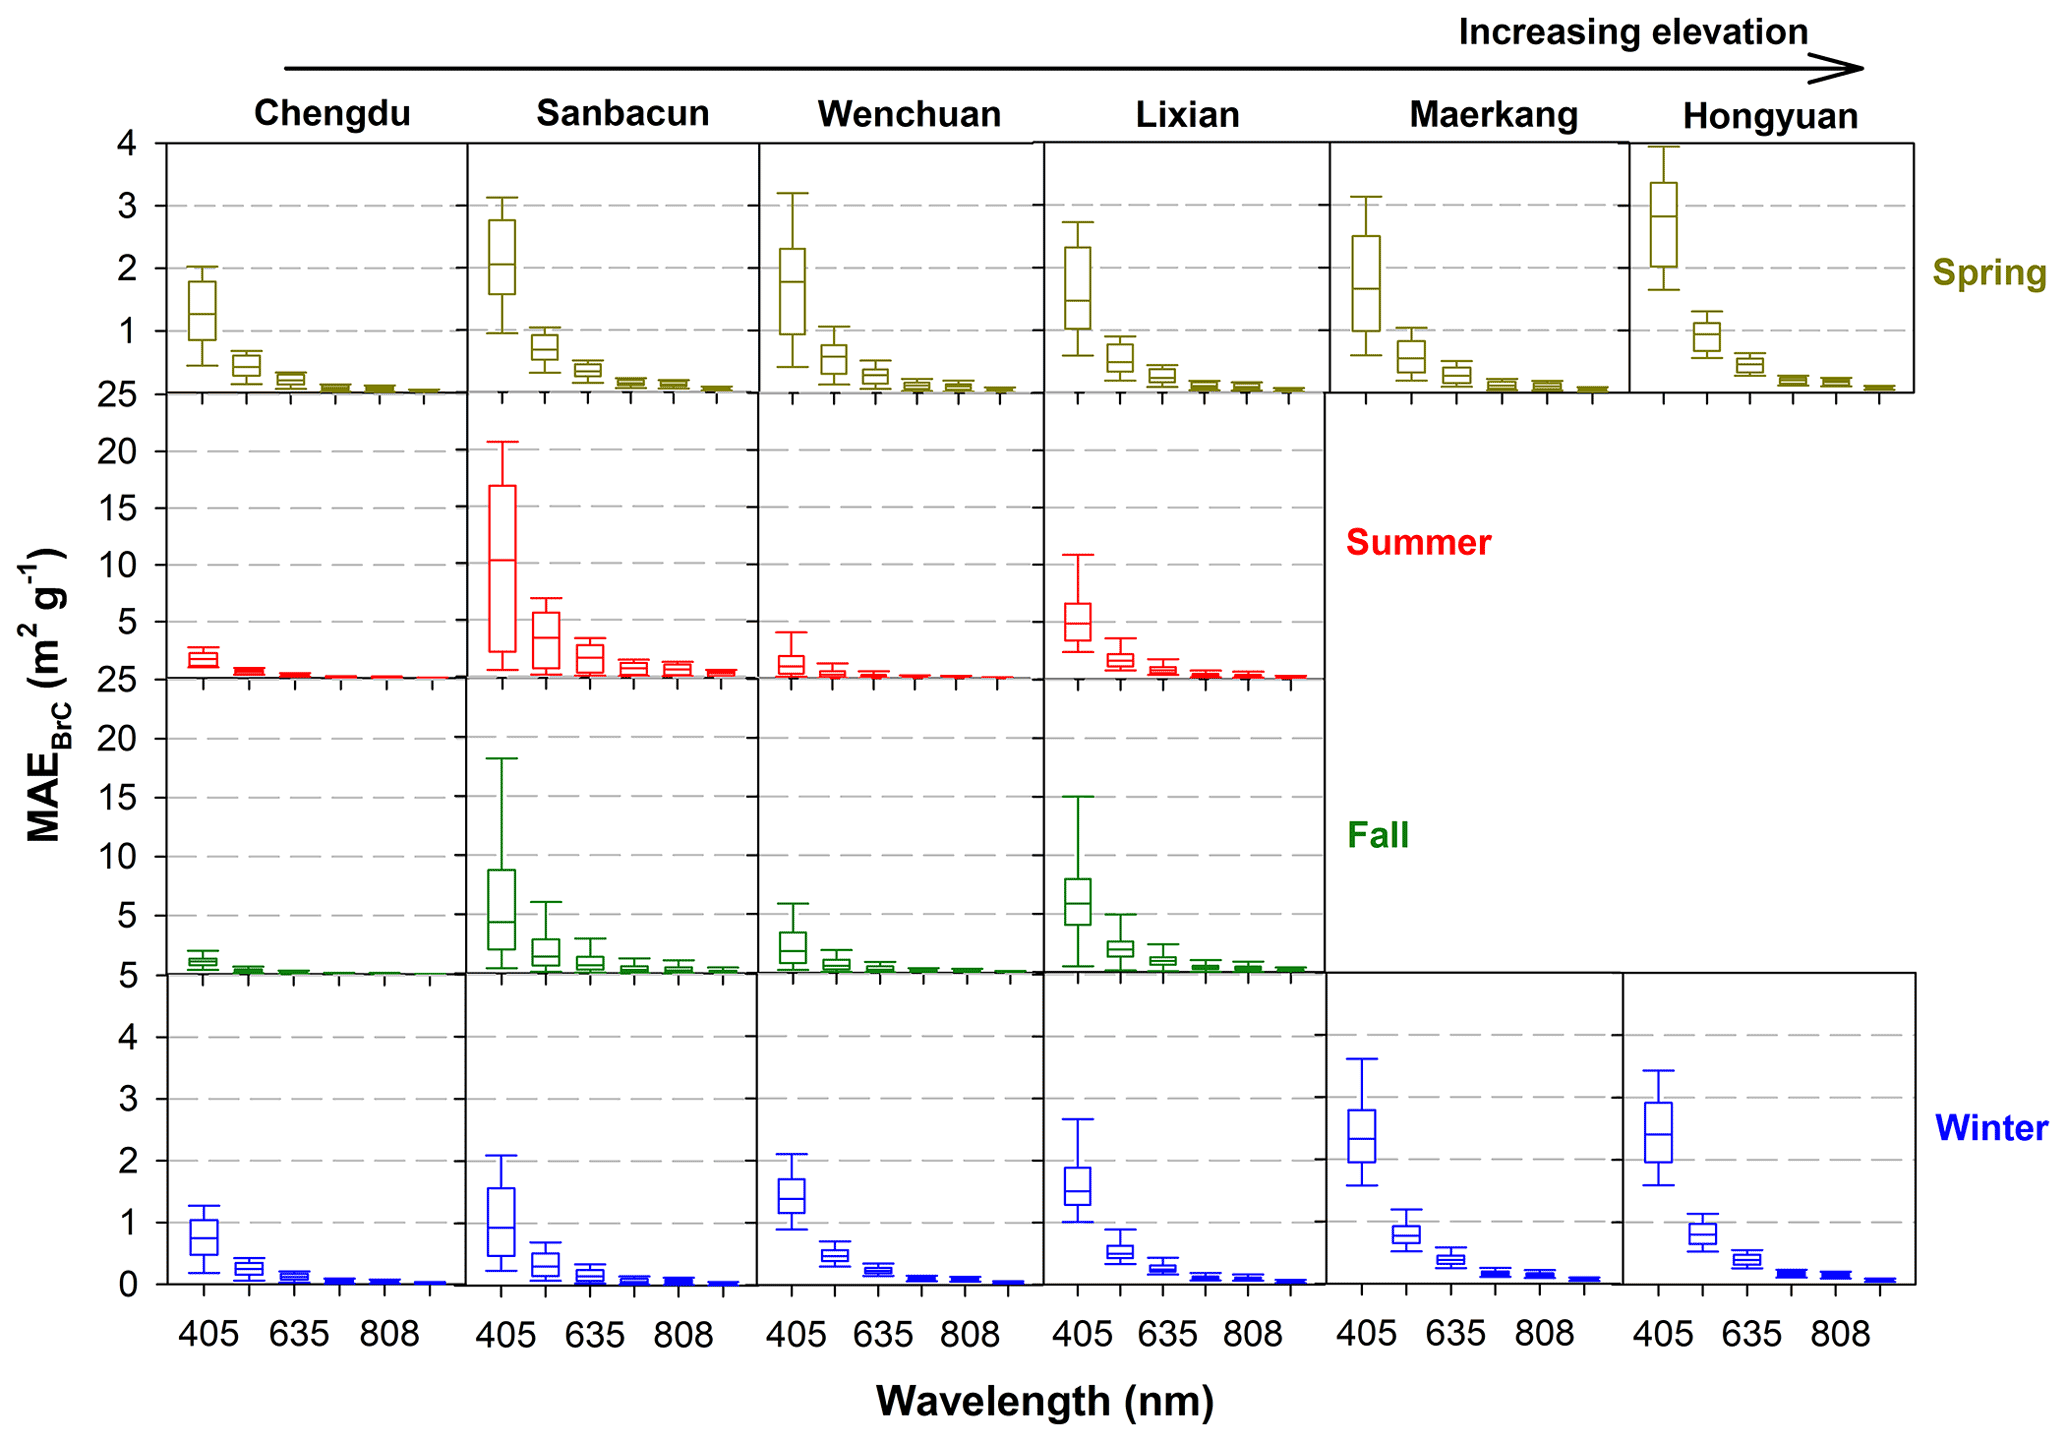
Figure 3Box plots of spectral mass absorption efficiency of BrC (MAEBrC) in each season from Chengdu inside the SCB to Hongyuan over the TP ranging in elevation from 500 to 3500 m. The lines inside the boxes denote the median values, and the two whiskers and the top and bottom of the boxes denote the 5th and 95th and the 75th and 25th percentiles, respectively.
Figure 2 compares the spectral total and separated EC and BrC babs in spring and winter at six sites along the ESTP. The measured (hollow green points) and calculated babs (dashed yellow lines) for total carbon (TC, sum of EC and BrC) were comparable, and the difference was within 5 %. For Sanbacun, a rural site inside the SCB, the babs is much higher than the other sites, especially for shorter wavelengths, because of more BrC emissions from coal and biomass burning for cooking and heating in rural areas inside the SCB (Zhao et al., 2021). The light absorption of EC aerosols decreased with altitude, primarily because of decreased EC concentration (see Table 2). This phenomenon may be partly caused by the stable air inside the deep basin (Feng et al., 2020); however, it would also apply to BrC as far as EC and BrC share sources, and vertical mixing is primarily due to fair-weather convection rather than deep convective storms (Zhang et al., 2017). However, light absorption by BrC does not monotonically change with altitude because of the more complicated sources and origins of BrC. The 405 nm babs of BrC accounting for that of TC increased from 20 % at Chengdu to ∼ 50 % at Hongyuan, whereas the proportion significantly reduced with increasing wavelength (Fig. S1), suggesting that light absorption of BrC aerosols is much stronger at high altitudes than in lowlands.
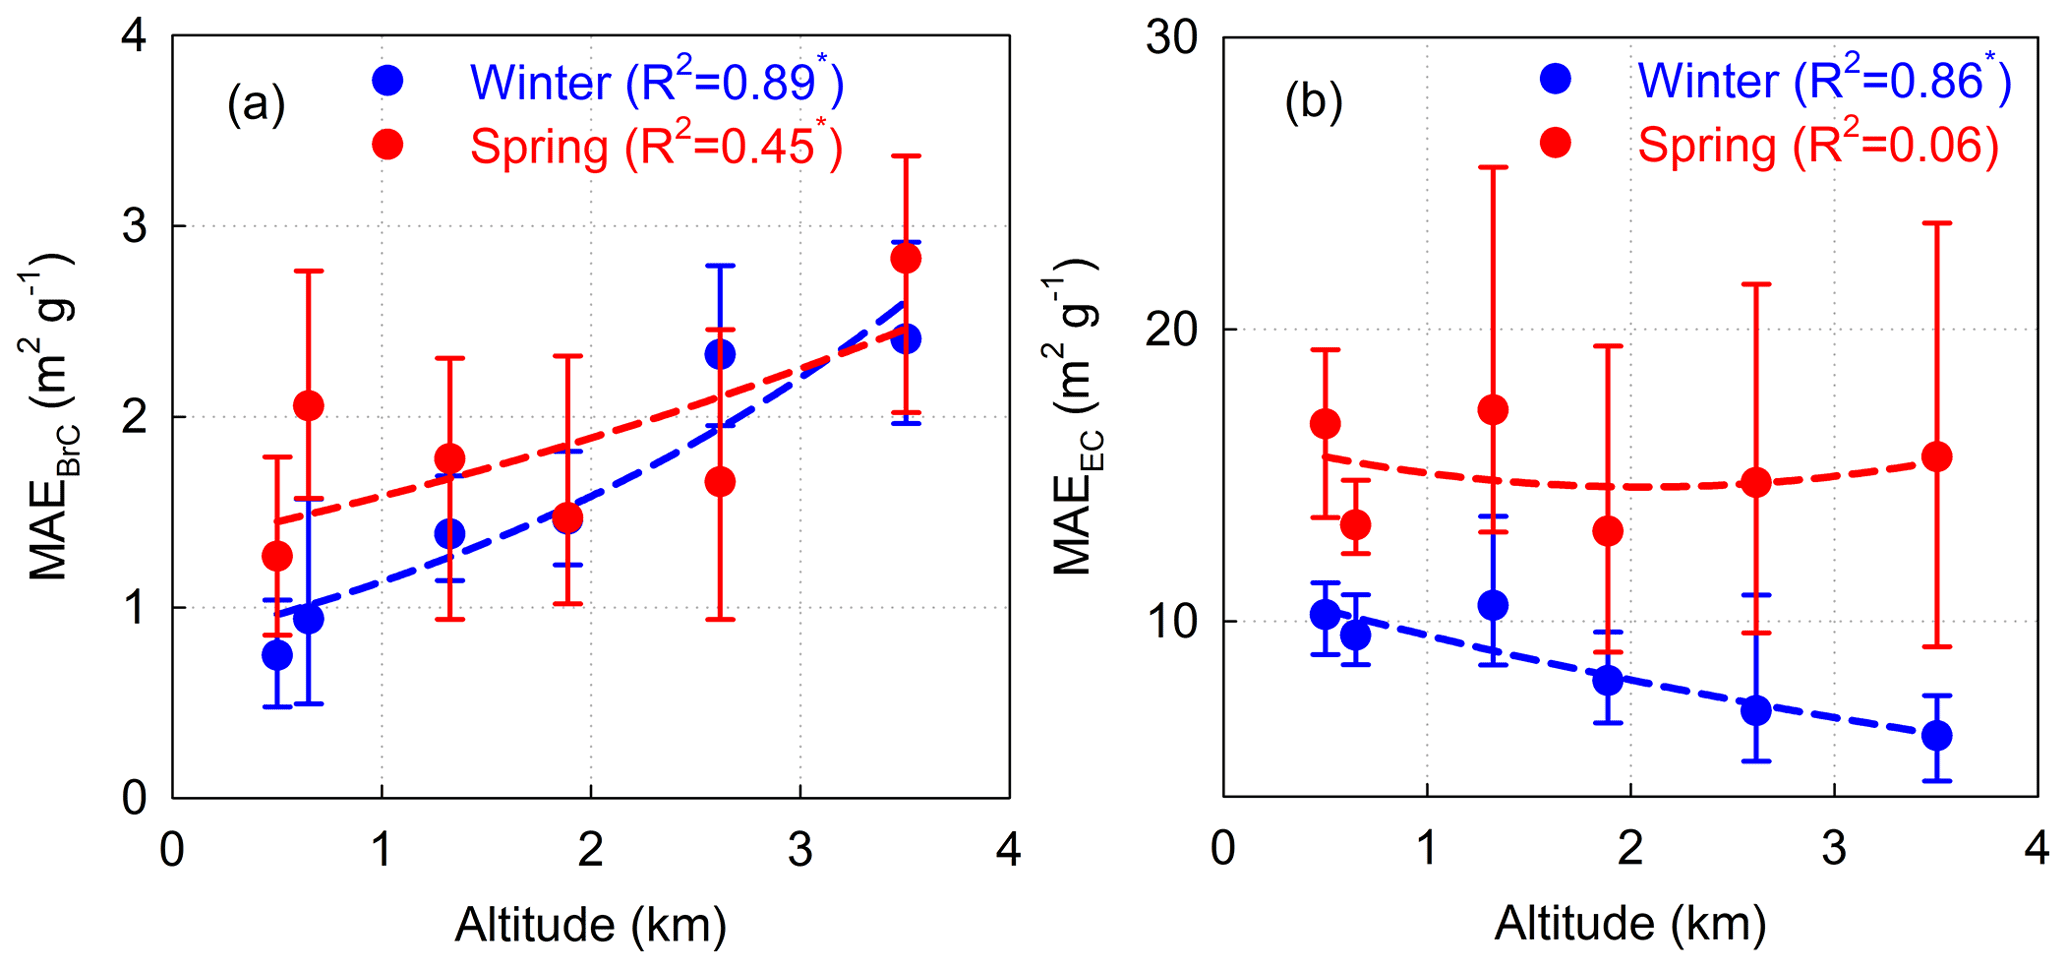
Figure 4Variations of (a) MAEBrC and (b) MAEEC at 405 nm as altitude in spring and winter during the field campaign. The solid dots denote the median values, and the two whiskers of the dots denote the 25th and 75th percentiles. The relationships between averaged MAE and altitude of the measurement sites are fitted by an exponential function, and the coefficients of determination (R2) are also given in each subplot. The relationships (R2 with the superscript of an asterisk) pass the significance level of 0.01.
Compared to babs, MAE can better reflect the LAE of aerosols. The average winter MAEEC is 6.0±1.0 m2 g−1 among all sites, which is within the range of 3.9–11.9 m2 g−1 over the TP and the surrounding basins (Tables 2 and S1). Except for our result in the rural site, the mean winter MAEBrC of 0.7–0.8 m2 g−1 inside the SCB is approximately half of that at the IGP, probably because of the differences in BrC emissions, PM size distribution and chemical composition between the SCB and IGP (Choudhary et al., 2018). Figures 3 and S2 show box plots of spectral MAEBrC and MAEEC in the four seasons from the basin to plateau sites, extending the elevation from 0.5 to 3.5 km. In contrast to EC, MAEBrC at 405 nm over the TP was 2–3 times higher than that inside the SCB with strong elevation-dependent light absorption, and the only clear dependence was in winter. Wu et al. (2018) found that winter MAEBrC was 4.5 m2 g−1 for a pristine environment over the TP (Nam Co, 4730 m a.s.l.), which is significantly higher than that at Hongyuan (3500 a.s.l.) in our study. The average winter ratio of 14.1 at Nam Co was significantly higher than at our sampling sites. Therefore, the clearly increased winter MAEBrC with altitude may be related to BrC composition seasonally, whereas winter MAEEC decreases with altitude, possibly because of the difference in source composition and ageing aerosols inside the deep basin (Liu et al., 2020). This mechanism is discussed in the following sections.
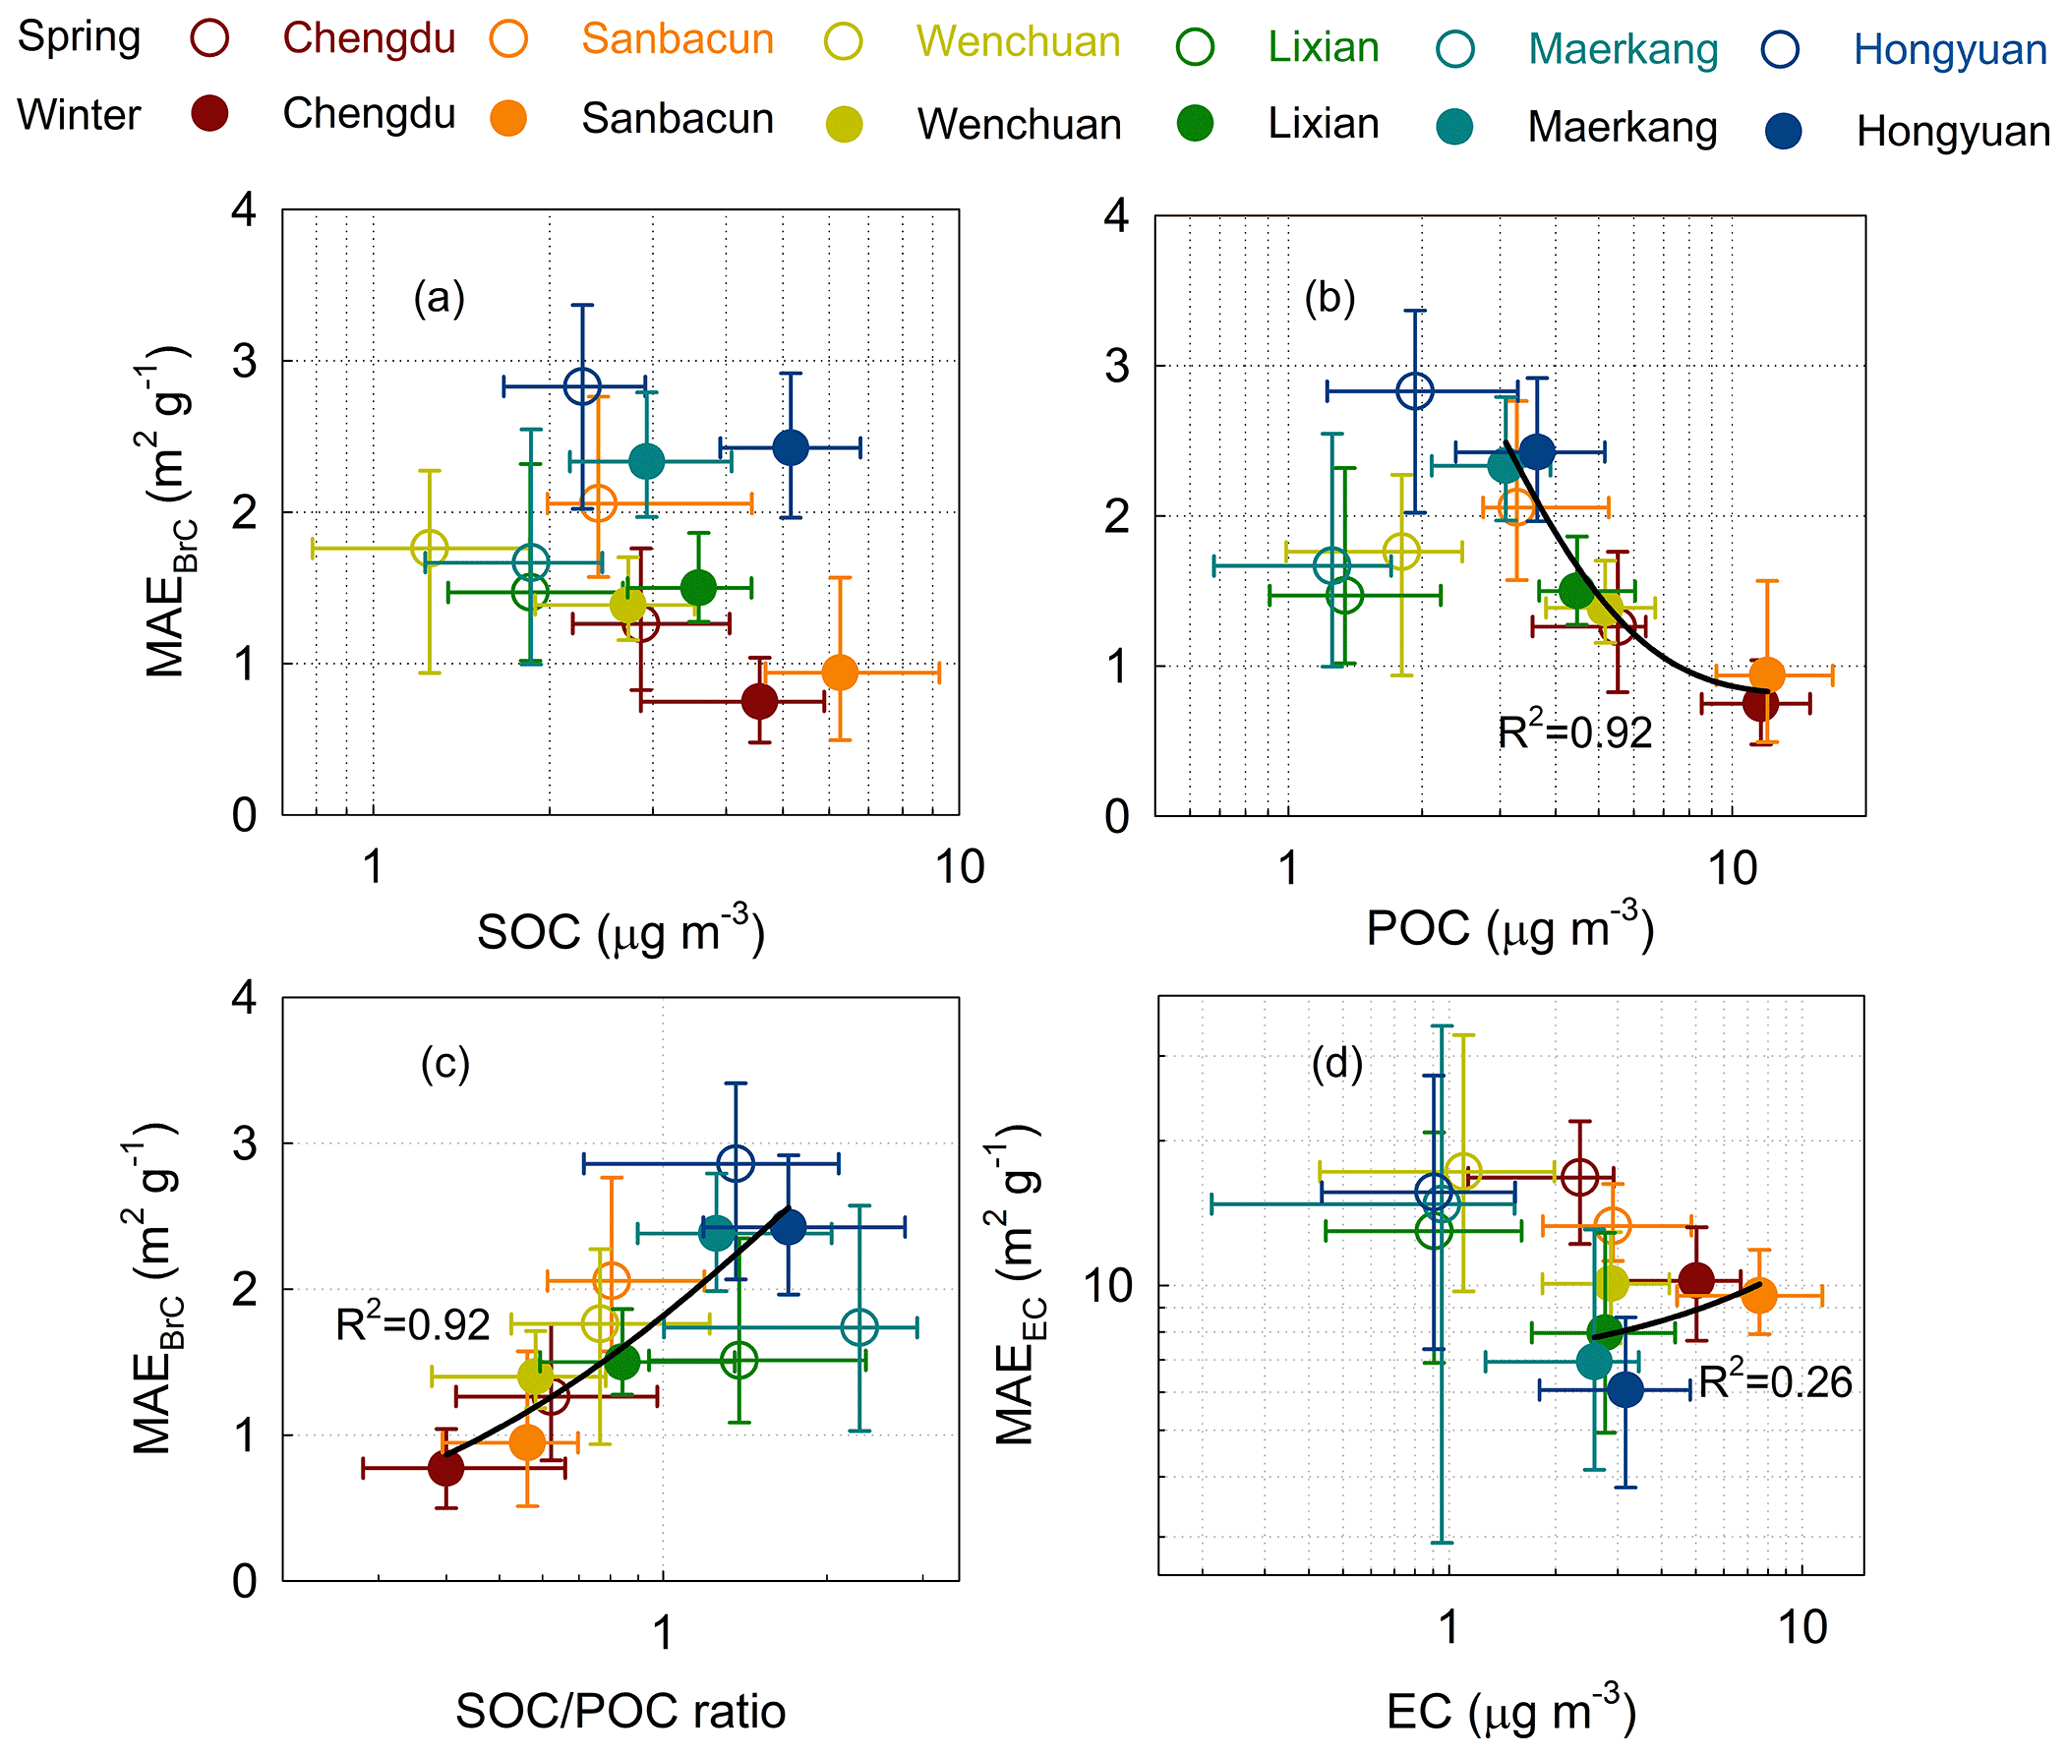
Figure 5Variations of averaged MAEBrC in spring and winter as (a) SOC, (b) POC, (c) ratio and (d) MAEEC as EC concentrations at the six sites. The hollow and solid dots denote the median values in spring and winter, and the four whiskers of the dots denote the 25th and 75th percentiles of the corresponding two variables. The horizontal axis in each subplot is showed on a logarithmic scale to more clearly see the details.
Figure 4 shows MAEBrC and MAEEC variations as altitude in spring and winter during the campaign. The relationships between average MAE and altitude of the measurement sites were fitted by exponential function, and coefficients of determination (R2) were given in Fig. 4. R2 reflects the strength of the relationships between two parameters. The contrasting MAE variation as altitude between BrC and EC in winter (R2 of 0.89 for MAEBrC and 0.86 for MAEEC) is more significant than that in spring (R2 of 0.45 for MAEBrC and 0.06 for MAEEC). The better relationships in winter may be because more urban and aged aerosols are trapped inside the deep basin in response to strong winter temperature inversion (Feng et al., 2020). The relation of MAEBrC or MAEEC at 405 nm with altitude can be parameterised with an exponential function (Eq. 9). The spring and winter MAEBrC can be parameterised with altitude (AT) as follows:
Similarly, the winter MAEEC can be parameterised by altitude (AT) as follows:
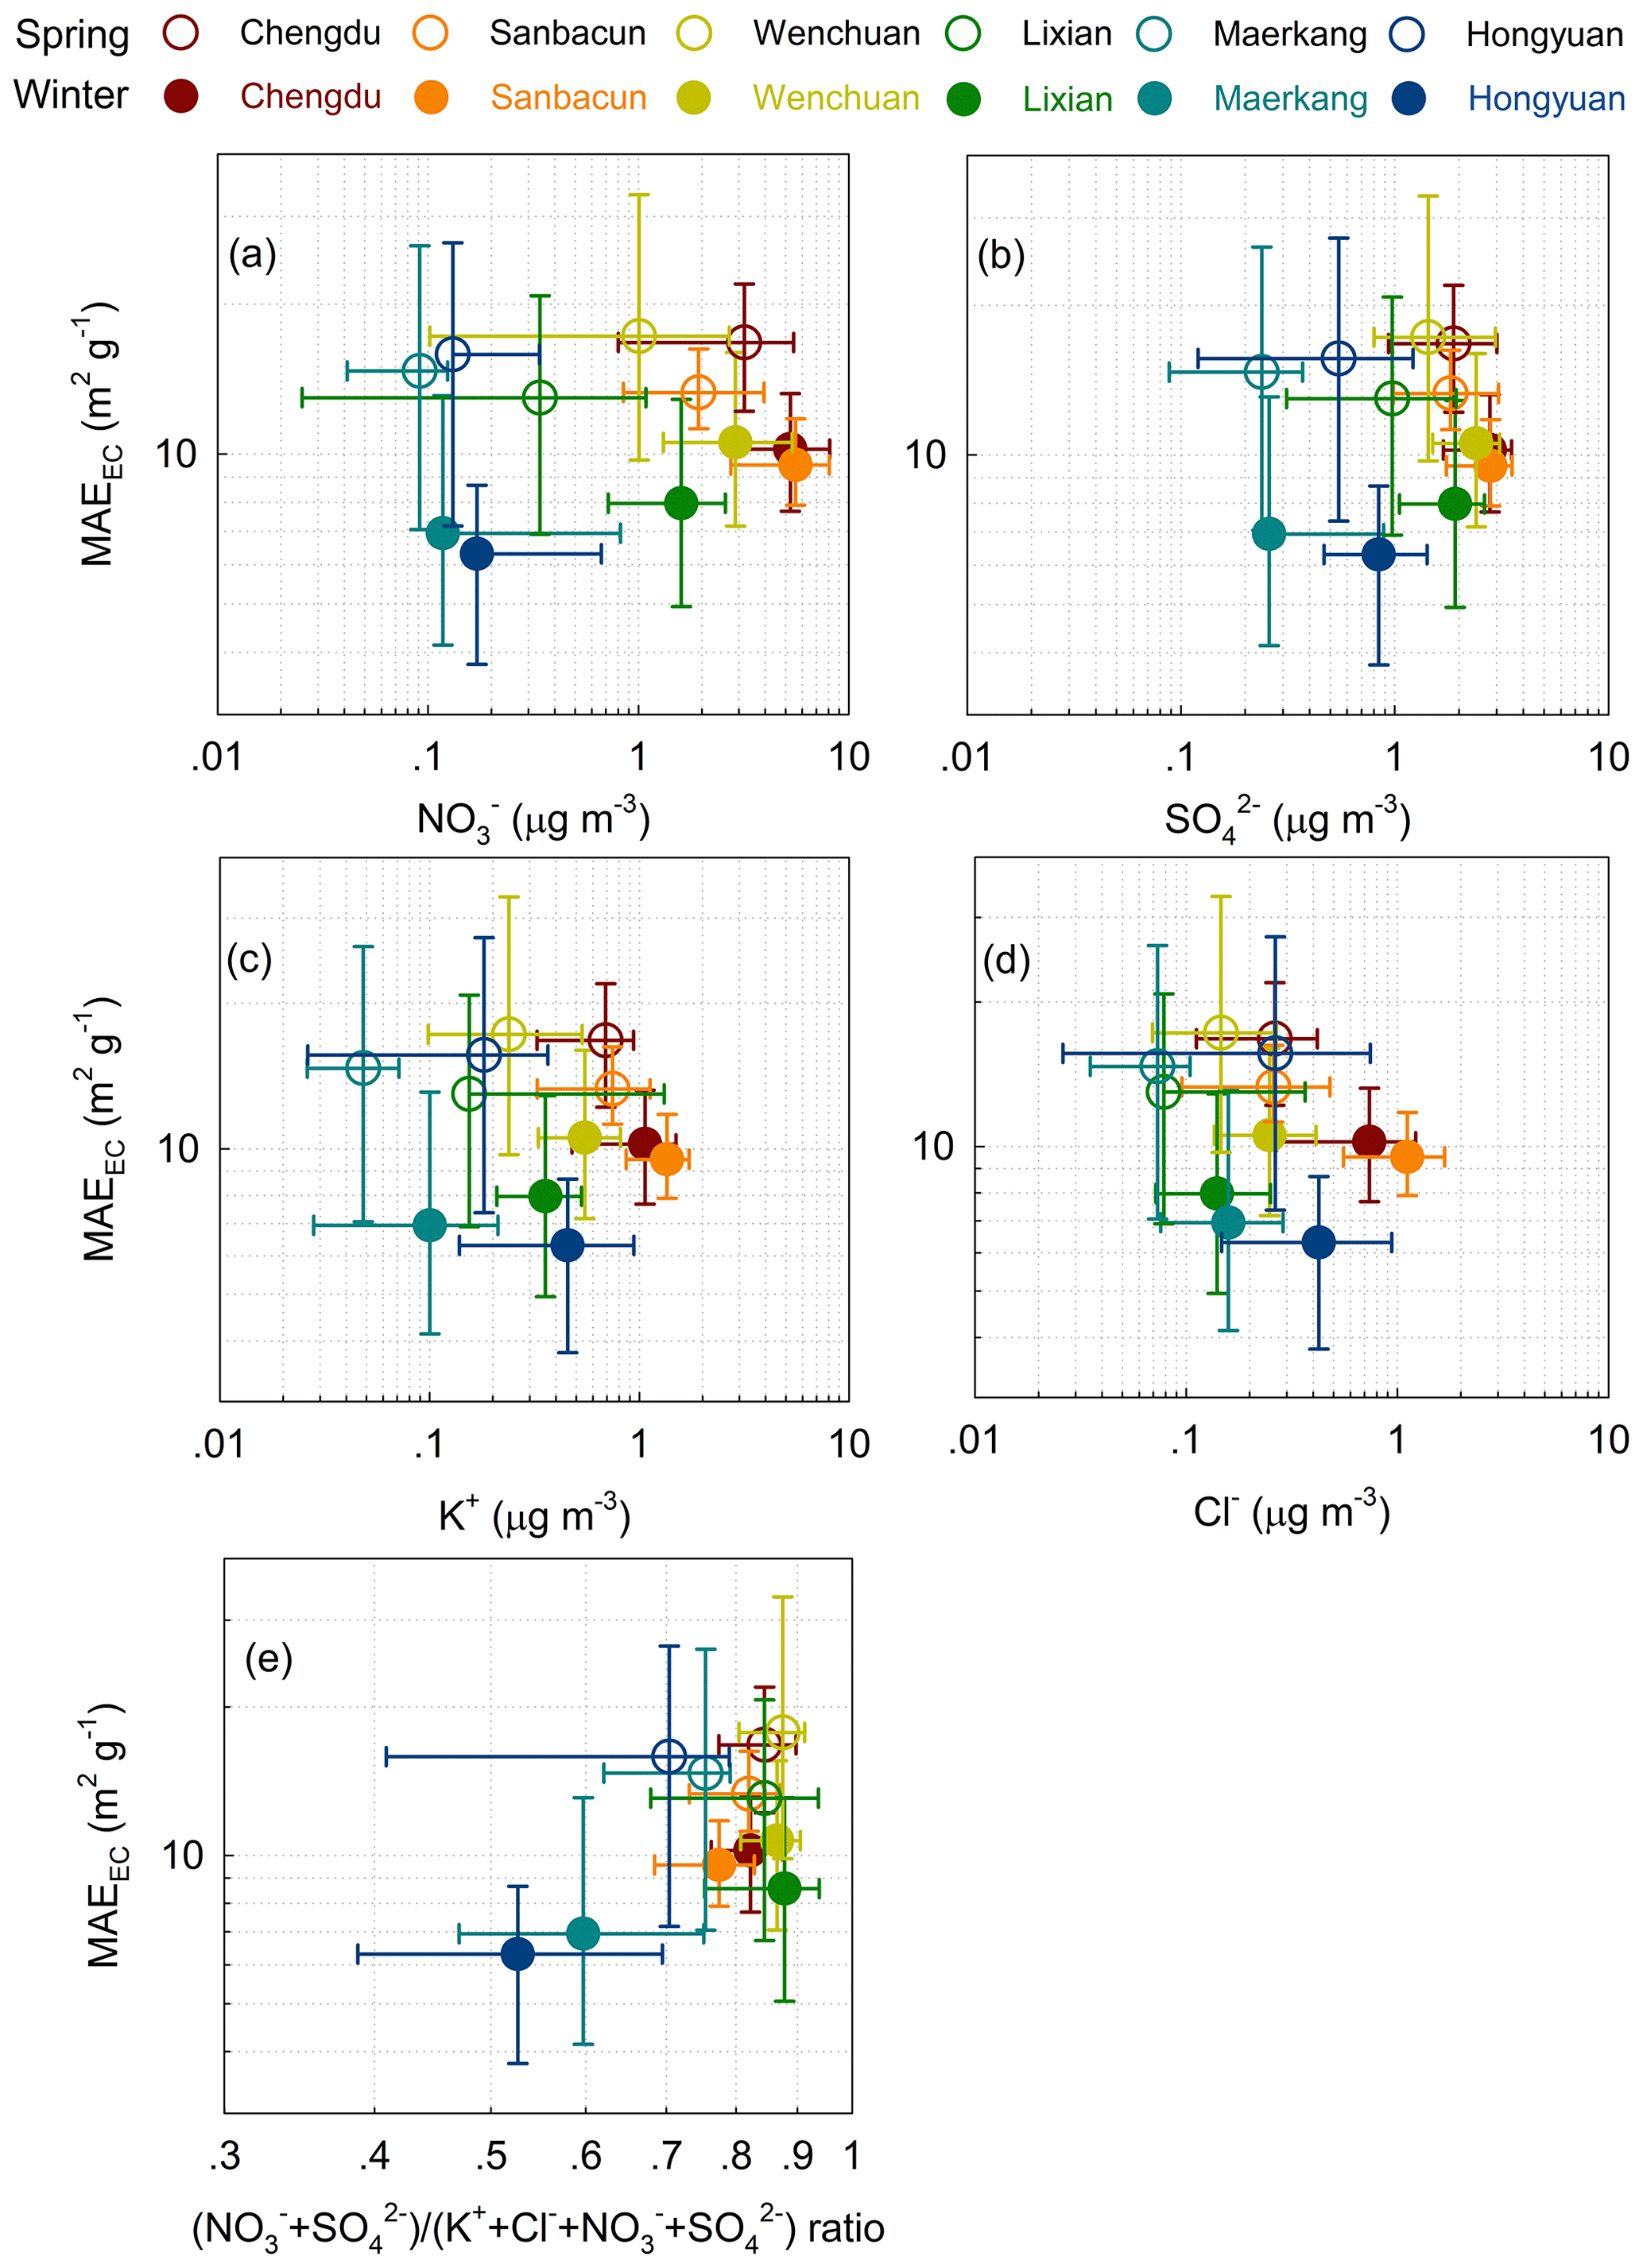
Figure 6Variations of MAEEC in spring and winter as (a) NO, (b) SO, (c) K+ and (d) Cl− concentrations and (e) (NO SO (K Cl NO SO ratio at the six sites. The hollow and solid dots denote the median values in spring and winter, respectively, and the four whiskers of the dots denote the 25th and 75th percentiles of the corresponding two variables. The axes in each subplot are shown on a logarithmic scale to more clearly display the details.
3.2 Sources impacting the light absorption of EC and BrC
The ratio can be used to approximately identify sources of carbonaceous aerosols, and the ratio of aerosols from fossil fuel combustion is generally lower than that from biomass burning (Bond et al., 2004). Figure S3 shows the relationship between OC and EC concentrations inside the SCB and over the TP during the campaign, and the ratio was obtained by fitting the relationships with univariate linear regression. The significant simultaneous change between OC and EC (R2=0.80 for SCB and R2=0.75 for TP) indicated that the sources may be similar. The ratios of 2.14 for western SCB and 2.06 for eastern TP are significantly lower than those at Nam Co (13.8–14.1, Wu et al., 2018) representing a pristine environment over the central TP (Cong et al., 2009), whereas the ratios are much higher than those for Lhasa – the largest city on the TP (1.46, Li et al., 2016). The ratios in our study are slightly lower than those for urban areas in eastern China and Helsinki in Finland (Han et al., 2014; Viidanoja et al., 2002), indicating that carbonaceous aerosols in the western SCB and eastern TP may be significantly affected by primary sources.

Figure 7Variation of radiative forcing of BrC relative to EC (f; see Eq. 8) as (a) altitude and (b) ratio for each site. The solid dots denote the median values, and the two whiskers of the dots denote the 25th and 75th percentiles of the variables.
In addition to primary sources, secondary formation largely contributes to OC aerosols; thus, secondary organic carbon (SOC) was calculated using the EC-tracer method (Turpin and Lim, 2001). To better understand the light absorption of primary organic carbon (POC) and SOC, Figs. S4 and 5 show sample-to-sample and average MAEBrC variations as SOC and POC concentrations for each site in spring and winter during the campaign, respectively. The LAE of BrC significantly declined as the OC composition increased with better relationships for POC at each site (Fig. S4). The average winter MAEBrC decreased by approximately 70 % as POC increased from 3.0 µg m−3 at Hongyuan to more than 20 µg m−3 at Chengdu (Fig. 5). SOC accounting for OC significantly increased from western SCB to eastern TP, and it was higher than 50 % at Maerkang and Hongyuan because there are relatively few primary sources over the TP. The large winter MAEBrC increment as the ratio indicates that more SOC and fewer POC provide a favourable conditions for BrC light absorption enhancement (Fig. 5). Therefore, the strong elevation-dependent MAEBrC in winter (Fig. 4) may be induced by ratio variations from western SCB to eastern TP.
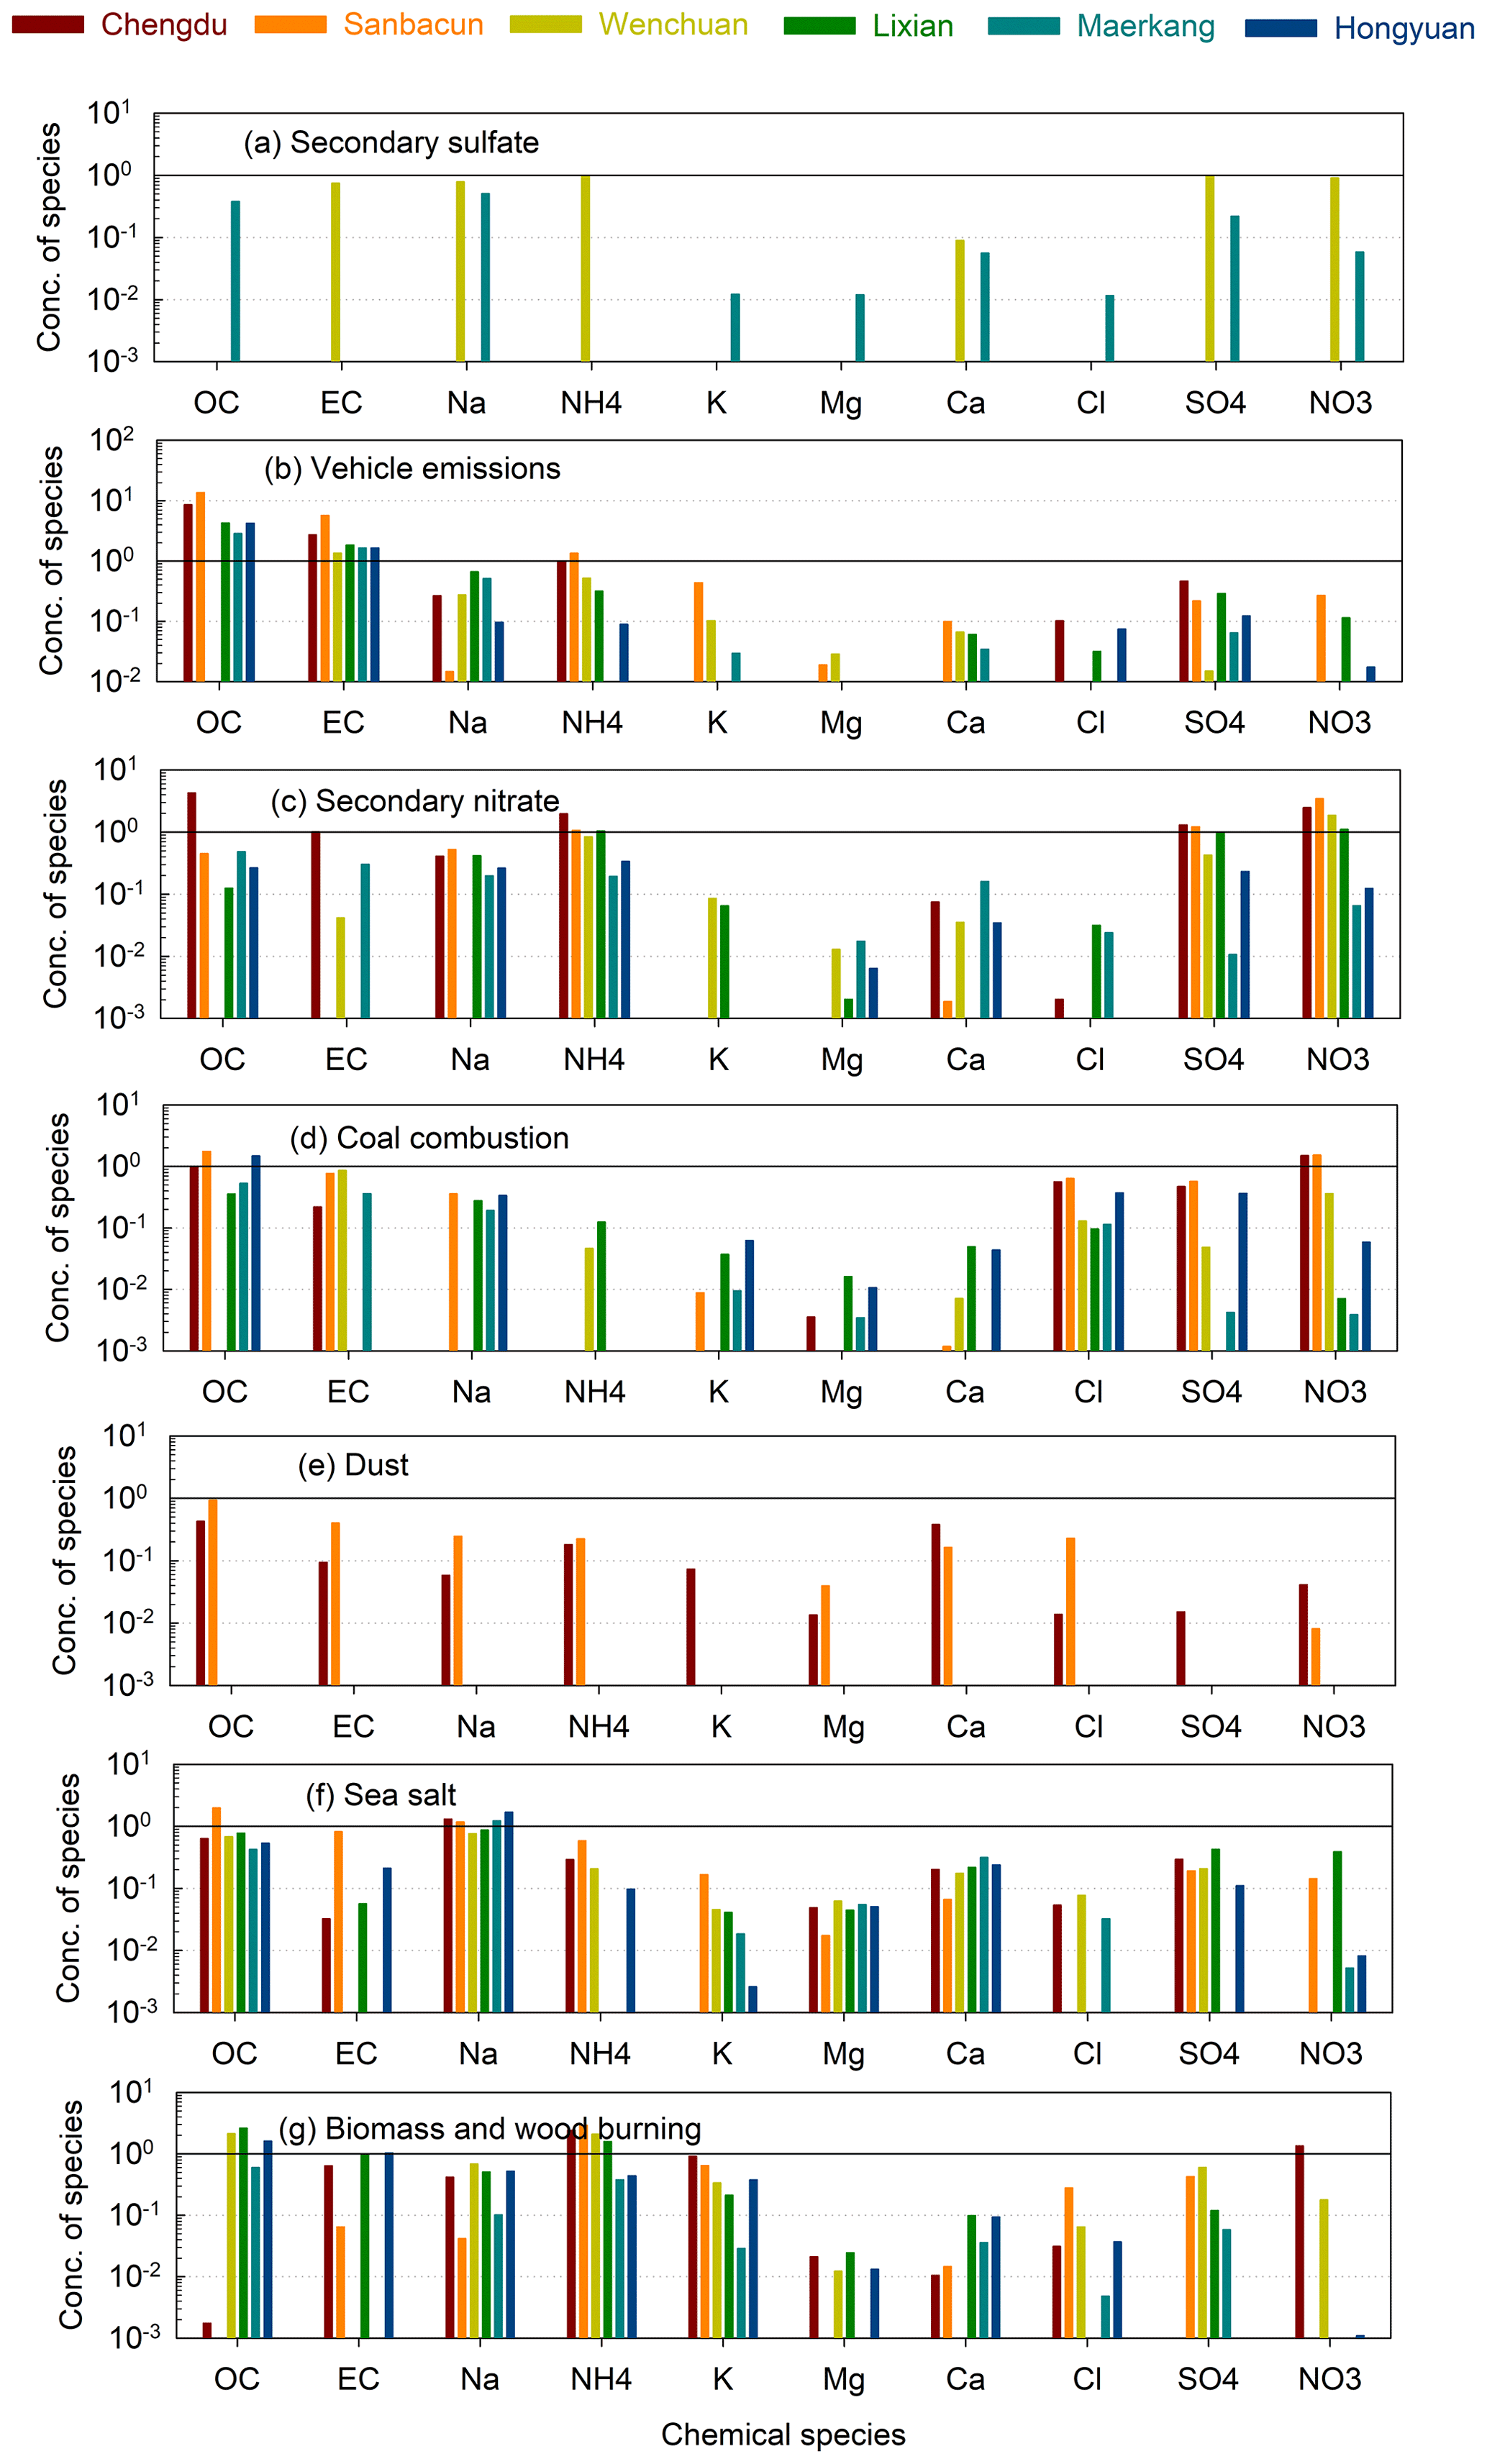
Figure 8Mass concentrations of species for each source at each site apportioned by PMF model in winter during the campaign. The vertical axes are showed on a logarithmic scale to better distinguish between the concentrations of chemical species among the measurement sites.
The EC LAE largely decreased as the EC concentration increased at each site (Fig. S5). However, the average winter MAEEC inside the highly polluted SCB was much higher than that over the clean TP, whereas for similar EC concentrations among the plateau sites, the MAEEC at Wenchuan was approximately 2 times higher than that at Hongyuan, with a strong dependence on elevation. Therefore, winter aerosol ageing inside the deep basin and large source differences may induce light absorption reduction from the western SCB to eastern TP. The increase in MAEEC as the ratios of water-soluble ions (K+, Cl−, SO and NO to EC concentrations at different levels suggests that EC light absorption was affected by many anthropogenic sources at the six sites (Fig. S6). A specific inorganic component can be considered an indicator of a specific emission source. K+ and Cl− ions are usually used to characterise biomass burning (BB) and coal combustion (CC), respectively (Tao et al., 2016). NO and SO reflect motor vehicles and industrial source impacts, respectively. Therefore, to further identify the key sources impacting MAEEC, we verified the spring and winter mean MAEEC variations as the concentrations of K+, Cl−, NO and SO ions at the six sites (Fig. 6). Compared to the spring value, the winter MAEEC was lower owing to high EC concentrations and was more sensitive to the chemical species from anthropogenic emissions. Furthermore, the NO difference among the sites (Fig. 6a) was much larger than that of K+, Cl− and SO because of the combustion of fossil fuels at the Chengyu city clusters inside the basin. The spatial heterogeneity in the (NO SO (K Cl NO SO ratio in winter was more significant than that in spring, and winter MAEEC evidently increased as the ratio from the TP to basin sites. Therefore, emissions from fossil fuel combustion may be a key influence on winter MAEEC.
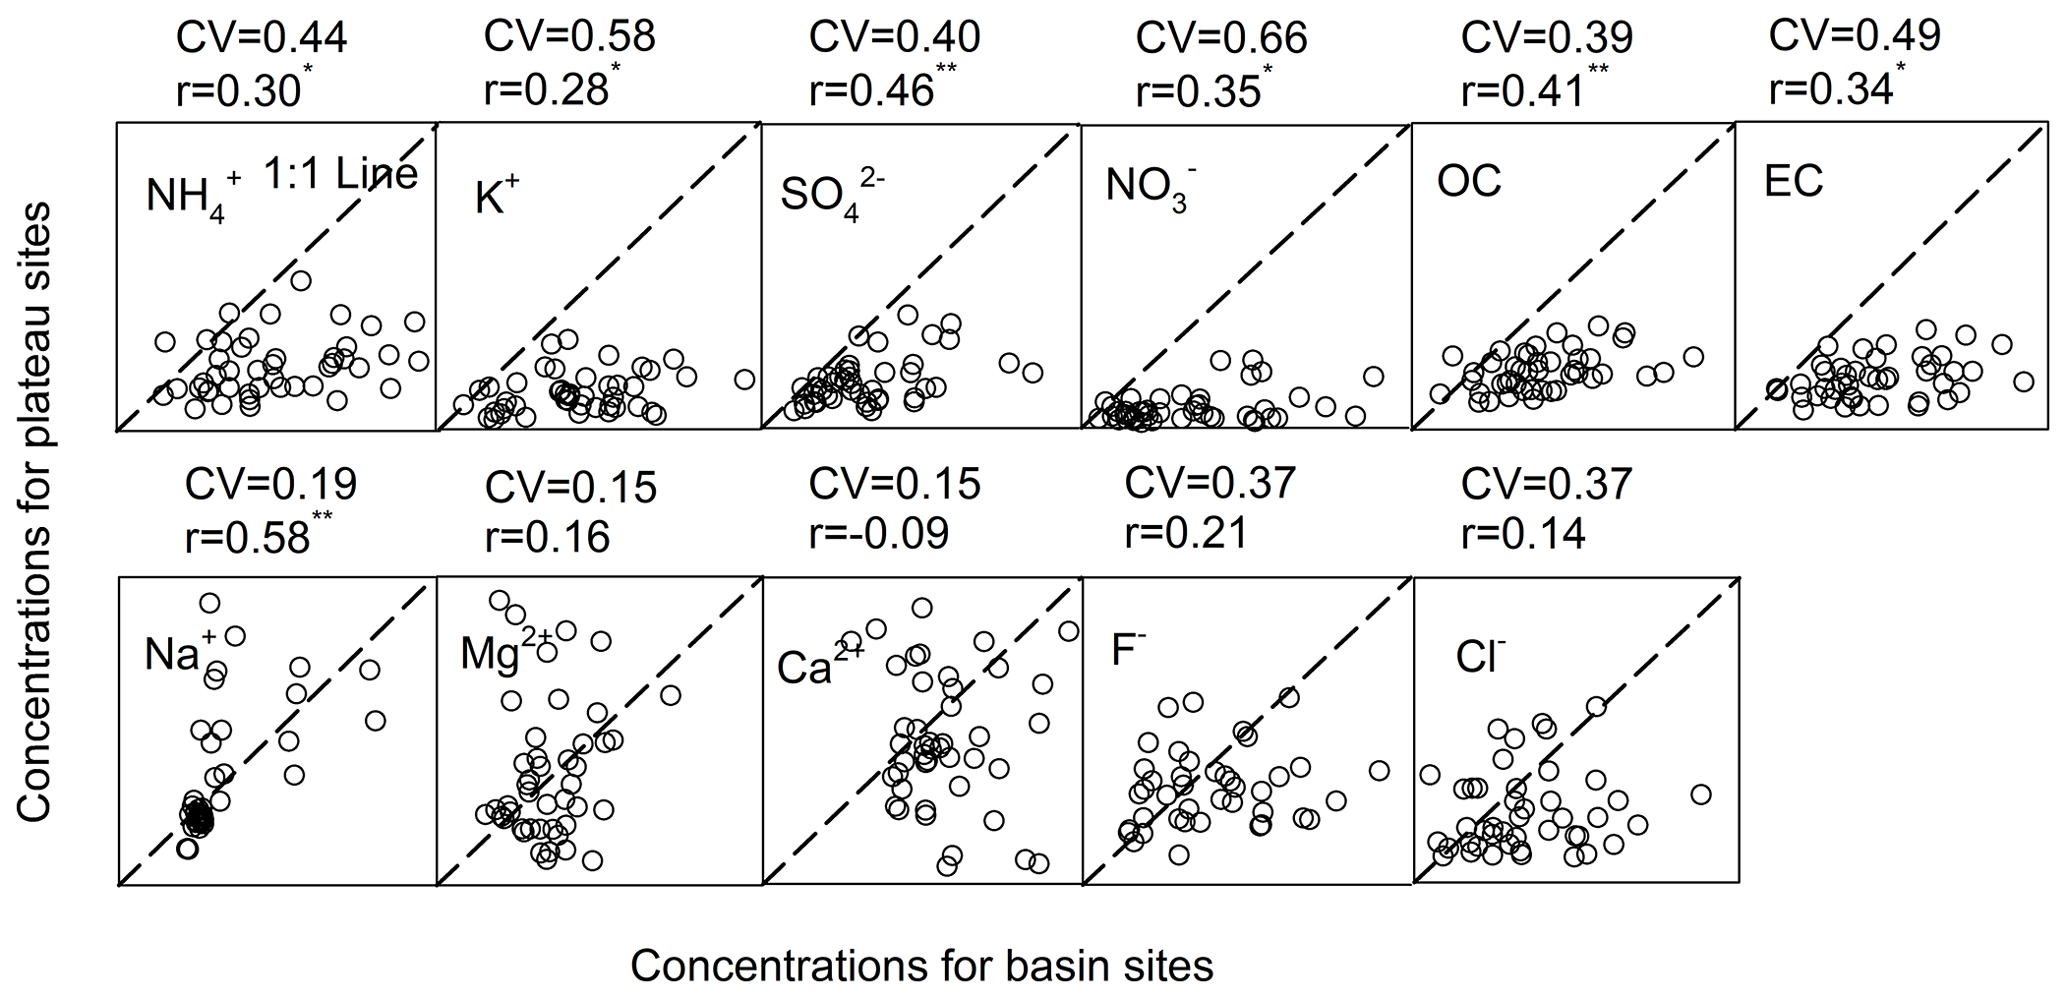
Figure 9Relationships of PM1 chemical components concentrations in spring between basin (horizontal axes, including Chengdu and Sanbacun) and plateau sites (vertical axes, including Wenchuan, Lixian, Maerkang and Hongyuan). The correlation coefficients (r) with asterisk and double asterisk superscripts passed the significance level of 0.05 and 0.01, respectively.
The above paragraphs separately analyse the LAE of BrC and EC and their variations as chemical species, and the change in radiative forcing of BrC relative to EC (f) from Chengdu to Hongyuan is shown in Fig. 7a to reveal the mechanism. Parameter (f) reflects the light absorption strength of BrC at shorter wavelengths compared to that of EC aerosols at all wavelengths. The much higher f values indicate that the radiative forcing of BrC aerosols is much stronger for similar EC radiate forcing; thus, this parameter can be used to better understand the radiative forcing of secondary aerosols relative to primary aerosols at a specific location. The altitude (AT) increased by 3 km, and the median f increased from approximately 0.10 inside the basin to 0.42 over eastern TP. The relationship between f and altitude can be parameterised as follows:
A few studies have found that the direct radiative forcing of BrC (BrC + EC) increases with altitude because the concentration of BrC decreases more slowly with altitude than that of EC (Liu et al., 2014, 2015; Zeng et al., 2020; Zhang et al., 2017). Therefore, we also checked the median ratio variations from the basin to plateau sites during the campaign (Fig. 7b). The ratio changed within the range of 2–4, and the 75th percentile of the ratio increased more significantly than the median values from the basin to plateau sites. Therefore, the increased f from the western SCB to eastern TP may be closely related to more secondary formation and fewer primary emissions over the TP than over the SCB (see also Fig. 5c).
As previously mentioned, the MAE of carbonaceous aerosols largely depends on emission sources. The PMF receptor model is widely used to apportion the sources influencing air pollutants at a specific site based on the fingerprints of the sources; for example, K+ and Cl− are usually used as tracers for BB and CC, respectively (Tao et al., 2016). The PMF analysis was conducted in this study for each season. Motor vehicles, biomass and coal burning, dust, sea salt, and secondary formations were found to be the main sources at the six sites. Figure 8 shows mass concentrations of species for each source at each site apportioned using the PMF model in winter during the campaign. The PMF results for the other seasons are shown in Figs. S7–S9. The winter NO concentrations for secondary nitrate decreased from 3.44 µg m−3 in Sanbacun to 0.07 µg m−3 in Maerkang, which is more heterogeneous than that in summer and autumn. As a main source inside the SCB, the winter secondary nitrate is in response to the intensive mixing between motor vehicle emissions and other primary pollutants trapped inside the basin by strong capping inversion (Feng et al., 2020). Additionally, high humidity inside the SCB facilities secondary nitrate formation, and the average nitrogen oxidation ratio in Sichuan (average RH = 80 %) is 3.1 times of that in winter in Beijing (average RH = 27 %) (Wang et al., 2021). EC aerosols from intensive human activities inside the SCB are easily aged by coating the secondary-formed nitrate in winter, which further enhances basin EC light absorption. The latest study by Zhang et al. (2022) found that light absorption and radiative forcing of BC coated with inorganic salts are much stronger than of that inside organic materials. The chemical species (K+, Cl−) from BB and CC declined from the basin to plateau sites; however, the declining ranges in the warm seasons (summer and autumn) were more significant than those in the cold seasons (spring and winter) because of the use of more fuel for heating over the TP. Therefore, the primary BrC from BB and CC for winter heating over the TP may partly contribute to strong TP BrC light absorption.
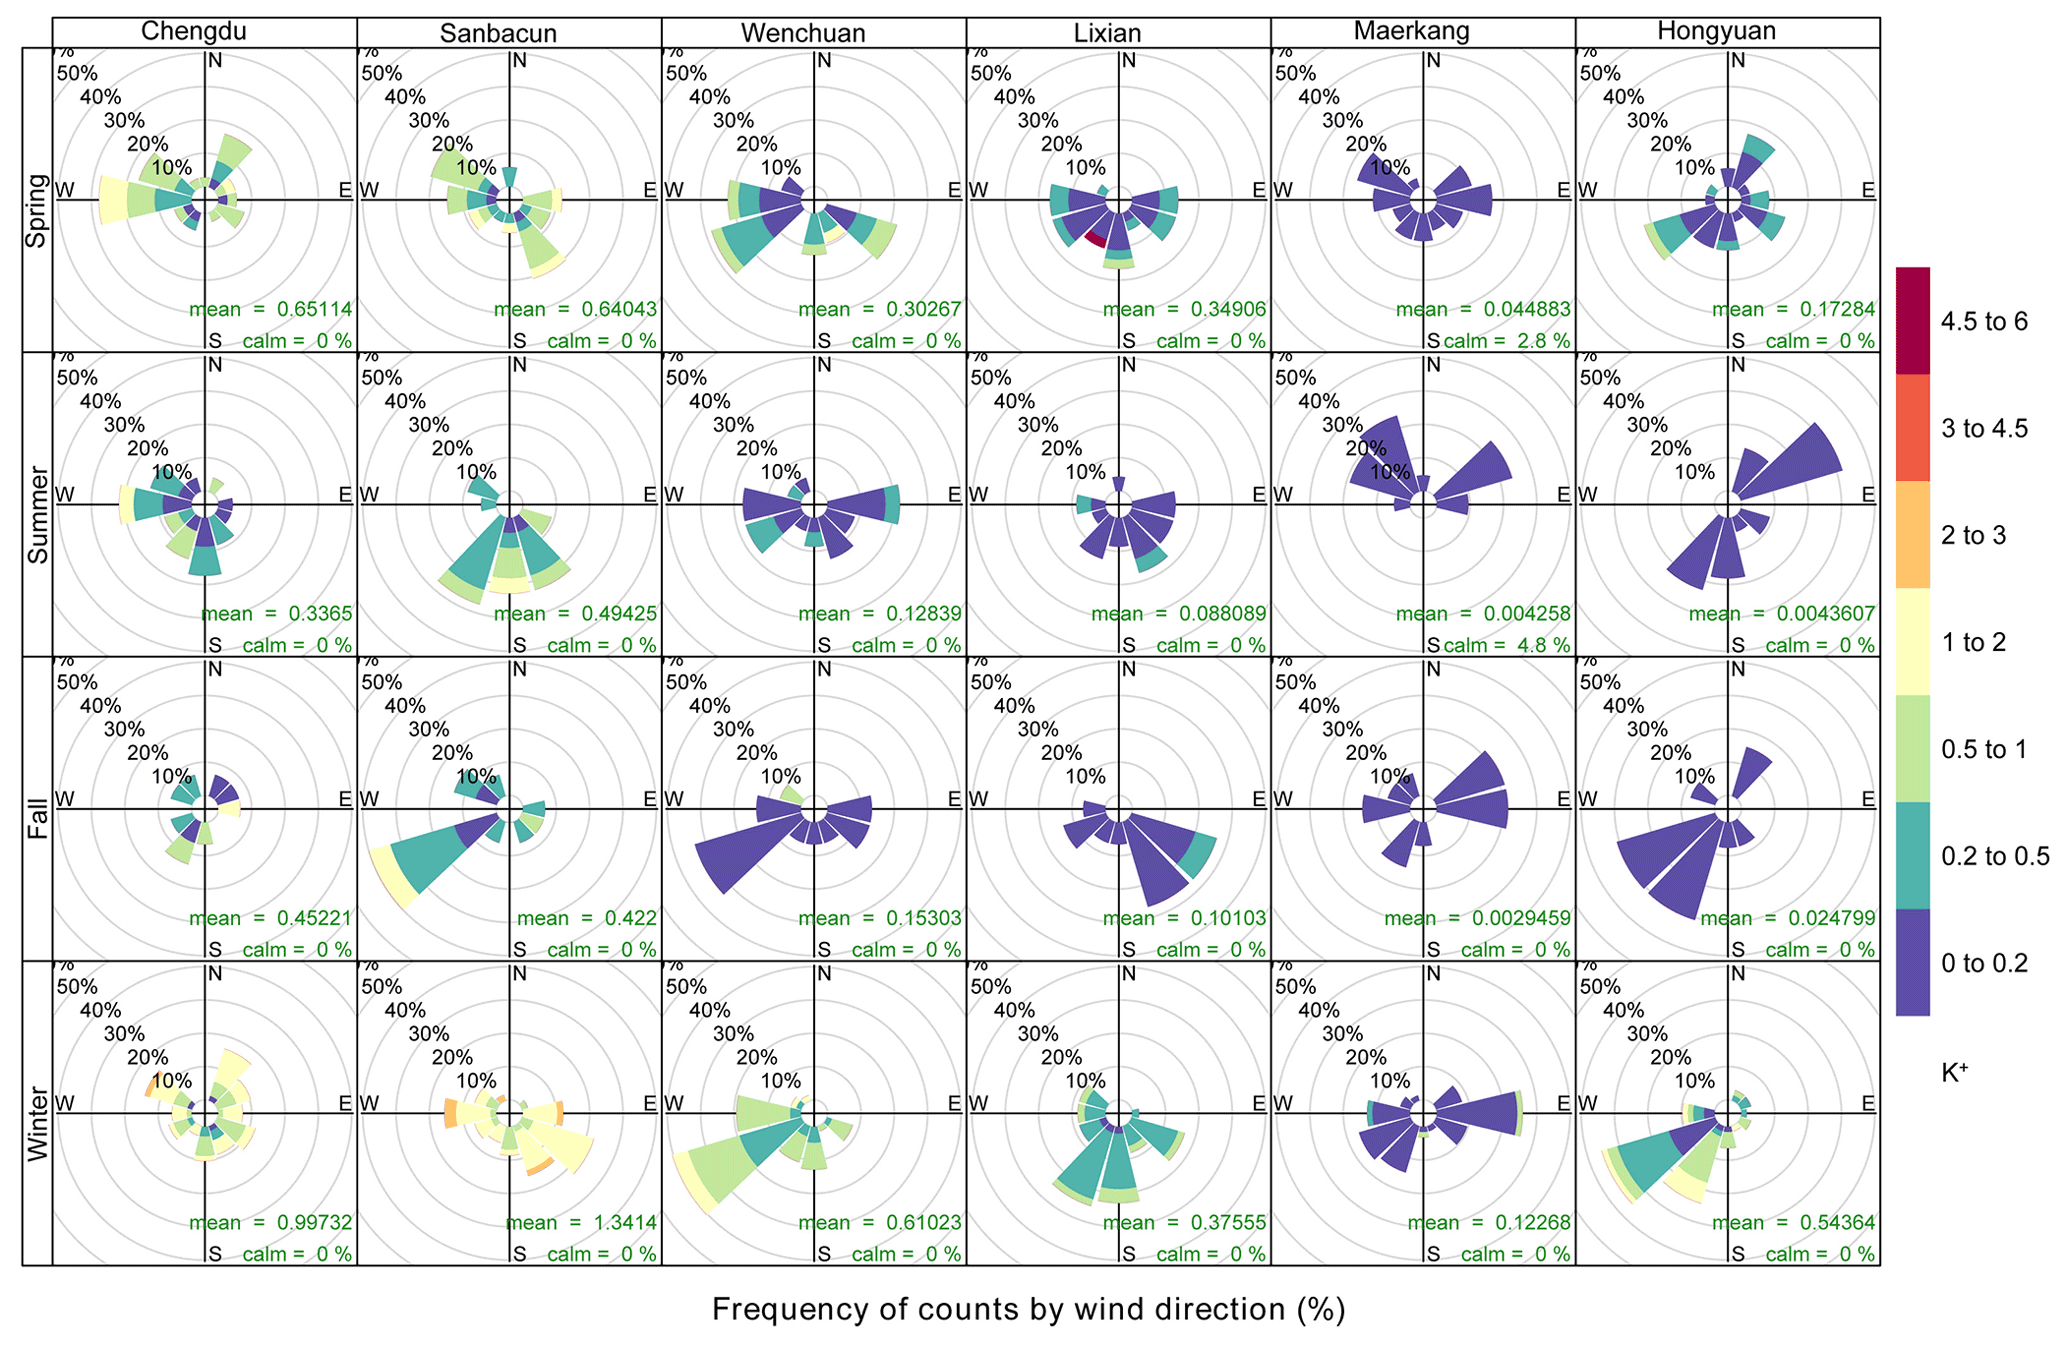
Figure 10K+ pollution rose in the four seasons at the six sites along the ESTP. Mean K+ concentrations and calm frequencies also were given in each subplot.
3.3 Impacts of regional and long-range transport on the light absorption of aerosols
Fresh aerosol particles are gradually aged by mixing with other pollutants during long-range transport, thereby enhancing their light absorption and radiative forcing. The similarities of the major chemical species between the two sites should represent regional air pollution, whereas the differences should reflect local source impacts. The comparisons between basin (Chengdu, Sanbacun) and plateau sites (Wenchuan, Lixian, Maerkang, Hongyuan) related to the average mass concentrations of water-soluble ions and carbonaceous species in the four seasons are shown in Figs. 9 and S10–S12. The numerical ranges between the two axes of each subplot were set to be equal to more clearly observe the spatial heterogeneity of the chemical species in the region. The combination of the CV and correlation coefficients can be used to better understand intra-location variability (Wilson et al., 2005). The CV was between 0 and 1 (Eq. 1), where a smaller value represented a more uniform particle concentration. Moderate differences and relatively high CV values (0.22–0.75) were observed for the chemical species from anthropogenic sources (NH, K+, SO, NO, F−, Cl−, OC and EC) in the four seasons. The differences indicated limited similarities between the basin and plateau sites, and the discrepancies were in major anthropogenic sources. The spatial heterogeneity of K+ and NO is more evident than that of the other species in the four seasons, which is primarily related to more BB and vehicle emissions inside the SCB (Zhao et al., 2021). The weak inter-regional transport between western SCB and eastern TP suggested that the light absorption of carbonaceous aerosols over the TP is rarely influenced by pollutants from the SCB. Furthermore, the CV values for K+, NO and EC in winter were the lowest among the seasons because of increased BB and CC for winter heating over the TP. Unlike CV, a high correlation coefficient for a specific chemical component does not necessarily indicate uniformity, which may suggest source similarity between sites. The correlation largely depended on the season (Figs. 9 and S10–S12). The strong correlations for NH, K+, SO, NO, OC and EC in spring and winter implied that basin and plateau sites shared similar sources for the species, whereas weak correlations for NO, OC and EC in summer and autumn indicated impacts of dissimilar sources between the SCB and TP.
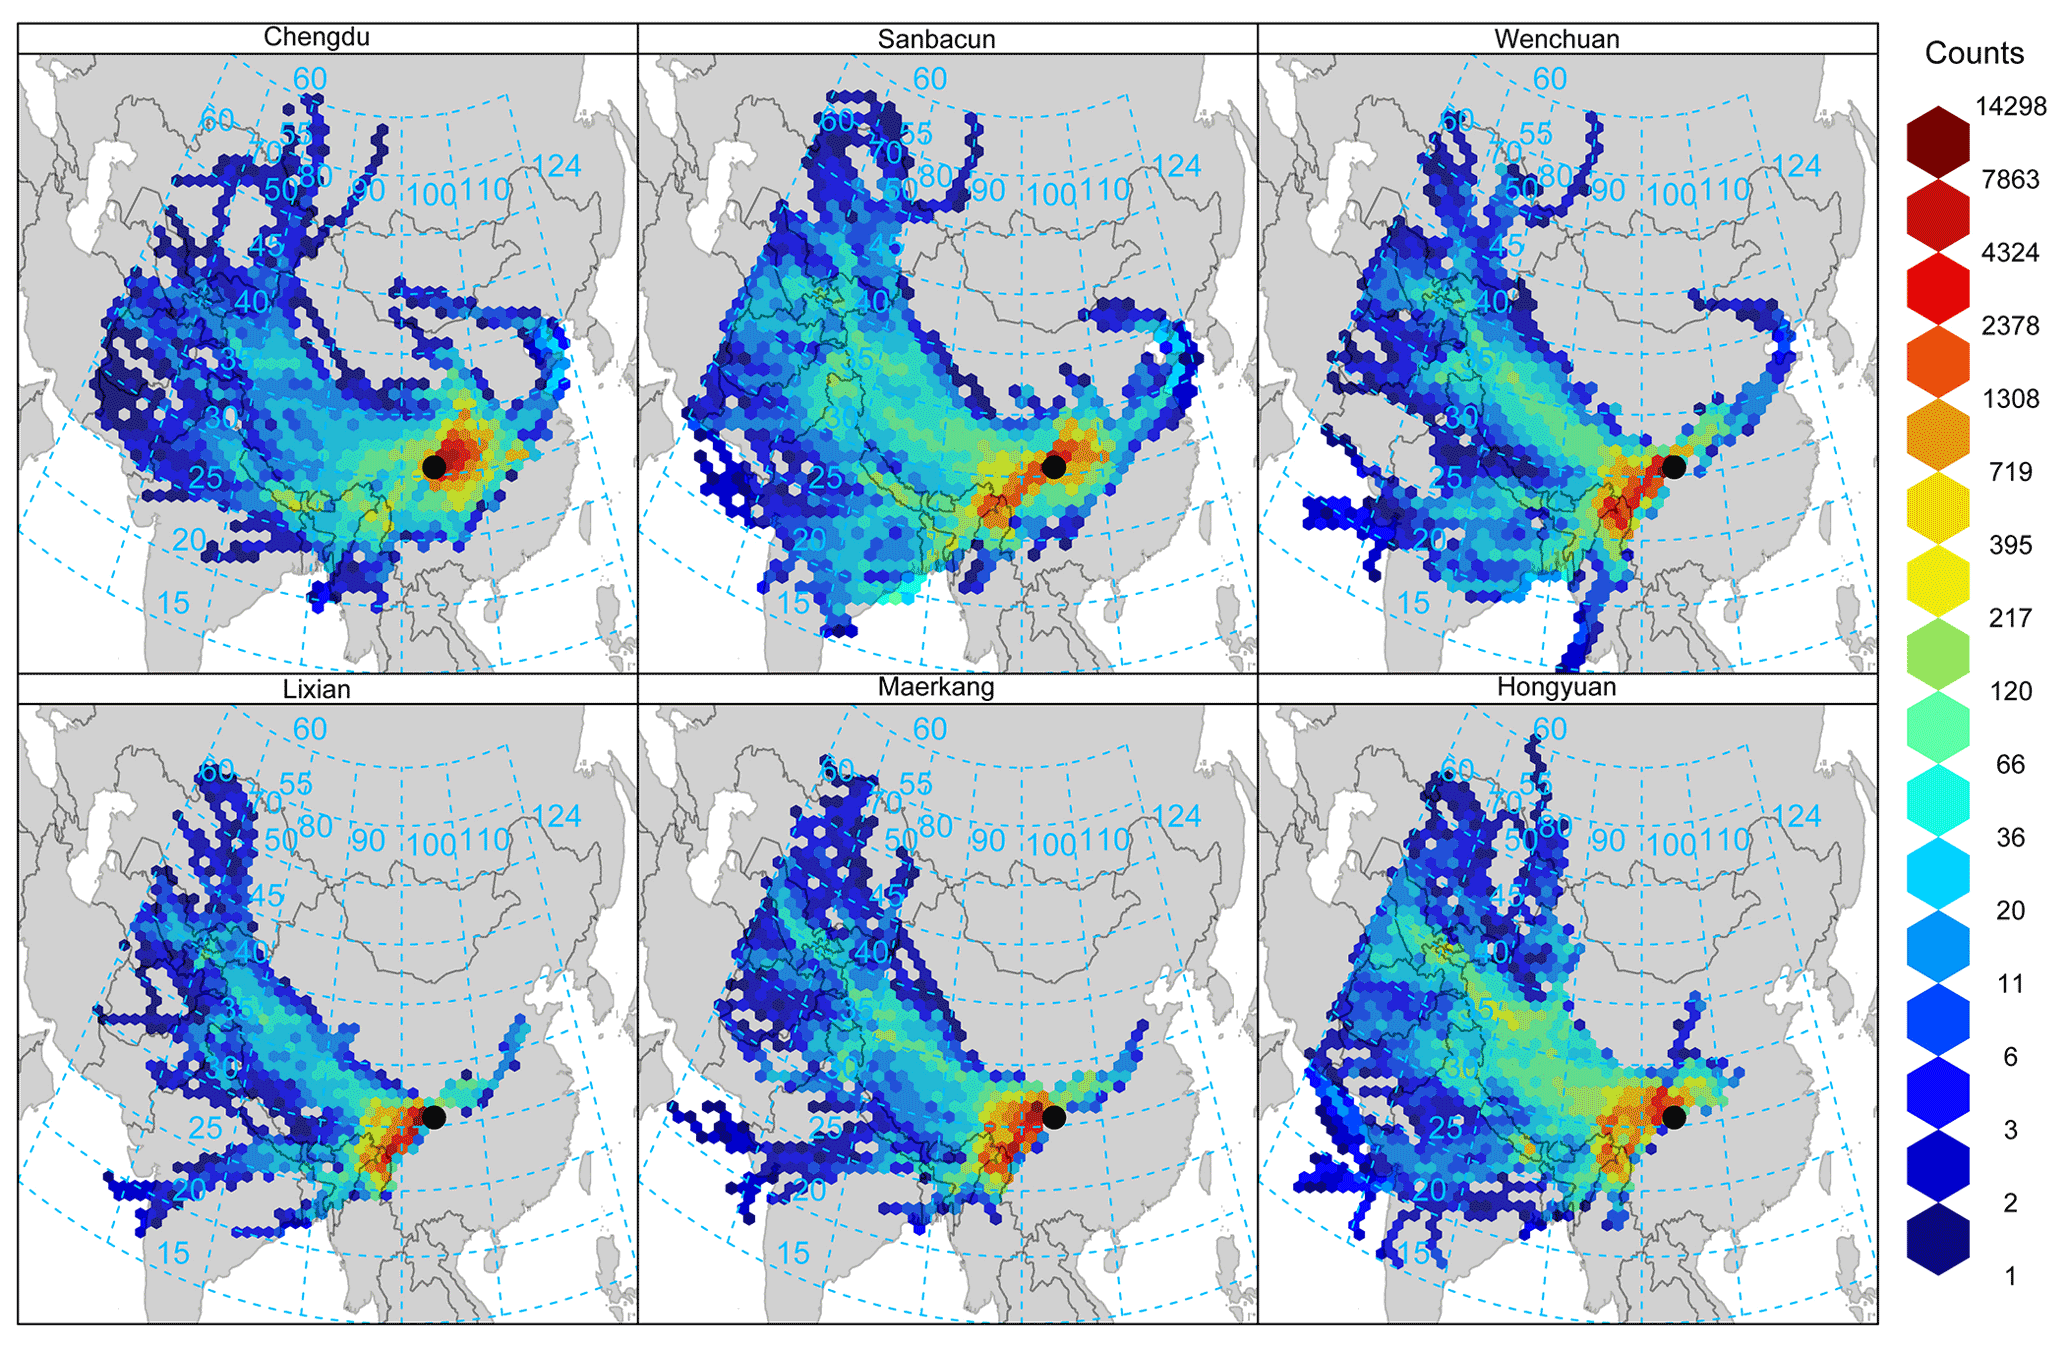
Figure 11Gridded back-trajectory frequencies with hexagonal binning in winter at the six sites from the western Sichuan Basin to the Tibetan Plateau. The map is a reproduction from Google Maps with added the trajectory frequencies. Copyright © Google Maps.
Compared to the species from anthropogenic sources, the lowest CV values for Na+, Mg2+ and Ca2+ among the species indicated that they were more comparable between the basin and plateau sites. Furthermore, changes in Na+ values were more synchronous than those of Mg2+ and Ca2+ in summer and autumn. Na+ concentrations were found to be high in salt-rich dust from saline soils (Quick and Chadwick, 2011). Dust events frequently occurred in spring and winter over the TP and northwestern China, where saline and alkaline land and dried salt-lakes are located (Jiang et al., 2021; Zhang et al., 2009; Zhang et al., 2021). Thus, the weak correlations for Na+, Mg2+ and Ca2+ values in spring and winter may suggest local and regional dust plume impacts. Therefore, the lack of consideration of mineral dust impacts in the separation of BrC light absorption from total aerosol absorption (Eq. 5) might cause some errors. The errors should be much smaller than those of the studies on the northern or northeastern TP close to the Taklimakan and Gobi deserts.
MODIS active fire data suggest that BB is primarily conducted in South Asia around our study regions, which was more frequent in cold than warm seasons during our campaign (Fig. S13). The PM mass concentrations in conjunction with wind data can be used to identify the local PM origins. Figure 10 shows that K+ pollution increased in the four seasons at the six sites. The back-trajectory calculation can provide PM origins from long-range transport. Figures 11 and S14–S16 illustrate the gridded back-trajectory frequencies in the four seasons. K+ stratification in warm seasons was more evident than that in cold seasons, implying that there were substantial BB plumes over the TP in spring and winter. The change in wind direction from the SCB to the TP during warm seasons is not evident. However, the predominant wind direction is northwest–southeast in cold seasons for the basin sites, whereas it primarily focusses on the southwest for the plateau sites (Fig. 10). The highest back-trajectory frequency was also in the southwest of the sampling sites in winter (Fig. 11). Therefore, the BB emissions originating from South Asia are transported to the eastern TP by highly frequent southwesterly winds, thus inducing high K+ concentrations in spring and winter. BrC aerosols from intensive BB in South Asia are gradually aged by internal or external mixing with other anthropogenic emissions during long-range transport. The light absorption of aged BrC aerosols over the TP is enhanced by coating with inorganic components (Zhang et al., 2022), which may partly contribute to stronger BrC light absorption at the plateau sites than that at the basin sites. Unlike the eastern TP, the carbonaceous aerosols in the western SCB are regionally transported from central and eastern SCB, as can be seen from the increase in pollution and back-trajectory frequencies. The aerosols accumulate and stagnate at the front areas of the mountains because of the terrain block; thus, light absorption by EC aerosols emitted from motor vehicles is enhanced by the intensive mixing among the air pollutants.
The Tibetan Plateau is surrounded by the three highly polluted regions, i.e. the IGP, Taklimakan and Gobi deserts (TGD), and the SCB. However, previous studies have primarily focussed on the south (IGP) and north slopes (TGD). The first in situ aerosol measurements were conducted on the ESTP to study the elevation-dependent light absorption by carbonaceous aerosols from the highly polluted SCB to the pristine TP. The source and origin impacts on light absorption by aerosols were also discussed by combining with PMF and HYSPLIT results.
The EC and BrC light absorptions were separated using a simple two-component model. The BrC light absorption coefficient at 405 nm, accounting for that of TC (sum of EC and BrC), was found to increase from ∼ 20 % inside the SCB to ∼ 50 % over the TP. The BrC MAE over eastern TP was 2–3 times higher than that inside the SCB, with strong elevation-dependent absorption. The most significant elevation-dependent winter MAEBrC was closely related to the high ratio of SOC to POC, meaning that there was more OC from secondary formation than from primary emissions at high altitudes. In contrast to BrC, winter MAEEC declined from the highly polluted SCB to the clean TP because of source differences between the two regions. Substantial urban emissions (vehicles, industries, etc.) were trapped inside the deep SCB owing to poor dispersion and frequent temperature inversion during cold seasons. High primary emissions and weak dispersion conditions were favourable for mixing and aerosol ageing to enhance light absorption inside the basin. The median radiative forcing of BrC relative to EC increased from approximately 0.10 inside the basin to 0.42 over eastern TP, which was associated with the ratio. Therefore, the enhanced radiative forcing of BrC relative to EC occurred because OC concentration decreased more slowly with altitude than the EC concentration.
The first aerosol field experiment was conducted in a specific study region; however, only six sampling sites from the deep SCB to eastern TP were used in this study. More measurement sites should be established to better understand the chemical composition and light properties of aerosols in a unique region. The light absorption coefficients and efficiencies of BrC could not be separated from those of TC in summer and autumn at Maerkang and Hongyuan because of instrument failure, which limited the revelation of elevation-dependent light absorption. Furthermore, replacing BrC, OC mass concentration was used to estimate MAEBrC, which may cause significant uncertainty; these errors are expected to be corrected in future studies.
Raw data sets (Zhao et al., 2022, https://doi.org/10.5281/zenodo.6474199) used in this paper are available at https://zenodo.org/record/6474199#.YmCn_YtByUk (last access: 12 August 2022).
The supplement related to this article is available online at: https://doi.org/10.5194/acp-22-14693-2022-supplement.
SZ and YY designed the study. SZ analysed the data with help from YY, JC and SK. DY and LD collected and analysed data during the campaign. SQ conducted the field experiment.
The contact author has declared that none of the authors has any competing interests.
Publisher's note: Copernicus Publications remains neutral with regard to jurisdictional claims in published maps and institutional affiliations.
This research has been supported by the National Natural Science Foundation of China, the National Outstanding Youth Science Fund Project of National Natural Science Foundation of China (grant nos. 42075185 and 41605103), the Youth Innovation Promotion Association of the Chinese Academy of Sciences (grant no. Y2021111), the Science Fund for Distinguished Young Scholars of Gansu Province (grant no. 20JR10RA037), and the Key Science and Technology Foundation of Gansu Province (grant no. 18JR2RA005).
This paper was edited by Graciela Raga and reviewed by two anonymous referees.
Bond, T. C.: Spectral dependence of visible light absorption by carbonaceous particles emitted from coal combustion, Geophys. Res. Lett., 28, 4075–4078, 2001.
Bond, T. C., Streets, D. G., Yarber, K. F., Nelson, S. M., Woo, J. H., and Klimont, Z.: A technology-based global inventory of black and organic carbon emissions from combustion, J. Geophys. Res.-Atmos., 109, D14203, https://doi.org/10.1029/2003J, 2004.
Chen, L.-W. A., Chow, J. C., Wang, X. L., Robles, J. A., Sumlin, B. J., Lowenthal, D. H., Zimmermann, R., and Watson, J. G.: Multi-wavelength optical measurement to enhance thermal/optical analysis for carbonaceous aerosol, Atmos. Meas. Tech., 8, 451–461, https://doi.org/10.5194/amt-8-451-2015, 2015.
Choudhary, V., Rajput, P., Singh, D. K., Singh, A. K., and Gupta, T.: Light absorption characteristics of brown carbon during foggy and non-foggy episodes over the Indo-Gangetic Plain, Atmos. Pollut. Res., 9, 494–501, 2018.
Chow, J. C., Watson, J. G., Chen, L.-W. A., Chang, M. C. O., Robinson, N. F., Trimble, D., and Kohl, S.: The IMPROVE A Temperature Protocol for Thermal/Optical Carbon Analysis: Maintaining Consistency with a Long-Term Database, J. Air Waste Manage. Assoc., 57, 1014–1023, 2007.
Chung, C. E., Ramanathan, V., and Decremer, D.: Observationally constrained estimates of carbonaceous aerosol radiative forcing, P. Natl. Acad. Sci. USA, 109, 11624–11629, 2012.
Cong, Z. Y. , Kang, S. C., Smirnov, A., and Holben, B.: Aerosol optical properties at Nam Co, a remote site in central Tibetan Plateau, Atmos. Res., 92, 42–48, 2009.
Cong, Z., Kang, S., Kawamura, K., Liu, B., Wan, X., Wang, Z., Gao, S., and Fu, P.: Carbonaceous aerosols on the south edge of the Tibetan Plateau: concentrations, seasonality and sources, Atmos. Chem. Phys., 15, 1573–1584, https://doi.org/10.5194/acp-15-1573-2015, 2015.
Cui, X. Q., Ren, J. W., Wang, Z. B., Yu, G. M., and Yue, G. Y.: Soluble ions in atmospheric PM2.5 over glacier terminus determined by ion chromatography and source analysis, J. Glaciol. Geocryol., 41, 574–578, 2019 (in Chinese).
Duan, A. M. and Wu, G. X.: Change of cloud amount and the climate warming on the Tibetan Plateau, Geophys. Res. Lett., 33, L22704, https://doi.org/10.1029/2006GL027946, 2006.
Feng, X. Y., Wei, S. M., and Wang, S. G.: Temperature inversions in the atmospheric boundary layer and lower troposphere over the Sichuan Basin, China: Climatology and impacts on air pollution, Sci. Total Environ., 726, 138579, https://doi.org/10.1016/j.scitotenv.2020.138579, 2020.
Gao, Y. H., Chen, F., Lettenmaier, D. P., Xu, J. W., Xiao, L. H., and Li, X.: Does elevation-dependent warming hold true above 5000 m elevation? Lessons from the Tibetan Plateau, Clim. Atmos. Sci., 1, 19, https://doi.org/10.1038/s41612-018-0030-z, 2018.
Garrett, T. J. and Zhao, C. F.: Increased Arctic cloud longwave emissivity associated with pollution from mid-latitudes, Nature, 440, 787–789, 2006.
Guo, D. L., Sun, J. Q., Yang, K., Pepin, N., and Xu, Y. M.: Revisiting recent elevation-dependent warming on the Tibetan Plateau using satellite-based data sets, J. Geophys. Res.-Atmos., 124, 8511–8521, 2019.
Guo, D. L., Pepin, N., Yang, K., Sun, J. Q., and Li, D.: Local changes in snow depth dominate the evolving pattern of elevation-dependent warming on the Tibetan Plateau, Sci. Bull., 66, 1146–1150, 2021.
Han, T. T., Liu, X. G., Zhang, Y. H., Gu, J. W., Tian, H. Z., Zeng, L. M., Chang, S.-Y., Cheng, Y. F., Lu, K. D., and Hu, M.: Chemical characteristics of PM10 during the summer in the mega-city Guangzhou, China, Atmos. Res., 137, 25–34, 2014.
Huang, J. P., Minnis, P., Yi, Y. H., Tang, Q., Wang, X., Hu, Y. X., Liu, Z. Y., Ayers, K., Trepte, C., and Winker, D.: Summer dust aerosols detected from CALIPSO over the Tibetan Plateau, Geophys. Res. Lett., 34, L18805, https://doi.org/10.1029/2007GL029938, 2007.
Huang, R. J., Yang, L., Cao, J. J., Chen, Y., Chen, Q., Li, Y. J., Duan, J., Zhu, C. S., Dai, W. T., Wang, K., Lin, C. S., Ni, H. Y., Corbin, J. C., Wu, Y. F., Zhang, R. J., Tie, X. X., Hoffmann, T., O'Dowd, C., and Dusek, U.: Brown carbon aerosol in urban Xi'an, Northwest China: the composition and light absorption properties, Environ. Sci. Technol., 52, 6825–6833, 2018.
Jiang, Y. S., Gao, Y. H., He, C. L., Liu, B. L., Pan, Y. J., and Li, X.: Spatiotemporal distribution and variation of wind erosion over the Tibetan Plateau based on a coupled land-surface wind-erosion model, Aeolian Res., 50, 100699, https://doi.org/10.1016/j.aeolia.2021.100699, 2021.
Kang, S. C., Zhang, Q. G., Qian, Y., Ji, Z. M., Li, C. L., Cong, Z. Y., Zhang, Y. L., Guo, J. M., Du, W. T., Huang, J., You, Q. L., Panday, A. K., Rupakheti, M., Chen, D. L., Gustafsson, O., Thiemens, M. H., and Qin, D. H.: Linking atmospheric pollution to cryospheric change in the Third Pole region: current progress and future prospects, National Sci. Rev., 6, 796–809, 2019.
Kang, S. C., Zhang, Y. L., Qian, Y., and Wang, H. L.: A review of black carbon in snow and ice and its impact on the cryosphere, Earth-Sci. Rev., 210, 103346, https://doi.org/10.1016/j.earscirev.2020.103346, 2020.
Kawamura, K., Kasukabe, H., and Barrie, L. A.: Secondary formation of water-soluble organic acids and alpha-dicarbonyls and their contributions to total carbon and water-soluble organic carbon: Photochemical aging of organic aerosols in the Arctic spring, J. Geophys. Res.-Atmos., 115, D21306, https://doi.org/10.1029/2010JD014299, 2010.
Lau, W. K. M., Kim, M. K., Kim, K. M., and Lee, W. S.: Enhanced surface warming and accelerated snow melt in the Himalayas and Tibetan Plateau induced by absorbing aerosols, Environ. Res. Lett., 5, 025204, https://doi.org/10.1088/1748-9326/5/2/025204, 2010.
Levinson, R., Akbari, H., and Berdahl, P.: Measuring solar re?ectance – part I: defining a metric that accurately predicts solar heat gain, Solar Ener., 84, 1717–1744, 2010.
Li, C. L., Chen, P. F., Kang, S C., Yan, F. P., Hu, Z., Qu, B., and Sillanpää, M.: Concentrations and light absorption characteristics of carbonaceous aerosol in PM2.5 and PM10 of Lhasa city, the Tibetan Plateau, Atmos. Environ., 127, 340–346, 2016.
Liu, X. D. and Chen, B. D.: Climatic warming in the Tibetan Plateau during recent decades, Int. J. Climatol., 20, 1729–1742, 2000.
Liu, H., Pan, X., Liu, D., Liu, X., Chen, X., Tian, Y., Sun, Y., Fu, P., and Wang, Z.: Mixing characteristics of refractory black carbon aerosols at an urban site in Beijing, Atmos. Chem. Phys., 20, 5771–5785, https://doi.org/10.5194/acp-20-5771-2020, 2020.
Liu, J., Scheuer, E., Dibb, J., Diskin, G. S., Ziemba, L. D., Thornhill, K. L., Anderson, B. E., Wisthaler, A., Mikoviny, T., Devi, J. J., Bergin, M., Perring, A. E., Markovic, M. Z., Schwarz, J. P., Campuzano-Jost, P., Day, D. A., Jimenez, J. L., and Weber, R. J.: Brown carbon aerosol in the North American continental troposphere: sources, abundance, and radiative forcing, Atmos. Chem. Phys., 15, 7841–7858, https://doi.org/10.5194/acp-15-7841-2015, 2015.
Liu, J. M., Scheuer, E., Dibb, J., Ziemba, L. D., Thornhill, K. L., Anderson, B. E., Wisthaler, A., Mikoviny, T., Devi, J. J., Bergin, M., and Weber, R. J.: Brown carbon in the continental troposphere, Geophys. Res. Lett., 41, 2191–2195, 2014.
Lu, A. G., Kang, S. C., Li, Z. X., and Theakstone, W. H.: Altitude effects of climatic variation on Tibetan Plateau and its vicinities, J. Earth Sci., 21, 189–198, 2010.
Mountain Research Initiative EDW Working Group.: Elevation-dependent warming in mountain regions of the world, Nat. Clim. Change, 5, 424–430, 2015.
Olson, M. R., Garcia, M. V., Robinson, M. A., Rooy, P. V., Dietenberger, M. A., Bergin, M., and Schauer, J. J.: Investigation of black and brown carbon multiple-wavelength dependent light absorption from biomass and fossil fuel combustion source emissions, J. Geophys. Res.-Atmos., 120, 6682–6697, 2015.
Palazzi, E., Filippi, L., and von Hardenberg, J.: Insights into elevation-dependent warming in the Tibetan Plateau-Himalayas from CMIP5 model simulations, Clim. Dynam., 48, 3991–4008, 2017.
Peng, C., Yang, F. M., Tian, M., Shi, G. M., Li, L., Huang, R. J., Yao, X. J., Luo, B., Zhai, C. Z., and Chen, Y.: Brown carbon aerosol in two megacities in the Sichuan Basin of southwestern China: Light absorption properties and implications, Sci. Total Environ., 719, 137483, https://doi.org/10.1016/j.scitotenv.2020.137483, 2020.
Pepin, N., Deng, H. J., Zhang, H. B., Zhang, F., Kang, S. C., and Yao, T. D.: An examination of temperature trends at high elevations across the Tibetan Plateau: The use of MODIS LST to understand patterns of elevation-dependent warming, J. Geophys. Res.-Atmos., 124, 5738–5756, 2019.
Quick, D. J. and Chadwick, O. A.: Accumulation of salt-rich dust from Owens Lake playa in nearby alluvial soils, Aeolian Res., 3, 23–29, 2011.
Ramanathan, V. and Carmichael, G.: Global and regional climate changes due to black carbon, Nat. Geosc., 1, 221–227, 2008.
Rangwala, I. and Miller, J. R.: Climate change in mountains: a review of elevation-dependent warming and its possible causes, Clim. Change, 114, 527–547, 2012.
Stein, A. F., Draxler, R. R., Rolph, G. D., Stunder, B. J. B., Cohen, M. D., and Ngan, F.: NOAA’s HYSPLIT Atmospheric Transport and Dispersion Modeling System, Bull. Amer. Meteor. Soc., 96, 2059–2077, https://doi.org/10.1175/BAMS-D-14-00110.1, 2015.
Tao, J., Zhang, L. M., Zhang, R. J., Wu, Y. F., Zhang, Z. S., Zhang, X. L., Tang, Y. X., Cao, J. J., and Zhang, Y. H.: Uncertainty assessment of source attribution of PM2.5 and its water-soluble organic carbon content using different biomass burning tracers in positive matrix factorization analysis-a case study in Beijing, China, Sci. Total Environ., 543, 326–335, 2016.
Tian, P., Zhang, L., Ma, J., Tang, K., Xu, L., Wang, Y., Cao, X., Liang, J., Ji, Y., Jiang, J. H., Yung, Y. L., and Zhang, R.: Radiative absorption enhancement of dust mixed with anthropogenic pollution over East Asia, Atmos. Chem. Phys., 18, 7815–7825, https://doi.org/10.5194/acp-18-7815-2018, 2018.
Turpin, B. J. and Lim, H. J.: Species contributions to PM2.5 mass concentrations: revisiting common assumptions for estimating organic mass, Aerosol Sci. Technol., 35, 602–610, 2001.
Viidanoja, J., Sillanpaa, M., Laakia, J., Kerminen, V. M., Hillamo, R., Aarnio, P., and Koskentalo, T.: Organic and black carbon in PM2.5 and PM10: 1 year of data from an urban site in Helsinki, Finland, Atmos. Environ., 36, 3183–3193, 2002.
Wang, H., Tian, M., Chen, Y., Shi, G., Liu, Y., Yang, F., Zhang, L., Deng, L., Yu, J., Peng, C., and Cao, X.: Seasonal characteristics, formation mechanisms and source origins of PM2.5 in two megacities in Sichuan Basin, China, Atmos. Chem. Phys., 18, 865–881, https://doi.org/10.5194/acp-18-865-2018, 2018.
Wang, Y. J., Hu, M., Hu, W., Zheng, J., Niu, H. Y., Fang, X., Xu, N., Wu, Z. J., Guo, S., Wu, Y. S., Chen, W. T., Lu, S. H., Shao, M., Xie, S. D., Luo, B., and Zhang, Y. H.: Secondary formation of aerosols under typical high-humidity conditions in wintertime Sichuan Basin, China: A contrast to the North China Plain, J. Geophys. Res.-Atmos., 126, e2021JD034560, https://doi.org/10.1029/2021JD034560, 2021.
Wilson, J. G., Kingham, S., Pearce, J., and Sturman, A. P.: A review of intraurban variations in particulate air pollution: implications for epidemiological research, Atmos. Environ., 39, 6444–6462, 2005.
Wu, G. M., Wan, X., Gao, S. P., Fu, P. Q., Yin, Y. G., Li, G., Zhang, G. S., Kang, S. C., Ram, K., and Cong, Z. Y.: Humic-like substances (HULIS) in aerosols of central Tibetan Plateau (Nam Co, 4730 m asl): abundance, light absorption properties, and sources, Environ. Sci. Technol., 52, 7203–7211, 2018.
Xu, B. Q., Cao, J. J., Hansen, J., Yao, T. D., Joswia, D. R., Wang, N. L., Wu, G. J., Wang, M., Zhao, H. B., Yang, W., Liu, X. Q., and He, J. Q.: Black soot and the survival of Tibetan glaciers, P. Natl. Acad. Sci. USA, 106, 22114–22118, 2009.
Yin, D. Y., Zhao, S. P., Qu, J. J., Yu, Y., Kang, S. C., Ren, X. L., Zhang, J., Zou, Y., Dong, L. X., Li, J. L., He, J. J., Li, P., and Qin, D. H.: The vertical profiles of carbonaceous aerosols and key influencing factors during wintertime over western Sichuan Basin, China, Atmos. Environ., 223, 117269, https://doi.org/10.1016/j.atmosenv.2020.117269, 2020.
You, Q. L., Chen, D. L., Wu, F. Y., Pepin, N., Cai, Z. Y., Ahrens, B., Jiang, Z. H., Wu, Z. W., Kang, S. C., and AghaKouchak A.: Elevation dependent warming over the Tibetan Plateau: Patterns, mechanisms and perspectives, Earth-Sci. Rev. 210, 103349, https://doi.org/10.1016/j.earscirev.2020.103349, 2020.
Zeng, L. H., Zhang, A. X., Wang, Y. H., Wagner, N. L., Katich, J. M., Schwarz, J. P., Schill, G. P., Brock, C., Froyd, K. D., Murphy, D. M., Williamson, C. J., Kupc, A., Scheuer, E., Dibb, J., and Weber, R. J.: Global measurements of brown carbon and estimated direct radiative effects, Geophys. Res. Lett., 47, e2020GL088747, https://doi.org/10.1029/2020GL088747, 2020.
Zhang, L., Tang, C. G., Huang, J. P., Du, T., Guan, X., Tian, P. F., Shi, J. S., Cao, X. J., Huang, Z. W., Guo, Q., Zhang, H. T., Wang, M., Zeng, H. Y., Wang, F. Y., and Dolkar, P.: Unexpected high absorption of atmospheric aerosols over a western Tibetan Plateau site in summer, J. Geophys. Res.-Atmos., 126, e2020JD033286, https://doi.org/10.1029/2020JD033286, 2021.
Zhang, J., Wang, Y. Y., Teng, X. M., Liu, L., Xu, Y. S., Ren, L. H., Shi, Z. B., Zhang, Y., Jiang, J. K., Liu, D. T., Hu, M., Shao, L. Y., Chen, J. M., Martin, S. T., Zhang, X. Y., and Li, W. J.: Liquid-liquid phase separation reduces radiative absorption by aged black carbon aerosols, Commun. Earth Environ., 3, 128, https://doi.org/10.1038/s43247-022-00462-1, 2022.
Zhang, X. Y., Zhuang, G. S., Yuan, H., Rahn, K. A., Wang, Z. F., and An, Z. S.: Aerosol particles from dried salt-lakes and saline soils carried on dust storms over Beijing, Terrest. Atmos. Ocean. Sci., 20, 619–628, 2009.
Zhang, Y. Z., Forrister, H., Liu, J. M., Dibb, J., Anderson, B., Schwarz, J. P., Perring, A. E., Jimenez, J. L., Campuzano-Jost, P., Wang, Y. H., Nenes, A., and Weber, R. J.: Top-of-atmosphere radiative forcing affected by brown carbon in the upper troposphere, Nat. Geosci., 10, 486–489, 2017.
Zhao, C. F., Yang, Y. K., Fan, H., Huang, J. P., Fu, Y. F., Zhang, X. Y., Kang, S. C., Cong, Z. Y., Letu, H., and Menenti, M.: Aerosol characteristics and impacts on weather and climate over the Tibetan Plateau, Nat. Sci. Rev., 7, 492–495, 2020.
Zhao, S., Feng, T., Tie, X., and Wang, Z.: The warming Tibetan Plateau improves winter air quality in the Sichuan Basin, China, Atmos. Chem. Phys., 20, 14873–14887, https://doi.org/10.5194/acp-20-14873-2020, 2020.
Zhao, S. P., Yu, Y., Yin, D. Y., Qin, D. H., He, J. J., and Dong, L. X.: Spatial patterns and temporal variations of six criteria air pollutants during 2015 to 2017 in the city clusters of Sichuan Basin, China, Sci. Total Environ., 624, 540–557, 2018.
Zhao, S. P., Yin, D. Y., Yu, Y., Kang, S. C., Ren, X. L., Zhang, J., Zou, Y., and Qin, D. H.: PM1 chemical composition and light absorption properties in urban and rural areas within Sichuan Basin, southwest China, Environ. Pollut., 280, 116970, https://doi.org/10.1016/j.envpol.2021.116970, 2021.
Zhao, S. P., Qi, S. F., Yu, Y., Kang, S. C., Dong, L. X., Chen, J. B., and Yin, D. Y.: Measurement report: The first in-situ PM1 chemical measurements at the steep slope from highly polluted Sichuan Basin to pristine Tibetan Plateau: light absorption of carbonaceous aerosols, and source and origin impacts, Zenodo [data set], https://doi.org/10.5281/zenodo.6474199, 2022.
Zhao, Z. Z., Cao, J. J., Chow, J. C., Watson, J. G., Chen, A. L.-W., Wang, X. L., Wang, Q. Y., Tian, J., Shen, Z. X., Zhu, C. S., Liu, S. X., Tao, J., Ye, Z. L., Zhang, T., Zhou, J. M., and Tian, R. X.: Multi-wavelength light absorption of black and brown carbon at a high-altitude site on the Southeastern margin of the Tibetan Plateau, China, Atmos. Environ., 212, 54–64, 2019.
Zhu, C. S., Cao, J. J., Huang, R. J., Shen, Z. X., Wang, Q. Y., and Zhang, N. N.: Light absorption properties of brown carbon over the southeastern Tibetan Plateau, Sci. Total Environ., 625, 246–251, 2018.