the Creative Commons Attribution 4.0 License.
the Creative Commons Attribution 4.0 License.
 | 18 Nov 2022
Monitoring multiple satellite aerosol optical depth (AOD) products within the Copernicus Atmosphere Monitoring Service (CAMS) data assimilation system
Sebastien Garrigues
Samuel Remy
Julien Chimot
Melanie Ades
Antje Inness
Johannes Flemming
Zak Kipling
Istvan Laszlo
Angela Benedetti
Roberto Ribas
Soheila Jafariserajehlou
Bertrand Fougnie
Shobha Kondragunta
Richard Engelen
Vincent-Henri Peuch
Mark Parrington
Nicolas Bousserez
Margarita Vazquez Navarro
Anna Agusti-Panareda
The Copernicus Atmosphere Monitoring Service (CAMS) provides near-real-time forecast and reanalysis of aerosols using the ECMWF Integrated Forecasting System with atmospheric composition extension, constrained by the assimilation of MODIS and the Polar Multi-Sensor Aerosol Optical Properties (PMAp) aerosol optical depth (AOD). The objective of this work is to evaluate two new near-real-time AOD products to prepare for their assimilation into CAMS, namely the Copernicus AOD (collection 1) from the Sea and Land Surface Temperature Radiometer (SLSTR) on board Sentinel 3-A/B over ocean and the NOAA EPS AOD (v2.r1) from VIIRS on board S-NPP and NOAA20 over both land and ocean. The differences between MODIS (C6.1), PMAp (v2.1), VIIRS (v2.r1), and SLSTR (C1) AOD as well as their departure from the modeled AOD were assessed at the model grid resolution (i.e., level-3) using the 3-month AOD average (December 2019–February 2020 and March–May 2020).
VIIRS and MODIS show the best consistency across the products, which is explained by instrument and retrieval algorithm similarities. VIIRS AOD is frequently lower over the ocean background and higher over biomass burning and dust source land regions compared to MODIS. VIIRS shows larger spatial coverage over land and resolves finer spatial structures such as the transport of Australian biomass burning smoke over the Pacific, which can be explained by the use of a heavy aerosol detection test in the retrieval algorithm. Our results confirm the positive offset over ocean (i) between Terra/MODIS and Aqua/MODIS due to the non-corrected radiometric calibration degradation of Terra/MODIS in the Dark Target algorithm and (ii) between SNPP/VIIRS and NOAA20/VIIRS due to the positive bias in the solar reflective bands of SNPP/VIIRS. SLSTR AOD shows much smaller level-3 values than the rest of the products, which is mainly related to differences in spatial representativity at the IFS grid spatial resolution due to the stringent cloud filtering applied to the SLSTR radiances. Finally, the geometry characteristics of the instrument, which drive the range of scattering angles sampled by the instrument, can explain a large part of the differences between retrievals such as the positive offset between PMAp datasets from MetOp-B and MetOp-A.
- Article
(21401 KB) - Full-text XML
- BibTeX
- EndNote


While aerosol models generally capture the global spatial distribution of aerosols, they can show large differences in aerosol mass budgets at both global and regional scales (Schutgens et al., 2020; Bellouin et al., 2020; Gliß et al., 2021). Sessions et al. (2015) showed that models frequently overestimate low AOD in the case of fine-sized particles and underestimate large AOD in the case of high aerosol load. Uncertainties in the representation of aerosol processes are related to the large horizontal, vertical, and temporal variability of aerosol physicochemical properties (e.g., size, shape, optical properties), the large range of natural and anthropogenic emission sources, and the complex emission, deposition, and aging processes, which are strongly coupled with meteorology (e.g., transport, impact of humidity, convective dust storm) and chemistry (e.g., heterogeneous chemistry) (Rémy et al., 2019; Ryder et al., 2019; Burgos et al., 2020; Sand et al., 2021; Gliß et al., 2021). Reducing these sources of uncertainties represent a crucial challenge to improve the representation of aerosol–climate interactions, which has been identified as one of the research priorities for the development of the next generation of Earth system models (IPCC, 2021).
Aerosol optical depth (AOD) observation, which measures the extinction of light by aerosols from the surface to the top of the atmosphere at a given spectral band, is frequently used to constrain the initial conditions of global aerosol forecasts through data assimilation. Satellite AOD observations offer great potential to resolve the horizontal, vertical, and temporal distribution of aerosols (Levy et al., 2013; Li et al., 2019; Dubovik et al., 2011; Popp et al., 2016). The first satellite AOD datasets were not accurate enough to be assimilated into global aerosol models due to incomplete spatial coverage, coarse spatial resolution (∼ 1∘), limited spectral information content, and uncertainties in cloud detection and radiometric calibration. With the advent of enhanced information content from more recent satellite instruments, more accurate aerosol retrieval datasets have been produced from SEAWIFs (Sayer et al., 2012), MERIS (Vidot et al., 2008), AATSR (North et al., 1999), MISR (Witek et al., 2013), POLDER (Tanré et al., 2011), MODIS (Levy et al., 2013), and VIIRS (Sayer et al., 2018a; Hsu et al., 2019). Most global aerosol data assimilation systems have been relying on MODIS, which has been providing AOD and fine-mode aerosol fraction over land and ocean since 2000. Positive impacts for aerosol near-real-time (NRT) predictions have been shown by Benedetti et al. (2009) for the European Centre for Medium-Range Weather Forecasts (ECMWF) Integrated Forecasting System (IFS) and Zhang et al. (2008, 2014) for the Naval Research Laboratory (NRL) Aerosol Analysis and Prediction System (NAAPS). In addition, Xian et al. (2019) showed that AOD data assimilation improves the consistency between model predictions.
However, AOD retrieval is a challenging task due to the weak aerosol signal that needs to be separated from the larger cloud and surface reflectances and can be affected by various sources of uncertainties. While the Global Climate Observing System (GCOS, Belward and Briggs, 2016) requirement for satellite AOD uncertainty is the larger of 0.03 % or 10 % of AOD, the uncertainty of most AOD satellite products falls between 0.02 and 0.05 AOD. It is frequently larger over land than ocean because of land surface brightness and anisotropy (Sayer et al., 2019). While AOD products generally agree on global average and show consistent temporal variations, they can substantially differ at regional scale (Kinne, 2009; de Leeuw et al., 2015; Wei et al., 2019a; Sogacheva et al., 2020; Schutgens et al., 2020). The analysis of the diversity between AOD products brings additional information on their uncertainty by identifying the retrieval configurations and the surface types which generate the largest differences between products (Schutgens et al., 2020). Over ocean, AOD products exhibit low correlation at low AOD, which can be due to differences in retrieval sensitivities to errors in surface reflectance and cloud contamination (Sayer et al., 2018a; Sogacheva et al., 2020). Sayer et al. (2017) showed that intercalibrating S-NPP/VIIRS with Aqua/MODIS reduces the discrepancies in AOD between the two products and improves the accuracy of VIIRS AOD over ocean. Terra/MODIS Dark Target (DT) AOD, which has a positive offset over ocean related to the calibration degradation of the blue band (Levy et al., 2013), was shown to frequently be the highest among satellite AOD products over oceanic background aerosols (Zhang et al., 2017; de Leeuw et al., 2018; Sogacheva et al., 2020; Sawyer et al., 2020). Over land, products agree better and are more accurate over dark vegetated regions such as in Europe and North America than over bright and heterogeneous surfaces such as in southern Asia, eastern Asia, Africa, and the Middle East (Wei et al., 2019a, b). Larger departures for high AOD values are found for regions and periods dominated by anthropogenic pollution, biomass burning events, or dust outbreaks (Tao et al., 2017; Sogacheva et al., 2020). Sayer et al. (2019) reported larger AOD estimated from the VIIRS Deep Blue (DB) algorithm compared to AOD derived from the MODIS DB over dust source regions (e.g., Sahara, Arabian peninsula, and Taklamakan desert) that the authors relate to the improved aerosol and surface reflectance models used in the VIIRS DB algorithm.
The Copernicus Atmosphere Monitoring Service (CAMS) provides global reanalysis records (Inness et al., 2019) and 5 d global forecasts of aerosols (Rémy et al., 2019), trace gas species (Flemming et al., 2015; Huijnen et al., 2019), and greenhouse gases (GHGs). CAMS relies on the use of the IFS, which combines state-of-the-art meteorological and atmospheric composition models together with a 4D-Var data assimilation scheme. For aerosols, AOD at 550 nm derived from MODIS and the Polar Multi-Sensor Aerosol Optical Properties (PMAp), which is produced by EUMETSAT by exploiting the synergy between GOME-2, IASI, and AVHRR on board MetOp-A, MetOp-B, and MetOp-C, is operationally assimilated into CAMS. Implementing new satellite AOD is a priority for CAMS to maximize the spatial and temporal coverage of the assimilated observations, enhance the accuracy of the analysis, and increase the resilience of the data assimilation system to instrument failures or product disruption. It requires two preparatory steps. First, new satellite observations must be properly evaluated at the model spatial resolution to check their consistency with both the modeled AOD and the other satellite AOD used in the data assimilation system at both regional and global scales. Since biases in the observations and departure between observations can significantly affect the data assimilation outputs (Zhang and Reid, 2006), the spatial and temporal structure of the systematic differences between satellite products needs to be properly understood and quantified in order to account for them in the assimilation process (Dee, 2005). The second step consists of implementing and testing the assimilation of the new products, which includes adapting the bias correction scheme and evaluating the observation error. The present work focuses on the passive monitoring of new satellite AOD datasets (first step), and the impact of their assimilation (second step) will be addressed in a separate paper.
While the uncertainty of satellite AOD products and their diversity have been documented in various studies (Sogacheva et al., 2020; Schutgens et al., 2020), the evaluation was frequently done at the native spatial and temporal resolution of the retrieval (hereafter denoted level-2). No recent studies have evaluated AOD products within a data assimilation system for NRT applications. While some AOD products such as MODIS or the SNPP/VIIRS dataset produced by NASA have been extensively evaluated (Sogacheva et al., 2020; Schutgens et al., 2020), the PMAp dataset, the recent Copernicus NRT Sea and Land Surface Temperature Radiometer (SLSTR) product, and the EPS VIIRS product produced by NOAA have not been intercompared. In addition, most existing intercomparison exercises have compared collocated level-2 satellite retrievals and evaluated them against independent ground measurements such as AERONET. While level-2 accuracy and uncertainty information was probably enough when assimilating a single AOD product, the current challenge to design efficient multi-satellite AOD assimilation strategies is to better understand the diversity of level-3 AOD products at the model grid spatial resolution.
The objective of this work is to evaluate two new AOD products to prepare their future assimilation in CAMS, namely the Copernicus NRT AOD product (collection 1) from SLSTR on board Sentinel 3-A/B over ocean and the NOAA EPS AOD product (v2.r1) from VIIRS on board S-NPP and NOAA20 over both land and ocean. The consistency between MODIS (C6.1), PMAp (v2.1), VIIRS (v2.r1), and SLSTR (C1) AOD products as well as their differences with the modeled AOD were monitored over a 6-month experiment from December 2019 to May 2020. This paper aims at assessing the differences between the satellite AOD products at the IFS model grid resolution (i.e., level-3). All analyses and conclusions reported in this paper hold for level-3 satellite AOD generated for use in the CAMS data assimilation system and may not directly apply to level-2 retrieval. Multi-month AOD averages were compared to characterize the systematic differences between products. The first-guess departure, which represents the differences between the satellite observation and its model-simulated equivalent from the short-range forecast, is a key metric operationally used by numerical weather prediction (NWP) centers to characterize the systematic and random errors between the observation and the model (Bell et al., 2008) as well as to prepare for the implementation of new satellite observations (Rennie et al., 2021). It is used in this work to identify possible inconsistencies between the investigated AOD products within the CAMS data assimilation system.
Section 2 provides a description of the satellite AOD observations used in this work. Section 3 presents the IFS model used in CAMS, the simulation experiments designed for this work, and the intercomparison methodology. The results are summarized in Sect. 4. The main sources of differences between the investigated AOD products are discussed in Sect. 5. Conclusions and recommendations from this work are given in Sect. 6.
The satellite products investigated in this work are the MODIS AOD C6.1 from Terra and Aqua produced by NASA (Levy et al., 2013; Hsu et al., 2019), the NOAA EPS AOD v2.r1 from VIIRS on board S-NPP and NOAA20 produced by NOAA (Laszlo and Liu, 2020), the Copernicus NRT AOD C1 from SLSTR on board Sentinel 3-A/B produced by EUMETSAT with the Optimized Simultaneous Surface Aerosol Retrieval for Copernicus Sentinel-3 (OSSAR-CS3) (EUMETSAT, 2021b),and the PMAp v2.1 dataset derived from the GOME-2, IASI, and AVHRR instruments on board MetOp-A/B/C produced by EUMETSAT (Grzegorski et al., 2022). All these products provide AOD at 0.55 µm for clear-sky and daylight conditions. Below we describe their general characteristics, which are summarized in Table 1. More detailed descriptions along with validation statements can be found in Appendix A.
Table 1Characteristics of the satellite AOD products. All times are given in local solar time (LST).

2.1 AOD product characteristics
2.1.1 MODIS and VIIRS
MODIS AOD produced by NASA (Levy et al., 2013; Hsu et al., 2019) and VIIRS AOD produced by NOAA (Laszlo and Liu, 2020) are used in this work. Note that VIIRS AOD is also produced by NASA (Sayer et al., 2018a; Hsu et al., 2019; Sawyer et al., 2020). It was decided to use the NOAA product because at the time of this work the NASA products only include retrievals from S-NPP, while the NOAA product includes both S-NPP and NOAA20 retrievals.
MODIS and VIIRS are two imaging radiometers which have similar spectral information contents. MODIS AOD has a ∼ 10 km spatial resolution, while the NOAA VIIRS product is retrieved at the native spatial resolution of the VIIRS radiances (0.750 km). The MODIS product includes two distinct retrieval algorithms: the Dark Target (DT) over dark surfaces (ocean, vegetated areas) and the Deep Blue (DB) over dark and bright land surfaces.
Over ocean, the MODIS DT and the VIIRS algorithm have similar characteristics. The ocean surface reflectance is calculated from an ocean surface reflectance model, which represents the contributions from sun-glint, underwater, and whitecap reflections. They exploit similar fine- and coarse-mode aerosol models adopted from Remer et al. (2005).
Over vegetated land surfaces, MODIS (DT and DB) and VIIRS algorithms exploit a similar spectral constraint approach that consists of estimating the surface reflectance in the visible from the shortwave infrared (SWIR, or the red and the SWIR for VIIRS), which is assumed to be slightly affected by atmospheric scattering (Kaufman et al., 1997a, b; Levy et al., 2013; Hsu et al., 2013; Lazlo and Liu, 2020). Over bright and heterogeneous surfaces, both the MODIS DB and the VIIRS algorithms exploit a surface reflectance database to represent the surface anisotropy, the surface spatial variability, and the seasonal changes in the surface reflective properties. MODIS DT uses a combination of a dust model with non-spherical shape and one of three fine-mode aerosol models with spherical shape and different absorbing properties. MODIS DB exploits 10 fine-mode and 5 coarse-mode aerosol models with spherical shape, but conversely to DT a single aerosol model is selected for the optimal solution. Four aerosol models, which are essentially based on the collection 5 MODIS DT models, are used by the VIIRS algorithm that dynamically selects the aerosol model based on the value of the residual between calculated and observed reflectances.
2.1.2 SLSTR
Conversely to MODIS and VIIRS, SLSTR has dual-view capability with a nadir and an oblique view pointing backward at 55∘. The AOD product is provided at a spatial resolution of 9.5 km. Over ocean, the retrieval relies on the spectral information content from all available views, which are used as independent spectral observations. The surface reflectance is pre-calculated using an ocean bidirectional reflectance distribution function (BRDF) model, which includes contributions from glint, white foam, and ocean color and uses the wind speed from the ECMWF forecast. Over land, the retrieval algorithm is a combination of the North et al. (1999) dual-angular model, used in a joint aerosol–surface reflectance fit, and a spectral first guess for the red surface reflectance derived from the NIR or the SWIR radiances (EUMETSAT, 2021b).
2.1.3 PMAp
Conversely to the other products based on a single instrument, PMAp is derived from the synergistic use of the GOME-2 UV–Vis spectrometer, the IASI Fourier transform infrared sounding interferometer, and the AVHRR radiometer on board MetOp platforms. The top-of-atmosphere (TOA) reflectances derived from measurements by the GOME-2 Polarisation Measurement Devices (PMDs) are the main inputs of the AOD retrieval, while AVHRR and IASI observations are exploited for aerosol type identification and cloud detection (Grzegorski et al., 2022). PMAp has a much coarser spatial resolution (5 × 40 km2 for MetOp-A and 10 × 40 km2 for MetOp-B) than the rest of the products.
2.2 Implementation in CAMS
While MODIS and VIIRS retrievals are evaluated over both land and ocean, only ocean retrievals are considered for PMAp and SLSTR because land retrievals of the version 2.1 of PMAp (EUMETSAT, 2021a) and the collection 1 of SLSTR (EUMETSAT, 2021b) were deemed not accurate enough for their assimilation into CAMS. In CAMS, MODIS DT retrievals associated with a quality assessment (QA) equal to 3 over land and larger than or equal to 1 over ocean are selected. DB retrievals associated with QA larger than or equal to 2 are used to gap-fill DT over land. The merged DT–DB product produced by NASA was not used because it was not available when the DB retrieval product was implemented in CAMS. The best-quality retrievals are selected for VIIRS, SLSTR, and PMAp.
3.1 IFS model
CAMS relies on the use of the Integrated Forecasting System (IFS), which is the NWP model developed at ECMWF. IFS includes state-of-the-art atmospheric transport, chemistry (Flemming et al., 2015; Huijnen et al., 2019), and aerosol (Rémy et al., 2019) models and is constrained by a 4D-Var data assimilation scheme. CAMS produces 5 d forecasts and reanalysis of aerosol as well as reactive and greenhouse gases. In the CAMS operational configuration, the simulations are performed at the horizontal spectral resolution of TL511 (equivalent to a grid size of about 40 km) and a vertical resolution of 137 levels (0.01 to 1013 hPa). The IFS cycle 47R1 was used in this work, and the full documentation can be found at https://www.ecmwf.int/en/publications/ifs-documentation (last access: 9 May 2021). Below we provide the main characteristics of the atmospheric composition modeling components of the IFS and the 4DVAR data assimilation scheme.
3.1.1 Atmospheric transport
Advection of the atmospheric tracers is simulated by a semi-Lagrangian scheme (Temperton et al., 2001). A mass fixer has been implemented to ensure conservation of mass of atmospheric species during atmospheric transport (Agustí-Panareda et al., 2014). Vertical mixing is simulated from the IFS turbulent diffusion and convection schemes.
3.1.2 Chemistry
Chemistry is represented using a modified version of the Carbon Bond 05 model (CB05, Yarwood et al., 2015) for the troposphere. More details on the IFS-CB05 system can be found in Flemming et al. (2015) and Huijnen et al. (2019).
3.1.3 Aerosol
Aerosol mass mixing ratios are simulated using a bulk bin scheme (Boucher et al., 2013). A total of 14 species are represented, which includes three size bins for dust and sea salt (defined at 80 % humidity), hydrophilic and hydrophobic organic matter as well as black carbon, sulfate, ammonium, fine-mode nitrate produced from gas–particle partitioning, and coarse-mode nitrate produced from heterogeneous reactions. Emission of sea salt and dust as well as the conversion of sulfur dioxide into sulfate and nitrate are computed online using the IFS meteorological variables. The Global Fire Assimilation System (GFASv1.4) provides globally gridded hourly estimates of biomass burning emission fluxes for reactive gas, greenhouse gases, and aerosols based on assimilated MODIS observations of fire radiative power (FRP) (Kaiser et al., 2012). The rest of the static primary aerosol sources are provided by the CAMS-GLOB-ANT 4.2 emission inventory dataset for anthropogenic sources (Elguindi et al., 2020) and from the CAMS-GLOB-BIO v1.1 emissions inventory, based on the MEGAN model (Sindelarova et al., 2014) with ERA-Interim reanalysis meteorology, for biogenic sources. The emission of secondary organic aerosol is scaled on anthropogenic CO emissions and is added to organic matter emissions (Rémy et al., 2019). More details on aerosol modeling can be found in Rémy et al. (2019, 2022).
3.1.4 Data assimilation
Meteorology and atmospheric composition control variables are initialized using the incremental 4D-Var assimilation scheme implemented in IFS (Courtier et al., 1994). In order to reduce the computational cost and the impact of model nonlinearities, the minimization is achieved at a lower spatial resolution using simplified physics (only atmospheric transport is represented for aerosols and chemistry). The assimilation is performed twice a day over a 12 h assimilation window. For aerosols, MODIS C6.1 is assimilated over ocean and land, and PMAp v2.1 is assimilated over ocean only. A thinning at 0.5 ∘ spatial resolution is applied to both MODIS and PMAp to reduce the number of observations and minimize the impacts of horizontal correlation on the observation error. A variational bias correction scheme (Dee, 2004) is applied to PMAp, and MODIS is used to anchor the bias correction, i.e., not bias-corrected. The aerosol data assimilation scheme is further described in Benedetti et al. (2009).
3.2 CAMS AOD performances
The evaluation of the CAMS cycle 47R1 against AERONET shows a positive bias at global scale, which is higher over North America, and an underestimation of dust but with large regional variability (e.g., overestimation over the Sahara and underestimation in the Sahel and the Mediterranean region) (Schulz et al., 2020). The burden of fine-mode aerosols, in particular that of sulfate, appears to be generally too high.
3.3 Experiment design
IFS was run from 1 December 2019 to 30 May 2020 using the CAMS operational configuration. The experiments were initialized from a past experiment with a similar configuration. VIIRS and SLSTR AOD were passively monitored, while MODIS and PMAp AOD were assimilated. For VIIRS, a superobbing (Janjić et al., 2018) at the TL511 model spatial resolution (∼ 40 km) was applied to reduce the number of observations and comply with the IFS computing requirements while preserving the main spatial patterns resolved by the VIIRS product. No spatial thinning was applied to SLSTR observations because the product is distributed at a coarser spatial resolution than the native spatial resolution of the retrieval, and the stringent cloud filtering applied to the input radiances used in the retrieval algorithm leads to a substantial reduction of the number of AOD observations.
3.4 Intercomparison methodology
The goal of this work is to assess the differences between the level-3 AOD satellite products generated within the CAMS data assimilation system and their departures with the model. Two 3-month periods, namely December 2019–February 2020 (DJF) and March 2020–May 2020 (MAM), were distinguished in the evaluation. For the DJF period, the 16 and 17 January data are discarded for all the products because the VIIRS AOD product was affected by calibration errors in the VIIRS reflectances on these two days. The intercomparison was carried out at the IFS model spatial resolution (∼ 40 km) and at a 3-month temporal resolution. This was done in two steps: (1) instantaneous regridding of the level-2 retrieval product at the (level-3) IFS model spatial resolution and (2) a 3-month average of the instantaneous level-3 AOD retrieval. The intercomparison of the satellite products at the model spatial resolution, which is much coarser than the level-2 retrieval spatial resolution, should reduce the impacts of the differences in spatial resolution between products (Sayer et al., 2019). Also, the use of a multi-month AOD average should minimize the impacts of differences in temporal representativity (Schutgens et al., 2017) and allow us to focus on the systematic differences between products.
Observations above 70∘ N and below 70∘ S were disregarded because they generally do not meet the quality criteria for their assimilation. The product comparison was carried out over ocean and land separately. Over land, it includes MODIS and VIIRS, while over ocean it includes MODIS, VIIRS, SLSTR, and PMAp. Distinct regional domains (Fig. 1) were defined over land and ocean to encompass a large range of aerosol characteristics and surface types for which the retrieval algorithms may exhibit different behaviors.
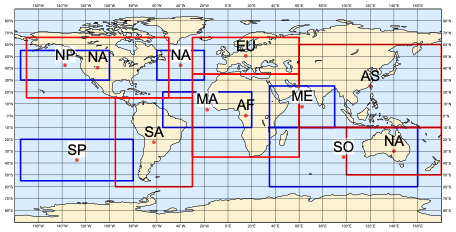
Figure 1Regions of interest. The blue rectangles and the red rectangles represent the ocean and land domains, respectively. MA, NA, NP, SP, SO, and AI mean mid-Atlantic, North Atlantic, North Pacific, South Pacific, Southern Ocean, Arabian peninsula, and Indian coast. AF, AS, AU, EU, NA, and SA mean Africa, Asia, Australia, Europe, North America, and South America.
Differences between the temporal averages of the products were assessed through global maps, global and regional probability density functions, and product versus product scatter plots and latitudinal transects. They were quantified by the mean deviation (MD), the root mean square of the differences (RMSD), and the Pearson correlation coefficient (r). The samples used to compute these metrics were the spatial and 3-month AOD average within each model grid box.
A key metric used in this work is the first-guess departure (hereafter denoted FGD), which represents the differences between the satellite AOD values and the model-simulated values based on short-range forecasts. It was computed by mapping the modeled AOD in the observation space independently for each satellite product, which consists of first interpolating the simulated aerosol mixing ratios to the observation location and time, then computing the modeled AOD from the mixing ratio value using the aerosol observation operator (Benedetti et al., 2009). FGD represents the differences between the level-2 retrieval at its native spatial resolution and the model-simulated equivalent observation with collocation in time and space. It should be noted that the first guess also includes the impact of assimilated MODIS and PMAp AOD from the previous cycles. Geographical maps of the mean and the standard deviation of FGD in space and time are produced by taking the observation–model collocated samples within each model grid box and within each 3-month period. Given the large number of spatial and temporal samples used, the mean and the standard deviation (SD) of FGD are meaningful estimates of the systematic and random differences, respectively, between the observation and the model, which are the results of both the observation and the model errors. Any bias in the AOD retrievals can result in inconsistencies between distinct satellite observations, which may fight against each other when they are assimilated, resulting in larger errors in the analysis. The use of the first-guess departure is twofold: (i) check that the mean departure between each satellite observation and the model is reasonably small and not impacted by any biases in the observation and (ii) evaluate the retrievals relative to the model to identify possible spatial and temporal inconsistencies between satellite products that would impact the assimilation of multi-satellite AODs. This requires the model to be skillful to some extent and low biased compared to the observation. This is a reasonable assumption given that the short-term forecast used to compute FGD is simulated from an optimal estimate of the atmospheric state produced by the data assimilation system.
4.1 Evaluation over ocean
4.1.1 Satellite observations
Figures 2 and 3 indicate that PMAp has the highest global mean AOD. The global mean of SLSTR is half that of the rest of the products. VIIRS global means are 0.01 and 0.02 lower than MODIS global means for DJF and MAM, respectively. PMAp shows the largest spatial variability (SD = 0.1), while the rest of the products have similar global SD (∼ 0.07). Over the remote ocean, SLSTR shows much lower AOD than the rest of the products, and its global mean is half that of MODIS. VIIRS exhibits spatial structures of low AOD over the North Pacific and the North Atlantic for the DJF period (Fig. 2) and over the Southern Ocean for the MAM period (Fig. 3). These structures are smaller and noisier in the MODIS and PMAp maps, and they cannot be distinguished in the SLSTR maps. Products exhibit large diversity in the Southern Ocean where PMAp and MODIS show nosier spatial patterns compared to VIIRS and SLSTR. All products consistently show high AOD values in the tropical Atlantic (Fig. 2), resulting from Saharan dust transport as well as smoke from central African biomass burning areas and off the Indian and Chinese coasts (Fig. 3) due to continental aerosol transport. VIIRS and SLSTR both detect the 2019–2020 Australian fire smoke transport over the Pacific (20 to 50∘ S, 120 to 180∘ W) where PMAp and MODIS show noisier spatial patterns (Fig. 2). The aerosol plumes detected by SLSTR over ocean have a smaller extent and are more fragmented compared to the rest of the products.
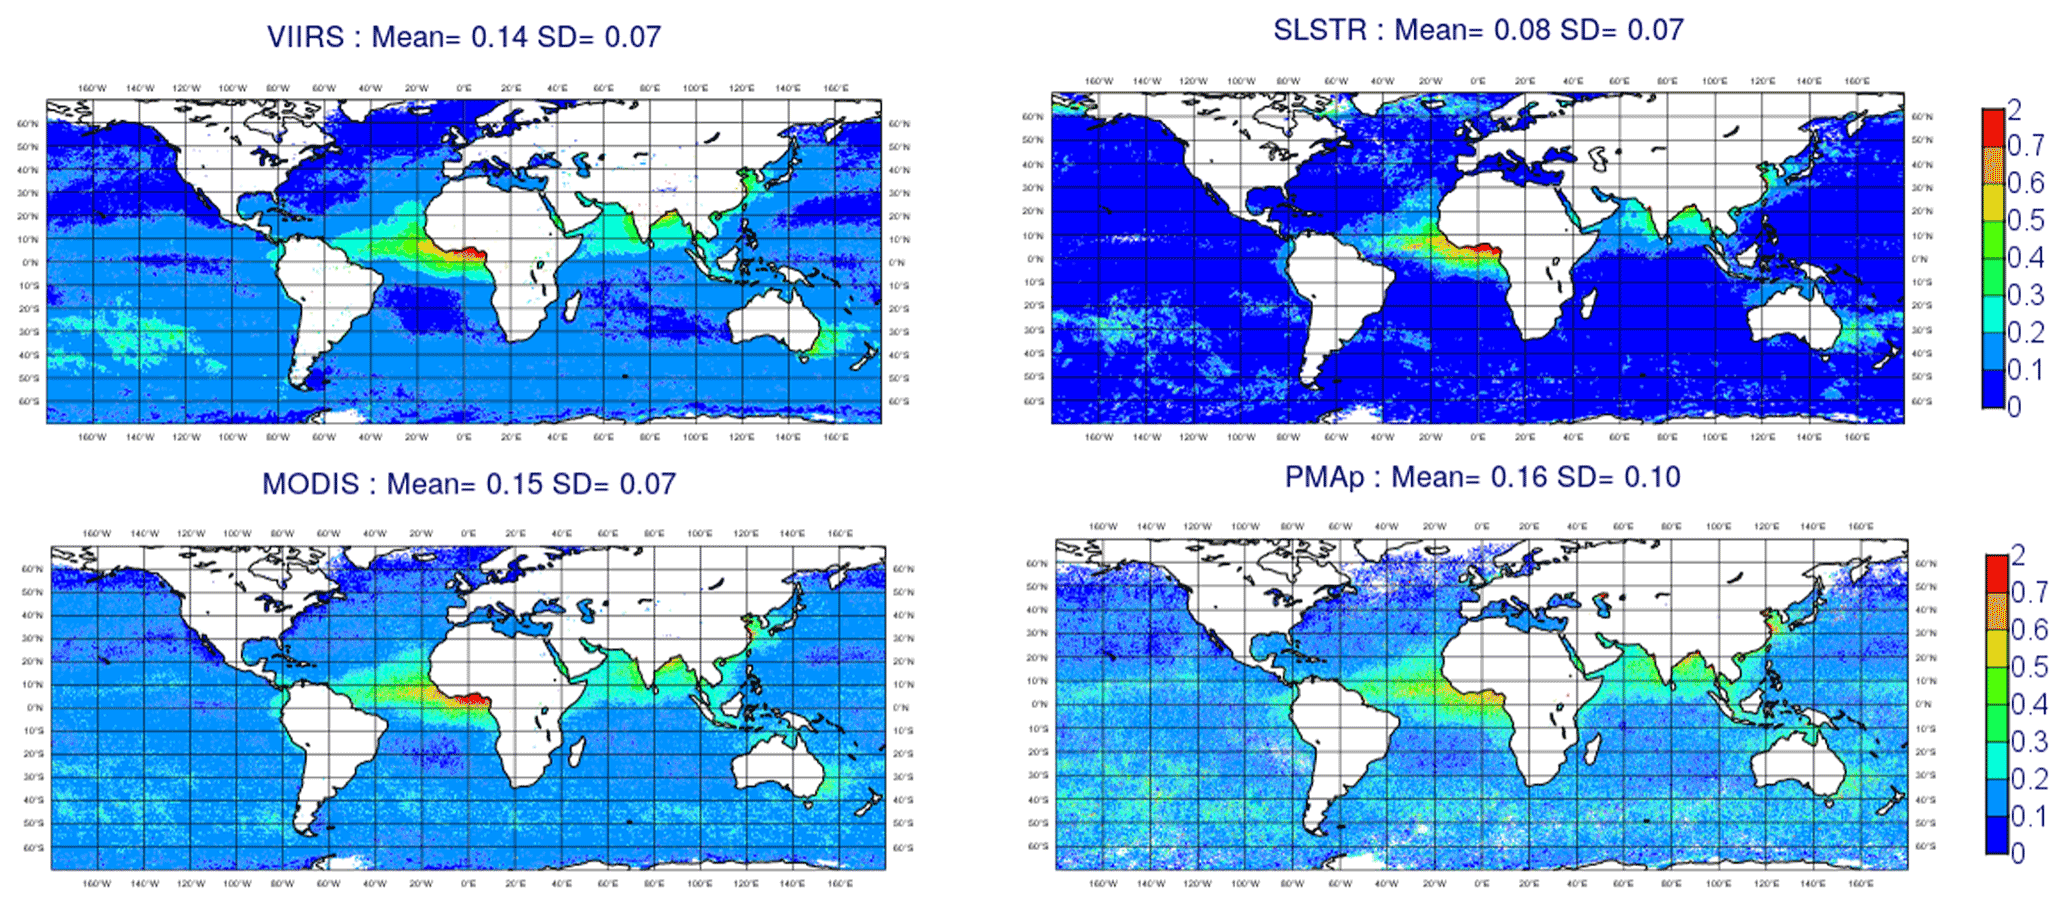
Figure 2Global maps of temporal mean AOD from Terra and Aqua/MODIS, NOAA20 and SNPP/VIIRS, S3A and S3B/SLSTR, and MetOp-A/B–PMAp for the DJF (2019–2020) period over ocean.
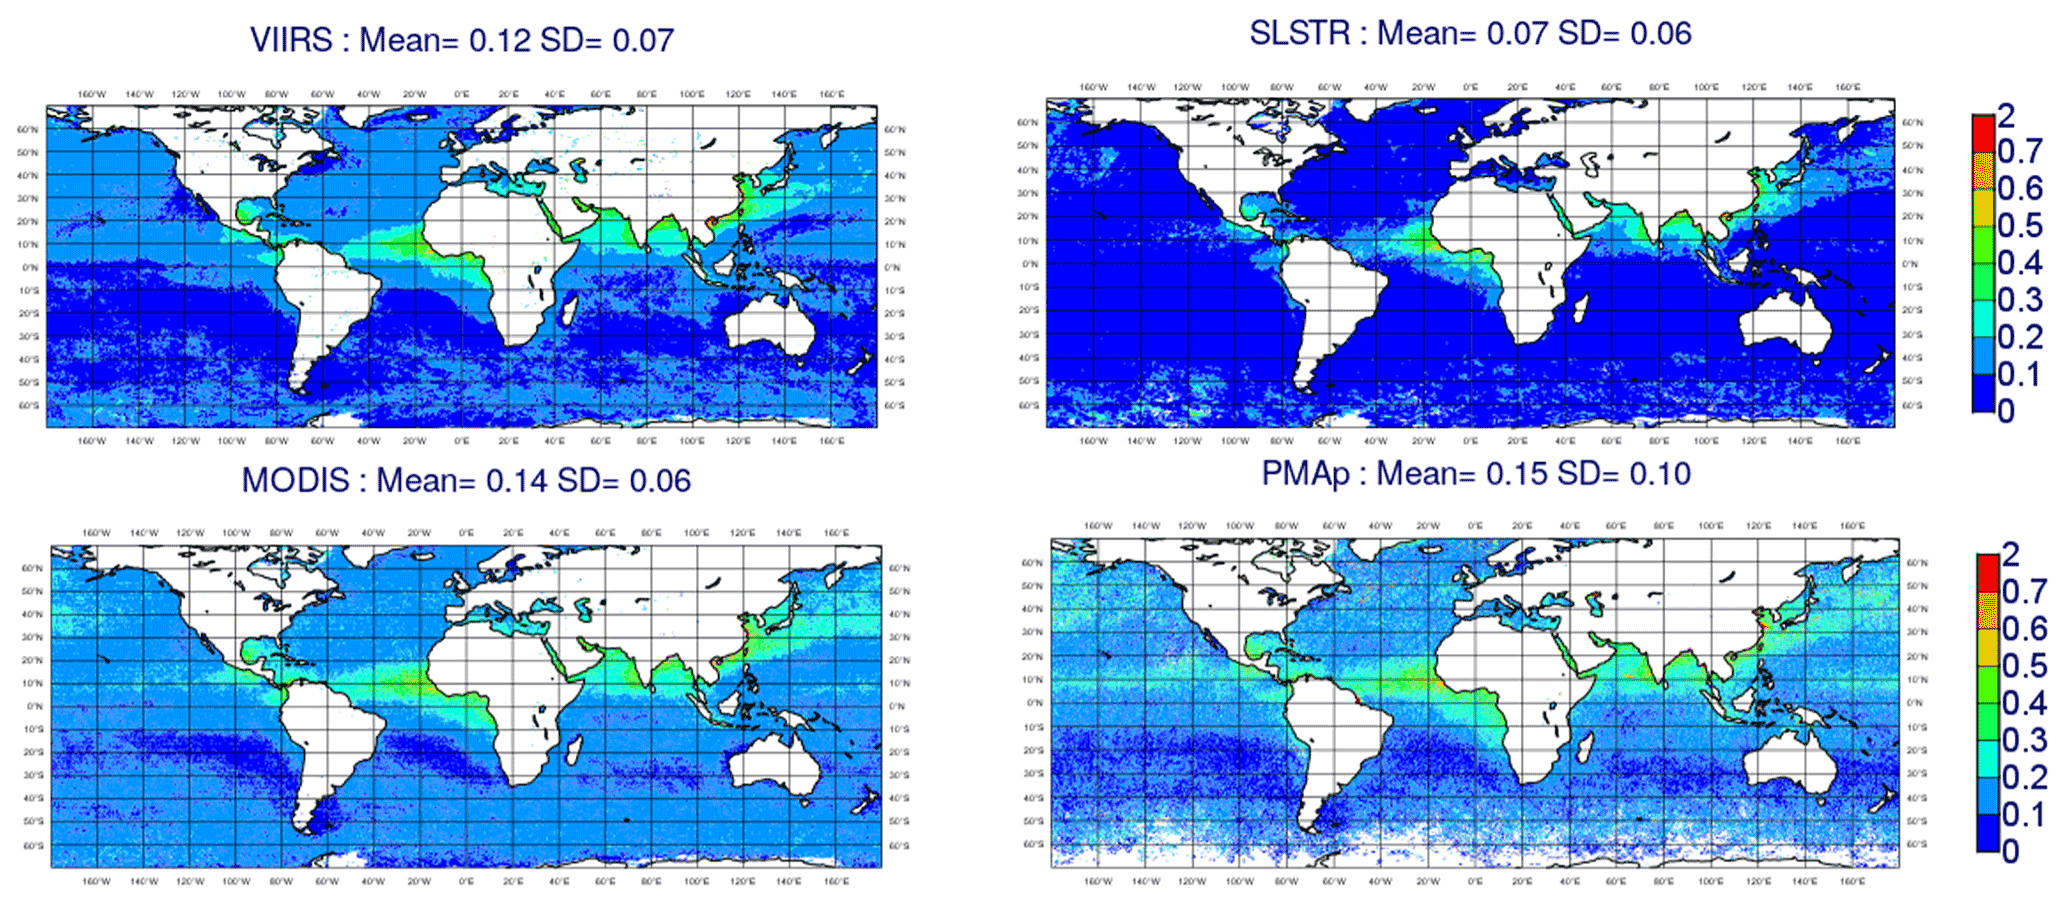
Figure 3Global maps of temporal mean AOD from Terra and Aqua/MODIS, NOAA20 and SNPP/VIIRS, S3A and S3B/SLSTR, and MetOp-A/B–PMAp for the MAM (2020) period over ocean.
The global probability distribution functions (PDFs) of AOD are displayed for the DJF period in Fig. 4 (results are similar for the MAM period and thus not shown). SLSTR has the narrowest PDF, positively skewed and centered over smaller values compared to the rest of the products. PMAp shows the widest PDF. MODIS and VIIRS exhibit similar Gaussian-like distributions, but the VIIRS distribution is shifted toward lower values.
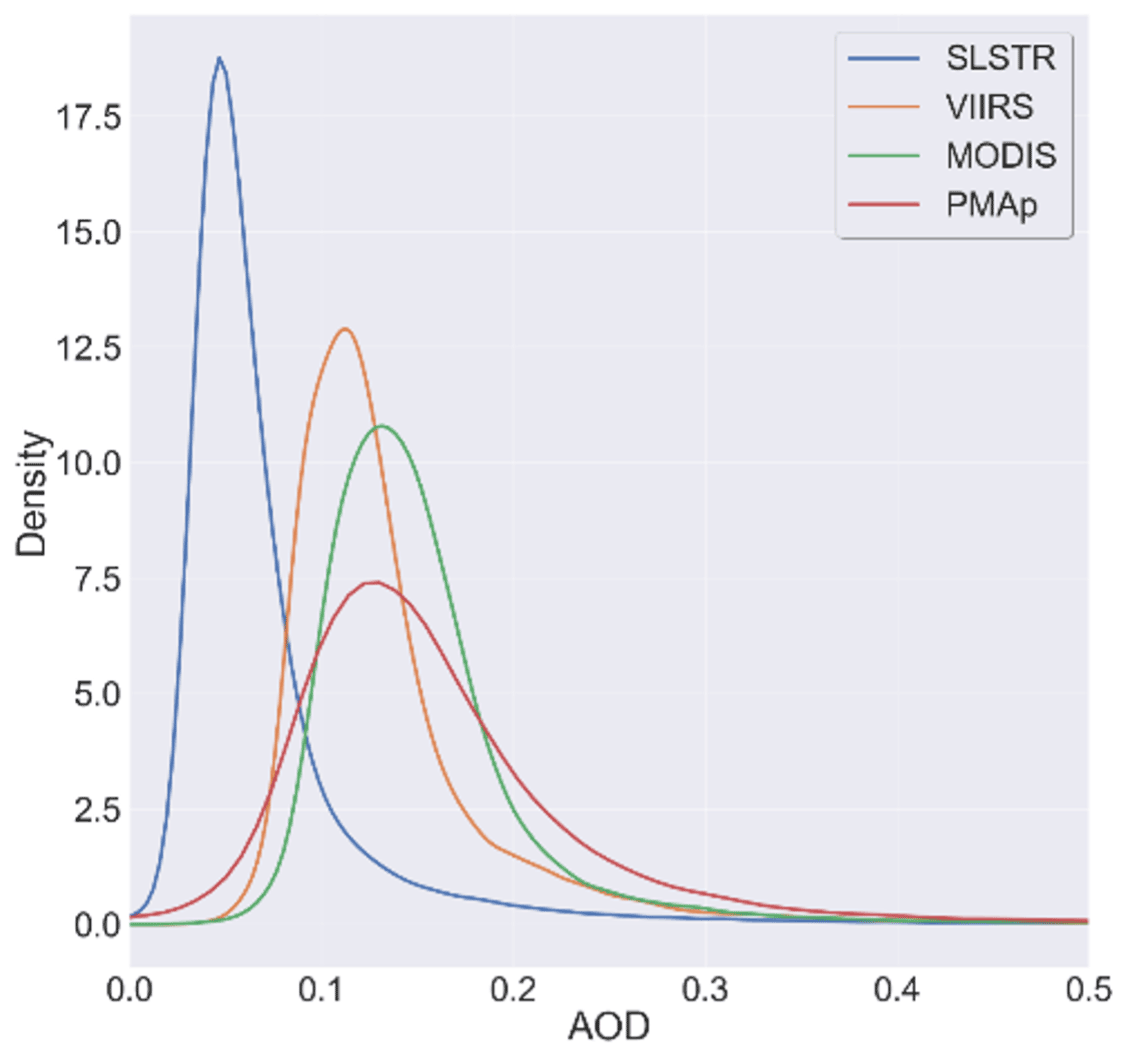
Figure 5 confirms the negative departure between SLSTR and the rest of the products across latitudes for the DJF period. PMAp-B shows the highest values, while PMAp-A is in better agreement with Terra/MODIS. S3A/SLSTR and S3B/SLSTR have consistent AOD latitudinal transects. SNPP/VIIRS is frequently lower than Terra/MODIS and is closer to Aqua/MODIS. NOAA20/VIIRS is lower than SNPP/VIIRS, and the differences are larger in the Southern Hemisphere. MODIS, VIIRS, and PMAp-A show larger discrepancies over southern midlatitudes (20–60∘ S) compared to northern midlatitudes and the tropics. All the products display a similar AOD peak at ∼ 2 to 8∘ N, which is related to the frequent Atlantic dust outbreak for which MODIS has higher values than VIIRS. The increase in SLSTR and VIIRS AOD around 30∘ S is related to the Australian fire smoke transport shown in the global maps. The increase in SLSTR AOD above 55∘ N is related to artifacts in the retrieval at high latitude. Similar differences in AOD latitude transects are obtained for the MAM period presented in Fig. D1.
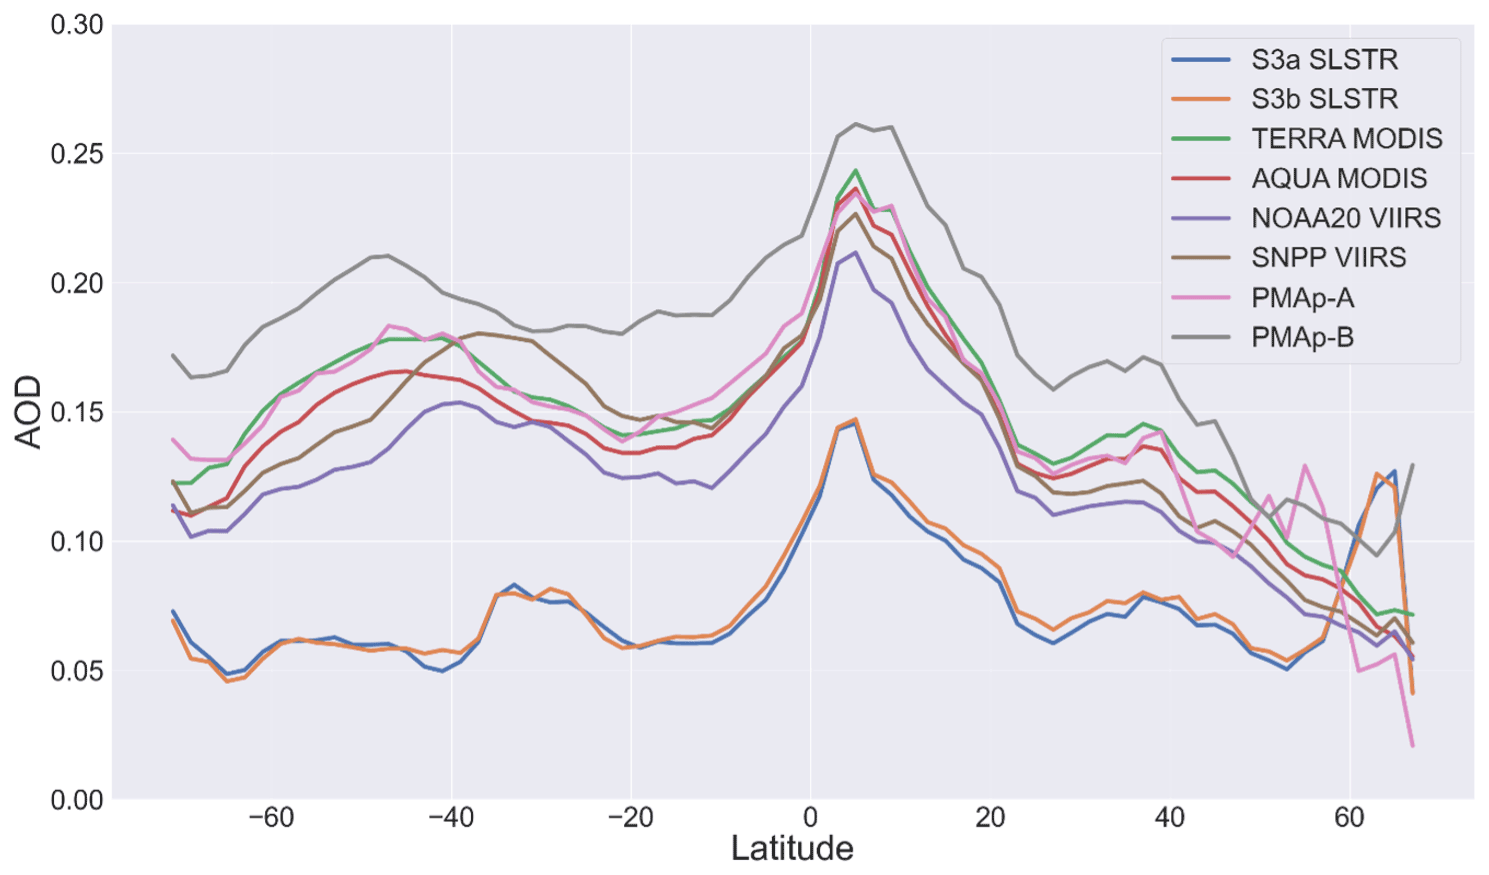
Figure 5Latitude cross-section of temporal mean satellite AOD for the DJF (2019–2020) period over ocean.
The values of MD, RMSD, and r between products are reported in Table 2, and the associated scatter plots are given in Appendix B1. VIIRS and MODIS have the smallest MD and RMSD as well as the highest correlation. The absolute MD between VIIRS and MODIS is slightly larger when using VIIRS from NOAA20 than from SNPP. SLSTR shows large negative MD with both VIIRS (−0.06) and MODIS (−0.08). PMAp has the smallest correlation with MODIS compared to SLSTR and VIIRS. RMSD and MD are lower between VIIRS and MODIS/Aqua compared to VIIRS and MODIS/Terra. Similar differences between products are obtained for the MAM period (results not shown) with slightly higher MD between VIIRS and MODIS.
Table 2Quantification of global AOD differences between satellites and instruments for the DJF period over ocean.
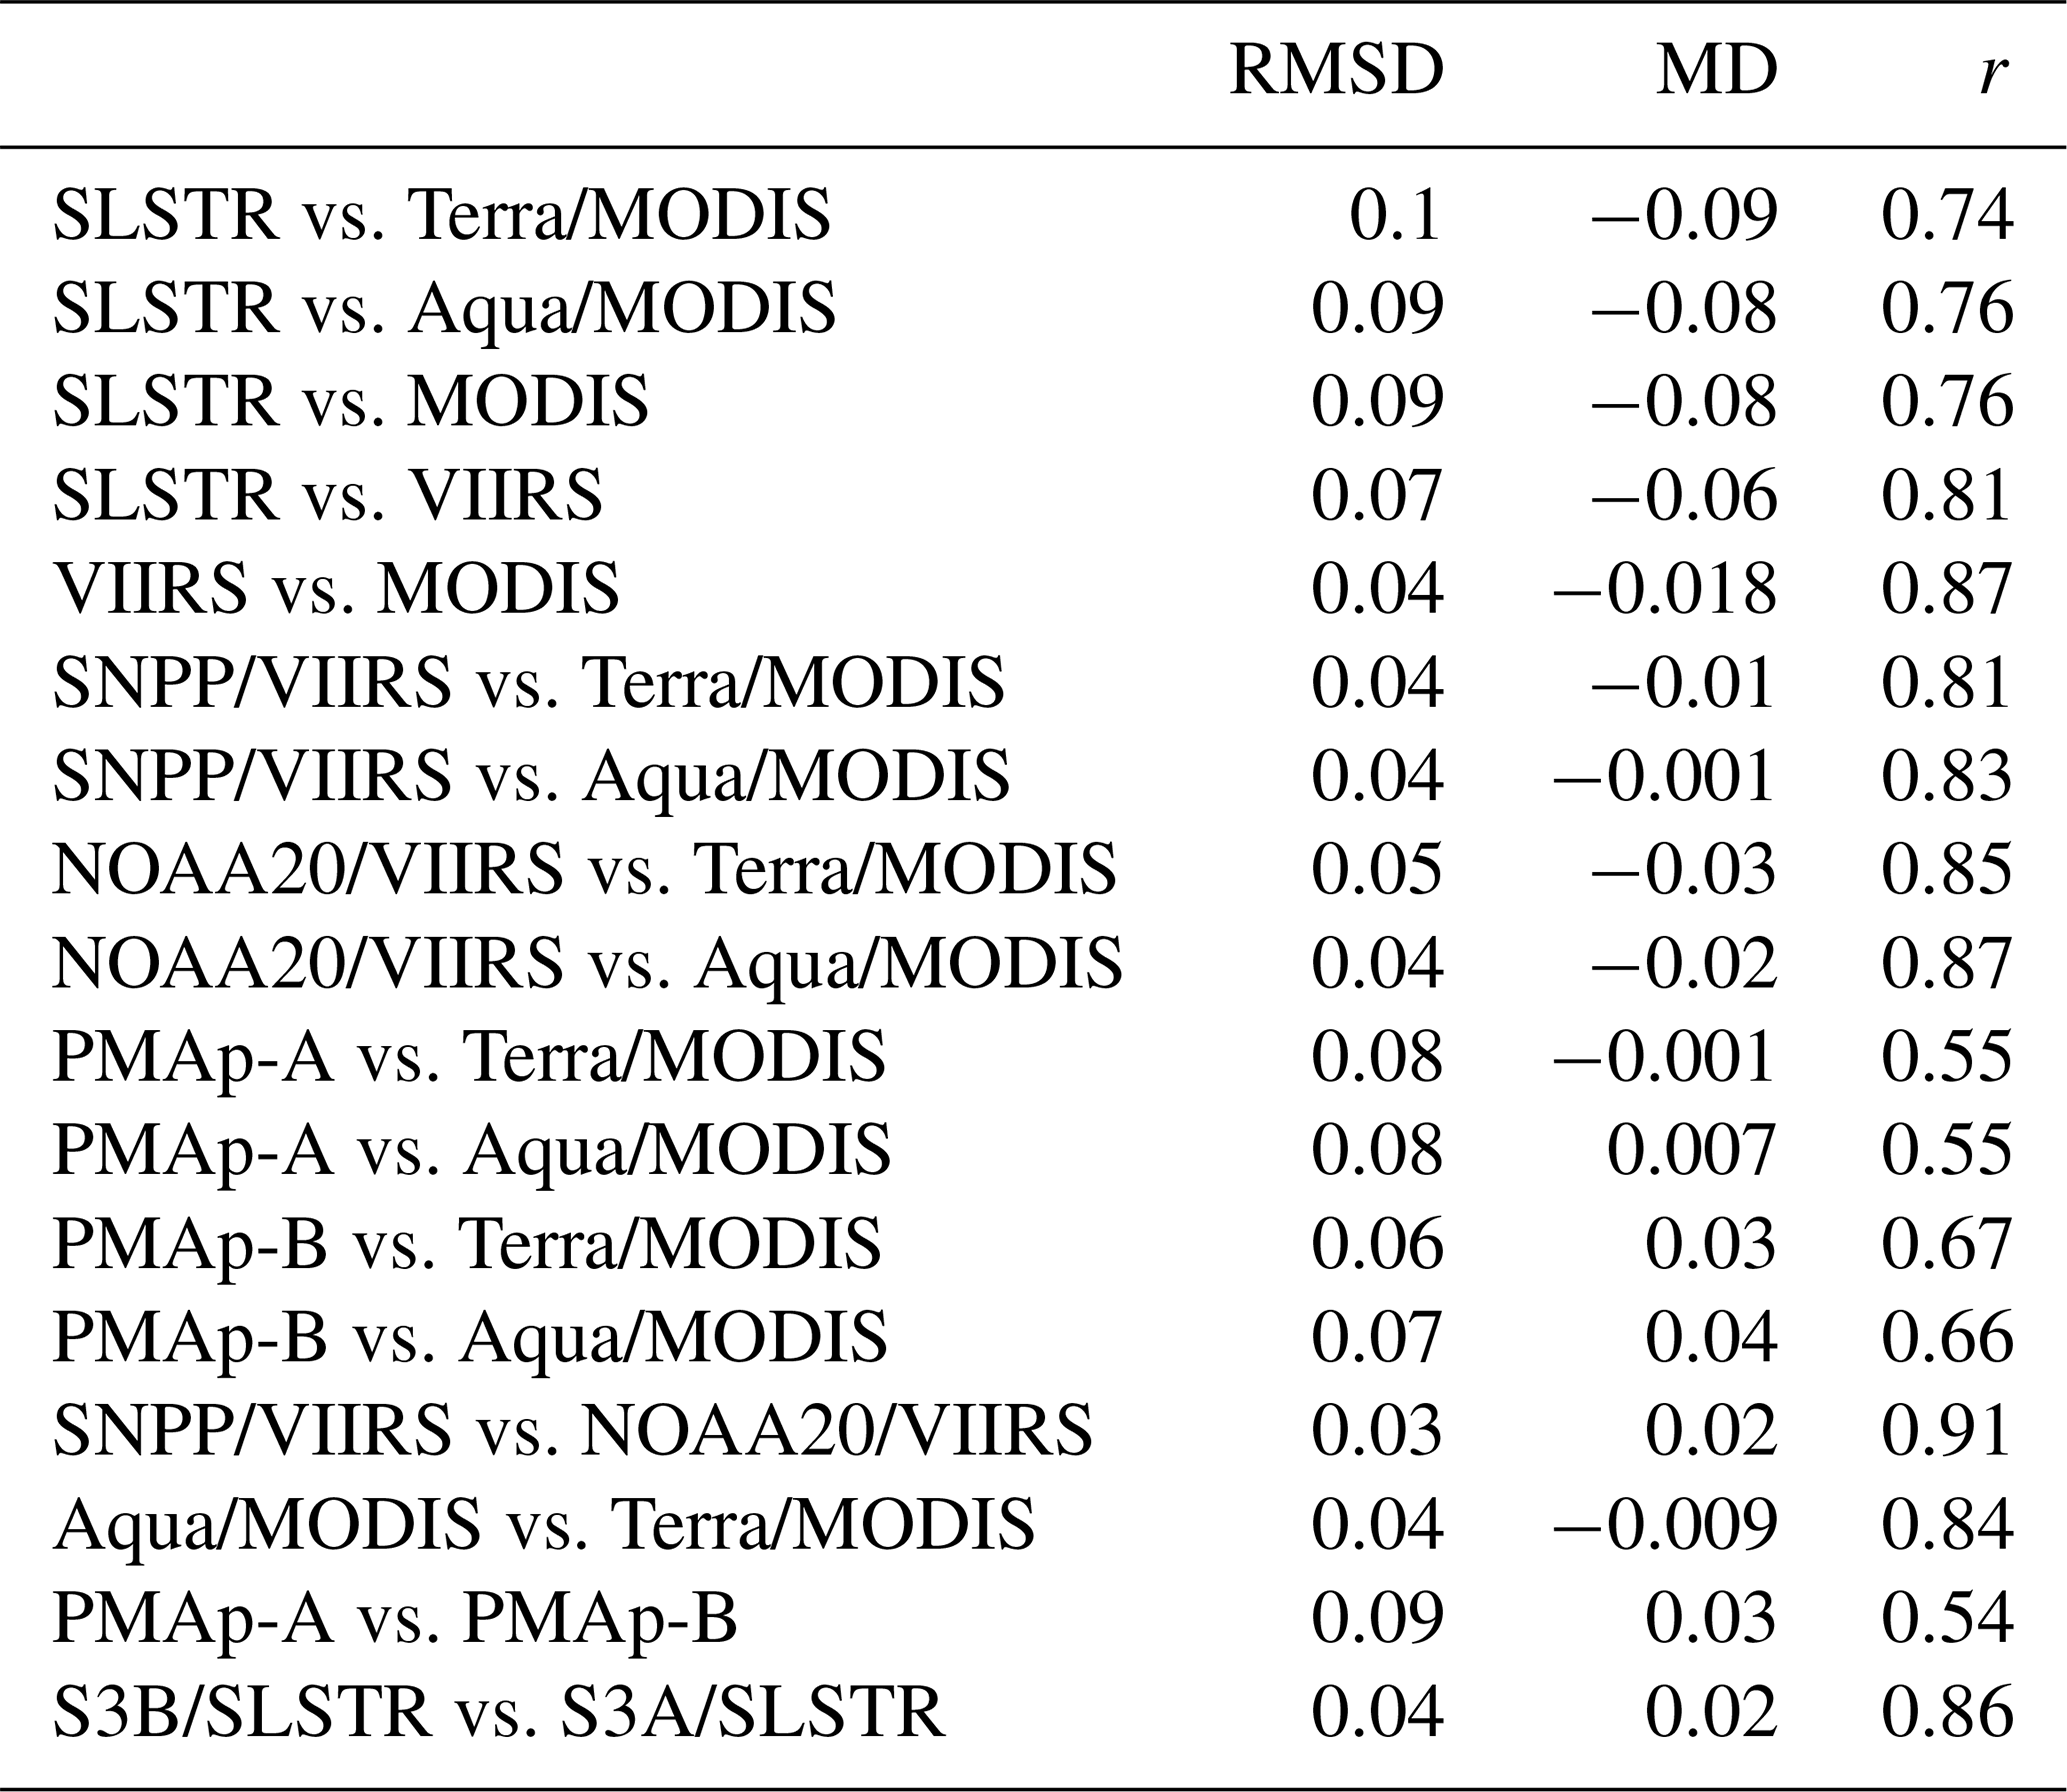
Table 3 and Fig. C1 characterize the diversity between products at the regional scale. Wider AOD distributions are reported in the Southern Ocean compared to global scale. SLSTR exhibits larger negative MD in the Southern Ocean compared to the North Atlantic and the North Pacific domains where MD and RMSD between products are frequently the smallest.
Table 3Quantification of AOD differences between instruments over the ocean regional domains (defined in Table 2) for the DJF period. Each cell gives the MD followed by the RMSD.

4.1.2 First-guess departure (FGD)
Figure 6a and b present the global maps of the mean and SD of FGD, respectively, and Fig. 7a and b display the associated latitude cross-sections by distinguishing the instruments on distinct platforms.
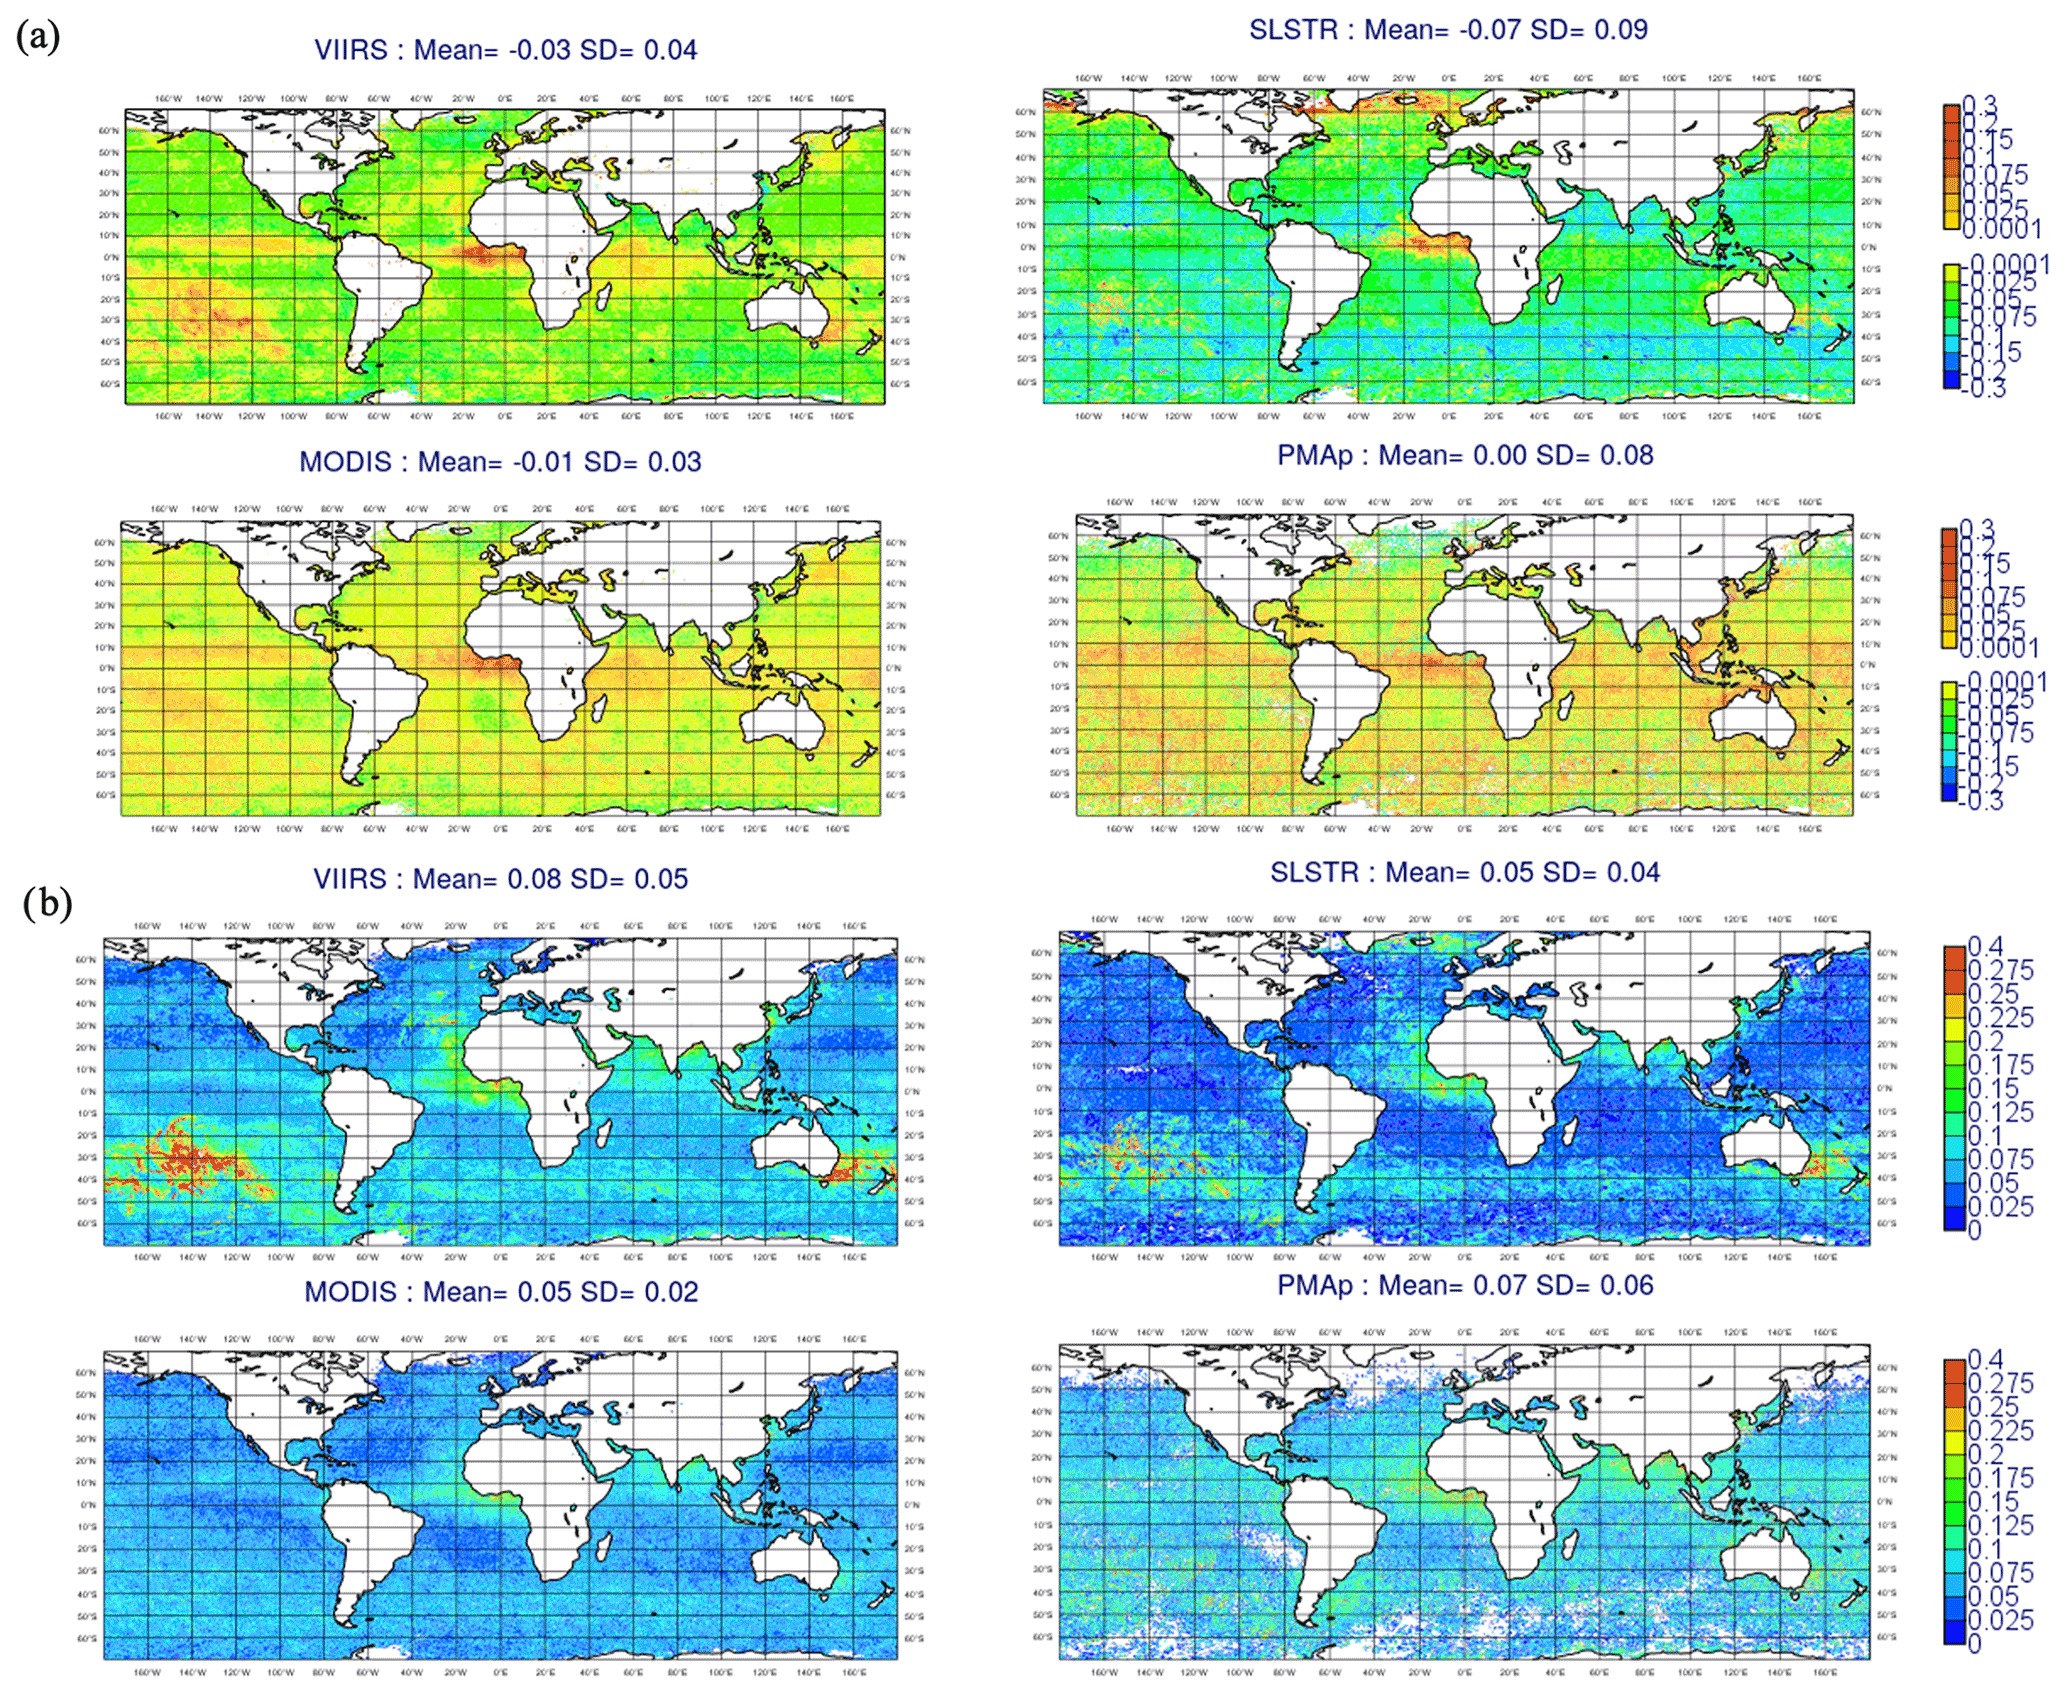
Figure 6Global maps of the mean (a) and SD (b) of the first-guess departure from Terra and Aqua/MODIS, NOAA20 and SNPP/VIIRS, S3A and S3B/SLSTR, and MetOp-A/B–PMAp for the DJF (2019–2020) period over ocean.
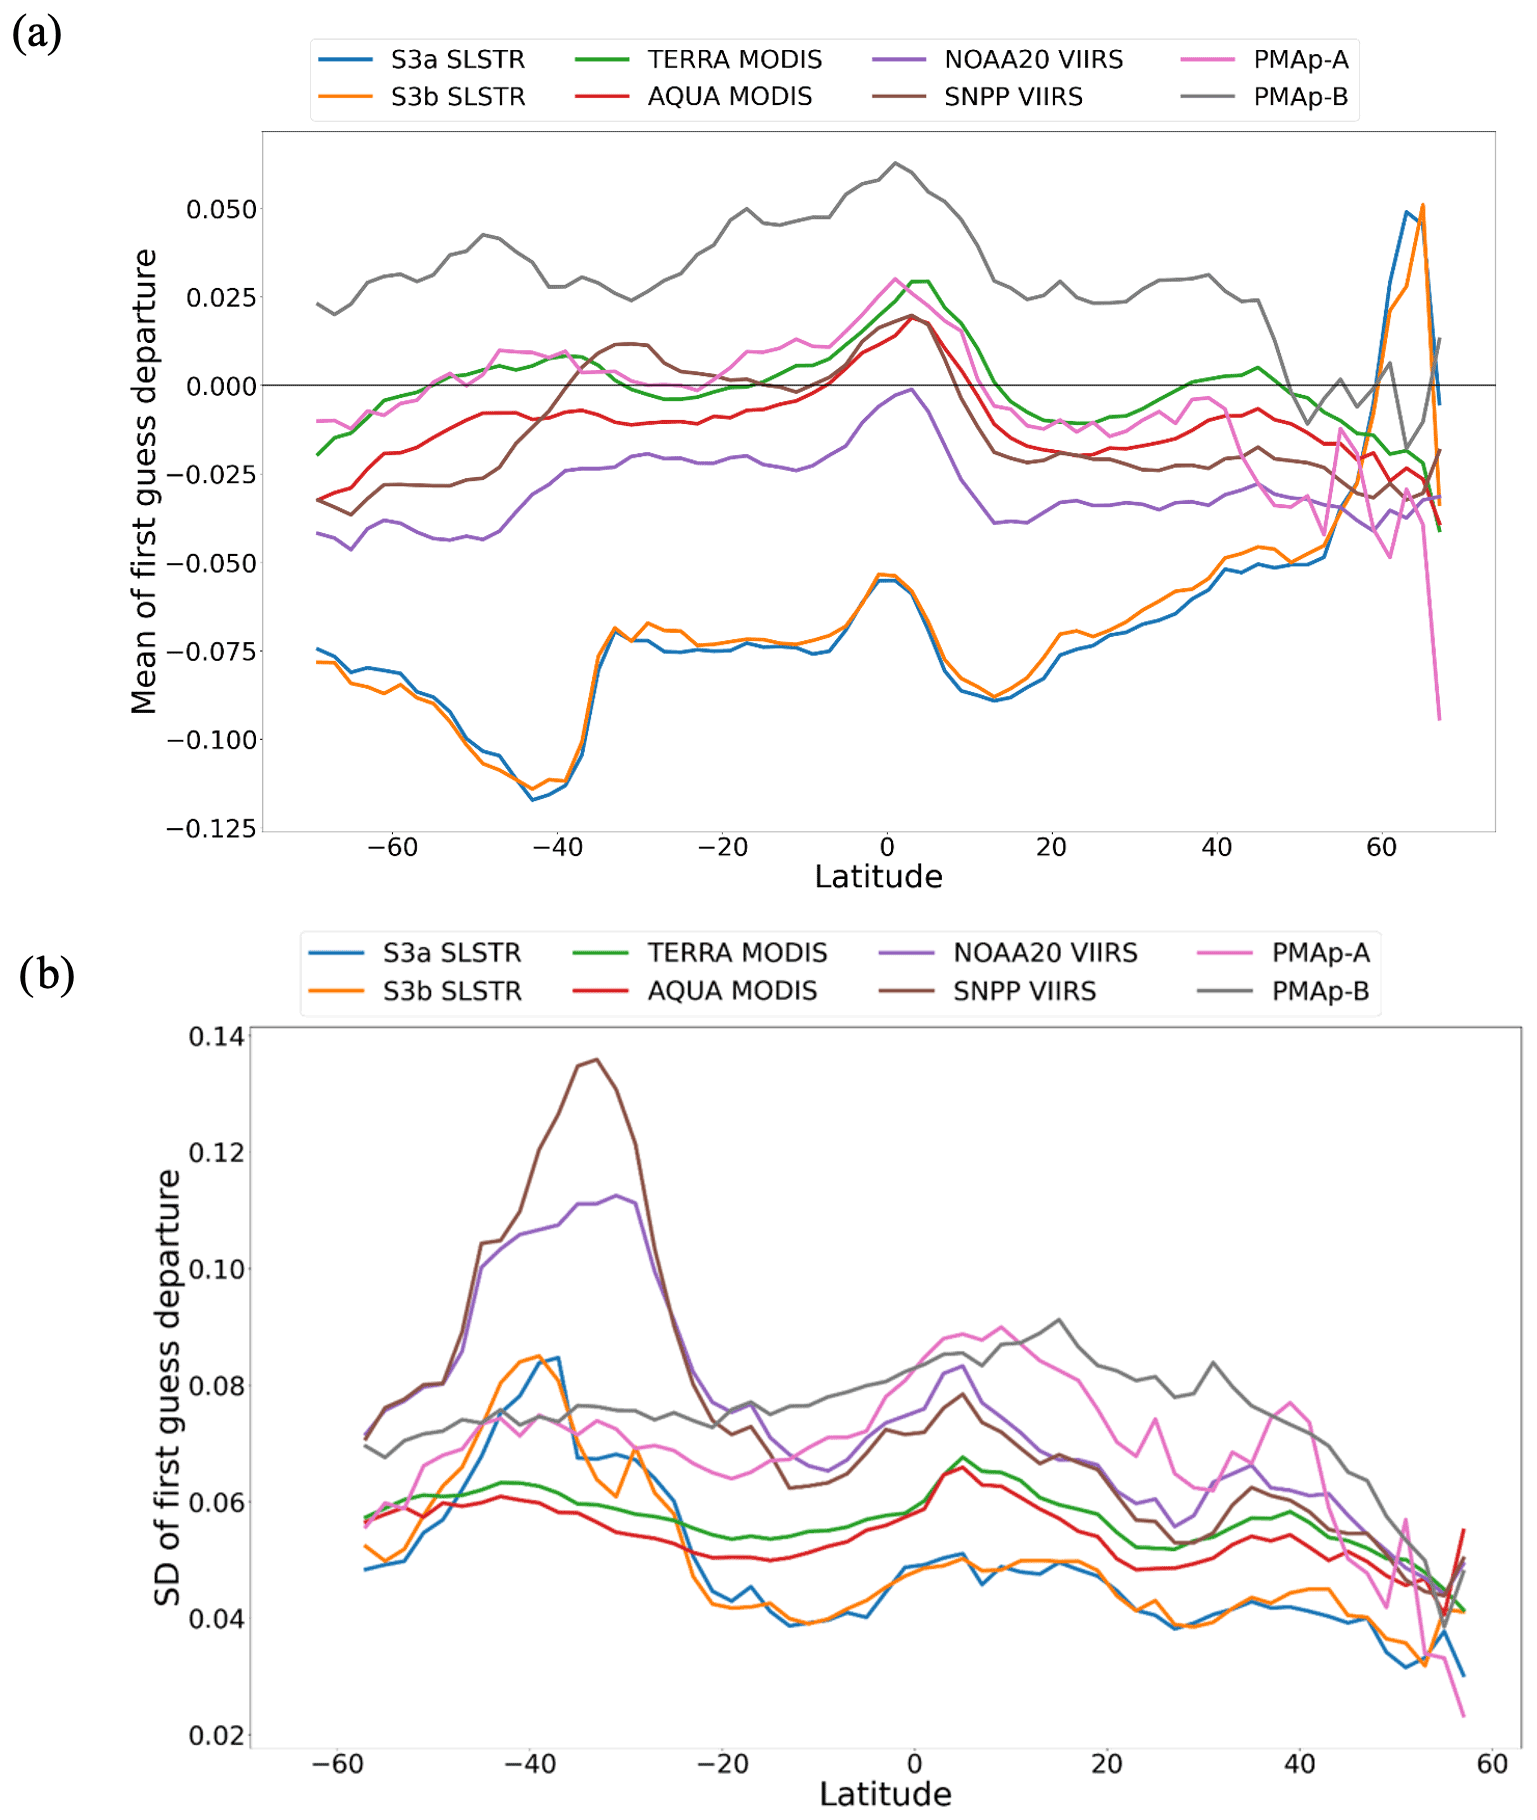
Figure 7Latitude cross-section of the mean (a) and the SD (b) of the first-guess departure for the DJF (2019–2020) period over ocean.
All satellite retrievals except PMAp show a negative global mean of FGD, which means that the modeled AOD is larger than the satellite observation over ocean. They exhibit consistent positive departure over the dust and smoke plume off the West African coast (Fig. 6a), which explains the increase in FGD around the Equator shown by all the products in Fig. 7a. VIIRS frequently shows more pronounced negative FGD values than MODIS over the remote oceans. SLSTR shows the largest negative FGD with values much lower than the range spanned by the rest of the products (Fig. 7a). The magnitude of SLSTR FGD increases in the Southern Ocean between ∼ 35 and ∼ 50∘ S and in the mid-Pacific between 10 and 20 ∘ N (Fig. 7a). Consistent with what is shown for AOD retrievals in Fig. 5, PMAp-B has larger and more positive FGD values than PMAp-A, which has values close to Terra/MODIS. Aqua/MODIS has a negative offset compared to Terra/MODIS, which keeps FGD close to zero. FGD of SNPP/VIIRS is larger than that of NOAA20/VIIRS, particularly between 15∘ S and 15∘ N (Fig. 7a) where it is close to that of Aqua/MODIS.
VIIRS shows sharp increases in FGD SD (Figs. 6b and 7b) in the South Pacific (20 to 50∘ S, 120 to 160∘ W) and off the Australian east coast, which both are related to the Australian fire smoke. This is partially shown by SLSTR but not by MODIS and PMAp (Fig. 7b). While SLSTR has the largest magnitude of the mean of FGD it generally has the lowest SD of FGD, which indicates lower random differences with the model compared to the rest of the products. PMAp frequently shows the largest SD of FGD, particularly in the Northern Hemisphere, which is related to the nosier patterns of PMAp retrieval compared to the rest of the products. Figure 7b indicates good agreement of SD of FGD between instruments on board distinct platforms except for PMAp-B, which has larger values than PMAp-A. Similar results are found for the MAM period (Figs. D3, D4, D5a and b).
Figure 8 shows the statistics of FGD for each product computed for distinct ranges of satellite AOD for the DJF period (similar results are obtained for the MAM period). For AOD smaller than 0.2, SLSTR has a negative FGD of about −0.05, while VIIRS and MODIS FGD values fall between −0.015 and 0. For AOD larger than 0.2, VIIRS, MODIS, and PMAp show positive FGD. The mean and spread of the FGD of PMAp and VIIRS increase with AOD. MODIS shows lower values and a smaller spread of FGD, which is expected because the model first guess is influenced by the assimilation of MODIS from the previous analysis cycles. SLSTR has negative FGD up to AOD = 0.4. The spread of SLSTR first guess is comparable to that of VIIRS.

Figure 8Global statistics of the first-guess departure (FGD) for a distinct range of AOD for the DJF (2019–2020) period over ocean.
4.2 Evaluation over land
4.2.1 Satellite observations
The magnitude of the AOD global mean of VIIRS and MODIS is larger over land than ocean, and it increases from the DJF to the MAM period. Figures 9 and 10 show the overall good agreement between MODIS and VIIRS over land. VIIRS exhibits larger spatial coverage and smoother spatial variations over northern latitudes, central Africa, and South America. Conversely to ocean, VIIRS AOD has a larger global mean than MODIS (difference of 0.03). VIIRS is higher over biomass burning regions (e.g., southwestern coast of Australia for the DJF period, central Africa, and South America) and over dust source regions (e.g., Taklamakan desert for the MAM period, the Bodélé depression for the DJF and MAM periods, the Sahel for the MAM period, central Australia for the DJF period, Central America for the MAM period). VIIRS show smaller AOD than MODIS over the polluted hot spots in eastern China.
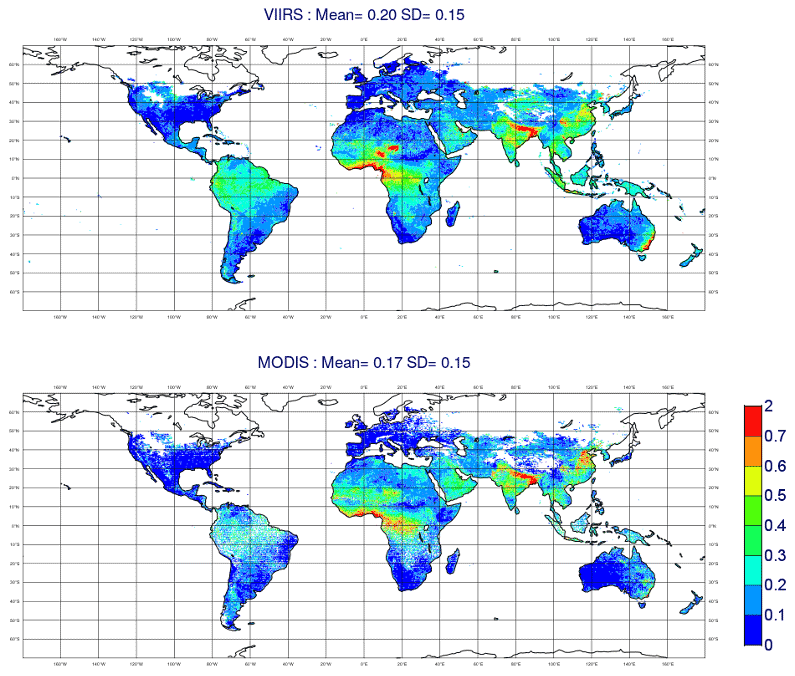
Figure 9Global maps of temporal mean AOD from Terra and Aqua/MODIS as well as NOAA20 and SNPP/VIIRS for the DJF (2019–2020) period over land.
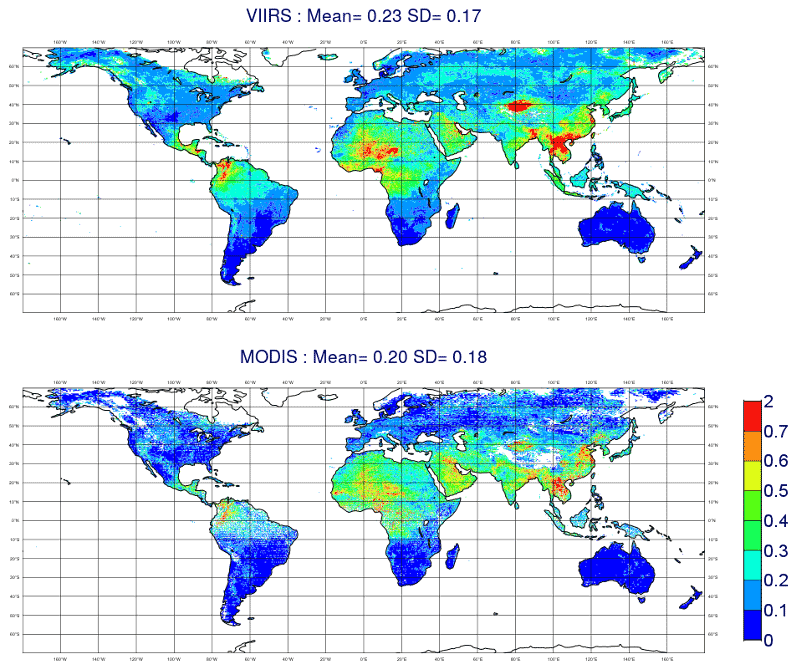
Figure 10Global maps of temporal mean AOD from Terra and Aqua/MODIS as well as NOAA20 and SNPP/VIIRS for the MAM (2020) period over land.
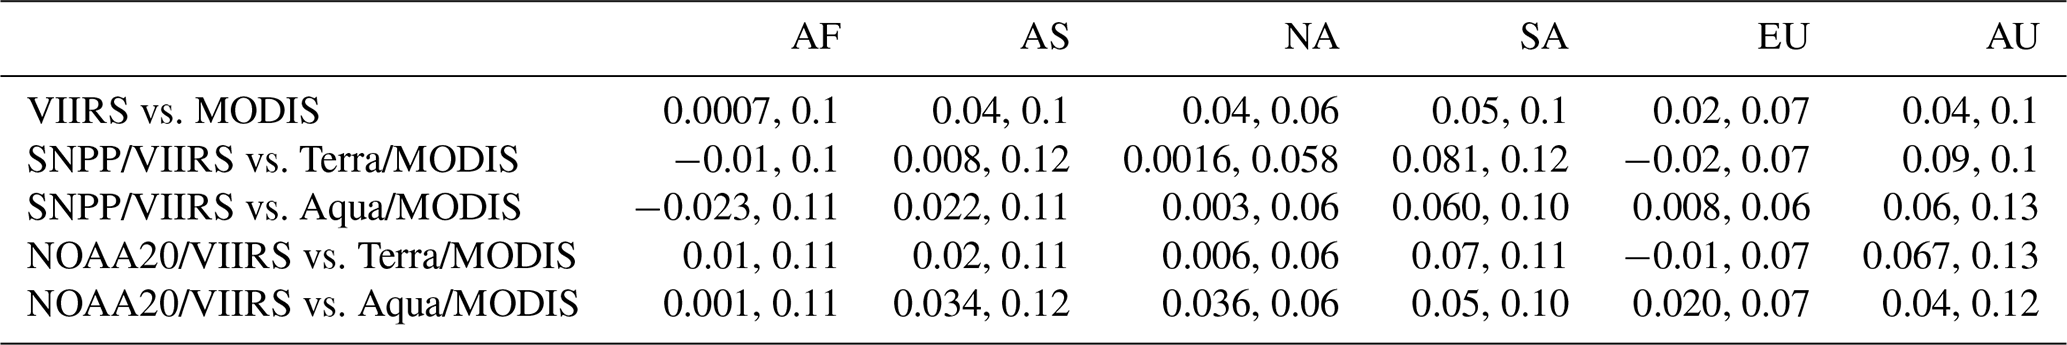
Figure 11 shows that MODIS has a wider and quasi-bimodal distribution, while VIIRS exhibits a positively skewed distribution. All VIIRS regional distributions are positively skewed toward larger AOD values than MODIS except over Africa where MODIS and VIIRS show similar PDF (Fig. C2). The latitude transects across land surfaces (Fig. 12 for the DJF period and Fig. C2 for the MAM period) indicate higher VIIRS AOD than MODIS AOD in the Southern Hemisphere where the differences are larger than in the Northern Hemisphere. The AOD peak around 40∘ S related to the Australian fires in Fig. 12 is more pronounced for VIIRS than for MODIS. Table 5 indicates smaller differences between VIIRS and MODIS over Europe, Africa, and North America, while the largest MD and RMSD are obtained over Australia and South America. SNPP/VIIRS and NOAA20/VIIRS show better agreement over land than over ocean except in the 20 to 30∘ N and 20 to 30∘ S latitude bands where NOAA20/VIIRS is larger and lower, respectively, than SNPP/VIIRS for the DJF period (Fig. 12). Aqua/MODIS and Terra/MODIS AOD are in close agreement in the Northern Hemisphere up to 30∘ N, above which Aqua/MODIS AOD drops below Terra/MODIS for the DJF period (this is not observed for the MAM period). In the Southern Hemisphere, Aqua/MODIS is systematically higher than Terra/MODIS, while the opposite was observed over ocean. Overall, the departure between retrievals from the same instrument on board different platforms is less important over land than over ocean (Table 4 compared to Table 2).
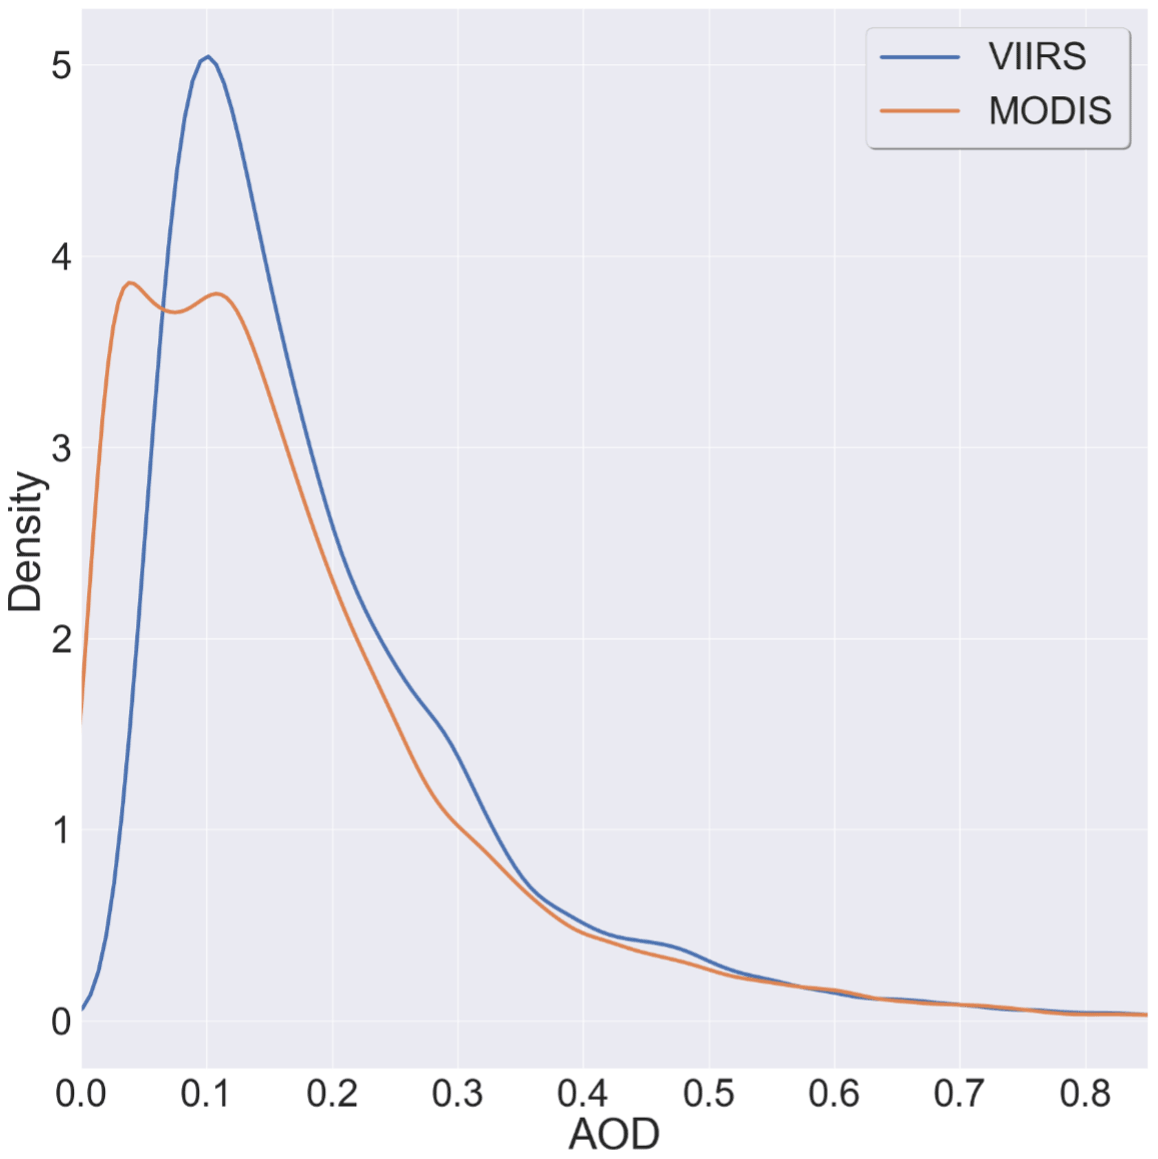
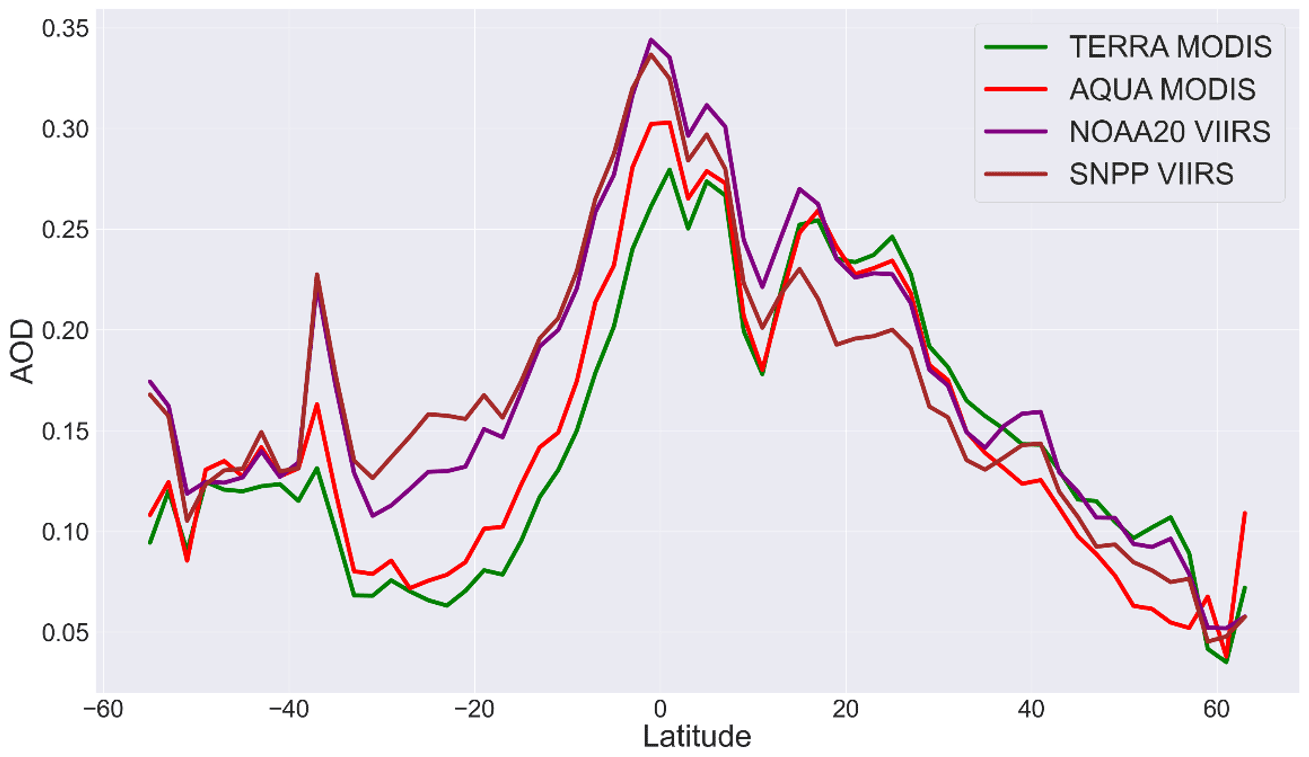
Figure 12Latitude cross-section of temporal mean satellite AOD for the DJF (2019–2020) period over land.
Table 4Quantification of global AOD differences between VIIRS vs. MODIS over land for the DJF and MAM periods.
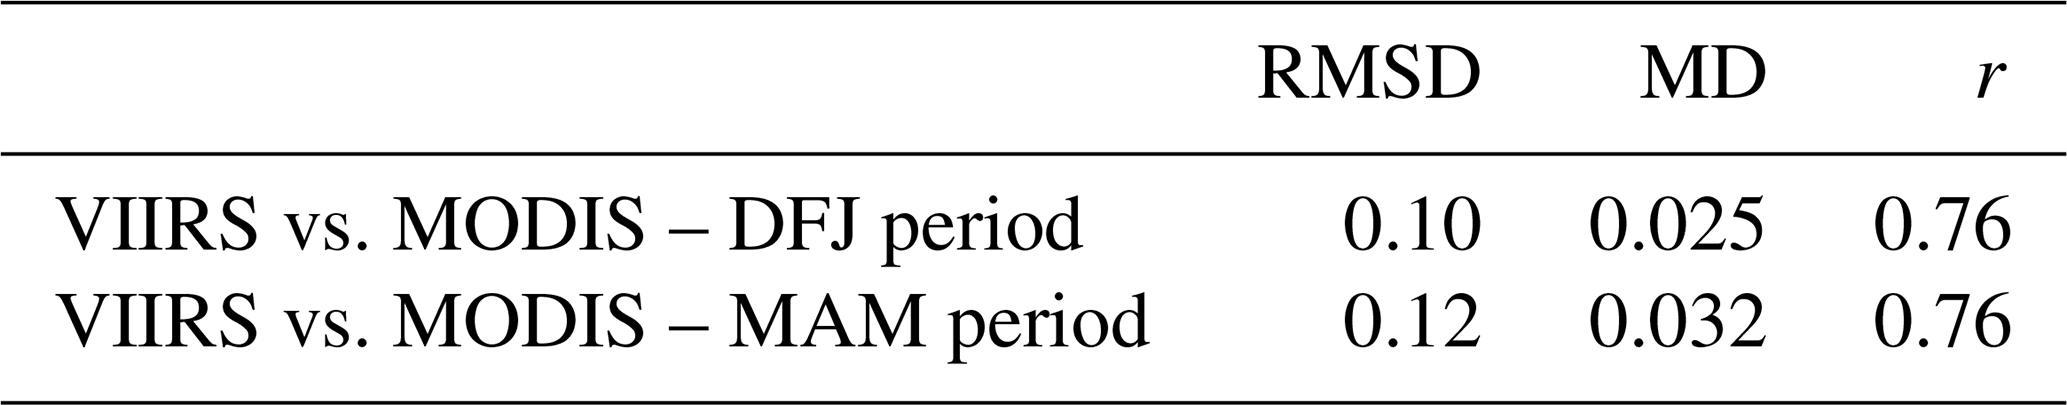
Table 5Quantification of AOD differences between instruments over the land regional domains (defined in Table 3) for the DJF period. Each cell gives the MD followed by the RMSD.
4.2.2 First-guess departure
Figure 13a indicates more frequent positive and negative FGD values for VIIRS and MODIS, respectively, for the DJF period. This holds for the MAM period (Fig. D7). VIIRS shows more pronounced positive FGD over South America, central and southern Africa, southeastern Australia (DJF only), western Australia, North America (particularly for the MAM period), and the Taklamakan region. Both MODIS and VIIRS consistently show negative departure in central Africa for the DJF period (Fig. 13a) and in India for the MAM period (Fig. D6), which corresponds to the decrease in FGD between 10 and 15∘ N shown by the latitude transects in Figs. 14a and D8a. Figure 14a indicates larger differences in FGD between instruments and platforms in the Southern Hemisphere compared to the Northern Hemisphere. In the Southern Hemisphere, MODIS and VIIRS frequently show negative and positive FGD, respectively. FGD magnitudes of Terra and SNPP are larger than that of Aqua and NOAA20, respectively. In the Northern Hemisphere, both VIIRS and MODIS have negative departure up to ∼ 40∘ N. Above 40∘ N, VIIRS and Terra/MODIS consistently show slightly positive FGD, while Aqua/MODIS keeps negative values.
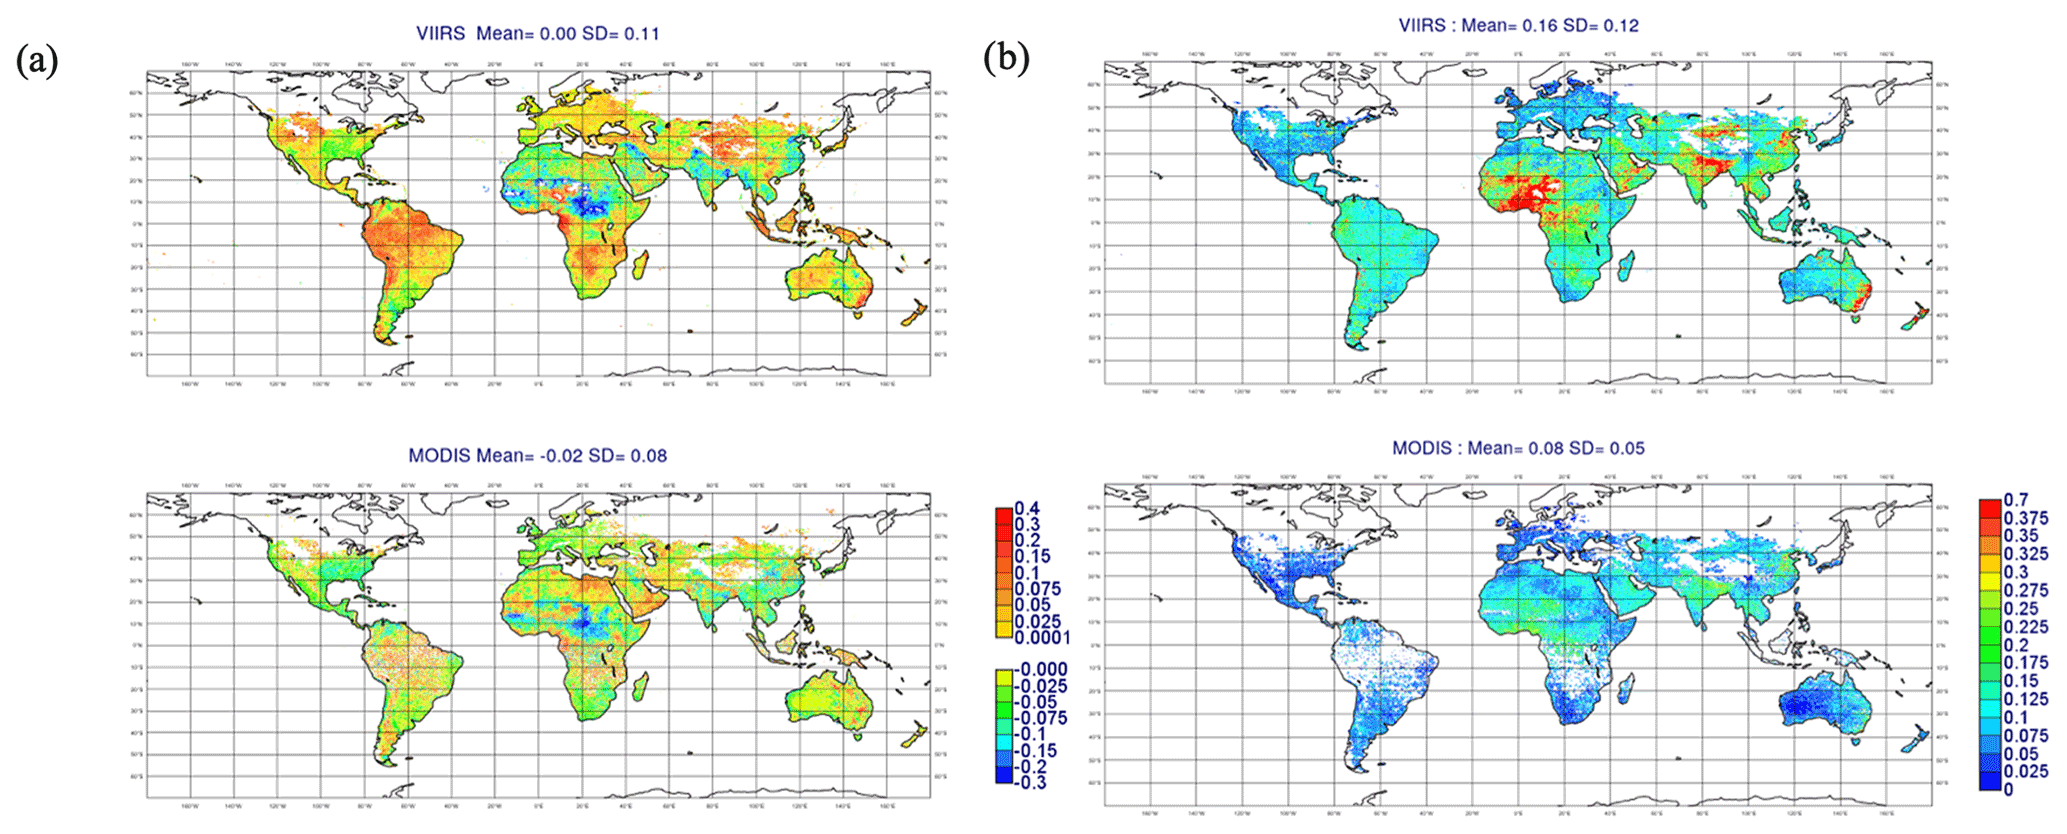
Figure 13Global maps of the mean (a) and SD (b) of the first-guess departure from Terra and Aqua/MODIS as well as NOAA20 and SNPP/VIIRS for the DJF (2019–2020) period over land.

Figure 14Latitude cross-section of the mean (a) and SD (b) of the first-guess departure for the DJF (2019–2020) period over land.
The SD of FGD (Figs. 13b and 14b) is overall larger for VIIRS than MODIS (VIIRS has a global average twice that of MODIS). Figures 13b and D7 highlight the large differences between VIIRS and the model AOD over dust source regions (Africa, Middle East, Asia, Australia), biomass burning regions in Africa, and polluted regions in India and China. While Terra and Aqua have similar SD of FGD, NOAA20 shows larger values than SNPP in the Northern Hemisphere (Figs. 14b and D8b).
Figure 15 indicates that MODIS and VIIRS both have similar FGD statistics for AOD less than 2. For AOD larger than 2, the mean and the variance of the VIIRS FGD increase with AOD, while the MODIS FGD is steady and less variable due to its assimilation.
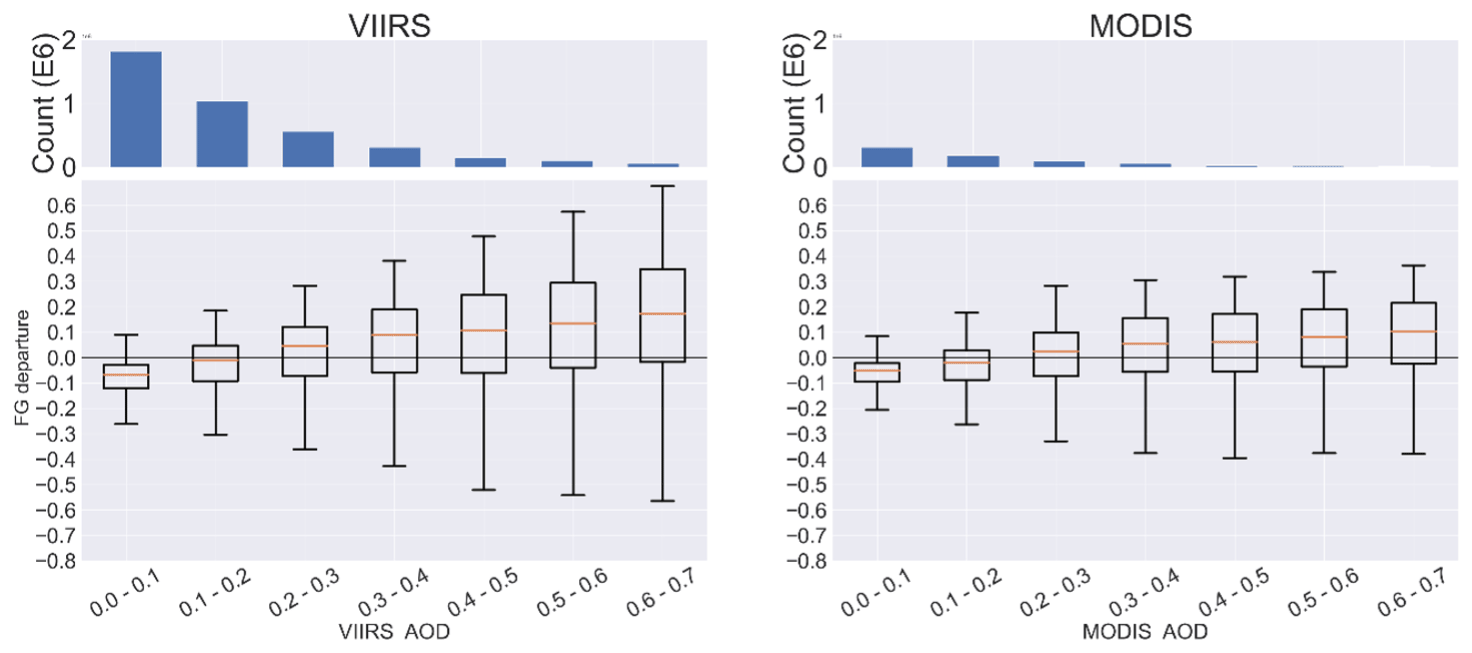
Figure 15Global statistics of the first-guess (FG) departure for a distinct range of AOD (DJF period) over land.
The sources of differences between the satellite AOD products monitored within the CAMS data assimilation system are discussed here.
5.1 Cloud detection
Cloud contamination has been identified as an important source of uncertainties in aerosol retrieval (Zhang et al., 2005; Kaufman et al., 2005; Li et al., 2009; Sogacheva et al., 2017; Schutgens et al., 2020). Commission errors are frequent between cirrus and dusts (Lee et al., 2013) or in the case of heavy smoke (Wong and Li, 2002). Zhao et al. (2013) have reported changes in monthly mean MODIS AOD up to 0.04 due to cloud contamination.
While the gridding of the satellite products within the CAMS data assimilation system should minimize the impacts of differences in spatial resolution between products, the differences in cloud filtering can lead to substantial differences in AOD spatial representativity between products at the model grid spatial resolution. Differences in spatial representativity can generate differences in AOD, which can be larger than the differences between collocated level-2 retrievals (Virtanen et al., 2018; Schutgens et al., 2017). The much lower AOD shown by SLSTR over the oceanic background aerosol is probably related to the overly stringent cloud filtering applied to the SLSTR L1B radiances. The SLSTR product relies on the native L1B cloud mask, which was originally designed for sea surface temperature retrieval and has proven to be too conservative for aerosol retrieval (EUMETSAT, 2021c). The SLSTR cloud mask frequently removes medium values of L1B radiances and thus medium AOD values over the ocean (SLSTR PVR, 2021), which leads to substantially reduced level-3 AOD values at the model grid resolution and explains the fragmented aspect of the aerosol plumes displayed by the level-3 SLSTR product. The negative departures between SLSTR and the model are more pronounced in the Southern and Northern Hemisphere for the DJF and MAM periods, respectively, which indicates a possible seasonality in the differences in spatial representativity due to cloud filtering. The magnitudes of the differences between the level-3 SLSTR and MODIS AOD over ocean reported in this study are mainly dominated by the differences in spatial and temporal representativity at the model spatial resolution due to cloud over-screening in the SLSTR product, which explains their larger values (MD of −0.08 and RMSD of −0.09) than the ones indicated in the SLSTR validation report for level-2 retrievals (SLSTR PVR, MD = −0.03 and RMSD = 0.05). A new cloud detection algorithm tuned for aerosol retrieval over ocean is under development at EUMETSAT, which should improve the consistency of level-3 AOD with the rest of the products at low AOD. While SLSTR shows under-representativeness issues, cloud residuals in VIIRS and MODIS can locally increase their 3-month average AOD value, which also contributes to the differences between products.
The differences between VIIRS and MODIS in the North Atlantic, where high cloud cover is frequent during the DJF period, can also be related to differences in cloud detection. The higher AOD values from Terra than Aqua over land at a latitude higher than 30∘ N can be due to the diurnal variation of cloud contamination (Painemal et al., 2015, 2020), which is generally more frequent during the early morning overpass of Terra during the DJF period. The use of a heavy aerosol detection test in the VIIRS algorithm reduces the commission errors between cloud and optically thick aerosols, which partly explains why VIIRS resolves the smoke plume in the Pacific where MODIS and PMAp show nosier spatial patterns due to cloud residuals. Finally, the higher spatial resolution of VIIRS and its reduced pixel deformation at the edge of the swath should improve cloud detection. This was demonstrated for the MAIAC MODIS product, which has a reduced cloud detection commission error compared to the MODIS standard product (Lyapustin et al., 2018).
5.2 Instrument geometry
Geometry is a key factor to understand the uncertainty in AOD retrieval since it influences the range of scattering angles sampled by the instrument and thus the degree of information content available for the retrieval (Fougnie et al., 2020; more details in Appendix A1).
Since the uncertainties in AOD retrieval vary with view angle and the length of the atmospheric path, the retrieval artifacts at the edge of the swath are expected to be larger for MetOp-B, which has a double swath compared to MetOp-A. Also, the differences in swath can generate distinct ranges of scattering angles sampled by the instrument, which contributes to the differences in AOD retrieval between MetOp-A and MetOp-B.
Despite the similarity between VIIRS and MODIS instruments, VIIRS has a smaller pixel deformation at the edge of the swath, which should limit geometry-induced biases compared to MODIS. In addition, the finer spatial resolution at which VIIRS retrieval is performed and its larger swath imply more frequent retrievals compared to MODIS (Sayer et al., 2019) and explain the larger spatial coverage of VIIRS over northern latitudes, central Africa, and South America. The VIIRS higher spatial resolution allows resolving finer spatial details such as the Australian fire smoke transport in the Pacific, which is not detected by MODIS and PMAp.
While one could expect a north–south structure bias in SLSTR retrievals due to more frequent unfavorable geometries (backscattering region) of the oblique view in the Northern Hemisphere (Fougnie et al., 2020), this is not shown in our results over ocean. But the impact could be stronger over anisotropic land surfaces. Other factors may also influence the information content of the SLSTR dual view, which varies not only along the swath in the north–south direction but also across the swath in a west–east direction and with seasons.
5.3 Measurement information content
VIIRS and MODIS are two imaging radiometers characterized by similar spectral information content, which can explain the overall better agreement between VIIRS and MODIS level-3 AOD compared to the rest of the products. This is consistent with the conclusions from Sayer et al. (2019), who showed that MODIS and VIIRS products capture similar temporal and spatial variations and have a similar level of uncertainty evaluated against AERONET. However, slight differences in spectral bands (e.g., blue bands) and the associated spectral response functions can play a role in the differences between MODIS and VIIRS, particularly at low AOD.
The GOME-2 instrument, which provides the main measurement to retrieve PMAp AOD, relies on a very different measurement technique compared to VIIRS and MODIS, with spectral information in the UV–Vis channel, which can explain some of the differences between PMAp and VIIRS or MODIS retrievals.
5.4 Radiometric calibration
AOD retrieval requires high radiometric accuracy of the input reflectance and consistency across bands and views. Small differences in sensor calibration and spectral response functions can have a large impact on AOD retrieval (Kaufman et al., 1997a), particularly for the ocean background associated with low AOD (Sayer et al., 2018b). The impact is larger for bright than dark surfaces since the error scales with the magnitude of the surface reflectance (Zhang et al., 2016). Upstream radiometric calibration uncertainties can explain a large part of the differences between retrievals from similar algorithms and instruments but from distinct platforms (Jourdan et al., 2007; Levy et al., 2013; Sayer et al., 2017). The positive offset of Terra over ocean compared to Aqua (Fig. 5), which has been acknowledged by various studies (Levy et al., 2018; Sogacheva et al., 2020), is partly related to a larger radiometric calibration degradation for Terra than Aqua, which is not corrected in the DT retrieval algorithm (Sayer et al., 2018b). Also, reflectances in the solar reflective bands of SNPP/VIIRS have been found to be systematically higher than those of NOAA20/VIIRS, which has a more consistent inter-channel calibration and a steadier calibration in time compared to SNPP/VIIRS (Uprety et al., 2020). Over land, where the surface reflectance and AOD are retrieved simultaneously from observed VIIRS TOA reflectance, the SNPP/VIIRS vs. NOAA20/VIIRS reflectance difference does not necessarily lead to a corresponding AOD difference. In contrast, over ocean, the surface reflectance is calculated from a model that is independent of instrument calibration, so a positive bias in the SNPP/VIIRS TOA reflectance directly translates into a higher AOD retrieval compared to NOAA20/VIIRS. The positive offset between PMAp-B and PMAp-A is also related to differences in GOME-2 radiometric performances (e.g., dark current, stray light, polarization) between MetOp-A and MetOp-B. A correction has been implemented in the new release 2.2.4 of PMAp (Grzegorski et al., 2022) that will be assessed in a future work. The good agreement between S3A and S3B retrievals is explained by radiometric alignment implemented in the SLSTR L1B processing after the tandem campaign between S3A and S3B in June–October 2018. Radiometric calibration residuals can also explain part of the bias of the SLSTR product at very low AOD (SLSTR PVR, 2021).
5.5 Surface reflectance parameterization
Over the ocean background, AOD retrieval at low AOD (less than 0.2) is very sensitive to small errors in the surface reflectance, which are frequently due to uncertainties in near-surface wind speed parameterization (Sayer et al., 2018b). This can explain the large diversity in AOD values observed over the Southern Ocean where large near-surface wind speeds are frequently underestimated by meteorological forecast datasets (Bentamy et al., 2021). In addition, differences in wind speed between meteorological datasets (NCEP for VIIRS and MODIS versus ECMWF for SLSTR and PMAp) can also play a role in the differences between retrievals. Finally, the way the wind speed is accounted for in the lookup table (LUT) can influence the retrieval. For example, the MODIS retrieval LUT contains nodes at four fixed wind speed values (2, 6, 10, 14 m s−1) to generate the surface reflectance, which may be too coarse to accurately represent the impact of wind speed variability. Similarly, inaccuracies in the wind speed and wind direction influence the estimation of the glint and whitecap components of the ocean BRDF model, which have been identified as possible sources of the negative bias of the SLSTR product at low AOD (SLSTR PVR, 2021).
Over land, surface reflectance models may fail to represent the angular variations of surface reflectance over highly complex land terrain or the seasonal and interannual variability of the surface reflectance (Kokhanovsky et al., 2007; Liu et al., 2014; Huang et al., 2016; Tao et al., 2017). The underestimation of AOD retrieved from the MODIS DB algorithm over desert can be partly related to inaccurate representation of dust regional variability in the surface reflectance database used in the MODIS DB retrieval (Hsu et al., 2019).
5.6 Aerosol models
Inconsistencies in aerosol properties between algorithms can generate large differences in AOD retrieval (Kokhanovsky et al., 2007; Levy et al., 2013). Most retrieval algorithms rely on a limited number of broad classes of aerosol models, which may not be sufficient to represent the spatial and temporal variability of actual aerosol properties such as the large variability in particle shape, size, and mineralogy composition of dusts, the large variations in aerosol optical properties over polluted regions due to the impact of transport, aging, and secondary organic aerosol processes, and the variability in smoke properties related to type of fuel and surface moisture conditions (Shi et al., 2011; Ichoku et al., 2003; Sayer et al., 2013; Huang et al., 2016). While spherical assumption is a good approximation for sulfate and carbonaceous aerosols (Martins et al., 1998), it can lead to geometry- and spectral-dependent biases in AOD for dust (Mishchenko et al., 1995; Torres et al., 1998; Levy et al., 2013; Sayer et al., 2018a; Zhou et al., 2020).
VIIRS and MODIS exploit distinct aerosol models, which can explain part of the larger VIIRS AOD values over biomass burning and desert regions. Tao et al. (2017) showed that the dust-scattering properties are overestimated in the MODIS DB algorithm, which results in a negative AOD bias over desert regions. Also, the spherical dust model used in the DT over ocean was shown to introduce a positive bias in the case of high dust load (Zhou et al., 2020), which could explain the larger MODIS AOD than VIIRS over the dust outbreak in the mid-Atlantic (5–10∘ N, Fig. 5). This can also play a role in the differences between MODIS and SLSTR (SLSTR validation report), but it is probably of second order compared to the differences in spatial representativity. Finally, our results indicate differences between MODIS and VIIRS over the polluted hot spots in China that can be related to differences in the fine-mode aerosol models used in both retrieval algorithms.
5.7 Regional and seasonal differences between products
The global distribution of AOD has a strong regional and seasonal dependency, particularly with respect to biomass burning events and dust outbreak, which influences the differences between satellite AOD products.
Over land, the sources of differences between products at large AOD are primarily related to the aerosol models and the representation of the surface reflectance anisotropy (Sayer et al., 2019; Schutgens et al., 2020). Retrievals are frequently more uncertain and more diverse over bright (e.g., bare, desert), complex (e.g., urban, mountains), and elevated terrains, where the strong surface anisotropy requires a higher degree of information content to retrieve AOD (de Leeuw et al., 2018; Wei et al., 2019b; Schutgens et al., 2020). In addition, our results show lower MODIS values than VIIRS over the Taklamakan desert, the Bodélé depression, the Sahel, and central Australia, which represent major global dust sources.
Over ocean, the sources of differences at low AOD mainly arise from small differences in the calculated surface reflectance mainly due to cloud contamination, calibration uncertainties, and inaccurate wind speed parameterization (Zhang et al., 2005; Smirnov et al., 2009; Sayer et al., 2018b). Product diversity increases in the Southern Ocean where PMAp and MODIS exhibit noisy spatial patterns and SLSTR has larger departure with the model. A systematic positive AOD anomaly, referred as the enhanced southern oceans anomaly (ENSOA), which has been reported for various satellite AOD products (e.g., MODIS, MISR) over middle- to high-latitude southern oceans (45 to 65∘ S), is likely due to unfiltered stratocumulus and low broken cumulus clouds, inaccuracy in ocean surface albedo assumptions, high wind speed, inaccurate aerosol models, and floating ice (Zhang et al., 2005; Shi et al., 2011; Toth et al., 2013).
Finally, our results indicate slightly larger diversity between AOD products for the MAM period compared to the DJF period over land, which is related to seasonality in dust and biomass burning events. However, while both DJF and MAM periods encompass a large range of aerosol events representative of global aerosol variability, AOD products should be monitored over a longer period in further works to better resolve the seasonal and interannual variability of aerosols such as the North American and Siberian fires that occur during the June–September period.
The objective of this work is to evaluate two new NRT satellite AOD products to prepare for their assimilation into the CAMS data assimilation system, namely the Copernicus SLSTR AOD (C1) from Sentinel-3A/B over ocean and the NOAA EPS VIIRS AOD (v2r1) from SNPP and NOAA20 over both land and ocean. The diversity between MODIS (C6.1), PMAp (v2.1), VIIRS (v2r1), and SLSTR (C1) AOD products as well as their differences from the model (IFS CY47R1) were assessed separately over land and ocean at the model grid resolution (level-3) using 3-month AOD average (December 2019–February 2020 and March–May 2020). The outcomes of this work concern level-3 AOD from the perspective of its use in the CAMS data assimilation system, which may not directly apply to level-2 retrievals at their native spatial and temporal resolution.
SLSTR AOD shows much smaller level-3 values than the rest of the products (MD between SLSTR and VIIRS and between SLSTR and MODIS is −0.06 and −0.09, respectively). PMAp shows the largest variability at global scale and the largest discrepancies across platforms: PMAp-B has a large positive offset compared to the other products, while PMAp-A is closer to Terra/MODIS. VIIRS and MODIS AOD show the best agreement among the investigated products; this is related to instrument and retrieval algorithm similarities compared to PMAp and SLSTR, which rely on different measurement techniques and retrieval approaches. However, VIIRS is frequently smaller than MODIS over oceanic background aerosol (global MD between VIIRS and MODIS is −0.02) and shows more pronounced negative departure with the model than MODIS. Over land, VIIRS AOD is frequently larger than MODIS and shows larger positive departure with the model over dust source (e.g., Taklamakan desert, Bodélé depression, Sahel, central Australia, Central America) and biomass burning (e.g., Australia, central Africa, South America) regions.
The main sources of diversity between retrievals over land at large AOD (e.g., dust and biomass burning regions) are mainly related to the differences in aerosol models (e.g., refractive index and particle size) and the representation of the surface reflectance anisotropy, while for the ocean background, which is generally characterized by low aerosol burden, differences between retrievals mainly arise from uncertainties in cloud detection, radiometric calibration, and the ocean surface reflectance model used in the retrieval algorithm. Cloud filtering criteria (permissive vs. conservative) can generate large differences in spatial and temporal representativity between products at the model grid spatial resolution. The overly stringent cloud mask used in the SLSTR product explains part of the smaller level-3 AOD values of SLSTR compared to the rest of the products. The use of heavy aerosol detection tests helps to reduce cloud contamination commission errors as demonstrated by the detection of the smoke transport over the Pacific by the VIIRS product, while PMAp and MODIS show nosier spatial patterns due to cloud contamination. The consistency in cloud filtering between products should be properly evaluated and improved to minimize the differences in spatial representativity at the model grid spatial resolution. A compromise should be found between (i) a strict enough cloud filtering to assimilate the best-quality retrievals and (ii) enough spatial coverage to resolve the aerosol plumes and properly sample the global and regional AOD distribution. The geometry characteristics of the instrument (swath, spatial resolution, view angle), which drive the range of scattering angles sampled by the instrument, can also explain a large part of the differences between retrievals such as the positive offset between PMAp from MetOp-B and MetOp-A. Finally, uncertainties in upstream radiometric calibration are a major source of differences between retrievals from the same instrument but on board distinct platforms as shown by the positive offset over ocean between Terra/MODIS and Aqua/MODIS retrievals due to the non-corrected radiometric calibration degradation of Terra/MODIS in the DT algorithm and between SNPP/VIIRS and NOAA20/VIIRS retrievals related to the positive bias in the solar reflective bands of SNPP/VIIRS.
The assessment of AOD product diversity within the CAMS data assimilation system provides meaningful information to design an accurate multi-satellite AOD data assimilation system. In particular, the consistency between the NASA MODIS and NOAA EPS VIIRS AOD products reported in this paper shows that the assimilation of VIIRS will ensure the continuity of the CAMS data assimilation system, and it will strengthen the resilience against a possible future failure of MODIS. This work shows that the NOAA VIIRS product will enhance the spatial coverage of AOD observations and provide a more accurate detection of smoke plumes. However, the conclusions reported in this paper are not sufficient to automatically include the additional AOD observations into the CAMS system, and further assimilation tests are planned and will be reported on in a follow-up paper. For example, there is a need to understand how the differences between MODIS and VIIRS over ocean and land will impact the analysis. While the magnitude of the mean deviation between the products is relatively small over the ocean (and certainly much smaller than over land), the low AOD value of the ocean background means that a slight difference in AOD between products will have a large impact on data assimilation. For instance, since VIIRS has lower values than MODIS over the ocean, its assimilation will likely decrease the analysis values over the ocean, which are currently known to be too high due to the positive offset of Terra/MODIS, if no bias correction is applied. Over land, the larger VIIRS AOD for biomass burning and dust source regions should increase the analysis values, which may affect AOD and surface particle matter predictions over these regions. Besides the departures between products retrieved from different instruments or different satellite platforms, this work provides information on how bias correction needs to be applied within the system. This work suggests that it would be preferable to use NOAA20/VIIRS as an anchor and apply bias correction to SNPP/VIIRS, which was found to be positively biased over ocean. Our results also highlight the role of geometry in retrieval uncertainties that can lead to systematic differences between products. Adding the scattering angle in the current variational bias correction scheme implemented in the CAMS data assimilation system could help to represent any geometry-dependent biases in the retrieval. Moreover, since AOD global distribution has a strong seasonal variability, the study period needs to be extended in future works to characterize the seasonal dependence of the departure between AOD products, particularly with respect to biomass burning and dust outbreak events. Finally, the observation error is an important variable to weight the relative contribution of each satellite observation to the analysis. Further work is required to evaluate the retrieval error associated with each product, which could be inflated to better reflect the larger diversity between products reported in the Southern Ocean and over bright land surfaces.
A1 General characteristics
The main difficulty in retrieving AOD from TOA reflectance measurements is to disentangle the respective contributions of the aerosol and the surface reflectance. The measurement information content available to retrieve AOD is strongly constrained by the domain of the aerosol phase function which is sampled by the instrument (Fougnie et al., 2020). Retrieval conditions are generally more favorable in the forward domain, for which the amplitude of the aerosol signal is the largest, the sensitivity of the phase function to the aerosol models is low, and the surface signal is weak. Retrieval is more complex in the backscattering region where the TOA reflectance is dominated by the surface signal and the retrieval is very sensitive to uncertainties in the aerosol models. The range of scattering angles resolved by the instrument varies along-track (north–south direction), across-track (west–east direction), and with the season (Fougnie et al., 2020). Complexity increases over land bright surfaces, where geometrical scattering from individual surface elements with size larger than the wavelength generate large reflectance anisotropy. The second source of difficulty is the regularization of the retrieval inverse problem, which frequently requires a priori knowledge of both the surface reflectance (e.g., spectral relationships, surface reflectance database) and the aerosol optical properties (e.g., particle size distribution and refractive index) (Kaufman et al., 1997b ; Dubovik et al., 2011; Levy et al., 2013; Hsu et al., 2019; Li et al., 2019).
Prior to the retrieval, several brightness and variability tests are generally applied to the TOA reflectances of selected spectral bands to screen out residual clouds, sediment contamination, and nonoptimal surface pixels. Then AOD is generally retrieved by minimizing the residuals between the TOA reflectances measured by the satellite for a given sun and satellite geometry as well as the theoretical values which have been pre-computed from a radiative transfer model (RTM) for a set of candidate aerosol models and stored in a lookup table (LUT). Over ocean, the surface reflectance is generally computed from an ocean surface reflectance model, which explicitly represents the contributions from the sun glint and the whitecap as a function of wind speed, and the reflection from within the water (Limbacher and Kahn, 2014; Sayer et al., 2018a, b; Garay et al., 2020); AOD is retrieved independently. Over land, both surface reflectance and AOD can be simultaneously retrieved if the measurement information content is high enough (Fougnie et al., 2020)
Retrievals are generally associated with (i) a quality assessment (QA) flag which quantifies the overall confidence in the retrieval and is computed a posteriori from tests on the inputs and outputs of the retrieval algorithm and (ii) an error which can be a prognostic output from the optimization algorithm or a diagnostic computed a posteriori by evaluating the retrieval against ground observations (Sayer et al., 2020).
A2 Satellite retrieval algorithm
Below we provide a summary of the retrieval algorithm of each product. The validation statements given for each product were taken from validation reports and relied on distinct methodology as well as different spatial and temporal sampling.
A2.1 MODIS Dark Target (ocean and land)
AOD is retrieved over a 10 × 10 MODIS pixel retrieval box (∼ 10 km at nadir) from the MODIS TOA reflectances, which have been averaged over the retrieval box.
Over ocean, the surface reflectances in six spectral wavelengths (0.55, 0.65, 0.86, 1.24, 1.63, and 2.11 µm) are computed for various combinations of fine-mode (selected from four models) and coarse-mode (selected from five models) aerosols, which are characterized by a single-mode lognormal size distribution and a spherical shape. Since collection 6.0, the ocean surface reflectance has exploited a varying wind speed taken from the NCEP forecast.
Over land, four aerosol models are prescribed as a function of location and season. This includes three fine-mode-dominated models, which are characterized by a bi-lognormal size distribution, a spherical shape, and distinct single-scattering albedo, and a dust coarse-mode-dominated model, which is bi-lognormal and non-spherical. The solution is a combination of the dust and one of the fine-mode models. Spectral relationships between the bands at 0.47, 0.65, and 2.11 µm, which are functions of NDVI and the scattering angle, are used to constrain the algorithm over vegetated areas. When not enough samples have been selected within the 10 × 10 retrieval box, an alternative retrieval is triggered using only the continental aerosol model characterized by a three-mode lognormal size distribution and a spherical shape.
Each output is associated with (i) QA information derived from tests on the number of pixels selected within the 10 × 10 retrieval box and the degree of realism of the solution as well as (ii) a diagnostic error which has been computed as a function of AERONET AOD (Table 1).
Terra/MODIS DT was shown to frequently be the highest over open-ocean conditions (Zhang et al., 2017; Sayer et al., 2018b; de Leeuw et al., 2018; Sogacheva et al., 2020). It has a positive offset at low AOD, which scales with AOD and is mainly related to the calibration degradation of the Terra/MODIS blue band (Levy et al., 2013; Sayer et al., 2018a, b; Sogacheva et al., 2019). Validation results for collection 6.1 are reported at https://darktarget.gsfc.nasa.gov/validation/results (last access: 9 November 2022). For Aqua/MODIS the bias and the RMSE evaluated against AERONET are 0.023 and 0.096 over ocean and 0.013 and 0.1 over land. For Terra/MODIS the bias and the RMSE are 0.039 and 0.099 over ocean and 0.029 and 0.106 over land. The percentages of samples within the expected error range are 83 % and 76 % over ocean and land, respectively, for Aqua and 77 % and 73 % over ocean and land, respectively, for Terra.
A2.2 MODIS Deep Blue (land)
The Deep Blue algorithm was first implemented in MODIS collection 5 to fill in the dark target gaps over bright land surfaces (Hsu et al., 2013). Since collection 6.0, an enhanced DB algorithm, which includes updated cloud detection and modified aerosol models, has been applied to both bright and vegetated areas. Additional modifications were applied in collection 6.1, which includes updated radiometric calibration to L1b radiances, improved internal smoke detection, improved surface reflectance database over rugged and elevated terrain, and updated parameters of the pixel-level uncertainties (more details at https://atmosphere-imager.gsfc.nasa.gov/sites/default/files/ModAtmo/modis_deep_blue_c61_changes2.pdf, last access: 9 November 2022). Conversely to DT, DB applies the corrections for the radiometric degradation of the 0.412 and 0.470 µm blue bands of Terra/MODIS. DB retrieval is first performed at 1 km, and then the 1 km retrievals are averaged over a 10 × 10 MODIS pixel box. The DB algorithm retrieves AOD and the fraction of two aerosol models from the radiances in the 0.412 and 0.47 µm spectral bands (Hsu et al., 2004). Distinct paths are used to estimate the surface reflectance depending on the surface type.
- a.
Over vegetated surfaces, the surface reflectances in the blue (0.47 µm) and the red (0.65 µm) are estimated using spectral relationships between these bands and the SWIR (2.1 µm). These relationships were derived from collocated MODIS observations with AERONET data, which were stratified by geometry, land cover types (cropland and natural vegetation), season, and vegetation amount quantified by a vegetation index (NDVI).
- b.
Over bright surfaces (desert and mountains), a database of surface reflectance was derived from 7 years of MODIS data for each season and for different ranges of NDVI. The surface reflectance is parameterized as a function of the scattering angle to account for the non-Lambertian properties of the surface.
- c.
Over urban and cropland transitional regions, to account for the strong surface heterogeneity and anisotropy, the angular shapes of the surface BRDF were derived from collocated AERONET and MODIS measurements for distinct seasons and ranges of NDVI values (Hsu et al., 2013). The derived angular shapes are then combined with the surface reflectance values derived from the surface reflectance database at a scattering angle of 135∘.
A total of 10 fine-mode and 5 coarse-mode aerosol models with spherical shape are employed in the retrieval. The size distributions and single-scattering albedo of the fine-mode models are region-dependent. Since collection 6.0, they have represented smoke and weakly absorbing aerosols to cover vegetated areas. Coarse-mode models employ the same phase function but have distinct single-scattering albedo (Hsu et al., 2004). Since collection 6.0, MODIS infrared channels have been used to identify extremely absorbing mineral dust prior to retrieval. An AOD is independently retrieved at each spectral band by selecting a single aerosol model. Then AOD at 0.55 µm is derived from the estimated AOD spectral dependence.
Each retrieval is associated with a QA based on residual cloud contamination, scene heterogeneity, and number of retrieved AOD pixels within each 10 × 10 retrieval box (Sayer et al., 2013). A pixel-level uncertainty, defined as 1 standard deviation Gaussian confidence interval, is computed from linear functions of MODIS AOD and solar and view geometry (Sayer et al., 2013). The parameters of the expected error for collection 6.1 can be found at https://atmosphere-imager.gsfc.nasa.gov/sites/default/files/ModAtmo/modis_deep_blue_c61_changes2.pdf (last access: 9 November 2022).
The evaluation of MODIS DB against AERONET measurements showed a bias less than 0.01, an RMSE of 0.012, 80 % of retrievals within the algorithm expected error, and 45 % of retrievals within the GCOS uncertainty requirement (Sayer et al., 2019). The bias is generally small for background aerosol (AOD less than 0.2), and the negative bias increases from fine mode to dust. Regionally, performances are lower over biomass burning regions in southern Africa, mixed polluted and dust sites in India, China, Southeast Asia, and desert sites where AOD is frequently underestimated (Tao et al., 2017; Sayer et al., 2019).
A2.3 VIIRS NOAA EPS
The NOAA EPS NRT AOD product v2r1, derived from the Visible/Infrared Imager Radiometer Suite (VIIRS) on board the Suomi National Polar-orbiting Partnership satellite (SNPP) and the NOAA20 platform, is provided at the native pixel size of 0.750 km (Laszlo and Liu, 2020). Several internal tests are applied to the input TOA reflectances to filter out residual cloud-contaminated observations, sea ice, shallow water, and glint as well as to identify heavy smoke and dust aerosols. The algorithm exploits the 6S-V1.1 radiative transfer model to account for aerosol extinction, molecular scattering, and gas absorption, as well as to couple the surface with the atmosphere. Final retrievals are categorized into four quality assurance levels based on internal tests and the retrieval residuals (Laszlo and Liu, 2020). Only the best-quality retrievals are selected for this work.
Over land, the TOA radiances at 0.412 µm (M1), 0.445 µm (M2), 0.488 µm (M3), 0.672 µm (M5), and 2.25 µm (M11) are used. The algorithm estimates the surface reflectances from the red (M5) or the SWIR (M11) TOA reflectances because, compared to the shorter wavelength bands, these bands have lower sensitivity to atmospheric scattering and higher sensitivity to surface reflectance. AOD is generally retrieved from the M3 blue band, where the aerosol signal is strong and the surface is dark, because this band is close to the nominal wavelength (0.55 µm) where AOD is reported. The aerosol model corresponding to the retrieved AOD is selected using residuals, which are the departures of the TOA reflectances calculated at the rest of the spectral bands for a finite number of candidate aerosol models from the observed reflectances. For dark vegetated surfaces, linear spectral relationships between M5 and M11, M3 and M5, M2 and M3, M1 and M3, and M11 and M5 were pre-computed for distinct land cover types as a function of NDVISWIR, the M5 M4 TOA reflectance ratio, and the glint angle. For bright surfaces, the surface reflectance ratios with M5 are parameterized as a linear function of the scattering angle (using distinct parameterization for forward and backward geometries). They are derived at global scale from a static database at 0.1∘ spatial resolution, which was computed using 2 years of VIIRS TOA reflectances over bright surfaces (Zhang et al., 2016). Over North Africa and the Arabian peninsula regions, a dust aerosol model is selected, the M3 spectral band is used to retrieve AOD, and the residuals are calculated from M1 and M2. Over the rest of bright regions, AOD is retrieved from M1, which is better suited for AOD retrieval than M3 over bright surfaces, and the residuals are calculated using M2 and M3. The algorithm employs four aerosol models, namely generic, smoke, and urban fine-mode-dominated models along with a dust coarse mode, which are all characterized by a bimodal lognormal aerosol size distribution, spherical shape for the fine-mode models, and a spheroid shape for the dust model. These models are essentially based on the collection 6 MODIS DT models. However, unlike the MODIS DT algorithm, which assigns the models to distinct geographical regions, the NOAA EPS algorithm dynamically selects the aerosol model based on the value of the residual.
Over ocean, the retrieval employs the 0.555 µm (M4), 0.672 µm (M5), 0.746 µm (M6), 0.865 µm (M7), 0.1240 µm (M8), 1.610 µm (M10), and 2.25 µm (M11) spectral bands. A typical model of ocean surface reflectance, which represents the contributions from bidirectional sun glint as well as Lambertian dark underwater and whitecap reflections, is exploited. Five coarse-mode and four fine-mode candidate aerosol models with spherical shapes (adopted from Remer et al., 2006) are used. Combination of the fine and coarse modes corresponding to varying fractions results in a large number of candidate aerosol models. AOD for each combination of fine and coarse mode is estimated using the M7 channel because of its low sensitivity to underwater reflectance and sufficient sensitivity to aerosols. The residuals at the rest of the spectral bands are used to select the best aerosol model. The outputs are the fine- and coarse-mode aerosol models, the fine-mode fraction, and the total AOD.
Parametric formulations of pixel-level uncertainty were derived from a posteriori evaluations against AERONET over land and ocean. Conversely to MODIS DB, no Gaussian assumption on the error distribution is applied, and the expected error is estimated from the adjustment of the bias and the error variance as a function of the VIIRS AOD (Huang et al., 2016).
A first evaluation against AERONET for the period from October 2012 to March 2016 indicates bias and error standard deviation of 0.01 and 0.1, respectively, over land and 0.03 and 0.05 over ocean (Laszlo, 2018). The ATBD (Table 2.1, Laszlo and Liu, 2020) provides accuracy and precision of AOD retrieval for three AERONET AOD ranges over land and two over ocean.
A2.4 Copernicus NRT SLSTR
The Optimized Simultaneous Surface-Aerosol Retrieval for Copernicus Sentinel-3 (OSSAR-CS3) is the reference EUMETSAT processor generating the NRT aerosol product, including AOD at 0.55 µm, derived from the radiances of the Sea and Land Surface Temperature Radiometer (SLSTR) dual-view instrument on board Sentinel 3-A and 3-B (EUMETSAT, 2021b). The collection 1.0 released in August 2020, which was available at the time of this work, is evaluated over ocean only. The following also includes a description of the land algorithm implemented in collection 2.0 (released in October 2021).
Prior to aerosol retrieval, absolute, inter-band, and dual-view calibration corrections are applied to reduce the SLSTR radiance calibration uncertainties. The original L1B cloud mask is used over ocean, while a specific cloud mask was designed to correct for under-screening deficiencies in the current L1B cloud mask over land. The aerosol product is provided at 9.5 km spatial resolution by aggregating a block of 19 × 19 native SLSTR pixels to reduce the impacts of surface heterogeneity, mitigate co-registration errors across views, and decrease the retrieval computing time. The retrieval is triggered if only more than 50 % of any of the 19 × 19 SLSTR pixels within each block are cloud- and glint-free. A posteriori quality control tests, which include AOD spatial variability, residual of the spectral fit, and reflectance brightness tests, are applied to flag AOD retrievals possibly contaminated by cloud and snow or ice residuals, contaminated by sediments in coastal areas, or impacted by other sources of uncertainties such as high ocean color signal and bright surfaces in the case of unfavorable geometries. A prognostic uncertainty (1 standard deviation) is computed at the pixel level from the second derivative of the cost function at the optimal AOD.
OSSAR-CS3 employs the 6SV RTM to compute the surface reflectance for a set of pre-defined aerosol models which are a linear combination of two coarse modes (sea salt, desert dust) and two fine modes (weakly and strongly absorbing). A spherical particle shape is assumed except for dust, which is modeled as a spheroid particle (Dubovik et al., 2006). Over ocean, the retrieval relies on only the spectral information content of S2, S3, S5, and S6 spectral bands from all available views, which are used as independent spectral observations. The surface reflectance is pre-calculated using an ocean BRDF model, which includes contributions from glint, white foam, and ocean color and uses the wind speed from the ECMWF forecast. Over land, the S1, S2, S3, S5, and S6 spectral bands are exploited. Spectral weights have been applied to the SLSTR radiances to limit the impacts of their uncertainties on the retrieval for given surface types and geometry configurations. The retrieval algorithm is a combination of the North et al. (1999) dual-angular model, used in a joint aerosol–surface reflectance fit, and a spectral first guess for the red surface reflectance derived from the NIR or the SWIR radiances (EUMETSAT, 2021b). The weights between the two approaches are a function of land surface type and dual-view geometry configuration. The dual-angular model is favored for low scattering angles and over bare soils, while the spectral constraint is required to compensate for the uncertainties of the dual-angular model at large scattering angles (>110∘) and over developed vegetation.
Level-2 AOD evaluation results (EUMETSAT, 2021c) against 1.5 years of AERONET observations showed good performances of the collection 1 over ocean, with a correlation of 0.9, a bias between −0.01 and −0.03 for AOD <0.1, an RMSE of 0.06, and a compliance with GCOS uncertainty between 66 % and 72 %. Land collection 2 retrieval showed lower performances compared to ocean, with correlation, bias, RMSE, and a GCOS fraction of 0.77 %, 0.061 %, 0.169 %, and 29 %. Correlation with AERONET is lower at low AOD in the case of unfavorable geometry for which the discrimination between the low aerosol signal and the high surface reflectance is largely uncertain.
A2.5 PMAp
The Polar Multi-Sensor Aerosol Product (PMAp) is derived from observations from the combined use of the GOME-2 UV–Vis spectrometer, the IASI Fourier transform infrared sounding interferometer, and the AVHRR radiometer on board MetOp-A, MetOp-B, and MetOp-C (Grzegorski et al., 2022). The PMAp v2.1 dataset from MetOp-A and MetOp-B, which was available at the time of this work, is used in this work. A new version of PMAp (2.2.4) has been recently released and has been used in the operational CAMS system since July 2021.
PMAp is produced at the spatial resolution of GOME-2 (5 × 40 km2 for MetOp-A and 10 × 40 km2 for MetOp-B). The linearly polarized radiances measured by the GOME-2 Polarisation Measurement Devices (PMDs) are used to derive unpolarized and polarized TOA reflectances, which are both the inputs of the AOD retrieval algorithm. A radiometric correction scheme was implemented to account for the spectral degradation of GOME-2 reflectances due to the aging of the instrument.
AVHRR observations are used for cloud detection, cloud fraction estimation, and cloud correction calculation. A preliminary classification of aerosol optical properties is performed prior to retrieval. This includes (i) computation of a dust index exploiting the IASI infrared thermal spectra, (ii) identification of volcanic ash exploiting both AVHRR and IASI observations as well as the GOME-2 UV index, and (iii) a fine- and coarse-mode discrimination derived from AVHRR spectral ratios. The retrieval relies on separate LUTs for ocean and land, which contain the reflectances and Stokes fractions for 10 PMD bands and various aerosol models (up to 29 aerosol models, but in the current version 9 models are used for ocean and 5 for land). Over ocean, the surface reflectance is pre-computed in cloud-free conditions using ECMWF wind speed forecast and estimated chlorophyll concentration. A default chlorophyll concentration value is used for partially cloudy pixels. Over land, the algorithm exploits a priori information on surface reflectance derived from the GOME-2 Lambertian-equivalent reflectance monthly climatology (Tilstra et al., 2017). The angular dependency of surface reflectance is accounted for using GOME-2 viewing angle information content (Tilstra et al., 2021). The candidate aerosol models identified in the pre-processing step are used to derive a series of AOD estimates using unpolarized GOME-2 reflectance at specified channels for ocean (0.650 µm) and land (0.410 and 0.470 µm). Both unpolarized and polarized reflectances are used in the optimization process to retrieve AOD.
QA information is computed depending on wind speed, geometry configuration, aerosol type pre-classification, cloud and thick aerosol screening, quality of fit, and range of AOD values. A prognostic error is computed as 1 standard deviation of a set of a minimum of 30 AOD estimates obtained using perturbations of selected input parameters of the retrieval algorithm. Additional information on PMAp retrieval can be found at https://www.eumetsat.int/media/39243 (last access: 9 November 2022).
The validation of PMAp v2.1 against AERONET within the June–September 2013 and February–May 2015 reference periods indicated a better correlation over ocean (∼ 0.8) than over land (∼ 0.6). Over ocean, the range of slope and offset of the best-fit line are 0.5–0.8 and 0.04–0.1, respectively. Over land, the range of slope and offset of the best-fit line are 0.5–0.7 and 0.1–0.2, respectively (Tables 3 and 4 on page 19 of the PMAp validation report, available at https://www.eumetsat.int/media/40632, last access: 9 November 2022).
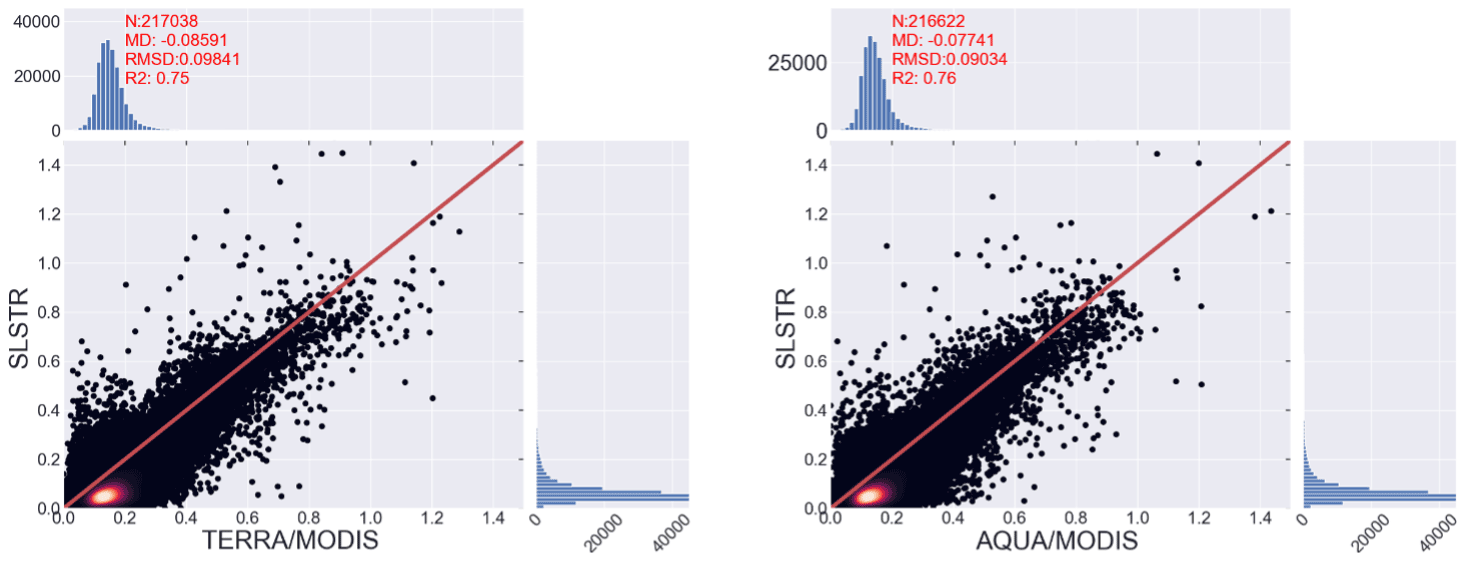
Figure B1S3A/B–SLSTR vs. MODIS AOD scatter plots of temporal mean AOD over ocean for the DJF period.
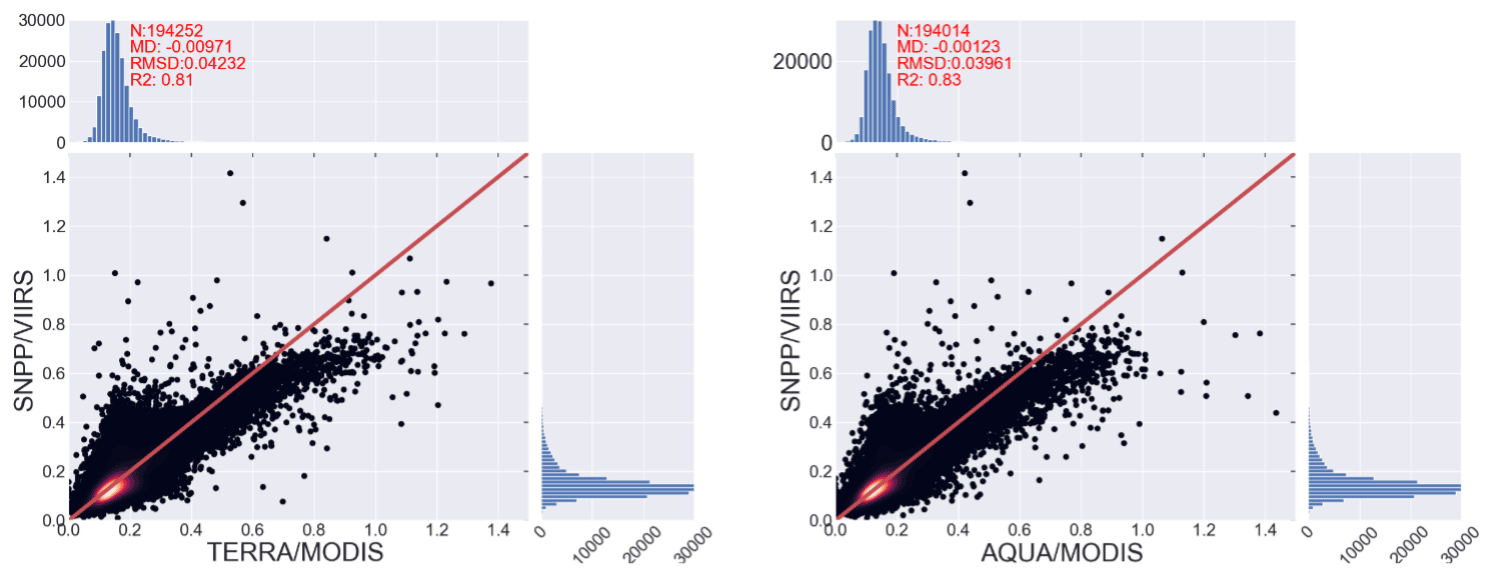
Figure B2SNPP/VIIRS vs. MODIS AOD scatter plots of temporal mean AOD over ocean for the DJF period.
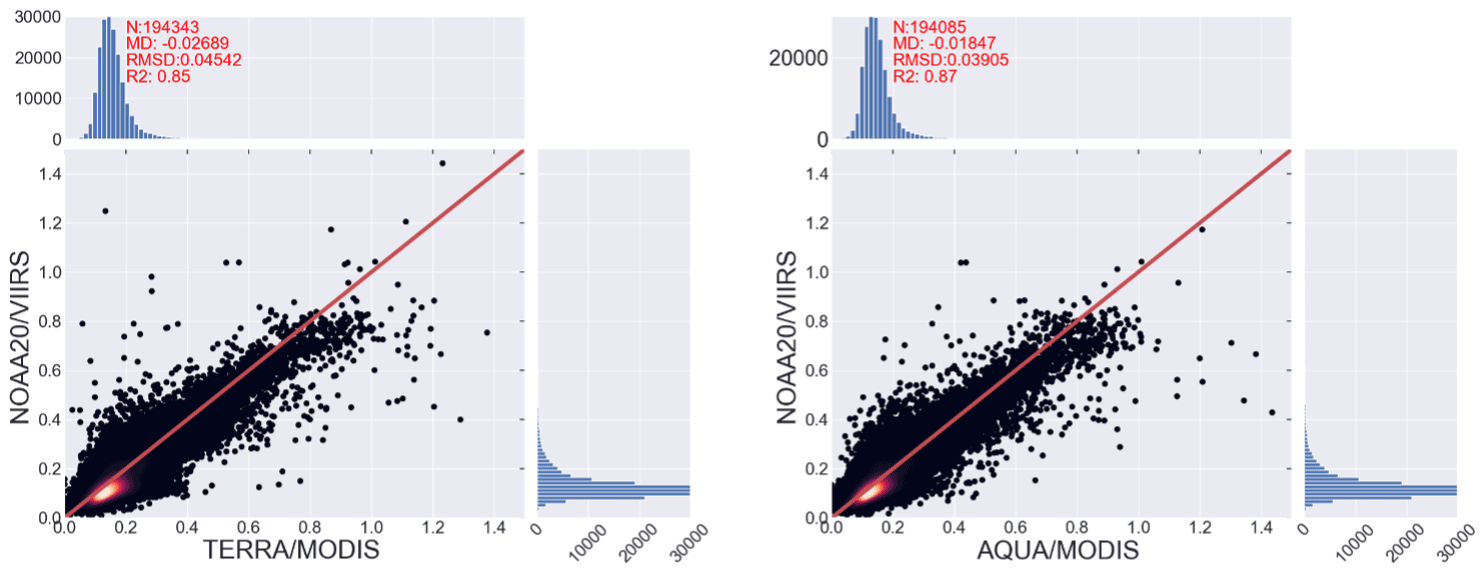
Figure B3NOAA20/VIIRS vs. MODIS AOD scatter plots of temporal mean AOD over ocean for the DJF period.
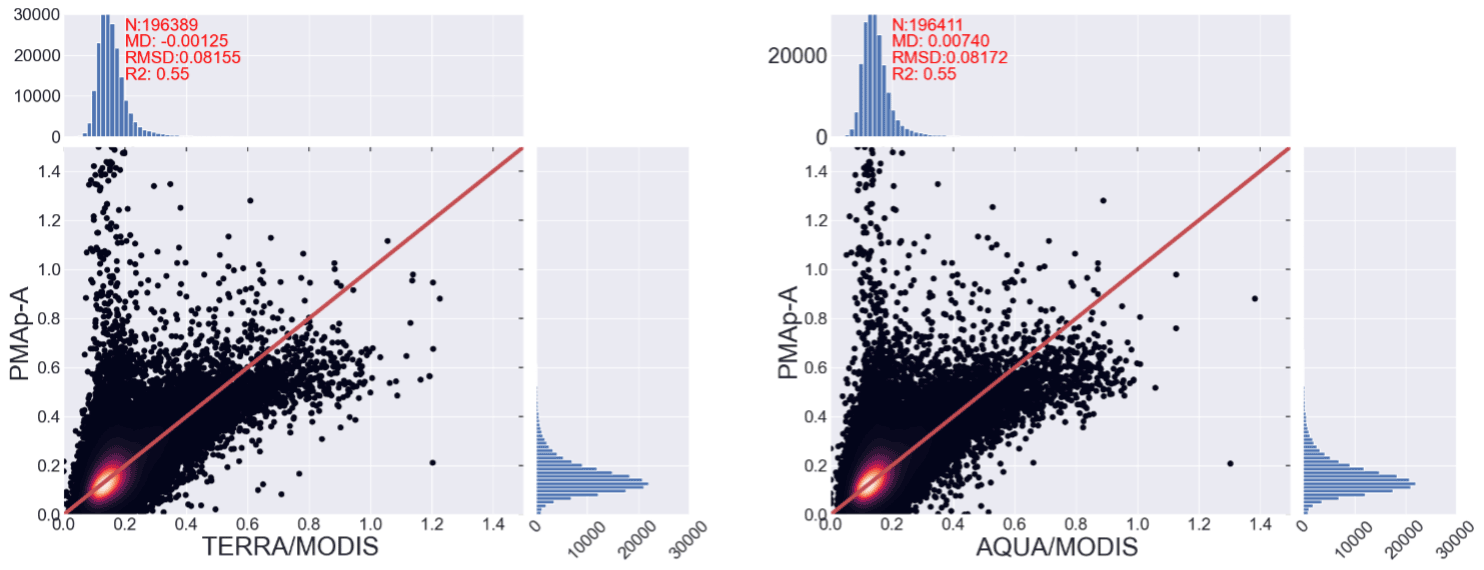
Figure B4PMAp-A vs. MODIS AOD scatter plots of temporal mean AOD over ocean for the DJF period.
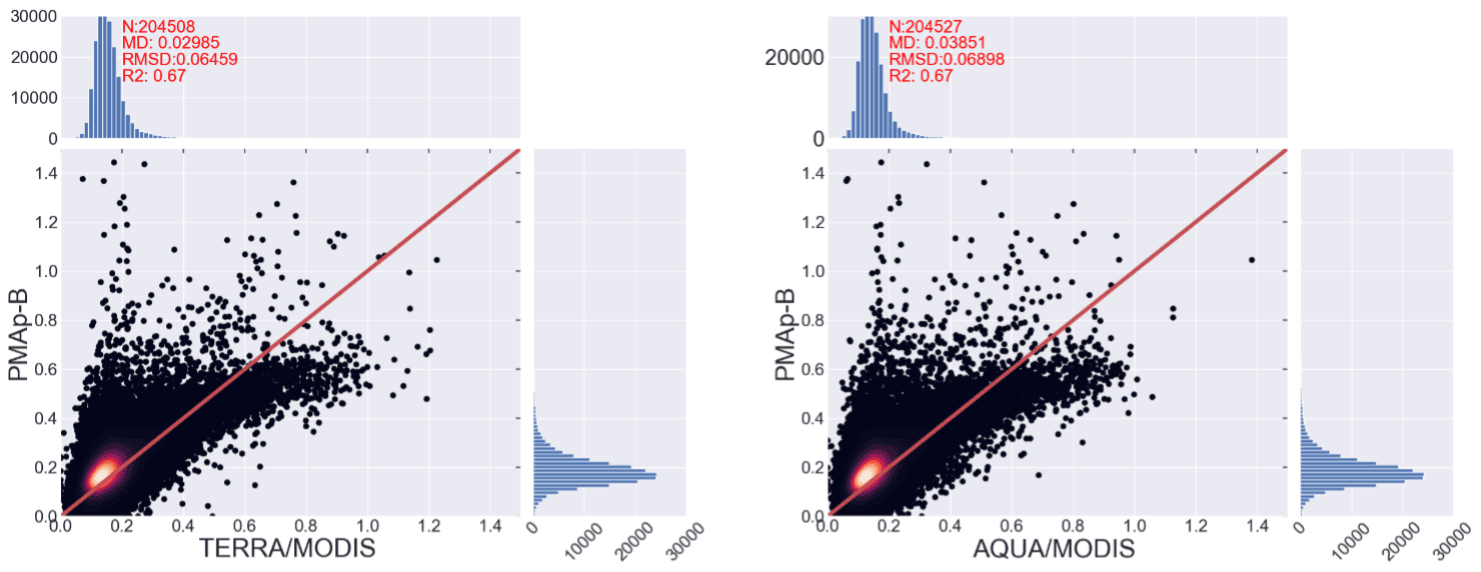
Figure B5PMAp-B vs. MODIS AOD scatter plots of temporal mean AOD over ocean for the DJF period.
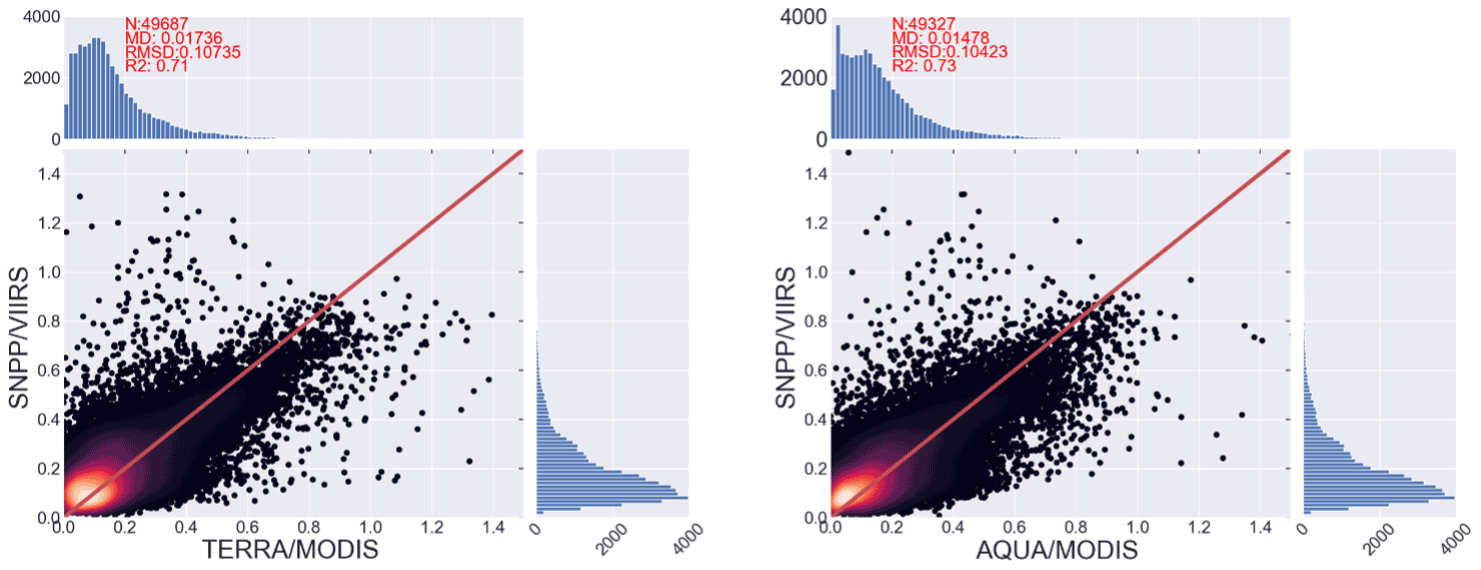
Figure B6SNPP/VIIRS vs. MODIS AOD scatter plots of temporal mean AOD over land for the DJF period.
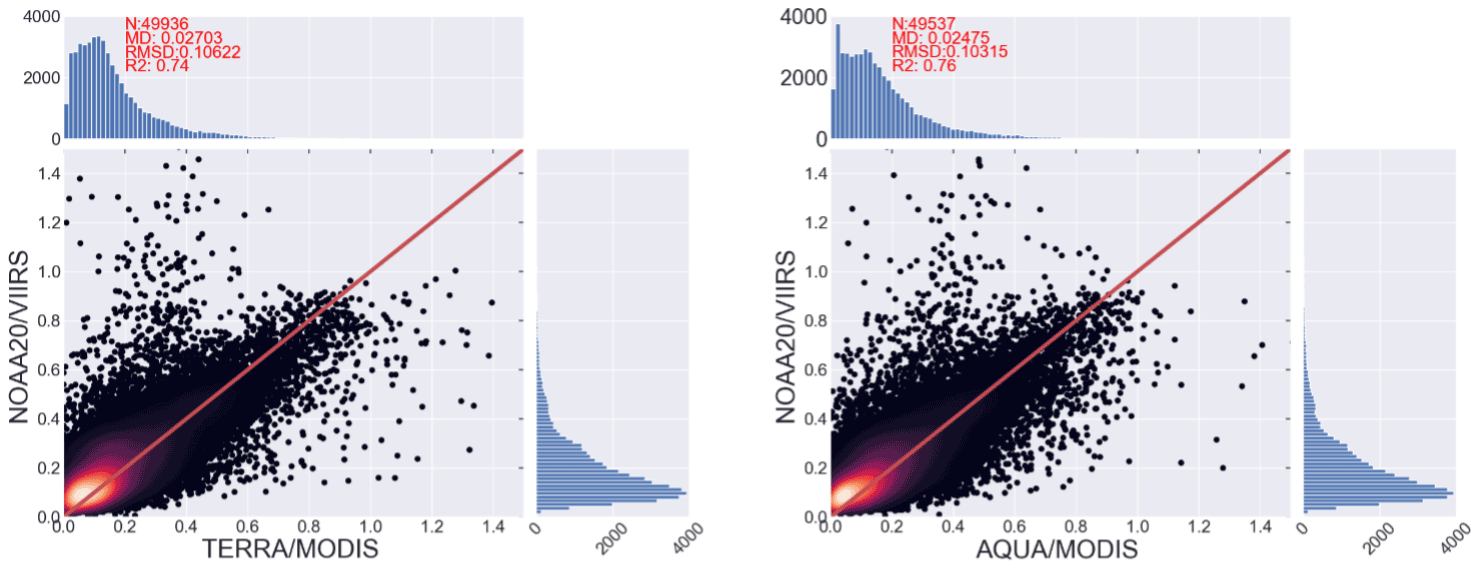
Figure B7NOAA20/VIIRS vs. MODIS AOD scatter plots of temporal mean AOD over land for the DJF period.
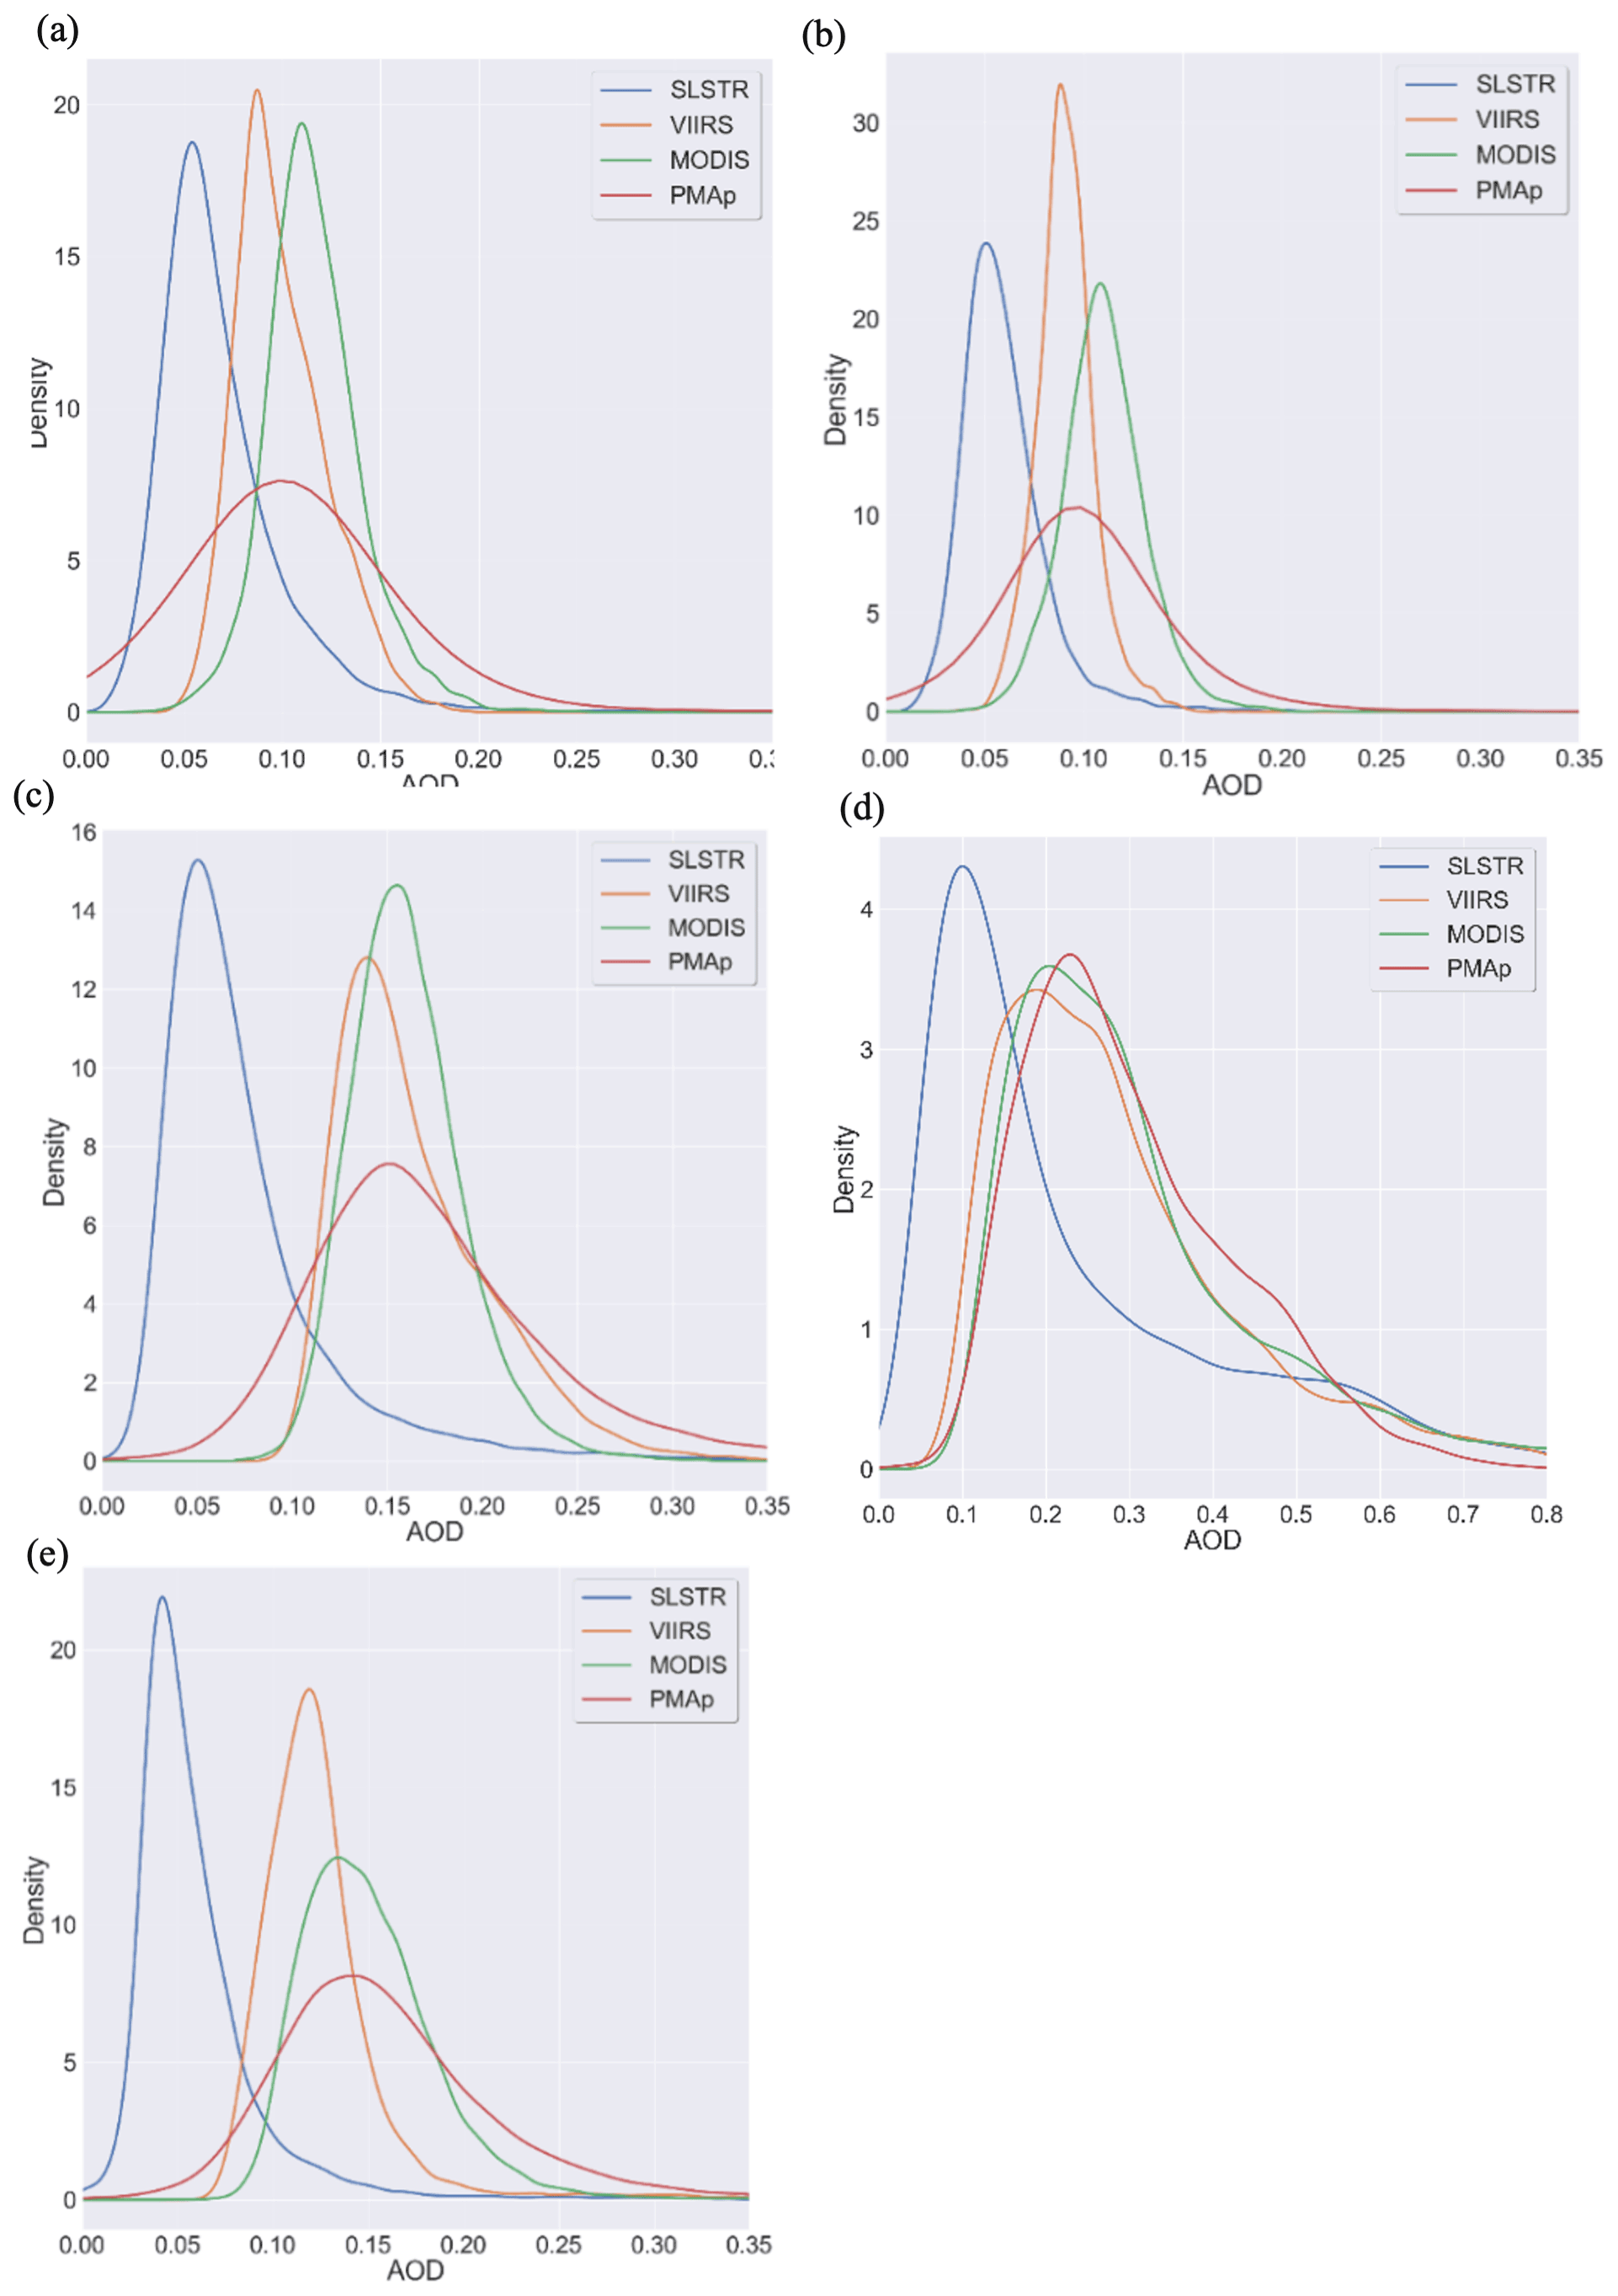
Figure C1AOD distributions over distinct ocean regional domains for the DJF period. (a) North Atlantic, (b) North Pacific, (c) South Pacific, (d) mid-Atlantic, and (e) southern Indian Ocean.
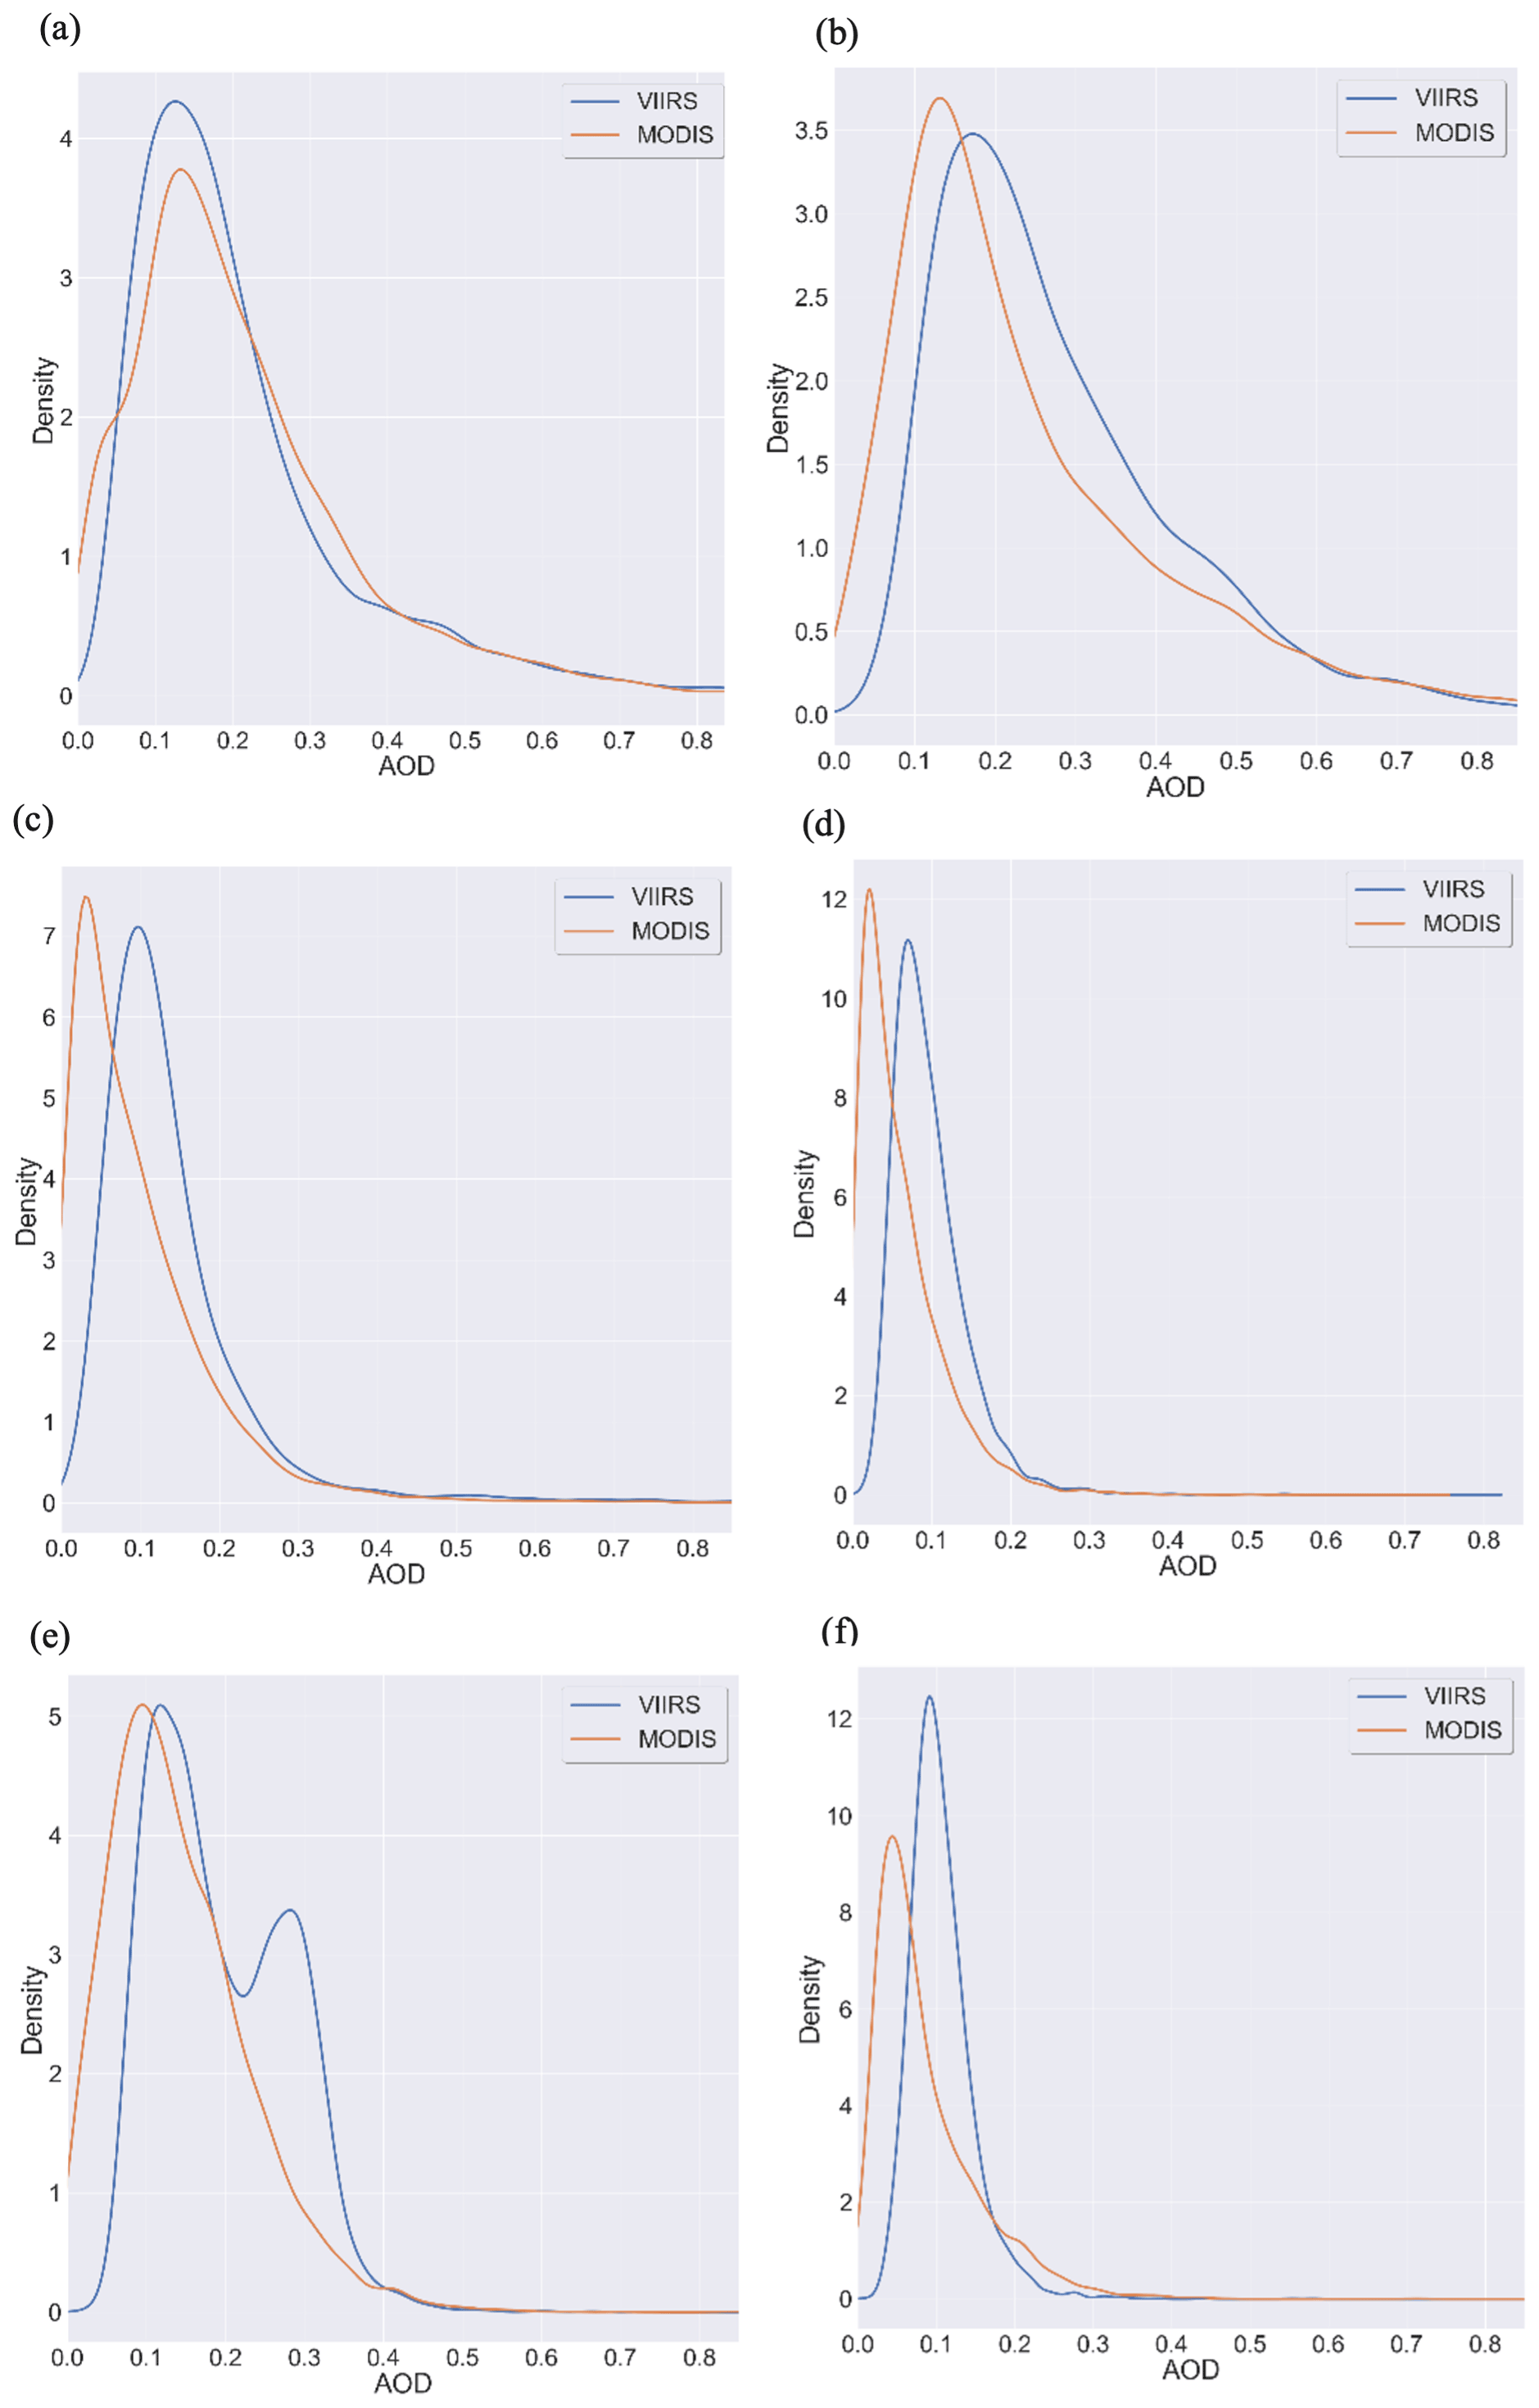
Figure C2AOD distributions over distinct land regional domains for the DJF period. (a) Africa, (b) Asia, (c) Australia, (d) North America, (e) South America, and (f) Europe.
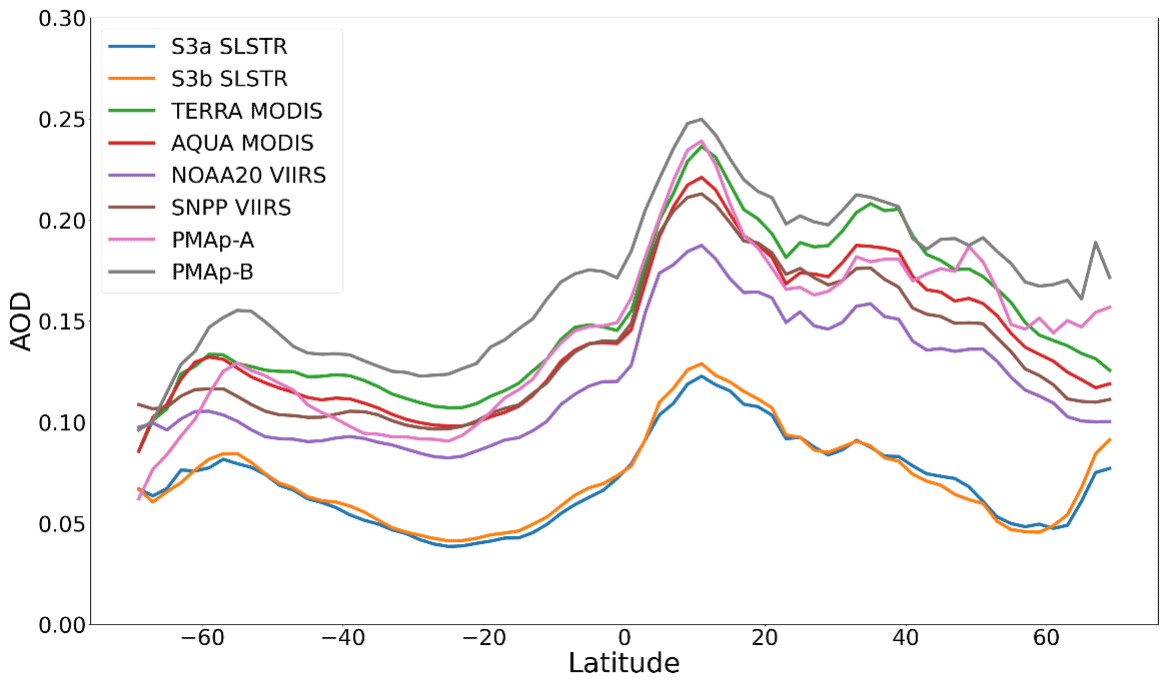
Figure D1Latitude cross-section of temporal mean satellite AOD for the MAM period over ocean.
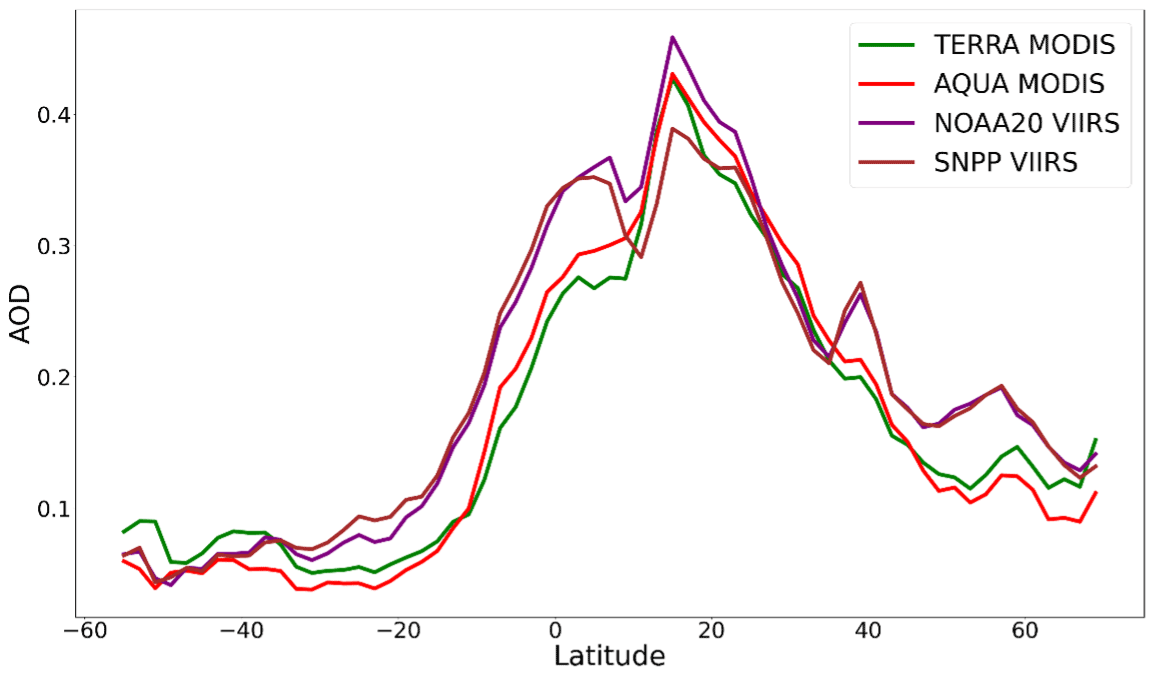
Figure D2Latitude cross-section of temporal mean satellite AOD for the MAM period over land.
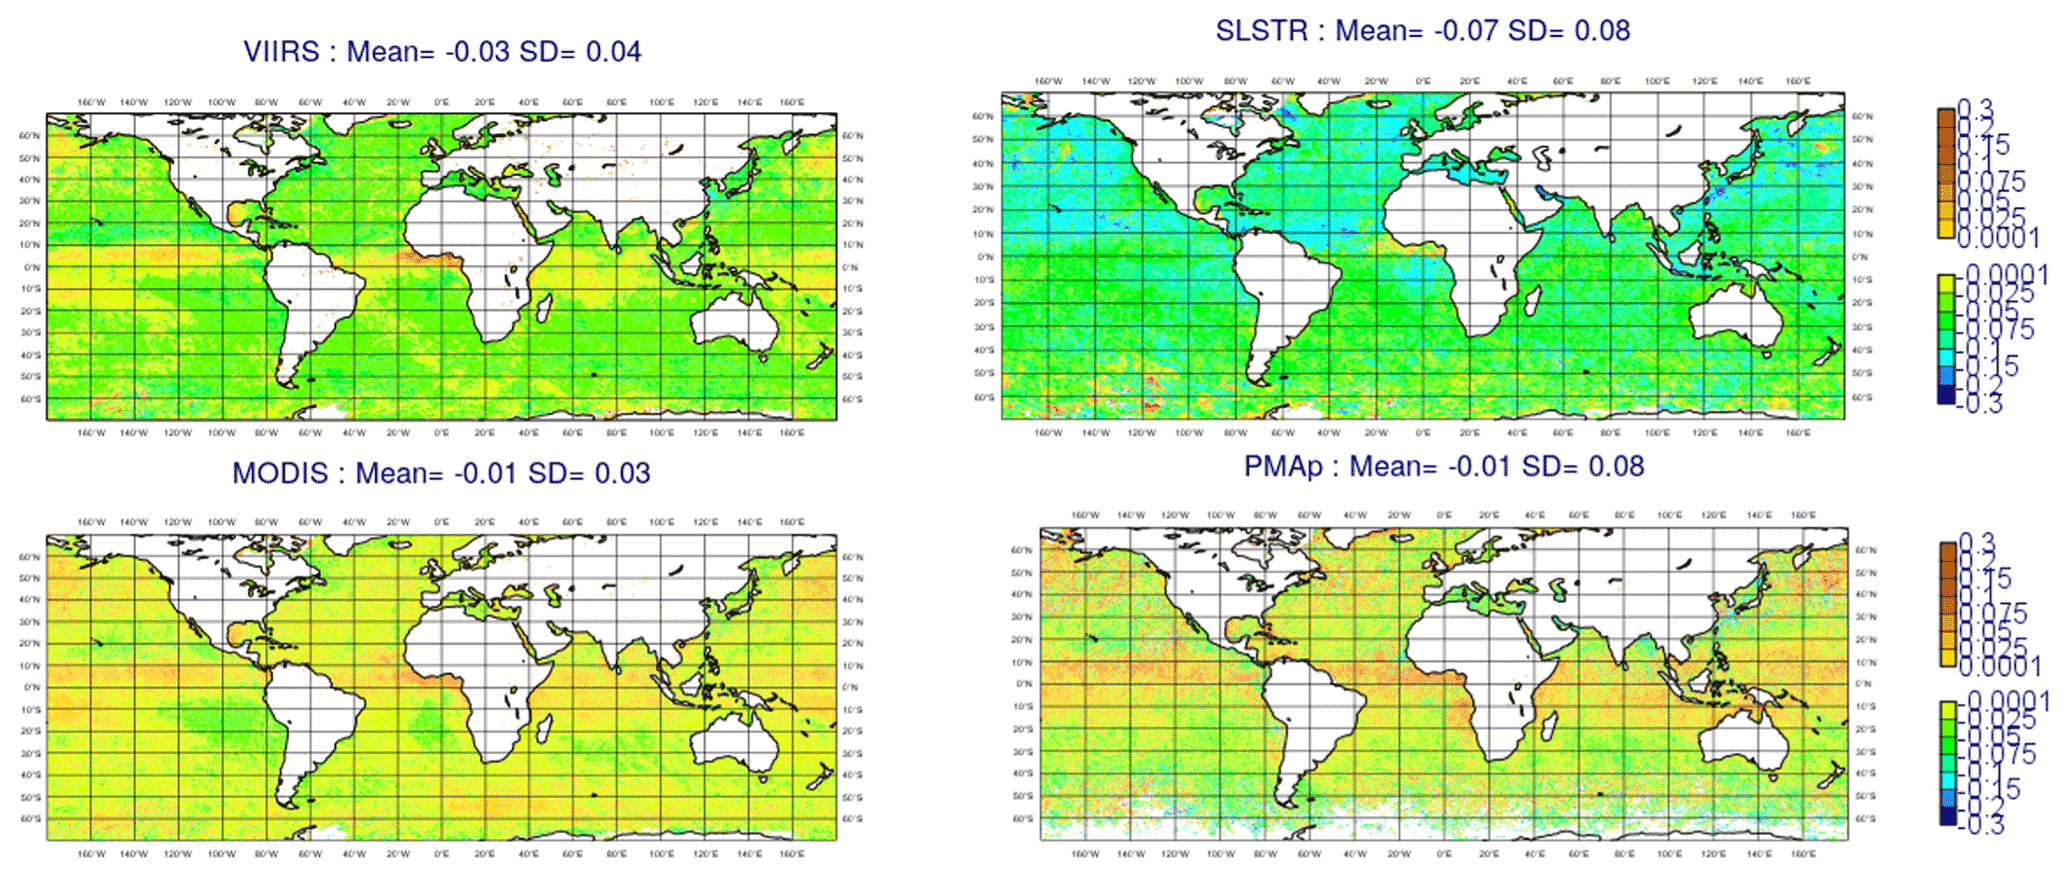
Figure D3Global maps of the mean of the first-guess departure from Terra and Aqua/MODIS, NOAA20 and SNPP/VIIRS, S3A and S3B/SLSTR, and MetOp-A/B–PMAp for the MAM period over ocean.
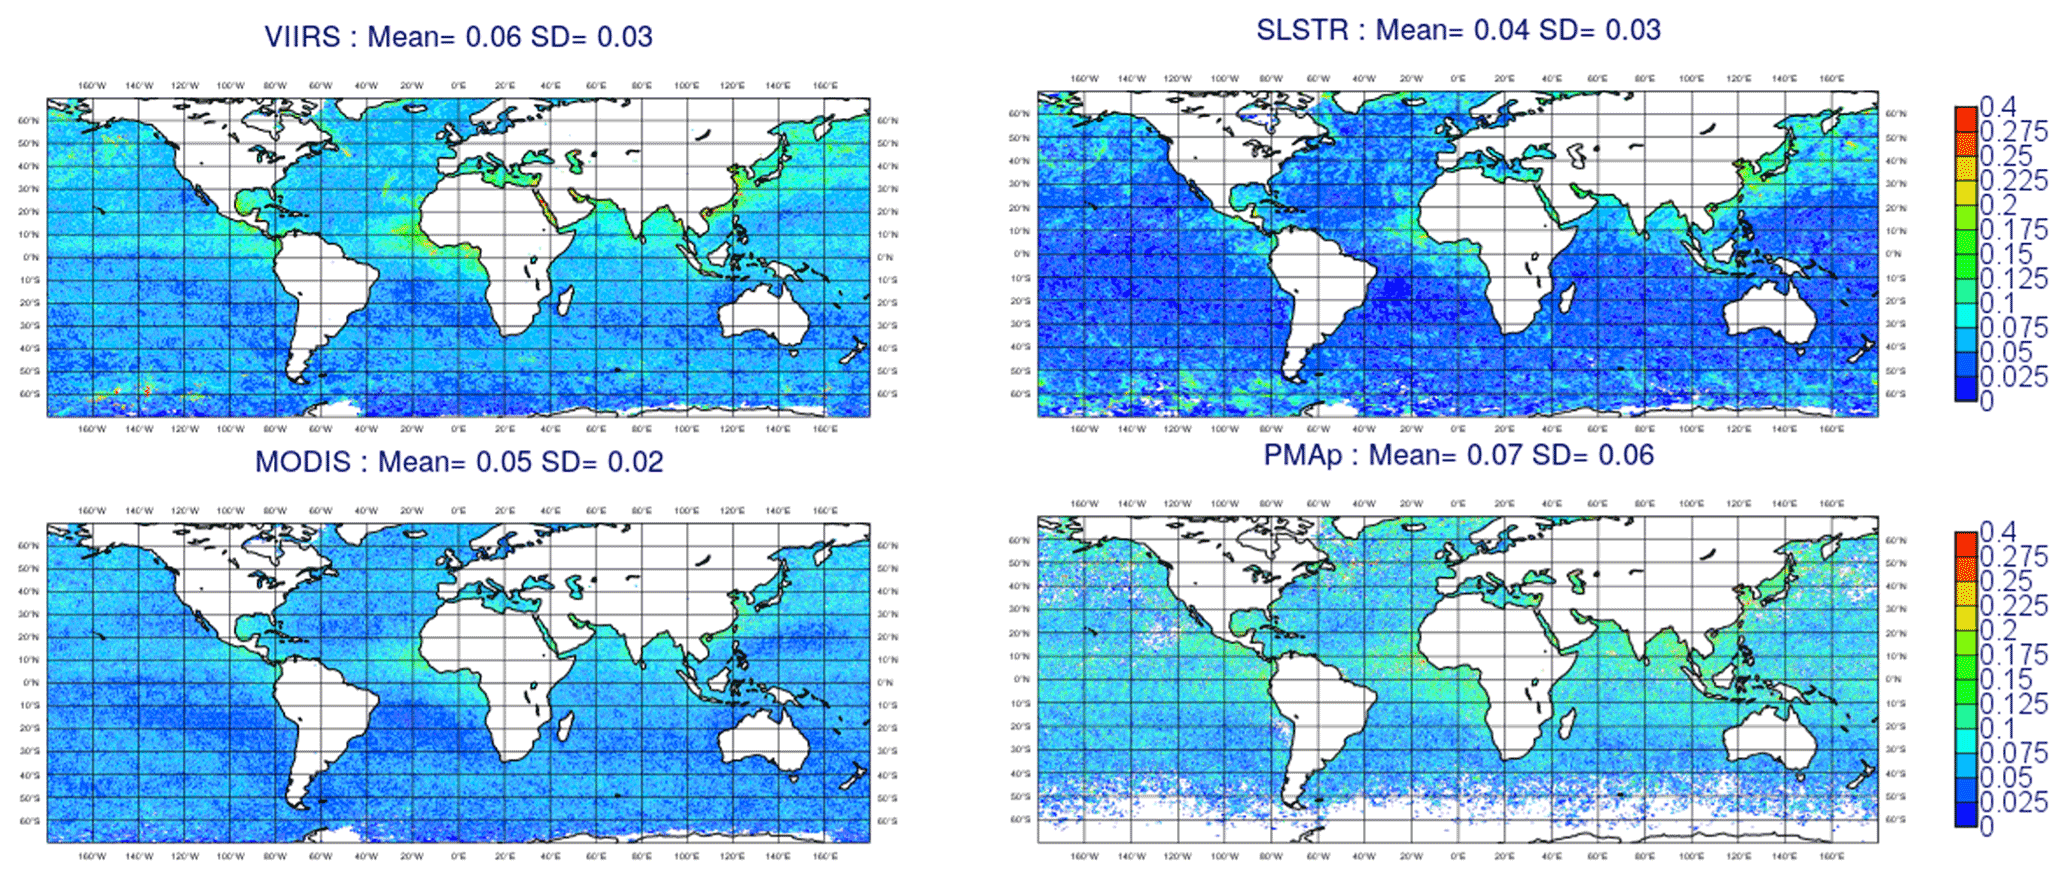
Figure D4Global maps of the standard deviation of the first-guess departure from Terra and Aqua/MODIS, NOAA20 and SNPP/VIIRS, S3A and S3B/SLSTR, and MetOp-A/B–PMAp for the MAM (2019–2020) period over ocean.
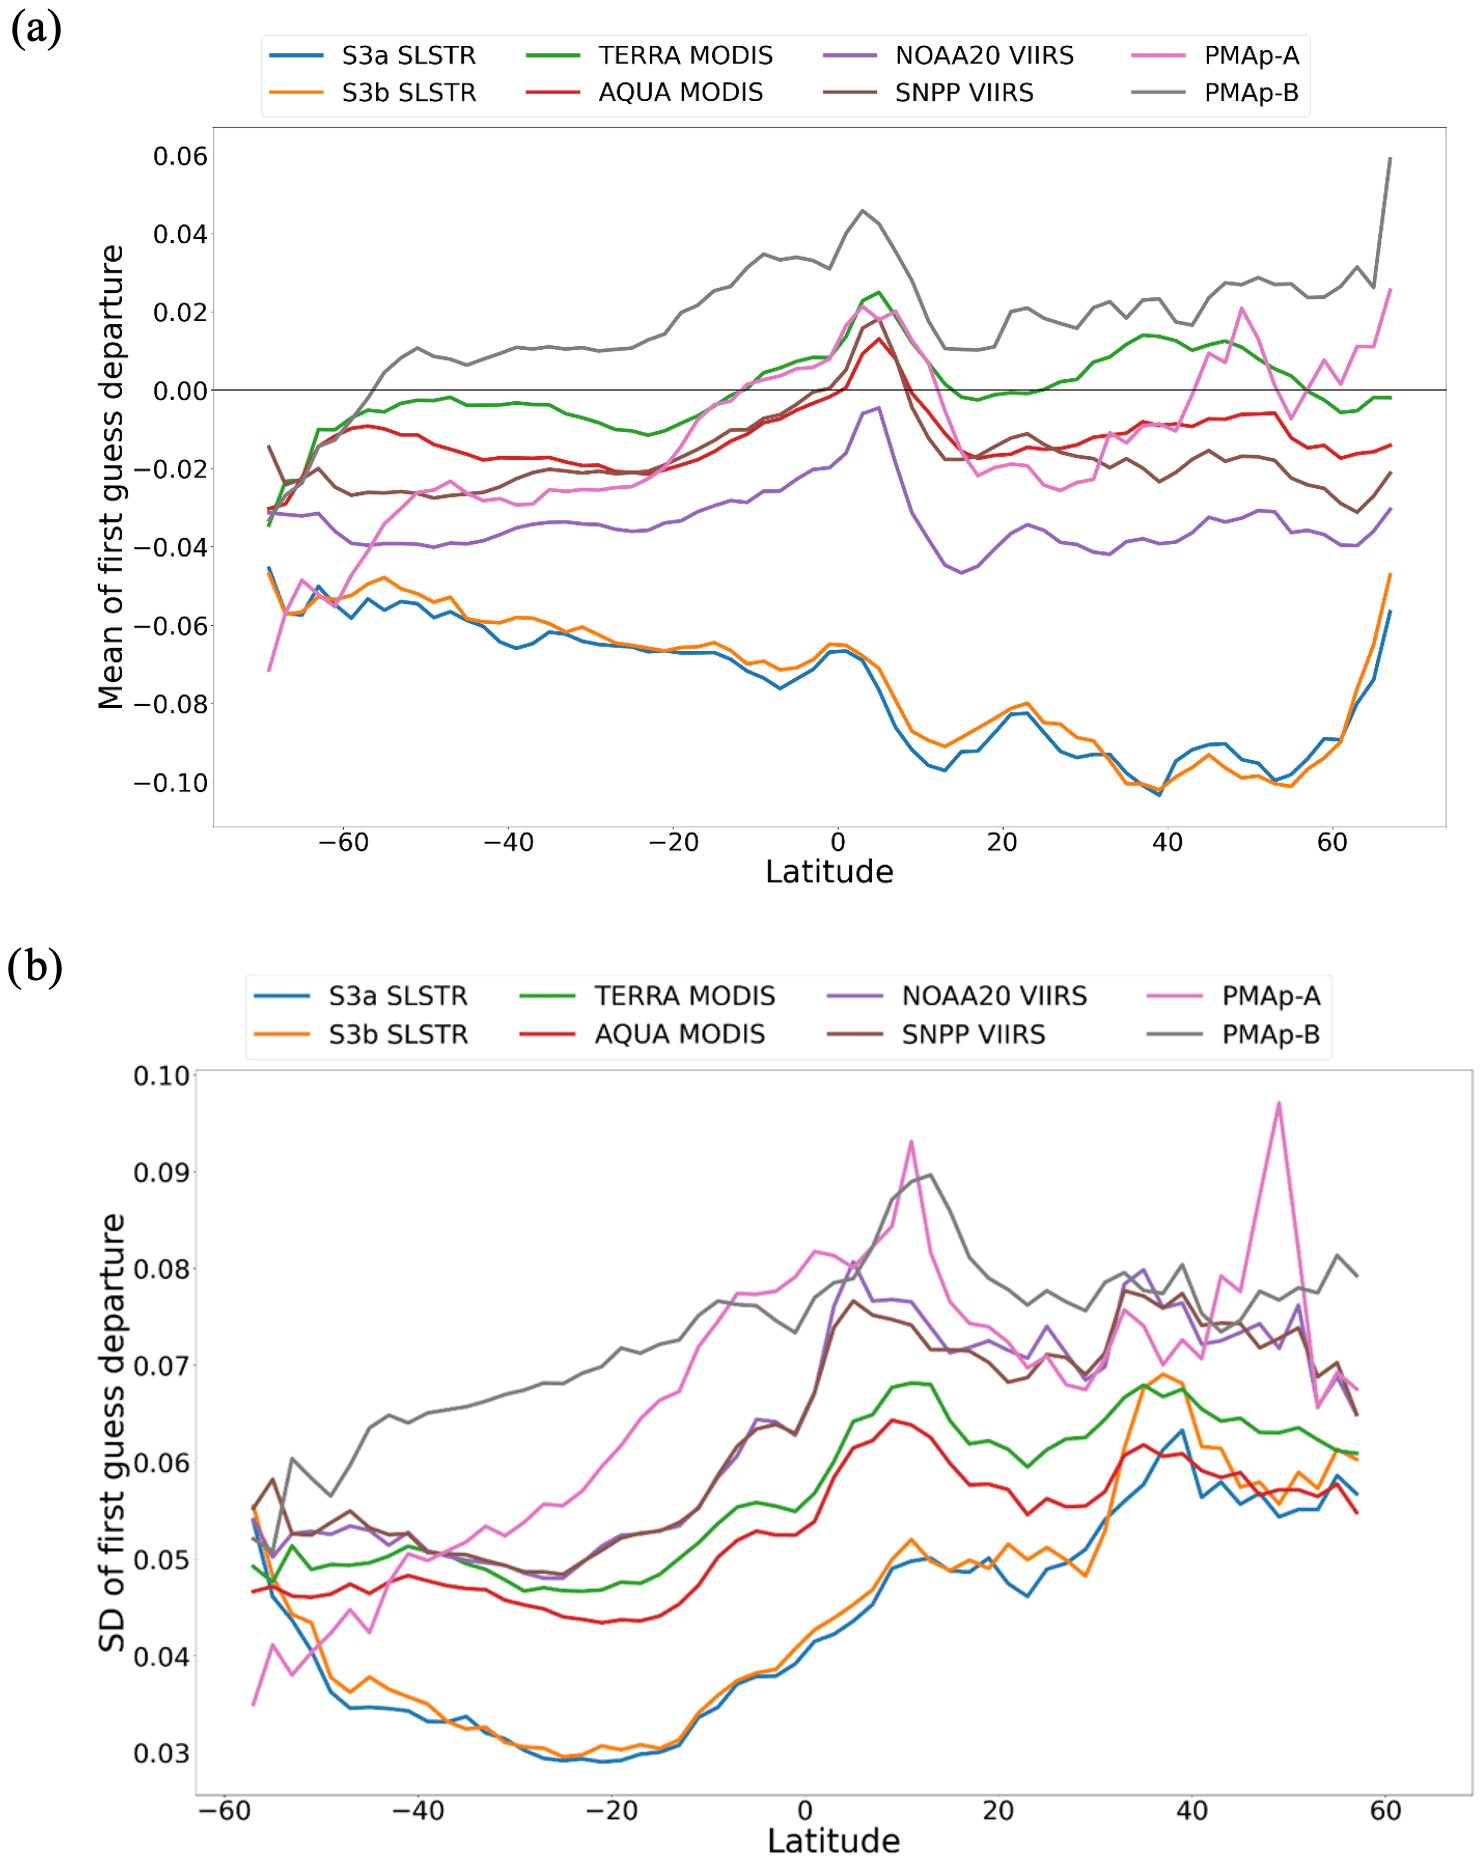
Figure D5Latitude cross-section of the mean (a) and SD (b) of the first-guess departure for the MAM (2019–2020) period over ocean.
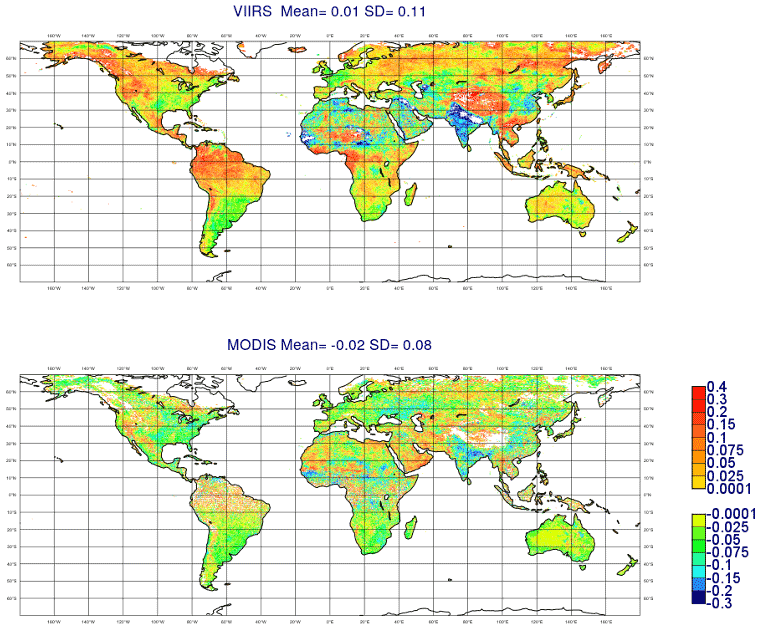
Figure D6Global maps of mean first-guess departure from Terra and Aqua/MODIS as well as NOAA20 and SNPP/VIIRS for the MAM period over land.
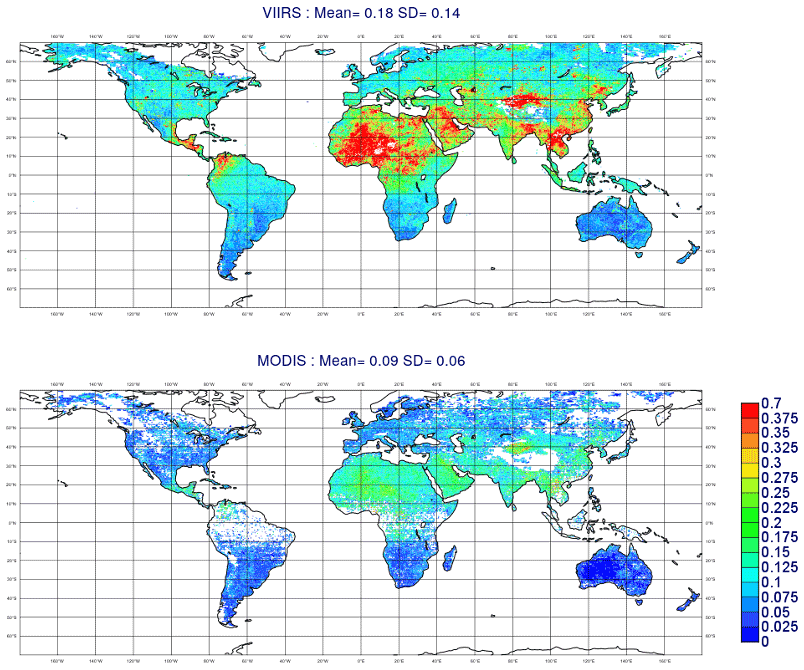
Figure D7Global maps of the standard deviation of the first-guess departure from Terra and Aqua/MODIS as well as NOAA20 and SNPP/VIIRS for the MAM period over land.
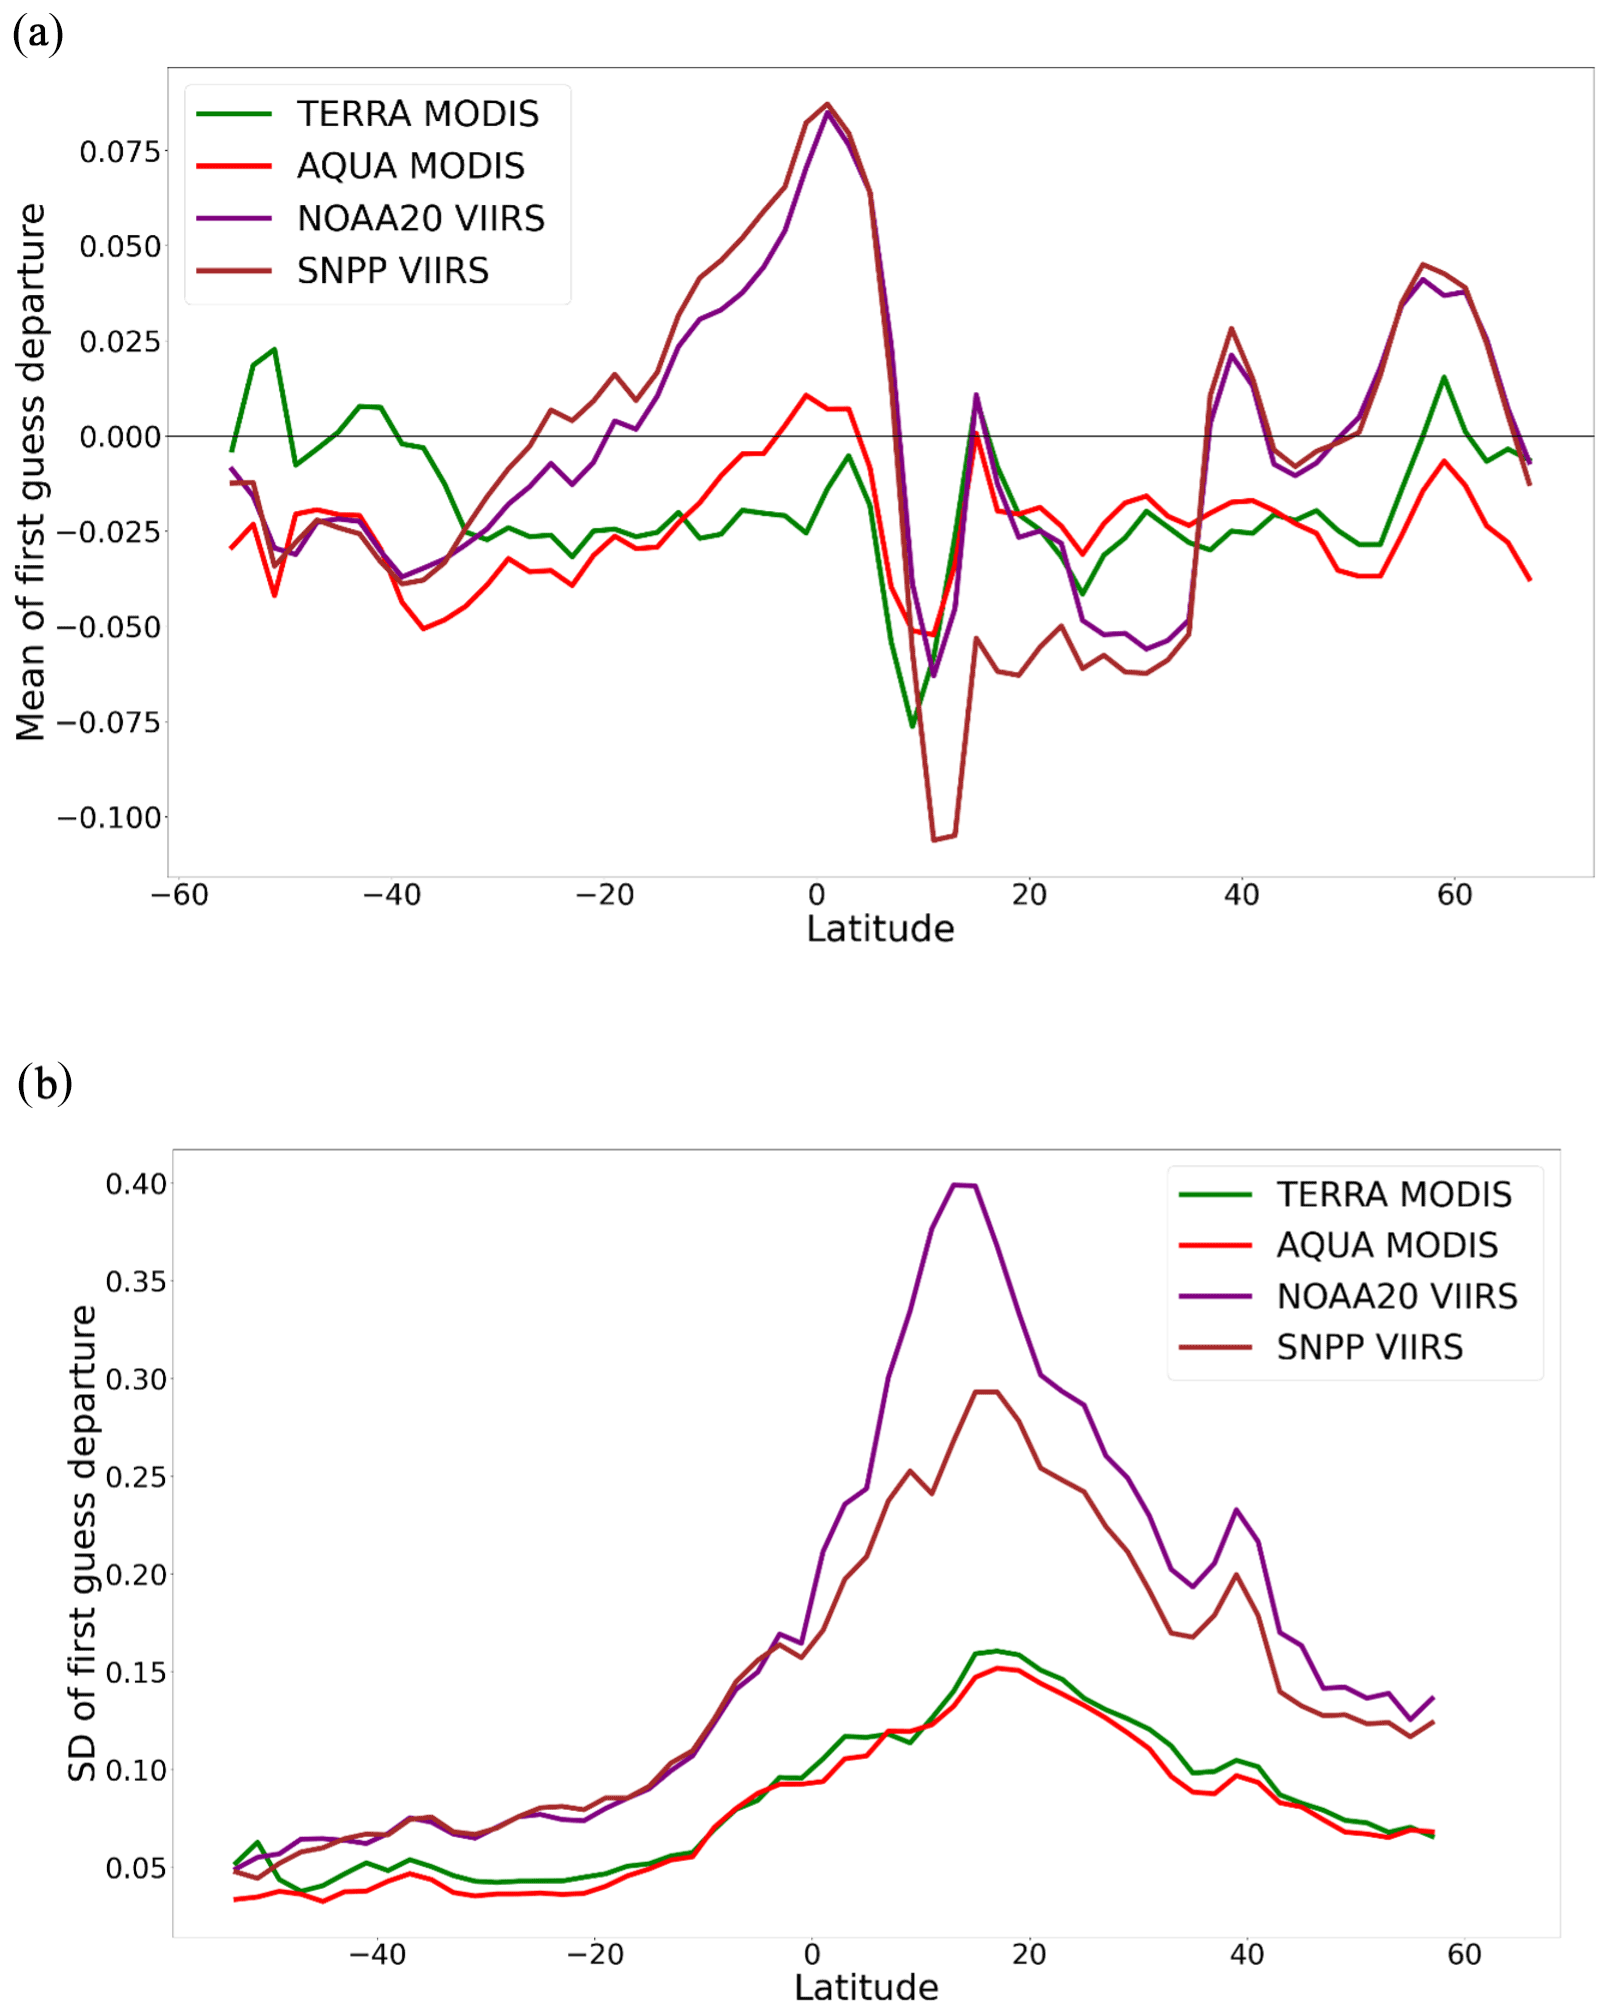
Figure D8Latitude cross-section of the mean (a) and SD (b) of the first-guess departure for the MAM (2019–2020) period over land.
Model code developed at ECMWF is the intellectual property of ECMWF and its member states, and therefore the IFS code is not publicly available. ECMWF member state weather services and their approved partners can get access granted to this code. Access to an open version of the IFS code (OpenIFS) that includes cycle CY47R1 IFS-AER may be obtained from ECMWF under an OpenIFS license. More details can be found at https://confluence.ecmwf.int/display/OIFS/About+OpenIFS (last access: 9 November 2022). A software licensing agreement with ECMWF is required to access the OpenIFS source distribution: despite the name it is not provided under any form of open-source software license. License agreements are free, limited to non-commercial use, forbid any real-time forecasting, and must be signed by research or educational organizations. A detailed documentation of the IFS code is available from https://www.ecmwf.int/en/publications/ifs-documentation (last access: 26 October 2022).
SG carried out the simulations described in the paper, performed the intercomparison of the satellite AOD, and wrote the paper. RR set up the processing chain of each satellite AOD product at ECMWF to prepare their use in the ECMWF data system. SR contributed to the analysis of the results and provided his expertise to the aerosol models. JC provided inputs on the Copernicus SLSTR AOD product. BF, SJ, and MVN provided information on PMAp. IL and SK gave insights on the VIIRS NOAA product. MA and AI contributed with their expertise in data assimilation. The rest of the co-authors from the CAMS team provided valuable feedback on the use of multi-satellite AOD in CAMS. All co-authors gave useful comments during the writing of the paper.
The contact author has declared that none of the authors has any competing interests.
Publisher's note: Copernicus Publications remains neutral with regard to jurisdictional claims in published maps and institutional affiliations.
The Copernicus Atmosphere Monitoring Service (CAMS) is operated by the European Centre for Medium-Range Weather Forecasts on behalf of the European Commission as part of the Copernicus program (http://copernicus.eu, last access: 30 October 2022). The authors would like to thank the EUMETSAT, NASA, and NOAA space agencies for providing the satellite AOD products assimilated and monitored in CAMS.
This paper was edited by Zhanqing Li and reviewed by three anonymous referees.
Agustí-Panareda, A., Massart, S., Chevallier, F., Boussetta, S., Balsamo, G., Beljaars, A., Ciais, P., Deutscher, N. M., Engelen, R., Jones, L., Kivi, R., Paris, J.-D., Peuch, V.-H., Sherlock, V., Vermeulen, A. T., Wennberg, P. O., and Wunch, D.: Forecasting global atmospheric CO2, Atmos. Chem. Phys., 14, 11959–11983, https://doi.org/10.5194/acp-14-11959-2014, 2014.
Bell, W., Candy, B., Atkinson, N., Hilton, F., Baker, N., Bormann, N., Kelly, G., Kazumori, M., Campbell, W. F., and Swadley, S. D.: The Assimilation of SSMIS Radiances in Numerical Weather Prediction Models, IEEE T. Geosci. Remote, 46, 884–900, https://doi.org/10.1109/TGRS.2008.917335, 2008.
Bellouin, N., Quaas, J., Gryspeerdt, E., Kinne, S., Stier, P., Watson-Parris, D., Boucher, O., Carslaw, K. S., Christensen, M., Daniau, A.-L., Dufresne, J.-L., Feingold, G., Fiedler, S., Forster, P., Gettelman, A., Haywood, J. M., Lohmann, U., Malavelle, F., Mauritsen, T., McCoy, D. T., Myhre, G., Mülmenstädt, J., Neubauer, D., Possner, A., Rugenstein, M., Sato, Y., Schulz, M., Schwartz, S. E., Sourdeval, O., Storelvmo, T., Toll, V., Winker, D., and Stevens, B.: Bounding global aerosol radiative forcing of climate change, Rev. Geophys., 58, e2019RG000660, https://doi.org/10.1029/2019RG000660, 2020.
Belward, A. and Briggs, S.: The Global Observing System for Climate: Implementation Needs, GCOS-200, https://library.wmo.int/doc_num.php?explnum_id=3417 (last access: 9 November 2022), 2016.
Benedetti, A., Morcrette, J.-J., Boucher, O., Dethof, A., Engelen, R., Fisher, M., Flentje, H., Huneeus, N., Jones, L., Kaiser, J., Kinne, S., Mangold, A., Razinger, M., Simmons, A. J., and Suttie, M.: Aerosol analysis and forecast in the European centre for medium-range weather forecasts integrated forecast system: 2. Data assimilation, J. Geophys. Res.-Atmos., 114, D13205, https://doi.org/10.1029/2008JD011235, 2009.
Bentamy, A., Grodsky, S. A., Cambon, G., Tandeo, P., Capet, X., Roy, C., Herbette, S., and Grouazel, A.: Twenty-Seven Years of Scatterometer Surface Wind Analysis over Eastern Boundary Upwelling Systems, Remote Sens., 13, 940, https://doi.org/10.3390/rs13050940, 2021.
Boucher, O., Randall, D., Artaxo, P., Bretherton, C., Feingold, G., Forster, P., Kerminen, V.-M., Kondo, Y., Liao, H., Lohmann, U., Rasch, P., Satheesh, S. K., Sherwood, S., Stevens, B., and Zhang, X. Y.: Clouds and aerosols, in: Climate Change 2013: The Physical Science Basis. Contribution of Working Group I to the Fifth Assessment Report of the Intergovernmental Panel on Climate Change, edited by: Stocker, T. F., Qin, D., Plattner, G.-K., Tignor, M., Allen, S. K., Doschung, J., Nauels, A., Xia, Y., Bex, V., and Midgley, P. M., Cambridge University Press, 571–657, 2013.
Burgos, M. A., Andrews, E., Titos, G., Benedetti, A., Bian, H., Buchard, V., Curci, G., Kipling, Z., Kirkevåg, A., Kokkola, H., Laakso, A., Letertre-Danczak, J., Lund, M. T., Matsui, H., Myhre, G., Randles, C., Schulz, M., van Noije, T., Zhang, K., Alados-Arboledas, L., Baltensperger, U., Jefferson, A., Sherman, J., Sun, J., Weingartner, E., and Zieger, P.: A global model–measurement evaluation of particle light scattering coefficients at elevated relative humidity, Atmos. Chem. Phys., 20, 10231–10258, https://doi.org/10.5194/acp-20-10231-2020, 2020.
Courtier, P., Thepaut, J.-N., and Hollingsworth, A.: A strategy for operational implementation of 4D-Var, using an incremental approach, Q. J. Roy. Meteor. Soc., 120, 1367–1387, 1994.
Dee, D.: Bias and data assimilation, Q. J. Roy. Meteor. Soc., 131, 3323–3343, https://doi.org/10.1256/qj.05.137, 2005.
Dee, D. P.: Variational bias correction of radiance data in the ECMWF system, in: Proceedings of the ECMWF workshop on assimilation of high spectral resolution sounders in NWP, Reading, UK, 28 June–1 July 2004, 97–112, https://www.ecmwf.int/sites/default/files/elibrary/2004/8930-variational-bias-correction-radiance-data-ecmwf-system.pdf (last access: 9 November 2022), 2004.
de Leeuw, G., Holzer-Popp, T., Bevan, S., Davies, W., Descloitres, J., Grainger, R. G., Griesfeller, J., Heckel, A., Kinne, S., Klüser, L., Kolmonen, P., Litvinov, P., Martynenko, D., North, P. J. R., Ovigneur, B., Pascal, N., Poulsen, C., Ramon, D., Schulz, M., Siddans, R., Sogacheva, L., Tanré, D., Thomas, G. E., Virtanen, T. H., von Hoyningen Huene, W., Vountas, M., and Pinnock, S.:Evaluation of seven European aerosol optical depth retrieval algorithms for climate analysis, Remote Sens. Environ., 162, 295–315, https://doi.org/10.1016/j.rse.2013.04.023, 2015.
de Leeuw, G., Sogacheva, L., Rodriguez, E., Kourtidis, K., Georgoulias, A. K., Alexandri, G., Amiridis, V., Proestakis, E., Marinou, E., Xue, Y., and van der A, R.: Two decades of satellite observations of AOD over mainland China using ATSR-2, AATSR and MODIS/Terra: data set evaluation and large-scale patterns, Atmos. Chem. Phys., 18, 1573–1592, https://doi.org/10.5194/acp-18-1573-2018, 2018.
Dubovik, O., Sinyuk, A., Lapyonok, T., Holben, B. N., Mishchenko, M., Yang, P., Eck, T. F., Volten, H., Muñoz, O., Veihelmann, B., van der Zande, W., Leon, J.-F., Sorokin, M., and Slutsker, I.: Application of spheroid models to account for aerosol particle nonsphericity in remote sensing of desert dust, J. Geophys. Res.-Atmos., 111, D11208, https://doi.org/10.1029/2005JD006619, 2006.
Dubovik, O., Herman, M., Holdak, A., Lapyonok, T., Tanré, D., Deuzé, J. L., Ducos, F., Sinyuk, A., and Lopatin, A.: Statistically optimized inversion algorithm for enhanced retrieval of aerosol properties from spectral multi-angle polarimetric satellite observations, Atmos. Meas. Tech., 4, 975–1018, https://doi.org/10.5194/amt-4-975-2011, 2011.
Elguindi, N., Granier, C., Stavrakou, T., Darras, S., Bauwens, M., Cao, H., Chen, C., Denier van der Gon, H. A. C., Dubovik, O., Fu, T. M., Henze, D. K., Jiang, Z., Keita, S., Kuenen, J. J. P., Kurokawa, J., Liousse, C., Miyazaki, K., Müller, J.-F., Qu, Z., Solmon, F., and Zheng, B.: Intercomparison of Magnitudes and Trends in Anthropogenic Surface Emissions From Bottom-Up Inventories, Top-Down Estimates, and Emission Scenarios, Earth's Future, 8, e2020EF001520, https://doi.org/10.1029/2020EF001520, 2020.
EUMETSAT: Polar Multi-Sensor Aerosol Product (PMAp): Validation Report, v6, EUM/TSS/REP/14/745438, https://www.eumetsat.int/media/40632 (last access: 9 November 2022), 2021a.
EUMETSAT: SLSTR ATBD Optimized Simultaneous Surface-Atmosphere Retrieval from Copernicus Sentinel-3 (OSSAR-CS3) – Algorithm Theoretical Basis Document (ATBD) v1, Sept 2021 EUM/SEN3/DOC/21/1243792, https://www-cdn.eumetsat.int/files/2021-10/Optimized Simultaneous Surface-Atmosphere Retrieval from Copernicus Sentinel-3 (OSSAR-CS3) - Algorithm Theoretical Basis Document (ATBD).pdf (last access: 9 November 2022), 2021b.
EUMETSAT: SLSTR PVR Optimized Simultaneous Surface-Atmosphere Retrieval from Copernicus Sentinel-3 (OSSARCS3) – Product Validation Report (PVR) EUM/SEN3/REP/21/1244474 v1A, https://www-cdn.eumetsat.int/files/2021-10/Optimized Simultaneous Surface-Atmosphere Retrieval from Copernicus Sentinel-3 (OSSAR-CS3) - Product Validation Report (PVR)_v1A.pdf (last access: 9 November 2022), 2021c.
Flemming, J., Huijnen, V., Arteta, J., Bechtold, P., Beljaars, A., Blechschmidt, A.-M., Diamantakis, M., Engelen, R. J., Gaudel, A., Inness, A., Jones, L., Josse, B., Katragkou, E., Marecal, V., Peuch, V.-H., Richter, A., Schultz, M. G., Stein, O., and Tsikerdekis, A.: Tropospheric chemistry in the Integrated Forecasting System of ECMWF, Geosci. Model Dev., 8, 975–1003, https://doi.org/10.5194/gmd-8-975-2015, 2015.
Fougnie, B., Chimot, J., Vazquez-Navarro, M., Marbach, T., and Bojkov, B.: Aerosol Retrieval from Space – How does Geometry of Acquisition Impact our Ability to Characterize Aerosol Properties, J. Quant. Spectrosc. Ra., 256, 107304, https://doi.org/10.1016/j.jqsrt.2020.107304, 2020.
Gliß, J., Mortier, A., Schulz, M., Andrews, E., Balkanski, Y., Bauer, S. E., Benedictow, A. M. K., Bian, H., Checa-Garcia, R., Chin, M., Ginoux, P., Griesfeller, J. J., Heckel, A., Kipling, Z., Kirkevåg, A., Kokkola, H., Laj, P., Le Sager, P., Lund, M. T., Lund Myhre, C., Matsui, H., Myhre, G., Neubauer, D., van Noije, T., North, P., Olivié, D. J. L., Rémy, S., Sogacheva, L., Takemura, T., Tsigaridis, K., and Tsyro, S. G.: AeroCom phase III multi-model evaluation of the aerosol life cycle and optical properties using ground- and space-based remote sensing as well as surface in situ observations, Atmos. Chem. Phys., 21, 87–128, https://doi.org/10.5194/acp-21-87-2021, 2021.
Grzegorski, M., Poli, G., Cacciari, A., Jafariserajehlou, S., Holdak, A., Lang, R., Vazquez-Navarro, M., Munro, R., and Fougnie, B.: Multi-Sensor Retrieval of Aerosol Optical Properties for Near-Real-Time Applications Using the Metop Series of Satellites: Concept, Detailed Description, and First Validation, Remote Sens., 14, 85, https://doi.org/10.3390/rs14010085, 2022.
Hsu, N. C., Tsay, S. C., King, M. D., and Herman, J. R.: Aerosol properties over bright-reflecting source regions, IEEE T. Geosci. Remote Sens., 42, 557–569, 2004.
Hsu, N. C., Jeong, M.-J., Bettenhausen, C., Sayer, A. M., Hansell, R., Seftor, C. S., Huang, J., and Tsay, S.-C.: Enhanced Deep Blue aerosol retrieval algorithm: The second generation, J. Geophys. Res.-Atmos., 118, 9296–9315, https://doi.org/10.1002/jgrd.50712, 2013.
Hsu, N. C., Lee, J., Sayer, A. M., Kim, W., Bettenhausen, C., and Tsay, S.-C: VIIRS Deep Blue aerosol products over land: Extending the EOS long-term aerosol data records, J. Geophys. Res.-Atmos., 124, 4026–4053, https://doi.org/10.1029/2018JD029688, 2019.
Huang, J., Kondragunta, S., Laszlo, I., Liu, H., Remer, L. A., Zhang, H., Superczynski, S., Ciren, P., Holben, B. N., and Petrenko, M.: Validation and expected error estimation of Suomi-NPP VIIRS aerosol optical thickness and Ångström exponent with AERONET, J. Geophys. Res.-Atmos., 121, 7139–7160, https://doi.org/10.1002/2016JD024834, 2016.
Huijnen, V., Pozzer, A., Arteta, J., Brasseur, G., Bouarar, I., Chabrillat, S., Christophe, Y., Doumbia, T., Flemming, J., Guth, J., Josse, B., Karydis, V. A., Marécal, V., and Pelletier, S.: Quantifying uncertainties due to chemistry modelling – evaluation of tropospheric composition simulations in the CAMS model (cycle 43R1), Geosci. Model Dev., 12, 1725–1752, https://doi.org/10.5194/gmd-12-1725-2019, 2019.
Ichoku, C., Remer, L., Kaufman, Y., Levy, R., Chu, D., Tanre, D., and Holben, B.: MODIS observation of aerosols and estimation of aerosol radiative forcing over southern Africa during SAFARI 2000, J. Geophys. Res.-Atmos., 108, 8499–8499, https://doi.org/10.1029/2002JD002366, 2003.
Inness, A., Ades, M., Agustí-Panareda, A., Barré, J., Benedictow, A., Blechschmidt, A.-M., Dominguez, J. J., Engelen, R., Eskes, H., Flemming, J., Huijnen, V., Jones, L., Kipling, Z., Massart, S., Parrington, M., Peuch, V.-H., Razinger, M., Remy, S., Schulz, M., and Suttie, M.: The CAMS reanalysis of atmospheric composition, Atmos. Chem. Phys., 19, 3515–3556, https://doi.org/10.5194/acp-19-3515-2019, 2019.
IPCC: Intergovernmental Panel on Climate Change: Climate Change 2021: The Physical Science Basis. Contribution of Working Group I to the Sixth Assessment Report of the Intergovernmental Panel on Climate Change, edited by: Masson-Delmotte, V., Zhai, P., Pirani, A., Connors, S. L., Péan, C., Berger, S., Caud, N., Chen, Y., Goldfarb, L., Gomis, M. I., Huang, M., Leitzell, K., Lonnoy, E., Matthews, J. B. R., Maycock, T. K., Waterfield, T., Yelekçi, O., Yu, R., and Zhou, B., Cambridge University Press, 2021.
Janjić, T., Bormann, N., Bocquet, M., Carton, J. A., Cohn, S. E., Dance, S. L., Losa, S. N., Nichols, N. K., Potthast, R., Waller, J. A., and Weston, P.: On the representation error in data assimilation, Q. J. Roy. Meteor. Soc., 144, 1257–1278, https://doi.org/10.1002/qj.3130, 2018.
Jourdan, O., Kokhanovsky, A. A., and Burrows, J. P.: Calibration of SCIAMACHY using AATSR top-of atmosphere reflectance over a hurricane, IEEE T. Geosci. Remote, 4, 8–12, 2007.
Kaiser, J. W., Heil, A., Andreae, M. O., Benedetti, A., Chubarova, N., Jones, L., Morcrette, J.-J., Razinger, M., Schultz, M. G., Suttie, M., and van der Werf, G. R.: Biomass burning emissions estimated with a global fire assimilation system based on observed fire radiative power, Biogeosciences, 9, 527–554, https://doi.org/10.5194/bg-9-527-2012, 2012.
Kaufman, Y. J., Tanre, D., Remer, L. A., Vermote, E. F., Chu, A., and Holben, B. N.: Operational remote sensing of tropospheric aerosol over land from EOS moderate resolution imaging spectroradiometer, J. Geophys. Res., 102, 17051–17068, https://doi.org/10.1029/96JD03988, 1997a.
Kaufman, Y. J., Wald, A. E., Remer, L. A., Gao, B.-C., Li, R.-R., and Flynn, L.: The MODIS 2.1-/spl mu/m channel-correlation with visible reflectance for use in remote sensing of aerosol, IEEE T. Geosci. Remote, 35, 1286–1296, https://doi.org/10.1109/36.628795, 1997b.
Kaufman, Y. J., Remer, L. A., Tanre, D., Li, R.-R., Kleidman, R., Mattoo, S., Levy, R., Eck, T., Holben, B. N., Ichoku, C., Martins, V., and Koren, I.: A critical examination of the residual cloud contamination and diurnal sampling effects on MODIS estimates of aerosol over ocean, IEEE T. Geosci. Remote, 43, 2886–2897, https://doi.org/10.1109/TGRS.2005.858430, 2005.
Kinne, S.: Remote sensing data combinations: superior global maps for aerosol optical depth, in: Satellite Aerosol Remote Sensing over Land, Springer, Berlin Heidelberg, 361–381, https://doi.org/10.1007/978-3-540-69397-0_12, 2009.
Kokhanovsky, A. A., Breon, F.-M., Cacciari, A., Carboni, E., Diner, D, Nicolantonio, W. D., Grainger, R. G., Grey, W. M. F., Höller, R., Lee, K. H., Li, Z., North, P. R. J., Sayer, A., Thomas, G., and von Hoyningen-Huene, W.: Aerosol remote sensing over land: Satellite retrievals using different algorithms and instruments, Atmos. Res., 85, 372–394, 2007.
Laszlo, I.: Remote Sensing of Tropospheric Aerosol Optical Depth From Multispectral Monodirectional Space-Based Observations, in: Comprehensive Remote Sensing, edited by: Liang, S., Elsevier, Oxford, 137–196, https://doi.org/10.1016/B978-0-12-409548-9.10389-6, 2018.
Laszlo, I. and Liu, H.: EPS Aerosol Optical Depth (AOD) Algorithm Theoretical Basis Document, NOAA-NESDIS-STAR, Center for Satellite Applications and Research, https://www.star.nesdis.noaa.gov/jpss/documents/ATBD/ATBD_EPS_Aerosol_AOD_v3.4.pdf (last access: 9 November 2022), 2020.
Lee, J., Hsu, N. C., Bettenhausen, C., and Sayer, A. M.: Retrieval of aerosol optical depth under thin cirrus from MODIS: Application to an ocean algorithm, J. Geophys. Res.-Atmos., 118, 10111–10124, https://doi.org/10.1002/jgrd.50806, 2013.
Levy, R. C., Mattoo, S., Munchak, L. A., Remer, L. A., Sayer, A. M., Patadia, F., and Hsu, N. C.: The Collection 6 MODIS aerosol products over land and ocean, Atmos. Meas. Tech., 6, 2989–3034, https://doi.org/10.5194/amt-6-2989-2013, 2013.
Levy, R. C., Mattoo, S., Sawyer, V., Shi, Y., Colarco, P. R., Lyapustin, A. I., Wang, Y., and Remer, L. A.: Exploring systematic offsets between aerosol products from the two MODIS sensors, Atmos. Meas. Tech., 11, 4073–4092, https://doi.org/10.5194/amt-11-4073-2018, 2018.
Li, L., Dubovik, O., Derimian, Y., Schuster, G. L., Lapyonok, T., Litvinov, P., Ducos, F., Fuertes, D., Chen, C., Li, Z., Lopatin, A., Torres, B., and Che, H.: Retrieval of aerosol components directly from satellite and ground-based measurements, Atmos. Chem. Phys., 19, 13409–13443, https://doi.org/10.5194/acp-19-13409-2019, 2019.
Li, Z., Zhao, X., Kahn, R., Mishchenko, M., Remer, L., Lee, K.-H., Wang, M., Laszlo, I., Nakajima, T., and Maring, H.: Uncertainties in satellite remote sensing of aerosols and impact on monitoring its long-term trend: a review and perspective, Ann. Geophys., 27, 2755–2770, https://doi.org/10.5194/angeo-27-2755-2009, 2009.
Limbacher, J. A. and Kahn, R. A.: MISR research-aerosol-algorithm refinements for dark water retrievals, Atmos. Meas. Tech., 7, 3989–4007, https://doi.org/10.5194/amt-7-3989-2014, 2014.
Liu, H., Remer, L. A., Huang, J., Huang, H.-C., Kondragunta, S., Laszlo, I., Oo, M., and Jackson, J. M.: Preliminary evaluation of S-NPP VIIRS aerosol optical thickness, J. Geophys. Res.-Atmos., 119, 3942–3962, https://doi.org/10.1002/2013JD020360, 2014.
Lyapustin, A., Wang, Y., Korkin, S., and Huang, D.: MODIS Collection 6 MAIAC algorithm, Atmos. Meas. Tech., 11, 5741–5765, https://doi.org/10.5194/amt-11-5741-2018, 2018.
Martins, J. V., Hobbs, P. V., Weiss, R. E., and Artaxo, P.: Sphericity and morphology of smoke particles from biomass burning in Brazil, J. Geophys. Res., 103, 32051–32057, 1998.
Mishchenko, M. I., Lacis, A. A., Carlson, B. E., and Travis, L. D.: Nonsphericity of dust-like tropospheric aerosols: Implications for aerosol remote sensing and climate modeling, Geophys. Res. Lett., 22, 1077–1080, 1995.
North, P. R. J., Briggs, S. A., Plummer, S. E., and Settle, J. J.: Retrieval of land surface bidirectional reflectance and aerosol opacity from ATSR-2 multi-angle imagery, IEEE T. Geosci. Remote 37, 526–537, 1999.
Painemal, D., Minnis, P., and Nordeen, M.: Aerosol variability, synoptic-scale processes, and their link to the cloud microphysics over the northeast Pacific during MAGIC, J. Geophys. Res.-Atmos., 120, 5122–5139, https://doi.org/10.1002/2015JD023175, 2015.
Painemal, D., Chang, F.-L., Ferrare, R., Burton, S., Li, Z., Smith Jr., W. L., Minnis, P., Feng, Y., and Clayton, M.: Reducing uncertainties in satellite estimates of aerosol–cloud interactions over the subtropical ocean by integrating vertically resolved aerosol observations, Atmos. Chem. Phys., 20, 7167–7177, https://doi.org/10.5194/acp-20-7167-2020, 2020.
Popp, T., de Leeuw, G., Bingen, C., Brühl, C., Capelle, V., Chedin, A., Clarisse, L., Dubovik, O., Grainger, R., Griesfeller, J., Heckel, A., Kinne, S., Klüser, L., Kosmale, M., Kolmonen, P., Lelli, L., Litvinov, P., Mei, L., North, P., Pinnock, S., Povey, A., Robert, C., Schulz, M., Sogacheva, L., Stebel, K., Stein Zweers, D., Thomas, G., Tilstra, L.G., Vandenbussche, S., Veefkind, P., Vountas, M., and Xue, Y.: Development, Production and Evaluation of Aerosol Climate Data Records from European Satellite Observations (Aerosol_cci), Remote Sens., 8, 421, https://doi.org/10.3390/rs8050421, 2016.
Remer, L. A., Kaufman, Y. J., Tanré, D., Mattoo, S., Chu, D. A., Martins, J. V., Li, R.-R., Ichoku, C., Levy, R. C., Kleidman, R. G., Eck, T. F., Vermote, E., and Holben, B. N.: The MODIS aerosol algorithm, products and validation, J. Atmos. Sci., 62, 947–973, https://doi.org/10.1175/JAS3385.1, 2005.
Rémy, S., Kipling, Z., Flemming, J., Boucher, O., Nabat, P., Michou, M., Bozzo, A., Ades, M., Huijnen, V., Benedetti, A., Engelen, R., Peuch, V.-H., and Morcrette, J.-J.: Description and evaluation of the tropospheric aerosol scheme in the European Centre for Medium-Range Weather Forecasts (ECMWF) Integrated Forecasting System (IFS-AER, cycle 45R1), Geosci. Model Dev., 12, 4627–4659, https://doi.org/10.5194/gmd-12-4627-2019, 2019.
Rémy, S., Kipling, Z., Huijnen, V., Flemming, J., Nabat, P., Michou, M., Ades, M., Engelen, R., and Peuch, V.-H.: Description and evaluation of the tropospheric aerosol scheme in the Integrated Forecasting System (IFS-AER, cycle 47R1) of ECMWF, Geosci. Model Dev., 15, 4881–4912, https://doi.org/10.5194/gmd-15-4881-2022, 2022.
Rennie, M. P., Isaksen, L., Weiler, F., de Kloe, J., Kanitz, T., and Reitebuch, O.: The impact of Aeolus wind retrievals on ECMWF global weather forecasts, Q. J. Roy. Meteor. Soc., 147, 3555–3586, https://doi.org/10.1002/qj.4142, 2021.
Ryder, C. L., Highwood, E. J., Walser, A., Seibert, P., Philipp, A., and Weinzierl, B.: Coarse and giant particles are ubiquitous in Saharan dust export regions and are radiatively significant over the Sahara, Atmos. Chem. Phys., 19, 15353–15376, https://doi.org/10.5194/acp-19-15353-2019, 2019.
Sand, M., Samset, B. H., Myhre, G., Gliß, J., Bauer, S. E., Bian, H., Chin, M., Checa-Garcia, R., Ginoux, P., Kipling, Z., Kirkevåg, A., Kokkola, H., Le Sager, P., Lund, M. T., Matsui, H., van Noije, T., Olivié, D. J. L., Remy, S., Schulz, M., Stier, P., Stjern, C. W., Takemura, T., Tsigaridis, K., Tsyro, S. G., and Watson-Parris, D.: Aerosol absorption in global models from AeroCom phase III, Atmos. Chem. Phys., 21, 15929–15947, https://doi.org/10.5194/acp-21-15929-2021, 2021.
Sawyer, V., Levy, R. C., Mattoo, S., Cureton, G., Shi, Y., and Remer, L. A.: Continuing the MODIS Dark Target Aerosol Time Series with VIIRS, Remote Sens., 12, 308, https://doi.org/10.3390/rs12020308, 2020.
Sayer, A. M. and Knobelspiesse, K. D.: How should we aggregate data? Methods accounting for the numerical distributions, with an assessment of aerosol optical depth, Atmos. Chem. Phys., 19, 15023–15048, https://doi.org/10.5194/acp-19-15023-2019, 2019.
Sayer, A. M., Hsu, N. C., Bettenhausen, C., Ahmad, Z., Holben, B. N., Smirnov. A., Thomas, G. E., and Zhang J.: SeaWiFS Ocean Aerosol Retrieval (SOAR): Algorithm, validation, and comparison with other data sets, J. Geophys. Res., 117, D03206, https://doi.org/10.1029/2011JD016599, 2012.
Sayer, A. M., Hsu, N. C., Bettenhausen, C., and Jeong, M.-J.: Validation and uncertainty estimates for MODIS Collection 6 “Deep Blue” aerosol data, J. Geophys. Res.-Atmos., 118, 7864–7872, https://doi.org/10.1002/jgrd.50600, 2013.
Sayer, A. M., Hsu, N. C., Bettenhausen, C., Holz, R. E., Lee, J., Quinn, G., and Veglio, P.: Cross-calibration of S-NPP VIIRS moderate-resolution reflective solar bands against MODIS Aqua over dark water scenes, Atmos. Meas. Tech., 10, 1425–1444, https://doi.org/10.5194/amt-10-1425-2017, 2017.
Sayer, A. M., Hsu, N. C., Lee, J., Bettenhausen, C., Kim, W. V., and Smirnov, A: Satellite Ocean Aerosol Retrieval (SOAR) algorithm extension to S-NPP VIIRS as part of the “Deep Blue” aerosol project, J. Geophys. Res.-Atmos., 123, 380–400, https://doi.org/10.1002/2017JD027412, 2018a.
Sayer, A. M., Hsu, N. C., Lee, J., Kim, W. V., Dubovik, O., Dutcher, S. T., Huang, D., Litvinov, P., Lyapustin, A., Tackett, J. L., and Winker, D. M.: Validation of SOAR VIIRS over-water aerosol retrievals and context within the global satellite aerosol data record, J. Geophys. Res.-Atmos., 123, 13496–13526, https://doi.org/10.1029/2018JD029465, 2018b.
Sayer, A. M., Hsu, N. C., Lee, J., Kim, W., and Dutcher, S.: Validation, stability, and consistency of MODIS Collection 6.1 and VIIRS Version 1 Deep Blue aerosol data over land, J. Geophys. Res.-Atmos., 124, 4658–4688, https://doi.org/10.1029/2018JD029598, 2019.
Schulz, M., Christophe, Y., Ramonet, M., Wagner, A., Eskes, H. J., Basart, S., Benedictow, A., Bennouna, Y., Blechschmidt, A.-M., Chabrillat, S., Cuevas, E., El Yazidi, A., Flentje, H., Fritzsche, P., Hansen, K. M., Im, U., Kapsomenakis, J., Langerock, B., Richter, A., Sudarchikova, N., Thouret, V., Warneke, T., and Zerefos, C.: Validation report of the CAMS near-real-time global atmospheric composition service: Period December 2019–February 2020, Copernicus Atmosphere Monitoring Service (CAMS) report, CAMS84_2018SC2_D1.1.1_DJF2020.pdf, June 2020, https://doi.org/10.24380/322n-jn39, 2020.
Schutgens, N., Tsyro, S., Gryspeerdt, E., Goto, D., Weigum, N., Schulz, M., and Stier, P.: On the spatio-temporal representativeness of observations, Atmos. Chem. Phys., 17, 9761–9780, https://doi.org/10.5194/acp-17-9761-2017, 2017.
Schutgens, N., Sayer, A. M., Heckel, A., Hsu, C., Jethva, H., de Leeuw, G., Leonard, P. J. T., Levy, R. C., Lipponen, A., Lyapustin, A., North, P., Popp, T., Poulsen, C., Sawyer, V., Sogacheva, L., Thomas, G., Torres, O., Wang, Y., Kinne, S., Schulz, M., and Stier, P.: An AeroCom–AeroSat study: intercomparison of satellite AOD datasets for aerosol model evaluation, Atmos. Chem. Phys., 20, 12431–12457, https://doi.org/10.5194/acp-20-12431-2020, 2020.
Sessions, W. R., Reid, J. S., Benedetti, A., Colarco, P. R., da Silva, A., Lu, S., Sekiyama, T., Tanaka, T. Y., Baldasano, J. M., Basart, S., Brooks, M. E., Eck, T. F., Iredell, M., Hansen, J. A., Jorba, O. C., Juang, H.-M. H., Lynch, P., Morcrette, J.-J., Moorthi, S., Mulcahy, J., Pradhan, Y., Razinger, M., Sampson, C. B., Wang, J., and Westphal, D. L.: Development towards a global operational aerosol consensus: basic climatological characteristics of the International Cooperative for Aerosol Prediction Multi-Model Ensemble (ICAP-MME), Atmos. Chem. Phys., 15, 335–362, https://doi.org/10.5194/acp-15-335-2015, 2015.
Shi, Y., Zhang, J., Reid, J. S., Holben, B., Hyer, E. J., and Curtis, C.: An analysis of the collection 5 MODIS over-ocean aerosol optical depth product for its implication in aerosol assimilation, Atmos. Chem. Phys., 11, 557–565, https://doi.org/10.5194/acp-11-557-2011, 2011.
Sindelarova, K., Granier, C., Bouarar, I., Guenther, A., Tilmes, S., Stavrakou, T., Müller, J.-F., Kuhn, U., Stefani, P., and Knorr, W.: Global data set of biogenic VOC emissions calculated by the MEGAN model over the last 30 years, Atmos. Chem. Phys., 14, 9317–9341, https://doi.org/10.5194/acp-14-9317-2014, 2014.
Smirnov, A., Holben, B. N., Slutsker, I., Giles, D. M., McCLain, C. R., Eck, T. F., Sakerin, S. M., Macke, A., Croot, P., Zibordi, G., Quinn, P. K., Sciare, J., Kinne, S., Harvey, M., Smyth, T. J., Piketh, S., Zielinski, T., Proshuninsky, A., Goes, J. I., Nelson, N. B., Larouche, P., Radionov, V. F., Goloub, P., Moorthy, K. K., Matarresse, R., Robertson, E. J., and Jourdin, F.: Maritime Aerosol Network as a component of Aerosol Robotic Network, J. Geophys. Res., 112, D06204, https://doi.org/10.1029/2008JD011257, 2009
Sogacheva, L., Kolmonen, P., Virtanen, T. H., Rodriguez, E., Saponaro, G., and de Leeuw, G.: Post-processing to remove residual clouds from aerosol optical depth retrieved using the Advanced Along Track Scanning Radiometer, Atmos. Meas. Tech., 10, 491–505, https://doi.org/10.5194/amt-10-491-2017, 2017.
Sogacheva, L., Popp, T., Sayer, A. M., Dubovik, O., Garay, M. J., Heckel, A., Hsu, N. C., Jethva, H., Kahn, R. A., Kolmonen, P., Kosmale, M., de Leeuw, G., Levy, R. C., Litvinov, P., Lyapustin, A., North, P., Torres, O., and Arola, A.: Merging regional and global aerosol optical depth records from major available satellite products, Atmos. Chem. Phys., 20, 2031–2056, https://doi.org/10.5194/acp-20-2031-2020, 2020.
Tanré, D., Bréon, F. M., Deuzé, J. L., Dubovik, O., Ducos, F., François, P., Goloub, P., Herman, M., Lifermann, A., and Waquet, F.: Remote sensing of aerosols by using polarized, directional and spectral measurements within the A-Train: the PARASOL mission, Atmos. Meas. Tech., 4, 1383–1395, https://doi.org/10.5194/amt-4-1383-2011, 2011.
Tao, M., Chen, L., Wang, Z., Wang, J., Che, H., Xu, X., Wang, W., Tao, J., Zhu, H., and Hou, C.: Evaluation of MODIS Deep Blue aerosol algorithm in desert region of East Asia: Ground validation and intercomparison, J. Geophys. Res.-Atmos., 122, 10357–10368, https://doi.org/10.1002/2017JD026976, 2017.
Temperton, C., Hortal, M., and Simmons, A.: A two-time-level semi-Lagrangian global spectral model, Q. J. Roy. Meteor. Soc., 127, 111–127, 2001.
Tilstra, L. G., Tuinder, O. N. E., Wang, P., and Stammes, P.: Surface reflectivity climatologies from UV to NIR determined from Earth observations by GOME-2 and SCIAMACHY, J. Geophys. Res.-Atmos. 122, 4084–4111, https://doi.org/10.1002/2016JD025940, 2017.
Tilstra, L. G., Tuinder, O. N. E., Wang, P., and Stammes, P.: Directionally dependent Lambertian-equivalent reflectivity (DLER) of the Earth's surface measured by the GOME-2 satellite instruments, Atmos. Meas. Tech., 14, 4219–4238, https://doi.org/10.5194/amt-14-4219-2021, 2021.
Torres, O., Bhartia, P. K., Herman, J. R., and Ahmad, Z.: Derivation of aerosol properties from satellite measurements of backscattered ultraviolet radiation: Theoretical basis, J. Geophys. Res., 103, 17099–17110, 1998.
Toth, T. D., Zhang, J., Campbell, J. R., Reid, J. S., Shi, Y., Johnson, R. S., Smirnov, A., Vaughan, M. A., and Winker, D. M.: Investigating enhanced Aqua MODIS aerosol optical depth retrievals over the mid-to-high latitude Southern Oceans through intercomparison with co-located CALIOP, MAN, and AERONET data sets, J. Geophys. Res.-Atmos., 118, 4700–4714, https://doi.org/10.1002/jgrd.50311, 2013.
Uprety, S., Cao, C., and Shao, X.: Radiometric consistency between GOES-16 ABI and VIIRS on Suomi NPP and NOAA-20, J. Appl. Remote Sens. 14, 032407, https://doi.org/10.1117/1.JRS.14.032407, 2020.
Vidot, J., Santer, R., and Aznay, O.: Evaluation of the MERIS aerosol product over land with AERONET, Atmos. Chem. Phys., 8, 7603–7617, https://doi.org/10.5194/acp-8-7603-2008, 2008.
Virtanen, T. H., Kolmonen, P., Sogacheva, L., Rodríguez, E., Saponaro, G., and de Leeuw, G.: Collocation mismatch uncertainties in satellite aerosol retrieval validation, Atmos. Meas. Tech., 11, 925–938, https://doi.org/10.5194/amt-11-925-2018, 2018.
Wei, J., Peng, Y., Mahmood, R., Sun, L., and Guo, J.: Intercomparison in spatial distributions and temporal trends derived from multi-source satellite aerosol products, Atmos. Chem. Phys., 19, 7183–7207, https://doi.org/10.5194/acp-19-7183-2019, 2019a.
Wei, J., Li, Z., Peng, Y., and Sun, L: MODIS Collection 6.1 aerosol optical depth products over land and ocean: validation and comparison, Atmos. Environ., 201, 428–440, 2019b.
Witek, M. L., Garay, M. J., Diner, D. J., and Smirnov, A.: Aerosol optical depths over oceans: A view from MISR retrievals and collocated MAN and AERONET in situ observations, J. Geophys. Res.-Atmos., 118, 12620–12633, https://doi.org/10.1002/2013JD020393, 2013.
Wong, J. and Li, Z.: Retrieval of Optical Depth for Heavy Smoke Aerosol Plumes: Uncertainties and Sensitivities to the Optical Properties, J. Atmos. Sci., 59, 250–261, 2002.
Xian, P., Reid, J. S., Hyer, E. J., et al.: Current state of the global operational aerosol multi-model ensemble: An update from the International Cooperative for Aerosol Prediction (ICAP), Q. J. Roy. Meteor. Soc., 145, 176–209, https://doi.org/10.1002/qj.3497, 2019.
Yarwood, G., Rao, S., Yocke, M., and Whitten, G.: Updates to the Carbon Bond Chemical Mechanism: CB05, Final Report to the US EPA, RT-0400675, 2005.
Zhang, J. and Reid, J. S.: MODIS aerosol product analysis for data assimilation: Assessment of over-ocean level 2aerosol optical thickness retrievals, J. Geophys. Res., 111, D22207, https://doi.org/10.1029/2005JD006898, 2006.
Zhang, J., Reid, J. S., and Holben, B. N.: An analysis of potential cloud artifacts in MODIS over ocean aerosol optical thickness products, Geophys. Res. Lett., 32, L15803, https://doi.org/10.1029/2005GL023254, 2005.
Zhang, J., Reid, J. S., Westphal, D. L., Baker, N. L., and Hyer, E. J.: A system for operational aerosol optical depth data assimilation over global oceans, J. Geophys. Res.-Atmos., 113, D10208, https://doi.org/10.1029/2007JD009065, 2008.
Zhang, J., Campbell, J. R., Hyer, E. J., Reid, J. S., Westphal, D. L., and Johnson, R. S.: Evaluating the impact of multisensor data assimilation on a global aerosol particle transport model, J. Geophys. Res.-Atmos., 119, 4674–4689, https://doi.org/10.1002/2013JD020975, 2014.
Zhang, H., Kondragunta, S., Laszlo, I., Liu, H., Remer, L. A., Huang, J., Superczynski, S., and Ciren, P.: An enhanced VIIRS aerosol optical thickness (AOT) retrieval algorithm over land using a global surface reflectance ratio database, J. Geophys. Res.-Atmos., 121, 10717–10738, https://doi.org/10.1002/2016JD024859, 2016.
Zhang, J., Reid, J. S., Alfaro-Contreras, R., and Xian, P.: Has China been exporting less particulate air pollution over the past decade?, Geophys. Res. Lett., 44, 2941–2948, https://doi.org/10.1002/2017GL072617, 2017.
Zhao, T. X.-P., Chan, P. K., and Heidinger, A. K.: A global survey of the effect of cloud contamination on the aerosol optical thickness and its long-term trend derived from operational AVHRR satellite observations, J. Geophys. Res.-Atmos., 118, 2849–2857, https://doi.org/10.1002/jgrd.50278, 2013.
Zhou, Y., Levy, R. C., Remer, L. A., Mattoo, S., and Espinosa, W. R.: Dust aerosol retrieval over the oceans with the MODIS/VIIRS dark target algorithm: 2. Non spherical dust model. Earth and Space Science, 7, e2020EA001222, https://doi.org/10.1029/2020EA001221, 2020.
- Abstract
- Introduction
- Satellite AOD products
- Model and experiment design
- Results
- Discussion
- Conclusion
- Appendix A: Satellite AOD products
- Appendix B: Product scatter plots
- Appendix C: Regional histograms
- Appendix D: Additional results for the MAM period
- Code and data availability
- Author contributions
- Competing interests
- Disclaimer
- Acknowledgements
- Review statement
- References