the Creative Commons Attribution 4.0 License.
the Creative Commons Attribution 4.0 License.
 | 15 Nov 2022
Comparison of model and ground observations finds snowpack and blowing snow aerosols both contribute to Arctic tropospheric reactive bromine
Chris D. Holmes
William R. Simpson
Kaitlyn Confer
Louis Marelle
Jennie L. Thomas
Lyatt Jaeglé
Becky Alexander
Shuting Zhai
Qianjie Chen
Xuan Wang
Tomás Sherwen
Reactive halogens play a prominent role in the atmospheric chemistry of the Arctic during springtime. Field measurements and modeling studies suggest that halogens are emitted into the atmosphere from snowpack and reactions on wind-blown snow-sourced aerosols. The relative importance of snowpack and blowing snow sources is still debated, both at local scales and regionally throughout the Arctic. To understand the implications of these halogen sources on a pan-Arctic scale, we simulate Arctic reactive bromine chemistry in the atmospheric chemical transport model GEOS-Chem. Two mechanisms are included: (1) a blowing snow sea salt aerosol formation mechanism and (2) a snowpack mechanism assuming uniform molecular bromine production from all snow surfaces. We compare simulations including neither mechanism, each mechanism individually, and both mechanisms to examine conditions where one process may dominate or the mechanisms may interact. We compare the models using these mechanisms to observations of bromine monoxide (BrO) derived from multiple-axis differential optical absorption spectroscopy (MAX-DOAS) instruments on O-Buoy platforms on the sea ice and at a coastal site in Utqiaġvik, Alaska, during spring 2015. Model estimations of hourly and monthly average BrO are improved by assuming a constant yield of 0.1 % molecular bromine from all snowpack surfaces on ozone deposition. The blowing snow aerosol mechanism increases modeled BrO by providing more bromide-rich aerosol surface area for reactive bromine recycling. The snowpack mechanism led to increased model BrO across the Arctic Ocean with maximum production in coastal regions, whereas the blowing snow aerosol mechanism increases BrO in specific areas due to high surface wind speeds. Our uniform snowpack source has a greater impact on BrO mixing ratios than the blowing snow source. Model results best replicate several features of BrO observations during spring 2015 when using both mechanisms in conjunction, adding evidence that these mechanisms are both active during the Arctic spring. Extending our transport model throughout the entire year leads to predictions of enhanced fall BrO that are not supported by observations.
- Article
(5146 KB) - Full-text XML
-
Supplement
(2627 KB) - BibTeX
- EndNote


Simulating Arctic halogen chemistry is a persistent problem for global models because processes appear to differ between the Arctic and middle latitudes (Parrella et al., 2012; Schmidt et al., 2016). Space-based instruments observe large column densities of reactive bromine across swaths of the Arctic Ocean during the Arctic spring (Chance, 1998; Richter et al., 1998; Wagner and Platt, 1998). Increased levels of tropospheric reactive bromine are associated with ozone depletion events (Barrie et al., 1988; Foster et al., 2001; Koo et al., 2012; Halfacre et al., 2014) as well as oxidation of gaseous elemental mercury (Schroeder et al., 1998; Nghiem, 2013; Moore et al., 2014). Bromine radicals have been observed to lead directly to ozone depletion and mercury oxidation (S. Wang et al., 2019). Deposition of oxidized mercury to the snowpack can have deleterious effects on the health of Arctic humans and animals (AMAP, 2011). Arctic reactive bromine chemistry impacts tropospheric oxidative chemistry but is not typically accounted for in global models. Model studies have found that reactive halogen chemistry can explain the oxidation of gaseous elemental mercury (Holmes et al., 2010) and reduce radiative forcing from ozone (Sherwen et al., 2017). Replicating reactive halogen chemistry in models requires inclusion of multiphase chemical reactions as well as mechanisms affecting sea salt aerosol particle production and chemical reactions within the snowpack.
These increased levels of tropospheric reactive bromine radicals are a product of heterogeneous photochemical reactions at the interface between air and saline surfaces such as surface snowpack and sea salt aerosols (Saiz-Lopez and von Glasow, 2012; Simpson et al., 2015). Figure 1 depicts the gas-phase, heterogeneous, and photochemical reactions thought to control tropospheric bromine, all of which are included in the model and results presented in this paper. Bromine radicals (Br) are produced by photolysis of molecular bromine (P1) or by self-reaction of BrO (R6) and react with ozone to form bromine monoxide (BrO) (R2). Under sunlit conditions, BrO is most often photolyzed back to Br radicals and an oxygen atom (P2) that then most often reforms ozone, resulting in a null cycle. Due to this rapid interchange of Br and BrO, these two compounds form the BrOx family. If processes other than BrO photolysis (P2) convert BrO back to Br without producing ozone, the imbalance between these other processes and P2 result in net ozone depletion. For example, ozone is depleted through R6 or R7 when BrO reacts with another halogen oxide to form either Br2 or BrCl or through other more extended processes. A reactive halogen-activating cycle occurs when a BrO radical reacts with a hydroperoxy (HO2) radical in R5 to form gaseous hypobromous acid (HOBr). Heterogeneous chemistry can occur on a saline surface between HOBr and particulate bromide (p-Br−) in HR1 forming Br2 or particle chloride (p-Cl−) in HR6-forming BrCl. For each cycle of reactions P1, R2, R5, and HR1, one hydroperoxy radical is removed from the atmosphere, one bromine atom is released into the atmosphere, and one ozone molecule is destroyed. This process of activation of particulate and snow bromide to Br2 by consuming other radicals (e.g., HO2) is known as the “bromine explosion” (Wennberg, 1999). Ground-based instruments have observed sharp increases in reactive bromine levels over the course of a single day from below 2 pmol mol−1 up to a maximum of 41 pmol mol−1 (Pöhler et al., 2010). Reactions may also sequester reactive bromine into more stable bromine reservoir species. BrO may react with nitrogen dioxide (NO2) in R8 to form bromine nitrate (BrNO3), which can also undergo hydrolysis on aqueous and ice surfaces to form HOBr as in HR3.
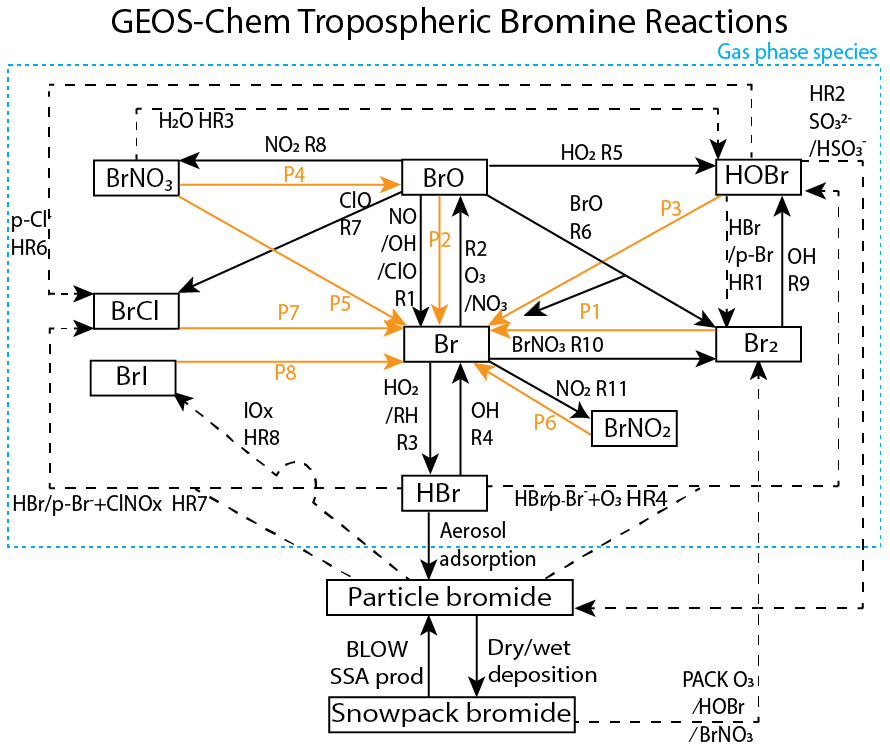
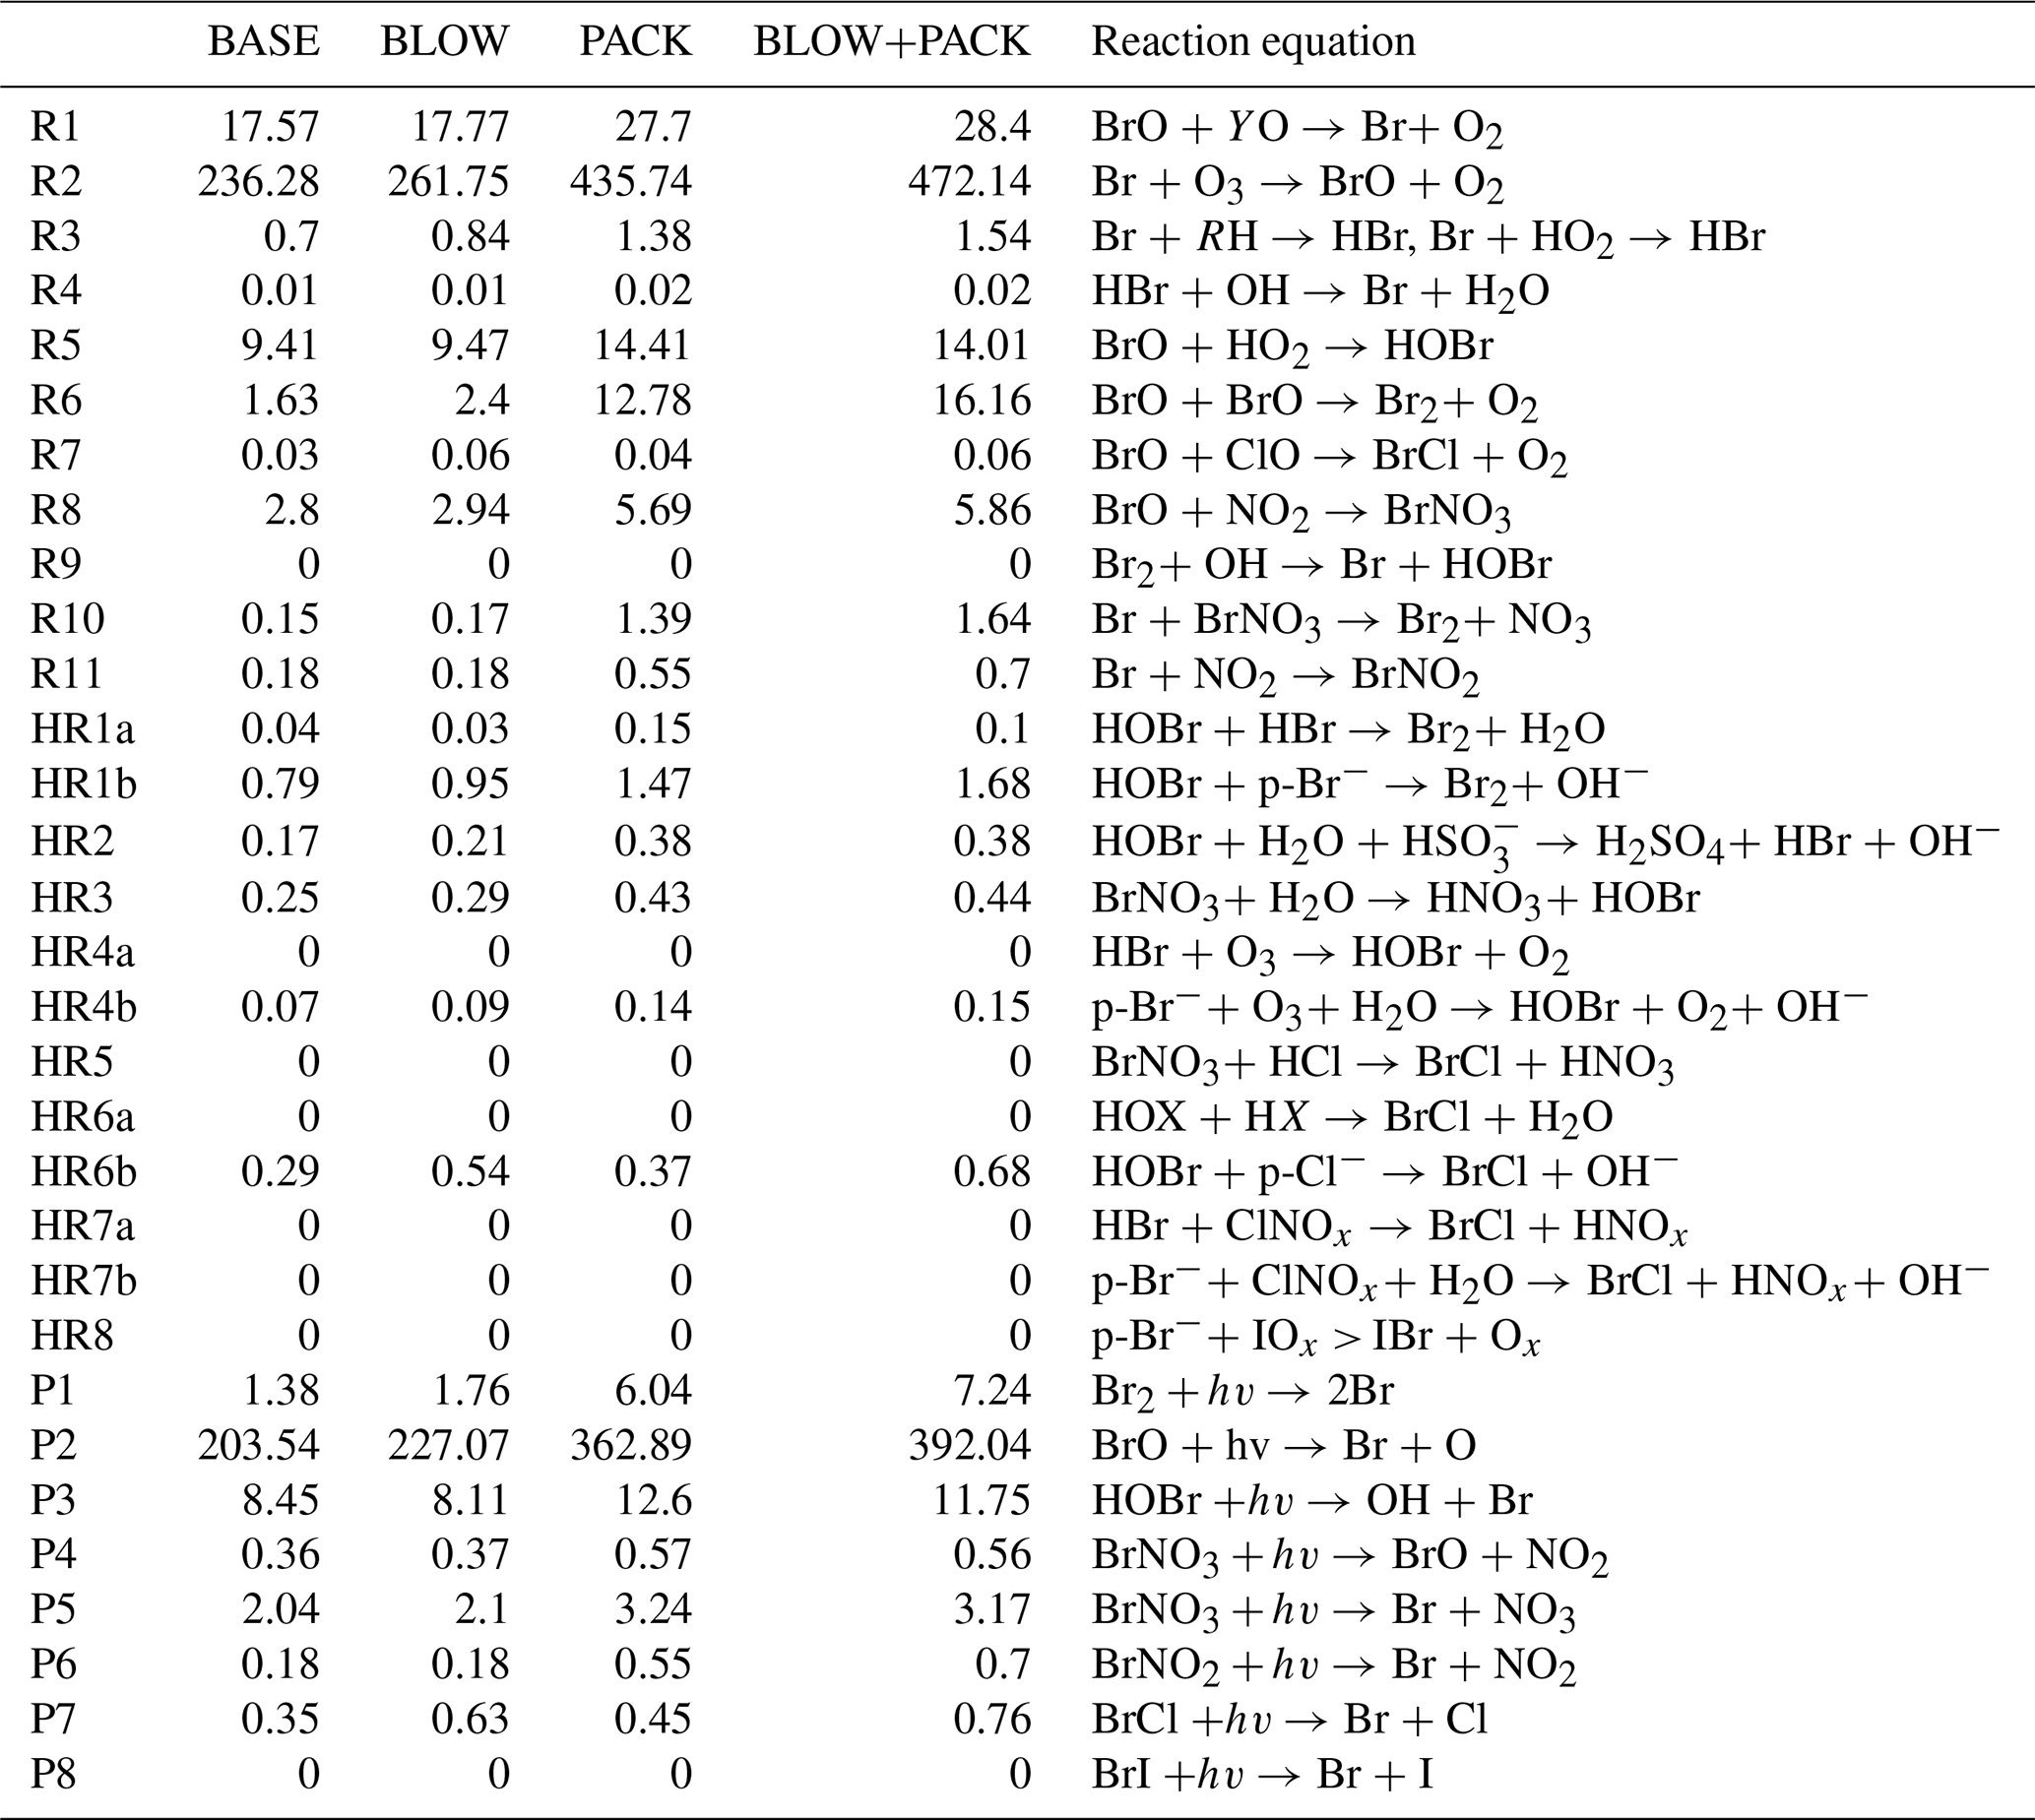
Figure 1GEOS-Chem tropospheric bromine reactions. Tropospheric bromide reservoirs are shown in black boxes, with attached lines indicating reactions. Solid black lines R1–R11 indicate gas-phase chemical reactions, solid orange lines P1–P8 indicate photolysis reactions, and dashed black lines HR1–HR8 indicate heterogeneous reactions. All gaseous species may undergo dry deposition. Additional sources of tropospheric bromine include the production of particulate bromide by the BLOW mechanisms and the production of Br2 by the PACK mechanism as well as the degradation of organobromines to form Br (OR1). Table 3 enumerates the specific species involved in each equation and shows the reaction rates for each respective equation.
A potentially important competitor for recycling of reactive bromine through HOBr is its reaction with sulfur (IV) species, such as the reaction between HSO and HOBr in HR2 (Chen et al., 2017). To the extent that this reaction competes with HR1, it can slow the release of bromide from surfaces and reduce gas-phase reactive bromine (e.g., reduce BrO). Deposition of the HBr formed from HOBr by HR2 can remove reactive bromine from the troposphere. In general, the termination of this chemistry leads to formation of HBr, which undergoes gas-particulate uptake to particulate bromide (p-Br−).
Ozone deposited on a saline surface can oxidize Br− to form HOBr (similar to p-Br− reactions HR4a and HR4b), which is then converted to Br2 or another dihalogen (e.g., BrCl). Production of reactive bromine during ozone deposition does not require light and can occur at night (Oum et al., 1998; Artiglia et al., 2017). The production of Br2 is increased at low pH levels (Halfacre et al., 2019).
We define the inorganic bromine family, Bry, in this paper as the sum of the bromine species: Br, BrO, HOBr, BrNO3, 2×Br2, BrCl, BrI, and HBr, excluding p-Br−. The release of bromine from sea salt aerosol particles was found to be the dominant global source of reactive bromine (Sander et al., 2003; Zhu et al., 2019). Sea salt aerosol particles (SSAs) are one of the most abundant aerosol particle types present in the troposphere (De Leeuw et al., 2011). Due to their abundance, SSA particles greatly increase the particulate bromide on aerosol surfaces available for heterogeneous reactive bromine chemistry. Debromination of acidified aerosol increases reactive bromine by 30 %, although global models may underestimate Arctic reactive bromine when considering only open-ocean-sourced SSA (Schmidt et al., 2016). The initial literature on Arctic reactive bromine chemistry identified aerosol particles as a potential saline surface for reactive bromine photochemistry (Fan and Jacob, 1992; Vogt et al., 1996), and field studies confirmed that SSA is depleted in bromide (Ayers et al., 1999; Hara et al., 2018). If one supposes that SSA can only be produced from the open-ocean source of SSA, the lack of Arctic Ocean open water during the winter/spring is at odds with observations of high SSA concentrations observed during the winter months in polar regions (Wagenbach et al., 1998; Huang et al., 2018). The formation of SSA from the sublimation of blowing snow particles over the Arctic Ocean was proposed as an alternate SSA production mechanism (Yang et al., 2008, 2010, 2019). Recent field studies have confirmed the direct production of SSA from blowing snow (Frey et al., 2020). A blowing snow SSA mechanism was implemented in the global chemical model GEOS-Chem and was able to explain wintertime SSA enhancements over the Arctic (Huang and Jaeglé, 2017) as well as CALIOP-detected aerosol particle abundance (Huang et al., 2018) and high levels of Arctic BrO detected by satellites in spring (Huang et al., 2020).
Snowpack containing bromide salts was also identified as a source of reactive bromine (Tang and McConnell, 1996). Molecular bromine was measured above the snowpack at levels up to 25 pmol mol−1 (Foster et al., 2001). Field experiments demonstrate that the snowpack emits Br2, Cl2, and BrCl, with emission affected by ambient ozone levels, the snowpack ratio of bromide to chloride, and exposure to sunlight (Pratt et al., 2013; Custard et al., 2017). Box modeling found that the flux of reactive bromine from the surface of the Arctic Ocean sea ice is a prerequisite for bromine activation (Lehrer et al., 2004). Box modeling found that both HOBr and BrNO3 can be converted to Br2 in the snowpack (Wang and Pratt, 2017). Detailed one-dimensional models of the snowpack–air interface find that reactive bromine production can occur in the interstitial air between snowpack grains (Thomas et al., 2011; Toyota et al., 2014), with ozone depletion events arising from snowpack reactive bromine production (Thomas et al., 2011; Toyota et al., 2014; Cao et al., 2016). However, a detailed snowpack model coupled to an atmospheric model would be sensitive to important parameters such as snowpack bromide content and acidity of the air–ice interface that are highly variable across the Arctic (Toom-Sauntry and Barrie, 2002; Krnavek et al., 2012). A mechanism to parameterize the release of molecular bromine from snowpack upon deposition of ozone, HOBr, and BrNO3 was implemented in the GEM-AQ model and captured many of the observed features of reactive bromine in the Arctic troposphere (Toyota et al., 2011). The mechanisms from Toyota et al. (2011) assume a 100 % yield of molecular bromine on deposition of HOBr or BrNO3 (see Fig. 1 PACK) and a diurnally varying yield of Br2 on ozone deposition of 7.5 % during the daytime (solar elevation angle > 5∘) and 0.1 % during the nighttime (solar elevation angle < 5∘) (see Fig. 1, PACK). In the Toyota et al. (2011) parameterization, the daytime yield of Br2 from ozone was increased to 7.5 % to match surface ozone depletion observations and is based on the assumption that photochemical reactions in the snowpack would trigger a bromine explosion and amplify the net release of Br2 (Toyota et al., 2011). Herrmann et al. (2021) implemented the Toyota et al. (2011) mechanism in WRF-Chem and found that snowpack Br2 production was capable of replicating ozone depletion events observed in multiple datasets. Marelle et al. (2021) implemented a surface snowpack mechanism based on Toyota et al. (2011) and a blowing snow SSA mechanism based on Yang et al. (2008) and Huang and Jaeglé (2017) and found improved prediction of ozone depletion events, the majority of which were triggered by the snowpack mechanism. The Toyota et al. (2011) mechanism was also implemented in the EMAC model and replicated many of the features of reactive bromine events observed by the satellite-based GOME sensor (Falk and Sinnhuber, 2018).
Field campaigns have directly observed the production of SSA from blowing snow (Frey et al., 2020) as well as production of Br2 from the snowpack (Pratt et al., 2013) in the environment. This paper uses both production mechanisms for the first time in the global chemical model GEOS-Chem. We devised a set of six model runs to test each mechanism individually and together as well as one control run using neither mechanism. We compare BrO simulated in each model run against extensive ground-based observations of BrO made from February to June 2015. This set of modeling scenarios allows identification of the effects of each mechanism on BrO as well as the synergistic effects of both mechanisms working together.
2.1 Multiple-axis differential optical absorption spectroscopy (MAX-DOAS) observation platforms
MAX-DOAS remotely measures the vertical profile of BrO (Hönninger and Platt, 2002; Carlson et al., 2010; Frieß et al., 2011; Peterson et al., 2015; Simpson et al., 2017). BrO is commonly used as a proxy for total tropospheric reactive bromine (Chance, 1998; Richter et al., 1998; Wagner and Platt, 1998; Theys et al., 2011; Choi et al., 2012). MAX-DOAS instruments were mounted on all of the 15 floating autonomous platforms (O-Buoys) deployed in the Arctic sea ice as a part of the National Science Foundation-funded Arctic Observing Network project (Knepp et al., 2010). Since MAX-DOAS requires sunlight to operate, measurements are not available in winter. Spring observations on the O-Buoys typically begin in April, when there is enough O-Buoy solar power to defrost the MAX-DOAS view port. Figure 2 shows the O-Buoys active during 2015. O-Buoy 10 was deployed in sea ice in fall 2013 and measured reactive halogen chemistry in spring 2014 and 2015. Most O-Buoys were destroyed in the summer, crushed between fragments of melting sea ice. However, O-Buoy 10 survived summer 2014 in an intact ice floe, survived the winter of 2014–2015, and re-started MAX-DOAS observations in April 2015. O-Buoys 11 and 12 were deployed in fall 2014 and also re-started observing BrO in April 2015. Figure 2 shows the GPS-derived tracks of the O-Buoys for their full deployment and highlights the O-Buoy locations from April to June 2015 when the BrO observations considered in this analysis were gathered. A MAX-DOAS instrument of the same design was deployed at the Barrow Arctic Research Center (BARC) on the coast of the Arctic Ocean located at 156.6679∘ W, 71.3249∘ N near Utqiaġvik, AK (Simpson, 2018), also shown in Fig. 2. Unlike the O-Buoy MAX-DOAS systems, which were powered by batteries and solar panels, the BARC MAX-DOAS was powered by local utilities and was able to defrost its view port to gather BrO observations earlier in the year, including February and March 2015. The BARC MAX-DOAS data were compared with two O-Buoy-style MAX-DOAS instruments deployed on Icelander platforms (deployed on top of sea ice instead of within), and measurements from the various MAX-DOAS systems were found to be comparable (Simpson et al., 2017). The reactive bromine season ends when the BrO slant column densities fall below the instrument detection limit and do not recover, which we call the seasonal end date (Burd et al., 2017). All O-Buoy and BARC (Utqiaġvik) data are available at arcticdata.io (Simpson et al., 2009; Simpson, 2018). More information on the time periods of spring BrO observations can be found in Swanson et al. (2020) and Burd et al. (2017). For comparison to the MAX-DOAS BrO observations, GEOS-Chem model simulations are sampled along the GPS-derived paths of O-Buoys 10, 11, and 12 as well as at BARC.
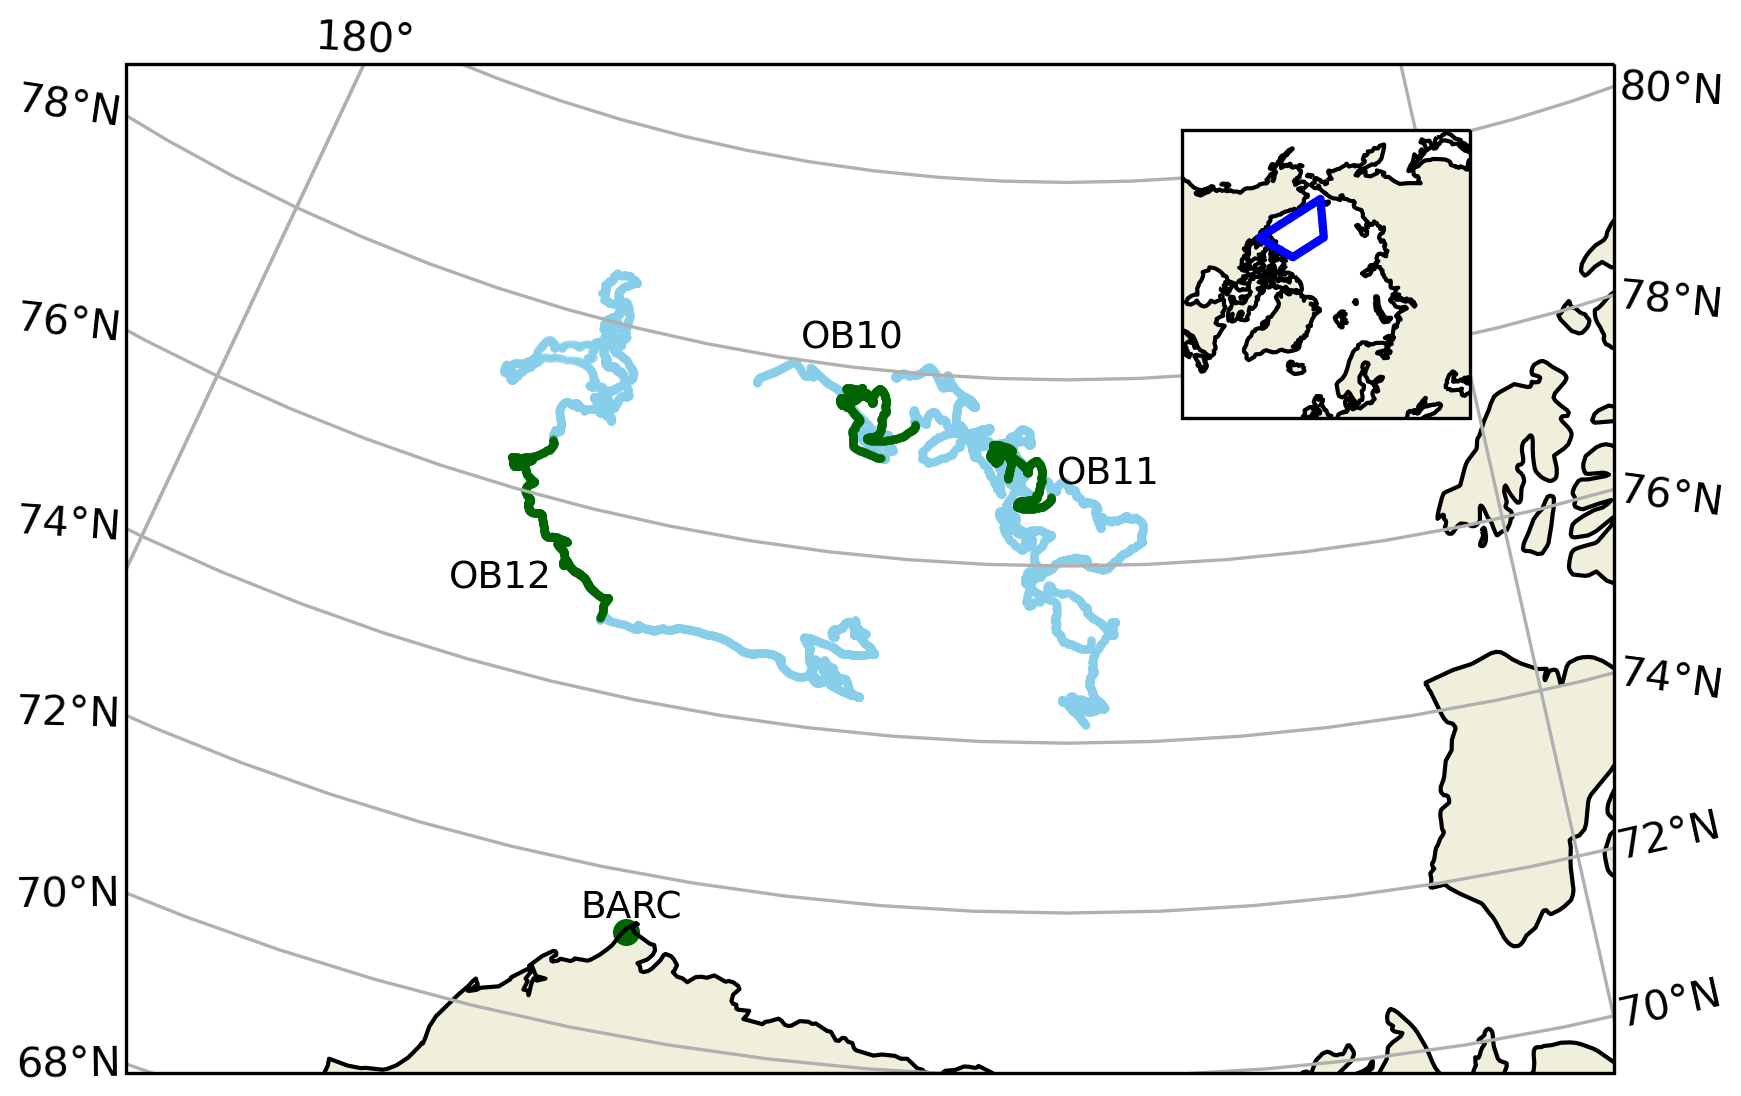
Figure 2Locations of MAX-DOAS BrO observations used in this work. Blue lines show the drift tracks of O-Buoys, with green showing the locations with valid BrO measurements in spring 2015. Location of Barrow Arctic Research Center (BARC) in Utqiaġvik indicated by green dots. True color MODIS imagery on 1 April 2015 shows typical sea ice coverage (NASA, 2015). The inset map shows the location of the map grid within the Northern Hemisphere.
2.2 MAX-DOAS profile retrieval
Vertical profiles of BrO were derived from MAX-DOAS observations by means of optimal estimation inversion procedures detailed in Peterson et al. (2015) with settings detailed in Simpson et al. (2017). The HeiPro optimal estimation algorithm (Frieß et al., 2006, 2019) is used to retrieve vertical profiles of BrO between the surface and 4 km from the MAX-DOAS observations. Examination of the averaging kernels from each MAX-DOAS retrieval finds the retrieved vertical profile of BrO is best represented by two quantities: the vertical column density of BrO in the lowest 200 m and the vertical column density of BrO in the lowest 2000 m of the troposphere, referred to in this paper as BrOLTcol (Peterson et al., 2015). It was shown in Peterson et al. (2015) that these two quantities were largely independent of each other, were fairly insensitive to variations in the assumed prior profile, and represented the ∼ 2–3 degrees of freedom for the signal indicated by the optimal estimation retrieval. An important consideration of this method is that when the visibility is poor, MAX-DOAS is unable to traverse the lowest 2000 m a.g.l. and BrOLTcol cannot be measured accurately. Therefore, our quality-control algorithm eliminates BrOLTcol observations when the degrees of freedom for the signal in the lofted (200–2000 m a.g.l.) layer were below 0.5 (Simpson et al., 2017). The average fitting error (1σ error) of BrOLTcol during spring 2015 was 5.6×10¹² molecules cm−2.
2.3 SSA production from the open ocean
Sea foam from breaking waves and bursting of bubbles forms aerosol droplets suspended in the marine boundary layer (Lewis and Schwartz, 2004). We calculate emission of sea salt aerosol particles from the open ocean as a function of wind speed and sea surface temperature (SST) using the mechanism initially described in Jaeglé et al. (2011) and updated with decreased emissions over cold (SST < 5 ∘C) ocean waters (Huang and Jaeglé, 2017). Two separate SSA tracers are transported: accumulation-mode SSA (rdry = 0.01–0.5 µm) and coarse-mode SSA (rdry=0.5–8 µm). Sea salt bromide is emitted assuming a bromine content of kg Br per kilogram of dry SSA (primarily NaCl) based on the mean ionic composition of seawater (Sander et al., 2003). Bromide content is tracked separately on accumulation-mode SSA and on coarse-mode SSA. Freshly emitted SSA is alkaline and can be titrated to a pH of 5 by uptake of acid gases SO2, H2SO4, and HNO3 (Alexander et al., 2005). Heterogeneous chemical reactions can convert SSA-transported bromide into gaseous reactive bromine species in the atmosphere. We run our open-ocean SSA calculations at 0.5∘ latitude × 0.625∘ longitude spatial resolution using the harmonized emissions component (HEMCO) for the highest possible detail (Keller et al., 2014; Lin et al., 2021), including cold water corrections used in Jaeglé et al. (2011). Production of SSA from open oceans followed by advection can lead to reactive bromine recycling over Arctic Ocean sea ice. Each of our model runs reads the dataset generated offline by HEMCO rather than spending computational time replicating open-ocean SSA emissions. We call our control run using only open-ocean SSA emissions BASE.
2.4 Blowing snow SSA production
Snow can be lofted from the snowpack into the lowest layers of the troposphere by high wind speeds, where it can undergo saltation (bouncing leading to fragmentation) and sublimation to form SSA (Yang et al., 2008, 2010; Frey et al., 2020). This process is modeled as a function of humidity, ambient temperature, wind speed, snow particle size distribution, and the salinity of the blowing snow (Yang et al., 2008, 2010). We assume that snowpack exists on all sea ice surfaces during the Arctic spring after snow accumulation during winter on sea ice of all ages. Three thresholds must be met for SSA production from blowing snow (Déry and Yau, 1999, 2001). A temperature threshold restricts SSA production from blowing snow to temperatures below freezing. The humidity threshold is based on relative humidity with respect to ice. Sublimation from snow crystals cannot occur if the air is saturated, and no SSA is produced if RHice is greater than 100 %. The wind speed threshold requires 10 m wind speed to be greater than a threshold value defined in Eq. (1) for any production of SSA (Déry and Yau, 1999, 2001).
The wind speed threshold (Ut) is dependent on surface temperature (Ts) in Celsius with a minimum threshold of 6.975 m s−1 at −27.27 ∘C and a maximum threshold at 0 ∘C of 9.429 m s−1. The 10 m wind speed threshold is the most stringent and often controls the production of SSA from blowing snow.
Production of blowing snow SSA is highly sensitive to surface wind speed. We use the highest-resolution surface wind speed dataset to ensure the most accurate modeling of SSA and reactive bromine. The MERRA-2 Global Reanalysis Product has a 0.5∘ latitude × 0.625∘ longitude resolution which is typically re-gridded to a lower resolution for global chemical modeling. Previous use of the snowpack blowing snow SSA mechanism used MERRA-2 data re-gridded to either 2∘ × 2.5∘ or 4∘ × 5∘ latitude and longitude (Huang and Jaeglé, 2017; Huang et al., 2018, 2020). Re-gridding to a coarser spatial resolution may smooth out the highest 10 m wind speeds by averaging them with lower wind speeds in the grid cell. The Utqiaġvik MERRA-2 10 m wind speeds at different spatial resolutions are shown in Supplement Figs. S1, S2, and S3 to illustrate this effect. Average Utqiaġvik 10 m wind speeds for 2015 are 5.3 m s−1 at 2∘ × 2.5∘ resolution and 5.5 m s−1 at 0.5∘ × 0.625∘ resolution. The maximum Utqiaġvik 10 m wind speed at MERRA-2 2×2.5 is 16.3 m s−1, while the maximum wind speed at MERRA-2 0.5∘ × 0.625∘ is 19.3 m s−1. These extremely high wind speed events are more common at higher spatial resolution and can contribute an outsized amount of SSA to the marine boundary layer. Supplement Fig. S4 shows the measured 10 m wind speed at BARC along with a daily average threshold wind speed (Eq. 1). Spikes in daily averaged wind speed at BARC in April can contribute to SSA formation and justify the use of high-resolution MERRA-2 wind speed data.
Snow salinity is influenced by snow age and the material underlying the snow (Krnavek et al., 2012). The median surface snowpack salinity near Utqiaġvik was measured at 0.67 practical salinity units (PSUz) for 2–3-week old sea ice, 0.12 PSU for thicker first-year ice, and 0.01 PSU for multi-year ice (MYI) (Krnavek et al., 2012). Snow salinity is also a function of snow depth above sea ice, with blowing surface snow having much lower salinity than snow at depth that is in contact with the sea ice (Frey et al., 2020). Domine et al. (2004) measured median salinity at 0.1 PSU on snowpack over first-year ice and 0.02 on snowpack over multi-year ice. In this analysis we use a salinity of 0.1 PSU on first-year sea ice as in Huang et al. (2020). The production of reactive bromine from sea ice types is entirely dependent on PSU in this parameterization. Previous modeling efforts have used 0.01 PSU for MYI (Huang et al., 2018) and underestimate BrO production in high Arctic areas with increased MYI coverage. The bromide content of surface snow over MYI is enriched by deposition of SSA and trace gases, and MYI regions may play a role in springtime halogen chemistry (Peterson et al., 2019). Previous analysis of O-Buoy data found no statistically significant differences in springtime BrO between regions of the Arctic (Swanson et al., 2020). We use 0.05 PSU for snowpack on MYI as in Huang et al. (2020).
Another important parameter for SSA formation is the number of SSA particles formed from each blowing snowflake. A value of five particles per snowflake was used in Huang and Jaeglé (2017) based on wintertime observations of supermicron and sub-micron SSA at Barrow. Values of 1 and 20 particles per snowflake have been tested (Yang et al., 2019), but it was unclear which value was more realistic. We use a particle formation value of five particles per snow grain as in Huang et al. (2020).
Snowpack may be enriched or depleted in bromide compared to seawater, which is thought to be an effect of atmospheric deposition or release of bromine from the snowpack (Krnavek et al., 2012). Snowpack enrichment due to atmospheric deposition is less pronounced when snowpack salinity is high, with snowpack containing 1000 µM Na+ (approximately 0.06 PSU) or more, never exceeding twice the seawater ratio of bromine to chloride (Krnavek et al., 2012). Domine et al. (2004) found an increased enrichment factor of 5 times seawater in snow with a salinity of 100 µM Cl− (approximately 0.006 PSU). We use a snowpack enrichment factor of bromide 5 times that of seawater as in Huang et al. (2020), where this enrichment best agreed with GOME-2 observations. However, we note that a bromide enrichment factor of 5 times seawater exceeds an enrichment factor of 2 measured in snowpack with a salinity of 0.1 PSU (Krnavek et al., 2012).
Our choice of model input settings is similar to Huang et al. (2020), but we will be running the blowing snow SSA mechanism in HEMCO at a 0.5∘ latitude × 0.625∘ longitude spatial resolution. The model run using the results of our high-resolution blowing snow SSA HEMCO simulation is called BLOW.
2.5 Snowpack emissions of molecular bromine
We base our Br2 emissions scheme on Toyota et al. (2011) and Marelle et al. (2021), which prescribe a yield of Br2 upon snowpack deposition of ozone, BrNO3, and HOBr. In other modeling studies, this simplified deposition-based mechanism captured the synoptic-scale behavior of reactive bromine production across the Arctic (Toyota et al., 2011; Falk and Sinnhuber, 2018; Herrmann et al., 2021; Marelle et al., 2021). These modeling studies used different yields of Br2 upon deposition over land snowpack, multi-year ice, and first-year ice, restricting the production of molecular bromine from ozone deposition to first-year ice surfaces. None of these studies were coupled to a snowpack model tracking snow bromide and effectively assume an infinite bromide reservoir with Br2 production limited only by the deposition flux and Br2 yield.
Field studies indicate that snowpack over multi-year ice, first-year ice, and land regions may contribute to reactive bromine chemistry. Krnavek et al. (2012) found snow bromide content spanning 6 orders of magnitude, with individual samples taken from multi-year ice, first-year ice, and land regions showing variability of up to 3 orders of magnitude for each region. Analysis of variance in tropospheric BrO from 2011 to 2016 found no statistically significant differences in tropospheric BrO between different regions of the Arctic (Swanson et al., 2020). Both coastal snowpack and multi-year ice regions may produce reactive bromine. Molecular bromine production has been observed from coastal snowpacks on exposure to ozone (Pratt et al., 2013; Custard et al., 2017). Airborne sampling has observed enhanced BrO up to 200 km inland (Peterson et al., 2018). Snow above multi-year sea ice regions is depleted in bromide, indicating that it may play a role in Arctic bromine chemistry (Peterson et al., 2019).
Our modeling study tests the hypothesis that all snow has a uniform ability to produce molecular bromine, effectively assuming an infinite bromide reservoir with Br2 production limited only by the deposition flux. We differ from previous model parameterizations in allowing uniform Br2 production upon snowpack deposition of ozone, BrNO3, and HOBr over all sea ice surfaces and selected coastal snowpack regions. We only allow snowpack Br2 production when the surface temperature is below freezing. Surface temperatures may rise above freezing and drop back below freezing in the Arctic spring, which may allow for snowpack Br2 to simulate late-season bromine production events after snowpack melt such as those observed in Burd et al. (2017). We expect higher predictions of snowpack molecular bromine production than recent modeling efforts (Herrmann et al., 2021; Marelle et al., 2021) in which ozone deposition over land and multi-year ice surfaces did not produce molecular bromine.
2.5.1 Snowpack Br2 production over sea ice
We assume a uniform production of Br2 on deposition to snowpack over oceanic ice, whether the ice is first-year sea ice or multi-year sea ice. We use MERRA-2 fractional ocean ice coverage fields, which introduces some artifacts. MERRA-2 classifies the freshwater Great Lakes as ocean, but sea ice and snowpack on those frozen lakes are unlikely to have sufficient bromide to support large Br2 fluxes due to their distance from the ocean. Therefore, we specifically prohibit snowpack Br2 emissions in the Great Lakes region (between 41 and 49∘ N latitude and between 75 and 93∘ W longitude). This choice is in agreement with McNamara et al. (2020), who found that road-salt-derived aerosol particles are responsible for 80 %–100 % of atmospheric ClNO2 in Michigan, with no strong indication of a source of reactive halogens from the nearby Great Lakes.
2.5.2 Snowpack Br2 production over land
We wish to only enable production of Br2 over land if the snowpack is sufficiently enriched in bromide. Snowpack over land surfaces and glaciers may be enriched in bromide by oceanic SSA sources (Jacobi et al., 2012, 2019). The distance that SSA may be transported inland from the coast is limited by geographical features such as mountains. Based on direct observations of reactive bromine chemistry up to 200 km from the Alaskan coastline (Peterson et al., 2018), we include unlimited production of Br2 from specific land grid cells within 200 km of the coast upon deposition of ozone, HOBr, and BrNO3. We only allow the fraction of each grid cell that is within 200 km of the coastline (Stumpf, 2021) to produce molecular bromine. We further restrict snowpack Br2 emissions to locations that are less than 500 m above sea level, because higher-elevation locations are unlikely to be enriched by sea spray. This altitude screen eliminates Br2 emissions from coastal mountains such as the Alaskan Rockies, the Brooks Range in Alaska, and the Scandinavian Mountains as well as from the Greenland Plateau. Halogen chemistry may occur over the Greenland ice sheet (Stutz et al., 2011), contrary to this screen, but this will have minimal impact on the regions of interest in this paper.
Our final screen is based on the average snow depth in each land grid cell. Both modeling studies (Thomas et al., 2011; Toyota et al., 2014) and field studies (Domine et al., 2004; Pratt et al., 2013; Custard et al., 2017; Frey et al., 2020) agree that bromine chemistry can occur in the better ventilated and illuminated top of the snowpack. Regions with less than 10 cm of snowpack may not have sufficient snow for reactive bromine chemistry, and thus we only produce snowpack Br2 when the average snow depth in a land grid cell is 10 cm or greater. This filter prevents molecular bromine production in the lower-latitude regions with minimal snow coverage and is necessary because ozone deposition to plants in snow-free grid cells often exceeds the slow deposition of ozone to snowpack and would not be expected to produce Br2.
2.5.3 Diurnal yield of Br2 on ozone deposition
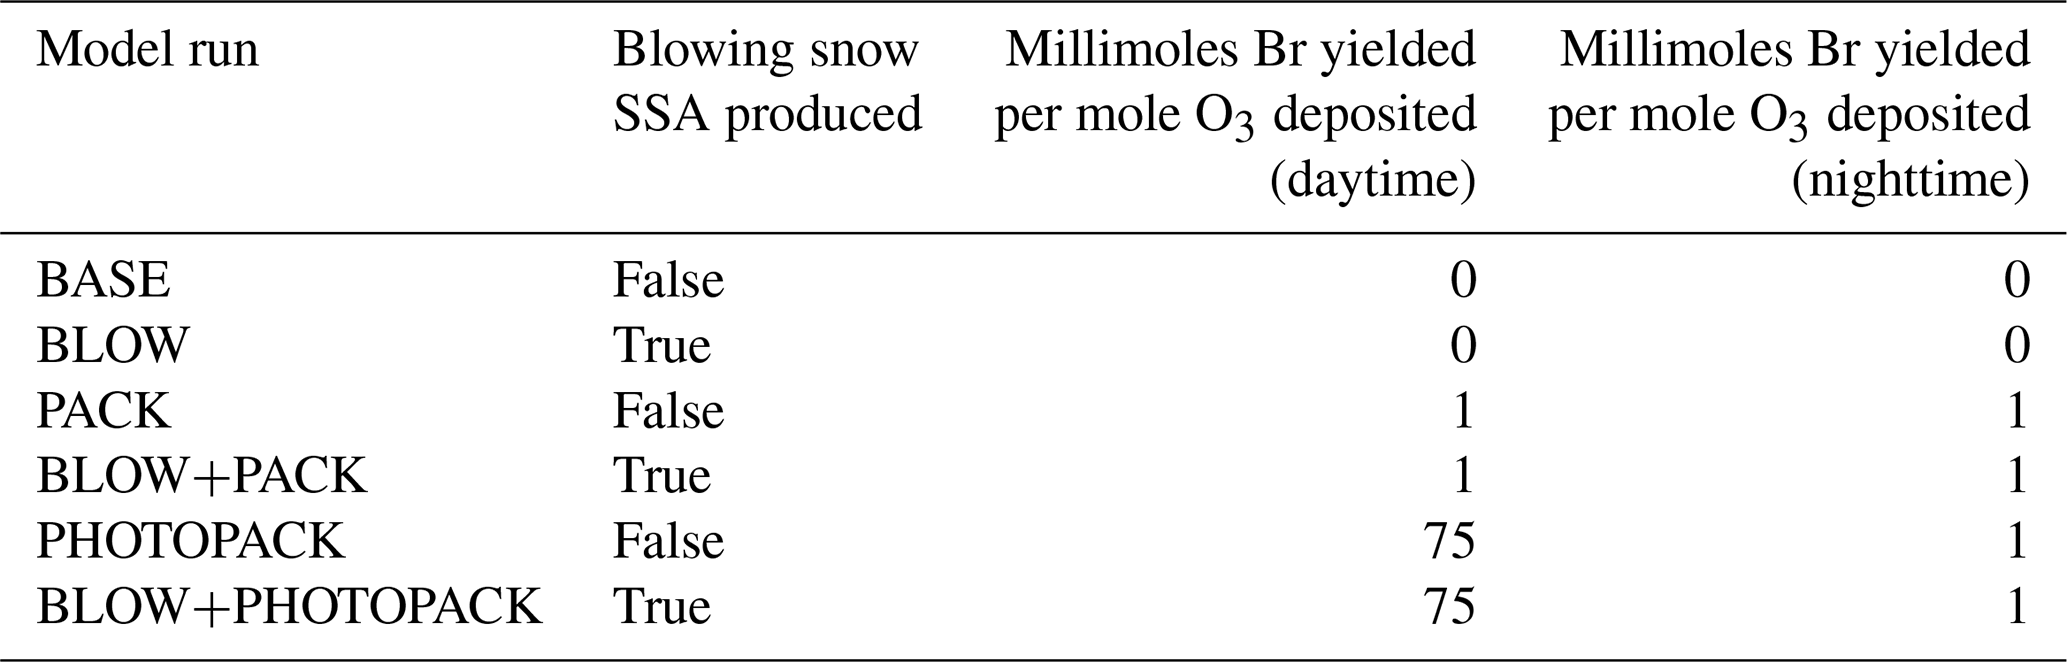
We choose two alternate assumptions for the yield of Br2 during the day. Toyota et al. (2011) initially assumed a constant yield of Br2 from ozone deposition of 0.1 % based on laboratory observations of nighttime bromine activation on ozone deposition (Oum et al., 1998; Wren et al., 2010, 2013) and then adjusted the daytime yield of Br2 on ozone deposition to 7.5 % to better match surface ozone mixing ratios measured at coastal stations. This increased daytime yield value was chosen based on the assumption that photochemistry may trigger an autocatalytic cycle leading to a 75-fold increase in Br2 yield. The PHOTOPACK runs use the increased daytime Br2 yield of 7.5 % when the solar elevation angle is 5∘ or greater. Previous implementations of the snowpack mechanism (Toyota et al., 2011; Herrmann et al., 2021; Marelle et al., 2021) predict ozone deposition velocities over Arctic sea ice on the order of 0.01 cm s−1. Their findings agree with a modeling sensitivity study finding best agreement with observations using ozone deposition rates between 0.00 and 0.01 cm s−1 (Helmig et al., 2007). Our model predicts similar polar open-ocean ozone deposition rates of 0.009 cm s−1 (Pound et al., 2020) but predicts higher modeled deposition velocity of ozone over Arctic sea ice between 0.02 and 0.1 cm s−1 based on the month (see Supplement Fig. S5), with higher values influenced by proximity to the coast as observed along non-Arctic coastlines in Bariteau et al. (2010). Thus, our PHOTOPACK run may predict much higher Br emissions than previous snowpack predictions despite the same yield values due to differences in deposition. To match our magnitude of Br2 production with previous implementations of the snowpack mechanism (Toyota et al., 2011; Herrmann et al., 2021; Marelle et al., 2021), we add two PACK runs with a constant Br2 yield on ozone deposition of 0.1 % based on yield values in Toyota et al. (2011). Both PACK and PHOTOPACK runs assume 100 % conversion of deposited HOBr and BrNO3 to Br2. Table 1 shows further model run yield details.
Table 1Model run settings. Sea salt aerosol particles are produced from blowing snow as detailed in Sect. 2.5. Daytime is defined as when the solar elevation angle is greater than 5∘, and nighttime is defined as when the solar elevation angle is less than 5∘.
2.6 GEOS-Chem chemistry and transport model
The GEOS-Chem global atmospheric chemistry and transport model (Bey et al., 2001) simulates emissions, transport, and chemistry of atmospheric trace gases and aerosols, including halogens. The chemical mechanism in GEOS-Chem 12.9.3 (http://www.geos-chem.org, last access: 29 October 2019, https://doi.org/10.5281/zenodo.3974569, The International GEOS-Chem User Community, 2020) includes HOx–NOx–VOC-O3–halogen–aerosol tropospheric chemistry (Mao et al., 2013; Fischer et al., 2014, 2016; Travis et al., 2016; Wang et al., 2021). The model has been regularly and consistently updated to reflect the current understanding of heterogeneous and gas-phase halogen chemistry.
Halogens in the troposphere may be sourced from photooxidation of halocarbons, emissions of iodine from the ocean surface, downward transport of halogens from the stratosphere, and release of halogens through heterogeneous chemistry on SSA. Figure 1 shows a simplified version of the GEOS-Chem reaction scheme focusing on tropospheric bromine reactions and reservoirs. Heterogeneous reactions for release of reactive bromine from aerosol surfaces were added to GEOS-Chem (Parrella et al., 2012) and have been updated to include multiphase reactions involving cloud aerosols, cloud droplets, and ice aerosols as well as inter-halogen reactions between bromine, chlorine, and iodine species (Schmidt et al., 2016; Sherwen et al., 2016a; X. Wang et al., 2019) and input from the stratosphere (Eastham et al., 2014). Recent updates also include reactions between sulfur (IV) species and HOBr, which lead to a 50 % decrease in Bry due to the scavenging of HOBr on aerosol surfaces containing sulfur (Chen et al., 2017). These HOBr–sulfur(IV) reactions are critical in moderating tropospheric BrO at the mid latitudes (Zhu et al., 2019). In GEOS-Chem 12.9 the halogen chemical mechanism was modified extensively to include chlorine chemistry as detailed in X. Wang et al. (2019) with updated halogen–sulfur (IV) rates (Liu et al., 2021), reaction of S(IV) + HOCl, and improved cloud pH calculation from Shah et al. (2020). For the simulations here, GEOS-Chem uses the Modern-Era Retrospective Analysis for Research and Applications, version 2 (MERRA-2) assimilated meteorological fields (Gelaro et al., 2017) re-gridded from a native resolution of 0.5∘ × 0.625∘ latitude and longitude to 2∘ × 2.5∘ using a reduced vertical grid of 47 layers.
We initialize our model in October 2014 from a full-chemistry benchmark file, allowing for 6 months of spinup before our period of interest spanning from March to November 2015. We run six different model simulations with settings detailed in Table 1. The base model (BASE) includes the halogen sources described above but no Arctic-specific halogen sources. The BLOW simulation adds SSA production from blowing snow following Huang et al. (2020) but using a more recent version of GEOS-Chem. The PACK simulation adds snowpack Br2 emissions using a constant yield from O3 deposition. The PHOTOPACK simulation also emits Br2 from snowpack but increases the Br2 yield from O3 deposition under sunlight. These blowing snow SSA and snowpack sources are combined in the BLOW+PACK and BLOW+PHOTOPACK simulations.
2.7 Comparing GEOS-Chem results to MAX-DOAS vertical column densities
GEOS-Chem simulates BrO mixing ratios for each of its 47 atmospheric layers. Reducing the vertical resolution of the more-resolved GEOS-Chem predictions to be comparable to the coarser MAX-DOAS data is necessary for appropriate comparison (Rodgers and Connor, 2003). To compare the GEOS-Chem profiles to these two grid-coarsened quantities, we grid-coarsen the averaging kernels produced by the HeiPro retrieval algorithm using Supplement Eq. (S1) from Payne et al. (2009) to the partial column averaging kernels shown in Fig. 3. We use the average of all April averaging kernels that pass our quality criteria (> 0.5 DOFS in the lofted layer), which generally represents non-cloudy conditions. We calculate modeled BrOLTcol by applying the partial column averaging kernels shown in Fig. 3 to the GEOS-Chem modeled vertical BrO profiles.
Figure 3 shows that the average partial column averaging kernel for the surface layer (0–200 m a.g.l.) has near-unit sensitivity to BrO at the ground, decaying to about 0.5 at 200 m a.g.l. and then to 0 at about 400 m a.g.l., as desired. The sensitivity of BrOLTcol is near unity from about the surface to 600 m a.g.l. and then slowly decays with 0.5 sensitivity at 2000 m a.g.l. The resulting sensitivity to mid-tropospheric BrO means that free-tropospheric BrO produced by the GEOS-Chem model contributes to modeled BrOLTcol, albeit at 50 % or lower sensitivity, even if the GEOS-Chem-predicted free-tropospheric BrO is above the nominal 2000 m top of the integration window. The residual sensitivity of the BrOLTcol averaging kernel above 2000 m is caused by the limited ability of ground-based MAX-DOAS to distinguish the true altitude of BrO at non-tangent geometries (higher viewing elevation angles) that are required to view BrO at these higher altitudes. Figure 3 shows that BrO above 4 km makes only a small contribution to the modeled BrOLTcol, which was not included in BrOLTcol.
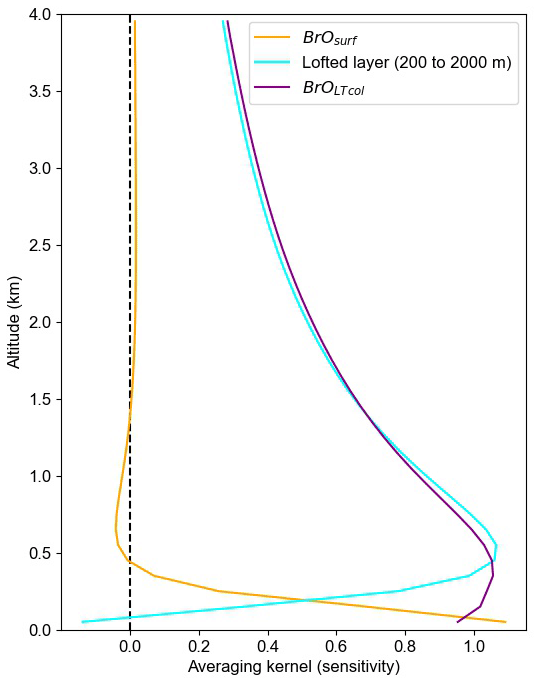
Figure 3Averaging kernels showing the sensitivity of retrieved BrOLTcol and retrieved BrOsurf to BrO at a range of altitudes. Each line represents a row of the averaging kernel matrix. BrOsurf is the column from the surface to 200 m, and BrOLTcol is the column up to 2000 m.
Although it has been suggested in the literature (von Clarmann and Glatthor, 2019) that averaged averaging kernels can cause problems, we do not report data when there are clouds, and thus we only use the more consistent averaging kernels that occur under clear-sky conditions. We use other criteria related to vertical visibility to identify clear skies. As described in Peterson et al. (2015), the information content (DOFS) in the lofted layer is nearly linearly related to the aerosol optical depth. We find that the slant column density of the O2–O2 collisional dimer (a.k.a. O4) observed at a 20∘ elevation angle is correlated with the lofted DOFS (Supplement Fig. S6). From this correlation we find that observations of clear-sky conditions have a 20∘ elevation angle for O4 dSCD > 1043 molecule2 cm−5, and we use this cut to distinguish clear sky versus clouds. To ensure that GEOS-Chem results are only compared to the clear-sky observational data, we apply this clear-sky screen to the measured BrOLTcol time series. The use of this screen also assists in minimizing variability in the averaging kernels and thus allows the April averaged partial column averaging kernels (Fig. 3) to be applied for clear skies at any time of the year.
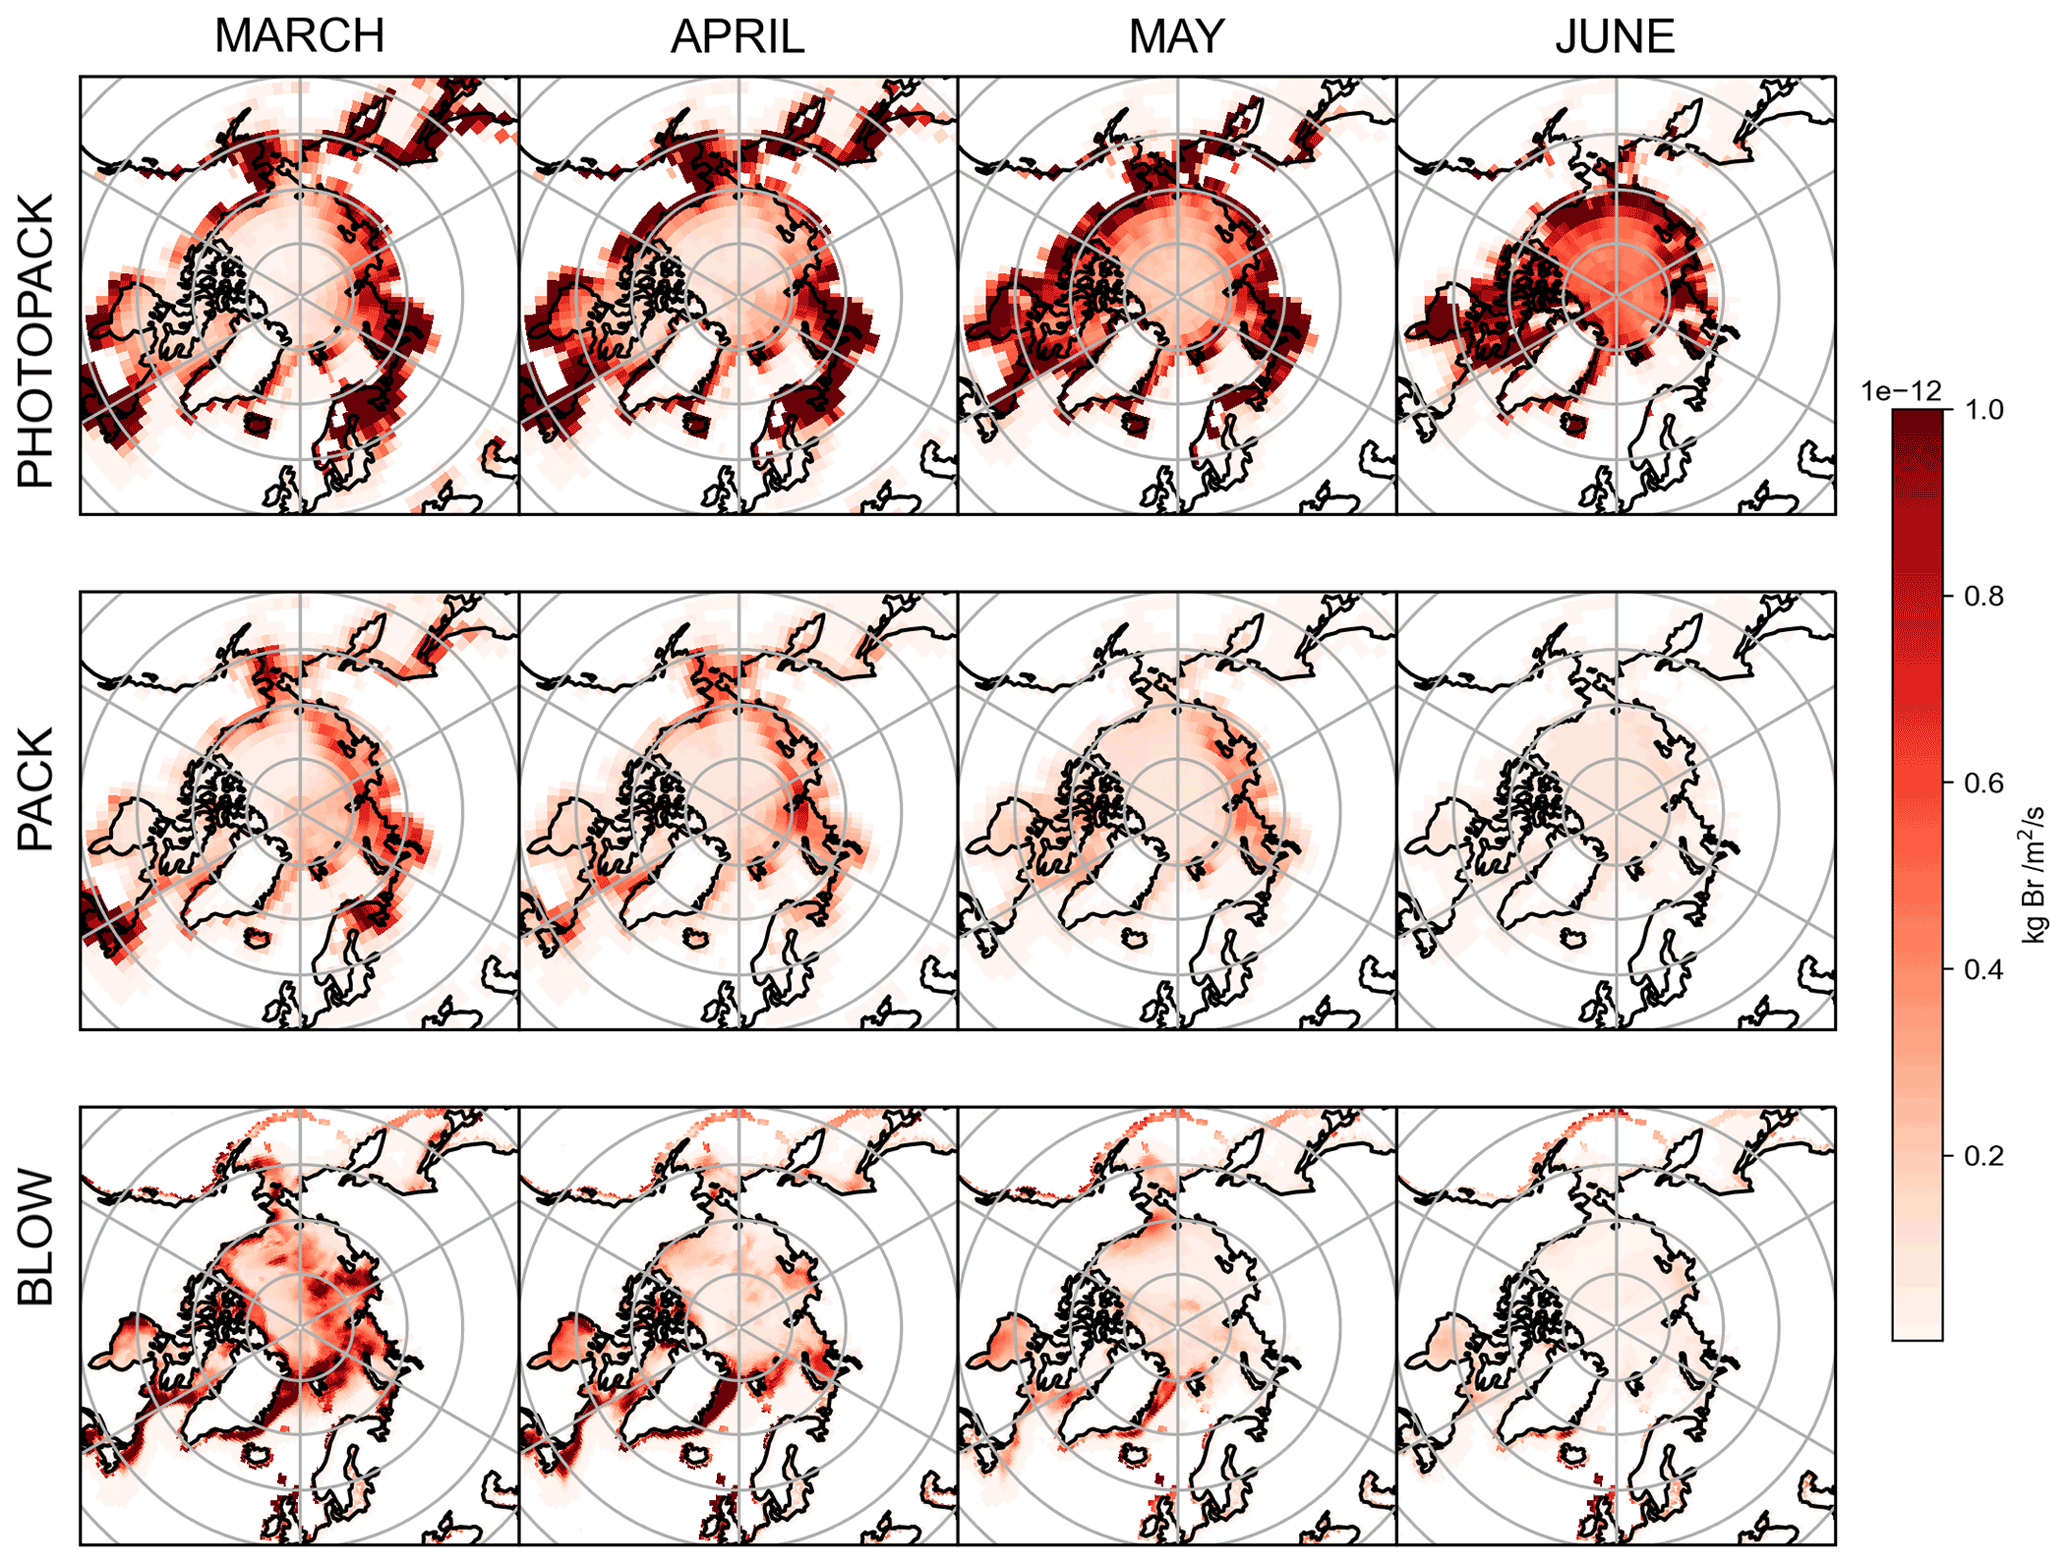
Figure 4Mean snowpack Br2 and p-Br− emissions by month, as simulated by GEOS-Chem. The top row shows emissions of Br2 in the PHOTOPACK run, the middle row shows the emissions of Br2 in the PACK run, and the bottom row shows emissions of p-Br− from adding the BLOW mechanism.
3.1 Snowpack Br2 emissions
The top two rows of Fig. 4 show PHOTOPACK and PACK average snowpack Br2 emissions for each spring month. The emission of Br2 in PHOTOPACK increases over the Arctic Ocean in May and June, when the Sun is above the horizon for up to 24 h d−1 and ozone deposition yield is almost always at the photo-enhanced level of 7.5 %. Notably, Br2 emissions over the Arctic Ocean in the PHOTOPACK and BLOW+PHOTOPACK runs are highest in June, when the Sun is nearly always 5 ∘ above the horizon and surface temperatures may drop below freezing. The PACK emissions are lower than the PHOTOPACK Br2 emissions by an order of magnitude and show a seasonal cycle with a high BrOLTcol in April and May with a decrease in May and June. While our ozone deposition velocities (see Supplement Fig. S5) over Arctic sea ice are much higher than previous estimates of an approximate magnitude of 0.01 cm s−1 (Toyota et al., 2011), the PHOTOPACK run highlights that a 75-fold increase in daytime Br2 yield can lead to predictions of increased Br2 production over the North Pole in June. Monthly satellite observations show that BrO reaches a minimum over the Arctic Ocean in June (Richter et al., 1998).
Coastal land regions within 200 km of the coastline have some of the highest modeled snowpack Br2 emissions (see Fig. 4, rows 1 and 2). Within GEOS-Chem, deposition rates are greatest over land, less rapid over the ice-covered ocean, and lowest over the open ocean (see Supplement Fig. S5). Lower dry deposition velocities over the ice-covered Arctic Ocean lead to decreased deposition and conversion to Br2. In GEOS-Chem, ozone mixing ratios and deposition are over 3 orders of magnitude larger than BrNO3 and HOBr mixing ratios and deposition over the Arctic Ocean, and ozone deposition contributes more than half of total Br2 emitted in the PACK and BLOW+PACK runs. Our snowpack mechanism assumes that all ozone deposited to the surface of a grid cell reacts with the snowpack cover, with those reactions yielding a set percentage of Br2. This assumption is more appropriate in the barren snow-covered coastal tundra but may be less accurate in areas where deposition to vegetation dominates. This nonconservative approach may lead to overestimation of Br2 emissions from snowy vegetated surfaces. Our screens for snowpack emissions described in Sect. 1.3.5 tried to minimize these effects but may not work perfectly due to finite grid cell resolution and other challenges. Increased Br2 emissions observed in Fig. 4 in northern Europe may also be partially driven by increased local mixing ratios of ozone and NOx over industrialized regions such as the Kola Peninsula.
3.2 Blowing snow aerosol bromide emissions
The bottom row of Fig. 4 shows the total quantity of particulate bromide released by the blowing snow SSA mechanism in the BLOW runs. Emissions over the Arctic Ocean decline each month after the March maximum as rising temperatures increase the wind speed threshold for blowing snow SSA production. Some icy coastal regions with frequently high wind speeds such as the Aleutian Islands south of Alaska and the eastern coast of Greenland continue to emit SSA p-Br− in April, and the extremely high winds in the Aleutians enable SSA production into May. The location of specific high-wind storm systems in spring 2015 may be evident in the darker red spots over the Arctic Ocean, which are particularly noticeable over the Eurasian and central Arctic in March. These monthly averages are only accurate for the months in spring 2015 and may not be spatially representative of blowing snow SSA production in other years.
The impact of the blowing snow SSA emissions on measured BrO is minimal on O-Buoys in the Beaufort Gyre, possibly due to the spatial and seasonal variations in SSA p-Br− emissions. Figure 4 shows that 2015 SSA production was highest in March and April in the Eurasian and central sectors of the Arctic, and thus the O-Buoys deployed as shown in Fig. 2 are less exposed to the effects of SSA production than the Arctic as a whole. Particulate bromide must be activated from SSA by heterogeneous reactions as in Fig. 1 and Table 3, leading to photochemical cycles that sustain further activation of bromide from SSA. The dearth of sunlight over the Arctic Ocean in early March coincides with the greatest SSA p-Br− production and means that the increased February SSA p-Br− emissions may not lead to a direct increase in BrO.
Table 2Model root mean square error by run and location. Root mean squared model error (RMSE) shown in BrO molecules cm−2 RMSE calculated as the square root of the mean of the squared errors for all times with valid observed BrOLTcol in spring 2015.
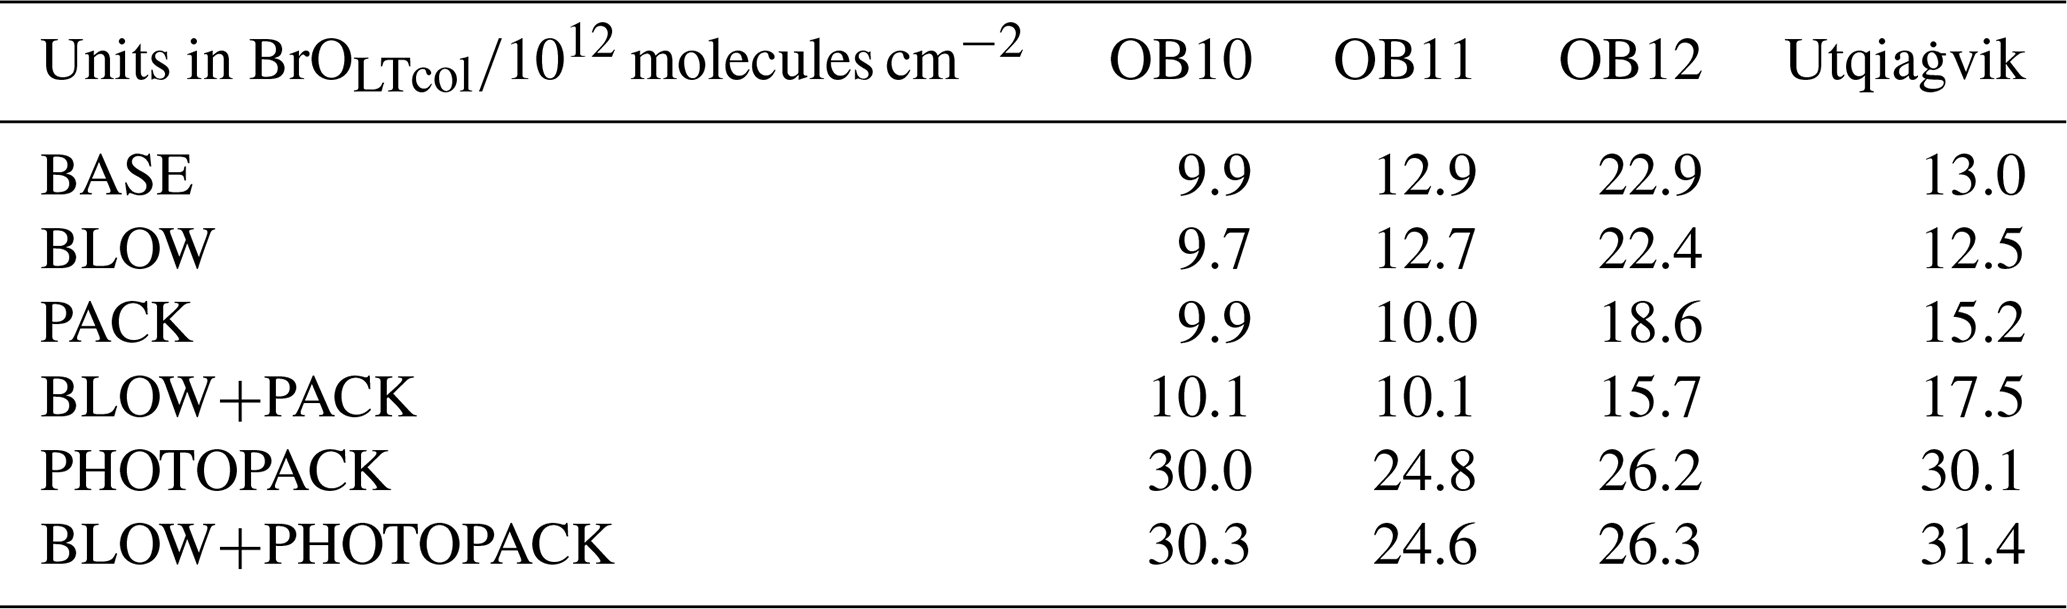

Figure 5Monthly average BrOLTcol in the observations and model. Monthly averages of BrO at (a) O-Buoy 10, (b) O-Buoy 11, (c) O-Buoy 12, and (d) BARC at Utqiaġvik only using predictions and observations when dSCDO4 > 1×1043 molecules2 cm−5. Observations with average 1σ error shown in red. All units in 1013 molecules cm−2.
3.3 Snowpack Br2 emissions have more impact than blowing snow SSA on monthly BrO abundance
Increased levels of bromine have been historically seen at Utqiaġvik during February, March, April, and May (Berg et al., 1983). Previous O-Buoy data analysis noted BrO dropping to zero in June (Burd et al., 2017). Figure 5 shows monthly averaged modeled BrOLTcol at Utqiaġvik and on the O-Buoys for each model configuration. The difference in GEOS-Chem modeled monthly averaged BrOLTcol for O-Buoys is minimal between the BASE and BLOW runs, the PHOTOPACK and BLOW+PHOTOPACK runs, and the PACK and BLOW+PACK runs. Both the BASE and BLOW runs predict near-zero BrOLTcol on all O-Buoys and during most months at Utqiaġvik. The exception to this is the slight increases in monthly modeled BrOLTcol to 1×10¹³ molecules cm−2 in March and April. This BASE increase in BrOLTcol indicates that oceanic SSA rather than blowing snow SSA can affect modeled BrO at Utqiaġvik due to its closer proximity to open-ocean regions than the O-Buoys. The increases in BrO from the BASE model due to the addition of BLOW, most evident at Utqiaġvik in March 2015, are a result of increased particulate bromide available for activation on aerosol surfaces. The PACK and BLOW+PACK runs show the highest skill in reproducing observations, falling within the monthly average of hourly measured BrOLTcol error for 9 of the 13 months plotted in Fig. 5. Both PACK and BLOW+PACK replicate the observed monthly pattern especially well on O-Buoy 11 and at Utqiaġvik. Both runs replicate the seasonal pattern of maximum modeled BrOLTcol at Utqiaġvik in March followed by a decrease to near-zero modeled BrOLTcol in May despite model overprediction of BrOLTcol in February and March. The BLOW+PACK monthly BrOLTcol is between 1×10¹² and 1×10¹³ molecules cm−2, higher than PACK monthly BrOLTcol due to the addition of blowing snow SSA. This increase is most pronounced in February and March at Utqiaġvik, when lower temperatures lead to lower threshold wind speeds and increased SSA production (see Supplement Fig. S4).
The inclusion of increased daytime yield of snowpack Br2 drives monthly average BrOLTcol above 3×10¹³ molecules cm−2 in the PHOTOPACK and BLOW+PHOTOPACK runs from February until June, far above the peak-observed monthly BrOLTcol of 2×10¹³ molecules cm−2. The PHOTOPACK and BLOW+PHOTOPACK runs show a steady decline in BrOLTcol from February to June at Utqiaġvik. Predictions of PHOTOPACK and BLOW+PHOTOPACK monthly June BrOLTcol above 2×10¹³ molecules cm−2 on the O-Buoys is due to increasing photo-assisted local snowpack Br2 emissions over the Arctic Ocean (see Fig. 5). The PHOTOPACK mechanism predicts monthly average BrOLTcol within observational error only on O-Buoy 12 in April. Aside from this replication of the sparsely sampled O-Buoy 12 April BrOLTcol, the PHOTOPACK mechanism overestimates BrOLTcol.
Table 2 shows the root mean squared error (RMSE) of each model run as compared to BrOLTcol observations in each different location in spring 2015. The PACK and BLOW+PACK runs have the lowest RMSE on O-Buoys 11 and 12 and among the lowest RMSEs on O-Buoy 10. Utqiaġvik shows the lowest RMSE of 1.25×10¹³ molecules cm−2 for the BLOW run, although the PACK run is not too far off at 1.57×10¹³ molecules cm−2. Despite the fact that BLOW+PACK has a higher RMSE of 1.75×10¹³ molecules cm−2 at Utqiaġvik, the BLOW+PACK run performs the best or near the best of all runs on the O-Buoys and includes both known processes for Arctic reactive bromine production. The PHOTOPACK and BLOW+PHOTOPACK runs with increased daytime yield have a consistently high RMSE of 2.46×10¹³ molecules cm−2 or higher, often double the RMSE of other model runs.
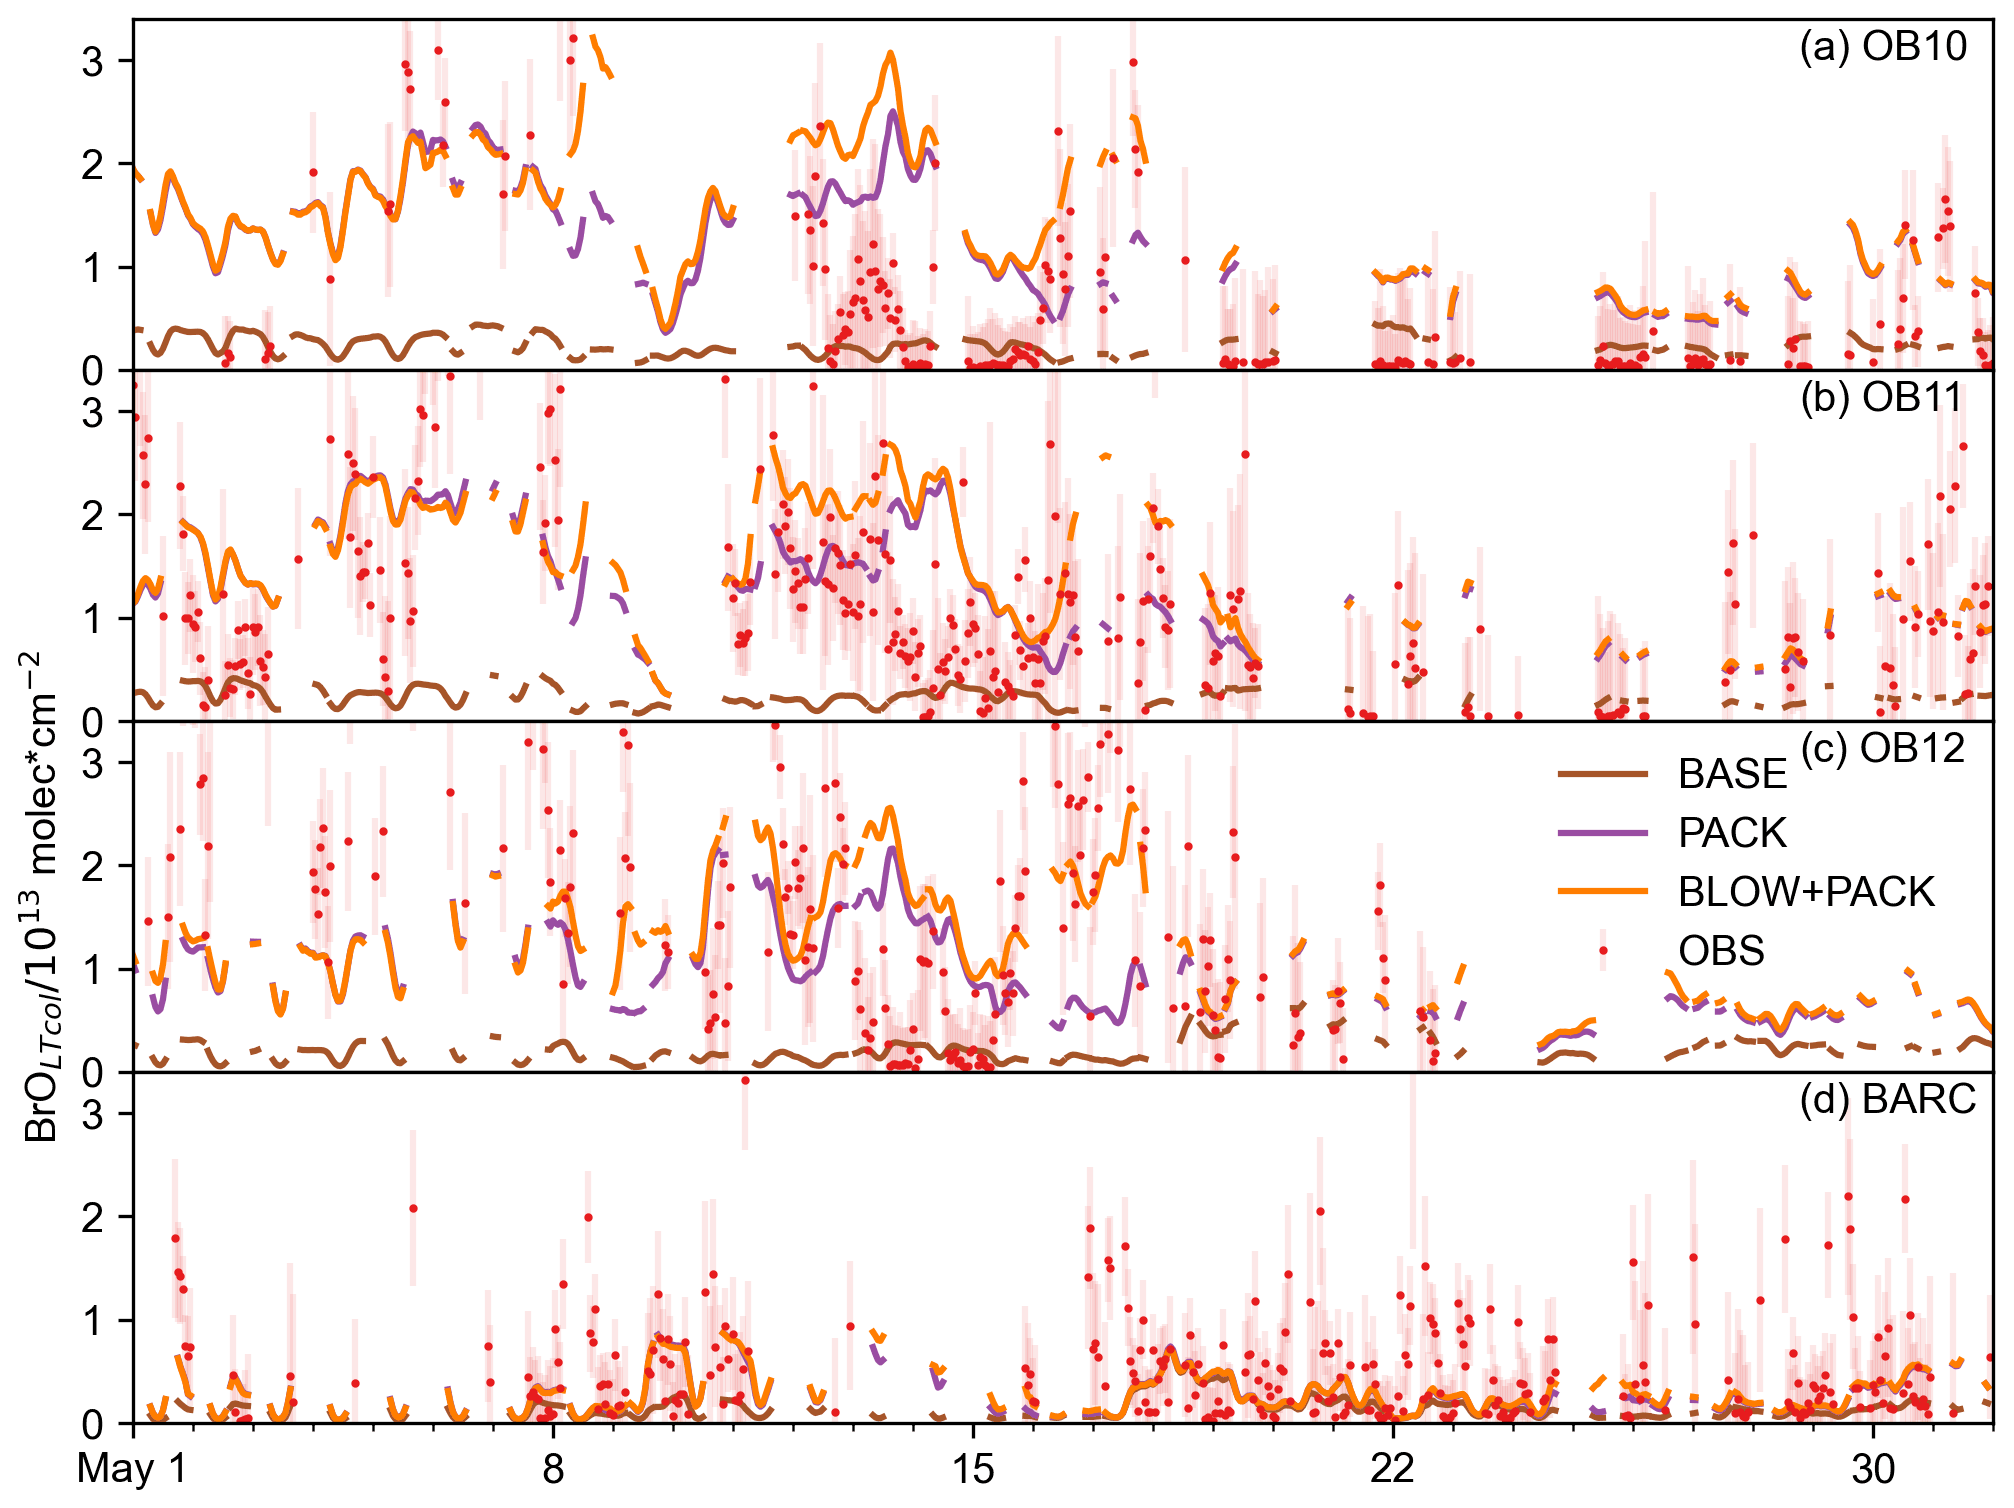
Figure 6May hourly BrOLTcol time series. Hourly time series of BLOW+PACK, PACK, and BASE BrOLTcol on (a) O-Buoy 10, (b) O-Buoy 11, (c) O-Buoy 12, and (d) BARC at Utqiaġvik in the 2015 Arctic spring. Observations and error bars in red, BASE BrOLTcol in brown, PACK BrOLTcol in purple, and BLOW+PACK BrOLTcol in orange. All BrOLTcol plotted continuously except for gaps where dSCDO4 > 1×1043 molecules2 cm−5.
3.4 The BLOW+PACK run best replicates hourly BrO events in mid and late May
The model's hourly predictions of BrOLTcol in May 2015 are shown in Fig. 6 for the BASE, PACK, and BLOW+PACK runs. Figure 6 screens the modeled BrOLTcol for times when dSCD O4 > 1×1043 molecules2 cm−5, while Supplement Figs. S7 and S8 make direct comparisons between observations of BrOLTcol for O-Buoys (S7) and at Utqiaġvik (S8) throughout all of spring 2015. The O-Buoys show fluctuations in observed BrOLTcol during May and show consistent increased columns of BrOLTcol from 10 to 20 May. The BASE run never rises above 1013 molecules cm−2 and underpredicts most May hourly BrOLTcol, although it predicts monthly BrOLTcol on OB10 within observational errors in May and June. Both PACK and BLOW+PACK runs show better skill in replicating BrOLTcol. The addition of the snowpack mechanism allows us to predict increased BrOLTcol in late May on O-Buoys 10 and 11. This points to the role of the surface snowpack in late-season events, in agreement with the findings of Burd et al. (2017).
We can identify the role of blowing snow SSA by comparing the PACK and BLOW+PACK runs. Both the PACK and BLOW+PACK runs underestimate BrOLTcol during the first 10 d of May. BrO predictions show higher variability and peaks starting on 10 May. The blowing snow SSA mechanism increases BLOW+PACK BrOLTcol on 12 and 13 May. PACK is skilled at replicating observed O-Buoy 11 BrOLTcol on both days, and both PACK and BLOW+PACK are within observational BrOLTcol error on 13 May.
A BrO event also occurs on 13 May on O-Buoy 10. While the strength of the O-Buoy 10 BrO event is overestimated by PACK and BLOW+PACK, the shape of that event is reproduced in both runs. Observed BrOLTcol decreases rapidly on all O-Buoys after 14 May, and the model is unable to track this sharp decrease. Rapid changes in BrOLTcol may be caused by sharp edges in BrO-enriched air masses such as those seen by Simpson et al. (2017). The GEOS-Chem run at this resolution cannot replicate abrupt changes in BrO, but it does slowly decrease BrOLTcol to reach BrOLTcol to less than 1013 molecules cm−2 on 16 May. The BLOW+PACK mechanism is skilled in replicating the magnitude and features of a mid-May BrO event on O-Buoys 10 and 11.
Figure 7 shows all spring 2015 BrOLTcol observations on O-Buoys 10, 11, and 12 and BARC plotted against PACK BrOLTcol and BLOW+PACK BrOLTcol. The increase in BrOLTcol on adding BLOW leads to fewer underpredictions of observations (see the bottom right section of Fig. 7b). The Pearson correlation coefficient (r) between PACK BrOLTcol and observed BrOLTcol is 0.33, improving to 0.39 on addition of BLOW in the BLOW+PACK run. Other runs show less skill in replicating observations, with a BASE BrOLTcol Pearson correlation with observations of 0.19 and a BLOW BrOLTcol Pearson correlation with observations of 0.23. We also performed a simple linear regression to determine the relationship between predictions and observations for each run. The slope of the line of best fit improves drastically on addition of PACK, changing from 0.06 for BASE and 0.07 for BLOW to 0.33 for PACK and 0.44 for BLOW+PACK. There is a positive synergistic effect on the slope of the line of best fit when using both BLOW and PACK in combination rather than individually. The use of both BLOW and PACK mechanisms corroborates literature findings on the processes influencing Arctic reactive bromine and increases correlation between GEOS-Chem predictions and observations.
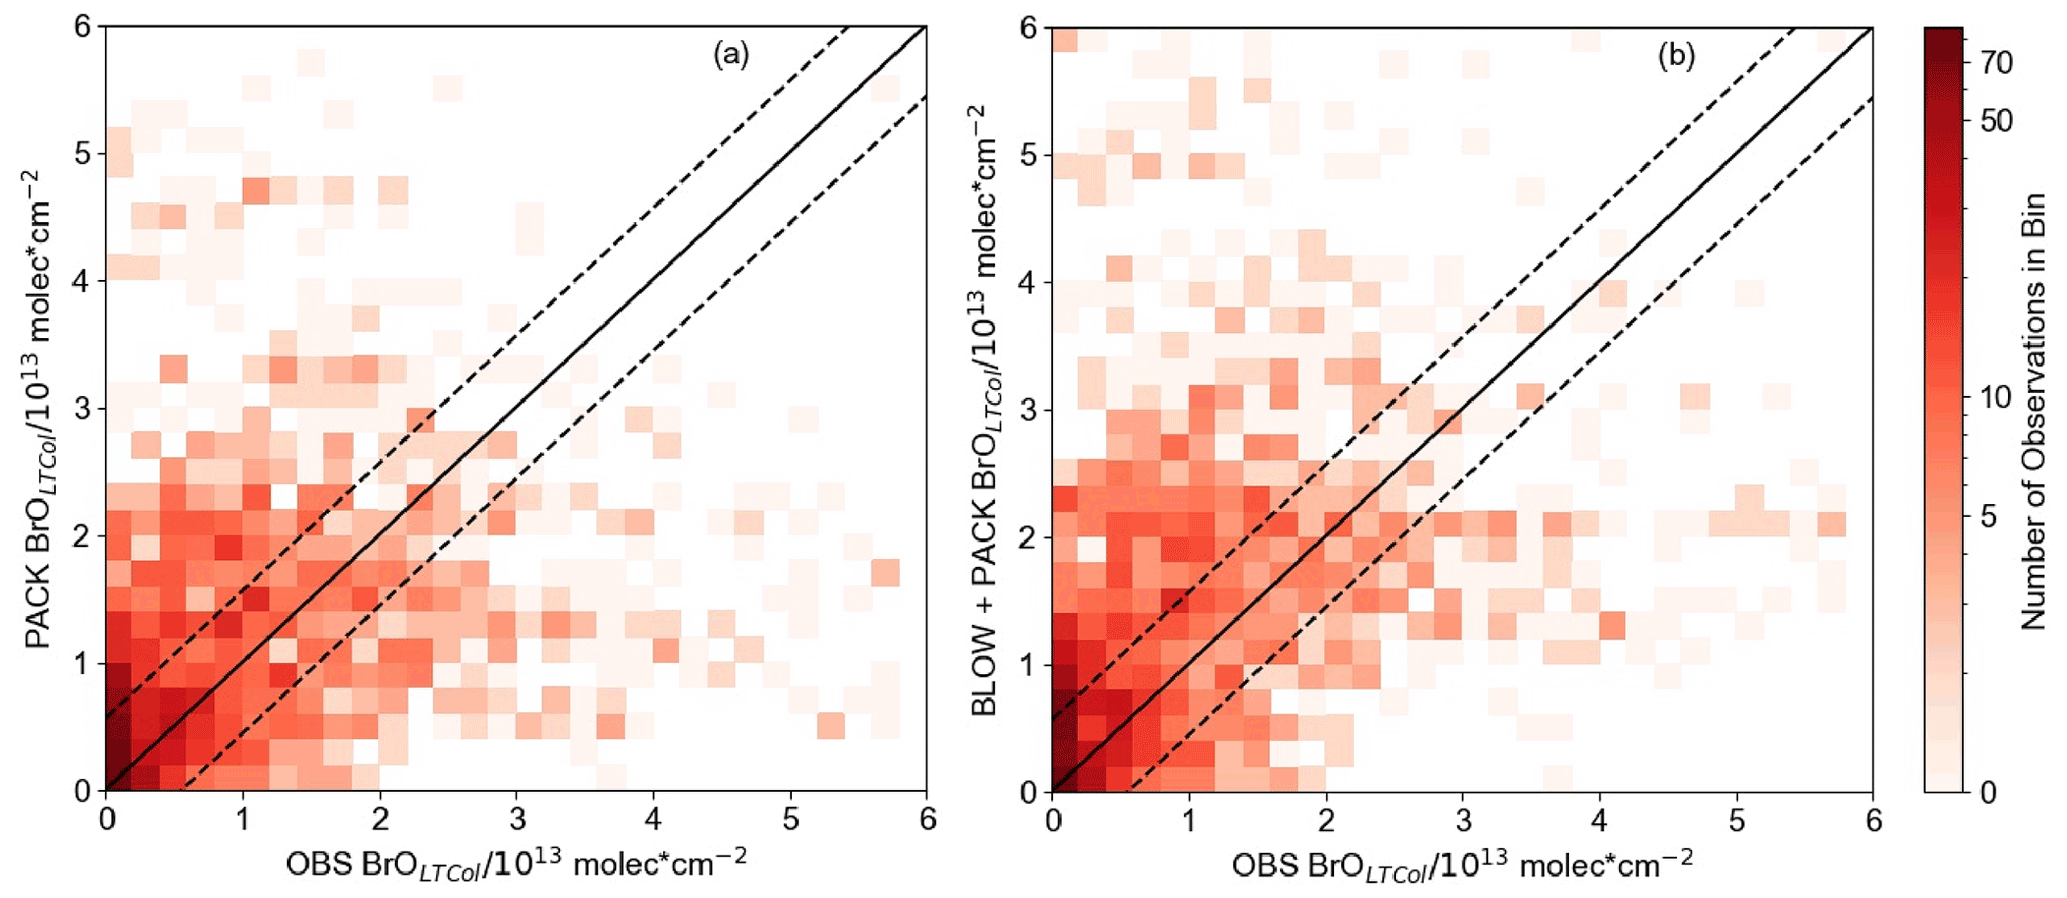
Figure 7Hourly modeled BrOLTcol versus BrOLTcol observations. Two-dimensional histograms showing the density of GEOS-Chem-predicted BrOLTcol versus all observed spring 2015 hourly BrLTcol, with (a) PACK BrOLTcol shown on the left sorted into square bins of 0.2 with a Pearson r correlation with observations of 0.33 and (b) BLOW+PACK BrOLTcol on the bottom sorted into square bins of 0.2 with a Pearson r correlation with observations to 0.39. All units are in molecules cm−2. 1:1 line drawn in the center in black, with a margin of the average observational error plotted in dashed black lines around the central 1:1 line.
4.1 Use of both mechanisms in conjunction leads to the best prediction of tropospheric BrO results
Initial implementation of this snowpack mechanism in Toyota et al. (2011) increased the daytime yield of Br2 from ozone deposition to 7.5 % to improve agreement between observed and modeled surface ozone mixing ratios. Toyota et al. (2011) also increased the surface resistance of ozone to 104 s m−1, which decreased deposition velocities on Arctic snowpack to approximately 0.01 cm s−1. Our model using a constant yield of Br2 from ozone deposition at 0.1 % performs best despite observations that sunlight has an effect on reactive bromine recycling in the snowpack (Pratt et al., 2013; Custard et al., 2017). GEOS-Chem does not explicitly model heterogeneous photochemistry within the snowpack interstitial space but does include heterogeneous bromine chemistry on aerosol particle surfaces after the Br2 is emitted from the snowpack into the lowest model layer. The updates to GEOS-Chem halogen chemistry (Schmidt et al., 2016; Sherwen et al., 2016b; Chen et al., 2017; X. Wang et al., 2019) should be mechanistically sufficient to model daytime heterogeneous chemistry of reactive bromine on aerosol surfaces. We note that improvements to GEOS-Chem have increased the explicit modeling of these photochemical recycling and amplification processes, possibly reducing the need for empirical increases to daytime yields.
Our findings differ from recent implementations of the snowpack mechanism in Herrmann et al. (2021) and Marelle et al. (2021). While all snowpack mechanisms are based on Toyota et al. (2011), several large differences in model configuration and mechanism implementation explain these differences. We allow Br2 production from ozone deposition over all snow surfaces, leading to much higher Br2 production over MYI and coastal regions. Land snowpack can produce Br2 on exposure to ozone and sunlight (Pratt et al., 2013; Custard et al., 2017), and Fig. 4 shows our coastal snowpack producing large quantities of Br2. Tropospheric reactive bromine chemistry has been observed up to 200 km inland from the coast (Peterson et al., 2018). Marelle et al. (2021) underestimate BrO in late March and overestimate Utqiaġvik BrO in early April. This seasonal pattern may be due to increased daytime ozone yield on first-year ice near Utqiaġvik in April. Herrmann et al. (2021) found that HOBr and BrNO3 deposition was more important in driving snowpack Br2 production and that the daytime yield of 7.5 % Br2 on ozone deposition underpredicted BrO. We find that ozone contributes slightly more than HOBr and BrNO3 because we allow for Br2 production on ozone deposition over the multi-year ice and coastal snowpack regions. The temporal coverage of this study spans the entire year, while Herrmann et al. (2021) only span February, March, and April. Our longer timescale highlights the issue of increased daytime Br2 yield during May and June (see Fig. 4, PHOTOPACK) with increased emissions over the Arctic Ocean that are not in agreement with satellite observations of minimal Arctic tropospheric BrO in June (Richter et al., 1998).
4.2 Addition of the PACK mechanism increases surface ozone predictive skill
The Barrow Arctic Research Center (BARC) in Utqiaġvik has the most comprehensive coverage of surface ozone in spring 2015. A constant yield of 0.1 % Br2 from ozone deposition allows us to approximate the average vertical extent of ozone depletion events at Utqiaġvik in May 2015. The increase in Bry in the PACK and BLOW+PACK runs is confined to the lowest 1000 m of the atmosphere (see Supplement Fig. S9). Ozone depletions, caused by reactive bromine chemistry, often only occur within the lowest 1000 m of the troposphere (Bottenheim et al., 2002; Salawitch et al., 2010). Previous studies have found evidence of lofted BrO in plumes at altitudes up to 900 m a.g.l. (Peterson et al., 2017). The monthly average Utqiaġvik May surface ozone in BLOW and BLOW+PACK is 22 nmol mol−1, matching mean May surface ozone from 1999 to 2008 (Oltmans et al., 2012). The PHOTOPACK runs generate mean May surface ozone depletion to approximately 5 nmol mol−1, far below the May mean. The PACK and BLOW+PACK runs duplicate the approximate vertical extent of elevated bromine levels and the strength of typical May ozone depletion.
Figure 8 shows hourly ozone predictions alongside BARC ozone observations (McClure-Begley et al., 2014). The BASE model fails to replicate variance in ozone measured at BARC in Utqiaġvik, with a Pearson correlation coefficient to observations of 0.35. Adding PACK improves Pearson correlation to 0.47, within a rounding error of BLOW+PACK Pearson correlation of 0.47. Both PACK and BLOW+PACK significantly improve model performance in replicating ozone depletions such as those below 30 nmol mol−1 from 20 to 29 March but fail to track the subsequent recovery of ozone to background levels on 1 April. Predicted PACK ozone does not recover to background levels up to a height of roughly 1000 m. A similar pattern where our model replicates low ozone but fails to predict the recovery of ozone to background levels occurs on 5 and 15 April. Examination of ozone profiles in GEOS-Chem found that GEOS-Chem underpredicts tropospheric ozone by 10–20 ppb north of 60∘ latitude (Wang et al., 2021), which contributes to the low ozone predictions in our runs. Previous modeling of Utqiaġvik spring 2012 ozone in WRF-Chem found a similar linear correlation coefficient of 0.5 to BROMEX observations (Simpson et al., 2017) when using both blowing snow and snowpack mechanisms (Marelle et al., 2021). We are biased low compared to observations, with a root mean square error of 17.0 nmol mol−1 in BLOW+PACK compared to a root mean square error of 12.9 nmol mol−1 in Marelle et al. (2021). This may be partially due to limited vertical resolution in GEOS-Chem that may be inadequate for describing shallow surface-based temperature inversions and subsequent recovery. The high bias in ozone deposition velocity over sea ice surfaces may also contribute to low ozone mixing ratios near the surface (Helmig et al., 2007).
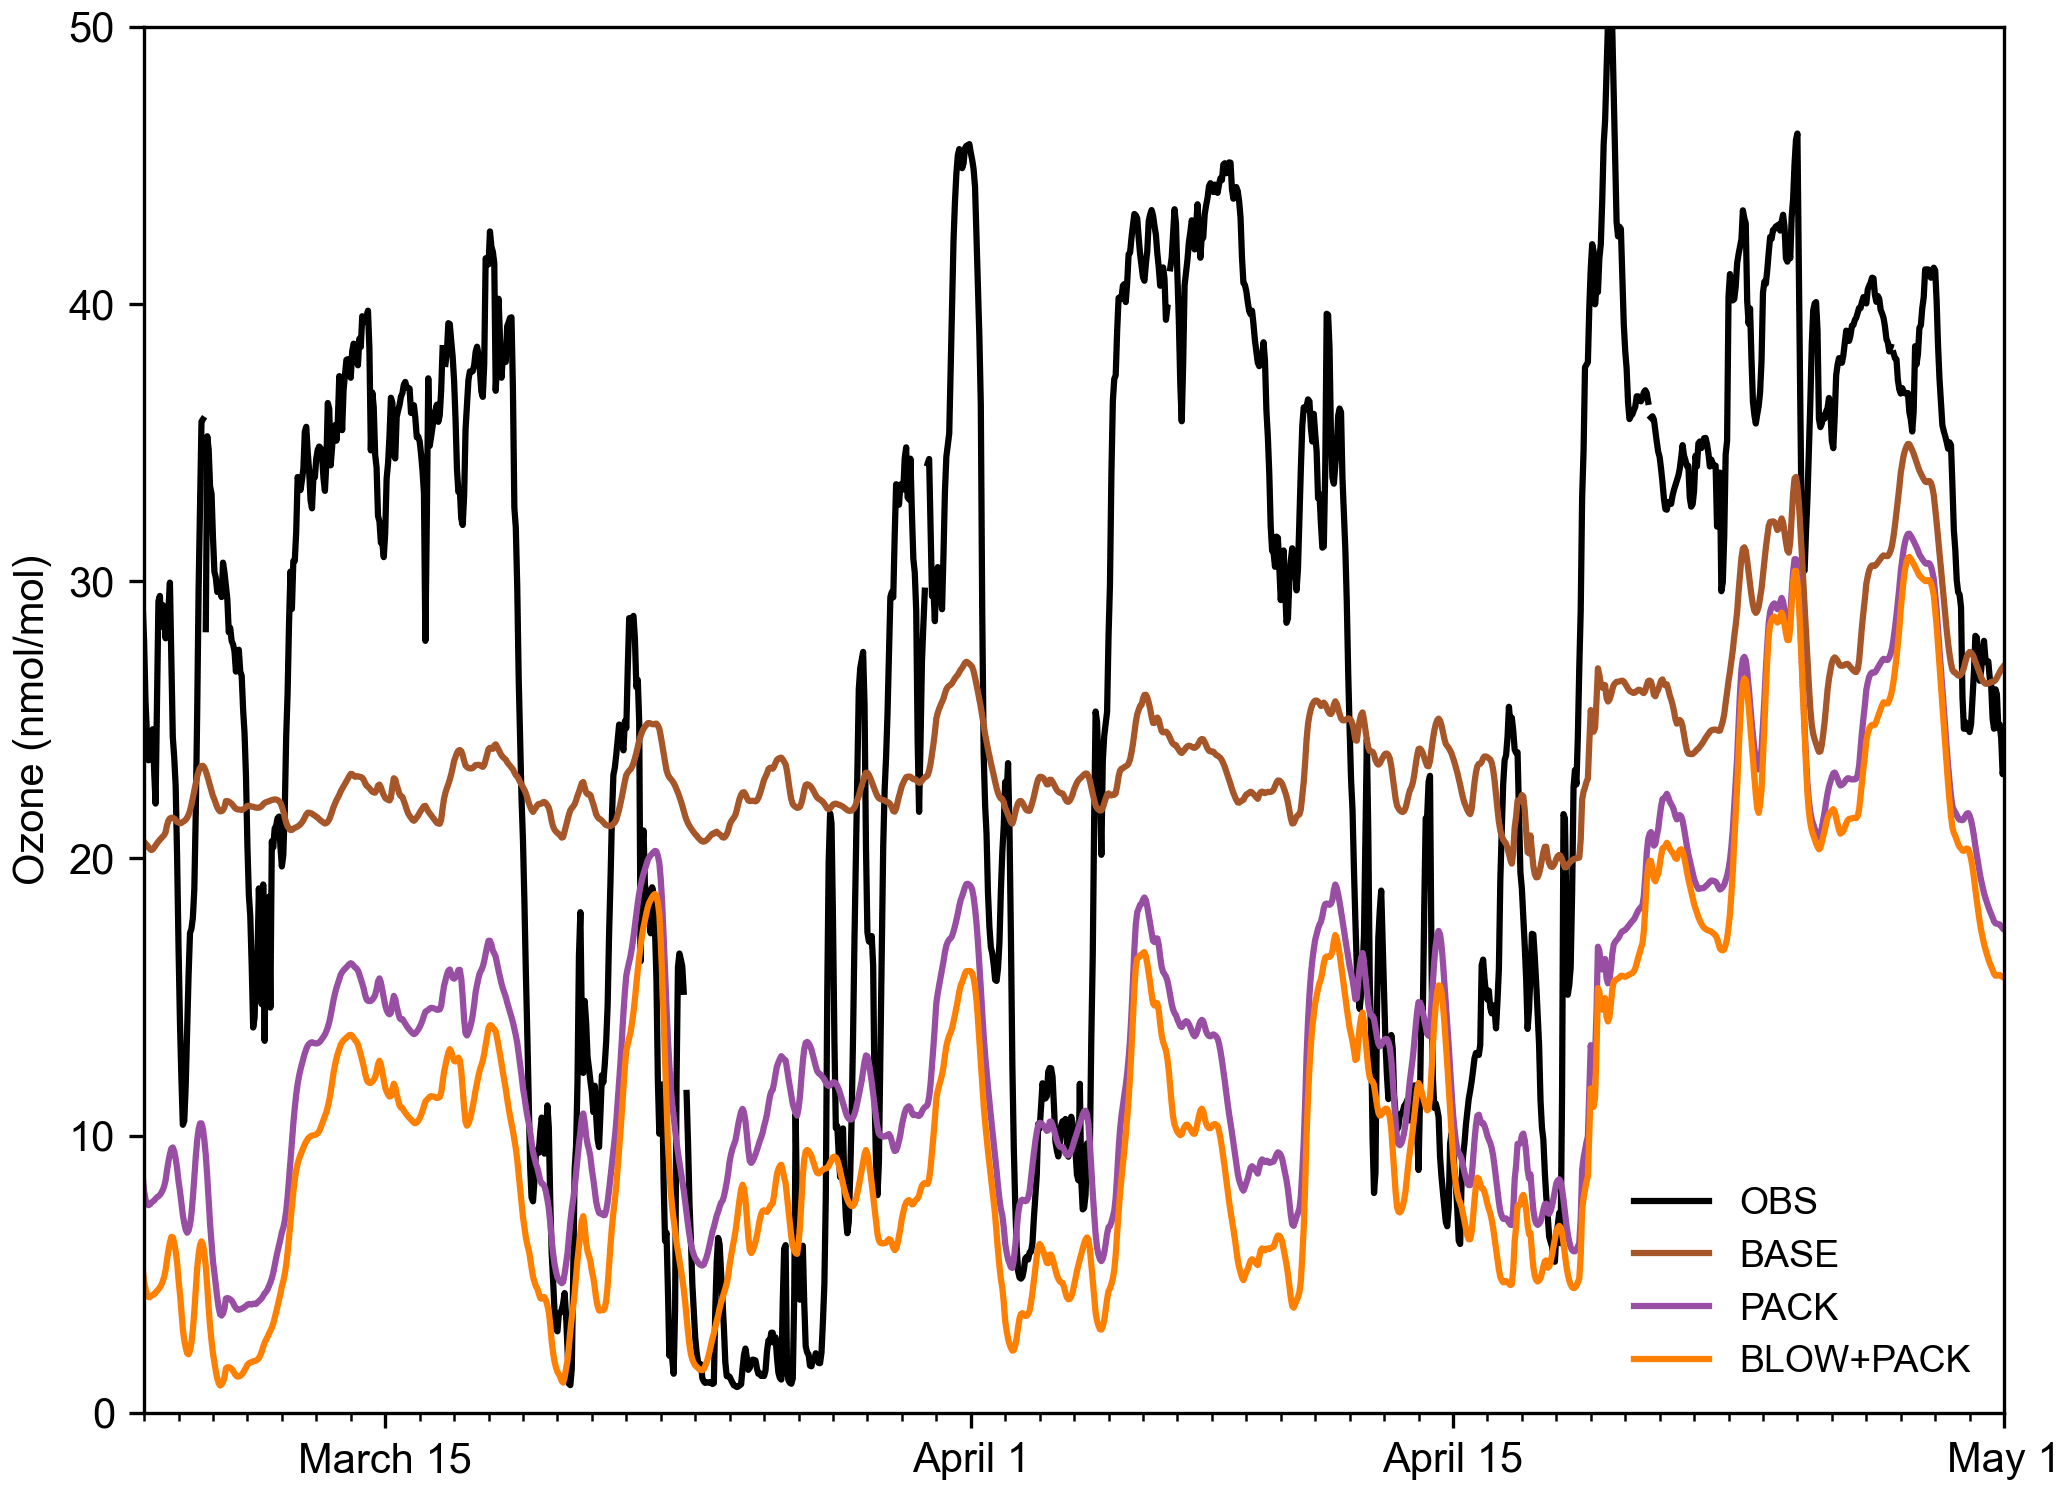
Figure 8Hourly Utqiaġvik ozone time series. Hourly time series of BLOW+PACK, PACK, and BASE ozone at Utqiaġvik in the 2015 Arctic spring. Ozone observations at BARC in black (McClure-Begley et al., 2014), BASE ozone in brown, PACK ozone in purple, and BLOW+PACK ozone in orange. Gaps indicate missing observational data.
A similar improvement in ozone predictions on the addition of PACK is seen on the O-Buoys but is harder to quantify due to observational gaps in ozone data. Supplement Fig. S10 shows hourly ozone predictions graphed over O-Buoy 11 observations, and Supplement Fig. S11 shows hourly ozone predictions graphed over O-Buoy 12. O-Buoy 10 was not able to gather an observation of ozone in 2015. The clearest impact of PACK in Figs. S10 and S11 is seen in early April, with observed ozone dropping near 0 nmol mol−1 and PACK and BLOW+PACK runs dropping to 5 nmol mol−1, while the BASE run remains near 20 nmol mol−1. Figure S10 shows that ozone predictions on O-Buoy 10 in May are less accurate, failing to fall below 10 nmol mol−1 ozone, while observations show ozone dropping near the detection limit. The O-Buoys appear to experience more late-season ozone depletion events that GEOS-Chem fails to replicate, possibly due to warming temperatures increasing vertical mixing and replenishing ozone near the surface.
Table 3Arctic tropospheric reaction rates by model run. Rates for each of the simulated reactions listed in Fig. 1 grouped by GEOS-Chem run. All units are listed as millions of moles per hour across the region shown in Supplement Fig. S14. R in Reaction (R3) refers to any organic molecule. Y in Eq. (1) represents NO, Cl, or H. X in Eq. (HR6a) represents either Br or Cl. PHOTOPACK and BLOW+PHOTOPACK are excluded as they severely overpredict BrO, as seen in Figs. 4 and 5.
O-Buoys deployed during fall 2015 measured BrO slant column densities characterized by noise around zero (see Supplement Figs. S12 and S13). We do not retrieve vertical column density from these fall slant column densities, because the resulting retrievals would be biased positive due to an algorithm requirement that only positive BrO column densities are allowed in the optimal estimation inversion. These differential slant column densities (dSCDs) can be used qualitatively to determine the presence or absence of BrO above the detection limit. If the dSCDs display noise around zero at all viewing angles, the BrO in the troposphere is below the detection limit of the spectrometer. A pattern of larger BrO dSCDs at near-horizon viewing elevation angles indicating the presence of tropospheric BrO above the detection limit is only observed at Utqiaġvik during Arctic spring (see Supplement Fig. S12). Any BrO present in the Arctic troposphere in September and October falls below detection limits at Utqiaġvik (see Supplement Fig. S12) and on each O-Buoy (see Supplement Fig. S13). The average Arctic spring 2015 MAX-DOAS BrOLTcol detection limits are 5×10¹² molecules cm−2 (Peterson et al., 2015; Simpson et al., 2017; Swanson et al., 2020). Both BLOW and PACK mechanisms lead to prediction of increased fall BrO because the weather and sea ice conditions specified in the emission algorithms occur in fall as well as spring.
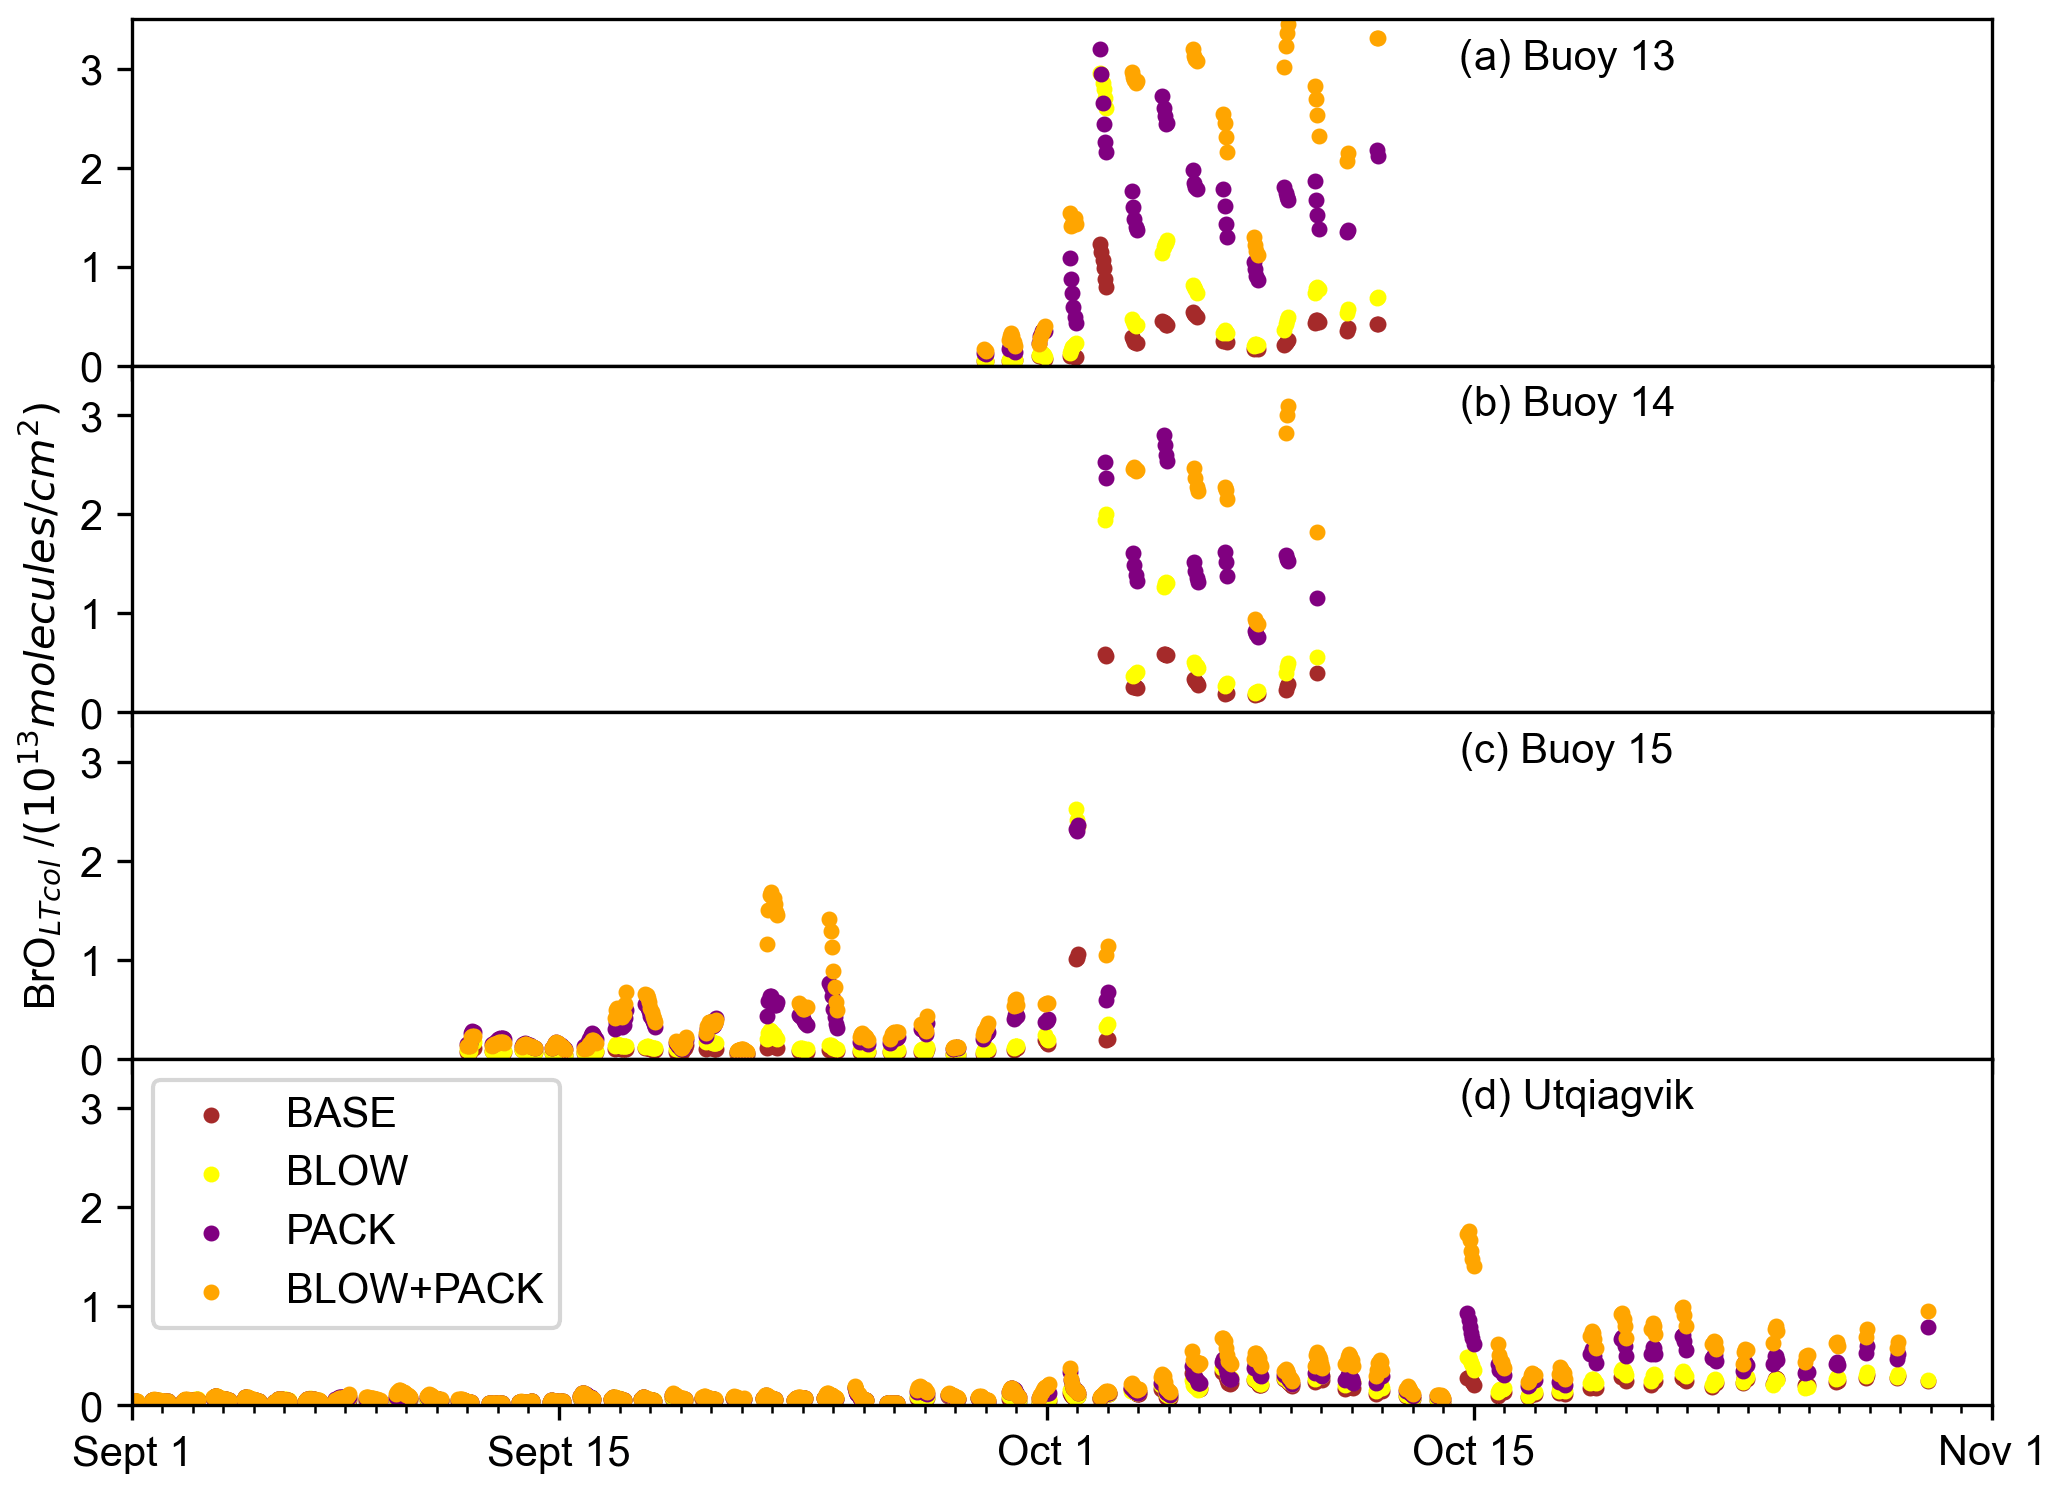
Figure 9Fall GEOS-Chem-predicted BrOLTcol. Hourly time series of BLOW+PACK, PACK, and BASE BrOLTcol on (a) O-Buoy 10, (b) O-Buoy 11, (c) O-Buoy 12 and (d) BARC at Utqiaġvik during September and October 2015 BASE BrOLTcol in brown, BLOW BrOLTcol in yellow, PACK BrOLTcol in purple, and BLOW+PACK BrOLTcol in orange. All BrOLTcol plotted continuously except for gaps where the solar elevation angle was less than 5∘.
Figure 9 shows fall predictions of BrOLTcol filtered for times when the solar elevation angle was greater than 5∘. BASE and PACK BrOLTcol remain near zero in September but rise above the MAX-DOAS detection limit of 5×10¹² molecules cm−2 BrOLTcol in October. The addition of the blowing snow SSA mechanism propels BLOW BrOLTcol up to 6×10¹³ molecules cm−2 in October. O-Buoys 13 and 14 have the highest modeled fall BrOLTcol, but even Utqiaġvik has several days of BrOLTcol above 5×10¹² molecules cm−2 in late October. There is no clear evidence of any BrO above MAX-DOAS detection limits at Utqiaġvik or on any O-Buoy in October, as seen by the dSCDs scattered around zero in Supplement Figs. S12 and S13.
Both mechanisms assume that snowpack and SSA are just as capable of recycling reactive bromine as in the springtime. High fall and winter SSA agrees with observations of peak SSA during polar winter in both Antarctica (Wagenbach et al., 1998) and the Arctic (Jacobi et al., 2012). The deposition of Arctic haze (Douglas and Sturm, 2004) and SSA (Jacobi et al., 2019) increases snowpack salinity and sulfate content over the course of winter and spring. This seasonal change in snowpack salinity and acidity may enable reactive bromine recycling in the Arctic spring, but there may not be sufficient haze and SSA deposition in the fall to decrease snowpack pH and increase snowpack bromide content. Additional observations of fall snowpack over sea ice including ion content could show different snowpack composition in spring and fall. Thus, the GEOS-Chem model overestimates fall BrO by assuming the fall snowpack is equally capable of reactive bromine recycling as the spring snowpack and providing an infinite reservoir of snowpack bromide in all seasons. Most other modeling exercises have focused on spring with unknown predictions in fall, possibly indicating problems in the mechanisms or parameterizations being employed, so we suggest that modeling should be done for a full year to improve the underlying chemistry and physics. We also suggest a fall snow sampling campaign to validate modeled fall BrO.
We add snowpack Br2 production to GEOS-Chem based on multiple field observations demonstrating molecular bromine production in snowpack interstitial air. We use a mechanistic parameterization of snowpack Br2 production based on Toyota et al. (2011) in which Br2 is emitted from all snowpacks of sufficient salinity and depth over land and sea ice upon deposition of the precursor species HOBr, BrNO3, and ozone. Prior work has also added a blowing snow SSA production mechanism that increases aerosol particulate bromide and thus facilitates heterogeneous recycling of reactive bromine on these aerosol particle surfaces. We update the halogen scheme to GEOS-Chem 12.9.3 and performed six model simulations including a BASE run with neither blowing snow SSA nor snowpack emissions, a PACK run assuming a constant yield of Br2 on ozone deposition over all snow surfaces, a PHOTOPACK run assuming an increased daytime yield of Br2 on ozone deposition (similar to Toyota et al., 2011), a BLOW run using only blowing snow SSA formation, and two additional runs combining BLOW and each respective PACK mechanism. The increased daytime yield of Br2 in PHOTOPACK leads to overprediction of BrO in these simulations, but the PACK run (with constant Br2 yield day and night) matches monthly averaged BrO vertical column densities within the measurement error for 9 of 13 cases at O-Buoy and Utqiaġvik in springtime months. The PACK and BLOW+PACK runs were successful in replicating observed BrO events on O-Buoys in May. The BLOW mechanism effectively increases aerosol surface available for turnover of reactive bromine. The snowpack mechanism has more impact on modeled BrO mixing ratios than the blowing snow SSA mechanism, but both contribute to tropospheric reactive bromine. We extend our model run to the full year and find that enhanced daytime Br2 yield can lead to increased Arctic Ocean Br2 production in the summer. Examining modeled BrO in fall 2015 reveals predictions of BrO when using these mechanisms that are at odds with observations.
The inclusion of two Arctic reactive bromine production mechanisms based on literature observations of snowpack Br2 emission and blowing snow SSA formation improves model skill in replicating Arctic tropospheric BrO in spring 2015. The snowpack is an important source of reactive bromine, and SSA particles provide an abundant surface for sustained reactive bromine recycling in the troposphere. We find that using both snowpack and blowing snow SSA bromine production mechanisms is necessary for modeling BrO in the Arctic.
Community authored code is available through GitHub at https://github.com/geoschem/geos-chem (last access: 29 October 2019) and https://doi.org/10.5281/zenodo.3974569 (The International GEOS-Chem User Community, 2020). First described in Bey et al. (2001). Documentation and guides may be found at http://wiki.seas.harvard.edu/geos-chem/index.php/Main_Page (last access: 15 January 2022).
The Utqiaġvik MAX-DOAS and meteorology data are available at https://doi.org/10.18739/A2R49G90M (Simpson, 2018), and the O-Buoy MAX-DOAS and meteorology data are available at https://doi.org/10.18739/a2wd4w (Simpson et al., 2009). We would like to thank the National Oceanic and Atmospheric Administration (NOAA) Global Monitoring Division for the provision of ozone and temperature data near Utqiaġvik, which is available online at https://doi.org/10.7289/V57P8WBF (NOAA ESRL Global Monitoring Division, 2018). We are grateful for the use of the coastline distance dataset from the Pacific Islands Ocean Observing System. We are grateful for the use of imagery from the Land Atmosphere Near Real-Time Capability for EOS (LANCE) system and services from the Global Imagery Browse Services (GIBS), both operated by the NASA/GSFC/Earth Science Data and Information System (ESDIS; https://earthdata.nasa.gov), with funding provided by NASA/HQ.
The supplement related to this article is available online at: https://doi.org/10.5194/acp-22-14467-2022-supplement.
WFS, WRS, and CH designed the study. WRS collected and curated MAX-DOAS data. KC, LM, JT, LJ, and JH contributed code for reactive bromine mechanisms. CH, KC, LJ, JH, BA, SZ, QC, XW, and TS contributed model updates. WFS carried out modeling and analysis. WFS wrote the paper, with input from all the authors.
The contact author has declared that none of the authors has any competing interests.
Publisher's note: Copernicus Publications remains neutral with regard to jurisdictional claims in published maps and institutional affiliations.
We thank the global GEOS-Chem community for their tireless work in improving the model. We recognize the work of Jiayue Huang in adding the blowing snow SSA mechanism to GEOS-Chem. We owe a debt of gratitude to all members of the Atmospheric Chemistry and Global Change group at Florida State University for their support in working with GEOS-Chem and Python. We also thank all involved in the O-Buoy project for data collection and analysis.
This research has been supported by the National Science Foundation (grant nos. ARC-1602716, AGS-1702266, AGS-2109323, and ARC-1602883) and by the CNRS INSU LEFE-CHAT program (grant no. Brom-Arc) and NASA (grant no. 80NSSC19K1273). This research has received funding from the European Union's Horizon 2020 Research And Innovation Program (grant no. 689443) via project the iCUPE (Integrative and Comprehensive Understanding on Polar Environments).
This paper was edited by Thorsten Bartels-Rausch and reviewed by two anonymous referees.
Alexander, B., Park, R. J., Jacob, D. J., Li, Q. B., Yantosca, R. M., Savarino, J., Lee, C. C. W., and Thiemens, M. H.: Sulfate formation in sea-salt aerosols: Constraints from oxygen isotopes, J. Geophys. Res.-Atmos., 110, 1–12, https://doi.org/10.1029/2004JD005659, 2005.
AMAP: AMAP Assessment 2011: Mercury in the Arctic. Arctic Monitoring and Assessment Programme (AMAP), Oslo, Norway. xiv + 193 pp., 2011.
Artiglia, L., Edebeli, J., Orlando, F., Chen, S., Lee, M. T., Corral Arroyo, P., Gilgen, A., Bartels-Rausch, T., Kleibert, A., Vazdar, M., Andres Carignano, M., Francisco, J. S., Shepson, P. B., Gladich, I., and Ammann, M.: A surface-stabilized ozonide triggers bromide oxidation at the aqueous solution-vapour interface, Nat. Commun., 8, 1–7, https://doi.org/10.1038/s41467-017-00823-x, 2017.
Ayers, G. P., Gillett, R. W., Cainey, J. M., and Dick, A. L.: Chloride and bromide loss from sea-salt particles in Southern Ocean air, J. Atmos. Chem., 33, 299–319, https://doi.org/10.1023/A:1006120205159, 1999.
Bariteau, L., Helmig, D., Fairall, C. W., Hare, J. E., Hueber, J., and Lang, E. K.: Determination of oceanic ozone deposition by ship-borne eddy covariance flux measurements, Atmos. Meas. Tech., 3, 441–455, https://doi.org/10.5194/amt-3-441-2010, 2010.
Barrie, L. A., Bottenheim, J. W., Schnell, R. C., Crutzen, P. J., and Rasmussen, R. A.: Ozone destruction and photochemical reactions at polar sunrise in the lower Arctic atmosphere, Nature, 334, 138–141, https://doi.org/10.1038/334138a0, 1988.
Berg, W. W., Sperry, P. D., Rahn, K. A., and Gladney, E. S.: Atmospheric Bromine in the Arctic, J. Geophys. Res., 88, 6719–6736, https://doi.org/10.1029/JC088iC11p06719, 1983.
Bey, I., Jacob, D. J., Yantosca, R. M., Logan, J. A., Field, B. D., Fiore, A. M., Li, Q., Liu, H. Y., Mickley, L. J., and Schultz, M. G.: Global modeling of tropospheric chemistry with assimilated meteorology: Model description and evaluation, J. Geophys. Res.-Atmos., 106, 23073–23095, https://doi.org/10.1029/2001JD000807, 2001.
Bottenheim, J. W., Fuentes, J. D., Tarasick, D. W., and Anlauf, K. G.: Ozone in the Arctic lower troposphere during winter and spring 2000 (ALERT2000), Atmos. Environ., 36, 2535–2544, 2002.
Burd, J. A., Peterson, P. K., Nghiem, S. V., Perovich, D. K., and Simpson, W. R.: Snow Melt Onset Hinders Bromine Monoxide Heterogeneous Recycling in the Arctic, J. Geophys. Res.-Atmos., 122, 8297–8309, https://doi.org/10.1002/2017JD026906, 2017.
Cao, L., Platt, U., and Gutheil, E.: Role of the boundary layer in the occurrence and termination of the tropospheric ozone depletion events in polar spring, Atmos. Environ., 132, 98–110, https://doi.org/10.1016/j.atmosenv.2016.02.034, 2016.
Carlson, D., Donohoue, D., Platt, U., and Simpson, W. R.: A low power automated MAX-DOAS instrument for the Arctic and other remote unmanned locations, Atmos. Meas. Tech., 3, 429–439, https://doi.org/10.5194/amt-3-429-2010, 2010.
Chance, K.: Analysis of BrO Measurements from the Global Ozone Monitoring Experiment, Geophys. Res. Lett., 25, 3335–3338, 1998.
Chen, Q., Schmidt, J. A., Shah, V., Jaeglé, L., Sherwen, T., and Alexander, B.: Sulfate production by reactive bromine: Implications for the global sulfur and reactive bromine budgets, Geophys. Res. Lett., 44, 7069–7078, https://doi.org/10.1002/2017GL073812, 2017.
Choi, S., Wang, Y., Salawitch, R. J., Canty, T., Joiner, J., Zeng, T., Kurosu, T. P., Chance, K., Richter, A., Huey, L. G., Liao, J., Neuman, J. A., Nowak, J. B., Dibb, J. E., Weinheimer, A. J., Diskin, G., Ryerson, T. B., da Silva, A., Curry, J., Kinnison, D., Tilmes, S., and Levelt, P. F.: Analysis of satellite-derived Arctic tropospheric BrO columns in conjunction with aircraft measurements during ARCTAS and ARCPAC, Atmos. Chem. Phys., 12, 1255–1285, https://doi.org/10.5194/acp-12-1255-2012, 2012.
Custard, K. D., Raso, A. R. W., Shepson, P. B., Staebler, R. M. and Pratt, K. A.: Production and Release of Molecular Bromine and Chlorine from the Arctic Coastal Snowpack, ACS Earth Space Chem., 1, 142–151, https://doi.org/10.1021/acsearthspacechem.7b00014, 2017.
De Leeuw, G., Andreas, E. L., Anguelova, M. D., Fairall, C. W., Lewis, E. R., O'Dowd, C., Schulz, M., and Schwartz, S. E.: Production flux of sea spray aerosol, Rev. Geophys., 49, 1–39, https://doi.org/10.1029/2010RG000349, 2011.
Déry, S. J. and Yau, M. K.: A Bulk Blowing Snow Model, Bound.-Lay. Meteorol., 93, 237–251, 1999.
Déry, S. J. and Yau, M. K.: Simulation of blowing snow in the Canadian Arctic using a double-moment model, Bound.-Lay. Meteorol., 99, 297–316, https://doi.org/10.1023/A:1018965008049, 2001.
Domine, F., Sparapani, R., Ianniello, A., and Beine, H. J.: The origin of sea salt in snow on Arctic sea ice and in coastal regions, Atmos. Chem. Phys., 4, 2259–2271, https://doi.org/10.5194/acp-4-2259-2004, 2004.
Douglas, T. A. and Sturm, M.: Arctic haze, mercury and the chemical composition of snow across northwestern Alaska, Atmos. Environ., 38, 805–820, https://doi.org/10.1016/j.atmosenv.2003.10.042, 2004.
Eastham, S. D., Weisenstein, D. K., and Barrett, S. R. H.: Development and evaluation of the unified tropospheric-stratospheric chemistry extension (UCX) for the global chemistry-transport model GEOS-Chem, Atmos. Environ., 89, 52–63, https://doi.org/10.1016/j.atmosenv.2014.02.001, 2014.
Falk, S. and Sinnhuber, B.-M.: Polar boundary layer bromine explosion and ozone depletion events in the chemistry–climate model EMAC v2.52: implementation and evaluation of AirSnow algorithm, Geosci. Model Dev., 11, 1115–1131, https://doi.org/10.5194/gmd-11-1115-2018, 2018.
Fan, S. M. and Jacob, D. J.: Surface ozone depletion in Arctic spring sustained by bromine reactions on aerosols, Nature, 359, 522–524, https://doi.org/10.1038/359522a0, 1992.
Fischer, E. V., Jacob, D. J., Yantosca, R. M., Sulprizio, M. P., Millet, D. B., Mao, J., Paulot, F., Singh, H. B., Roiger, A., Ries, L., Talbot, R. W., Dzepina, K., and Pandey Deolal, S.: Atmospheric peroxyacetyl nitrate (PAN): a global budget and source attribution, Atmos. Chem. Phys., 14, 2679–2698, https://doi.org/10.5194/acp-14-2679-2014, 2014.
Fisher, J. A., Jacob, D. J., Travis, K. R., Kim, P. S., Marais, E. A., Chan Miller, C., Yu, K., Zhu, L., Yantosca, R. M., Sulprizio, M. P., Mao, J., Wennberg, P. O., Crounse, J. D., Teng, A. P., Nguyen, T. B., St. Clair, J. M., Cohen, R. C., Romer, P., Nault, B. A., Wooldridge, P. J., Jimenez, J. L., Campuzano-Jost, P., Day, D. A., Hu, W., Shepson, P. B., Xiong, F., Blake, D. R., Goldstein, A. H., Misztal, P. K., Hanisco, T. F., Wolfe, G. M., Ryerson, T. B., Wisthaler, A., and Mikoviny, T.: Organic nitrate chemistry and its implications for nitrogen budgets in an isoprene- and monoterpene-rich atmosphere: constraints from aircraft (SEAC4RS) and ground-based (SOAS) observations in the Southeast US, Atmos. Chem. Phys., 16, 5969–5991, https://doi.org/10.5194/acp-16-5969-2016, 2016.
Foster, K. L., Plastridge, R. A., Bottenheim, J. W., Shepson, P. B., Finlayson-pitts, B. J. and Spicer, C. W.: The Role of Br 2 and BrCl in Surface Ozone Destruction at Polar Sunrise, Science, 80, 471–475, 2001.
Frey, M. M., Norris, S. J., Brooks, I. M., Anderson, P. S., Nishimura, K., Yang, X., Jones, A. E., Nerentorp Mastromonaco, M. G., Jones, D. H., and Wolff, E. W.: First direct observation of sea salt aerosol production from blowing snow above sea ice, Atmos. Chem. Phys., 20, 2549–2578, https://doi.org/10.5194/acp-20-2549-2020, 2020.
Frieß, U., Monks, P. S., Remedios, J. J., Rozanov, A., Sinreich, R., Wagner, T. and Platt, U.: MAX-DOAS O4 measurements: A new technique to derive information on atmospheric aerosols: 2. Modeling studies, J. Geophys.-Res., 111, D14203 https://doi.org/10.1029/2005JD006618, 2006.
Frieβ, U., Sihler, H., Sander, R., Phler, D., Yilmaz, S. and Platt, U.: The vertical distribution of BrO and aerosols in the Arctic: Measurements by active and passive differential optical absorption spectroscopy, J. Geophys. Res.-Atmos., 116, 1–19, https://doi.org/10.1029/2011JD015938, 2011.
Frieß, U., Beirle, S., Alvarado Bonilla, L., Bösch, T., Friedrich, M. M., Hendrick, F., Piters, A., Richter, A., van Roozendael, M., Rozanov, V. V., Spinei, E., Tirpitz, J.-L., Vlemmix, T., Wagner, T., and Wang, Y.: Intercomparison of MAX-DOAS vertical profile retrieval algorithms: studies using synthetic data, Atmos. Meas. Tech., 12, 2155–2181, https://doi.org/10.5194/amt-12-2155-2019, 2019.
Gelaro, R., McCarty, W., Suarez, M. J., Todling, R., Molod, A., Takacs, L., Randles, C., Darmenov, A., Bosilovich, M., Reichle, R., Wargan, K., Coy, L., Cullather, R., Draper, C., Akella, S., Buchard, V., Conaty, A., Da Silva, A., Gu, W., Kim, G., Koster, R., Lucchesi, R., Merkova, D., Nielsen, J. E., Partyka, G., Pawson, S., Putman, W., Rienecker, M., Schubert, S., Sienkiewicz, M., and Zhao, B.: The Modern-Era Retrospective Analysis for Research and Applications, J. Climate, 30, 5419–5454, https://doi.org/10.1175/JCLI-D-16-0758.1, 2017.
Halfacre, J. W., Knepp, T. N., Shepson, P. B., Thompson, C. R., Pratt, K. A., Li, B., Peterson, P. K., Walsh, S. J., Simpson, W. R., Matrai, P. A., Bottenheim, J. W., Netcheva, S., Perovich, D. K., and Richter, A.: Temporal and spatial characteristics of ozone depletion events from measurements in the Arctic, Atmos. Chem. Phys., 14, 4875–4894, https://doi.org/10.5194/acp-14-4875-2014, 2014.
Halfacre, J. W., Shepson, P. B., and Pratt, K. A.: pH-dependent production of molecular chlorine, bromine, and iodine from frozen saline surfaces, Atmos. Chem. Phys., 19, 4917–4931, https://doi.org/10.5194/acp-19-4917-2019, 2019.
Hara, K., Osada, K., Yabuki, M., Takashima, H., Theys, N. and Yamanouchi, T.: Important contributions of sea-salt aerosols to atmospheric bromine cycle in the Antarctic coasts, Sci. Rep., 8, 13852, https://doi.org/10.1038/s41598-018-32287-4, 2018.
Helmig, D., Ganzeveld, L., Butler, T., and Oltmans, S. J.: The role of ozone atmosphere-snow gas exchange on polar, boundary-layer tropospheric ozone – a review and sensitivity analysis, Atmos. Chem. Phys., 7, 15–30, https://doi.org/10.5194/acp-7-15-2007, 2007.
Herrmann, M., Sihler, H., Frieß, U., Wagner, T., Platt, U., and Gutheil, E.: Time-dependent 3D simulations of tropospheric ozone depletion events in the Arctic spring using the Weather Research and Forecasting model coupled with Chemistry (WRF-Chem), Atmos. Chem. Phys., 21, 7611–7638, https://doi.org/10.5194/acp-21-7611-2021, 2021.
Holmes, C. D., Jacob, D. J., Corbitt, E. S., Mao, J., Yang, X., Talbot, R., and Slemr, F.: Global atmospheric model for mercury including oxidation by bromine atoms, Atmos. Chem. Phys., 10, 12037–12057, https://doi.org/10.5194/acp-10-12037-2010, 2010.
Hönninger, G. and Platt, U.: Observations of BrO and its vertical distribution during surface ozone depletion at Alert, Atmos. Environ., 36, 2481–2489, https://doi.org/10.1016/S1352-2310(02)00104-8, 2002.
Huang, J. and Jaeglé, L.: Wintertime enhancements of sea salt aerosol in polar regions consistent with a sea ice source from blowing snow, Atmos. Chem. Phys., 17, 3699–3712, https://doi.org/10.5194/acp-17-3699-2017, 2017.
Huang, J., Jaeglé, L., and Shah, V.: Using CALIOP to constrain blowing snow emissions of sea salt aerosols over Arctic and Antarctic sea ice, Atmos. Chem. Phys., 18, 16253–16269, https://doi.org/10.5194/acp-18-16253-2018, 2018.
Huang, J., Jaeglé, L., Chen, Q., Alexander, B., Sherwen, T., Evans, M. J., Theys, N., and Choi, S.: Evaluating the impact of blowing-snow sea salt aerosol on springtime BrO and O3 in the Arctic, Atmos. Chem. Phys., 20, 7335–7358, https://doi.org/10.5194/acp-20-7335-2020, 2020.
Jacobi, H. W., Voisin, D., Jaffrezo, J. L., Cozic, J., and Douglas, T. A.: Chemical composition of the snowpack during the OASIS spring campaign 2009 at Barrow, Alaska, J. Geophys. Res.-Atmos., 117, D00R13, https://doi.org/10.1029/2011JD016654, 2012.
Jacobi, H.-W., Obleitner, F., Da Costa, S., Ginot, P., Eleftheriadis, K., Aas, W., and Zanatta, M.: Deposition of ionic species and black carbon to the Arctic snowpack: combining snow pit observations with modeling, Atmos. Chem. Phys., 19, 10361–10377, https://doi.org/10.5194/acp-19-10361-2019, 2019.
Jaeglé, L., Quinn, P. K., Bates, T. S., Alexander, B., and Lin, J.-T.: Global distribution of sea salt aerosols: new constraints from in situ and remote sensing observations, Atmos. Chem. Phys., 11, 3137–3157, https://doi.org/10.5194/acp-11-3137-2011, 2011.
Keller, C. A., Long, M. S., Yantosca, R. M., Da Silva, A. M., Pawson, S., and Jacob, D. J.: HEMCO v1.0: a versatile, ESMF-compliant component for calculating emissions in atmospheric models, Geosci. Model Dev., 7, 1409–1417, https://doi.org/10.5194/gmd-7-1409-2014, 2014.
Knepp, T. N., Bottenheim, J., Carlsen, M., Carlson, D., Donohoue, D., Friederich, G., Matrai, P. A., Netcheva, S., Perovich, D. K., Santini, R., Shepson, P. B., Simpson, W., Valentic, T., Williams, C., and Wyss, P. J.: Development of an autonomous sea ice tethered buoy for the study of ocean-atmosphere-sea ice-snow pack interactions: the O-buoy, Atmos. Meas. Tech., 3, 249–261, https://doi.org/10.5194/amt-3-249-2010, 2010.
Koo, J.-H., Wang, Y., Kurosu, T. P., Chance, K., Rozanov, A., Richter, A., Oltmans, S. J., Thompson, A. M., Hair, J. W., Fenn, M. A., Weinheimer, A. J., Ryerson, T. B., Solberg, S., Huey, L. G., Liao, J., Dibb, J. E., Neuman, J. A., Nowak, J. B., Pierce, R. B., Natarajan, M., and Al-Saadi, J.: Characteristics of tropospheric ozone depletion events in the Arctic spring: analysis of the ARCTAS, ARCPAC, and ARCIONS measurements and satellite BrO observations, Atmos. Chem. Phys., 12, 9909–9922, https://doi.org/10.5194/acp-12-9909-2012, 2012.
Krnavek, L., Simpson, W. R., Carlson, D., Domine, F., Douglas, T. A., and Sturm, M.: The chemical composition of surface snow in the Arctic: Examining marine, terrestrial, and atmospheric influences, Atmos. Environ., 50, 349–359, https://doi.org/10.1016/j.atmosenv.2011.11.033, 2012.
Lehrer, E., Hönninger, G., and Platt, U.: A one dimensional model study of the mechanism of halogen liberation and vertical transport in the polar troposphere, Atmos. Chem. Phys., 4, 2427–2440, https://doi.org/10.5194/acp-4-2427-2004, 2004.
Lewis, E. R. and Schwartz, S. E.: Salt Aerosol Production: Mechanisms, Methods, Measurements, and Models: A Critical Review, American Geophysical Union, Washington D.C., https://doi.org/10.1029/GM152, 2004.
Lin, H., Jacob, D. J., Lundgren, E. W., Sulprizio, M. P., Keller, C. A., Fritz, T. M., Eastham, S. D., Emmons, L. K., Campbell, P. C., Baker, B., Saylor, R. D., and Montuoro, R.: Harmonized Emissions Component (HEMCO) 3.0 as a versatile emissions component for atmospheric models: application in the GEOS-Chem, NASA GEOS, WRF-GC, CESM2, NOAA GEFS-Aerosol, and NOAA UFS models, Geosci. Model Dev., 14, 5487–5506, https://doi.org/10.5194/gmd-14-5487-2021, 2021.
Liu, T., Chan, A. W. H. and Abbatt, J. P. D.: Multiphase Oxidation of Sulfur Dioxide in Aerosol Particles: Implications for Sulfate Formation in Polluted Environments, Environ. Sci. Technol., 55, 4227–4242, https://doi.org/10.1021/acs.est.0c06496, 2021.
Mao, J., Paulot, F., Jacob, D. J., Cohen, R. C., Crounse, J. D., Wennberg, P. O., Keller, C. A., Hudman, R. C., Barkley, M. P., and Horowitz, L. W.: Ozone and organic nitrates over the eastern United States: Sensitivity to isoprene chemistry, J. Geophys. Res.-Atmos., 118, 11256–11268, https://doi.org/10.1002/jgrd.50817, 2013.
Marelle, L., Thomas, J. L., Ahmed, S., Tuite, K., Stutz, J., Dommergue, A., Simpson, W. R., Frey, M. M., and Baladima, F.: Implementation and Impacts of Surface and Blowing Snow Sources of Arctic Bromine Activation Within WRF-Chem 4.1.1, J. Adv. Model. Earth Sy., 13, e2020MS002391, https://doi.org/10.1029/2020ms002391, 2021.
McClure-Begley, A., Petropavlovskikh, I., and Oltmans, S.: NOAA Global Monitoring Surface Ozone Network 1973–2014, National Oceanic and Atmospheric Administration, Earth Systems Research Laboratory Global Monitoring Division [data set], Boulder, CO, https://doi.org/10.7289/V57P8WBF, 2014.
McNamara, S. M., Kolesar, K. R., Wang, S., Kirpes, R. M., May, N. W., Gunsch, M. J., Cook, R. D., Fuentes, J. D., Hornbrook, R. S., Apel, E. C., Laskin, A., and Pratt, K. A.: Observation of Road Salt Aerosol Driving Inland Wintertime Atmospheric Chlorine Chemistry, ACS Cent. Sci., 6, 684–694, https://doi.org/10.1021/acscentsci.9b00994, 2020.
Moore, C. W., Obrist, D., Steffen, A., Staebler, R. M., Douglas, T. A., Richter, A., and Nghiem, S. V: Convective forcing of mercury and ozone in the Arctic boundary layer induced by leads in sea ice, Nature, 506, 81–84, https://doi.org/10.1038/nature12924, 2014.
NASA: NASA Goddard Space Flight Center, Ocean Ecology Laboratory, Ocean Biology Processing Group. Moderate-resolution Imaging Spectroradiometer (MODIS) Terra Corrected Reflectance True Color Data 4/1/2015; NASA OB.DAAC, Greenbelt, MD, USA, 2015.
Nghiem, S.: Studying bromine, ozone, and mercury chemistry in the Arctic, Eos T. Am. Geophys. Un., 94, 289–291, https://doi.org/10.1038/NGEO1779, 2013.
NOAA ESRL Global Monitoring Division: Meteorology measurements from quasi-continuous measurements at Barrow, Alaska, American Samoa and South Pole. Compiled by Christine Schultz, National Oceanic and Atmospheric Administration (NOAA), Earth System Research Laboratory (ESRL), Global Monitoring Division (GMD), Boulder, Colorado, USA, https://doi.org/10.7289/V57P8WBFTS14, 2018.
Oltmans, S. J., Johnson, B. J., and Harris, J. M.: Springtime boundary layer ozone depletion at Barrow, Alaska: Meteorological influence, year-to-year variation, and long-term change, J. Geophys. Res.-Atmos., 117, 1–18, https://doi.org/10.1029/2011JD016889, 2012.
Oum, K. W., Lakin, M. J., and Finlayson-Pitts, B. J.: Bromine activation in the troposphere by the dark reaction of O3 with seawater ice, Geophys. Res. Lett., 25, 3923–3926, https://doi.org/10.1029/1998GL900078, 1998.
Parrella, J. P., Jacob, D. J., Liang, Q., Zhang, Y., Mickley, L. J., Miller, B., Evans, M. J., Yang, X., Pyle, J. A., Theys, N., and Van Roozendael, M.: Tropospheric bromine chemistry: implications for present and pre-industrial ozone and mercury, Atmos. Chem. Phys., 12, 6723–6740, https://doi.org/10.5194/acp-12-6723-2012, 2012.
Payne, V. H., Clough, S. A., Shephard, M. W., Nassar, R., and Logan, J. A.: Information-centered representation of retrievals with limited degrees of freedom for signal: Application to methane from the Tropospheric Emission Spectrometer, J. Geophys. Res., 114, 1–16, https://doi.org/10.1029/2008JD010155, 2009.
Peterson, P. K., Simpson, W. R., Pratt, K. A., Shepson, P. B., Frieß, U., Zielcke, J., Platt, U., Walsh, S. J., and Nghiem, S. V.: Dependence of the vertical distribution of bromine monoxide in the lower troposphere on meteorological factors such as wind speed and stability, Atmos. Chem. Phys., 15, 2119–2137, https://doi.org/10.5194/acp-15-2119-2015, 2015.
Peterson, P. K., Pöhler, D., Sihler, H., Zielcke, J., General, S., Frieß, U., Platt, U., Simpson, W. R., Nghiem, S. V., Shepson, P. B., Stirm, B. H., Dhaniyala, S., Wagner, T., Caulton, D. R., Fuentes, J. D., and Pratt, K. A.: Observations of bromine monoxide transport in the Arctic sustained on aerosol particles, Atmos. Chem. Phys., 17, 7567–7579, https://doi.org/10.5194/acp-17-7567-2017, 2017.
Peterson, P. K., Pöhler, D., Zielcke, J., General, S., Friess, U., Platt, U., Simpson, W. R., Nghiem, S., Shepson, P. B., Stirm, B. H., and Pratt, K. A.: Springtime Bromine Activation Over Coastal and Inland Arctic Snowpacks, ACS Earth Sp. Chem., 2, 1075–1086, https://doi.org/10.1021/acsearthspacechem.8b00083, 2018.
Peterson, P. K., Hartwig, M., May, N. W., Schwartz, E., Rigor, I., Ermold, W., Steele, M., Morison, J. H., Nghiem, S. V., and Pratt, K. A.: Snowpack measurements suggest role for multiyear sea ice regions in Arctic atmospheric bromine and chlorine chemistry, Elementa 7, https://doi.org/10.1525/elementa.352, 2019.
Pöhler, D., Vogel, L., Friess, U., and Platt, U.: Observation of halogen species in the Amundsen Gulf, Arctic, by active long-path differential optical absorption spectroscopy, P. Natl. Acad. Sci. USA., 107, 6582–6587, https://doi.org/10.1073/pnas.0912231107, 2010.
Pound, R. J., Sherwen, T., Helmig, D., Carpenter, L. J., and Evans, M. J.: Influences of oceanic ozone deposition on tropospheric photochemistry, Atmos. Chem. Phys., 20, 4227–4239, https://doi.org/10.5194/acp-20-4227-2020, 2020.
Pratt, K. A., Custard, K. D., Shepson, P. B., Douglas, T. A., Pöhler, D., General, S., Zielcke, J., Simpson, W. R., Platt, U., Tanner, D. J., Gregory Huey, L., Carlsen, M., and Stirm, B. H.: Photochemical production of molecular bromine in Arctic surface snowpacks, Nat. Geosci., 6, 351–356, https://doi.org/10.1038/ngeo1779, 2013.
Richter, A., Wittrock, F., Eisinger, M., and Burrows, J. P.: GOME observations of tropospheric BrO in Northern Hemispheric spring and summer 1997, Geophys. Res. Lett., 25, 2683–2686, https://doi.org/10.1029/98GL52016, 1998.
Rodgers, C. D. and Connor, B. J.: Intercomparison of remote sounding instruments, J. Geophys. Res., 108, 4116, https://doi.org/10.1029/2002JD002299, 2003.
Saiz-Lopez, A. and von Glasow, R.: Reactive halogen chemistry in the troposphere, Chem. Soc. Rev., 41, 6448, https://doi.org/10.1039/c2cs35208g, 2012.
Salawitch, R. J., Canty, T., Kurosu, T., Chance, K., Liang, Q., Silva, A., Pawson, S., Nielsen, J. E., Rodriguez, J. M., Bhartia, P. K., Liu, X., Huey, L. G., Liao, J., Stickel, R. E., Tanner, D. J., Dibb, J. E., Simpson, W. R., Donohoue, D., Kreher, K., Johnston, P. V, Gao, R. S., Johnson, B., Bui, T. P., and Chen, G.: A new interpretation of total column BrO during Arctic spring, Geophys. Res. Lett., 37, 1–9, https://doi.org/10.1029/2010GL043798, 2010.
Sander, R., Keene, W. C., Pszenny, A. A. P., Arimoto, R., Ayers, G. P., Baboukas, E., Cainey, J. M., Crutzen, P. J., Duce, R. A., Hönninger, G., Huebert, B. J., Maenhaut, W., Mihalopoulos, N., Turekian, V. C., and Van Dingenen, R.: Inorganic bromine in the marine boundary layer: a critical review, Atmos. Chem. Phys., 3, 1301–1336, https://doi.org/10.5194/acp-3-1301-2003, 2003.
Schmidt, J. A., Jacob, D. J., Horowitz, H. M., Hu, L., Sherwen, T., Evans, M. J., Liang, Q., Suleiman, R. M., Oram, D. E., Le Breton, M., Percival, C. J., Wang, S., Dix, B., and Volkamer, R.: Modeling the observed tropospheric BrO background: Importance of multiphase chemistry and implications for ozone, OH, andmercury, J. Geophys. Res., 121, 11819–11835, https://doi.org/10.1002/2015JD024229, 2016.
Schroeder, W. H., Anlauf, K. G., Barrie, L. A., Lu, J. Y., and Steffen, A.: Arctic Springtime Depletion of Mercury, Nature, 394, 331–332, https://doi.org/10.1038/379126b0, 1998.
Shah, V., Jacob, D. J., Moch, J. M., Wang, X., and Zhai, S.: Global modeling of cloud water acidity, precipitation acidity, and acid inputs to ecosystems, Atmos. Chem. Phys., 20, 12223–12245, https://doi.org/10.5194/acp-20-12223-2020, 2020.
Sherwen, T., Schmidt, J. A., Evans, M. J., Carpenter, L. J., Großmann, K., Eastham, S. D., Jacob, D. J., Dix, B., Koenig, T. K., Sinreich, R., Ortega, I., Volkamer, R., Saiz-Lopez, A., Prados-Roman, C., Mahajan, A. S., and Ordóñez, C.: Global impacts of tropospheric halogens (Cl, Br, I) on oxidants and composition in GEOS-Chem, Atmos. Chem. Phys., 16, 12239–12271, https://doi.org/10.5194/acp-16-12239-2016, 2016a.
Sherwen, T., Schmidt, J. A., Evans, M. J., Carpenter, L. J., Großmann, K., Eastham, S. D., Jacob, D. J., Dix, B., Koenig, T. K., Sinreich, R., Ortega, I., Volkamer, R., Saiz-Lopez, A., Prados-Roman, C., Mahajan, A. S., and Ordóñez, C.: Global impacts of tropospheric halogens (Cl, Br, I) on oxidants and composition in GEOS-Chem, Atmos. Chem. Phys., 16, 12239–12271, https://doi.org/10.5194/acp-16-12239-2016, 2016b.
Sherwen, T., Evans, M. J., Carpenter, L. J., Schmidt, J. A., and Mickley, L. J.: Halogen chemistry reduces tropospheric O3 radiative forcing, Atmos. Chem. Phys., 17, 1557–1569, https://doi.org/10.5194/acp-17-1557-2017, 2017.
Simpson, W. R.: Atmospheric measurements via Multiple Axis Differential Optical Absorption Spectroscopy (MAXDOAS), Utqiaġvik (Barrow), Alaska 2012–2018, Arctic Data Center, Arcticdata.io [data set], https://doi.org/10.18739/A2222R550, 2018.
Simpson, W. R., Perovich, D. K., Matrai, P. A., Shepson, P. B., and Chavez, F.: The Collaborative O-Buoy Project: Deployment of a Network of Arctic Ocean Chemical Sensors for the IPY and beyond, Arctic Data Center [data set], https://doi.org/10.18739/A2WD4W, 2009.
Simpson, W. R., Brown, S. S., Saiz-Lopez, A., Thornton, J. A., and Glasow, R. Von: Tropospheric Halogen Chemistry: Sources, Cycling, and Impacts, Chem. Rev., 115, 4035–4062, https://doi.org/10.1021/cr5006638, 2015.
Simpson, W. R., Peterson, P. K., Frieß, U., Sihler, H., Lampel, J., Platt, U., Moore, C., Pratt, K., Shepson, P., Halfacre, J., and Nghiem, S. V.: Horizontal and vertical structure of reactive bromine events probed by bromine monoxide MAX-DOAS, Atmos. Chem. Phys., 17, 9291–9309, https://doi.org/10.5194/acp-17-9291-2017, 2017.
Stumpf, R.: Distance to Nearest Coastline 0.01 Degree Grid [data set], https://pae-paha.pacioos.hawaii.edu/thredds/ncss/dist2coast_1deg/dataset.html, last access: 11 October 11 2021.
Stutz, J., Thomas, J. L., Hurlock, S. C., Schneider, M., von Glasow, R., Piot, M., Gorham, K., Burkhart, J. F., Ziemba, L., Dibb, J. E., and Lefer, B. L.: Longpath DOAS observations of surface BrO at Summit, Greenland, Atmos. Chem. Phys., 11, 9899–9910, https://doi.org/10.5194/acp-11-9899-2011, 2011.
Swanson, W. F., Graham, K. A., Halfacre, J. W., Holmes, C. D., Shepson, P. B., and Simpson, W. R.: Arctic Reactive Bromine Events Occur in Two Distinct Sets of Environmental Conditions: A Statistical Analysis of 6 Years of Observations, J. Geophys. Res.-Atmos., 125, e2019JD032139, https://doi.org/10.1029/2019JD032139, 2020.
Tang, T. and McConnell, J. C.: Autocatalytic release of bromine from Arctic snow pack during polar sunrise, Geophys. Res. Lett., 23, 2633–2636, https://doi.org/10.1029/96GL02572, 1996.
The International GEOS-Chem User Community: geoschem/geos-chem: GEOS-Chem 12.9.3 (12.9.3), Zenodo [code and data], https://doi.org/10.5281/zenodo.3974569, 2020.
Theys, N., Van Roozendael, M., Hendrick, F., Yang, X., De Smedt, I., Richter, A., Begoin, M., Errera, Q., Johnston, P. V., Kreher, K., and De Mazière, M.: Global observations of tropospheric BrO columns using GOME-2 satellite data, Atmos. Chem. Phys., 11, 1791–1811, https://doi.org/10.5194/acp-11-1791-2011, 2011.
Thomas, J. L., Stutz, J., Lefer, B., Huey, L. G., Toyota, K., Dibb, J. E., and von Glasow, R.: Modeling chemistry in and above snow at Summit, Greenland – Part 1: Model description and results, Atmos. Chem. Phys., 11, 4899–4914, https://doi.org/10.5194/acp-11-4899-2011, 2011.
Toom-Sauntry, D. and Barrie, L. A.: Chemical composition of snowfall in the high Arctic: 1990–1994, Atmos. Environ., 36, 2683–2693, https://doi.org/10.1016/S1352-2310(02)00115-2, 2002.
Toyota, K., McConnell, J. C., Lupu, A., Neary, L., McLinden, C. A., Richter, A., Kwok, R., Semeniuk, K., Kaminski, J. W., Gong, S.-L., Jarosz, J., Chipperfield, M. P., and Sioris, C. E.: Analysis of reactive bromine production and ozone depletion in the Arctic boundary layer using 3-D simulations with GEM-AQ: inference from synoptic-scale patterns, Atmos. Chem. Phys., 11, 3949–3979, https://doi.org/10.5194/acp-11-3949-2011, 2011.
Toyota, K., McConnell, J. C., Staebler, R. M., and Dastoor, A. P.: Air–snowpack exchange of bromine, ozone and mercury in the springtime Arctic simulated by the 1-D model PHANTAS – Part 1: In-snow bromine activation and its impact on ozone, Atmos. Chem. Phys., 14, 4101–4133, https://doi.org/10.5194/acp-14-4101-2014, 2014.
Travis, K. R., Jacob, D. J., Fisher, J. A., Kim, P. S., Marais, E. A., Zhu, L., Yu, K., Miller, C. C., Yantosca, R. M., Sulprizio, M. P., Thompson, A. M., Wennberg, P. O., Crounse, J. D., St. Clair, J. M., Cohen, R. C., Laughner, J. L., Dibb, J. E., Hall, S. R., Ullmann, K., Wolfe, G. M., Pollack, I. B., Peischl, J., Neuman, J. A., and Zhou, X.: Why do models overestimate surface ozone in the Southeast United States?, Atmos. Chem. Phys., 16, 13561–13577, https://doi.org/10.5194/acp-16-13561-2016, 2016.
von Clarmann, T. and Glatthor, N.: The application of mean averaging kernels to mean trace gas distributions, Atmos. Meas. Tech., 12, 5155–5160, https://doi.org/10.5194/amt-12-5155-2019, 2019.
Vogt, R., Crutzen, P., and Sander, R.: A mechanism for halogen release from sea-salt, Nature, 383, 327–331, 1996.
Wagenbach, D., Minikin, A., Ducroz, F., Mulvaney, R., Keck, L., Legrand, M., Hall, J. S., and Wolff, E. W.: Sea-salt aerosol in coastal Antarctic regions at three coastal, J. Geophys. Res.-Atmos., 103, 961–974, 1998.
Wagner, T. and Platt, U.: Satellite mapping of enhanced BrO concentrations in the troposphere, Nature, 395, 486–490, https://doi.org/10.1038/26723, 1998.
Wang, S. and Pratt, K. A.: Molecular Halogens Above the Arctic Snowpack: Emissions, Diurnal Variations, and Recycling Mechanisms, J. Geophys. Res.-Atmos., 122, 11991–12007, https://doi.org/10.1002/2017JD027175, 2017.
Wang, S., Mcnamara, S. M., Moore, C. W., Obrist, D., Steffen, A., Shepson, P. B., Staebler, R. M., Raso, A. R. W., and Pratt, K. A.: Direct detection of atmospheric atomic bromine leading to mercury and ozone depletion, P. Natl. Acad. Sci. USA, 116, 14479–14484, https://doi.org/10.1073/pnas.1900613116, 2019.
Wang, X., Jacob, D. J., Eastham, S. D., Sulprizio, M. P., Zhu, L., Chen, Q., Alexander, B., Sherwen, T., Evans, M. J., Lee, B. H., Haskins, J. D., Lopez-Hilfiker, F. D., Thornton, J. A., Huey, G. L., and Liao, H.: The role of chlorine in global tropospheric chemistry, Atmos. Chem. Phys., 19, 3981–4003, https://doi.org/10.5194/acp-19-3981-2019, 2019.
Wang, X., Jacob, D. J., Downs, W., Zhai, S., Zhu, L., Shah, V., Holmes, C. D., Sherwen, T., Alexander, B., Evans, M. J., Eastham, S. D., Neuman, J. A., Veres, P. R., Koenig, T. K., Volkamer, R., Huey, L. G., Bannan, T. J., Percival, C. J., Lee, B. H., and Thornton, J. A.: Global tropospheric halogen (Cl, Br, I) chemistry and its impact on oxidants, Atmos. Chem. Phys., 21, 13973–13996, https://doi.org/10.5194/acp-21-13973-2021, 2021.
Wennberg, P. O.: Bromine explosion, Nature, 397, 299–301, https://doi.org/10.1038/16805, 1999.
Wren, S. N., Kahan, T. F., Jumaa, K. B., and Donaldson, D. J.: Spectroscopic studies of the heterogeneous reaction between O3(g) and halides at the surface of frozen salt solutions, J. Geophys. Res.-Atmos., 115, 1–8, https://doi.org/10.1029/2010JD013929, 2010.
Wren, S. N., Donaldson, D. J., and Abbatt, J. P. D.: Photochemical chlorine and bromine activation from artificial saline snow, Atmos. Chem. Phys., 13, 9789–9800, https://doi.org/10.5194/acp-13-9789-2013, 2013.
Yang, X., Pyle, J. A., and Cox, R. A.: Sea salt aerosol production and bromine release: Role of snow on sea ice, Geophys. Res. Lett., 35, 1–5, https://doi.org/10.1029/2008GL034536, 2008.
Yang, X., Pyle, J. A., Cox, R. A., Theys, N., and Van Roozendael, M.: Snow-sourced bromine and its implications for polar tropospheric ozone, Atmos. Chem. Phys., 10, 7763–7773, https://doi.org/10.5194/acp-10-7763-2010, 2010.
Yang, X., Frey, M. M., Rhodes, R. H., Norris, S. J., Brooks, I. M., Anderson, P. S., Nishimura, K., Jones, A. E., and Wolff, E. W.: Sea salt aerosol production via sublimating wind-blown saline snow particles over sea ice: parameterizations and relevant microphysical mechanisms, Atmos. Chem. Phys., 19, 8407–8424, https://doi.org/10.5194/acp-19-8407-2019, 2019.
Zhu, L., Jacob, D. J., Eastham, S. D., Sulprizio, M. P., Wang, X., Sherwen, T., Evans, M. J., Chen, Q., Alexander, B., Koenig, T. K., Volkamer, R., Huey, L. G., Le Breton, M., Bannan, T. J., and Percival, C. J.: Effect of sea salt aerosol on tropospheric bromine chemistry, Atmos. Chem. Phys., 19, 6497–6507, https://doi.org/10.5194/acp-19-6497-2019, 2019.
- Abstract
- Introduction
- Data sources and methods
- Examining reactive bromine in the Arctic spring
- Arctic spring reactive bromine modeling discussion
- Examining reactive bromine in the Arctic in September and October
- Conclusions
- Code availability
- Data availability
- Author contributions
- Competing interests
- Disclaimer
- Acknowledgements
- Financial support
- Review statement
- References
- Supplement