the Creative Commons Attribution 4.0 License.
the Creative Commons Attribution 4.0 License.
 | 27 Jan 2022
Statistical validation of Aeolus L2A particle backscatter coefficient retrievals over ACTRIS/EARLINET stations on the Iberian Peninsula
Jesús Abril-Gago
Juan Luis Guerrero-Rascado
Maria João Costa
Juan Antonio Bravo-Aranda
Michaël Sicard
Diego Bermejo-Pantaleón
Daniele Bortoli
María José Granados-Muñoz
Alejandro Rodríguez-Gómez
Constantino Muñoz-Porcar
Adolfo Comerón
Pablo Ortiz-Amezcua
Vanda Salgueiro
Marta María Jiménez-Martín
Lucas Alados-Arboledas
The Global Observing System (GOS) has encountered some limitations due to a lack of worldwide real-time wind measurements. In this context, the European Space Agency (ESA) has developed the Aeolus satellite mission, based on the ALADIN (Atmospheric Laser Doppler Instrument) Doppler wind lidar; this mission aims to obtain near-real-time wind retrievals at the global scale. As spin-off products, the instrument retrieves aerosol optical properties such as particle backscatter and extinction coefficients. In this work, a validation of Aeolus reprocessed (baseline 10) co-polar backscatter coefficients () is presented through an intercomparison with analogous ground-based measurements taken at the ACTRIS (Aerosols, Clouds and Trace gases Research InfraStructure Network)/EARLINET (European Aerosol Research Lidar Network) stations of Granada (Spain), Évora (Portugal) and Barcelona (Spain) over the period from July 2019 until October 2020. Case studies are first presented, followed by a statistical analysis. The stations are located in a hot spot between Africa and the rest of Europe, which guarantees a variety of aerosol types, from mineral dust layers to continental/anthropogenic aerosol, and allows us to test Aeolus performance under different scenarios. The so called Aeolus-like profiles () are obtained from total particle backscatter coefficient and linear particle depolarization ratio () profiles at 355 and 532 nm measured from the surface, through a thorough bibliographic review of dual-polarization measurements for relevant aerosol types. Finally, the study proposes a relation for the spectral conversion of , which is implemented in the Aeolus-like profile calculation. The statistical results show the ability of the satellite to detect and characterize significant aerosol layers under cloud-free conditions, along with the surface effect on the lowermost measurements, which causes the satellite to largely overestimate co-polar backscatter coefficients. Finally, the Aeolus standard correct algorithm middle bin (SCAmb) shows a better agreement with ground-based measurements than the standard correct algorithm (SCA), which tends to retrieve negative and meaningless coefficients in the clear troposphere. The implementation of Aeolus quality flags entails a vast reduction in the number of measurements available for comparison, which affects the statistical significance of the results.
- Article
(7466 KB) - Full-text XML
- BibTeX
- EndNote


Aerosol particles are a key component in the climate system, scattering and absorbing the solar and thermal radiation. As highlighted by the Intergovernmental Panel on Climate Change (IPCC), the uncertainty of the radiative effects of some aerosol components, such as black carbon (strong positive radiative forcing), organic carbon (strong negative forcing) or mineral dust (small but significant negative forcing), is still exceptionally large (Myhre et al., 2013). Moreover, the current uncertainties due to aerosol–cloud interactions do not allow an accurate assessment of their radiative forcing. Thus, more comprehensive datasets of the properties of atmospheric aerosols at the global scale, acquired by monitoring ground-based networks and satellite missions, are needed in order to reduce these uncertainties and, consequently, improve our knowledge of the effects of atmospheric aerosols on climate change.
Atmospheric aerosols and clouds may cause a strong radiative forcing, playing an important role in the climate system of their source region as well as in the regions over which they are transported (Stocker et al., 2013). Thus, a good understanding of atmospheric dynamics is required. Satellites can observe large areas of the atmosphere, and a few instruments can provide a nonstop full coverage of the planet's atmosphere and surface. Satellite missions enable the remote retrieval of a vast set of atmospheric and surface properties such as multispectral images of surface reflectance (e.g., Claverie et al., 2018; Bioresita et al., 2018), atmospheric composition (e.g., Veefkind et al., 2012) and detailed optical information of the atmosphere (e.g., Amiridis et al., 2015).
The lack of worldwide real-time wind measurements is one of the main deficiencies in the current Global Observing System (GOS), affecting the reliability of numerical weather prediction (NWP) models and the analysis of the climate variability (WMO, 2004). Aiming to sort out these limitations and encourage large-scale dynamic studies, especially in remote regions, the European Space Agency (ESA) approved (in 1999) the development of the Atmospheric Dynamic Mission Aeolus (ADM-Aeolus, now called Aeolus). The satellite was finally launched on 22 August 2018 with the Atmospheric Laser Doppler Instrument (ALADIN) on board. The complete coverage of the planet and the variety of properties provided by Aeolus will imply an important improvement of numerical models (Stoffelen et al., 2006; ESA, 2008; Horányi et al., 2015a, b) as well as a contribution to the understanding of atmospheric dynamics in the troposphere and lower stratosphere (Straume et al., 2020).
Prior to the satellite launch, the ESA promoted several campaigns for the intercomparison of the satellite's products, for both wind and optical retrievals (Straume et al., 2019), in order to determine possible observation biases and increase the data quality. The current study is engaged within the EARLINET (European Aerosol Research Lidar Network) “Cal/Val” (calibration and validation) activities of the Aeolus mission campaign at the continental scale (“Aeolus L2A aerosol and cloud product validation using the European Aerosol Research Lidar Network EARLINET”, project no. 5166), promoted by the ESA (Straume et al., 2019). The Cal/Val activities encourage independent stations in the framework of EARLINET to perform ground-based simultaneous measurements with Aeolus overpasses for validation activities. The present paper is one of the few devoted to the intercomparison of optical products from Aeolus at the continental scale. The geographic and temporal coverage of EARLINET stations along the quality-assured measurements provides an excellent framework for the intercomparison of Aeolus products under different atmospheric conditions and aerosol concentrations. Thus, the continuation of the Cal/Val activities are of great importance.
Several Cal/Val campaigns have taken place in the framework of EARLINET over the last few decades, such as the one (still ongoing) for the Cloud-Aerosol Lidar and Infrared Pathfinder Satellite Observation (CALIPSO) mission (Winker et al., 2007), the first satellite mission focused on monitoring vertically resolved aerosol and cloud optical products worldwide, funded by NASA (e.g., Mamouri et al., 2009; Pappalardo et al., 2010; Amiridis et al., 2010, 2015; Papagiannopoulos et al., 2016). Furthermore, the evaluation of aerosol optical products from the Cloud-Aerosol Transport System (CATS) on board the International Space Station (ISS) (Yorks et al., 2015, 2016; Rodier et al., 2016) was performed within the EARLINET community (Proestakis et al., 2019). Regarding Aeolus, several Cal/Val studies have focused on Aeolus wind products (known as L2B products), including wind profiles and their biases, with frequent intensive campaigns (e.g., Baars et al., 2020; Lux et al., 2020; Witschas et al., 2020; Guo et al., 2021). Recently, some applications of Aeolus optical products (known as L2A) have been reported (Baars et al., 2021; Dai et al., 2021; Feofilov et al., 2021). However, to date, no studies assessing the calibration and validation of Aeolus aerosol products with ground-based stations have been published.
The present study presents the intercomparison of Aeolus L2A aerosol optical products, in particular the particle backscatter coefficients at 355 nm, with analogous ground-based lidar measurements from three different ACTRIS (Aerosols, Clouds and Trace gases Research InfraStructure Network)/EARLINET stations on the Iberian Peninsula, namely Granada, Évora and Barcelona. This article is structured as follows: Sect. 2 presents the experimental setup of the different systems, addressing the characteristics of Aeolus and ALADIN, along with the main aspects of the ground-based ACTRIS/EARLINET stations involved in the study; Sect. 3 is devoted to the methodology followed in the intercomparison process, the peculiarities of Aeolus products and ground-based measurements, and the criteria set for the comparison; Sect. 4 gathers the results and discussion; and, finally, Sect. 5 summarizes the main findings of the study, with special attention to the most relevant aspects for the satellite mission.
2.1 The Aeolus satellite
Aeolus was launched on 22 August 2018 from French Guiana. It was placed into a Sun-synchronous orbit at an altitude of 320 km and inclination angle of 97∘. It moves at 7.71 km s−1 and completes an orbit in 90 min (16 orbits per day) (Reitebuch et al., 2018; Flamant et al., 2020). The revisit time is 7 d (Flamant et al., 2020). The orbit setting of Aeolus allows it to overpass the Equator at 06:00 and 18:00 LST (local solar time) during the ascending and descending modes, respectively, in order to minimize the background noise caused by solar radiation, as it avoids solar zenith.
The Aeolus satellite is equipped with a single instrument: the ALADIN lidar. The instrument, based on the Doppler wind lidar technique, acquires profiles of wind speed and particle optical properties in the troposphere and low stratosphere up to 30 km (Ansmann et al., 2007; Flamant et al., 2008). The ALADIN lidar points towards the Earth's surface at an angle of 35∘ compared to nadir, although (due to the planet's curvature) this angle changes to 37.6∘ at surface level (Reitebuch et al., 2018). Due to the orbit configuration and the instrument design, ALADIN only retrieves the projection of the horizontal wind speed over the horizontal line of sight (HLOS), a variable sufficient for the characterization of the wind field (ESA, 2008). This variable is known as a Level 2B (L2B) product. As spin-off products, ALADIN also provides particle optical properties, namely the particle backscatter and extinction coefficients (among others), known as Level 2A (L2A) products, which are separately retrieved through the standard correct algorithm (SCA), standard correct algorithm middle bin (SCAmb), iterative correct algorithm (ICA) and Mie channel algorithm (MCA) (Flamant et al., 2020; Flament et al., 2021). The retrieval employs the High Spectral Resolution Lidar (HSRL) technique (Wandinger, 1998). Additionally, Level 2C (L2C) products consist of wind fields after the assimilation of L2B profiles by the forecast models of the European Center for Medium-Range Weather Forecasts (ECMWF) (Ingmann and Straume, 2016). On 12 May 2020, L2B products were made available to the general public (https://aeolus-ds.eo.esa.int, last access: 7 January 2022) after going through bias correction procedures. Recently, L2A products began to be produced under a new processor version (baseline 12) and are openly published alongside L2B and L2C products. At the time of writing this article, the longest, fully homogeneous product dataset has been reprocessed in baseline 10 (B10). In this study, we evaluated Aeolus B10 optical products with a thorough analysis of Aeolus co-polar backscatter coefficients using SCA and SCAmb.
The instrument emits ultraviolet (UV) radiation at 355 nm and acquires the backscattered radiation through a dual receiver, consisting of two spectrometers, with Rayleigh and Mie channels, for molecule and particle backscattering, respectively (Ingmann and Straume, 2016). Consequently, two independent wind profiles can be retrieved. However, a single measurement of aerosol optical products is obtained from the combination of both signals. The emitted radiation is circularly polarized, whilst the receiver only detects the parallel (co-polar) component, resulting in underestimated particle backscatter coefficients and overestimated extinction coefficients (Flamant et al., 2020), especially under conditions with highly depolarizing particles. ALADIN emits light pulses at a repetition frequency of 50.5 Hz. A single observation, i.e., profile, is generated by averaging shots over a 12 s period corresponding to a horizontal resolution of 87 km. Each profile is divided into 24 vertical bins. The vertical resolution of each bin depends on the altitude: 500 m between 0 and 2 km (roughly the atmospheric boundary layer), 1 km between 2 and 16 km (roughly free troposphere), and 2 km between 16 and 30 km (roughly the lowermost stratosphere) (Ingmann and Straume, 2016).
2.2 ACTRIS/EARLINET stations
EARLINET (European Aerosol Research Lidar Network; Pappalardo et al., 2014), in the framework of ACTRIS (Aerosols, Clouds, and Trace gases Research Infrastructure Network; https://www.actris.eu/, last access: 7 January 2022), aims to generate a vast database of quality-assured vertical profiles of aerosol measurements under homogeneous standards around Europe. Thanks to its large spatial coverage of the European continent, ACTRIS/EARLINET has actively participated and participates in the calibration and validation of satellite mission measurements (Pappalardo et al., 2010; Amiridis et al., 2015; Papagiannopoulos et al., 2016; Proestakis et al., 2019). In this study, three ACTRIS/EARLINET lidar stations from the Iberian Peninsula, namely Granada, Évora and Barcelona, are considered (details in Table 1).
Table 1Overview of the lidar systems of Granada, Évora and Barcelona stations.

The ACTRIS/EARLINET Granada station (37.164∘ N, 3.605∘ W; 680 m a.s.l.) is located in the southeastern part of Spain, in a fairly populated region. The city lies in a geographic depression, at the foot of Sierra Nevada, with altitudes of up to 3479 m a.s.l. to the east of the station. Aerosol particles of anthropogenic origin, mainly released by fossil fuel burning, can be detected during the whole year (Lyamani et al., 2006, 2010, 2012). Due to the station proximity to the north of Africa, mineral dust intrusions from the Sahara Desert are often detected during the year, mainly in the summer season (Guerrero-Rascado et al., 2008, 2009; Bravo-Aranda et al., 2015; Granados-Muñoz et al., 2016; Mandija et al., 2016), although winter dust intrusions have become more frequent over the last few years (Cazorla et al., 2017; Fernández et al., 2019). The concentration of continental aerosols from the European continent are also significant throughout the year (Lyamani et al., 2010). Notable events of local wildfire smoke (Alados-Arboledas et al., 2011) and long-range-transported smoke from North America (Ortiz-Amezcua et al., 2014, 2017; Sicard et al., 2019) are usual. Bioaerosol particle concentrations, especially pollen grains, are significant over the city during specific periods of the year (Cariñanos et al., 2021). The station is equipped with a multispectral Raman lidar system, MULHACEN (LR331D400, Raymetrics S.A.), operated by the Atmospheric Physics Research Group at the Andalusian Institute for Earth System Research (IISTA-CEAMA), University of Granada.
The ACTRIS/EARLINET Évora station (38.568∘ N, 7.912∘ W; 293 m a.s.l.) is located in the southern part of Portugal, around 100 km from Lisbon and the border with Spain, in a mainly flat and rural region with relatively low industrialization and low concentrations of anthropogenic aerosol (Pereira et al., 2009; Preißler et al., 2013). Smoke particles from nearby wildfires or industrialized regions are regularly transported over the station (Preißler et al., 2013; Pereira et al., 2014), and it also receives long-range-transported smoke from North America (Sicard et al., 2019; Baars et al., 2019). Furthermore, due to the station's proximity to the Sahara Desert, mineral dust layers are frequent over the city (Pereira et al., 2009; Preißler et al., 2011, 2013) with many extreme events occurring (Preißler et al., 2011; Valenzuela et al., 2017; Couto et al., 2021). Rare events of simultaneous biomass burning and mineral dust intrusions have been characterized (Salgueiro et al., 2021). Significant bioaerosol concentration events can also occur at specific stages of the year (Galveias et al., 2021). The lidar station is operated by the Institute of Earth Sciences, associated with the University of Évora. Among other atmospheric research instruments, the station holds a multispectral Raman lidar of the POLLYXT type (Baars et al., 2016; Engelmann et al., 2016) named PAOLI.
The ACTRIS/EARLINET Barcelona station (41.393∘ N, 2.120∘ E; 115 m a.s.l.) is located on the northeastern coast of Spain, in a highly populated and industrialized region. Due to its location, the different types of aerosols present are significantly diverse. The background aerosol load, mostly made of urban, traffic-related particles and marine aerosols, is located in the lowermost part of the boundary layer (Sicard et al., 2011). Saharan mineral dust intrusions are frequent throughout the year due to the station's relative proximity to North Africa (Pérez et al., 2006). The variability of the aerosol optical properties in Barcelona in the atmospheric column has been studied by Sicard et al. (2011). The Barcelona lidar system is developed and operated by the Remote Sensing Laboratory of the Department of Signal Theory and Communications at the Universitat Politècnica de Catalunya.
The variety of locations, surroundings and orography of the three stations enables the study to explore coastal and inland, rural and urban, and flat and mountainous effects on the quality of the comparisons between the ground station and the satellite. Aeolus overpasses Évora during an ascending mode (south to north) at around 52 km east every Friday at 18:17 UTC. In the case of Barcelona, the satellite overpasses the station during an ascending mode at 26 km west every Tuesday at 17:39 UTC. The station in Granada lies at the intersection of two Aeolus overpasses: every Thursday at 06:24 UTC (ascending orbit) and 18:04 UTC (descending orbit), both at about 24 km west. All three stations fulfill the ESA requirement that only satellite overpasses with a ground-track distance of less than 100 km should be considered (Straume et al., 2019). Figure 1a shows Aeolus overpasses over a wide part of Europe. Figure 1b is a zoomed in view of the Iberian Peninsula, where all three stations are located, as well as the associated Aeolus overpasses of the case studies analyzed in Sect. 4.2.
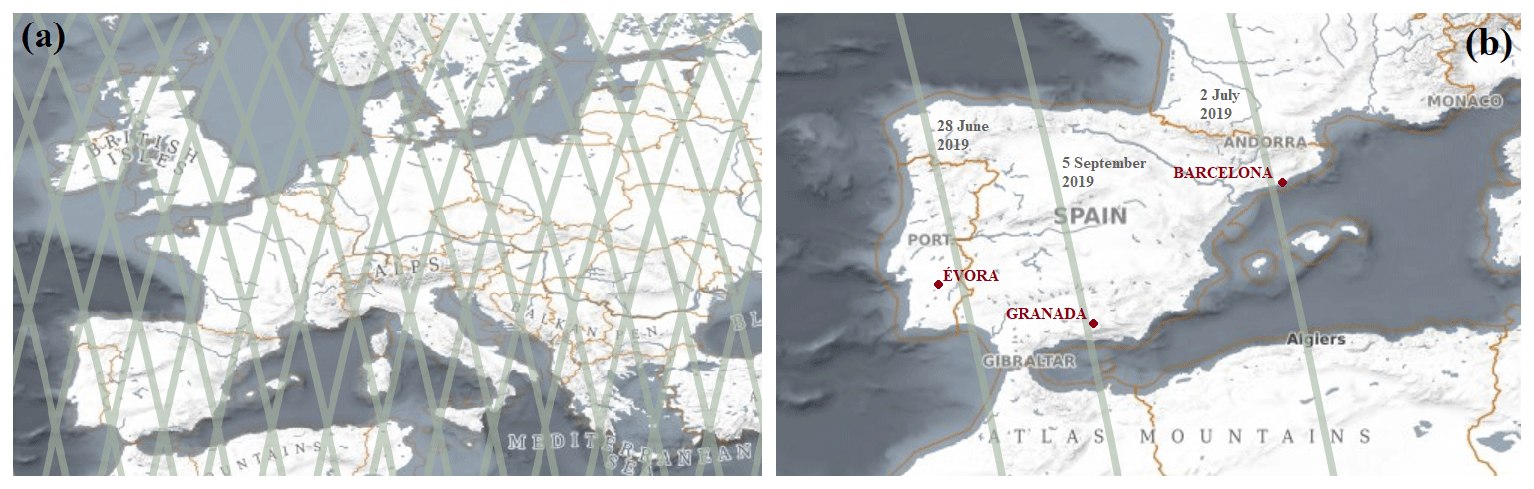
Figure 1(a) Distribution of the Aeolus overpasses over Europe during the considered period (B10, from July 2019 to December 2019 and from 20 April 2020 to 6 October 2020). (b) Location of the stations in Évora, Granada and Barcelona as well as the associated overpasses during the case studies analyzed in Sect. 4.2. (Source: ESA Aeolus online dissemination, https://aeolus-ds.eo.esa.int, last access: 7 January 2022).
3.1 Database and intercomparison methodology
For the intercomparison between ground-based measurements and satellite products, a series of spatiotemporal criteria was established taking the location of each station and the overpasses times into account. On the one hand, the Aeolus observation closest in distance to the station was chosen. For the location of the Aeolus overpass, the middle point of the 87 km horizontal average forming each single profile was considered. On the other hand, the temporal co-location was established according to the measurement protocols at each station. For Granada, a 1.5 h interval containing the morning overpass time (i.e., 05:30–07:00 UTC) and a 1 h interval containing the evening overpass time (i.e., 17:30–18:30 UTC) were chosen. For Barcelona, a 1 h range centered at the overpass time (i.e., 17:09–18:09 UTC) was considered. For Évora, a 1.5 h interval containing the overpass time (i.e., 17:30–19:00 UTC) was considered to take the larger distance between the Aeolus ground track and the lidar site into account. The temporal evolution of the meteorological conditions and layers has been checked individually so as to ensure that the selection of 1 or 1.5 h as average interval for the lidar signals does not introduce any artifact in the comparison.
Aeolus products are automatically processed by ESA. They are generated under specific data processing algorithms, called baselines, which are constantly being improved and updated. In October 2020 Aeolus products from July 2019 to December 2019 and from 20 April 2020 to 6 October 2020 were reprocessed under a single baseline, baseline 10 (B10), aiming to homogenize the processing of the products and encourage Aeolus Cal/Val teams to proceed with B10 products. The Aeolus database considered in this work is exclusively composed of B10 Aeolus products and covers different seasons and atmospheric conditions.
In the current study, only aerosol products (L2A) are considered, in particular particle backscatter coefficients derived from the standard correct algorithm (SCA) and standard correct algorithm middle bin (SCAmb). SCA and SCAmb employ the information from the Rayleigh and Mie channels, and the derived profiles are divided into a series of vertical bins. The difference between them is that SCAmb bins (or middle bins) are obtained from two halves of adjacent original SCA bins, aiming to reduce noise in the products. These products come with quality flags that individually mark the validity of each bin measurement. The quality flags assess the signal-to-noise ratio of both Mie and Rayleigh channels as well as retrieval uncertainties (known as error estimates). A full description of L2A products and their implemented algorithms is given by Flamant et al. (2020), and a more concise description is given by Flament et al. (2021).
The current study is developed under cloud-free scenarios. Cloud screening was performed by visual inspection of the ground-based profiles. Aeolus observations have been carefully and individually checked, and atmospheric conditions have been studied along each overpass to ensure cloud-free conditions.
The ground-based measurements are processed by the Single Calculus Chain (SCC) (D'Amico et al., 2015, 2016; Mattis et al., 2016), the standardized tool that allows one to automatically process the lidar data acquired at each station within EARLINET. Very few measurements of the Barcelona station were not inverted successfully by the SCC. In those cases, after checking the cloud-free condition, the measurements were inverted manually with an algorithm validated in previous algorithm intercomparisons at the network level (Böckmann et al., 2004; Pappalardo et al., 2004; Sicard et al., 2009). All data used in this work are Level 1.0 and Level 2.0 data from the EARLINET/ACTRIS database (http://www.actris.nilu.no, last access: 7 January 2022). The Raman-derived extinction profiles retrieved at ground level could not be used in the study due to the time of the satellite overpass, during which the signal-to-noise ratio is not good enough for these channels. Therefore, Aeolus extinction coefficients are not exploited in the study.
3.2 Aeolus-like conversion of ground-based lidar particle backscatter coefficients
Aeolus underestimates the particle backscatter coefficient, as the receiver only detects the co-polar component of circular polarized backscattered radiation at 355 nm (Flamant et al., 2020), whereas ground-based lidars retrieve particle backscatter coefficients with the total backscattered radiation at 355 or 532 nm. For comparison purposes, the co-polar component of the ground-based observations at 355 nm must be extracted from the total particle backscatter coefficient. This is done using the following expression:
where is the co-polar component of the particle backscatter coefficient at 355 nm (henceforth labeled as Aeolus-like coefficient, ); is the total component of the particle backscatter coefficient at 355 nm derived from the ground-based lidar; and is the circular particle depolarization ratio at 355 nm, which is not directly measured by the considered ground-based lidars. The linear particle depolarization ratio can be easily converted into the circular particle depolarization ratio from Mishchenko and Hovenier (1995) as follows:
where is the linear particle depolarization ratio at 355 nm. The stations in Évora and Granada do not possess a depolarization channel at 355 nm and lack the possibility to measure . A conversion of into is proposed in the form of
where Kδ is the spectral conversion factor. Thus, a thorough bibliographic review of previous multispectral depolarization studies has been conducted and discussed in Sect. 4.1 to estimate such a conversion factor. The third station, Barcelona, does measure both depolarization ratios; however, for the sake of consistency of the data processing, Barcelona was calculated in the same way as the other two stations. In Sect. 4.1, the measurements of and in Barcelona are superimposed onto the literature results in order to validate our methodology.
3.3 Statistical parameters
A key point of the intercomparison is the vertical resolution of each profile. Aeolus divides each profile into a set of 24 vertical bins that are not homogeneously distributed. The resolution of these bins depends on the altitude range: 500 m between 0 and 2 km a.s.l., 1 km between 2 and 16 km a.s.l., and 2 km between 16 and 30 km a.s.l. (Ingmann and Straume, 2016). Because the ground-based lidars present a much finer resolution, of the order of a few meters, the resolution of each ground-based profile has been degraded to the Aeolus vertical resolution. Thus, the different ground-based vertical values within a given Aeolus bin are averaged into a single value, permitting a bin-to-bin intercomparison. This degradation process is performed on the ground-based Aeolus-like profiles in the last stage, prior to the statistical analysis calculations. Ground-based vertical coverage depends on the station and on each particular case, typically up to 10 km or up to the top of the highest aerosol layer, whereas Aeolus profiles extend way beyond 10 km. Hence, only statistical comparisons below 10 km, where most of the aerosols are, are presented.
The statistical results are presented in vertical ranges of 1 km. A pair of Aeolus and Aeolus-like values will fall into a given 1 km range if the middle point of the bin lies within the vertical range (for instance, if a bin ranges from 1900 to 2400 m, its middle altitude, 2150 m, lies within the 2 km vertical range). Three statistical parameters are calculated to assess the intercomparison results: difference (Δ), root-mean-square error (RMSE) and linear fit. Δ profiles are calculated as follows:
where r is the vertical range, z is the middle altitude of the bin's range that lies within the r vertical range and N is the number of pairs of Aeolus and Aeolus-like values whose z lies within r. This parameter indicates if Aeolus underestimates (Δ(r) < 0) or overestimates (Δ(r) > 0) the co-polar particle backscatter coefficient in each region r. The RMSE profile is also obtained as follow:
Finally, the linear regression of ) against is performed under a series of different settings, in order to test if they lie close to the 1:1 relation. The Pearson correlation coefficient, R, is calculated in all cases.
4.1 Estimation of the depolarization spectral conversion factor from ground-based profiles to Aeolus-like products
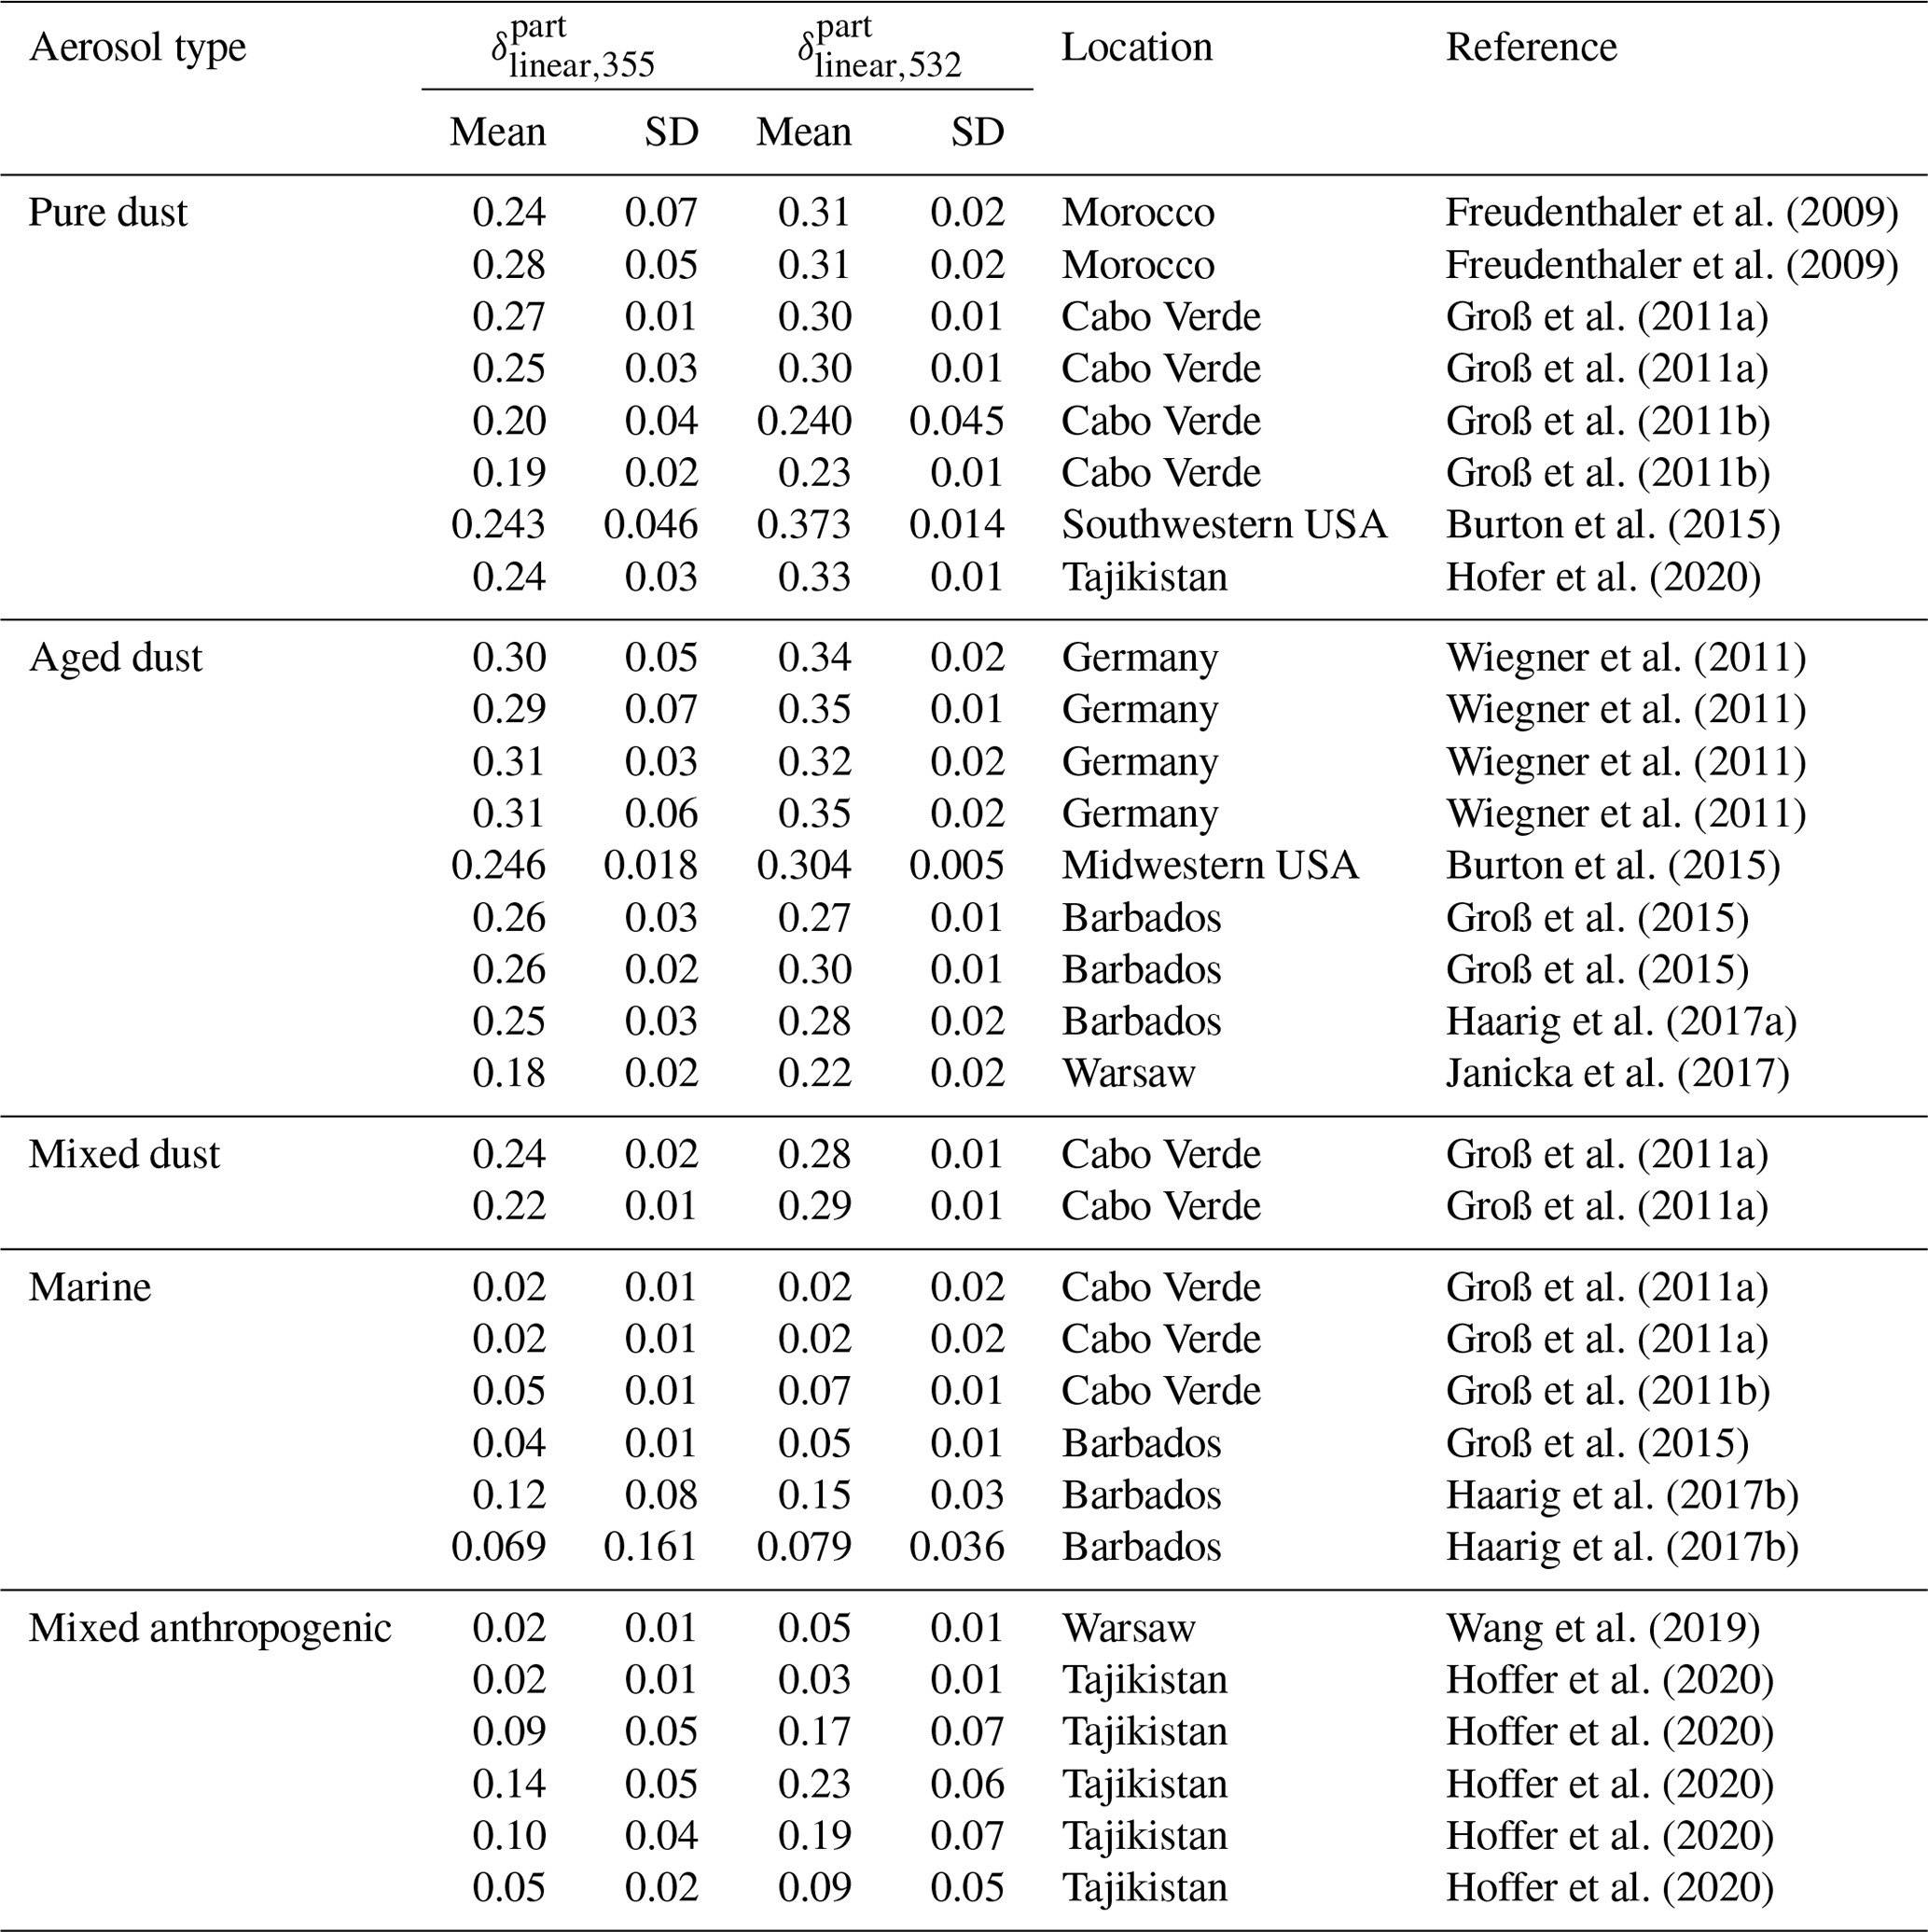
For the calculation of the ground-based Aeolus-like profile (Eq. 1), is needed (Eq. 2). PAOLI (Évora) and MULHACEN (Granada) hold only one depolarization channel at 532 nm, whereas the lidar system at Barcelona retrieves depolarization information at 355 and 532 nm. Therefore, the estimation of from is required. Pairs of (, ) obtained from a thorough review of the literature and for different aerosol types are listed in Table 2. The literature provides a modest but significant dataset for different well-characterized aerosol types, including mineral dust (fresh, aged, mixed), marine and mixed anthropogenic aerosol. These three aerosol types are the predominant aerosol types in Barcelona. Although not listed in Table 2, the literature also offers data for volcanic, bioaerosol and biomass burning particles.
Table 2Linear particle depolarization ratios () at 355 and 532 nm (with the corresponding standard deviation) obtained from the literature for dust, marine and mixed anthropogenic aerosol types. It should be noted that is a dimensionless variable.
A linear fit has been applied to the pairs (, ) in order to set up a simple relationship to estimate from (Eq. 3) through the so-called depolarization spectral conversion factor (Kδ). Figure 2 shows the scatterplot of (, ) for dust, marine and mixed anthropogenic aerosol from the literature, which are the aerosol types present in the cases used for the intercomparison. The best linear fit for these types together is obtained for , with a fairly acceptable statistical significance (Pearson correlation coefficient R= 0.99). A similar analysis for the other aerosol types (volcanic, bioaerosol and biomass) is performed with a linear fit calculated for each aerosol type separately. For biomass burning particles (Groß et al., 2011a; Burton et al., 2015; Janicka et al., 2017; Haarig et al., 2018; Hu et al., 2019; Stachlewska et al., 2018 and Ohneiser et al., 2020), is higher than and , with a reliable statistical significance (R=0.98). For bioaerosols (Cao et al., 2010 and Shang et al., 2020), Kδ is significantly smaller (0.46±0.04) and less significant (R= 0.91). For volcanic particles (Groß et al., 2012), (and R= 0.98). The large variability in biomass burning depolarization is related to the aging of smoke particles, whereas it comes from the wide variety of bioaerosols for bioaerosol particles (see, e.g., Cao et al., 2010, where most of the bioaerosol data come from). Multispectral studies for volcanic particles are currently scarce in the literature. Dust and non-dust (generally a mixture of marine and anthropogenic particles) dual-polarization measurements from the system in Barcelona are consistent with the literature. Thus, the literature-derived relation for dust, marine and mixed anthropogenic is corroborated by the experimental values acquired over the Iberian Peninsula.
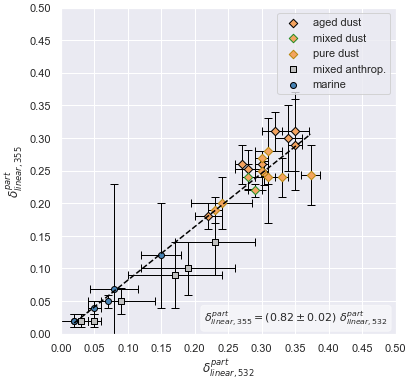
Figure 2Scatterplot of versus for dust, marine and anthropogenic particles obtained from the literature (see Table 2).
The relationships obtained between and (dust plus non-dust, biomass burning, volcanic and bioaerosols; see Fig. 2) aim to serve as a lookup table for any station where only the depolarization channel at 532 nm is available, which is a frequent handicap for many lidar systems worldwide. In the case of the Aeolus overpasses considered in our study, only dust, marine and anthropogenic particles have been identified, with no evidence of biomass, volcanic or bioaerosol particles in significant concentrations. For dust and non-dust types, Kδ equals 0.82±0.02, and this value is implemented from now on in the calculation of the Aeolus-like profile. The literature-derived factor is implemented in order to base the results in previous measurements reported for different environmental conditions and aerosol types, which are subsequently used as a reference in other studies.
4.2 Case studies
A set of case studies is given for the different stations under relevant atmospheric conditions. These case studies illustrate the intercomparison process and serve as graphic examples of the Aeolus performance. Sun-photometer measurements are taken into account for the sake of completeness, through the study of the aerosol optical depth (AOD) at 440 nm (AOD440), the AOD-related Ångström exponent (AE) calculated between the channels at 440 and 870 nm (AOD − AE440–870), the fine-mode fraction at 500 nm (FMF500), the particle size distribution, and the single-scattering albedo (SSA) at 440 and 1020 nm (SSA440 and SSA1020) (e.g., Dubovik et al., 2002; Gobbi et al., 2007; Lee et al., 2010; Foyo-Moreno et al., 2019; Shin et al., 2019). Aerosol Robotic Network (AERONET) Level 1.5 or Level 2.0 products, depending on availability, computed from the version 3 algorithm (Giles et al., 2019) are used.

Figure 3(a) Lidar range-corrected signal measured at 1064 nm in Granada on 5 September 2019. (b) Aeolus SCAmb backscatter retrievals along the considered orbit (6007) with the profile closest to the station marked in red (source: VirES for Aeolus, https://aeolus.services/, last access: 7 January 2022). Quality flags are applied.
The location of the stations is highly interesting due to their proximity to the Sahara Desert and mainland Europe, so frequent events of mineral dust and anthropogenic particles could be detected by the satellite. In addition, Barcelona lies just on the coastline, and both Barcelona and Granada present high concentrations of anthropogenic aerosol, whereas Évora aerosol concentrations could be classified as rural. Thus, Aeolus operation can be tested under a complete set of atmospheric scenarios.
4.2.1 Case study of anthropogenic aerosol: Granada, 5 September 2019
Aeolus overpassed Granada at 18:04 UTC on 5 September 2019 with a horizontal distance of 14 km (from the Aeolus observation middle point). The lidar range-corrected signal time series and the ground track of the satellite are presented in Fig. 3a and b, respectively. As observed in the time series, a significant particle concentration is detected during the whole day up to approximately 4 km a.s.l., with few cirrus clouds between 6 and 14 km a.s.l. Thus, following the ESA requirements (and for the sake of homogeneity), this case is not included in the statistical analysis presented in Sect. 4.3; however, due to its interesting features, it is included as a case study of Aeolus performance. Figure 3b shows Aeolus SCAmb backscatter along the orbit, considering Aeolus quality flags. A significant aerosol layer over North Africa and the southern Iberian Peninsula can be observed.
The HYSPLIT model (Fig. 4) reveals that the air masses over Granada at 18:00 UTC mainly come from two differentiated regions: above roughly 4.3 km a.g.l. (equivalent to 5 km a.s.l., not shown), the air masses traveled the Atlantic from North America, whereas the air masses were mostly stagnant over the Iberian Peninsula below 4.3 km a.g.l. Thus, mostly continental/anthropogenic particles are expected over Granada in the lowermost region.
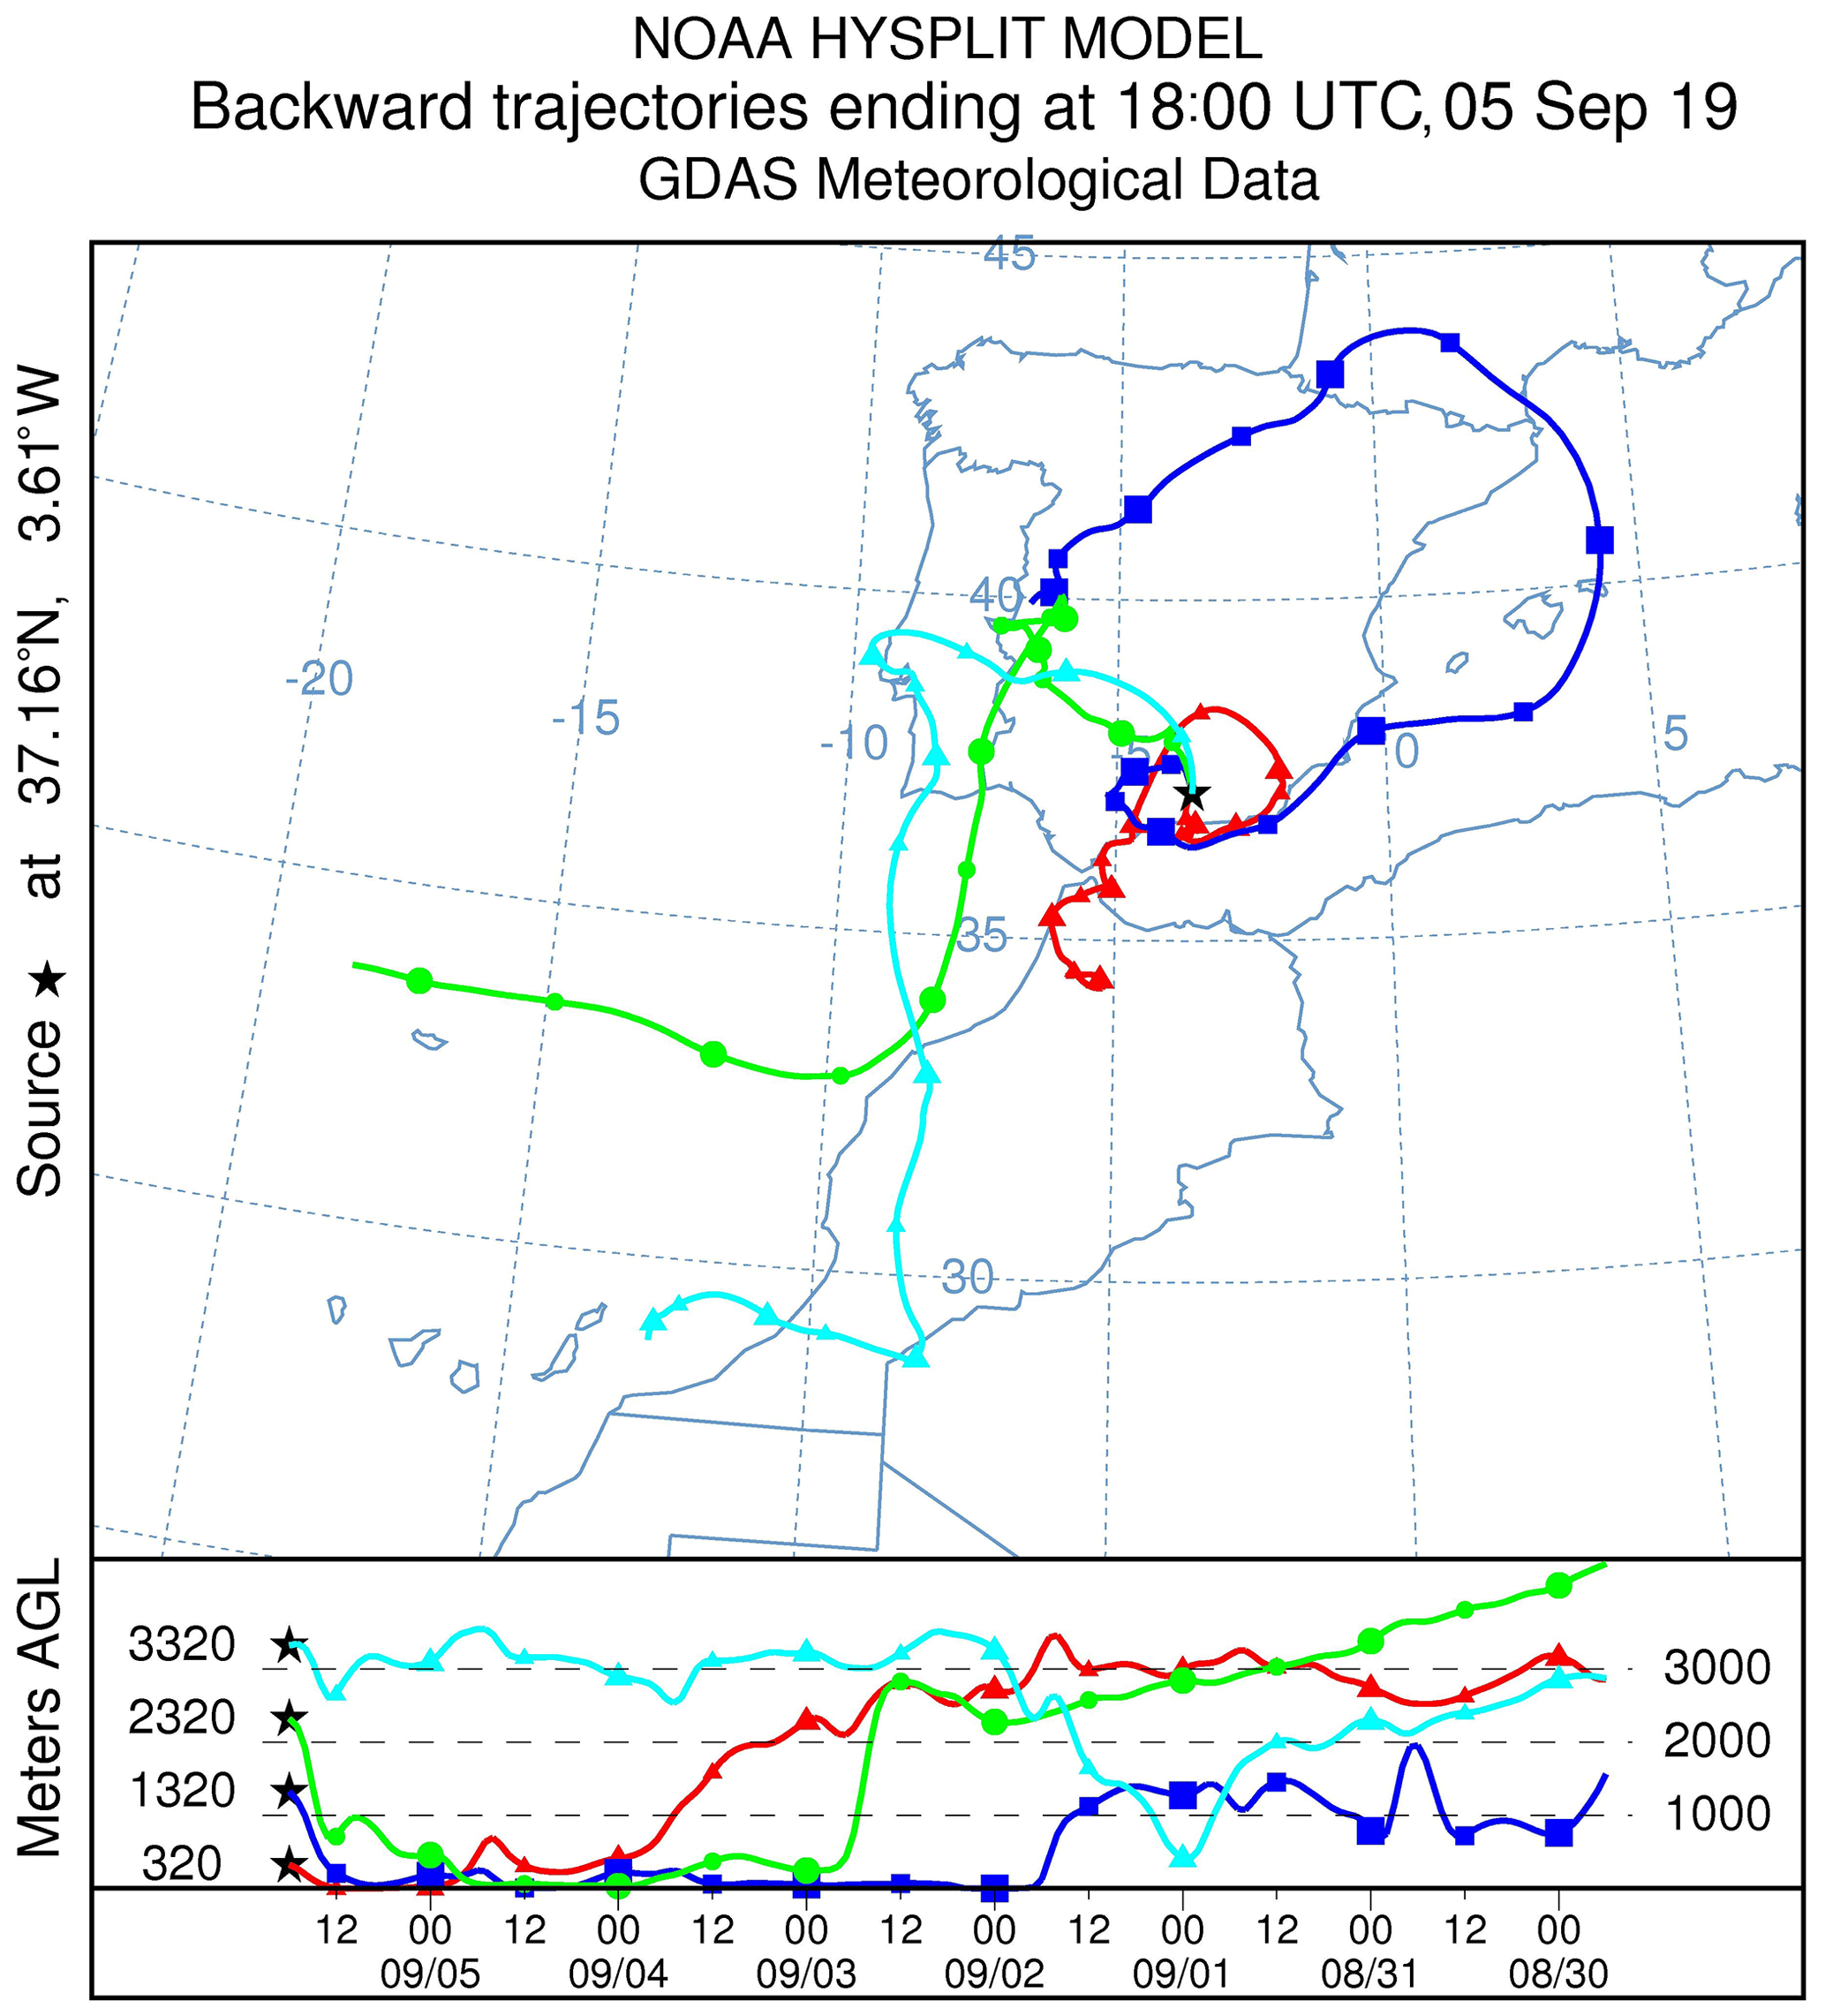
Figure 4HYSPLIT model back trajectories for the air masses over Granada between 0.3 and 3.3 km a.g.l. (equivalent to approximately 1 and 4 km a.s.l., respectively) at 18:00 UTC on 5 September 2019.
The measurements from the co-located Sun photometer (not presented here) suggest a predominance of fine-mode particles during the whole available period. The AOD − AE440–870 values agree with the presence of small particles (continental/anthropogenic aerosol), with a mean value of 1.30±0.08. Furthermore, the AOD440 slightly varies throughout the day, with a mean value of 0.27 ± 0.03. The columnar particle size distribution displays a bimodal distribution in the early morning with a mean effective radius of 0.39 ± 0.06 µm and a SSA around 0.99 for all wavelengths, indicating the presence of non-absorbing particles (Shin et al., 2019).
Figure 5 presents the most relevant vertically resolved quantities measured by Aeolus and the ground-based lidar system in Granada. According to the particle backscatter coefficients at 355 and 532 nm (Fig. 5a), a significant aerosol layer is observed up to approximately 4 km with a clear free troposphere above and a thin cirrus cloud at around 11 km a.s.l. The depolarization channel at 532 nm (Fig. 5b) indicates the homogeneity of the depolarizing particles within the layer, with low values of . Furthermore, the backscatter-related Ångström exponent profile calculated with the 355 and 532 nm lidar channels, β − AE355–532 (not shown here), exhibits values of around 2 for the whole layer and yields the presence of anthropogenic/continental aerosol and the absence of mineral dust particles. The large backscatter coefficient and Ångström exponent values along with low values corroborate the presence of non-depolarizing anthropogenic particles in a part of the aerosol layer. First, the Aeolus satellite properly detects the layer with both SCA and SCAmb (Fig. 5c), in terms of co-polar particle backscatter coefficient values and vertical layering, with an excellent agreement for these bins. Second, for this particular case, SCAmb retrievals present a better agreement with ground-based measurements than SCA retrievals. Third, the satellite performance presents a surface-related effect for their lowermost bins, retrieving a large and unreasonable co-polar particle backscatter coefficient. Fourth, the cirrus cloud shown in Fig. 3a is well retrieved by SCA but not by SCAmb. The implementation of Aeolus quality flags (Fig. 5d) produces a notable decrease in the amount of available data points. In this case, quality flags do not seem to help in cloud screening of the satellite data (at 11 km a.s.l., Aeolus retrievals are the same with and without quality flags). However, SCA retrievals are improved because the quality flags exclude the negative particle backscatter coefficients found between 6 and 9 km a.s.l.

Figure 5Vertical profiles for the case study in Granada on 5 September 2019: (a) ground-based particle backscatter coefficient profiles at 355 and 532 nm with their uncertainties; (b) ground-based volume and linear particle depolarization ratios at 532 nm and the derived circular particle depolarization ratio at 355 nm; (c) Aeolus SCA and SCAmb co-polar particle backscatter coefficients (without quality flags) and the corresponding ground-based Aeolus-like backscatter coefficient. Panel (d) is the same as panel (c) but considering preliminary quality flags. Ground-based lidar profiles were obtained from the continuous measurement of the system from 18:00 to 18:30 UTC. Satellite-based profiles correspond to the Aeolus overpass at 18:04 UTC.
4.2.2 Case study of mineral dust: Évora, 28 June 2019
Aeolus overpassed Évora at 18:17 UTC on 28 June 2019 with a horizontal distance of 61 km (from the Aeolus observation middle point). The time series of the lidar range-corrected signal at 355 nm and the ground track of the satellite are presented in Fig. 6a and b, respectively. A notable and homogeneous layer can be identified throughout the whole day below 3 km a.s.l. Furthermore, there is no evidence of cloud presence above the station. Figure 6b shows the Aeolus SCAmb backscatter retrievals along the orbit with the quality flags applied. A homogeneous layer can be seen over the western side of the Iberian Peninsula, with a wider vertical extension over Morocco.
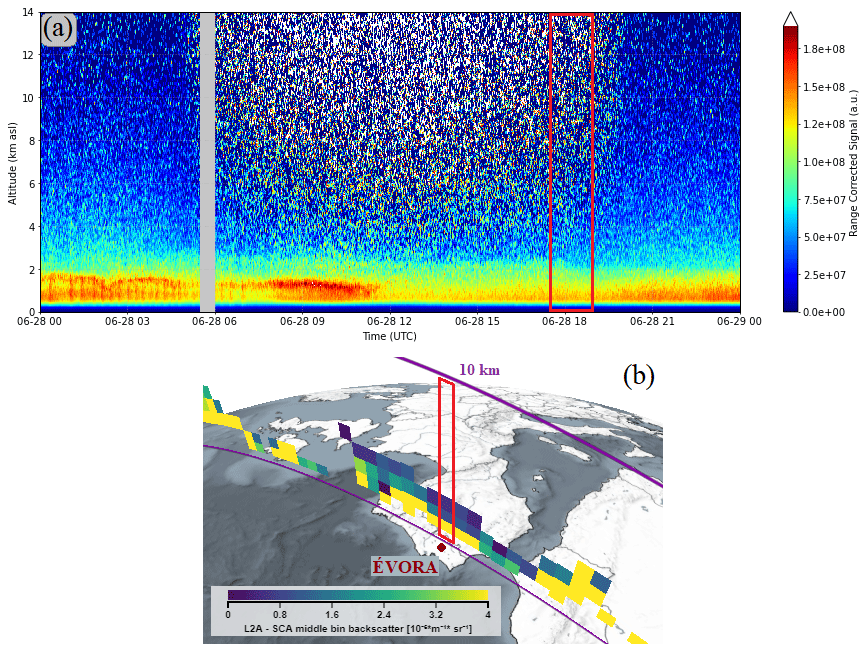
Figure 6(a) Lidar range-corrected signal measured with the 355 nm channel in Évora on 28 June 2019. (b) Aeolus SCAmb backscatter retrievals along the considered orbit (4913) with the profile closest to the station marked in red (source: VirES for Aeolus, https://aeolus.services/, last access: 7 January 2022). Quality flags are applied.
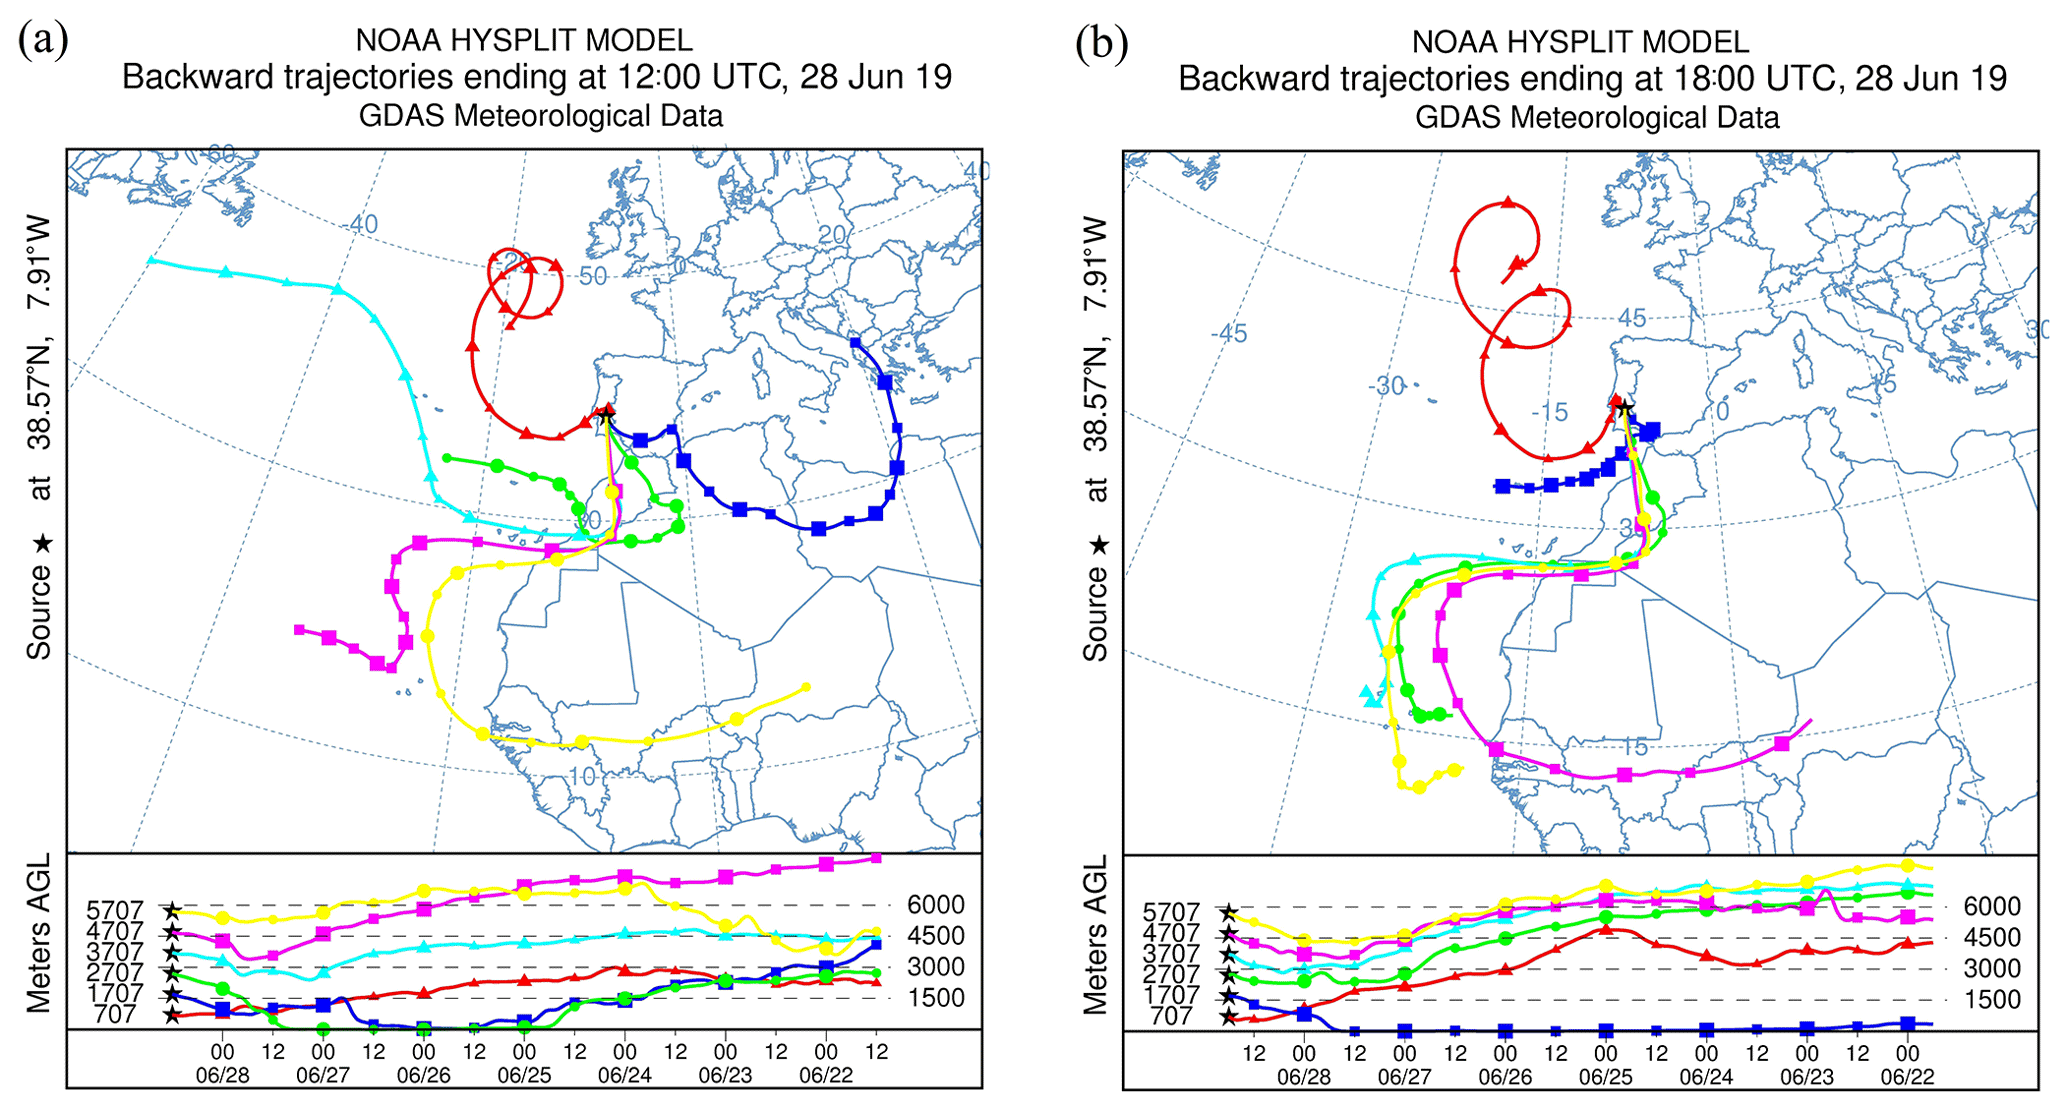
Figure 7HYSPLIT model back trajectories for the air masses over Évora between 0.7 and 5.7 km a.g.l. (equivalent to 1 and 6 km a.s.l., respectively) on 28 June 2019 at (a) 12:00 UTC and (b) 18:00 UTC.
The HYSPLIT model indicates that the air mass located over Évora at 1.7 and 2.7 km a.g.l. (equivalent to 2 and 3 km a.s.l., respectively) at 12:00 UTC originates from the surface level of North Africa (Fig. 7a). The back trajectories of the air masses over Évora at 18:00 UTC (Fig. 7b), closer in time to Aeolus overpass, still indicate an origin of lower altitudes over the African continent for the air masses at 1.7 km a.g.l. but no longer for 2.7 km a.g.l. Both the Barcelona Supercomputing Center–Dust REgional Atmospheric Model (BSC-DREAM8b) and the Navy Aerosol Analysis and Prediction System (NAAPS), which are not shown here, indicate the presence of low but non-negligible concentrations of mineral dust particles over the region at 18:00 UTC.
The co-located Sun-photometer measurements (Fig. 8) suggest the predominance of coarse-mode particles until approximately 09:30 UTC. From 09:30 UTC on, fine-mode particles dominate. The AOD − AE440–870 (Fig. 8a) agrees with the presence of a mineral dust layer over the station during the first half of the day, with a mean value of 0.70 ± 0.07. This value remains between approximately 0.88 and 1.12 during the second half of the day, indicating that the dust episode is vanishing over Évora. The AOD indicates that the possible mineral dust layer over the first half of the day does not present large concentrations of mineral particles, although these values are far from representing a clean atmosphere. The columnar size distribution endorses this hypothesis, with the predominance of large particle radii during the morning and a decrease in the concentration of large particles after noon, with mean total effective radii of 0.60 ± 0.02 and 0.47 ±0.03 µm, respectively. The SSA corroborates the presence of mineral dust during the day (Fig. 8b), with a positive difference SSA1020 − SSA440 of +0.04 in the morning and a difference of almost zero (−0.001) in the late afternoon. Thus, the models and the Sun-photometer measurements indicate the presence of a minor mineral dust episode over Évora that vanishes in the afternoon. The satellite overpass takes place at 18:17 UTC, when the dust episode is practically finished and the dust concentration is low. At that time, AOD440 takes a value of 0.18 while AOD − AE440–870 reaches 1.04.
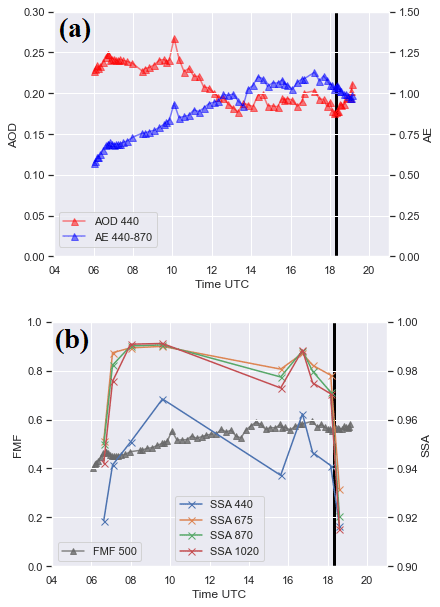
Figure 8Sun-photometer data retrieved by AERONET at Évora on 28 June 2019 for (a) AOD440 and AOD − AE440–870 and for (b) the fine-mode fraction at 500 nm (FMF500) and the multiwavelength SSA daily series. The black vertical line indicates the Aeolus overpass.
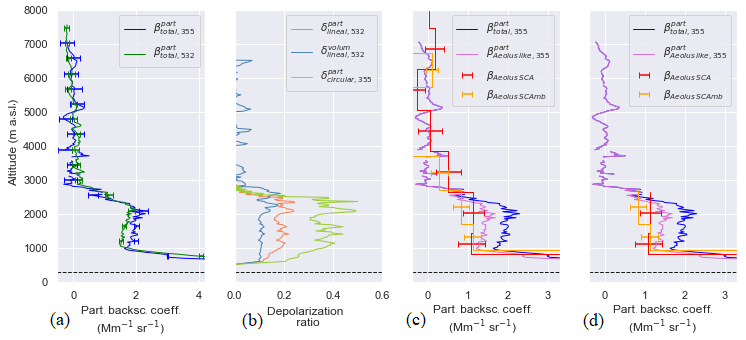
Figure 9Vertical profiles for the case study in Évora on 28 June 2019: (a) ground-based particle backscatter coefficient profiles at 355 and 532 nm with their uncertainties; (b) ground-based volume and linear particle depolarization ratios at 532 nm and the derived circular particle depolarization ratio at 355 nm; (c) Aeolus SCA and SCAmb co-polar particle backscatter coefficients (without quality flags) and the corresponding Aeolus-like ground-based backscatter coefficient. Panel (d) is the same as panel (c) but considering preliminary quality flags. Ground-based lidar profiles were obtained from the continuous measurement of the system from 17:30 to 19:00 UTC. Satellite-based profiles correspond to the Aeolus overpass at 18:17 UTC.
Figure 9 presents the most relevant vertically resolved quantities measured by Aeolus and the ground-based lidar system in Évora. A well-defined layer in the lowermost atmosphere is detected by the lidar at both 355 and 532 nm (Fig. 9a). The lidar (Fig. 9b) agrees with the presence of mineral dust particles mixed with other non-polarizing particles. Furthermore, β − AE355–532 profiles (not shown here) take values close to zero, corresponding to mineral dust particles (e.g., Müller et al., 2007; Guerrero-Rascado et al., 2009; Preißler et al., 2011; Fernández et al., 2019), throughout the vertical range of the detected layer. Aeolus detects this layer using both SCA and SCAmb (Fig. 9c). First, a fair agreement between the satellite and ground-based systems is achieved throughout the profile. Second, this case study leaves no doubts that the proposed Aeolus-like conversion of the total component ground-based backscatter profiles to co-polar component profiles has to be considered. Third, no significant difference is detected between SCA and the SCAmb intercomparison results for this case. Fourth, Aeolus behaves stably above the layer, measuring particle co-polar backscatter coefficients close to zero in the free troposphere, although sometimes it retrieves negative and meaningless values. Fifth, the satellite presents a surface-related effect for the lowermost bin, retrieving large (and unrealistic) co-polar particle backscatter coefficients. In the final stage, quality flags are applied to Aeolus measurements (Fig. 9d), presenting a notable decrease in the amount of available Aeolus values to perform the intercomparison. These quality flags limit the intercomparison to the layers with significant aerosol loads, preventing the intercomparison of Aeolus behavior in the free troposphere. Moreover, current preliminary quality flags do not prevent surface-related effects on the final Aeolus measurements.
4.2.3 Case study of smoke and mineral dust mixture: Barcelona, 2 July 2019
Aeolus overpassed the city of Barcelona at 17:39 UTC on 2 July 2019 with a horizontal distance of 35.17 km (from the Aeolus observation middle point). Figure 10a presents the time series of the lidar range-corrected signal at the 1064 nm channel, and the ground track of the satellite is presented in Fig. 10b. A significant aerosol layer, which is itself stratified in thinner layers, is detected up to 2.5 km a.s.l., as well as a sparse small layer above, between 2.5 and 4 km a.s.l. Figure 10b also presents the Aeolus SCAmb co-polar backscatter retrievals along the orbit with the quality flags applied. Figure 10b displays Aeolus SCAmb co-polar backscatter coefficients along the considered orbit applying the quality flags. A significant layer is captured by the satellite above France, the northwestern part of the Iberian Peninsula and the Mediterranean Sea.
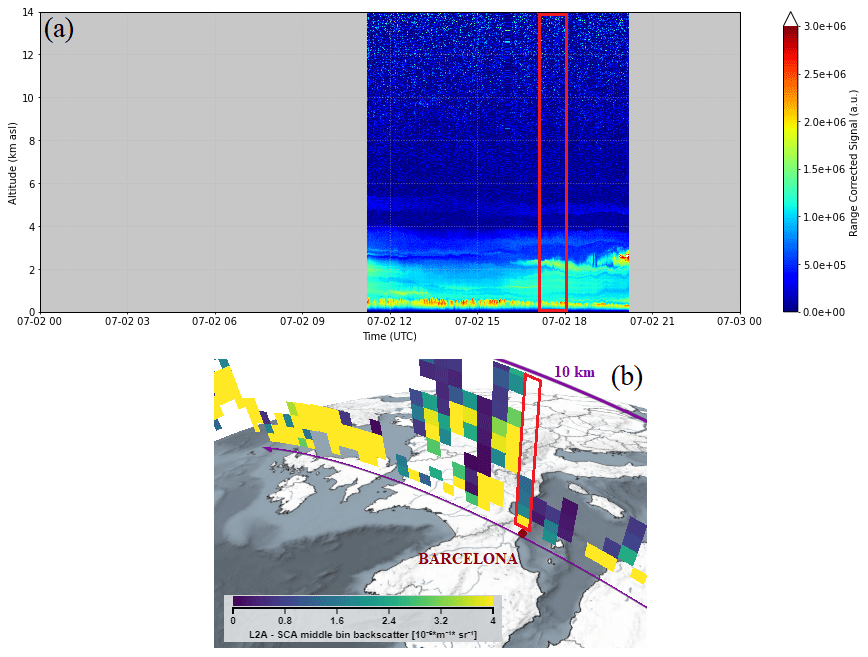
Figure 10(a) Lidar range-corrected signal measured with the 1064 nm channel in Barcelona on 2 July 2019. (b) Aeolus SCAmb backscatter retrievals along the considered orbit (4976), with the profile closest to the station marked in red (source: VirES for Aeolus, https://aeolus.services/, last access: 7 January 2022). Quality flags are applied.
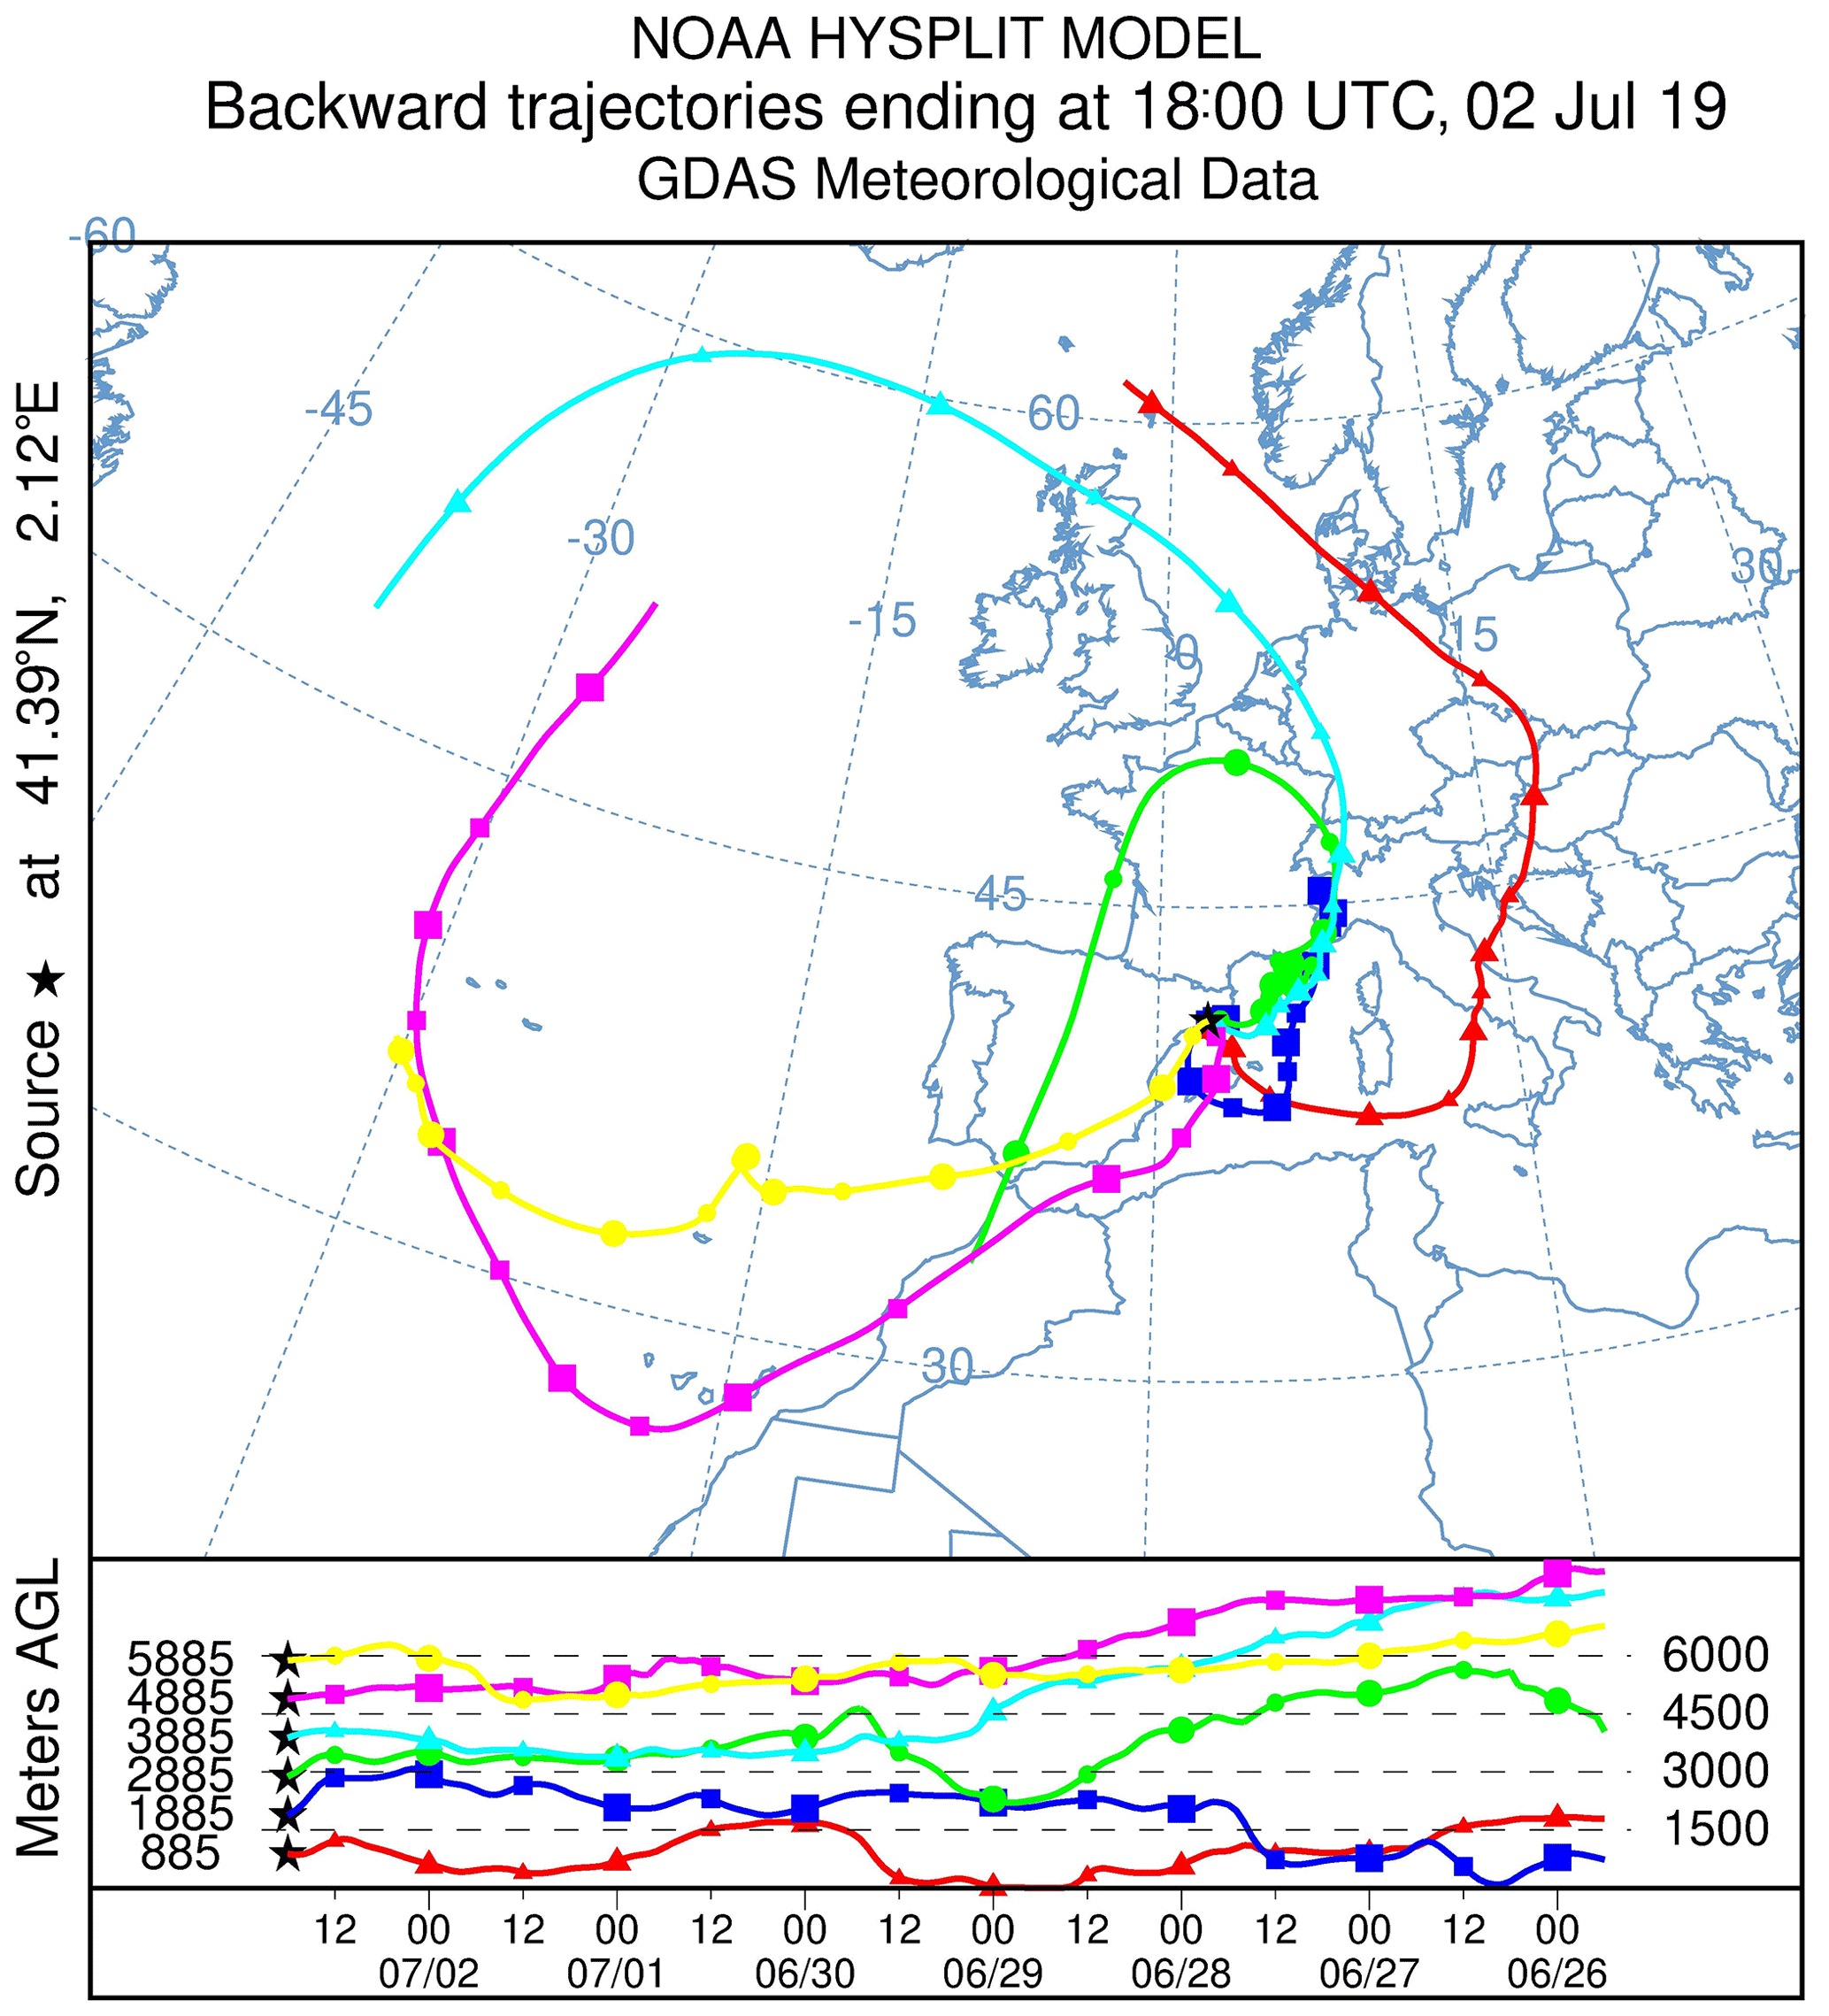
Figure 11HYSPLIT model back trajectories for the air masses between 0.9 and 5.9 km a.g.l. (equivalent to 1 and 6 km a.s.l., respectively) over Barcelona at 18:00 UTC on 2 July 2019.
The HYSPLIT model indicates that the air masses over Barcelona at 18:00 UTC between approximately 1.9 and 2.9 km a.g.l. (equivalent to 2 km and 4 km a.s.l., respectively) come directly from southeastern France/northwestern Italy (Fig. 11). In particular, the air masses at 1.9 km a.g.l. have the typical pattern of local recirculation and might carry pollutants from southern France. Additionally, the NAAPS model (not shown here) yields the presence of significant smoke concentrations over southeastern France/northwestern Italy during the previous days. Furthermore, Moderate Resolution Imaging Spectroradiometer (MODIS) measurements from both Aqua and Terra (not shown here) reveal the existence of wildfires in southeastern France/northwestern Italy.
The co-located Sun-photometer retrievals indicate the predominance of fine-mode particles throughout the day. The daily mean AOD − AE440–870 is 1.43±0.13, while the AOD440 also remains constant throughout the day, with a mean value of 0.29 ± 0.05. The particle size distribution presents two distinct modes, with a mean effective radius of approximately 0.39 ± 0.04 µm, where the fine mode dominates. This distribution is constant over the day. After noon, all of the retrieved SSA1020 lie below 0.95, suggesting the prevalence of absorbing particles (Shin et al., 2019). On the other hand, for all of the available sets of SSA1020 and SSA440, the difference SSA1020 − SSA440 is negative, so the presence of mineral dust is discarded (Dubovik et al., 2002). These Sun-photometer measurements suggest the presence of a smoke layer over the station during the whole day. Aeolus overpassed the station at 17:39 UTC, when the values of AOD440 and AOD − AE440–870 are 0.30 and 1.47, respectively.
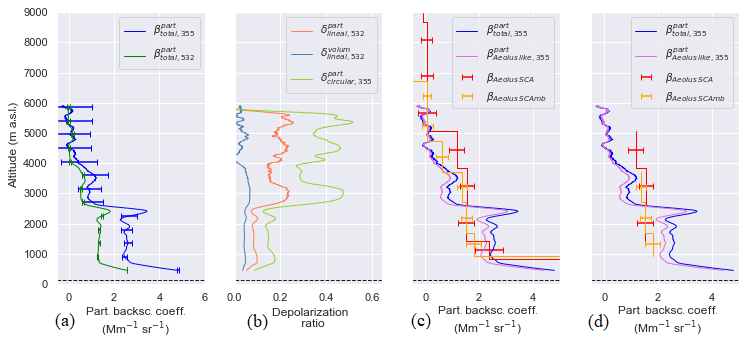
Figure 12Vertical profiles for the case study in Barcelona on 2 July 2019: (a) ground-based particle backscatter coefficient profiles at 355 and 532 nm with their uncertainties; (b) ground-based volume and linear particle depolarization ratios at 532 nm and the derived circular particle depolarization ratio at 355 nm; (c) Aeolus SCA and SCAmb co-polar particle backscatter coefficients (without quality flags) and the corresponding ground-based Aeolus-like backscatter coefficient. Panel (d) is the same as panel (c) but considering preliminary quality flags. Ground-based lidar profiles were obtained from the continuous measurement of the system from 17:09 to 18:09 UTC. Satellite-based profiles correspond to the Aeolus overpass at 17:39 UTC.
The most relevant vertically resolved properties measured by Aeolus and the ground-based lidar in Barcelona are represented in Fig. 12. The ground-based lidar detects the presence of several layers: a non-depolarizing aerosol layer up to approximately 2.5 km a.s.l. and a depolarizing layer above 2.5 km a.s.l. (Fig. 12a, b). From 2.5 to 6 km, the particle backscatter coefficient decreases significantly while increases with respect to the lower layer up to values close to 0.2. Such high values for smoke particles have been observed recently by Khaykin et al. (2018), Haarig et al. (2018), Sicard et al. (2018) and Hu et al. (2019), but they were produced by aged smoke and observed at high altitudes, which is not the case here. Another possible and more plausible explanation is the mixture of mineral dust and smoke, which also produces such high values of (Groß at el., 2011a). Indeed, the Iberian Peninsula was unusually and frequently hit by dust episodes during June–July 2019 (Córdoba-Jabonero et al., 2021). β − AE355–532 profiles (not presented here) exhibit values of around 1.50 in the lower layer and 1.25 between 2.5 and 4 km a.s.l. These values are in accordance with the values reported in the literature for Iberian smoke (Alados-Arboledas et al., 2011; Pereira et al., 2014) and anthropogenic particles (Lyamani et al., 2006; Alados-Arboledas et al., 2011). First, the satellite presents a satisfactory agreement with the ground-based lidar in the whole available profile using both SCA and SCAmb (Fig. 12c). Second, the satellite clearly detects a layer up to approximately 5 km a.s.l. Third, SCA retrieves stable near-zero values in the free troposphere, although some are negative and meaningless. Fourth, the surface-related effect is present in the lowermost bins. In this case, Aeolus quality flags (Fig. 12d) seem to remove the surface-related effect; however, again, they do not allow for an investigation of the Aeolus performance in the free troposphere.
4.3 Statistical analysis
This section assesses the intercomparison of Aeolus SCA and SCA middle bin products with ground-based measurements from a statistical point of view. The process is performed considering Aeolus quality flags to achieve a further understanding of the products. Moreover, ground-based measurements are cloud screened (Granada case study for 5 September 2019, see details in Sect. 4.2.1, is removed as well). Taking the requirements and considerations presented in Sect. 3 into account, the initial database is largely reduced, in order to ensure the reliability of the intercomparison. From the initially available measurements, 101 B10 overpasses for Granada, 51 for Évora and 52 for Barcelona were considered, and after applying the set of requirements, the intercomparison was performed with 21 cases for Granada, 15 cases for Évora and 16 cases for Barcelona, leading to a wide dataset of cases.
First, we address the general performance of the satellite, with emphasis on the domain of Aeolus co-polar particle backscatter coefficient retrievals. On the one hand, Fig. 13a shows that Aeolus SCA retrievals range from approximately −2 Mm−1 sr−1 to large and unrealistic values that are associated with the surface-related effect shown by the satellite. On the other hand, Aeolus SCAmb retrievals range from 0 Mm−1 sr−1 to similarly large and unrealistic values (Fig. 13b). The mentioned large values (86 Mm−1 sr−1 in the case of SCA and 68 Mm−1 sr−1 in the case of SCAmb) can be considered as unrealistic when compared to particle backscatter coefficients detected during extreme events on the Iberian Peninsula (e.g., Guerrero-Rascado et al., 2009; Preißler et al., 2011; Cazorla et al., 2017; Fernández et al., 2019). With the implementation of the quality flags (Fig. 13c, d), any of the sets present negative backscatter coefficients. In fact, a little more than one out of every three SCA values (35.5 %) are negative. Additionally, unrealistic values are still flagged as valid after the application of the quality flags, although the amount is slightly reduced in absolute terms but not in relative terms. Actually, the maximum values mentioned are still flagged as valid, 86 and 68 Mm−1 sr−1 in the case of SCA and SCAmb, respectively. In the case of the dataset without the quality flag filtering, SCA presents 28 measurements above 7 Mm−1 sr−1 (used here to delimit unrealistic values) (6.6 % of all 425 measurements) whereas SCAmb presents 23 (6.6 % of all 346 measurements). After the quality flag filtering of the dataset, 27 values (28.1 % of all 96 measurements) above 7 Mm−1 sr−1 can be found for SCA and 20 (26.6 % of all 75 measurements) are found for SCAmb. Regarding the unfiltered dataset, the number of values above 7 Mm−1 sr−1 is negligible, although their effects on the statistical results of the lowermost regions can be observed, as will be addressed further on. On the contrary, the amount of values above 7 Mm−1 sr−1 is substantial and relevant for the filtered dataset, as the number of values below 7 Mm−1 sr−1 is dramatically reduced.
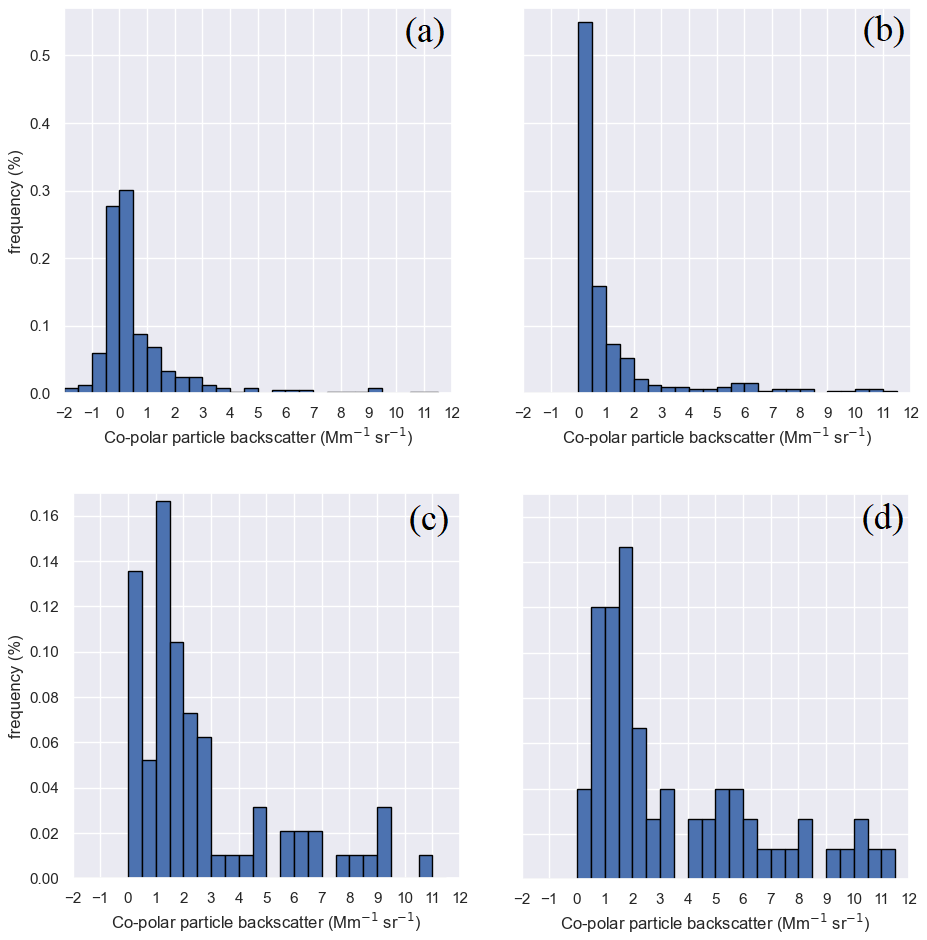
Figure 13Histograms for the dataset, considering the three stations, of (a) the Aeolus SCA co-polar backscatter coefficient without the implementation of quality flags and (b) the Aeolus SCAmb co-polar backscatter coefficient without the implementation of quality flags. Panels (c) and (d) are the same as panels (a) and (b) , respectively, but considering quality flags.
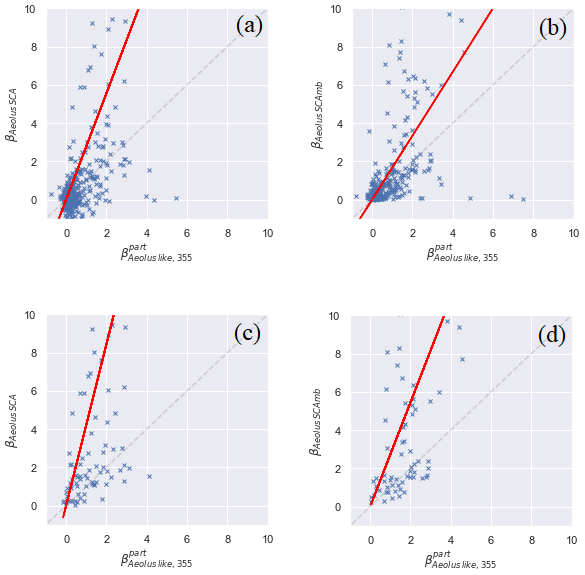
Figure 14(a) and βAeolus SCA of the dataset, considering the three stations, with no quality flags applied. (b) and βAeolus SCAmb of the dataset, considering the three stations, with no quality flags applied. Panels (c) and (d) are the same as panels (a) and (b), respectively, but considering quality flags. The values of each dataset have been adjusted to a linear model with a null intercept (red line).
Figure 14a and b present and values, which do not fit any linear or nonlinear relation. The linear fit of each dataset (red lines in Fig. 14) is not good (R smaller than 0.4 in all cases). Several types of relationship were tested, and no valid model was found. Quality flagged data (Fig. 14c, d) worsen the linear relationship (R smaller than 0.25 in both cases). The same analysis has been performed for each station separately (not presented here) in order to search potential particularities of each site. Analogous and unsatisfactory results were found with the dataset of each station.
4.3.1 Granada
The statistical results for Granada are obtained from the 21 selected cases (205 SCA data points and 162 SCAmb data points). Aeolus retrieves co-polar particle backscatter coefficients from approximately 32 km to the ground level (downward view). However, due to the station's altitude (680 m a.s.l.) and the lidar full overlap height, no matching measurements are available between 0 and 1 km a.s.l. (Fig. 15). On the one hand, Aeolus products present a significant surface-related effect for the lowermost regions, between 1 and 2 km a.s.l. Thus, the satellite strongly overestimates the co-polar particle backscatter coefficient in the 1 to 2 km a.s.l. vertical range (with no quality flag implementation; Fig. 15a–d), with an SCA Δ of around 11 Mm−1 sr−1 and an RMSE of around 18 Mm−1 sr−1 along with an SCAmb Δ around 8 Mm−1 sr−1 and an RMSE around 7 Mm−1 sr−1. This surface effect may also impact the 2 to 3 km a.s.l. range to a lesser extent. Figure 15a and b show that the general performance of SCA underestimates particle backscatter coefficients from 3 to 11 km a.s.l., with a fair Δ value, smaller than 0.4 Mm−1 sr−1 in any case, and an RMSE lower than 1 Mm−1 sr−1 (average values of −0.16 ± 0.04 and 0.6 ± 0.2 Mm−1 sr−1, respectively). On the other hand, Figure 15c shows that SCAmb does not present any trend between 2 and 11 km a.s.l., with the Δ values oscillating around zero, between −0.10 and 0.35 Mm−1 sr−1 (average value of 0.04 ± 0.10 Mm−1 sr−1). For this algorithm, the RMSE (Fig. 15d) lies below 0.7 Mm−1 sr−1 in every range above 3 km a.s.l. (average value of 0.35 ± 0.14 Mm−1 sr−1). SCAmb-derived RMSE values are smaller than those obtained with SCA in every vertical range. Thus, a better agreement is found between the satellite and the ground-based measurements with SCAmb. Furthermore, with the quality flag implementation (Fig. 15e–h), the number of available measurements flagged as valid is largely diminished (one out of four SCA or SCAmb values), especially above 3 km a.s.l. Therefore, the statistical significance of the results is also reduced, and the reliable results are limited to the lowermost ranges. Additionally, after quality flag consideration between 2 and 4 km a.s.l., i.e., the statistically significant ranges, SCA and SCAmb RMSE values increase to 16 % and 42 %, respectively. The use of the quality flags worsens the average agreement between the satellite and the ground-based system and does not avoid the surface-related effect on the measurements.
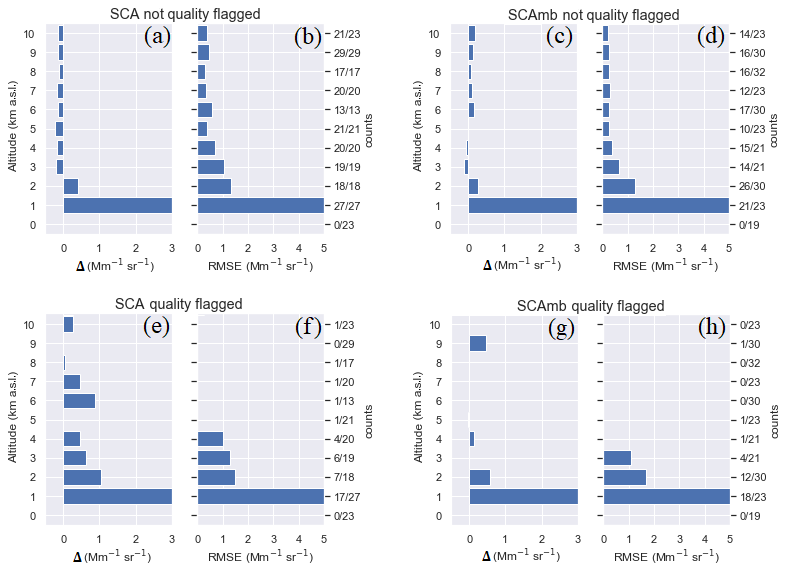
Figure 15Statistical results for the intercomparison of Aeolus SCA and SCAmb products with Granada ground-based measurements, with and without quality flags. The right-hand axis indicates the number of available data points included in each vertical range out of the total number of measurements within that vertical range. The (a) difference (Δ) and (b) RMSE of the intercomparison of the SCA products without quality flags applied. The (c) Δ and (d) RMSE of the intercomparison of the SCAmb products without quality flags applied. Panels (e) and (f) are the same as panels (a) and (b), respectively, but considering quality flags. Panels (g) and (h) are the same as panels (c) and (d), respectively, but considering quality flags.
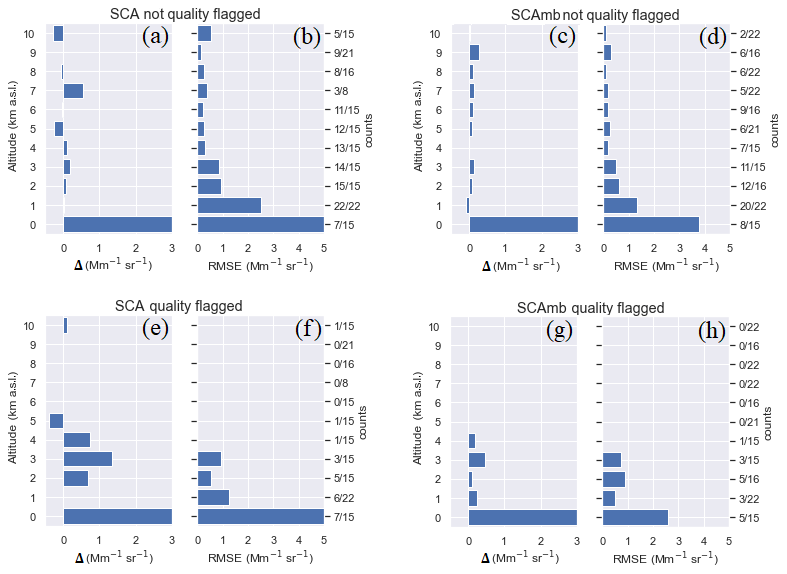
Figure 16Statistical results for the intercomparison of Aeolus SCA and SCAmb products with Évora ground-based measurements, with and without quality flags. The right-hand axis indicates the number of available data points included in each vertical range out of the total number of measurements within that vertical range. The (a) difference (Δ) and (b) RMSE of the intercomparison of the SCA products without quality flags applied. The (c) Δ and (d) RMSE of the intercomparison of the SCAmb products without quality flags applied. Panels (e) and (f) are the same as panels (a) and (b), respectively, but considering quality flags. Panels (g) and (h) are the same as panels (c) and (d), respectively, but considering quality flags.
4.3.2 Évora
In the case of Évora, the statistical results are derived from 15 selected cases (150 SCA data points and 108 SCAmb data points). Figure 16 indicates that a few matching measurements in the vertical range from 0 to 1 km a.s.l. could be found for this lidar system, due to the station's altitude (293 m a.s.l.). On the one hand, the surface-related effect is also present in all cases in the lowermost regions, from 0 to 2 km a.s.l., with the vertical range from 0 to 1 km clearly more affected by this effect. In these regions Aeolus largely overestimates the co-polar particle backscatter coefficient (Fig. 16a–d) with an SCA Δ of around 11 Mm−1 sr−1 and an RMSE of around 7 Mm−1 sr−1 along with an SCAmb Δ of around 5 Mm−1 sr−1 and an RMSE around 4 Mm−1 sr−1. Therefore, the SCAmb retrieval is less affected by the surface effect. On the other hand, an inhomogeneous performance is observed for SCA above 2 km a.s.l. (Fig. 16a), with Δ values ranging from −0.2 to 0.5 Mm−1 sr−1 (average value of 0.02 ± 0.24 Mm−1 sr−1). Additionally, an average RMSE value of 0.4 ± 0.2 Mm−1 sr−1 is obtained for the vertical ranges above 2 km a.s.l. (Fig. 16b). SCAmb (Fig. 16c, d) seems to overestimate the particle backscatter coefficient from 2 to 11 km a.s.l., although a fair agreement with ground-based measurements is observed (average Δ value of 0.11 ± 0.08 Mm−1 sr−1 and RMSE of 0.25 ± 0.11 Mm−1 sr−1). Therefore, the SCAmb retrievals present a better agreement with ground-based measurements than SCA. The number of selected cases is smaller for Évora than for Granada, but it is still statistically significant. However, with the implementation of the quality flags (Fig. 16e–h), the amount of valid matching measurements is drastically reduced (only one out of five SCA values and one out of six SCAmb values), and the results cannot be considered statistically significant in any range. The only improvement in the agreement between the systems is observed between 1 and 2 km a.s.l., but the statistical significance has to be taken into account. Again, the application of the quality flags does not avoid the surface-related effect on the final results.
4.3.3 Barcelona
The statistical results for Barcelona are derived from 16 selected matching cases (80 SCA data points and 76 SCAmb data points). In Barcelona, the validation process of the particle backscatter coefficient cuts the profiles where the aerosol layers end, so the vertical coverage usually does not extend higher than 5 or 6 km a.s.l. (depending on the atmospheric conditions). Thus, no statistical intercomparison could be performed above this altitude. Furthermore, the station lies at a very low altitude above sea level (115 m a.s.l.), and its full overlap height (between 400 and 500 m a.g.l.) allows us to work with a significant amount of matching values between 0 and 1 km a.s.l., the vertical range which is most affected by the surface (Fig. 17). Between 0 and 1 km a.s.l. Aeolus largely overestimates co-polar particle backscatter coefficients (with no quality flag implementation; Fig. 17a–d), with an approximate SCA Δ of 15 Mm−1 sr−1 and an RMSE of 15 Mm−1 sr−1 along with an SCAmb Δ of around 9 Mm−1 sr−1 and an RMSE of around 16 Mm−1 sr−1. However, possible surface-related effects can be noted in the case of the SCA retrievals between 1 and 4 km a.s.l. (Fig. 17b), where an average RMSE of 1.5 ± 0.1 Mm−1 sr−1 is observed. This could be explained by the complex terrain orography below the Aeolus ground-track, mostly affected by the transition from sea to land, with the Catalan Pre-Coastal Range situated only 15 km from the coast and reaching almost 1000 m a.s.l. On the contrary, SCAmb seems to be partially affected between 1 and 2 km a.s.l. (Fig. 17d) and to a lesser extent (1.4 Mm−1 sr−1). Therefore, SCAmb is more robust to the surface effects. Nevertheless, Aeolus does not present a trend above 1 km a.s.l. with SCA nor with SCAmb (Fig. 17a, c), and the Δ values ranges from −0.5 to 0.8 Mm−1 sr−1 and from −0.2 to 0.3 Mm−1 sr−1, respectively. In the rest of the available vertical ranges, Aeolus presents a slightly better agreement with the ground-based system using SCAmb, with RMSE values below 0.5 Mm−1 sr−1 between 2 and 7 km a.s.l. Finally, when quality flags are applied (Fig. 17e–h), the amount of valid matching measurements is reduced (almost two out of five SCA values and two out of seven SCAmb values), affecting the statistical significance of the results. Additionally, after the quality flag consideration between 1 and 3 km a.s.l., i.e., the statistically significant vertical ranges, SCA RMSE values increase by 25 % and SCAmb RMSE values increase by 36 % between 1 and 2 km a.s.l. Thus, quality flag filtering of the dataset worsens the statistical results and does not avoid the surface-related effect.

Figure 17Statistical results for the intercomparison of Aeolus SCA and SCAmb products with Barcelona ground-based measurements, with and without quality flags. The right-hand axis indicates the number of available data points included in each vertical range out of the total number of measurements within that vertical range. The (a) difference (Δ) and (b) RMSE of the intercomparison of the SCA products without quality flags applied. The (c) Δ and (d) RMSE of the intercomparison of the SCAmb products without quality flags applied. Panels (e) and (f) are the same as panels (a) and (b), respectively, but considering quality flags. Panels (g) and (h) are the same as panels (c) and (d), respectively, but considering quality flags.
The Aeolus satellite was launched in 2018. At the time of writing of this article, the longest, fully homogeneous product dataset has been reprocessed in baseline 10 (reprocessed products, B10 version). In this study, we evaluated Aeolus B10 optical products with a thorough analysis of Aeolus co-polar backscatter coefficients under the standard correct algorithm (SCA) and the standard correct algorithm middle bin (SCAmb), and we carried out an effective testing of Aeolus quality flags. This process was performed taking the Cal/Val community and the ESA recommendations into account through the intercomparison of Aeolus products with analogous ground-based measurements taken at the ACTRIS/EARLINET stations of Granada, Évora and Barcelona (southwestern Europe), matching the satellite's overpasses both temporally and spatially (55 cases). However, Aeolus overpasses at each station were analyzed separately, aiming to characterize Aeolus performance under different and relevant atmospheric conditions, aerosol types and orographic features.
We assessed the so-called Aeolus-like conversion of ground-based measurements. Aeolus retrieves the co-polar component of the backscatter coefficient, which is not directly comparable to the total component measured at the surface stations. Thus, the co-polar component of the ground-based measurements has to be derived from the total one. In this work, an approach based on a thorough bibliographic review of dual-polarization measurements for relevant aerosol types, aiming to estimate from , was proposed. A relation of , which is endorsed by dual-polarization measurements in Barcelona, was found. Other Cal/Val teams are encouraged consider the Aeolus-like conversion of the ground-based measurements as well as the implementation of the spectral relationship, if needed, which has proven to be effective in our case studies.
Several types of linear and nonlinear relations were tested, and no valid model was found for and . These results were observed at the three stations, suggesting that they were related to the satellite data characteristics and/or the methodology employed and difficulties inherent to satellite Cal/Val activities rather than to a specific feature of one particular station.
Aeolus SCAmb retrievals presented a better agreement with respect to ground-based measurements than the SCA ones. For the Granada station, the difference between algorithms was less significant, whereas SCAmb presented much better results than SCA for the stations in Évora and Barcelona. Évora presented the highest agreement with the SCAmb retrievals, although the results for Barcelona and Granada were quite satisfactory as well. RMSE profiles obtained with SCAmb are fairly similar for the three stations, providing consistency to the results obtained. Additionally, Aeolus measurements over all three stations presented a critical surface-related effect that caused Aeolus to drastically overestimate the lowermost co-polar backscatter coefficients. Depending on the station and the orography of the region, this effect extended up to higher altitudes. Out of the two algorithms, SCAmb showed more robustness to this surface-related effect, with lower RMSE values in the lowermost ranges. Aeolus quality flag implementation entailed a strong reduction in the amount of Aeolus measurements initially available. For both SCA and SCAmb, approximately 20 % of the data remains after the quality tests. This substantially affected the statistical significance of the results of the filtered dataset. Finally, the statistical intercomparison was not improved after the quality flag application, e.g., the surface effect was not mitigated and an increase of the RMSE (of between 16 % and 36 %) was even observed.
It has been seen that the satellite experiences saturation and retrieves inconsistent and invalid results under significant cloud conditions. Even cirrus conditions can affect the results. However, the presented case study for Granada (5 September 2019) shows that the satellite is able to characterize thin cirrus clouds with a fairly acceptable agreement.
Despite the distance between the overpasses and the stations as well as the fact that Aeolus products are generated by averaging horizontally over 87 km, a good agreement was found between Aeolus retrievals and ground-based lidar measurements, demonstrating that Aeolus has a high potential for the worldwide characterization of the aerosol vertical distributions. However, as can be noted from the results, the Aeolus vertical and horizontal resolution is too coarse (especially compared with other satellites) for a detailed characterization of the nuances of the atmospheric optical properties, especially in regions such as Barcelona, where the coarse horizontal resolution might cover very different orographic features, from a mountainous system to the Mediterranean Sea. Thus, Aeolus provides valuable information on the detection and characterization of significant aerosol and cloud layers.
The code is not publicly accessible; however, readers may contact Juan Luis Guerrero-Rascado (rascado@ugr.es) or Jesús Abril-Gago (jabrilgago@ugr.es) for further information.
Aeolus data files are available from the ESA Aeolus Online Dissemination System (https://aeolus-ds.eo.esa.int, ESA, 2022). The accessibility of these files is limited based on the ESA criteria. EARLINET lidar files are available from the EARLINET Data Portal (https://data.earlinet.org/, EARLINET, 2022). The accessibility of these files is limited based on the EARLINET criteria. AERONET files are publicly available from the AERONET database (https://aeronet.gsfc.nasa.gov/, Goddard Space Flight Center, 2022).
JAG, JLGR, MJC and MS conceptualized the study, developed the methodology, and carried out the investigation and validation. JAG, JLGR, MJC, JABA, MS, DBP, DB, MJGM, ARG, CMP, AC, POA, VS, MMJM and LAA were responsible for data curation and undertook the formal analysis. JAG, JLGR, MJC and MS wrote the original draft of the paper, and JAG, JLGR, MJC, JABA, MS, DBP, MJGM, ARG, AC, POA and LAA reviewed and edited the paper.
The contact author has declared that neither they nor their co-authors have any competing interests.
Publisher’s note: Copernicus Publications remains neutral with regard to jurisdictional claims in published maps and institutional affiliations.
This article is part of the special issue “Aeolus data and their application (AMT/ACP/WCD inter-journal SI)”. It is not associated with a conference.
The analysis in this work has been performed in the framework of the Aeolus Scientific Calibration and Validation Team (ACVT) activities. The authors acknowledge the ESA project “Aeolus L2A aerosol and cloud product validation using the European Aerosol Research Lidar Network EARLINET” (project no. 5166). The ACTRIS-2 Research Infrastructure Project and Implementation Project of the European Union's Horizon 2020 Research and Innovation program (grant nos. 654109 and 871115) and GRASP-ACE (grant no. 778349) are also acknowledged. This work is related to activities within the COST Action CA18235 PROBE (PROfiling the atmospheric Boundary layer at European scale). This work was also supported by the Spanish Ministry of Economy and Competitiveness (project nos. CGL2015-73250-JIN, CGL2016-81092-R, CGL2017-83538-C3-1-R and CGL2017-90884-REDT); the Spanish Ministry of Science and Innovation (project nos. PID2019-103886RB-I00, PID2020-117825GB-C21 and PID2020-120015RB-I00); the Unity of Excellence “María de Maeztu” (project MDM-2016-0600), financed by the Spanish State Research Agency (AEI); the national Portuguese funds, through FCT – Fundação para a Ciência e Tecnologia, I.P. (project nos. UIDB/04683/2020, UIDP/04683/2020, PTDC/CTAMET/29678/2017 and 0753_CILIFO_5_E); and the Regional Government of Andalusia (project no. P18-RT-3820). The authors thankfully acknowledge the FEDER program for the instrumentation used in this work. Maria José Granados-Muñoz has received funding from the European Union's Horizon 2020 Research and Innovation program via a Marie Skłodowska-Curie grant (grant no. 796539). Juan Antonio Bravo-Aranda received funding from the Marie Skłodowska-Curie Action Cofund 2016 EU project – Athenea3i grant (grant no. 754446). Pablo Ortiz-Amezcua received funding from the National Science Centre (NCN, Poland) in the framework of the SONATINA 5 project (project no. DEC-2021/40/C/ST10/00023). Finally, the authors gratefully acknowledge the NOAA Air Resources Laboratory (ARL) for the provision of the HYSPLIT transport and dispersion model and/or READY website (https://www.ready.noaa.gov/index.php, last access: 7 January 2022) used in this publication.
This research has been supported by the FEDER/Junta de Andalucía-Consejería de Transformación Económica, Industria, Conocimiento y Universidades/Project (A-RNM-430-UGR20) and Scientific Units of Excellence Program (grant no. UCE-PP2017-02).
This paper was edited by Eduardo Landulfo and reviewed by three anonymous referees.
Alados-Arboledas, L., Müller, D., Guerrero-Rascado, J. L., Navas-Guzmán, F., Pérez-Ramírez, D., and Olmo, F. J.: Optical and microphysical properties of fresh biomass burning aerosol retrieved by Raman lidar, and star-and sun-photometry, Geophys. Res. Lett., 38, L01807, https://doi.org/10.1029/2010GL045999, 2011.
Amiridis, V., Giannakaki, E., Balis, D. S., Gerasopoulos, E., Pytharoulis, I., Zanis, P., Kazadzis, S., Melas, D., and Zerefos, C.: Smoke injection heights from agricultural burning in Eastern Europe as seen by CALIPSO, Atmos. Chem. Phys., 10, 11567–11576, https://doi.org/10.5194/acp-10-11567-2010, 2010.
Amiridis, V., Marinou, E., Tsekeri, A., Wandinger, U., Schwarz, A., Giannakaki, E., Mamouri, R., Kokkalis, P., Binietoglou, I., Solomos, S., Herekakis, T., Kazadzis, S., Gerasopoulos, E., Proestakis, E., Kottas, M., Balis, D., Papayannis, A., Kontoes, C., Kourtidis, K., Papagiannopoulos, N., Mona, L., Pappalardo, G., Le Rille, O., and Ansmann, A.: LIVAS: a 3-D multi-wavelength aerosol/cloud database based on CALIPSO and EARLINET, Atmos. Chem. Phys., 15, 7127–7153, https://doi.org/10.5194/acp-15-7127-2015, 2015.
Ansmann, A., Wandinger, U., Le Rille, O., Lajas, D., and Straume, A. G.: Particle backscatter and extinction profiling with the spaceborne high-spectral-resolution Doppler lidar ALADIN: Methodology and simulations, Appl. Opt., 46, 6606–6622, https://doi.org/10.1364/AO.46.006606, 2007.
Baars, H., Kanitz, T., Engelmann, R., Althausen, D., Heese, B., Komppula, M., Preißler, J., Tesche, M., Ansmann, A., Wandinger, U., Lim, J.-H., Ahn, J. Y., Stachlewska, I. S., Amiridis, V., Marinou, E., Seifert, P., Hofer, J., Skupin, A., Schneider, F., Bohlmann, S., Foth, A., Bley, S., Pfüller, A., Giannakaki, E., Lihavainen, H., Viisanen, Y., Hooda, R. K., Pereira, S. N., Bortoli, D., Wagner, F., Mattis, I., Janicka, L., Markowicz, K. M., Achtert, P., Artaxo, P., Pauliquevis, T., Souza, R. A. F., Sharma, V. P., van Zyl, P. G., Beukes, J. P., Sun, J., Rohwer, E. G., Deng, R., Mamouri, R.-E., and Zamorano, F.: An overview of the first decade of PollyNET: an emerging network of automated Raman-polarization lidars for continuous aerosol profiling, Atmos. Chem. Phys., 16, 5111–5137, https://doi.org/10.5194/acp-16-5111-2016, 2016.
Baars, H., Ansmann, A., Ohneiser, K., Haarig, M., Engelmann, R., Althausen, D., Hanssen, I., Gausa, M., Pietruczuk, A., Szkop, A., Stachlewska, I. S., Wang, D., Reichardt, J., Skupin, A., Mattis, I., Trickl, T., Vogelmann, H., Navas-Guzmán, F., Haefele, A., Acheson, K., Ruth, A. A., Tatarov, B., Müller, D., Hu, Q., Podvin, T., Goloub, P., Veselovskii, I., Pietras, C., Haeffelin, M., Fréville, P., Sicard, M., Comerón, A., Fernández García, A. J., Molero Menéndez, F., Córdoba-Jabonero, C., Guerrero-Rascado, J. L., Alados-Arboledas, L., Bortoli, D., Costa, M. J., Dionisi, D., Liberti, G. L., Wang, X., Sannino, A., Papagiannopoulos, N., Boselli, A., Mona, L., D'Amico, G., Romano, S., Perrone, M. R., Belegante, L., Nicolae, D., Grigorov, I., Gialitaki, A., Amiridis, V., Soupiona, O., Papayannis, A., Mamouri, R.-E., Nisantzi, A., Heese, B., Hofer, J., Schechner, Y. Y., Wandinger, U., and Pappalardo, G.: The unprecedented 2017–2018 stratospheric smoke event: decay phase and aerosol properties observed with the EARLINET, Atmos. Chem. Phys., 19, 15183–15198, https://doi.org/10.5194/acp-19-15183-2019, 2019.
Baars, H., Herzog, A., Heese, B., Ohneiser, K., Hanbuch, K., Hofer, J., Yin, Z., Engelmann, R., and Wandinger, U.: Validation of Aeolus wind products above the Atlantic Ocean, Atmos. Meas. Tech., 13, 6007–6024, https://doi.org/10.5194/amt-13-6007-2020, 2020.
Baars, H., Radenz, M., Floutsi, A. A., Engelmann, R., Althausen, D., Heese, B., Ansmann, A., Flament, T., Dabas, A., Trapon, D., Reitebuch, O., Bley, S., and Wandinger, U.: Californian Wildfire Smoke Over Europe: A First Example of the Aerosol Observing Capabilities of Aeolus Compared to Ground-Based Lidar, Geophys. Res. Lett., 48, e2020GL092194, https://doi.org/10.1029/2020GL092194, 2021
Bioresita, F., Puissant, A., Stumpf, A., and Malet, J.-P.: A Method for Automatic and Rapid Mapping of Water Surfaces from Sentinel-1 Imagery, Remote Sensing, 10, 217, https://doi.org/10.3390/rs10020217, 2018.
Böckmann, C., Wandinger, U., Ansmann, A., Bösenberg, J., Amiridis, V., Boselli, A., Delaval, A., De Tomasi, F., Frioud, M., Grigorov, I. V., Hågård, A., Horvat, M., Iarlori, M., Komguem, L., Kreipl, S., Larchevêque, G., Matthias, V., Papayannis, A., Pappalardo, G., Rocadenbosch, F., Rodrigues, J. A., Schneider, J., Shcherbakov, V., and Wiegner, M.: Aerosol lidar intercomparison in the framework of the EARLINET project. 2. Aerosol backscatter algorithms, Appl. Opt., 43, 977–989, https://doi.org/10.1364/AO.43.000977, 2004.
Bravo-Aranda, J. A., Navas-Guzmán, F., Guerrero-Rascado, J. L., Pérez-Ramírez, D., Granados-Muñoz, M. J., and Alados-Arboledas, L.: Analysis of lidar depolarization calibration procedure and application to the atmospheric aerosol characterization, Int. J. Remote Sens., 34, 3543–3560, https://doi.org/10.1080/01431161.2012.716546, 2013.
Bravo-Aranda, J. A., Titos, G., Granados-Muñoz, M. J., Guerrero-Rascado, J. L., Navas-Guzmán, F., Valenzuela, A., Lyamani, H., Olmo, F. J., Andrey, J., and Alados-Arboledas, L.: Study of mineral dust entrainment in the planetary boundary layer by lidar depolarisation technique, Tellus B, 67, 26180, https://doi.org/10.3402/tellusb.v67.26180, 2015.
Burton, S. P., Hair, J. W., Kahnert, M., Ferrare, R. A., Hostetler, C. A., Cook, A. L., Harper, D. B., Berkoff, T. A., Seaman, S. T., Collins, J. E., Fenn, M. A., and Rogers, R. R.: Observations of the spectral dependence of linear particle depolarization ratio of aerosols using NASA Langley airborne High Spectral Resolution Lidar, Atmos. Chem. Phys., 15, 13453–13473, https://doi.org/10.5194/acp-15-13453-2015, 2015.
Cao, X., Roy, G., and Bernier, R.: Lidar polarization discrimination of bioaerosols, Opt. Eng., 49, 116201, https://doi.org/10.1117/1.3505877, 2010.
Cariñanos, P., Foyo-Moreno, I., Alados, I., Guerrero-Rascado, J. L., Ruiz-Peñuela, S., Titos, G., Cazorla, A., Alados-Arboledas, L., and Díaz de la Guardia, C.: Bioaerosols in urban environments: Trends and interactions with pollutants and meteorological variables based on quasi-climatological series, J. Environ. Manage., 282, 111963, https://doi.org/10.1016/j.jenvman.2021.111963, 2021.
Cazorla, A., Casquero-Vera, J. A., Román, R., Guerrero-Rascado, J. L., Toledano, C., Cachorro, V. E., Orza, J. A. G., Cancillo, M. L., Serrano, A., Titos, G., Pandolfi, M., Alastuey, A., Hanrieder, N., and Alados-Arboledas, L.: Near-real-time processing of a ceilometer network assisted with sun-photometer data: monitoring a dust outbreak over the Iberian Peninsula, Atmos. Chem. Phys., 17, 11861–11876, https://doi.org/10.5194/acp-17-11861-2017, 2017.
Claverie, M., Ju, J., Masek, J. G., Dungan, J. L., Vermote, E. F., Roger, J. C., Skakun, S. V., and Justice, C.: The Harmonized Landsat and Sentinel-2 surface reflectance data set, Remote Sens. Environ., 219, 145–161, https://doi.org/10.1016/j.rse.2018.09.002, 2018.
Córdoba-Jabonero, C., Sicard, M., López-Cayuela, M.-Á., Ansmann, A., Comerón, A., Zorzano, M.-P., Rodríguez-Gómez, A., and Muñoz-Porcar, C.: Aerosol radiative impact during the summer 2019 heatwave produced partly by an inter-continental Saharan dust outbreak – Part 1: Short-wave dust direct radiative effect, Atmos. Chem. Phys., 21, 6455–6479, https://doi.org/10.5194/acp-21-6455-2021, 2021.
Couto, F. T., Cardoso, E. H. C., Costa, M. J., Salgado, R., Guerrero-Rascado, J. L., and Salgueiro, V.: How a mesoscale cyclonic vortex over Sahara leads to a dust outbreak in South-western Iberia, Atmos. Res., 249, 105302, https://doi.org/10.1016/j.atmosres.2020.105302, 2021.
Dai, G., Sun, K., Wang, X., Wu, S., E, X., Liu, Q., and Liu, B.: Dust transport and horizontal fluxes measurement with spaceborne lidars ALADIN, CALIOP and model reanalysis data, Atmos. Chem. Phys. Discuss. [preprint], https://doi.org/10.5194/acp-2021-219, 2021.
D'Amico, G., Amodeo, A., Baars, H., Binietoglou, I., Freudenthaler, V., Mattis, I., Wandinger, U., and Pappalardo, G.: EARLINET Single Calculus Chain – overview on methodology and strategy, Atmos. Meas. Tech., 8, 4891–4916, https://doi.org/10.5194/amt-8-4891-2015, 2015.
D'Amico, G., Amodeo, A., Mattis, I., Freudenthaler, V., and Pappalardo, G.: EARLINET Single Calculus Chain – technical – Part 1: Pre-processing of raw lidar data, Atmos. Meas. Tech., 9, 491–507, https://doi.org/10.5194/amt-9-491-2016, 2016.
Dubovik, O., Holben, B., Eck, T. F., Smirnov, A., Kaufman, Y. J., King, M. D., Tanré, D., and Slutsker, I.: Variability of absorption and optical properties of key aerosol types observed in worldwide locations, J. Atmos. Sci., 59, 590–608, https://doi.org/10.1175/1520-0469(2002)059<0590:voaaop>2.0.co;2, 2002.
EARLINET: Data Portal, available at: https://data.earlinet.org/, last access: 7 January 2022.
Engelmann, R., Kanitz, T., Baars, H., Heese, B., Althausen, D., Skupin, A., Wandinger, U., Komppula, M., Stachlewska, I. S., Amiridis, V., Marinou, E., Mattis, I., Linné, H., and Ansmann, A.: The automated multiwavelength Raman polarization and water-vapor lidar PollyXT: the neXT generation, Atmos. Meas. Tech., 9, 1767–1784, https://doi.org/10.5194/amt-9-1767-2016, 2016.
ESA: Aeolus Online Dissemination System, available at: https://aeolus-ds.eo.esa.int, last access: 7 January 2022.
European Space Agency (ESA): ADM-Aeolus Science Report, ESA SP-1311, available at: https://earth.esa.int/pi/esa?id=3409&sideExpandedNavigationBoxId=Aos&cmd=image&topSelectedNavigationNodeId=AOS&targetIFramePage=/web/guest/pi-community/apply-for-data/ao-s&ts=1496439496255&type=file&colorTheme=03&sideNavigationType=AO&table=aotarget (last access: 21 November 2021) 2008.
Feofilov, A., Chepfer, H., Noel, V., Guzman, R., Gindre, C., and Chiriaco, M.: Comparing scattering ratio products retrieved from ALADIN/Aeolus and CALIOP/CALIPSO observations: sensitivity, comparability, and temporal evolution, Atmos. Meas. Tech. Discuss. [preprint], https://doi.org/10.5194/amt-2021-96, in review, 2021.
Fernández, A. J., Sicard, M., Costa, M. J., Guerrero-Rascado, J. L., Gómez-Amo, J. L., Molero, F., Barragán, R., Basart, S., Bortoli, D., Bedoya-Velásquez, A. E., Utrillas, M. P., Salvador, P., Granados-Muñoz, M. J., Potes, M., Ortiz-Amezcua, P., Martínez-Lozano, J. A., Artíñano, B., Muñoz-Porcar, C., Salgado, R., Román, R., Rocadenbosch, F., Salgueiro, V., Benavent-Oltra, J. A., Rodríguez-Gómez, A., Alados-Arboledas, L., Comerón, A., and Pujadas, M.: Extreme, wintertime Saharan dust intrusion in the Iberian Peninsula: Lidar monitoring and evaluation of dust forecast models during the February 2017 event, Atmos. Res., 228, 223–241, https://doi.org/10.1016/j.atmosres.2019.06.007, 2019.
Flamant, P., Cuesta, J., Denneulin, M.-L., Dabas, A., Huber, D.: ADM-Aeolus retrieval algorithms for aerosol and cloud products, The Authors Journal Compilation C, 60, 273–286, https://doi.org/10.1111/j.1600-0870.2007.00287.x, 2008.
Flamant, P. H., Lever, V., Martinet, P., Flament, T., Cuesta, J., Dabas, A., Olivier, M., and Huber, D.: ADM-Aeolus L2A Algorithm Theoretical Baseline Document Particle spin-off products, ESA, reference: AE-TN-IPSL-GS-001, available at: https://earth.esa.int/eogateway/documents/20142/37627/Aeolus-L2A-Algorithm-Theoretical-Baseline-Document (last access: 21 November 2021), 2020.
Flament, T., Trapon, D., Lacour, A., Dabas, A., Ehlers, F., and Huber, D.: Aeolus L2A aerosol optical properties product: standard correct algorithm and Mie correct algorithm, Atmos. Meas. Tech., 14, 7851–7871, https://doi.org/10.5194/amt-14-7851-2021, 2021.
Foyo-Moreno, I., Alados, I., Guerrero-Rascado, J. L., Lyamani, H., Pérez-Ramírez, D., Olmo, F. J., and Alados-Arboledas, L.: Contribution to column-integrated aerosol typing based on Sun-photometry using different criteria, Atmos. Res., 224, 1–17, https://doi.org/10.1016/j.atmosres.2019.03.007, 2019.
Freudenthaler, V., Esselborn, M., Wiegner, M., Heese, B., Tesche, M., Ansmann, A., Müller, D., Althausen, D., Wirth, M., Fix, A., Ehret, G., Knippertz, P., Toledano, C., Gasteiger, J., Garhammer, M., and Seefeldner, M.: Depolarization ratio profiling at several wavelengths in pure Saharan dust during SAMUM 2006, Tellus, Series B, 61, 165–179, https://doi.org/10.1111/j.1600-0889.2008.00396.x, 2009.
Galveias, A., Costa, A. R., Bortoli, D., Alpizar-Jara, R., Salgado, R., Costa, M. J., and Antunes, C. M.: Cupressaceae Pollen in the City of Évora, South of Portugal: Disruption of the Pollen during Air Transport Facilitates Allergen Exposure, Forests, 12, 64, https://doi.org/10.3390/f12010064, 2021.
Giles, D. M., Sinyuk, A., Sorokin, M. G., Schafer, J. S., Smirnov, A., Slutsker, I., Eck, T. F., Holben, B. N., Lewis, J. R., Campbell, J. R., Welton, E. J., Korkin, S. V., and Lyapustin, A. I.: Advancements in the Aerosol Robotic Network (AERONET) Version 3 database – automated near-real-time quality control algorithm with improved cloud screening for Sun photometer aerosol optical depth (AOD) measurements, Atmos. Meas. Tech., 12, 169–209, https://doi.org/10.5194/amt-12-169-2019, 2019.
Gobbi, G. P., Kaufman, Y. J., Koren, I., and Eck, T. F.: Classification of aerosol properties derived from AERONET direct sun data, Atmos. Chem. Phys., 7, 453–458, https://doi.org/10.5194/acp-7-453-2007, 2007.
Goddard Space Flight Center: AEROSOL ROBOTIC NETWORK, AERONET, available at: https://aeronet.gsfc.nasa.gov/, last access: 7 January 2022.
Granados-Muñoz, M. J., Bravo-Aranda, J. A., Baumgardner, D., Guerrero-Rascado, J. L., Pérez-Ramírez, D., Navas-Guzmán, F., Veselovskii, I., Lyamani, H., Valenzuela, A., Olmo, F. J., Titos, G., Andrey, J., Chaikovsky, A., Dubovik, O., Gil-Ojeda, M., and Alados-Arboledas, L.: A comparative study of aerosol microphysical properties retrieved from ground-based remote sensing and aircraft in situ measurements during a Saharan dust event, Atmos. Meas. Tech., 9, 1113–1133, https://doi.org/10.5194/amt-9-1113-2016, 2016.
Groß, S., Tesche, M., Freudenthaler, V., Toledano, C., Wiegner, M., Ansmann, A., Althausen, D., and Seefeldner, M.: Characterization of Saharan dust, marine aerosols and mixtures of biomass-burning aerosols and dust by means of multi-wavelength depolarization and Raman lidar measurements during SAMUM 2, Tellus B, 63, 706–724, https://doi.org/10.1111/j.1600-0889.2011.00556.x, 2011a.
Groß, S., Gasteiger, J., Freudenthaler, V., Wiegner, M., Geiß, A., Schladitz, A., Toledano, C., Kandler, K., Tesche, M., Ansmann, A., and Wiedensohler, A.: Characterization of the planetary boundary layer during SAMUM-2 by means of lidar measurements, Tellus B, 63, 695–705, https://doi.org/10.1111/j.1600-0889.2011.00557.x, 2011b.
Groß, S., Freudenthaler, V., Wiegner, M., Gasteiger, J., Geiß, A., and Schnell, F.: Dual-wavelength linear depolarization ratio of volcanic aerosols: Lidar measurements of the Eyjafjallajökull plume over Maisach, Germany, Atmos. Environ., 48, 85–96, https://doi.org/10.1016/j.atmosenv.2011.06.017, 2012.
Groß, S., Freudenthaler, V., Schepanski, K., Toledano, C., Schäfler, A., Ansmann, A., and Weinzierl, B.: Optical properties of long-range transported Saharan dust over Barbados as measured by dual-wavelength depolarization Raman lidar measurements, Atmos. Chem. Phys., 15, 11067–11080, https://doi.org/10.5194/acp-15-11067-2015, 2015.
Guerrero-Rascado, J. L., Ruiz, B., and Alados-Arboledas, L.: Multi-spectral Lidar characterization of the vertical structure of Saharan dust aerosol over southern Spain, Atmos. Environ., 42, 2668–2681, https://doi.org/10.1016/j.atmosenv.2007.12.062, 2008.
Guerrero-Rascado, J. L., Olmo, F. J., Avilés-Rodríguez, I., Navas-Guzmán, F., Pérez-Ramírez, D., Lyamani, H., and Alados Arboledas, L.: Extreme Saharan dust event over the southern Iberian Peninsula in september 2007: active and passive remote sensing from surface and satellite, Atmos. Chem. Phys., 9, 8453–8469, https://doi.org/10.5194/acp-9-8453-2009, 2009.
Guerrero-Rascado, J. L., Costa, M. J., Bortoli, D., Silva, A. M., Lyamani, H., and Alados-Arboledas, L.: Infrared lidar overlap function: an experimental determination, Opt. Express, 18, 20350, https://doi.org/10.1364/oe.18.020350, 2010.
Guo, J., Liu, B., Gong, W., Shi, L., Zhang, Y., Ma, Y., Zhang, J., Chen, T., Bai, K., Stoffelen, A., de Leeuw, G., and Xu, X.: Technical note: First comparison of wind observations from ESA's satellite mission Aeolus and ground-based radar wind profiler network of China, Atmos. Chem. Phys., 21, 2945–2958, https://doi.org/10.5194/acp-21-2945-2021, 2021.
Haarig, M., Ansmann, A., Althausen, D., Klepel, A., Groß, S., Freudenthaler, V., Toledano, C., Mamouri, R.-E., Farrell, D. A., Prescod, D. A., Marinou, E., Burton, S. P., Gasteiger, J., Engelmann, R., and Baars, H.: Triple-wavelength depolarization-ratio profiling of Saharan dust over Barbados during SALTRACE in 2013 and 2014, Atmos. Chem. Phys., 17, 10767–10794, https://doi.org/10.5194/acp-17-10767-2017, 2017a.
Haarig, M., Ansmann, A., Gasteiger, J., Kandler, K., Althausen, D., Baars, H., Radenz, M., and Farrell, D. A.: Dry versus wet marine particle optical properties: RH dependence of depolarization ratio, backscatter, and extinction from multiwavelength lidar measurements during SALTRACE, Atmos. Chem. Phys., 17, 14199–14217, https://doi.org/10.5194/acp-17-14199-2017, 2017b.
Haarig, M., Ansmann, A., Baars, H., Jimenez, C., Veselovskii, I., Engelmann, R., and Althausen, D.: Depolarization and lidar ratios at 355, 532, and 1064 nm and microphysical properties of aged tropospheric and stratospheric Canadian wildfire smoke, Atmos. Chem. Phys., 18, 11847–11861, https://doi.org/10.5194/acp-18-11847-2018, 2018.
Hofer, J., Ansmann, A., Althausen, D., Engelmann, R., Baars, H., Fomba, K. W., Wandinger, U., Abdullaev, S. F., and Makhmudov, A. N.: Optical properties of Central Asian aerosol relevant for spaceborne lidar applications and aerosol typing at 355 and 532 nm, Atmos. Chem. Phys., 20, 9265–9280, https://doi.org/10.5194/acp-20-9265-2020, 2020.
Horányi, A., Cardinali, C., Rennie, M., and Isaksen, L.: The assimilation of horizontal line-of-sight wind information into the ECMWF data assimilation and forecasting system. Part I: The assessment of wind impact, Q. J. Roy. Meteor. Soc., 141, 1223–1232, https://doi.org/10.1002/qj.2430, 2015a.
Horányi, A., Cardinali, C., Rennie, M., and Isaksen, L.: The assimilation of horizontal line-of-sight wind information into the ECMWF data assimilation and forecasting system. Part II: The impact of degraded wind observations, Q. J. Roy. Meteor. Soc., 141, 1233–1243, https://doi.org/10.1002/qj.2551, 2015b.
Hu, Q., Goloub, P., Veselovskii, I., Bravo-Aranda, J.-A., Popovici, I. E., Podvin, T., Haeffelin, M., Lopatin, A., Dubovik, O., Pietras, C., Huang, X., Torres, B., and Chen, C.: Long-range-transported Canadian smoke plumes in the lower stratosphere over northern France, Atmos. Chem. Phys., 19, 1173–1193, https://doi.org/10.5194/acp-19-1173-2019, 2019.
Ingmann, P. and Straume, A. G.: ADM-Aeolus Mission Requirements Document, ESA, reference: AE-RP-ESA-SY-001 EOP-SM/2047, available at: https://earth.esa.int/eogateway/documents/20142/1564626/Aeolus-Mission-Requirements.pdf (last access: 21 November 2021), 2016.
Janicka, L., Stachlewska, I. S., Veselovskii, I., and Baars, H.: Temporal variations in optical and microphysical properties of mineral dust and biomass burning aerosol derived from daytime Raman lidar observations over Warsaw, Poland, Atmos. Environ., 169, 162–174, https://doi.org/10.1016/j.atmosenv.2017.09.022, 2017.
Khaykin, S. M., Godin-Beekmann, S., Hauchecorne, A., Pelon, J., Ravetta, F., and Keckut, P.: Stratospheric smoke with unprecedentedly high backscatter observed by lidars above southern France, Geophys. Res. Lett., 45, 1639–1646, https://doi.org/10.1002/2017GL076763, 2018.
Kumar, D., Rocadenbosch, F., Sicard, M., Comeron, A., Muñoz, C., Lange, D., Tomás, S., and Gregorio, E.: Six-channel polychromator design and implementation for the UPC elastic/Raman lidar, Lidar Technologies, Techniques, and Measurements for Atmospheric Remote Sensing VII, 8182, 81820, https://doi.org/10.1117/12.896305, 2011.
Lee, J., Kim, J., Song, C. H., Kim, S. B., Chun, Y., Sohn, B. J., and Holben, B. N.: Characteristics of aerosol types from AERONET sunphotometer measurements, Atmos. Environ., 44, 3110–3117, https://doi.org/10.1016/j.atmosenv.2010.05.035, 2010.
Lux, O., Lemmerz, C., Weiler, F., Marksteiner, U., Witschas, B., Rahm, S., Geiß, A., and Reitebuch, O.: Intercomparison of wind observations from the European Space Agency's Aeolus satellite mission and the ALADIN Airborne Demonstrator, Atmos. Meas. Tech., 13, 2075–2097, https://doi.org/10.5194/amt-13-2075-2020, 2020.
Lyamani, H., Olmo, F. J., Alcántara, A., and Alados-Arboledas, L.: Atmospheric aerosols during the 2003 heat wave in southeastern Spain I: Spectral optical depth, Atmos. Environ., 40, 6453–6464, https://doi.org/10.1016/j.atmosenv.2006.04.048, 2006.
Lyamani, H., Olmo, F. J., and Alados-Arboledas, L.: Physical and optical properties of aerosols over an urban location in Spain: seasonal and diurnal variability, Atmos. Chem. Phys., 10, 239–254, https://doi.org/10.5194/acp-10-239-2010, 2010.
Lyamani, H., Fernández-Gálvez, J., Pérez-Ramírez, D., Valenzuela, A., Antón, M., Alados, I., Titos, G., Olmo, F. J., and Alados-Arboledas, L.: Aerosol properties over two urban sites in South Spain during an extended stagnation episode in winter season, Atmos. Environ., 62, 424–432, https://doi.org/10.1016/j.atmosenv.2012.08.050, 2012.
Mamouri, R. E., Amiridis, V., Papayannis, A., Giannakaki, E., Tsaknakis, G., and Balis, D. S.: Validation of CALIPSO space-borne-derived attenuated backscatter coefficient profiles using a ground-based lidar in Athens, Greece, Atmos. Meas. Tech., 2, 513–522, https://doi.org/10.5194/amt-2-513-2009, 2009.
Mandija, F., Guerrero-Rascado, J. L., Lyamani, H., Granados-Muñoz, M. J., and Alados-Arboledas, L.: Synergic estimation of columnar integrated aerosol properties and their vertical resolved profiles in respect to the scenarios of dust intrusions over Granada, Atmos. Environ., 145, 439–454, https://doi.org/10.1016/j.atmosenv.2016.09.045, 2016.
Mattis, I., D'Amico, G., Baars, H., Amodeo, A., Madonna, F., and Iarlori, M.: EARLINET Single Calculus Chain – technical – Part 2: Calculation of optical products, Atmos. Meas. Tech., 9, 3009–3029, https://doi.org/10.5194/amt-9-3009-2016, 2016.
Mishchenko, M. I. and Hovenier, J. W.: Depolarization of light backscattered by randomly oriented nonspherical particles, Opt. Lett., 20, 1356, https://doi.org/10.1364/ol.20.001356, 1995.
Müller, D., Ansmann, A., Mattis, I., Tesche, M., Wandinger, U., Althausen, D., and Pisani, G.: Aerosol-type-dependent lidar ratios observed with Raman lidar, J. Geophys. Res., 112, D16202, https://doi.org/10.1029/2006JD008292, 2007.
Myhre, G., Shindell, D., Bréon, F. M., Collins, W., Fuglestvedt, J., Huang, J., Koch, D., Lamarque, J. F., Lee, D., Mendoza, B., Nakajima, T., Robock, A., Stephens, G., Takemura, T., and Zhang, H.: Anthropogenic and natural radiative forcing. In: Climate Change 2013: The Physical Science Basis. Contribution of Working Group I to the Fifth Assessment Report of the Intergovernmental Panel on Climate Change, edited by: Stocker, T. F., Qin, D., Plattner, G.-K., Tignor, M., Allen, S. K., Boschung, J., Nauels, A., Xia, Y., Bex, V., and Midgley, P. M.,, 9781107057, Cambridge University Press, 659–740, https://doi.org/10.1017/CBO9781107415324.018, 2013.
Navas-Guzmán, F., Guerrero-Rascado, J. L., and Alados-Arboledas, L.: Retrieval of the lidar overlap function using Raman signals, Óptica Pura y Aplicada, 44, 71–75, available at: https://dialnet.unirioja.es/servlet/articulo?codigo=6817648 (last access: 7 January 2022), 2011.
Ohneiser, K., Ansmann, A., Baars, H., Seifert, P., Barja, B., Jimenez, C., Radenz, M., Teisseire, A., Floutsi, A., Haarig, M., Foth, A., Chudnovsky, A., Engelmann, R., Zamorano, F., Bühl, J., and Wandinger, U.: Smoke of extreme Australian bushfires observed in the stratosphere over Punta Arenas, Chile, in January 2020: optical thickness, lidar ratios, and depolarization ratios at 355 and 532 nm, Atmos. Chem. Phys., 20, 8003–8015, https://doi.org/10.5194/acp-20-8003-2020, 2020.
Ortiz-Amezcua, P., Guerrero-Rascado, J. L., Granados-Muñoz, M. J., Bravo-Aranda, J. A., and Alados-Arboledas, L.: Characterization of atmospheric aerosols for a long range transport of biomass burning particles from canadian forest fires over the southern iberian peninsula in july 2013, Optica Pura y Aplicada, 47, 43–49, https://doi.org/10.7149/OPA.47.1.43, 2014.
Ortiz-Amezcua, P., Guerrero-Rascado, J. L., Granados-Muñoz, M. J., Benavent-Oltra, J. A., Böckmann, C., Samaras, S., Stachlewska, I. S., Janicka, Ł., Baars, H., Bohlmann, S., and Alados-Arboledas, L.: Microphysical characterization of long-range transported biomass burning particles from North America at three EARLINET stations, Atmos. Chem. Phys., 17, 5931–5946, https://doi.org/10.5194/acp-17-5931-2017, 2017.
Papagiannopoulos, N., Mona, L., Alados-Arboledas, L., Amiridis, V., Baars, H., Binietoglou, I., Bortoli, D., D'Amico, G., Giunta, A., Guerrero-Rascado, J. L., Schwarz, A., Pereira, S., Spinelli, N., Wandinger, U., Wang, X., and Pappalardo, G.: CALIPSO climatological products: evaluation and suggestions from EARLINET, Atmos. Chem. Phys., 16, 2341–2357, https://doi.org/10.5194/acp-16-2341-2016, 2016.
Pappalardo, G., Amodeo, A., Pandolfi, M., Wandinger, U., Ansmann, A., Bösenberg, J., Matthias, V., Amiridis, V., De Tomasl, F., Frioud, M., Iarlori, M., Komguem, L., Papayannis, A., Rocadenbosch, F., and Wang, X.: Aerosol lidar intercomparison in the framework of the EARLINET project. 3. Raman lidar algorithm for aerosol extinction, backscatter, and lidar ratio, Appl. Opt., 43, 5370–5385. https://doi.org/10.1364/AO.43.005370, 2004.
Pappalardo, G., Wandinger, U., Mona, L., Hiebsch, A., Mattis, I., Amodeo, A., Ansmann, A., Seifert, P., Linné, H., Apituley, A., Arboledas, L. A., Balis, D., Chaikovsky, A., D'Amico, G., De Tomasi, F., Freudenthaler, V., Giannakaki, E., Giunta, A., Grigorov, I., Iarlori, M., Madonna, F., Mamouri, R. E., Nasti, L., Papayannis, A., Pietruczuk, A., Pujadas, M., Rizi, V., Rocadenbosch, F., Russo, F., Schnell, F., Spinelli, N., Wang, X., and Wiegner, M.: EARLINET correlative measurements for CALIPSO: First intercomparison results, J. Geophys. Res.-Atmos., 115, D00H19, https://doi.org/10.1029/2009JD012147, 2010.
Pappalardo, G., Amodeo, A., Apituley, A., Comeron, A., Freudenthaler, V., Linné, H., Ansmann, A., Bösenberg, J., D'Amico, G., Mattis, I., Mona, L., Wandinger, U., Amiridis, V., Alados-Arboledas, L., Nicolae, D., and Wiegner, M.: EARLINET: towards an advanced sustainable European aerosol lidar network, Atmos. Meas. Tech., 7, 2389–2409, https://doi.org/10.5194/amt-7-2389-2014, 2014.
Pereira, S. N., Wagner, F., and Silva, A. M.: Continuous measurements of near surface aerosols in the south-western European (Portugal) region in 2006–2008, Adv. Sci. Res., 3, 1–4, https://doi.org/10.5194/asr-3-1-2009, 2009.
Pereira, S. N., Preißler, J., Guerrero-Rascado, J. L., Silva, A. M., and Wagner, F.: Forest fire smoke layers observed in the free troposphere over Portugal with a multiwavelength Raman lidar: Optical and microphysical properties, Sci. World J., 2014, 421838, https://doi.org/10.1155/2014/421838, 2014.
Pérez, C., Nickovic, S., Baldasano, J. M., Sicard, M., Rocadenbosch, F., and Cachorro, V. E.: A long Saharan dust event over the western Mediterranean: Lidar, Sun photometer observations, and regional dust modeling, J. Geophys. Res., 111, D15214, https://doi.org/10.1029/2005JD006579, 2006.
Preißler, J., Wagner, F., Pereira, S. N., and Guerrero-Rascado, J. L.: Multi-instrumental observation of an exceptionally strong Saharan dust outbreak over Portugal, J. Geophys. Res.-Atmos., 116, D24204, https://doi.org/10.1029/2011JD016527, 2011.
Preißler, J., Wagner, F., Guerrero-Rascado, J. L., and Silva, A. M.: Two years of free-tropospheric aerosol layers observed over Portugal by lidar, J. Geophys. Res.-Atmos., 118, 3676–3686, https://doi.org/10.1002/jgrd.50350, 2013.
Proestakis, E., Amiridis, V., Marinou, E., Binietoglou, I., Ansmann, A., Wandinger, U., Hofer, J., Yorks, J., Nowottnick, E., Makhmudov, A., Papayannis, A., Pietruczuk, A., Gialitaki, A., Apituley, A., Szkop, A., Muñoz Porcar, C., Bortoli, D., Dionisi, D., Althausen, D., Mamali, D., Balis, D., Nicolae, D., Tetoni, E., Liberti, G. L., Baars, H., Mattis, I., Stachlewska, I. S., Voudouri, K. A., Mona, L., Mylonaki, M., Perrone, M. R., Costa, M. J., Sicard, M., Papagiannopoulos, N., Siomos, N., Burlizzi, P., Pauly, R., Engelmann, R., Abdullaev, S., and Pappalardo, G.: EARLINET evaluation of the CATS Level 2 aerosol backscatter coefficient product, Atmos. Chem. Phys., 19, 11743–11764, https://doi.org/10.5194/acp-19-11743-2019, 2019.
Reitebuch, O., Huber D., and Nikolaus, I.: ADM-Aeolus Algorithm Theoretical Basis Document ATBD Level 1B Products, available at: https://earth.esa.int/eogateway/documents/20142/37627/Aeolus-L1B-Algorithm-ATBD.pdf (last access: 21 November 2021), 2018.
Rodier, S., Palm, S., Vaughan, M., Yorks, J., McGill, M., Jensen, M., Murray, T., and Trepte, C.: Laser Remote Sensing from ISS: CATS Cloud and Aerosol Level 2 Data Products, Heritage Edition, EPJ Web Conf., 119, 04012, https://doi.org/10.1051/epjconf/201611904012, 2016.
Rodríguez-Gómez, A., Sicard, M., Granados-Muñoz, M.-J., Ben Chahed, E., Muñoz-Porcar, C., Barragán, R., Comerón, A., Rocadenbosch, F., and Vidal, E.: An Architecture Providing Depolarization Ratio Capability for a Multi-Wavelength Raman Lidar: Implementation and First Measurements, Sensors, 17, 2957, https://doi.org/10.3390/s17122957, 2017.
Salgueiro, V., Costa, M. J., Guerrero-Rascado, J. L., Couto, F. T., and Bortoli, D.: Characterization of forest fire and Saharan desert dust aerosols over south-western Europe using a multi-wavelength Raman lidar and Sun-photometer, Atmos. Environ., 252, 118346, https://doi.org/10.1016/j.atmosenv.2021.118346, 2021.
Shang, X., Giannakaki, E., Bohlmann, S., Filioglou, M., Saarto, A., Ruuskanen, A., Leskinen, A., Romakkaniemi, S., and Komppula, M.: Optical characterization of pure pollen types using a multi-wavelength Raman polarization lidar, Atmos. Chem. Phys., 20, 15323–15339, https://doi.org/10.5194/acp-20-15323-2020, 2020.
Shin, S.-K., Tesche, M., Noh, Y., and Müller, D.: Aerosol-type classification based on AERONET version 3 inversion products, Atmos. Meas. Tech., 12, 3789–3803, https://doi.org/10.5194/amt-12-3789-2019, 2019.
Sicard, M., Molero, F., Guerrero-Rascado, J. L., Pedros, R., Exposito, F. J., Cordoba-Jabonero, C., Bolarin, J. M., Comeron, A., Rocadenbosch, F., Pujadas, M., Alados-Arboledas, L., Martinez-Lozano, J. A., Diaz, J. P., Gil, M., Requena, A., Navas-Guzmán, F., and Moreno, J. M.: Aerosol lidar intercomparison in the framework of SPALINET – The Spanish lidar network: Methodology and results, IEEE T. Geosci. Remote, 47, 3547–3559, https://doi.org/10.1109/TGRS.2009.2021525, 2009.
Sicard, M., Rocadenbosch, F., Reba, M. N. M., Comerón, A., Tomás, S., García-Vízcaino, D., Batet, O., Barrios, R., Kumar, D., and Baldasano, J. M.: Seasonal variability of aerosol optical properties observed by means of a Raman lidar at an EARLINET site over Northeastern Spain, Atmos. Chem. Phys., 11, 175–190, https://doi.org/10.5194/acp-11-175-2011, 2011.
Sicard, M., Granados-Muñoz, M. J., Papagiannopoulos, N., Alados-Arboledas, L., Barragán, R., Bedoya-Velásquez, A. E., Benavent-Oltra, J. A., Bortoli, D., Comerón, A., Córdoba Jabonero, C., Costa, M. J., del Águila, A., Fernández, A. J., Gómez Amo, J. L., Guerrero-Rascado, J. L., Jorba, O., Martínez-Lozano, J. A., Molero, F., Muñoz-Porcar, C., Ortiz-Amezcua, P., Potes, M., Pujadas, M., Rocadenbosch, F., Rodríguez-Gómez, A., Román, R., Salgado, R., Salgueiro, V., Utrillas, M. P., and Yela, M.: Tropospheric and stratospheric impact of Canadian smoke plumes over the Iberian Peninsula in August–September 2017, in: Proc. European Lidar Conference (ELC), 22, Thessaloniki, Greece, 3–5 July 2018, 2018.
Sicard, M., Granados-Muñoz, M. J., Alados-Arboledas, L., Barragán, R., Bedoya-Velásquez, A. E., Benavent-Oltra, J. A., Bortoli, D., Comerón, A., Córdoba-Jabonero, C., Costa, M. J., del Águila, A., Fernández, A. J., Guerrero-Rascado, J. L., Jorba, O., Molero, F., Muñoz-Porcar, C., Ortiz-Amezcua, P., Papagiannopoulos, N., Potes, M., Pujadas, M., Rocadenbosch, F., Rodríguez-Gómez, A., Román, R., Salgado, R., Salgueiro, V., Sola, Y., and Yela, M.: Ground/space, passive/active remote sensing observations coupled with particle dispersion modelling to understand the inter-continental transport of wildfire smoke plumes, Remote Sens. Environ., 232, 111294, https://doi.org/10.1016/j.rse.2019.111294, 2019.
Stachlewska, I. S., Samson, M., Zawadzka, O., Harenda, K. M., Janicka, L., Poczta, P., Szczepanik, D., Heese, B., Wang, D., Borek, K., Tetoni, E., Proestakis, E., Siomos, N., Nemuc, A., Chojnicki, B.H., Markowicz, K. M., Pietruczuk, A., Szkop, A., Althausen, D., Stebel, K., Schuettemeyer, D., and Zehner, C.: Modification of Local Urban Aerosol Properties by Long-Range Transport of Biomass Burning Aerosol, Remote Sensing, 10, 412, https://doi.org/10.3390/rs10030412, 2018.
Stocker, T. F., Qin, D., Plattner, G.-K., Tignor, M., Allen, S. K., Boschung, J., Nauels, A., Xia, Y., Bex, V., and Midgley, P. M. (Eds.): Climate Change 2013: The Physical Science Basis. Contribution of Working Group I to the Fifth Assessment Report of the Intergovernmental Panel on Climate Change, Cambridge University Press, 1535 pp., available at: https://www.ipcc.ch/site/assets/uploads/2018/03/WG1AR5_SummaryVolume_FINAL.pdf (last access: 7 January 2022), 2013.
Stoffelen, A., Marseille, G. J., Bouttier, F., Vasiljevic, D., de Haan, S., and Cardinali, C.: ADM-Aeolus Doppler wind lidar Observing System Simulation Experiment, Q. J. Roy. Meteor. Soc., 132, 1927–1947, https://doi.org/10.1256/qj.05.83, 2006.
Straume, A. G., Schuettemeyer, D., Von Bismarck, J., Kanitz, T., and Fehr, T.: Aeolus Scientific Calibration and Validation Implementation Plan, available at: https://earth.esa.int/eogateway/documents/20142/1564626/Aeolus-Scientific-CAL-VAL-Implementation-Plan.pdf (last access: 21 November 2021), 2019.
Straume, A. G., Rennie, M., Isaksen, L., de Kloe, J., Marseille, G.-J., Stoffelen, A., Flament, T., Stieglitz, H., Dabas, A., Huber, D., Reitebuch, O., Lemmerz, C., Lux, O., Marksteiner, U., Weiler, F., Witschas, B., Meringer, M., Schmidt, K., Nikolaus, I., Geiss, A., Flamant, P., Kanitz, T., Wernham, D., von Bismarck, J., Bley, S., Fehr, T., Floberghagen, R., and Parinello, T.: ESA's Space-Based Doppler Wind Lidar Mission Aeolus – First Wind and Aerosol Product Assessment Results, EPJ Web Conf., 237, 01007, https://doi.org/10.1051/epjconf/202023701007, 2020.
Valenzuela, A., Costa, M. J., Guerrero-Rascado, J. L., Bortoli, D., and Olmo, F. J.: Solar and thermal radiative effects during the 2011 extreme desert dust episode over Portugal, Atmos. Environ., 148, 16–29, https://doi.org/10.1016/j.atmosenv.2016.10.037, 2017.
Yorks, J. E., McGill, M. J., Palm, S. P., Hlavka, D. L., Selmer, P. A., Nowottnick, E. P., Vaughan, M. A., and Rodier, S. D.: An Overview of the Cloud-Aerosol Transport System (CATS) Processing Algorithms and Data Products, Proceedings of the 27th International Laser Radar Conference (ILRC 27), https://doi.org/10.13140/RG.2.1.3877.3603, 2015.
Yorks, J. E., McGill, M. J., Palm, S. P., Hlavka, D. L., Selmer, P. A., Nowottnick, E. P., Vaughan, M. A., Rodier, S. D., and Hart, W. D.: An overview of the CATS level 1 processing algorithms and data products, Geophys. Res. Lett., 43, 4632–4639, https://doi.org/10.1002/2016GL068006, 2016.
Veefkind, J. P., Aben, I., McMullan, K., Förster, H., de Vries, J., Otter, G., Claas, J., Eskes, H. J., de Haan, J. F., Kleipool, Q., van Weele, M., Hasekamp, O., Hoogeveen, R., Landgraf, J., Snel, R., Tol, P., Ingmann, P., Voors, R., Kruizinga, B., Vink, R., Visser, H., and Levelt, P. F.: TROPOMI on the ESA Sentinel-5 Precursor: A GMES mission for global observations of the atmospheric composition for climate, air quality and ozone layer applications, Remote Sens. Environ., 120, 70–83, https://doi.org/10.1016/j.rse.2011.09.027, 2012.
Wandinger, U.: Multiple-scattering influence on extinction- and backscatter-coefficient measurements with Raman and high-spectral-resolution lidars, Appl. Opt., 37, 417, https://doi.org/10.1364/ao.37.000417, 1998.
Wiegner, M., Groß, S., Freudenthaler, V., Schnell, F., and Gasteiger, J.: The May/June 2008 Saharan dust event over Munich: Intensive aerosol parameters from lidar measurements, J. Geophys. Res.-Atmos., 116, D23213, https://doi.org/10.1029/2011JD016619, 2011.
Wang, D., Szczepanik, D., and Stachlewska, I. S.: Interrelations between surface, boundary layer, and columnar aerosol properties derived in summer and early autumn over a continental urban site in Warsaw, Poland, Atmos. Chem. Phys., 19, 13097–13128, https://doi.org/10.5194/acp-19-13097-2019, 2019.
Winker, D. M., Hunt, W. H., and McGill, M. J.: Initial performance assessment of CALIOP, Geophys. Res. Lett., 34, L19803, https://doi.org/10.1029/2007GL030135, 2007.
Witschas, B., Lemmerz, C., Geiß, A., Lux, O., Marksteiner, U., Rahm, S., Reitebuch, O., and Weiler, F.: First validation of Aeolus wind observations by airborne Doppler wind lidar measurements, Atmos. Meas. Tech., 13, 2381–2396, https://doi.org/10.5194/amt-13-2381-2020, 2020.
World Meteorological Organization (WMO): Proceedings of the third WMO Workshop on the impact of various observing systems on numerical weather prediction, WMO, available at: https://library.wmo.int/doc_num.php?explnum_id=5409 (last access: 21 November 2021), 2004.
Zenteno-Hernández, J. A., Comerón, A., Rodríguez-Gómez, A., Muñoz-Porcar, C., D'Amico, G., and Sicard, M.: A Comparative Analysis of Aerosol Optical Coefficients and Their Associated Errors Retrieved from Pure-Rotational and Vibro-Rotational Raman Lidar Signals, Sensors, 21, 1277, https://doi.org/10.3390/s21041277, 2021.