the Creative Commons Attribution 4.0 License.
the Creative Commons Attribution 4.0 License.
 | 03 Nov 2022
Fluorescence characteristics, absorption properties, and radiative effects of water-soluble organic carbon in seasonal snow across northeastern China
Xiaoying Niu
Pingqing Fu
Yang Chen
Yuxuan Xing
Dongyou Wu
Ziqi Chen
Tenglong Shi
Water-soluble organic carbon (WSOC) in the cryosphere can significantly influence the global carbon cycle and radiation budget. However, WSOC in the snowpack has received little scientific attention to date. This study reports the fluorescence characteristics, absorption properties, and radiative effects of WSOC based on 34 snow samples collected from sites in northeastern China. A significant degree of regional WSOC variability is found, with concentrations ranging from 0.5±0.2 to 5.7±3.7 µg g−1 (average concentration: 3.6±3.2 µg g−1). The three principal fluorescent components of WSOC are identified as (1) the high-oxygenated humic-like substances (HULIS-1) of terrestrial origin, (2) the low-oxygenated humic-like substances (HULIS-2) of mixed origin, and (3) the protein-like substances (PRLIS) derived from autochthonous microbial activity. In southeastern Inner Mongolia (SEIM), a region dominated by desert and exposed soils, the WSOC exhibits the highest humification index (HIX) but the lowest fluorescence (FI) and biological (BIX) indices; the fluorescence signal is mainly attributed to HULIS-1 and thus implicates soil as the primary source. By contrast, the HIX (FI and BIX) value is the lowest (highest), and the percentage of PRLIS is the highest in the remote area of northeastern Inner Mongolia (NEIM), suggesting a primarily biological source. For south and north of northeastern China (SNC and NNC), both of which are characterized by intensive agriculture and industrial activity, the fluorescence signal is dominated by HULIS-2, and the HIX, FI, and BIX values are all moderate, indicating the mixed origins for WSOC (anthropogenic activity, microbial activity, and soil). We also observe that, throughout northeastern China, the light absorption of WSOC is dominated by HULIS-1, followed by HULIS-2 and PRLIS. The contribution of WSOC to albedo reduction (average concentration: 3.6 µg g−1) in the ultraviolet–visible (UV–Vis) band is approximately half that of black carbon (BC average concentration: 0.6 µg g−1). Radiative forcing is 3.8 (0.8) W m−2 in old (fresh) snow, equating to 19 % (17 %) of the radiative forcing of BC. These results indicate that WSOC has a profound impact on snow albedo and the solar radiation balance.
- Article
(12330 KB) - Full-text XML
-
Supplement
(757 KB) - BibTeX
- EndNote


Seasonal snow plays a significant role in Earth's solar radiation energy budget, owing to its high reflectivity (Beniston et al., 2018; Usha et al., 2020; Xie et al., 2018). In recent decades, however, the extent of snow-covered areas has trended downward, partially as a result of the presence of light-absorbing particles (LAPs) in the snowpack (Barnett et al., 2008; Dumont et al., 2014; Groisman et al., 1994). The LAPs in seasonal snow, such as black carbon (BC), organic carbon (OC), mineral dust (MD), and biota (Beres et al., 2020; Di Mauro, 2020; Els et al., 2020; Qian et al., 2015; Wu et al., 2016), can strongly absorb solar radiation, which serves to lower surface albedo and impose a positive radiative forcing (Cui et al., 2021; Dumont et al., 2014; Hansen and Nazarenko, 2004; Shi et al., 2022b; Warren and Wiscombe, 1980; Zhang et al., 2017). Ultimately, LAPs can accelerate snow melting (Li et al., 2021b) and disturb the global radiative balance; therefore, they have important implications for regional and global climate change (Shi et al., 2022a; Skiles et al., 2018).
Snowpack BC and MD have been the focus of considerable research in snow-covered regions worldwide (Antony et al., 2014; Doherty et al., 2014; Hegg et al., 2010; Li et al., 2021a; Wang et al., 2014b; Zhang et al., 2018). As the most important LAP (Bond et al., 2013; Doherty et al., 2010; Shi et al., 2020; Wang et al., 2014b), the radiative efficiency of snowpack BC can be more than 3 times greater than that of carbon dioxide (Flanner et al., 2007). MD, another important snowpack LAP, is also known to alter the cryospheric environment, owing to its light-absorbing properties (Di Mauro et al., 2015; Painter et al., 2007; Sarangi et al., 2020; Shi et al., 2021). Recently, researchers have also begun evaluating the influence of biomes on global snow albedo (Hotaling et al., 2021). In contrast, however, the role of OC remains poorly understood because of its complex composition and a lack of OC-focused research. Consequently, substantial uncertainty surrounds the origins, optical properties, and radiative effects of snowpack OC.
A recent study has reported that the storage of OC in mountain glaciers and ice caps (∼ 11 % of Earth's land surface) could be as high as 6 Pg (petagrams; Hood et al., 2015), the majority of which is water-soluble organic carbon (WSOC) (Yan et al., 2016). The substantial part of WSOC in the glacier is highly bioavailable and can be a source of labile organic matter for downstream ecosystems (Singer et al., 2012). The physical and photochemical processes can occur within various WSOC in snow cover and glaciers and therefore have a great effect on atmospheric and glacier chemistry (Antony et al., 2014; Domine, 2002; Grannas et al., 2007). Moreover, WSOC has important influences on the energy budget and radiative forcing of snow cover and glaciers (Kirillova et al., 2014; Ram et al., 2010; Yan et al., 2016). As the chief absorber of WSOC, water-soluble brown carbon (WS-BrC) can absorb significant measures of solar radiation in the UV–Vis wavelengths (Murphy et al., 2008). For instance, in their analysis of 21 snow samples from the Arctic and Antarctic, Anastasio and Robles (2007) attributed 50 % of the total light absorption coefficients at wavelengths of >280 nm to organic chromophores of WSOC. Beine et al. (2011) reported that WSOC occupies almost the entire absorption spectrum of the photochemically active region (300–450 nm) in surficial snow samples from Utqiaġvik (formerly Barrow), Alaska. Feng et al. (2016) observed that absorption in cryoconite samples from the central Tibetan Plateau was dominated by WSOC components in the 300–350 nm range. Similarly, Yan et al. (2016) measured WSOC in glacial snow from Laohugou glacier, northern Tibetan Plateau, where they found that the radiative forcing was ∼ 10 % that of BC. Together, these studies indicate that WSOC plays a key role in global snowpack energy absorption (Niu et al., 2018; Zhang et al., 2020). We note that recent research on cryospheric WSOC mainly focused on alpine glaciers and polar regions (Guo et al., 2022; Li et al., 2022), while the extensive midlatitude regions impacted by seasonal snowpack remain relatively understudied.
The composition of WSOC is typically complex, and characteristics of fluorescence and absorption can vary widely among the different components. Nonetheless, recent studies have tended to treat WSOC as a single entity and focus on the overall impacts (Barrett and Sheesley, 2017; D'Sa et al., 2014; Niu et al., 2018; Wu et al., 2019), such that the specific roles of individual components are poorly constrained. One commonly used analytical method for distinguishing the components and properties of fluorescence is the fluorescence excitation–emission matrix (EEM), which has the advantage of high sensitivity and small sample size (Coble, 1996; Kowalczuk et al., 2005). First applied in oceanic contexts (Coble et al., 1990), EEM has been gradually extended to lakes, fog water, and rainwater (Birdwell and Valsaraj, 2010; Huguet et al., 2009; McKnight et al., 2001). At present, the application of EEM on atmospheric aerosols has entered a mature stage. EEM has been used to identify fluorescent WSOC components in aerosols from polar regions or urban backgrounds, and it has been found that different structures of WSOC fractions exhibit different oxidation properties, which may provide a clue to understand the chemical formation or loss of organic chromophores in atmospheric aerosols (Chen et al., 2016; Fu et al., 2015). Recently, this method has been gradually extended to the analysis of glacier samples and snow samples (Feng et al., 2018; Guo et al., 2022; Zhou et al., 2019b). Concurrently, parallel factor analysis (PARAFAC) is an effective approach to extracting the individual fluorescence components and their corresponding fluorescence information from complex EEMs, thus making EEM-PARAFAC a direct and viable means for exploring sources of WSOC. For example, Zhou et al. (2019b) used EEM-PARAFAC to identify the multiple sources of WSOC measured in seasonal snow in northwestern China. Accordingly, we have applied EEM-PARAFAC for our analysis of snow samples in this study.
EEM-PARAFAC can only provide plausible information about the component-specific influence of WSOC on fluorescent properties, and the quantitative fractional contributions of specific components to light absorption are still unknown. Recently, Chen et al. (2019a) collected atmospheric aerosol samples in PM2.5 over Xi'an, China, and successfully attributed the dithiothreitol (DTT) activity levels to various BrC components by coupling DTT and BrC datasets. A similar attribution method has been applied to various research areas, including climate change, extreme weather, and atmospheric environments (Cao et al., 2015; Pokrovsky, 2019; Xin et al., 2016; Zhao et al., 2019). In this study, we applied a multiple linear regression method comparable to that of Chen et al. (2019a) to derive the fractional contribution of each WSOC component to light absorption. Despite this method having been used elsewhere (Wu et al., 2022; Wu et al., 2021), it remains a highly innovative approach to evaluating the light absorption of snowpack WSOC.
Northeastern China supports an extensive snowpack during winter and spring. As a major industrial and agricultural center, this region is also the principal source of heavy airborne pollutants that are incorporated into seasonal snow via wet and dry deposition (Wang et al., 2017). Coupled with intensive tilling of farmland, the geographical proximity of northeastern China to the neighboring desert regions also provides a source of soil organic matter that becomes entrained into the snowpack (Wang et al., 2013b). Compared with research on BC–snow mixing ratios and their radiative impact in northeastern China (Dang et al., 2017; Huang et al., 2011; Pu et al., 2019), studies of WSOC are still in their infancy. To address this deficiency, we made the first investigation of the fluorescence characteristics, absorption properties, and radiative effects of WSOC in seasonal snow samples in northeastern China. Specifically, we applied EEM-PARAFAC to identify the origins and fluorescence characteristics of snowpack WSOC, after which we derived individual absorption contributions for each WSOC component using fluorescence data, an absorption data series, and an attribution method. Finally, we estimated the reduction of snow albedo and radiative forcing caused by WSOC and BC via the Spectral Albedo Model for Dirty Snow (SAMDS) radiative transfer model.
2.1 Sample collection
During January and December 2020 and January 2021, we collected 34 snow samples from sites across northeastern China, including the eastern part of Inner Mongolia and Heilongjiang and Jilin provinces. Sample numbers were set following previous campaigns (Pu et al., 2017; Wang et al., 2013b, 2017), with the exception that samples from the Changbai Mountain area are numbered individually. The geographical distribution of sampling sites and respective land-cover types are shown in Fig. 1a. The sites are characterized by five land-cover types, including forest, grassland, desert, cropland, and frozen lake/river (Fig. 1b–g). On the basis of these geographical and environmental classifications, we divided the sampling sites into five broad regions: southeastern Inner Mongolia (SEIM; Q494–495, Q497–499), the south of northeast China (SNC; Q470–471, Q473–474, Q477, Q484, Q486–Q489, Q491–Q493, Q501), the north of northeast China (NNC; Q480–483), the Changbai Mountain area (CBM; CM1–CM2, CM5, CM11, CM13–CM14), and northeastern Inner Mongolia (NEIM; Q440, Q443, Q447, Q449, Q454).
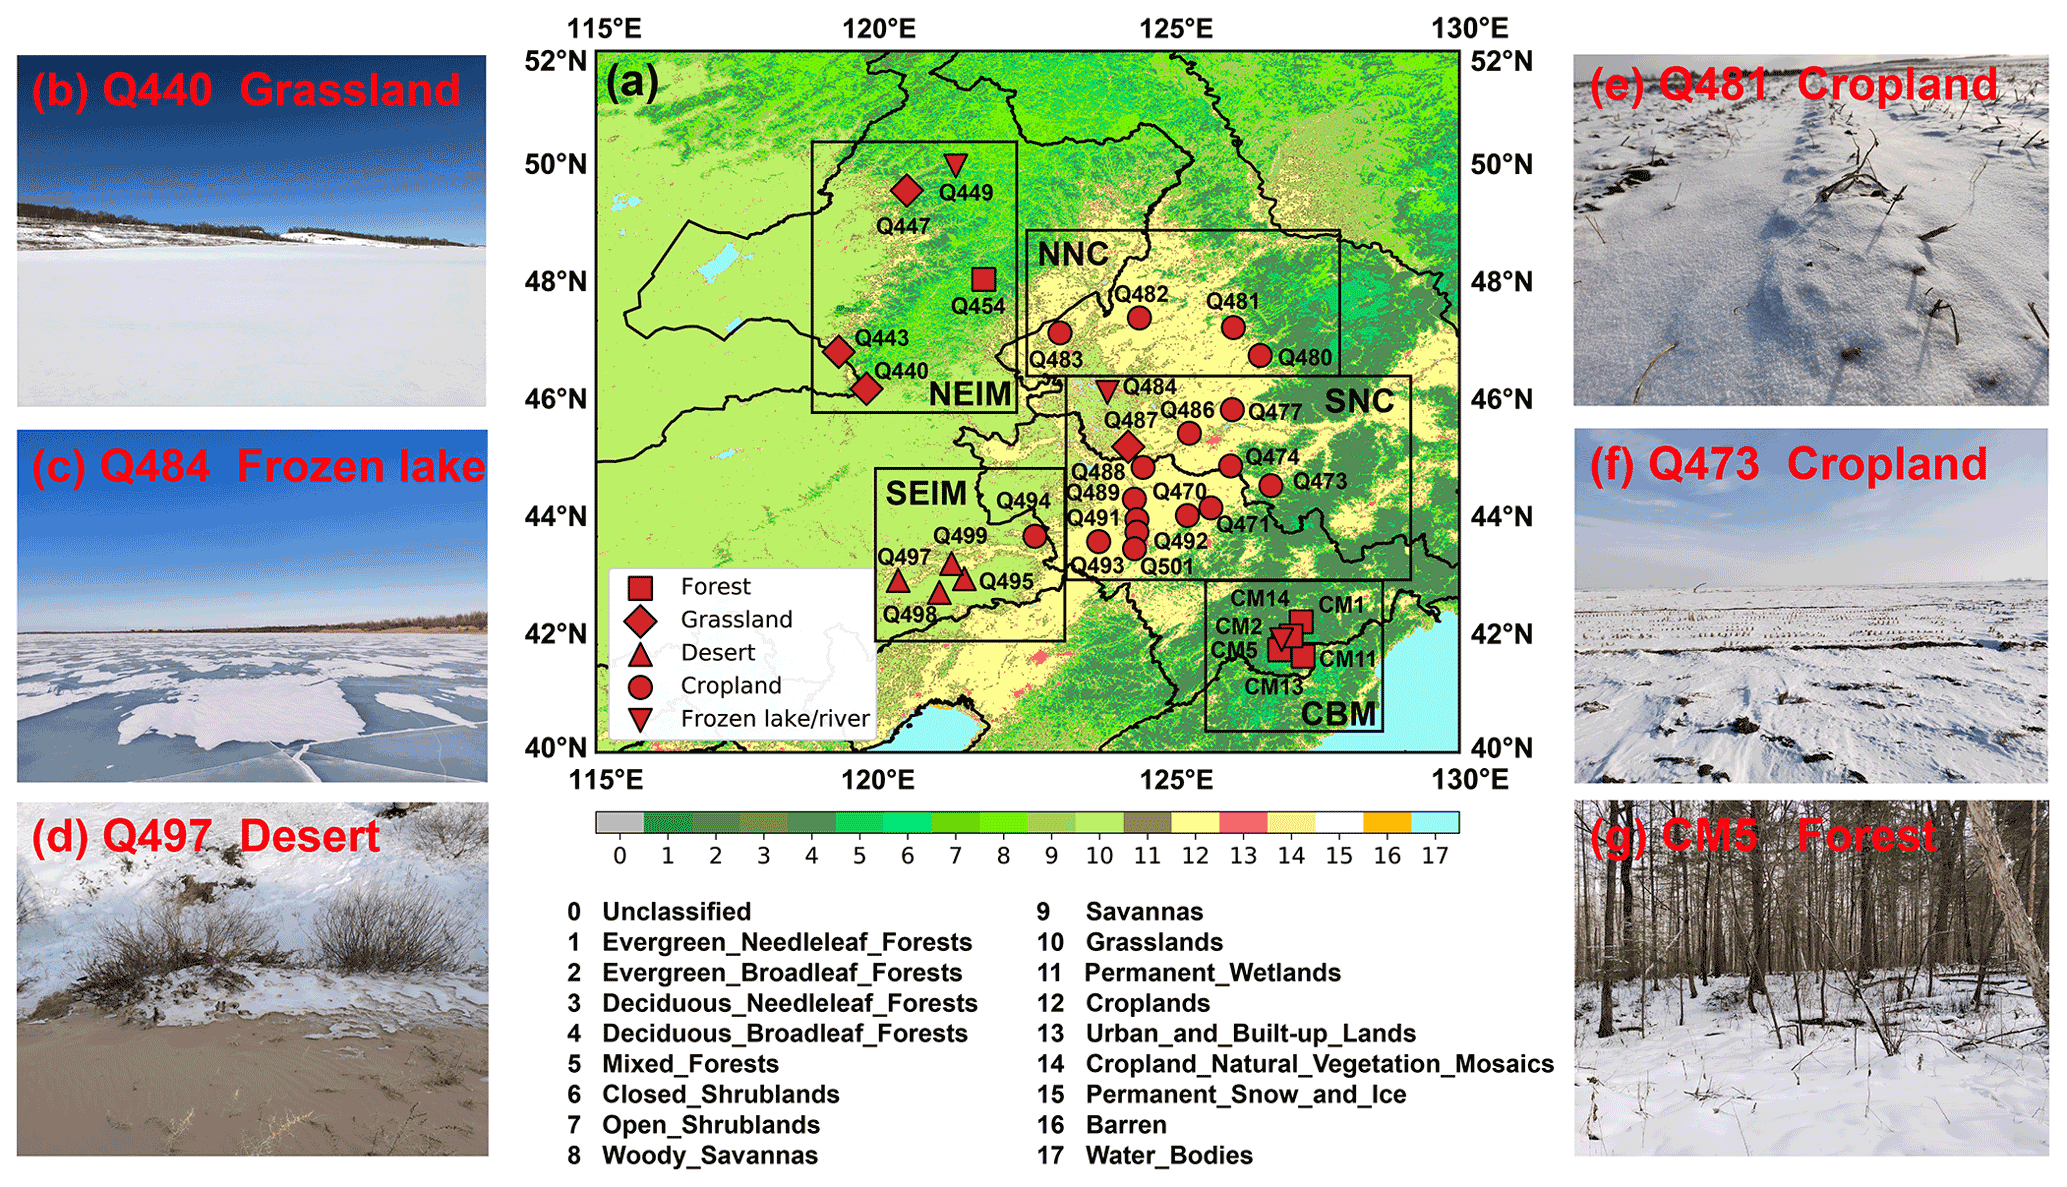
Figure 1(a) Information on sampling site distributions in northeastern China, including the land-cover type, site number, and grouping. Land-cover types are derived from Collection 5.1 of the MODIS global land-cover type dataset (MCD12Q1; https://lpdaac.usgs.gov/products/mcd12q1v006/, last access: 25 October 2022) and are indicated by specific colors and symbols relative to sampling sites. Sampling sites are divided into five groups defined by black rectangles. (b–g) Photographs depicting the typical snow and ground-cover conditions of our various sampling sites.
The sampling sites were chosen at random but had to be located ≥20 km from cities and villages and at least 1 km upwind of roads or railroads to minimize the influence of single-point pollution sources and to ensure the broadest regional representation. Furthermore, we performed sample collection oriented toward the wind to avoid contamination from personnel. At each site, we used a sterile disposable shovel to collect 0–5 cm thick samples of surface snow, which were subsequently stored in sterile Whirlpak (Nasco, WI, USA) bags. For snow depths of <5 cm, we determined the sampling depth according to the actual conditions to avoid inducting significant soil impurities during sampling. Snow samples were melted at room temperature and stored in a freezer at −20 ∘C until analysis in the laboratory. For more operational details, we refer the reader to Wang et al. (2013b).
2.2 Chemical species analysis
All collected snow samples were stored in a freezer at −20 ∘C until analysis in the laboratory. In the lab process, the samples were first melted at room temperature. Then 30 mL meltwater was taken for each sample with the clean disposable syringe (Jiangnan, Anhui, China) and injected into the pre-baked (4 h, 450 ∘C) glass bottle, passing through 0.45 µm pore-sized polytetrafluoroethylene filters (Jinteng, Tianjin, China). Finally, the concentration of WSOC was measured by the total organic carbon analyzer (Aurora 1030W, OI Analytical, TX, USA). Measurement detection limits and relative standard deviations are 2 µg L−1 and 1 %, respectively. The concentration of WSOC for the ultrapure water blank is 0.35 mg L−1, and the value of each sample after blank subtraction is presented in Table S1.
We used 0.4 µm pore-sized polycarbonate filter membranes (Whatman, USA) to isolate BC and other insoluble particles, following the protocols outlined by Wang et al. (2020), after which we employed a custom-developed two-sphere integrating-sandwich (TSI) filter-based spectrophotometer to measure particle absorption. Coupled with the mass of filtered meltwater, these optical measurements were then converted to snowpack BC concentrations. To make these calculations, we applied a BC mass-absorption coefficient (MAC) and absorption Ångström exponent (AAE) of 6.3 m2 g−1 (550 nm) and 1.1, respectively, after Pu et al. (2017). We note that TSI provides greater accuracy and smaller overall uncertainties in the quantification of seasonal snow BC than thermo-optical carbon analysis does (Wang et al., 2020), and thus it has been applied widely in this type of research (Shi et al., 2020). For more detailed information, see Wang et al. (2013b).
2.3 Fluorescence and absorption measurement
We obtained absorbance and fluorescence EEMs for filtered meltwater samples via synchronous absorption–3D fluorescence scanning spectrometry (Aqualog, Horiba Scientific) with the following measurement parameters: fluorescence spectra excitation range =240–800 nm in 3 nm intervals, emission range =152.25–929.92 nm in 5.04 nm (8 pixels) intervals, scanning interval = 0.3 s. Prior to sample measurement, the aliquots of filtered ultrapure water were analyzed (18.2 Mω cm, Milli-q Purification System, Millipore) as analytical blanks. The fluorescence intensity was normalized to that of the water Raman unit (RU), which exhibited a peak excitation wavelength of 350 nm, and this Raman signal was deducted from all subsequent sample tests (Lawaetz and Stedmon, 2009). The inner filtration effect correction was based on the absorbance-based approach (Kothawala et al., 2013), using the measured absorbance at each pair of excitation and emission wavelengths across the EEMs to convert the observed fluorescence intensity into the corrected fluorescence intensity. Rayleigh scattering peaks were processed by the interpolation algorithm in the EEMscat MATLAB toolbox (Bahram et al., 2006). As fluorescence signals with wavelengths greater than 600 nm are primarily noise (Zhou et al., 2019b), they are not considered further in this study.
We used version 0.6.3 of the MATLAB drEEM toolbox (http://dreem.openfluor.org/, last access: 25 October 2022; Murphy et al., 2013) to perform PARAFAC analysis on EEMs. Comprising the consistency index, residuals, and visual inspections, the three-component model was considered more reliable and representative than the two- to seven-component models (Fig. S1 in the Supplement) and passes the S4C6T3 split scheme (Fig. S2; Murphy et al., 2013). The contributions of these three components to the overall fluorescence signal were expressed as relative percentages of Fmax in RU, and the total fluorescence volume (TFV; RU nm2) was calculated from the EEMs (Song et al., 2019). Normalized TFV equates to normalized fluorescence volume (NFV; RU nm2 (mg L), using , where c(WSOC) is the concentration of WSOC in the snow (mg L−1)) and represents the fluorescence ability of WSOC (Chen et al., 2019a).
We calculated three fluorescence-derived indices – the fluorescence index (FI), biological index (BIX), and humification index (HIX) – from the ratio of fluorescence intensity at specific excitation and emission wavelengths. As demonstrated by previous studies (Birdwell and Valsaraj, 2010; Huguet et al., 2009; McKnight et al., 2001), these ratios can help characterize potential sources of WSOC. Specifically, the FI is taken to represent the relative amount of dissolved organic matter (DOM) derived from terrestrial and microbial/algae sources (McKnight et al., 2001); high values correspond to terrestrially derived organics, and low values reflect microbial sources. The HIX describes the degree of humification of soluble organic matter (Zsolnay et al., 1999). During humification, the aromaticity of organic matter increases as microbial availability decreases, such that higher HIX values correspond to more strongly humified and/or higher aromaticity organics (principally of terrestrial origin), whereas lower values indicate autochthonous or microbial origins. As a measure of autochthonous productivity (Huguet et al., 2009), elevated BIX values are associated with increased contributions of microbial-derived fluorescent organic matter. The three indices are calculated by the following equations (Feng et al., 2016; Huguet et al., 2009; McKnight et al., 2001; Ohno, 2002):
where I is the fluorescence intensity, and Ex and Em represent the excitation and emission wavelengths, respectively. To ensure a direct comparison with prior results, we recalculated published HIX data using the same calculation methods as in our analyses. According to a previous study, FI values of ≤1.4 correspond to terrestrial sources, and values of ≥1.9 denote a primarily microbial origin. The values of 1.4–1.9 suggest a mixed origin (McKnight et al., 2001).
The absorption spectra of WSOC were derived from 240 to 800 nm in 3 nm intervals. The baseline shifts and scattering effects of the measurement for the absorption spectra were corrected by subtracting the average absorbance above 600 nm from the whole spectrum (Chen et al., 2019b). We converted sample absorbance to an absorption coefficient using the following equation:
where Abs is absorbance, λ is the wavelength, L is the path length of the cuvette (0.01 m), and aWSOC is the absorption coefficient (m−1).
Owing to the absorption characteristics of WSOC, we selected the absorption coefficient at 280 nm (aWSOC(280)) to characterize the absorption intensity of WSOC for comparison with other studies (Zhang et al., 2009).
To investigate the wavelength dependence of WSOC absorption, we obtained the absorption Ångström exponent (AAE) via the following equation (Doherty et al., 2010; Niu et al., 2018; Wang et al., 2013b; Yan et al., 2016):
where K is a constant related to WSOC concentration.
We calculated the mass absorption coefficient (MACλ; m2 g−1) of our samples using the following equation (Chen et al., 2019b; Yan et al., 2016):
where aWSOC is the absorption coefficient derived from Eq. (4), and c(WSOC) (mg L−1) is the concentration of WSOC.
2.4 Snow albedo modeling and radiative forcing calculations
To reveal the radiative effect impact of snowpack WSOC in northeastern China, we used SAMDS to simulate spectral snow albedo. This model is based on the asymptotic radiative transfer theory, which has been verified in previous studies (Li et al., 2021b; Wang et al., 2017). As described in detail by Wang et al. (2017), the model involves parameters including solar zenith angle, impurity concentrations, the mass absorption coefficient of impurities, and snow grain radius. Measured values include the concentration of BC and the absorption coefficients of WSOC. To quantify the influence of pollutants on snow albedo, we assumed a semi-infinite snow layer and a uniform snow grain radius of 100 µm for fresh snow and 1000 µm for old snow, consistent with previous studies (Pu et al., 2021). With the solar zenith angle fixed at 60∘, consistent with our sampling dates and locations, we calculated the reduction (Δαi, i represents BC only, WSOC only, and BC + WSOC, similarly hereinafter) in spectral snow albedo derived from different types of impurities for the UV–Vis (280–400 nm) and ultraviolet–near-infrared (UV–NIR; 280–1500 nm) bands. The radiative forcing resulting from either BC or WSOC in snow (RFi) was then derived by multiplying the albedo reduction value by the incident solar radiation (Painter et al., 2013):
where αpure is snow albedo for pure snow, and E is the average daily downward shortwave solar radiation flux acquired from NASA's Clouds and the Earth's Radiant Energy System (CERES) product “CERES SYN1deg” (https://ceres.larc.nasa.gov/products.php?product=SYN1deg, last access: 25 October 2022).
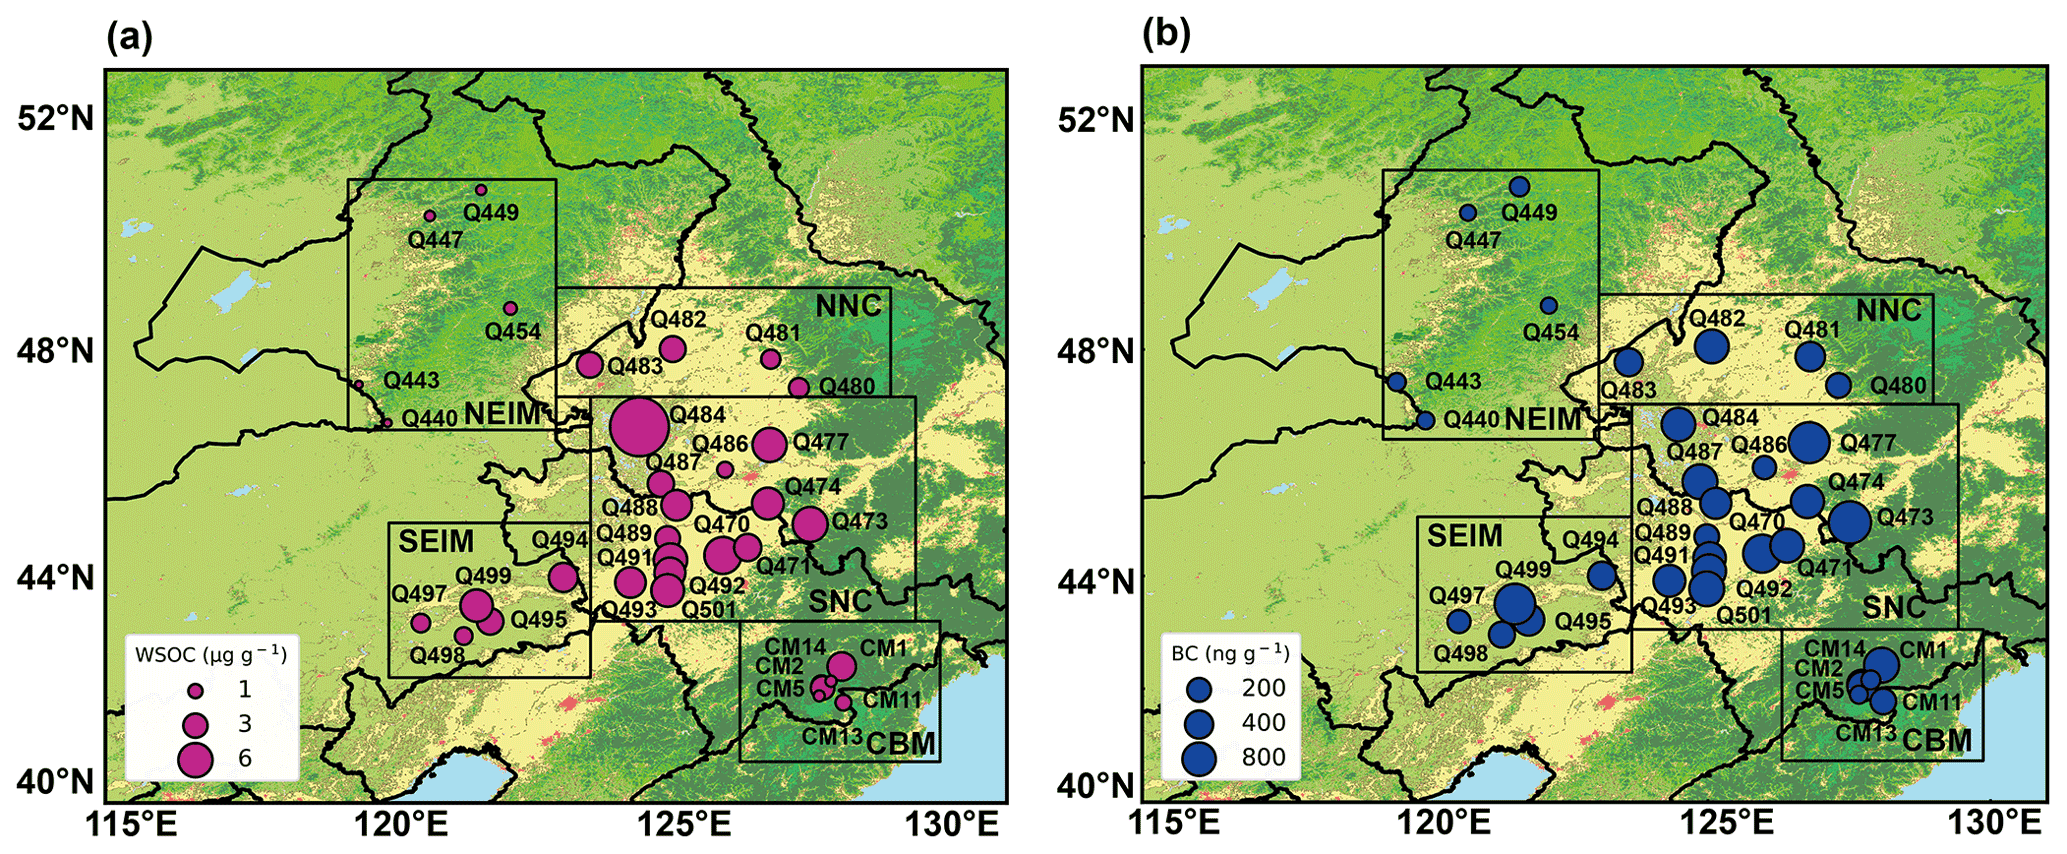
Figure 2Spatial distributions of concentrations of (a) WSOC and (b) BC in snow samples. Sampling sites are divided into the five groups defined in Fig. 1. Bubble sizes are proportional to concentrations of WSOC and BC.
3.1 Characteristics of chemical species
Figure 2a shows the spatial distribution of measured WSOC in seasonal snow across northeastern China. The averaged WSOC concentration (arithmetic mean ± standard deviation) is 3.6±3.2 µg g−1, with a maximum of 18 and a minimum of 0.3 µg g−1. Among all five regions, WSOC concentrations are highest in SNC (average 5.7±3.7 µg g−1), likely reflecting the greater degree of agricultural and industrial activity there compared with other regions (Lu et al., 2011; Wang et al., 2013b). We highlight that both agricultural and industrial sources are considered anthropogenic. In contrast, the second highest measured concentrations (3.4±1.5 µg g−1) are from SEIM, where desertification occurs (Fang et al., 2007), and that is considered a natural source of WSOC. For most sites, the underlying surface is desert (Fig. 1a) that was incompletely covered by seasonal snow during the sampling period (Fig. 1d). Consequently, the exposure of natural sandy soils is a potentially significant contributor to WSOC through aeolian erosion and dry deposition. In NNC, where both the population density and agricultural intensity are lower than in SNC (Choi et al., 2020), the contribution of anthropogenic pollution to the snowpack is correspondingly lower, resulting in a moderate WSOC concentration of 2.7±0.8 µg g−1. Meanwhile, being far from intensive human activity, both the CBM and NEIM (Fig. 1a, b, and g) return the low WSOC concentrations (CBM: 2.0±1.3 µg g−1; NEIM: 0.5±0.2 µg g−1). Nonetheless, the higher value for the CBM betrays the influence of far-traveled anthropogenic pollutants (Wang et al., 2015; Wu et al., 2020; Zhang et al., 2013).
In comparison with previous studies, we observe that, with the exception of NEIM, our measured WSOC concentrations are significantly higher than those reported for snow/ice from the Tibetan Plateau (∼ 0.71–1.02 µg g−1; Feng et al., 2016), the Alps (∼ 0.14–0.78 µg g−1; Vione et al., 2021), North America (∼ 0.1–0.3 µg g−1; Fellman et al., 2015), and polar regions (∼ 0.12–0.27 µg g−1; Antony et al., 2014) but comparable to values in Laohugou glacier ice from the Tibetan Plateau (∼ 1.02–2.6 µg g−1; Feng et al., 2016, 2018) and seasonal snowpack in northwestern China (0.48–7.07 µg g−1; Zhou et al., 2021). This finding implies that snowpack WSOC in northeastern China is significantly contributing to regional and global climate change (Domine, 2002).
A similar spatial pattern is exhibited by snowpack BC (Fig. 2b). For example, of all five regions, the regional mean BC concentration is highest for SNC (923±512 ng g−1), followed by SEIM (659±582 ng g−1), NNC (494±224 ng g−1), and the CBM (391±312 ng g−1). BC concentrations are lowest in NEIM (60±19 ng g−1), in agreement with the values in remote areas reported by Doherty et al. (2010).
3.2 Fluorescence characteristics of WSOC
Three fluorescent components (C1–C3) were captured by resolving the EEMs. All fluorescence information is summarized in Table S2. C1 exhibits a primary peak at Ex=240 nm, Em=448 nm, indicating the high-oxygenated HULIS found primarily in aromatic conjugated macromolecules (Chen et al., 2016). The weaker secondary peak occurs at longer excitation wavelengths ( nm), implying a higher aromatic content and greater molecular weight (Coble et al., 1998). Wen et al. (2021) concluded that C1 was probably derived from natural terrestrial sources, such as dust and soil, as proposed originally by Stedmon et al. (2003) and Osburn et al. (2016). Accordingly, we classified C1 as a terrestrial, humic-like substance, hereafter referred to as HULIS-1.
C2 exhibits a primary (secondary) peak at Ex=240 (293) nm, Em=398 nm, suggestive of the lower-oxygenated HULIS (Chen et al., 2016). Observed in a variety of sources, Stedmon et al. (2003) reported this component in terrestrial end-member samples, whereas both Murphy et al. (2011) and Osburn et al. (2016) have since linked C2 to anthropogenic sources, such as urban runoff and sewage. Microbial activity and the degradation of phytoplankton in natural aquatic systems are also thought to contribute to this component (Yamashita et al., 2008; Zhang et al., 2009). Accordingly, we classified C2 as humic-like substances with complex origins in terrestrial, anthropogenic, and/or microbial sources, hereafter termed HULIS-2. Unlike HULIS-1 and HULIS-2, C3 is recognizable as a UVB-like protein or tyrosine-like fluorescence (hereafter PRLIS) with a primary (secondary) peak at Ex=240 (293) nm, Em=398 nm (Osburn et al., 2016; Stedmon and Markager, 2005). PRLIS reflects autochthonously labile DOM produced by biological processes (Stedmon et al., 2003) and has been reported in previous studies of seasonal snow (Zhou et al., 2019b).
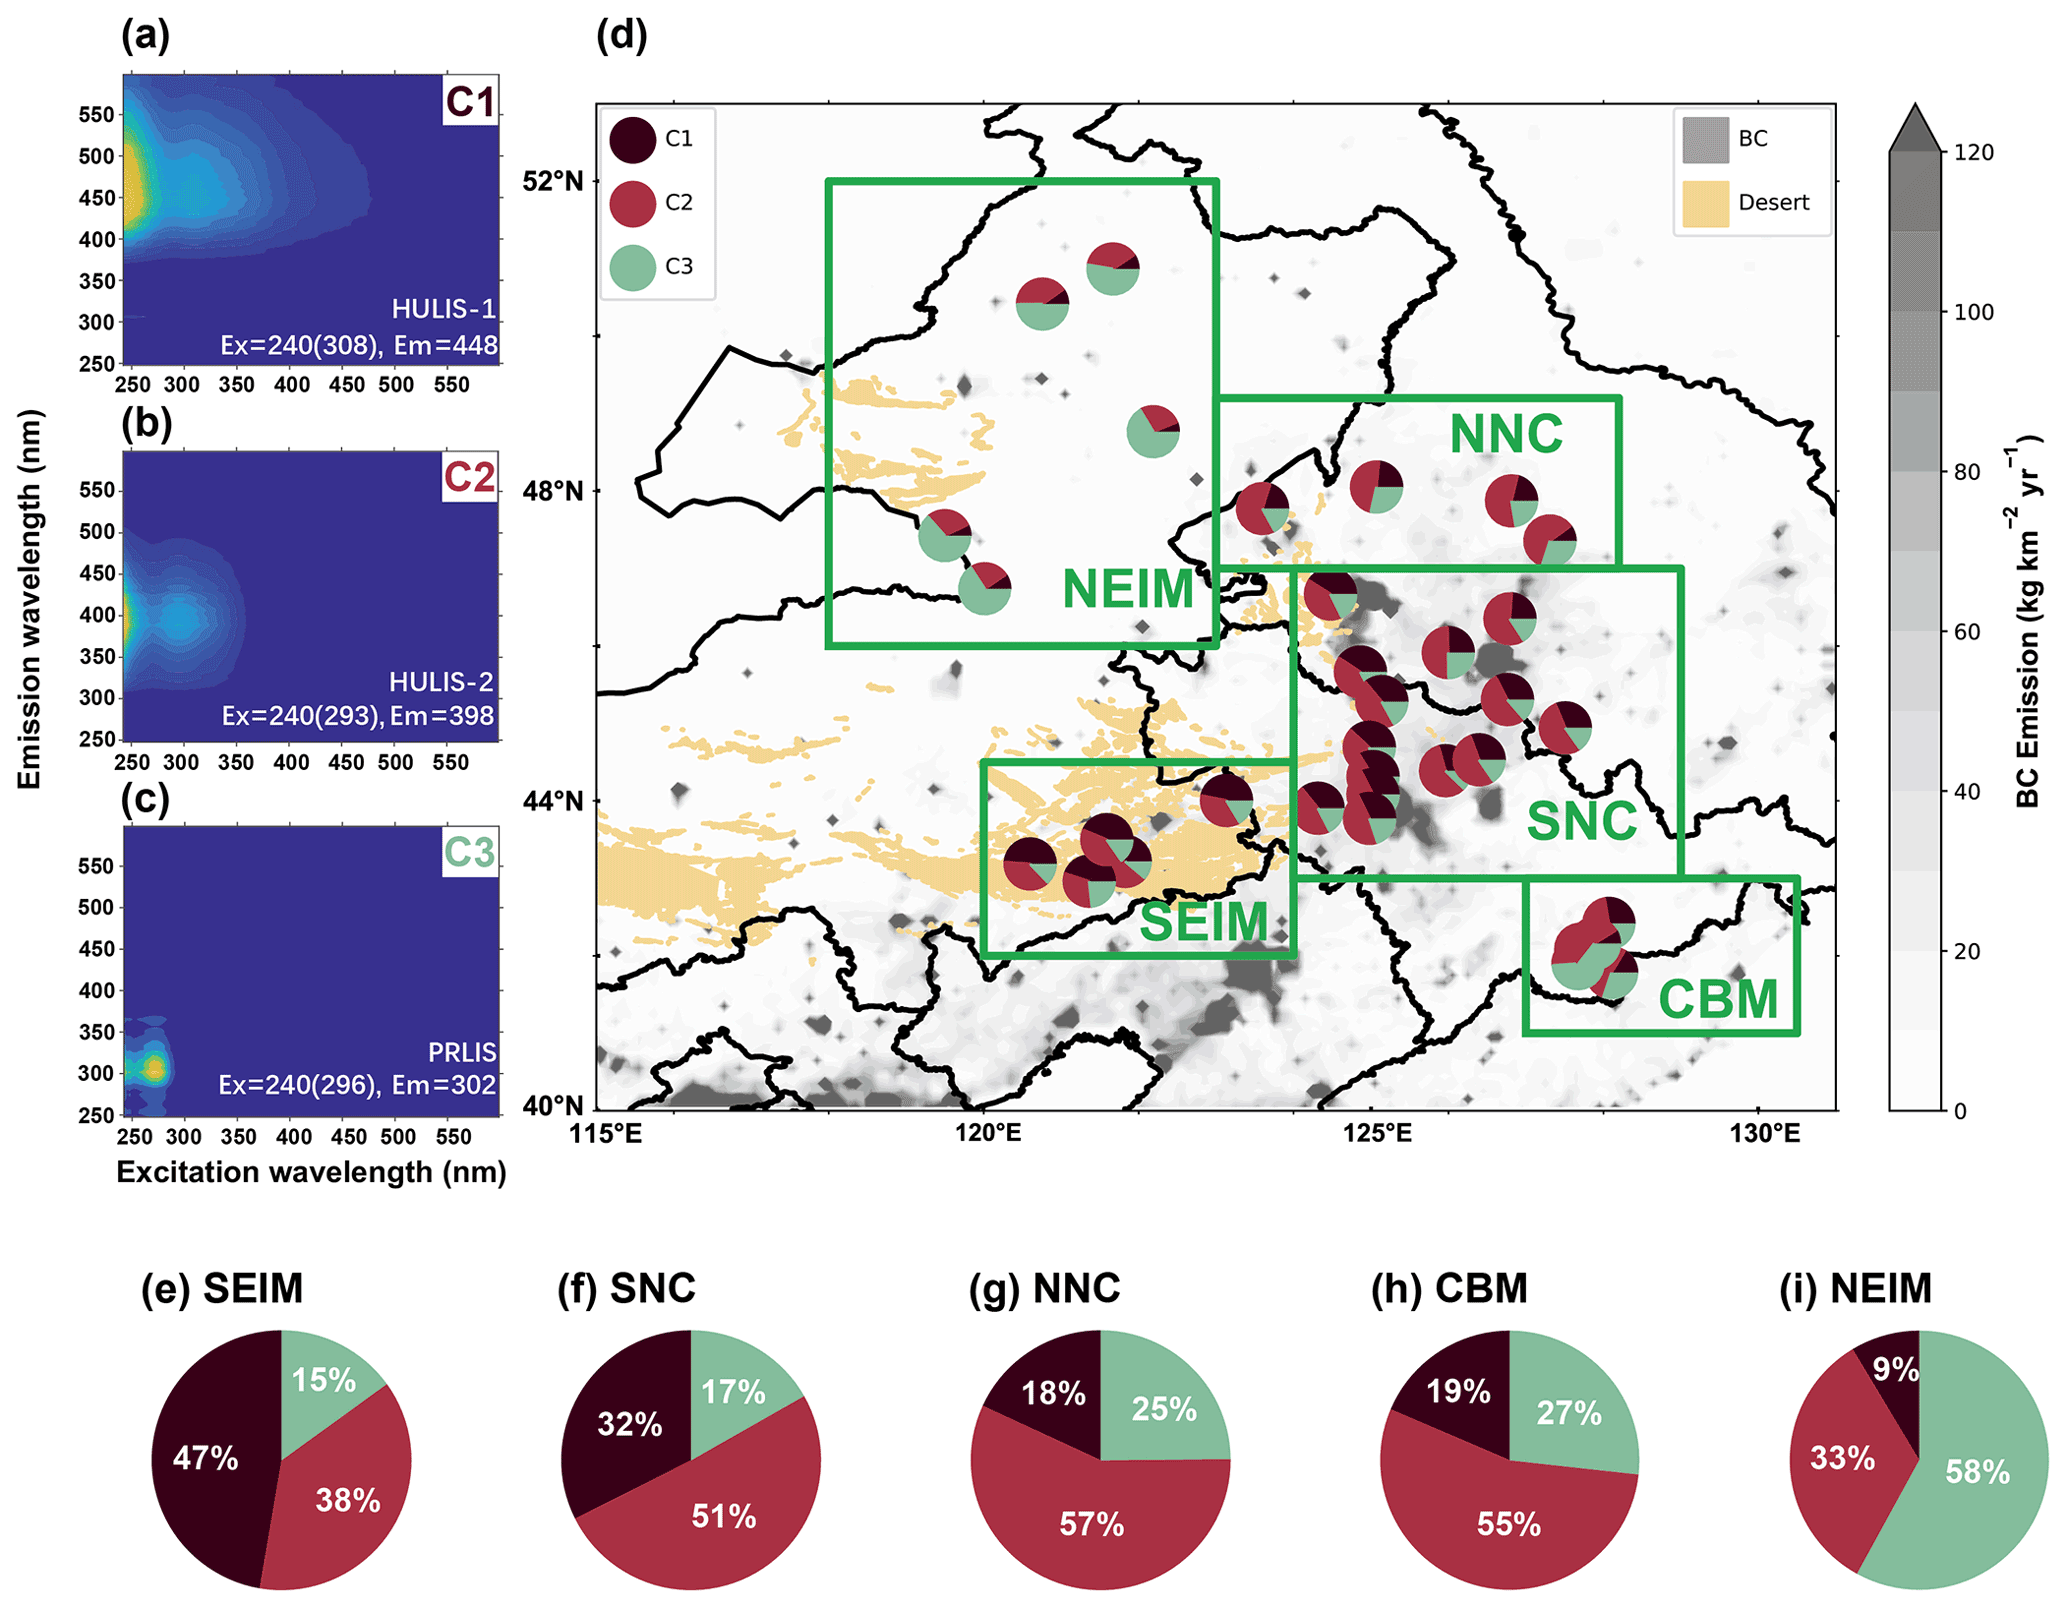
Figure 3(a–c) Three fluorescent components identified by PARAFAC analysis. (d) Relative contributions of the three components to total fluorescence at each site. HULIS-1, HULIS-2, and PRLIS are represented by the specific colors shown in the legend (top left corner). The distributions of BC emissions and desert areas in our study area are indicated by gray and light yellow, respectively, with darker gray colors indicating higher black carbon concentrations. (e–i) Average contributions of the three components in different groups of samples. BC emission data are derived from the research group at Peking University (http://inventory.pku.edu.cn/home.html, last access: 25 October 2022; Wang et al., 2014a); the Chinese desert (sand) distribution dataset is provided by the National Tibetan Plateau Data Center (http://poles.tpdc.ac.cn/zh-hans/data/122c9ac2-53ee-4b9a-ae87-1a980b131c9b/, last access: 25 October 2022; Wang et al., 2013a).
Figure 3d depicts the spatial distribution of the relative contribution of three components to fluorescence, with the regional averages given in Fig. 3e–g. In SEIM, the greatest contribution is that of HULIS-1 (47 %), followed by HULIS-2 (38 %) and PRLIS (15 %), indicating that the signal is dominated by local soil/dust sources, consistent with the local environment (Figs. 2 and 3d). HULIS-2 plays a greater role in SNC, where it accounts for half of the total fluorescence signals, with HULIS-1 is being next most important. This difference in key components between SEIM and SNC illustrates the change in the primary source of fluorescence intensity. Indeed, although HULIS-2 might be derived from any combination of terrestrial, anthropogenic, and microbial sources (Osburn et al., 2016; Stedmon et al., 2003; Yamashita et al., 2008; Zhang et al., 2009), human activity (e.g., agriculture, industrial emissions) is most intensive in SNC (Figs. 1a and 3d; Guo and Hu, 2022). Therefore, our combined analysis suggests that the anthropogenic source is the main contributor to seasonal snow in SNC. The conclusion is also in good agreement with the previous study (Zhou et al., 2019b). As in SNC, HULIS-2 also represents approximately half of the fluorescence signal in both NNC and the CBM. The background environment of NNC is similar to that of SNC, with dense urban cities and populations. In the CBM, which is heavily forested (Fig. 1a; Guo and Hu, 2022), the long-range transport of anthropogenic pollutants is responsible for the dominance of HULIS-2, as discussed in Sect. 3.1. HULIS-1 accounts for less than PRLIS in both NNC and the CBM, which we posit reflects the concealment of bare soil surfaces by deep snow and the importance of biological processes due to the heavy vegetation cover. PRLIS accounts for >50 % of the total fluorescence signal in NEIM, followed by HULIS-2; HULIS-1 contributes relatively little in this region. We attribute this pattern to both the extensive grassland and forest cover, which obscures bare soil surfaces and the distance from anthropogenic pollution. These together serve to amplify the importance of biological processes (Zhou et al., 2019a). Taken as a whole, the respective contributions of HULIS-1, HULIS-2, and PRLIS to the fluorescence signals in our study area are ∼ 30 %, ∼ 50 %, and ∼ 20 %, respectively. We note that these findings correspond well with the background environmental conditions.

Figure 4(a) Variations in fluorescence-derived indices among the five groups. Boxes denote the 25 and 75 quantiles, and horizontal lines represent median values. Averages are shown as small boxes, and the whiskers denote maximum and minimum data. (b) Comparison plots of HIX versus FI for the seasonal snow surface samples (colored dots) from northeastern China, together with the average and standard deviation of different types of WSOC (gray markers) adapted from Arctic aerosols (a Fu et al., 2015), Spanish urban aerosols (b Mladenov et al., 2011), seasonal snowpack in northwestern China (c Zhou et al., 2019b), Chinese lakes and rivers (d,e Zhou et al., 2017), fog water from Tai Mountain, China (f Birdwell and Valsaraj, 2010), cave water from Frasassi Caves, Italy (g Birdwell and Engel, 2010), and spring water in the USA (h Birdwell and Engel, 2010). Shaded areas represent mixed WSOC signatures.
The FI, BIX, and HIX indices reveal spatial variability in fluorescence characteristics and thus permit the tracing of potential sources. Regionally averaged FI, BIX, and HIX values are depicted in Fig. 4a. Our results show that the FI values are 1.34–1.94 (mean = 1.49), BIX values are 0.46–1.17 (mean = 0.74), and HIX values are 0.30–0.84 (mean = 0.64). By comparison, reported mean FI, BIX, and HIX values for seasonal snow in Xinjiang (northwestern China) are 1.42, 0.76, and 0.55, respectively (Zhou et al., 2019b), suggesting that the impacts of WSOC humification and aromaticity are slightly greater in the study area than in Xinjiang. This outcome implies a relatively strong terrigenous signal and correspondingly weaker biogenic signal in the seasonal snowpack of northeastern China. Regionally, SEIM exhibits the lowest FI (mean = 1.40) and BIX (mean = 0.49) values but the largest HIX value (mean = 0.80), further confirming the strong influence of highly aromatic, terrestrially derived WSOC in this region relative to the others. In contrast, NEIM returns the highest FI (mean = 1.74) and BIX (mean = 0.89) values but the lowest HIX value (mean = 0.38), indicating the dominance of low-aromatic WSOC of microbial origin. Intriguingly, our results reveal that FI and BIX rise generally with decreasing (increasing) fractional contributions of HULIS-1 (PRLIS), whereas HIX exhibits a similar but contrasting pattern. Together, the comprehensive dataset described above verifies the regional variability in the terrestrial contributions to WSOC, with SEIM > SNC > NNC > CBM > NEIM. This pattern is reversed for microbially sourced WSOC.
Figure 4b illustrates HIX versus FI as a scatter plot, compared with published data for different sample types; the shaded area depicts the region in which the FI value is >1.4 but <1.9. In general, FI exhibits a rising trend with declining HIX across northeastern China. For both SEIM and SNC, FI occupies a narrow range centered on 1.4, indicating either a predominantly terrestrial or mixed origin. We note that these results are comparable to those of fog water from the Tai Mountain, Arctic atmospheric aerosols, and seasonal snow in northwestern China (Birdwell and Valsaraj, 2010; Fu et al., 2015; Zhou et al., 2019b). Further, we highlight that HIX values are marginally higher in SEIM than elsewhere, suggesting a stronger influence from highly humified WSOC that probably reflects the extensive deserts and exposed earth in this region. FI values for NNC and the CBM fall within the range of 1.4–1.7 and thus reflect a mixed origin, in line with previous data from urban aerosols in Spanish and Chinese river water samples (Mladenov et al., 2011; Zhou et al., 2017). When combined, the FI and HIX values for NNC and the CBM snowpack indicate that WSOC in these regions bears a stronger terrestrial signature than water samples from Chinese lakes and Italian caves do (Birdwell and Engel, 2010; Zhou et al., 2017). Finally, FI values for NEIM fall within a range of 1.6–2.0, comparable to values for spring water in the USA (Birdwell and Engel, 2010), thus implying a predominantly microbial or mixed origin.

Figure 5Spatial distribution of (a) aWSOC(280) (m−1), (b) TFV (RU nm2), (c) MAC280 (m2 g−1), and (d) NFV (RU nm2 (mg L). Regional averages for (e) aWSOC(280), TFV, and (f) MAC280, NFV, for the five groups. Error bars in (e) and (f) represent the standard deviations of aWSOC(280), MAC280, TFV, and NFV for the five groups, respectively.
3.3 Comparisons of fluorescence and absorption characteristics
Figure 5a describes the spatial distribution of aWSOC(280) as WSOC absorption in the snowpack of northeastern China; Fig. 5b depicts TFV as a measure of the spatial distribution of absolute WSOC fluorescence intensity for comparison. In general, TFV and aWSOC(280) both exhibit large spatial variability in the range of 690–18 600 RU nm2 and 0.42–16.98 m−1, respectively. Regional mean values are 7700±2800 RU nm2 (TFV) and 6.90±2.39 m−1 (aWSOC(280)) for SEIM, 12 400±4300 RU⋅ nm2 (TFV) and 11.48±3.96 m−1 (aWSOC(280)) for SNC, 7800±500 RU nm2 (TFV) and 7.02±0.88 m−1 (aWSOC(280)) for NNC, 3900±2500 RU nm2 (TFV) and 3.97±2.46 m−1 (aWSOC(280)) for the CBM, and 1000±300 RU nm2 (TFV) and 0.83±0.23 m−1 (aWSOC(280)) for NEIM. We note that both distributions are consistent in space (Fig. 5e), with the highest concentrations in SNC and the lowest in NEIM. Moreover, the aWSOC(280) value for SNC is an order of magnitude larger than that for NEIM, implying that the impact of WSOC on snow albedo at UV wavelengths is significant in SNC but less notable in NEIM in general (see Sect. 3.5). Previous work has reported a similarly broad range of snowpack aWSOC(280) (0.15–10.57 m−1) in northwestern China (Zhou et al., 2019b).
Two additional fluorescence and absorption capacity indices, identified as NFV and MAC280, are proven tools for revealing WSOC's fluorescence and absorption characteristics, and they are related to chemical composition, structure, and source (Chen et al., 2019a). For the present study area as a whole, mean NFV and MAC280 values are 2412±374 RU nm2 (mg L and 2.2±0.5 m2 g−1, respectively. Both indices exhibit a narrow range, with regional means ranging from 2100±600 to 3100±800 RU nm2 (mg L and from 1.8±0.6 to 2.7±0.4 m2 g−1, respectively, in contrast to the broad inter-regional disparities in TFV and aWSOC(280). Moreover, the spatial patterns of NFV and MAC280 are similar, with the highest values in NNC. We speculate that this result reflects the comparatively high low-oxygenated HULIS-2 fraction measured in the NNC samples (Fig. 3g), as the lower-oxygenated BrC (e.g., HULIS-2) has a higher absorption capacity (Browne et al., 2019).
Scatter plots of aWSOC(280) versus TFV, Fmax(HULIS-1), Fmax(HULIS-2), and Fmax(PRLIS) are provided in Fig. S3 to further demonstrate the close relationship between fluorescence and the absorption characteristics of WSOC in our snow samples. As samples Q480, Q484, and Q477 deviate considerably from the respective confidence intervals, we did not include them in our analyses. Surprisingly, we found that TFV is closely correlated to aWSOC(280), with P<0.001 and all data points located close to the line of best fit, indicating that the three components (HULIS-1, HULIS-2, PRLIS) contributing to the total fluorescence are also responsible for the majority of absorption. For each component, our data show that Fmax(HULIS-1) is most closely correlated with aWSOC(280), followed by Fmax(HULIS-2). The correlation between Fmax(PRLIS) and aWSOC(280) is the weakest, yet it is still significant (P<0.001). Together, our results imply that HULIS-1 is probably the greatest contributor to light absorption, with PRLIS being the least important.
3.4 Fractional contributions of different WSOC components to light absorption
In this study, we applied a multiple linear regression method comparable to that of Chen et al. (2019a) to derive the fractional contribution of each WSOC component to light absorption. Table S3 lists the statistical results of the fitted light absorption coefficient, based on the Fmax data for three fluorescent components of EEM analysis. As the fitted results can explain ∼ 94 %–99 % of the variance in measured light absorption within the 280–400 nm range, we conclude that the fusion of multiple fluorescent components is an effective means of describing most of the spatial features of WSOC light absorption throughout northeastern China. Accordingly, the wavelength-dependent fractional contributions of each component of light absorption in this band (280–400 nm) are reported in Fig. 6. For the entire study area, light absorption is dominated by high-oxygenated HULIS-1, which accounts for ∼ 56 %–65 % of the contribution across UV wavelengths. Furthermore, the contribution of HULIS-1 first increases with increasing wavelength from 280 to ∼ 340 nm and then decreases. In contrast, HULIS-2 exhibits a valley-type pattern in terms of its fractional contribution at wavelengths between 280 and 400 nm and is responsible for ∼ 19 %–30 % of all light absorption.

Figure 6Relative contributions of the three components to the total absorption of samples in (a) the whole study area and (b–f) each of the five groups.
PRLIS contributes the least (∼ 12 %–17 %) to light absorption and exhibits a similar wavelength-dependent pattern to HULIS-1. These results are consistent with the qualitatively comparative analysis described in Sect. 3.3. Previous studies have also highlighted this dominance of high-oxygenated compounds in WSOC light absorption, based on samples impacted by naturally and anthropogenically derived soils (Zhou et al., 2022). Conversely, the total absorption coefficient of WSOC decreases with the increasing wavelength between 280 and 400 nm, in accord with previous studies (Andreae and Gelencser, 2006; Chakrabarty et al., 2010; Gustafsson et al., 2009; Wu et al., 2019). The AAE lies primarily between 5.0 and 8.0 (mean =6.6) in the range of 280–400 nm, which is in agreement with results from snow collected from the Arctic, the northern Tibetan Plateau, and northwestern China (Voisin et al., 2012; Yan et al., 2016; Zhou et al., 2021).
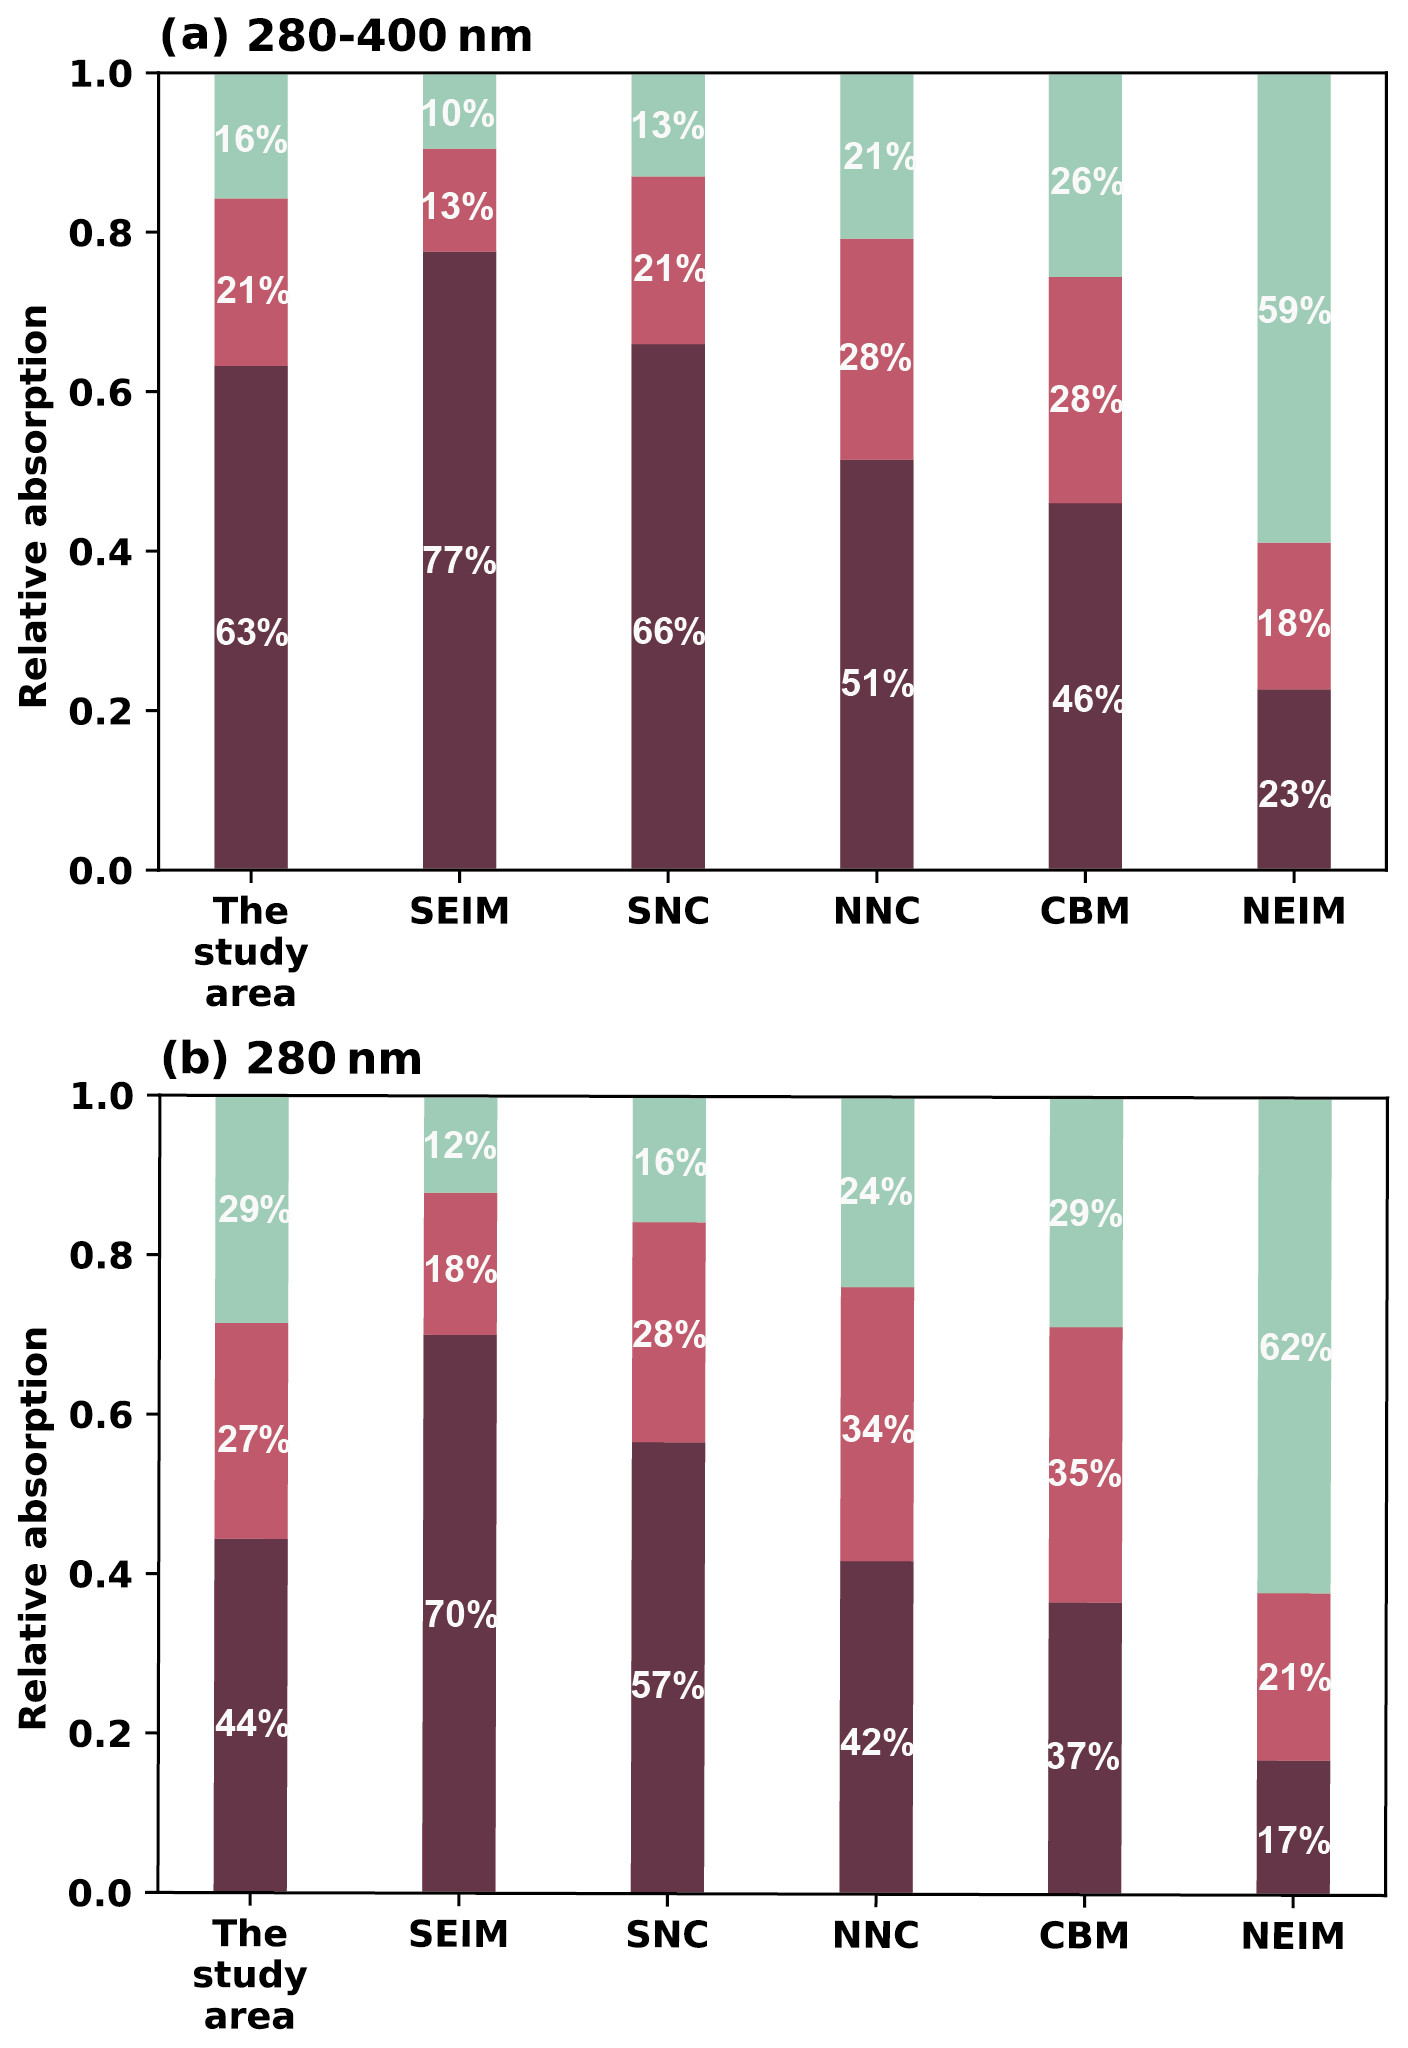
Figure 7Regional averages for the relative contributions of the three fluorescent components to light absorption at wavelengths of (a) 280–400 nm and (b) 280 nm.
For each component, the wavelength-dependent variability in light absorption is similar among all five regions, although the magnitude of each contribution varies from region to region. Moreover, compared with the spectral results, the solar-radiation-weighted broadband light absorption is a more meaningful parameter for researchers studying climate change and atmospheric radiation. Therefore, the broadband results in Fig. 7a for 280–400 nm absorption contributions – HULIS-1 (62 %), HULIS-2 (21 %), and PRLIS (17 %) – are average values for the whole study area. On a regional scale, the HULIS-1 contribution to light absorption (280–400 nm) follows the spatial pattern SEIM > SNC > NNC > CBM > NEIM. We note that HULIS-1 dominates light absorption in SEIM, SNC, and NNC but has a minor impact in NEIM compared with the other two components. In contrast, the impact of HULIS-2 varies only slightly among the five regions, with the greatest contributions in NNC and CBM and the lowest in NEIM. The contribution of PRLIS is essentially opposite to that of HULIS-1, being dominant in NEIM but of relatively minor importance elsewhere. As shown in Fig. 7b, light absorption contributions at 280 nm are consistent with the broadband results (Fig. 7a) in terms of the regional pattern, although specific values differ because of the different wavelength-dependent properties of light absorption for the three WSOC components.
We find it noteworthy that, for each component, the overall regional pattern of its contribution to light absorption aligns with its impact on fluorescence signals, thereby confirming the viability of the attribution analysis employed in this study. Nonetheless, we observed that the magnitude of each component's contribution varies relative to its respective fluorescence signal. For instance, HULIS-1 returns a greater contribution to light absorption than its fluorescence signal, in contrast to HULIS-2. One plausible explanation for this discrepancy is that the apparent fluorescence quantum yields (AQYs), which are essentially the ratio of fluorescence intensity versus absorption intensity, are different for each component. Indeed, in their comprehensive field-based study of BrC fluorescence and absorption properties in northern China, Wen et al. (2021) reported that the AQYs of WSOC decrease with increasing HIX, meaning that components with higher HIX values, such as HULIS-1, have lower AQYs than HULIS-2. Thus, the contribution of HULIS-1 to the fluorescence signals will be smaller than its contribution to light absorption, and vice versa for HULIS-2.
3.5 Albedo reduction and radiative forcing attributed to snowpack WSOC
The strong light absorption of WSOC in UV bands has important ramifications for snow albedo and radiative forcing throughout northeastern China. However, owing to the chemical and optical complexity of WSOC components, quantitative estimates for snowpack light absorption remain poorly understood. For example, although prior work in northeastern China has focused on BC (Wang et al., 2013b) and other water-insoluble light-absorbing particles (Wang et al., 2017; Zhao et al., 2014) via field measurements, model simulations, and satellite remote sensing (Pu et al., 2019), the specific impacts of WSOC have not been studied. Consequently, ours is the first study to report on the impact of WSOC on snow albedo and radiative forcing in northeastern China and to compare these data with BC results to highlight the non-negligible role of WSOC.

Figure 8(a–b): Simulated snow spectral albedo and broadband albedo reductions – under various contamination scenarios and for different regions – for old snow (radius =1000 µm). (c–d) Simulated snow spectral albedo and broadband albedo reductions – under various contamination scenarios and for different regions – for fresh snow (radius =100 µm). Colors represent the different types of snow (pure snow, BC- or WSOC-contaminated snow, and snow polluted by both WSOC and BC).
Figure 8 shows the regional-mean spectral snow albedo as well as the reduction in albedo due to WSOC, BC, and WSOC + BC. We assume a snow radius of 100 µm for fresh snow and 1000 µm for old snow. Our findings reveal that WSOC induces a marked decline in albedo within the UV and shortwave Vis bands, with the magnitude of albedo reduction growing rapidly as wavelength shrinks, owing to the large AAE value of WSOC. In comparison, BC induces a widespread albedo reduction spanning the UV to NIR bands, and wavelength-dependent variations are significantly smaller than those of WSOC. For Vis and NIR, the reduction in albedo is dominated by BC, whereas the impacts of WSOC and BC are comparable at UV wavelengths, a pattern that is consistent with the results of studies of atmospheric aerosols (Shamjad et al., 2016). We note that these characteristics persist throughout northeastern China despite regional variability in environmental conditions and snowpack types (old vs. fresh snow).
For broadband wavelengths, our results indicate that the WSOC-induced (mean =3.6 µg g−1) albedo reduction for 280–400 nm wavelength in old (fresh) snow is 0.16 (0.05) across the whole study area, which corresponds to approximately 50 % (46 %) of the impact of BC (mean =0.6 µg g−1). Regionally, the greatest decline in albedo occurred in SNC, where a mean WSOC of 5.7 µg g−1 resulted in a reduction of 0.20 (0.06) in the 280–400 nm range for old (fresh) snow. In contrast, the smallest decline in albedo was observed in NEIM, with a reduction of 0.06 (0.02) resulting from an average WSOC concentration of 0.5 µg g−1. Compared with the UV bands, a WSOC-induced albedo reduction of 0.03 (0.009) over the UV–NIR range (280–1500 nm) accounts for only ∼ 19 % (17 %) of that due to BC in the study area. The regional mean for old (fresh) snow falls in the range of 0.01–0.04 (0.003–0.012), with the highest (lowest) values occurring in SNC (NEIM). However, we observed the highest ratio of WSOC- to BC-induced albedo reduction in NEIM. Together, these results indicate that WSOC plays a potentially important role in altering UV snow albedo in NEIM, despite its relatively low concentrations in the regional snowpack.
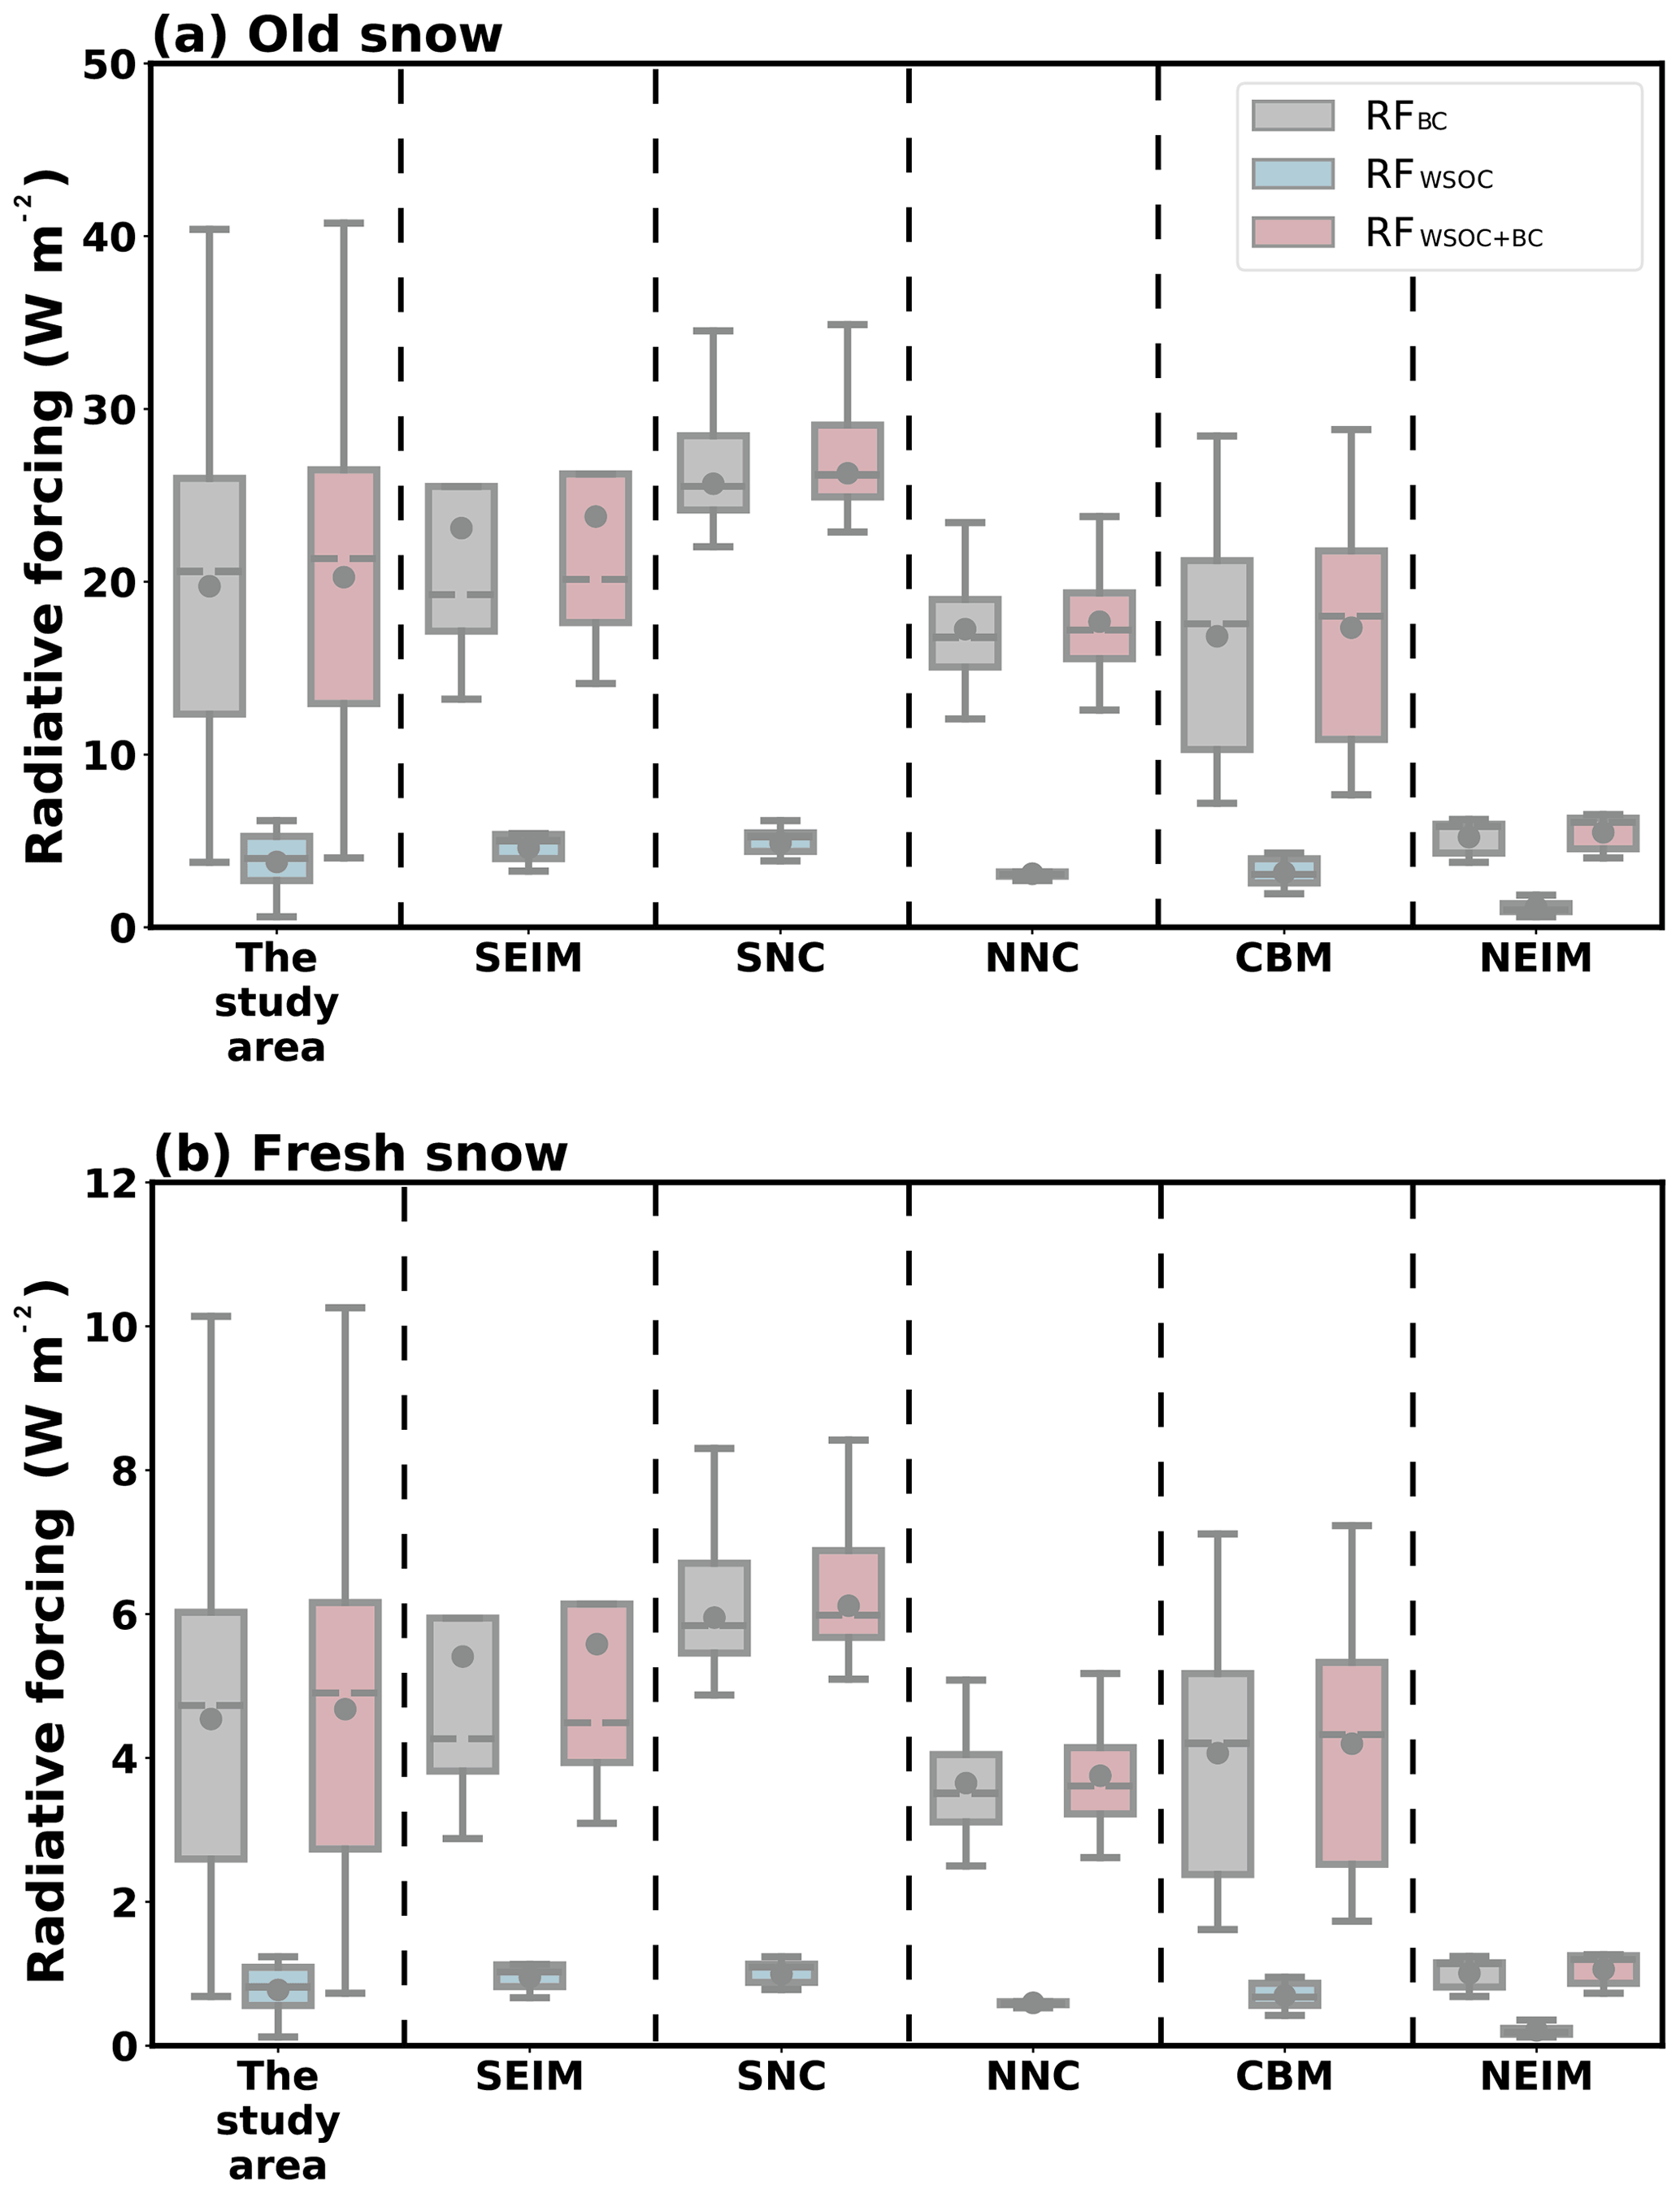
Figure 9Radiative forcing due to different pollutants in (a) old or (b) fresh snow. Gray, blue, and red indicate the radiative forcing of BC, WSOC, and BC + WSOC, respectively.
Radiative forcing is an important index that directly reflects the impact of snowpack WSOC on the regional radiation balance and climate (Beres et al., 2020). Previous studies have tended to focus on calculating instantaneous radiative forcing values; however, in reality, time-averaged results are more valuable for climate research. Here, we present data on the daily mean radiative forcing due to WSOC, BC, and WSOC + BC (Fig. 9). For northeastern China, the mean radiative forcing of WSOC in old (fresh) snow is 3.8 (0.8) W m−2, with regional mean values varying from 1.2 (0.2) to 4.9 (1.0) W m−2. Zhou et al. (2021) reported that daily mean radiative forcing by regional WSOC (0.6–7.1 µg g−1) was between ∼ 0.04 and ∼ 0.6 W m−2 for northwestern China, which is comparable to our values in fresh snow. Furthermore, the ratio of WSOC-driven to BC-driven radiative forcing varies within the range of 10 %–32 % (10 %–31 %) for old (fresh) snow, which is consistent with the results of our calculated albedo reductions. These results confirm that the role of WSOC must not be ignored in discussions about radiative balance in northeastern China. Similarly, the sizable impact of WSOC on the absorption of UV radiation has the potential to influence biogeochemistry (Helms et al., 2013; Seekell et al., 2015) and snow photochemical processes (e.g., photolysis of nitrate (NO) and nitrite (NO) in snow, in addition to the release of NOx (NO + NO2 and HONO)). Snow photochemistry is beyond the scope of this study; however, the high concentrations of WSOC and nitrate (not shown) pollution in northeastern China make this a logical next step for research in this field.
During 2020 and 2021, we collected 34 surface samples of seasonal snow from sites throughout northeastern China to investigate the fluorescence characteristics, optical properties, and radiative effects of snowpack WSOC. With an average concentration of WSOC of 3.6±3.2 µg g−1, our results returned regional mean values of 3.4±1.5 µg g−1 (SEIM), 5.7±3.7 µg g−1 (SNC), 2.7±0.8 µg g−1 (NNC), 2.0±1.3 µg g−1 (CBM), and 0.5±0.2 µg g−1 (NEIM), indicating a considerable degree of regional variability of WSOC mass loadings. Measured values of WSOC fluorescence intensity (690–18 600 RU nm2) and light absorption (0.4–17 m−1) are also highly variable.
Moreover, we also used EEMs and PARAFAC to identify three fluorescence WSOC components prevalent in northeastern China and analyzed their regional differences. In SEIM, which is characterized by desert and bare soil surfaces, the signal of high-oxygenated and terrigenous HULIS-1 is dominant (47 %). The high degree of humification and minimal bioavailability of WSOC indicate that snowpack WSOC originates primarily from soil source. In contrast, the autochthonous PRLIS signal (58 %) dominates in remote and clean NEIM. Low-oxygenated and anthropogenic HULIS-2 dominate the densely populated and intensively farmed SNC (51 %) and NNC (57 %) regions, leading us to conclude that the snowpack WSOC in SNC and NNC is influenced more by the anthropogenic source. In the CBM of the forest environment, the impact of long-distance transport of pollutants is greater than that of the background environment. The above conclusions are also verified by fluorescence-derived indices.
We employed multiple regression analysis to estimate the fractional contributions of different WSOC components to snowpack light absorption. Throughout our study area, HULIS-1 tends to be the greatest contributor (∼ 56 %–65 %) over the 280–400 nm range, followed by HULIS-2 (∼ 19 %–30 %) and PRLIS (∼ 12 %–17 %). In contrast to its primary role in fluorescence, the contribution of HULIS-2 to light absorption is relatively low across all regions, potentially reflecting the variable molecular structure of different components. Finally, we highlight that the average RF due to WSOC in old (fresh) snow in northeastern China is 3.8 (0.8) W m−2, which is equal to 19 % (17 %) of the BC-induced radiative forcing. Therefore, we demonstrated the important impacts of WSOC on the snow energy budget and potentially on triggering snow photochemistry. We indicate that our study could contribute to the understanding of carbon cycling processes, regional air quality, hydrological processes, and climate change in Earth systems. For example, the abundant WSOC concentrations measured in this study imply the significant carbon input from the atmosphere to the snowpack through wet or dry depositions in northeastern China, while the complex chemical compositions of snowpack WSOC could further influence the carbon balance of the snow environment by affecting microbial activities (Stedmon et al., 2007). The strong absorption properties of WSOC in the UV–Vis band also imply its important role in initiating snow photochemistry (McNeill et al., 2012). It will change the composition of organic compounds in the snow in turn (Grannas et al., 2007) and affect the surrounding air quality by releasing oxidizing gas like NOx into the atmosphere (Zatko et al., 2013). Moreover, the non-negligible influence of WSOC on the snow albedo and radiative effect indicates that it could not only accelerate snow melting, but also change the periods and mass of water and carbon exchange between snowpack and underlying soils or vegetation (Meyer and Wania, 2008) and potentially affect regional climate through changing the surface radiative balance (Beres et al., 2020).
Data presented and used throughout this study can be accessed from the following data repository: https://doi.org/10.5281/zenodo.6541956 (Niu, 2022).
The supplement related to this article is available online at: https://doi.org/10.5194/acp-22-14075-2022-supplement.
XN and WP designed the study and wrote the first draft with contributions from all coauthors. XN designed and conducted the lab experiments with the assistance of PF, YZ and HW. XN processed the data with the assistance of DW, ZC and TS. XN, WP, YC, YX, and TS designed and conducted the field campaign. XW supervised this study. All co-authors commented on the paper and improved it.
The contact author has declared that none of the authors has any competing interests.
Publisher’s note: Copernicus Publications remains neutral with regard to jurisdictional claims in published maps and institutional affiliations.
This research was supported by the National Science Fund for Distinguished Young Scholars (grant no. 42025102), the National Natural Science Foundation of China (grant nos. 42075061 and 41975157), and the Lanzhou City's scientific research funding subsidy to Lanzhou University.
This paper was edited by Irena Grgić and reviewed by two anonymous referees.
Anastasio, C. and Robles, T.: Light absorption by soluble chemical species in Arctic and Antarctic snow, J. Geophys. Res., 112, D24304, https://doi.org/10.1029/2007JD008695, 2007.
Andreae, M. O. and Gelencsér, A.: Black carbon or brown carbon? The nature of light-absorbing carbonaceous aerosols, Atmos. Chem. Phys., 6, 3131–3148, https://doi.org/10.5194/acp-6-3131-2006, 2006.
Antony, R., Grannas, A. M., Willoughby, A. S., Sleighter, R. L., Thamban, M., and Hatcher, P. G.: Origin and Sources of Dissolved Organic Matter in Snow on the East Antarctic Ice Sheet, Environ. Sci. Technol., 48, 6151–6159, https://doi.org/10.1021/es405246a, 2014.
Bahram, M., Bro, R., Stedmon, C., and Afkhami, A.: Handling of Rayleigh and Raman scatter for PARAFAC modeling of fluorescence data using interpolation, J. Chemom., 20, 99–105, https://doi.org/10.1002/cem.978, 2006.
Barnett, T. P., Pierce, D. W., Hidalgo, H. G., Bonfils, C., Santer, B. D., Das, T., Bala, G., Wood, A. W., Nozawa, T., Mirin, A. A., Cayan, D. R., and Dettinger, M. D.: Human-Induced Changes in the Hydrology of the Western United States, Science, 319, 1080–1083, https://doi.org/10.1126/science.1152538, 2008.
Barrett, T. E. and Sheesley, R. J.: Year-round optical properties and source characterization of Arctic organic carbon aerosols on the North Slope Alaska, J. Geophys. Res.-Atmos., 122, 9319–9331, https://doi.org/10.1002/2016JD026194, 2017.
Beine, H., Anastasio, C., Esposito, G., Patten, K., Wilkening, E., Domine, F., Voisin, D., Barret, M., Houdier, S., and Hall, S.: Soluble, light-absorbing species in snow at Barrow, Alaska, J. Geophys. Res., 116, D00R05, https://doi.org/10.1029/2011JD016181, 2011.
Beniston, M., Farinotti, D., Stoffel, M., Andreassen, L. M., Coppola, E., Eckert, N., Fantini, A., Giacona, F., Hauck, C., Huss, M., Huwald, H., Lehning, M., López-Moreno, J.-I., Magnusson, J., Marty, C., Morán-Tejéda, E., Morin, S., Naaim, M., Provenzale, A., Rabatel, A., Six, D., Stötter, J., Strasser, U., Terzago, S., and Vincent, C.: The European mountain cryosphere: a review of its current state, trends, and future challenges, The Cryosphere, 12, 759–794, https://doi.org/10.5194/tc-12-759-2018, 2018.
Beres, N. D., Sengupta, D., Samburova, V., Khlystov, A. Y., and Moosmüller, H.: Deposition of brown carbon onto snow: changes in snow optical and radiative properties, Atmos. Chem. Phys., 20, 6095–6114, https://doi.org/10.5194/acp-20-6095-2020, 2020.
Birdwell, J. E. and Engel, A. S.: Characterization of dissolved organic matter in cave and spring waters using UV-Vis absorbance and fluorescence spectroscopy, Org. Geochem., 41, 270–280, https://doi.org/10.1016/j.orggeochem.2009.11.002, 2010.
Birdwell, J. E. and Valsaraj, K. T.: Characterization of dissolved organic matter in fogwater by excitation-emission matrix fluorescence spectroscopy, Atmos. Environ., 44, 3246–3253, https://doi.org/10.1016/j.atmosenv.2010.05.055, 2010.
Bond, T. C., Doherty, S. J., Fahey, D. W., Forster, P. M., Berntsen, T., DeAngelo, B. J., Flanner, M. G., Ghan, S., Kärcher, B., Koch, D., Kinne, S., Kondo, Y., Quinn, P. K., Sarofim, M. C., Schultz, M. G., Schulz, M., Venkataraman, C., Zhang, H., Zhang, S., Bellouin, N., Guttikunda, S. K., Hopke, P. K., Jacobson, M. Z., Kaiser, J. W., Klimont, Z., Lohmann, U., Schwarz, J. P., Shindell, D., Storelvmo, T., Warren, S. G., and Zender, C. S.: Bounding the role of black carbon in the climate system: A scientific assessment, J. Geophys. Res.-Atmos., 118, 5380–5552, https://doi.org/10.1002/jgrd.50171, 2013.
Browne, E. C., Zhang, X., Franklin, J. P., Ridley, K. J., Kirchstetter, T. W., Wilson, K. R., Cappa, C. D., and Kroll, J. H.: Effect of heterogeneous oxidative aging on light absorption by biomass burning organic aerosol, Aerosol Sci. Tech., 53, 663–674, https://doi.org/10.1080/02786826.2019.1599321, 2019.
Cao, L., Bala, G., Zheng, M., and Caldeira, K.: Fast and slow climate responses to CO2 and solar forcing: A linear multivariate regression model characterizing transient climate change, J. Geophys. Res.-Atmos., 120, 12037–12053, https://doi.org/10.1002/2015JD023901, 2015.
Chakrabarty, R. K., Moosmüller, H., Chen, L.-W. A., Lewis, K., Arnott, W. P., Mazzoleni, C., Dubey, M. K., Wold, C. E., Hao, W. M., and Kreidenweis, S. M.: Brown carbon in tar balls from smoldering biomass combustion, Atmos. Chem. Phys., 10, 6363–6370, https://doi.org/10.5194/acp-10-6363-2010, 2010.
Chen, Q., Miyazaki, Y., Kawamura, K., Matsumoto, K., Coburn, S., Volkamer, R., Iwamoto, Y., Kagami, S., Deng, Y., Ogawa, S., Ramasamy, S., Kato, S., Ida, A., Kajii, Y., and Mochida, M.: Characterization of Chromophoric Water-Soluble Organic Matter in Urban, Forest, and Marine Aerosols by HR-ToF-AMS Analysis and Excitation-Emission Matrix Spectroscopy, Environ. Sci. Technol., 50, 10351–10360, https://doi.org/10.1021/acs.est.6b01643, 2016.
Chen, Q., Wang, M., Wang, Y., Zhang, L., Li, Y., and Han, Y.: Oxidative Potential of Water-Soluble Matter Associated with Chromophoric Substances in PM2.5 over Xi'an, China, Environ. Sci. Technol., 53, 8574–8584, https://doi.org/10.1021/acs.est.9b01976, 2019a.
Chen, Q., Mu, Z., Song, W., Wang, Y., Yang, Z., Zhang, L., and Zhang, Y.: Size-Resolved Characterization of the Chromophores in Atmospheric Particulate Matter From a Typical Coal-Burning City in China, J. Geophys. Res.-Atmos., 124, 10546–10563, https://doi.org/10.1029/2019JD031149, 2019b.
Choi, Y., Kanaya, Y., Park, S.-M., Matsuki, A., Sadanaga, Y., Kim, S.-W., Uno, I., Pan, X., Lee, M., Kim, H., and Jung, D. H.: Regional variability in black carbon and carbon monoxide ratio from long-term observations over East Asia: assessment of representativeness for black carbon (BC) and carbon monoxide (CO) emission inventories, Atmos. Chem. Phys., 20, 83–98, https://doi.org/10.5194/acp-20-83-2020, 2020.
Coble, P. G.: Characterization of marine and terrestrial DOM in seawater using excitation-emission matrix spectroscopy, Mar. Chem., 51, 325–346, https://doi.org/10.1016/0304-4203(95)00062-3, 1996.
Coble, P. G., Green, S. A., Blough, N. V., and Gagosian, R. B.: Characterization of dissolved organic matter in the Black Sea by fluorescence spectroscopy, Nature, 348, 432–435, https://doi.org/10.1038/348432a0, 1990.
Coble, P. G., Del Castillo, C. E., and Avril, B.: Distribution and optical properties of CDOM in the Arabian Sea during the 1995 Southwest Monsoon, Deep-Sea Res. Pt. II, 45, 2195–2223, https://doi.org/10.1016/S0967-0645(98)00068-X, 1998.
Cui, J., Shi, T., Zhou, Y., Wu, D., Wang, X., and Pu, W.: Satellite-based radiative forcing by light-absorbing particles in snow across the Northern Hemisphere, Atmos. Chem. Phys., 21, 269–288, https://doi.org/10.5194/acp-21-269-2021, 2021.
Dang, C., Warren, S. G., Fu, Q., Doherty, S. J., Sturm, M., and Su, J.: Measurements of light-absorbing particles in snow across the Arctic, North America, and China: Effects on surface albedo, J. Geophys. Res.-Atmos., 122, 10149–10168, https://doi.org/10.1002/2017JD027070, 2017.
Di Mauro, B.: A darker cryosphere in a warming world, Nat. Clim. Chang., 10, 978–979, https://doi.org/10.1038/s41558-020-0896-8, 2020.
Di Mauro, B., Fava, F., Ferrero, L., Garzonio, R., Baccolo, G., Delmonte, B., and Colombo, R.: Mineral dust impact on snow radiative properties in the European Alps combining ground, UAV, and satellite observations, J. Geophys. Res.-Atmos., 120, 6080–6097, https://doi.org/10.1002/2015JD023287, 2015.
Doherty, S. J., Warren, S. G., Grenfell, T. C., Clarke, A. D., and Brandt, R. E.: Light-absorbing impurities in Arctic snow, Atmos. Chem. Phys., 10, 11647–11680, https://doi.org/10.5194/acp-10-11647-2010, 2010.
Doherty, S. J., Dang, C., Hegg, D. A., Zhang, R., and Warren, S. G.: Black carbon and other light-absorbing particles in snow of central North America: Black carbon in North American snow, J. Geophys. Res.-Atmos., 119, 12807–12831, https://doi.org/10.1002/2014JD022350, 2014.
Domine, F.: Air-Snow Interactions and Atmospheric Chemistry, Science, 297, 1506–1510, https://doi.org/10.1126/science.1074610, 2002.
D'Sa, E. J., Goes, J. I., Gomes, H., and Mouw, C.: Absorption and fluorescence properties of chromophoric dissolved organic matter of the eastern Bering Sea in the summer with special reference to the influence of a cold pool, Biogeosciences, 11, 3225–3244, https://doi.org/10.5194/bg-11-3225-2014, 2014.
Dumont, M., Brun, E., Picard, G., Michou, M., Libois, Q., Petit, J.-R., Geyer, M., Morin, S., and Josse, B.: Contribution of light-absorbing impurities in snow to Greenland's darkening since 2009, Nature Geosci., 7, 509–512, https://doi.org/10.1038/ngeo2180, 2014.
Els, N., Greilinger, M., Reisecker, M., Tignat-Perrier, R., Baumann-Stanzer, K., Kasper-Giebl, A., Sattler, B., and Larose, C.: Comparison of Bacterial and Fungal Composition and Their Chemical Interaction in Free Tropospheric Air and Snow Over an Entire Winter Season at Mount Sonnblick, Austria, Front. Microbiol., 11, 980, https://doi.org/10.3389/fmicb.2020.00980, 2020.
Fang, L., Bai, Z., Wei, S., Yanfen, H., Zongming, W., Kaishan, S., Dianwei, L., and Zhiming, L.: Sandy desertification change and its driving forces in western Jilin Province, North China, Environ. Monit. Assess., 136, 379–390, https://doi.org/10.1007/s10661-007-9693-3, 2007.
Fellman, J. B., Hood, E., Raymond, P. A., Stubbins, A., and Spencer, R. G. M.: Spatial Variation in the Origin of Dissolved Organic Carbon in Snow on the Juneau Icefield, Southeast Alaska, Environ. Sci. Technol., 49, 11492–11499, https://doi.org/10.1021/acs.est.5b02685, 2015.
Feng, L., Xu, J., Kang, S., Li, X., Li, Y., Jiang, B., and Shi, Q.: Chemical Composition of Microbe-Derived Dissolved Organic Matter in Cryoconite in Tibetan Plateau Glaciers: Insights from Fourier Transform Ion Cyclotron Resonance Mass Spectrometry Analysis, Environ. Sci. Technol., 50, 13215–13223, https://doi.org/10.1021/acs.est.6b03971, 2016.
Feng, L., An, Y., Xu, J., and Kang, S.: Characteristics and sources of dissolved organic matter in a glacier in the northern Tibetan Plateau: differences between different snow categories, Ann. Glaciol., 59, 31–40, https://doi.org/10.1017/aog.2018.20, 2018.
Flanner, M. G., Zender, C. S., Randerson, J. T., and Rasch, P. J.: Present-day climate forcing and response from black carbon in snow, J. Geophys. Res., 112, D11202, https://doi.org/10.1029/2006JD008003, 2007.
Fu, P., Kawamura, K., Chen, J., Qin, M., Ren, L., Sun, Y., Wang, Z., Barrie, L. A., Tachibana, E., Ding, A., and Yamashita, Y.: Fluorescent water-soluble organic aerosols in the High Arctic atmosphere, Sci. Rep., 5, 9845, https://doi.org/10.1038/srep09845, 2015.
Grannas, A. M., Jones, A. E., Dibb, J., Ammann, M., Anastasio, C., Beine, H. J., Bergin, M., Bottenheim, J., Boxe, C. S., Carver, G., Chen, G., Crawford, J. H., Dominé, F., Frey, M. M., Guzmán, M. I., Heard, D. E., Helmig, D., Hoffmann, M. R., Honrath, R. E., Huey, L. G., Hutterli, M., Jacobi, H. W., Klán, P., Lefer, B., McConnell, J., Plane, J., Sander, R., Savarino, J., Shepson, P. B., Simpson, W. R., Sodeau, J. R., von Glasow, R., Weller, R., Wolff, E. W., and Zhu, T.: An overview of snow photochemistry: evidence, mechanisms and impacts, Atmos. Chem. Phys., 7, 4329–4373, https://doi.org/10.5194/acp-7-4329-2007, 2007.
Groisman, P. Ya., Karl, T. R., and Knight, R. W.: Observed Impact of Snow Cover on the Heat Balance and the Rise of Continental Spring Temperatures, Science, 263, 198–200, https://doi.org/10.1126/science.263.5144.198, 1994.
Guo, B., Li, W., Santibáñez, P., Priscu, J. C., Liu, Y., and Liu, K.: Organic matter distribution in the icy environments of Taylor Valley, Antarctica, Sci. Total Environ., 841, 156639, https://doi.org/10.1016/j.scitotenv.2022.156639, 2022.
Guo, J. and Hu, Y.: Spatiotemporal Variations in Satellite-Derived Vegetation Phenological Parameters in Northeast China, Remote Sens., 14, 705, https://doi.org/10.3390/rs14030705, 2022.
Gustafsson, Ö., Kruså, M., Zencak, Z., Sheesley, R. J., Granat, L., Engström, E., Praveen, P. S., Rao, P. S. P., Leck, C., and Rodhe, H.: Brown Clouds over South Asia: Biomass or Fossil Fuel Combustion?, Science, 323, 495–498, https://doi.org/10.1126/science.1164857, 2009.
Hansen, J. and Nazarenko, L.: Soot climate forcing via snow and ice albedos, P. Natl. Acad. Sci. USA, 101, 423–428, https://doi.org/10.1073/pnas.2237157100, 2004.
Hegg, D. A., Warren, S. G., Grenfell, T. C., Doherty, S. J., and Clarke, A. D.: Sources of light-absorbing aerosol in arctic snow and their seasonal variation, Atmos. Chem. Phys., 10, 10923–10938, https://doi.org/10.5194/acp-10-10923-2010, 2010.
Helms, J. R., Stubbins, A., Perdue, E. M., Green, N. W., Chen, H., and Mopper, K.: Photochemical bleaching of oceanic dissolved organic matter and its effect on absorption spectral slope and fluorescence, Mar. Chem., 155, 81–91, https://doi.org/10.1016/j.marchem.2013.05.015, 2013.
Hood, E., Battin, T. J., Fellman, J., O'Neel, S., and Spencer, R. G. M.: Storage and release of organic carbon from glaciers and ice sheets, Nature Geosci., 8, 91–96, https://doi.org/10.1038/ngeo2331, 2015.
Hotaling, S., Lutz, S., Dial, R. J., Anesio, A. M., Benning, L. G., Fountain, A. G., Kelley, J. L., McCutcheon, J., Skiles, S. M., Takeuchi, N., and Hamilton, T. L.: Biological albedo reduction on ice sheets, glaciers, and snowfields, Earth-Sci. Rev., 220, 103728, https://doi.org/10.1016/j.earscirev.2021.103728, 2021.
Huang, J., Fu, Q., Zhang, W., Wang, X., Zhang, R., Ye, H., and Warren, S. G.: Dust and Black Carbon in Seasonal Snow Across Northern China, Bull. Amer. Meteor. Soc., 92, 175–181, https://doi.org/10.1175/2010BAMS3064.1, 2011.
Huguet, A., Vacher, L., Relexans, S., Saubusse, S., Froidefond, J. M., and Parlanti, E.: Properties of fluorescent dissolved organic matter in the Gironde Estuary, Org. Geochem., 40, 706–719, https://doi.org/10.1016/j.orggeochem.2009.03.002, 2009.
Kirillova, E. N., Andersson, A., Han, J., Lee, M., and Gustafsson, Ö.: Sources and light absorption of water-soluble organic carbon aerosols in the outflow from northern China, Atmos. Chem. Phys., 14, 1413–1422, https://doi.org/10.5194/acp-14-1413-2014, 2014.
Kothawala, D. N., Murphy, K. R., Stedmon, C. A., Weyhenmeyer, G. A., and Tranvik, L. J.: Inner filter correction of dissolved organic matter fluorescence: Correction of inner filter effects, Limnol. Oceanogr-Meth., 11, 616–630, https://doi.org/10.4319/lom.2013.11.616, 2013.
Kowalczuk, P., Stoń-Egiert, J., Cooper, W. J., Whitehead, R. F., and Durako, M. J.: Characterization of chromophoric dissolved organic matter (CDOM) in the Baltic Sea by excitation emission matrix fluorescence spectroscopy, Mar. Chem., 96, 273–292, https://doi.org/10.1016/j.marchem.2005.03.002, 2005.
Lawaetz, A. J. and Stedmon, C. A.: Fluorescence Intensity Calibration Using the Raman Scatter Peak of Water, Appl. Spectrosc., 63, 936–940, https://doi.org/10.1366/000370209788964548, 2009.
Li, C., Yan, F., Kang, S., Yan, C., Hu, Z., Chen, P., Gao, S., Zhang, C., He, C., Kaspari, S., and Stubbins, A.: Carbonaceous matter in the atmosphere and glaciers of the Himalayas and the Tibetan plateau: An investigative review, Environ. Int., 146, 106281, https://doi.org/10.1016/j.envint.2020.106281, 2021a.
Li, X., Fu, P., Tripathee, L., Yan, F., Hu, Z., Yu, F., Chen, Q., Li, J., Chen, Q., Cao, J., and Kang, S.: Molecular compositions, optical properties, and implications of dissolved brown carbon in snow/ice on the Tibetan Plateau glaciers, Environ. Int., 164, 107276, https://doi.org/10.1016/j.envint.2022.107276, 2022.
Li, Y., Kang, S., Zhang, X., Chen, J., Schmale, J., Li, X., Zhang, Y., Niu, H., Li, Z., Qin, X., He, X., Yang, W., Zhang, G., Wang, S., Shao, L., and Tian, L.: Black carbon and dust in the Third Pole glaciers: Revaluated concentrations, mass absorption cross-sections and contributions to glacier ablation, Sci. Total Environ., 789, 147746, https://doi.org/10.1016/j.scitotenv.2021.147746, 2021b.
Lu, Z., Zhang, Q., and Streets, D. G.: Sulfur dioxide and primary carbonaceous aerosol emissions in China and India, 1996–2010, Atmos. Chem. Phys., 11, 9839–9864, https://doi.org/10.5194/acp-11-9839-2011, 2011.
McKnight, D. M., Boyer, E. W., Westerhoff, P. K., Doran, P. T., Kulbe, T., and Andersen, D. T.: Spectrofluorometric characterization of dissolved organic matter for indication of precursor organic material and aromaticity, Limnol. Oceanogr., 46, 38–48, https://doi.org/10.4319/lo.2001.46.1.0038, 2001.
McNeill, V. F., Grannas, A. M., Abbatt, J. P. D., Ammann, M., Ariya, P., Bartels-Rausch, T., Domine, F., Donaldson, D. J., Guzman, M. I., Heger, D., Kahan, T. F., Klán, P., Masclin, S., Toubin, C., and Voisin, D.: Organics in environmental ices: sources, chemistry, and impacts, Atmos. Chem. Phys., 12, 9653–9678, https://doi.org/10.5194/acp-12-9653-2012, 2012.
Meyer, T. and Wania, F.: Organic contaminant amplification during snowmelt, Water Res., 42, 1847–1865, https://doi.org/10.1016/j.watres.2007.12.016, 2008.
Mladenov, N., Alados-Arboledas, L., Olmo, F. J., Lyamani, H., Delgado, A., Molina, A., and Reche, I.: Applications of optical spectroscopy and stable isotope analyses to organic aerosol source discrimination in an urban area, Atmos. Environ., 45, 1960–1969, https://doi.org/10.1016/j.atmosenv.2011.01.029, 2011.
Murphy, K. R., Stedmon, C. A., Waite, T. D., and Ruiz, G. M.: Distinguishing between terrestrial and autochthonous organic matter sources in marine environments using fluorescence spectroscopy, Mar. Chem., 108, 40–58, https://doi.org/10.1016/j.marchem.2007.10.003, 2008.
Murphy, K. R., Hambly, A., Singh, S., Henderson, R. K., Baker, A., Stuetz, R., and Khan, S. J.: Organic Matter Fluorescence in Municipal Water Recycling Schemes: Toward a Unified PARAFAC Model, Environ. Sci. Technol., 45, 2909–2916, https://doi.org/10.1021/es103015e, 2011.
Murphy, K. R., Stedmon, C. A., Graeber, D., and Bro, R.: Fluorescence spectroscopy and multi-way techniques, PARAFAC, Anal. Methods, 5, 6557, https://doi.org/10.1039/c3ay41160e, 2013.
Niu, H., Kang, S., Lu, X., and Shi, X.: Distributions and light absorption property of water soluble organic carbon in a typical temperate glacier, southeastern Tibetan Plateau, Tellus B, 70, 1–15, https://doi.org/10.1080/16000889.2018.1468705, 2018.
Niu, X.: The data of acp-2022-336, Zenodo [data set], https://doi.org/10.5281/zenodo.6541956, 2022.
Ohno, T.: Fluorescence Inner-Filtering Correction for Determining the Humification Index of Dissolved Organic Matter, Environ. Sci. Technol., 36, 742–746, https://doi.org/10.1021/es0155276, 2002.
Osburn, C. L., Handsel, L. T., Peierls, B. L., and Paerl, H. W.: Predicting Sources of Dissolved Organic Nitrogen to an Estuary from an Agro-Urban Coastal Watershed, Environ. Sci. Technol., 50, 8473–8484, https://doi.org/10.1021/acs.est.6b00053, 2016.
Painter, T. H., Barrett, A. P., Landry, C. C., Neff, J. C., Cassidy, M. P., Lawrence, C. R., McBride, K. E., and Farmer, G. L.: Impact of disturbed desert soils on duration of mountain snow cover, Geophys. Res. Lett., 34, L12502, https://doi.org/10.1029/2007GL030284, 2007.
Painter, T. H., Seidel, F. C., Bryant, A. C., McKenzie Skiles, S., and Rittger, K.: Imaging spectroscopy of albedo and radiative forcing by light-absorbing impurities in mountain snow, J. Geophys. Res.-Atmos., 118, 9511–9523, https://doi.org/10.1002/jgrd.50520, 2013.
Pokrovsky, O. M.: Quantitative Estimates of the Impact of the Most Important Factors on Global Climate Change over the Past 150 Years, Izv. Atmos. Ocean. Phys., 55, 1182–1188, https://doi.org/10.1134/S0001433819090354, 2019.
Pu, W., Wang, X., Wei, H., Zhou, Y., Shi, J., Hu, Z., Jin, H., and Chen, Q.: Properties of black carbon and other insoluble light-absorbing particles in seasonal snow of northwestern China, The Cryosphere, 11, 1213–1233, https://doi.org/10.5194/tc-11-1213-2017, 2017.
Pu, W., Cui, J., Shi, T., Zhang, X., He, C., and Wang, X.: The remote sensing of radiative forcing by light-absorbing particles (LAPs) in seasonal snow over northeastern China, Atmos. Chem. Phys., 19, 9949–9968, https://doi.org/10.5194/acp-19-9949-2019, 2019.
Pu, W., Shi, T., Cui, J., Chen, Y., Zhou, Y., and Wang, X.: Enhancement of snow albedo reduction and radiative forcing due to coated black carbon in snow, The Cryosphere, 15, 2255–2272, https://doi.org/10.5194/tc-15-2255-2021, 2021.
Qian, Y., Yasunari, T. J., Doherty, S. J., Flanner, M. G., Lau, W. K. M., Ming, J., Wang, H., Wang, M., Warren, S. G., and Zhang, R.: Light-absorbing particles in snow and ice: Measurement and modeling of climatic and hydrological impact, Adv. Atmos. Sci., 32, 64–91, https://doi.org/10.1007/s00376-014-0010-0, 2015.
Ram, K., Sarin, M. M., and Hegde, P.: Long-term record of aerosol optical properties and chemical composition from a high-altitude site (Manora Peak) in Central Himalaya, Atmos. Chem. Phys., 10, 11791–11803, https://doi.org/10.5194/acp-10-11791-2010, 2010.
Sarangi, C., Qian, Y., Rittger, K., Ruby Leung, L., Chand, D., Bormann, K. J., and Painter, T. H.: Dust dominates high-altitude snow darkening and melt over high-mountain Asia, Nat. Clim. Chang., 10, 1045–1051, https://doi.org/10.1038/s41558-020-00909-3, 2020.
Seekell, D. A., Lapierre, J.-F., Ask, J., Bergström, A.-K., Deininger, A., Rodríguez, P., and Karlsson, J.: The influence of dissolved organic carbon on primary production in northern lakes, Limnol. Oceanogr., 60, 1276–1285, https://doi.org/10.1002/lno.10096, 2015.
Shamjad, P. M., Tripathi, S. N., Thamban, N. M., and Vreeland, H.: Refractive Index and Absorption Attribution of Highly Absorbing Brown Carbon Aerosols from an Urban Indian City-Kanpur, Sci. Rep., 6, 37735, https://doi.org/10.1038/srep37735, 2016.
Shi, T., Pu, W., Zhou, Y., Cui, J., Zhang, D., and Wang, X.: Albedo of Black Carbon-Contaminated Snow Across Northwestern China and the Validation With Model Simulation, J. Geophys. Res.-Atmos., 125, e2019JD032065, https://doi.org/10.1029/2019JD032065, 2020.
Shi, T., Cui, J., Chen, Y., Zhou, Y., Pu, W., Xu, X., Chen, Q., Zhang, X., and Wang, X.: Enhanced light absorption and reduced snow albedo due to internally mixed mineral dust in grains of snow, Atmos. Chem. Phys., 21, 6035–6051, https://doi.org/10.5194/acp-21-6035-2021, 2021.
Shi, T., Chen, Y., Xing, Y., Niu, X., Wu, D., Cui, J., Zhou, Y., Pu, W., and Wang, X.: Assessment of the combined radiative effects of black carbon in the atmosphere and snowpack in the Northern Hemisphere constrained by surface observations, Environ. Sci.-Atmos., 2, 702–713, https://doi.org/10.1039/D2EA00005A, 2022a.
Shi, T., Cui, J., Wu, D., Xing, Y., Chen, Y., Zhou, Y., Pu, W., and Wang, X.: Snow albedo reductions induced by the internal/external mixing of black carbon and mineral dust, and different snow grain shapes across northern China, Environ. Res., 208, 112670, https://doi.org/10.1016/j.envres.2021.112670, 2022b.
Singer, G. A., Fasching, C., Wilhelm, L., Niggemann, J., Steier, P., Dittmar, T., and Battin, T. J.: Biogeochemically diverse organic matter in Alpine glaciers and its downstream fate, Nature Geosci., 5, 710–714, https://doi.org/10.1038/ngeo1581, 2012.
Skiles, S. M., Flanner, M., Cook, J. M., Dumont, M., and Painter, T. H.: Radiative forcing by light-absorbing particles in snow, Nat. Clim. Change, 8, 964–971, https://doi.org/10.1038/s41558-018-0296-5, 2018.
Song, K., Shang, Y., Wen, Z., Jacinthe, P.-A., Liu, G., Lyu, L., and Fang, C.: Characterization of CDOM in saline and freshwater lakes across China using spectroscopic analysis, Water Res., 150, 403–417, https://doi.org/10.1016/j.watres.2018.12.004, 2019.
Stedmon, C. A. and Markager, S.: Resolving the variability in dissolved organic matter fluorescence in a temperate estuary and its catchment using PARAFAC analysis, Limnol. Oceanogr., 50, 686–697, https://doi.org/10.4319/lo.2005.50.2.0686, 2005.
Stedmon, C. A., Markager, S., and Bro, R.: Tracing dissolved organic matter in aquatic environments using a new approach to fluorescence spectroscopy, Mar. Chem., 82, 239–254, https://doi.org/10.1016/S0304-4203(03)00072-0, 2003.
Stedmon, C. A., Thomas, D. N., Granskog, M., Kaartokallio, H., Papadimitriou, S., and Kuosa, H.: Characteristics of Dissolved Organic Matter in Baltic Coastal Sea Ice: Allochthonous or Autochthonous Origins?, Environ. Sci. Technol., 41, 7273–7279, https://doi.org/10.1021/es071210f, 2007.
Usha, K. H., Nair, V. S., and Babu, S. S.: Modeling of aerosol induced snow albedo feedbacks over the Himalayas and its implications on regional climate, Clim. Dynam., 54, 4191–4210, https://doi.org/10.1007/s00382-020-05222-5, 2020.
Vione, D., Colombo, N., Said-Pullicino, D., Bocchiola, D., Confortola, G., Salerno, F., Viviano, G., Fratianni, S., Martin, M., Godone, D., and Freppaz, M.: Seasonal variations in the optical characteristics of dissolved organic matter in glacial pond water, Sci. Total Environ., 759, 143464, https://doi.org/10.1016/j.scitotenv.2020.143464, 2021.
Voisin, D., Jaffrezo, J.-L., Houdier, S., Barret, M., Cozic, J., King, M. D., France, J. L., Reay, H. J., Grannas, A., Kos, G., Ariya, P. A., Beine, H. J., and Domine, F.: Carbonaceous species and humic like substances (HULIS) in Arctic snowpack during OASIS field campaign in Barrow, J. Geophys. Res., 117, D00R19, https://doi.org/10.1029/2011JD016612, 2012.
Wang, J., Wang, Y., Yan, C., and Qi, Y.: 1:100 000 desert (sand) distribution dataset in China, edited by: National Tibetan Plateau Data Center, National Tibetan Plateau Data Center, https://doi.org/10.3972/westdc.006.2013.db, 2013a.
Wang, R., Tao, S., Balkanski, Y., Ciais, P., Boucher, O., Liu, J., Piao, S., Shen, H., Vuolo, M. R., Valari, M., Chen, H., Chen, Y., Cozic, A., Huang, Y., Li, B., Li, W., Shen, G., Wang, B., and Zhang, Y.: Exposure to ambient black carbon derived from a unique inventory and high-resolution model, P. Natl. Acad. Sci. USA, 111, 2459–2463, https://doi.org/10.1073/pnas.1318763111, 2014a.
Wang, X., Doherty, S. J., and Huang, J.: Black carbon and other light-absorbing impurities in snow across Northern China, J. Geophys. Res.-Atmos., 118, 1471–1492, https://doi.org/10.1029/2012JD018291, 2013b.
Wang, X., Xu, B., and Ming, J.: An overview of the studies on black carbon and mineral dust deposition in snow and ice cores in East Asia, J. Meteorol. Res., 28, 354–370, https://doi.org/10.1007/s13351-014-4005-7, 2014b.
Wang, X., Pu, W., Zhang, X., Ren, Y., and Huang, J.: Water-soluble ions and trace elements in surface snow and their potential source regions across northeastern China, Atmos. Environ., 114, 57–65, https://doi.org/10.1016/j.atmosenv.2015.05.012, 2015.
Wang, X., Pu, W., Ren, Y., Zhang, X., Zhang, X., Shi, J., Jin, H., Dai, M., and Chen, Q.: Observations and model simulations of snow albedo reduction in seasonal snow due to insoluble light-absorbing particles during 2014 Chinese survey, Atmos. Chem. Phys., 17, 2279–2296, https://doi.org/10.5194/acp-17-2279-2017, 2017.
Wang, X., Bai, X., Ma, L., He, C., Jiang, H., Sheng, L., and Luo, W.: Snow depths' impact on soil microbial activities and carbon dioxide fluxes from a temperate wetland in Northeast China, Sci. Rep., 10, 8709, https://doi.org/10.1038/s41598-020-65569-x, 2020.
Warren, S. and Wiscombe, W.: A Model for the Spectral Albedo of Snow. II: Snow Containing Atmospheric Aerosols, J. Atmos. Sci., 37, 2734–2745, https://doi.org/10.1175/1520-0469(1980)037<2734:AMFTSA>2.0.CO;2, 1980.
Wen, H., Zhou, Y., Xu, X., Wang, T., Chen, Q., Chen, Q., Li, W., Wang, Z., Huang, Z., Zhou, T., Shi, J., Bi, J., Ji, M., and Wang, X.: Water-soluble brown carbon in atmospheric aerosols along the transport pathway of Asian dust: Optical properties, chemical compositions, and potential sources, Sci. Total Environ., 789, 147971, https://doi.org/10.1016/j.scitotenv.2021.147971, 2021.
Wu, D., Liu, J., Wang, T., Niu, X., Chen, Z., Wang, D., Zhang, X., Ji, M., Wang, X., and Pu, W.: Applying a dust index over North China and evaluating the contribution of potential factors to its distribution, Atmos. Res., 254, 105515, https://doi.org/10.1016/j.atmosres.2021.105515, 2021.
Wu, D., Shi, T., Niu, X., Chen, Z., Cui, J., Chen, Y., Zhang, X., Liu, J., Ji, M., Wang, X., and Pu, W.: Seasonal to sub-seasonal variations of the Asian Tropopause Aerosols Layer affected by the deep convection, surface pollutants and precipitation, J. Environ. Sci., 114, 53–65, https://doi.org/10.1016/j.jes.2021.07.022, 2022.
Wu, G., Cong, Z., Kang, S., Kawamura, K., Fu, P., Zhang, Y., Wan, X., Gao, S., and Liu, B.: Brown carbon in the cryosphere: Current knowledge and perspective, Adv. Clim. Chang. Res., 7, 82–89, https://doi.org/10.1016/j.accre.2016.06.002, 2016.
Wu, G., Ram, K., Fu, P., Wang, W., Zhang, Y., Liu, X., Stone, E. A., Pradhan, B. B., Dangol, P. M., Panday, A. K., Wan, X., Bai, Z., Kang, S., Zhang, Q., and Cong, Z.: Water-Soluble Brown Carbon in Atmospheric Aerosols from Godavari (Nepal), a Regional Representative of South Asia, Environ. Sci. Technol., 53, 3471–3479, https://doi.org/10.1021/acs.est.9b00596, 2019.
Wu, G., Wan, X., Ram, K., Li, P., Liu, B., Yin, Y., Fu, P., Loewen, M., Gao, S., Kang, S., Kawamura, K., Wang, Y., and Cong, Z.: Light absorption, fluorescence properties and sources of brown carbon aerosols in the Southeast Tibetan Plateau, Environ. Pollut., 257, 113616, https://doi.org/10.1016/j.envpol.2019.113616, 2020.
Xie, X., Liu, X., Che, H., Xie, X., Li, X., Shi, Z., Wang, H., Zhao, T., and Liu, Y.: Radiative feedbacks of dust in snow over eastern Asia in CAM4-BAM, Atmos. Chem. Phys., 18, 12683–12698, https://doi.org/10.5194/acp-18-12683-2018, 2018.
Xin, J., Gong, C., Liu, Z., Cong, Z., Gao, W., Song, T., Pan, Y., Sun, Y., Ji, D., Wang, L., Tang, G., and Wang, Y.: The observation-based relationships between PM2.5 and AOD over China, J. Geophys. Res.-Atmos., 121, 10701–10716, https://doi.org/10.1002/2015JD024655, 2016.
Yamashita, Y., Jaffé, R., Maie, N., and Tanoue, E.: Assessing the dynamics of dissolved organic matter (DOM) in coastal environments by excitation emission matrix fluorescence and parallel factor analysis (EEM-PARAFAC), Limnol. Oceanogr., 53, 1900–1908, https://doi.org/10.4319/lo.2008.53.5.1900, 2008.
Yan, F., Kang, S., Li, C., Zhang, Y., Qin, X., Li, Y., Zhang, X., Hu, Z., Chen, P., Li, X., Qu, B., and Sillanpää, M.: Concentration, sources and light absorption characteristics of dissolved organic carbon on a medium-sized valley glacier, northern Tibetan Plateau, The Cryosphere, 10, 2611–2621, https://doi.org/10.5194/tc-10-2611-2016, 2016.
Zatko, M. C., Grenfell, T. C., Alexander, B., Doherty, S. J., Thomas, J. L., and Yang, X.: The influence of snow grain size and impurities on the vertical profiles of actinic flux and associated NOx emissions on the Antarctic and Greenland ice sheets, Atmos. Chem. Phys., 13, 3547–3567, https://doi.org/10.5194/acp-13-3547-2013, 2013.
Zhang, R., Hegg, D. A., Huang, J., and Fu, Q.: Source attribution of insoluble light-absorbing particles in seasonal snow across northern China, Atmos. Chem. Phys., 13, 6091–6099, https://doi.org/10.5194/acp-13-6091-2013, 2013.
Zhang, Y., van Dijk, M. A., Liu, M., Zhu, G., and Qin, B.: The contribution of phytoplankton degradation to chromophoric dissolved organic matter (CDOM) in eutrophic shallow lakes: Field and experimental evidence, Water Res., 43, 4685–4697, https://doi.org/10.1016/j.watres.2009.07.024, 2009.
Zhang, Y., Kang, S., Cong, Z., Schmale, J., Sprenger, M., Li, C., Yang, W., Gao, T., Sillanpää, M., Li, X., Liu, Y., Chen, P., and Zhang, X.: Light-absorbing impurities enhance glacier albedo reduction in the southeastern Tibetan plateau: Light-Absorbing Impurities in Snow, J. Geophys. Res.-Atmos., 122, 6915–6933, https://doi.org/10.1002/2016JD026397, 2017.
Zhang, Y., Kang, S., Sprenger, M., Cong, Z., Gao, T., Li, C., Tao, S., Li, X., Zhong, X., Xu, M., Meng, W., Neupane, B., Qin, X., and Sillanpää, M.: Black carbon and mineral dust in snow cover on the Tibetan Plateau, The Cryosphere, 12, 413–431, https://doi.org/10.5194/tc-12-413-2018, 2018.
Zhang, Y., Kang, S., Gao, T., Sprenger, M., Dou, T., Han, W., Zhang, Q., Sun, S., Du, W., Chen, P., Guo, J., Cui, X., and Sillanpää, M.: Dissolved organic carbon in Alaskan Arctic snow: concentrations, light-absorption properties, and bioavailability, Tellus B, 72, 1–19, https://doi.org/10.1080/16000889.2020.1778968, 2020.
Zhao, C., Hu, Z., Qian, Y., Ruby Leung, L., Huang, J., Huang, M., Jin, J., Flanner, M. G., Zhang, R., Wang, H., Yan, H., Lu, Z., and Streets, D. G.: Simulating black carbon and dust and their radiative forcing in seasonal snow: a case study over North China with field campaign measurements, Atmos. Chem. Phys., 14, 11475–11491, https://doi.org/10.5194/acp-14-11475-2014, 2014.
Zhao, Y., Xu, X., Huang, W., Wang, Y., Xu, Y., Chen, H., and Kang, Z.: Trends in observed mean and extreme precipitation within the Yellow River Basin, China, Theor. Appl. Climatol., 136, 1387–1396, https://doi.org/10.1007/s00704-018-2568-4, 2019.
Zhou, L., Zhou, Y., Hu, Y., Cai, J., Liu, X., Bai, C., Tang, X., Zhang, Y., Jang, K.-S., Spencer, R. G. M., and Jeppesen, E.: Microbial production and consumption of dissolved organic matter in glacial ecosystems on the Tibetan Plateau, Water Res., 160, 18–28, https://doi.org/10.1016/j.watres.2019.05.048, 2019a.
Zhou, Y., Shi, K., Zhang, Y., Jeppesen, E., Liu, X., Zhou, Q., Wu, H., Tang, X., and Zhu, G.: Fluorescence peak integration ratio IC:IT as a new potential indicator tracing the compositional changes in chromophoric dissolved organic matter, Sci. Total Environ., 574, 1588–1598, https://doi.org/10.1016/j.scitotenv.2016.08.196, 2017.
Zhou, Y., Wen, H., Liu, J., Pu, W., Chen, Q., and Wang, X.: The optical characteristics and sources of chromophoric dissolved organic matter (CDOM) in seasonal snow of northwestern China, The Cryosphere, 13, 157–175, https://doi.org/10.5194/tc-13-157-2019, 2019b.
Zhou, Y., West, C. P., Hettiyadura, A. P. S., Niu, X., Wen, H., Cui, J., Shi, T., Pu, W., Wang, X., and Laskin, A.: Measurement report: Molecular composition, optical properties, and radiative effects of water-soluble organic carbon in snowpack samples from northern Xinjiang, China, Atmos. Chem. Phys., 21, 8531–8555, https://doi.org/10.5194/acp-21-8531-2021, 2021.
Zhou, Y., West, C. P., Hettiyadura, A. P. S., Pu, W., Shi, T., Niu, X., Wen, H., Cui, J., Wang, X., and Laskin, A.: Molecular Characterization of Water-Soluble Brown Carbon Chromophores in Snowpack from Northern Xinjiang, China, Environ. Sci. Technol., 56, 4173–4186, https://doi.org/10.1021/acs.est.1c07972, 2022.
Zsolnay, A., Baigar, E., Jimenez, M., Steinweg, B., and Saccomandi, F.: Differentiating with fluorescence spectroscopy the sources of dissolved organic matter in soils subjected to drying, Chemosphere, 38, 45–50, https://doi.org/10.1016/S0045-6535(98)00166-0, 1999.