the Creative Commons Attribution 4.0 License.
the Creative Commons Attribution 4.0 License.
 | 01 Nov 2022
Comprehensive characterization of particulate intermediate-volatility and semi-volatile organic compounds (I/SVOCs) from heavy-duty diesel vehicles using two-dimensional gas chromatography time-of-flight mass spectrometry
Xuan Zheng
Shaojun Zhang
Xuan Wang
Ting Chen
Xiao Zhang
Guanghan Huang
Yihuan Cao
Liqiang He
Xubing Cao
Yuan Cheng
Shuxiao Wang
Ye Wu
Tailpipe emissions from three heavy-duty diesel vehicles (HDDVs), complying with varying emission standards and installed with diverse aftertreatment technologies, are collected at a certified chassis dynamometer laboratory. The HDDV-emitted intermediate-volatility and semi-volatile organic compound (I/SVOC) emission and the gas–particle partitioning of the I/SVOCs are investigated. Over 4000 compounds are identified and grouped into 21 categories. The dominant compound groups of particulate I/SVOCs are alkanes and phenolic compounds. For HDDVs without aftertreatment devices, i.e., diesel oxidation catalysts (DOCs) and diesel particulate filters (DPFs), the emitted I/SVOCs partition dramatically into the gas phase (accounting for ∼ 93 % of the total I/SVOC mass), with a few exceptions: hopane, four-ring polycyclic aromatic hydrocarbons (PAH4rings), and five-ring polycyclic aromatic hydrocarbons (PAH5rings). For HDDVs with DPFs and DOCs, the particulate fractions are reduced to a negligible level (i.e., less than 2 %). Nevertheless, 50 % of the total two-ring PAH mass is detected in the particle phase, which is much higher than the high-molecular-weight PAHs, arising from the positive sampling artifact of quartz filter absorbing organic vapors. The positive sampling artifact of quartz filter absorbing organic vapors is clearly observed, and uncertainties are discussed and quantified. Particulate I/SVOCs at low-speed, middle-speed, and high-speed phases are collected and analyzed separately. The emission factor (EF) distribution of the speciated organic aerosol (OA) on a two-dimensional volatility basis set (2D-VBS) space reveals that the fractions of OA with oxygen to carbon (O : C) ratios > 0.3 (0.4, 0.5) are 18.2 % (11.5 %, 9.5 %), 23 % (15.4 %, 13.6 %), and 29.1 % (20.6 %, 19.1 %) at the low-speed, middle-speed, and high-speed stages. These results help to resolve complex organic mixtures and trace the evolution of OA.
- Article
(7121 KB) - Full-text XML
-
Supplement
(815 KB) - BibTeX
- EndNote


The chemical composition of fine particulate matter (particulate matter with an aerodynamic diameter of less than 2.5 µm, PM2.5) varies both temporally and spatially. Unlike the inorganic portion, which has been well studied, the characterization of organic aerosol, which takes up a major faction of PM2.5 mass, is yet to be achieved. Nevertheless, elevated PM2.5 concentrations have been widely recognized (by epidemiologic studies) as being associated with enhanced mortality (Franklin et al., 2008; Tecer et al., 2008; Sun et al., 2022b; Faridi et al., 2022; Nguyen et al., 2022). For example, exposure to polycyclic aromatic hydrocarbons (PAHs) and their derivatives via inhalation, ingestion, and dermal contact is associated with an increased risk of cancer (Li et al., 2022; Sun et al., 2022a).
Once emitted into the atmosphere, volatile organic compounds (VOCs) and intermediate-volatility and semi-volatile organic compounds (I/SVOCs) are subject to sequences of chemical and physical evolution that form secondary organic aerosol (SOA) (Alier et al., 2013; Paasonen et al., 2016; Wang et al., 2006; Stewart et al., 2021a, b). I/SVOCs span a wide range of volatility and partition dynamically between the gas and particle phases (Alam et al., 2019; Presto et al., 2009). The term “effective saturation concentration” (C∗, µg m−3) is frequently used to categorize intermediate-volatility organic compounds (IVOCs; µg m−3), semi-volatile organic compounds (SVOCs; µg m−3), and low-volatility organic compounds (LVOCs; µg m−3) (Gentner et al., 2012).
Diesel vehicle exhaust has contributed significantly to the emission of VOCs, IVOCs, SVOCs, and PM on both global and regional scales (Huang et al., 2015; Liu et al., 2021; Ridley et al., 2018). The abundant emission of their precursors and their dynamic interactions under atmospheric conditions impose significant impacts on climate change and human health (Luo et al., 2022; Poorfakhraei et al., 2017). In view of such importance, quantitative characterization of vehicular organic components, spanning the whole volatility range, is highly needed. While on-road-vehicle-emitted VOCs have been well speciated and accurately quantified, regardless of fuel type, vehicle type, ignition system, and driving condition, the determination of IVOCs and SVOCs is far from adequate (Kawashima et al., 2006; Gentner et al., 2009).
The accurate quantification of I/SVOCs, which are comprised of thousands of individual compounds, remains a great challenge (Stewart et al., 2021b). They are frequently reported as a few compound categories, and the majority is left as unresolved complex mixtures (UCMs) (Qi et al., 2019; Zhao et al., 2014). For instance, alkanes (including n-alkanes, i-alkanes, and cyclic alkanes) are found to be the dominant fraction of I/SVOCs, contributing to over 60 % of the total mass, followed by oxygenated and aromatic species (Alam et al., 2019; Lu et al., 2018; He et al., 2022). Crucial structural information (e.g., carbon skeletons and chemical active moieties) is notably missing. The knowledge of structural information at the molecular level helps to provide a more comprehensive description of the chemical evolution of I/SVOCs from mobile sources and to better predict SOA formation (Chen et al., 2019; Kleindienst et al., 2012; He et al., 2020; Tkacik et al., 2012). Moreover, the molecular-level composition significantly alters the optical properties of the OA (Li et al., 2018, 2021; Harvey et al., 2016).
The gas–particle (g–p) partitioning of vehicle-emitted I/SVOCs is determined by the mutual effects of the intrinsic nature of the organics, e.g., the subcooled liquid vapor pressure, and the environmental conditions, e.g., the temperature, bulk OA concentration, and heterogeneous reactions (Lu et al., 2018; Sitaras et al., 2004; Chen et al., 2010; Liu et al., 2015). Scenarios of g–p partitioning of vehicle emissions have been described by different vehicle types or driving conditions, and limited compound categories have been reported (Lu et al., 2018; May et al., 2013a, b). The lack of information on the phase distribution by chemical speciation biases the SOA model prediction and hinders a full understanding of the chemical fate of vehicle emissions (Li et al., 2018; Grieshop et al., 2007). For example, Zhao et al. (2013) reported the g–p partitioning of individual organic species using a thermal desorption aerosol gas chromatograph (TAG) instrument and found that the contribution of oxygenated compounds to SOA can be substantially increased through g–p partitioning. However, a comprehensive characterization of the speciated g–p partitioning of vehicle emission is yet to be achieved (Alam et al., 2016; Zhao et al., 2013; Liu et al., 2015).
Given such significant research gap, particulate I/SVOCs at ascending speed stages are collected and analyzed separately in this work. We combine targeted and non-targeted analysis to speciate and quantify them. The emission characteristics are explored, and the species-by-species g–p partitioning is fully addressed. We observe the unusual absorption of IVOC vapors to the sampling surface (i.e., quartz filter) and provide a systematic discussion of the sampling artifact/bias on the g–p partitioning equilibrium. The results clearly demonstrate that state-of-the-art instruments enable the characterization of the complex organic mixtures and help to trace the evolution of OA.
2.1 Vehicles, driving cycles, and sampling
The tailpipe emissions from three in-use heavy-duty diesel vehicles (HDDVs) are collected at the China Automotive Technology and Research Centre (CATARC) in Tianjin, China. The vehicles are selected to cover a range of aftertreatment technologies. One HDDV (no. 1) is installed with a selective catalytic reduction (SCR) system, and two HDDVs (no. 2 and no. 3) are installed with SCR systems, diesel oxidation catalysts (DOCs), and diesel particulate filters (DPFs). The recruited HDDVs were manufactured in 2016, 2020, and 2020, respectively, and their respective gross weights are 18.7, 25, and 25 t. Vehicle no. 1 meets the China IV national emission standard, which has been implemented since 2010, and vehicles no. 2 and no. 3 comply with the China VI national emission standard, which came into force in 2021.
Each HDDV was tested on a chassis dynamometer (AIP-ECDM 72H/2AXLE) and operated over the China heavy-duty commercial vehicle test cycle for heavy trucks (CHTC-HT) cold-start and hot-start driving conditions, consecutively. The CHTC-HT driving cycle (1800 s) simulates the driving conditions for heavy-duty commercial vehicles in China and is divided into three segments: low-speed (phase one, P1, 342 s), middle-speed (phase two, P2, 988 s), and high-speed (phase three, P3, 470 s), and samples were collected separately. Moreover, samples were also collected during the whole sampling time (W, 1800 s) under cold-start and hot-start driving conditions, hereafter referred to as W_cold and W_hot, respectively. Prior to the cold start, each vehicle was preconditioned overnight to cool the engine completely. The time slot between the cold start and hot start was approximately 10 min. Each test cycle was repeated three times.
The constant volume sampler (CVS) is equipped with a real-time gas analyzer module (MEXA-7400HLE, HORIBA, Japan) to monitor the transient concentrations of CO and CO2. An array of online and off-line instruments are deployed to measure the heavy-duty vehicle exhaust in the gas and particle phases. Experimental conditions, including temperature, airflow, relative humidity, and pressure, and inorganic and organic components are monitored side by side. The details of the sample collection of gaseous I/SVOCs are described elsewhere (He et al., 2022). The particulate I/SVOC collection procedures are given below. Tailpipe emissions from each HDDV are drawn into the CVS system, along with ambient air that is filtered by a high-efficiency particulate air filter. The diluted diesel exhaust is then directed into the second dilution trunk (SDT), where the diesel-emitted particles are further diluted before entering the PM sampler and being collected by quartz filters. For each test, one 47 mm quartz filter (Grade QM-A, Whatman, UK) is loaded for particle collection. The quartz filters are prebaked overnight at 550 ∘C to remove any carbonaceous contamination. The particle-sampling probe is placed on the center line of the first dilution truck (DT), and the length of DT is 10 times its inner diameter to guarantee thorough mixing. The airflow, temperature and humidity control, and dilution ratios within the whole sampling system follow the stipulations of the China VI emission standard. The average temperature in the sampling train is 47±5 ∘C. Field blank samples are collected upstream of the emission pipeline. An diagram outlining the collection of gaseous and particulate emissions as well as the position of gas monitors is shown in Fig. S1 in the Supplement.
2.2 Sample treatment and chemical analysis
A total of 36 filter samples and 3 field blanks were collected and subjected to the determination of I/SVOCs, among which one-third was non-(DPF + DOC) vehicle samples and two-thirds were (DPF + DOC) vehicle samples. A precious portion of 1 cm2 (1 cm × 1 cm) was removed from the quartz filter and cut into strips before being placed into the thermal desorption (TD) tube. A total of 2 µL of deuterated internal standard (IS) mixing solution was spiked onto the strips through a mild N2 blow (CSLR, Markes International). The list of IS species is shown in the Supplement (Sect. S1). The TD tubes were placed into an automated thermal desorption system (TD100-xr, Markes International), which is connected to a two-dimensional gas chromatograph (GC × GC) (Agilent 7890B, Agilent Technologies) coupled with a time-of-flight mass spectrometer (ToF-MS) (LECO Pegasus4D, LECO Corporation).
The TD, GC × GC, and ToF-MS parameters are similar to those previously published for the measurement of gaseous I/SVOCs (He et al., 2022). Briefly, the TD tubes are heated to 315 ∘C for 20 min during which time the I/SVOCs are gradually vaporized and condense at the cold trap, which is maintained at 25 ∘C. The trap is then heated to 330 ∘C for 5 min, and the reconcentrated compounds are purged into the GC column in a split ratio of 8.7 : 1. The first Rxi-5ms capillary column (30 m × 0.25 mm × 0.25 µm, Restek) and the second Rxi-17Sil MS capillary column (0.75 m × 0.25 mm × 0.25 µm, Restek) are installed to separate the analytes. A modulator is deployed to partition the effluents from the first column into cryo-focused segments and to inject them into the second column (with a modulation time slot of 4 s). The column flow is set at 1.3 mL min−1; the GC oven initial temperature is 50 ∘C for 5 min, and it is increased to 300 ∘C at 5 ∘C min−1 and held for another 5 min. The secondary oven and modulator temperatures are 5 and 30 ∘C higher than the GC oven temperature, respectively. The complete run time is approximately 3900 s. The ToF-MS is conducted in electron impact positive (EI +) mode (70 eV) scanning over an range of 35–550 amu. The ion source temperature is kept at 250 ∘C.
2.3 Data analysis
Particulate I/SVOCs are identified and quantified with their respective authentic standards or surrogates using the three-step approach proposed in He et al. (2022). In short, within one GC × GC chromatogram, for the peaks for which the authentic standards are available, they are accurately identified based on the retention time of the respective authentic standards and their mass spectrum, and they are precisely quantified based on the constructed calibration curves. The list of authentic standards is shown in Table S1 in the Supplement. Next, for the peaks for which the authentic standards are not available, they are semi-identified by referring to the elution sequences and extracting mass spectrum patterns via a self-developed algorithm. The syntax is described in He et al. (2022). Third, for the peaks without clear mass spectrum patterns, they are semi-identified by the physically nearest surrogate within the GC × GC chromatogram. The surrogate is picked out by iterating through all of the authentic standards using the self-developed data-processing program and comparing the first retention time (RT1) and second retention time (RT2) intervals.
Basically, thousands of peaks are identified and grouped into 21 categories. The classified particulate I/SVOCs include alkanes, alkenes, cycloalkanes, hopane, two-ring PAHs, three-ring PAHs, four-ring PAHs (PAH4rings202 and PAH4rings228), five-ring PAHs, biphenyl and acenaphthene, acid, phenol benzylic alcohol, aliphatic alcohol ether, aliphatic ketone ester, benzylic ketone ester, nitros, C2 alkyl benzene, C3 alkyl benzene, C4 alkyl benzene, C5 alkyl benzene, and C6 alkyl benzene.
2.4 Calculation of emission factors (EFs)
Particulate I/SVOC EFs are determined using the following equation by assuming that the CO2 and CO are the dominant combustion products of diesel fuel:
where EF is the emission factor of particulate I/SVOCs (mg kg−1 of fuel); ΔI/SVOCs is the mass deposited on the quartz filter in the CVS (mg), which is corrected for the background contamination measured on the field blanks and column bleedings; Δ[CO2] and Δ[CO] are the background-corrected CO2 and CO masses (mg), respectively; , MCO, and MC are the molar weight of CO2 (44 g mol−1), CO (28 g mol−1), and C (12 g mol−1) atom; Vcvs and VS are the airflow monitored in the CVS and particle-sampling trunk (L min−1); and wC is the mass fraction of carbon (0.865) in the diesel fuel (Dallmann et al., 2013).
3.1 EFs and the chemical speciation of particulate I/SVOCs
Figure 1 shows the speciated EFs of the HDDV-emitted I/SVOCs in the particle phase. Generally, over 4000 individual peaks are detected within different tailpipe samples and grouped into 21 categories after the three-step data treatment procedure. The average HDDV-emitted particulate I/SVOC EFs of cold-start and hot-start driving cycles are 147.2±68.3 and 1.7±0.3 mg kg−1 of fuel for non-(DPF + DOC) vehicles and 1.6±0.3 and 0.9±0.1 mg kg−1 of fuel for (DPF + DOC) vehicles, respectively. The substantial removal effect of the aftertreatment devices is confirmed. The category-specific EFs for the non-(DOC + DPF) and (DOC + DPF) vehicles are shown in Table S2.
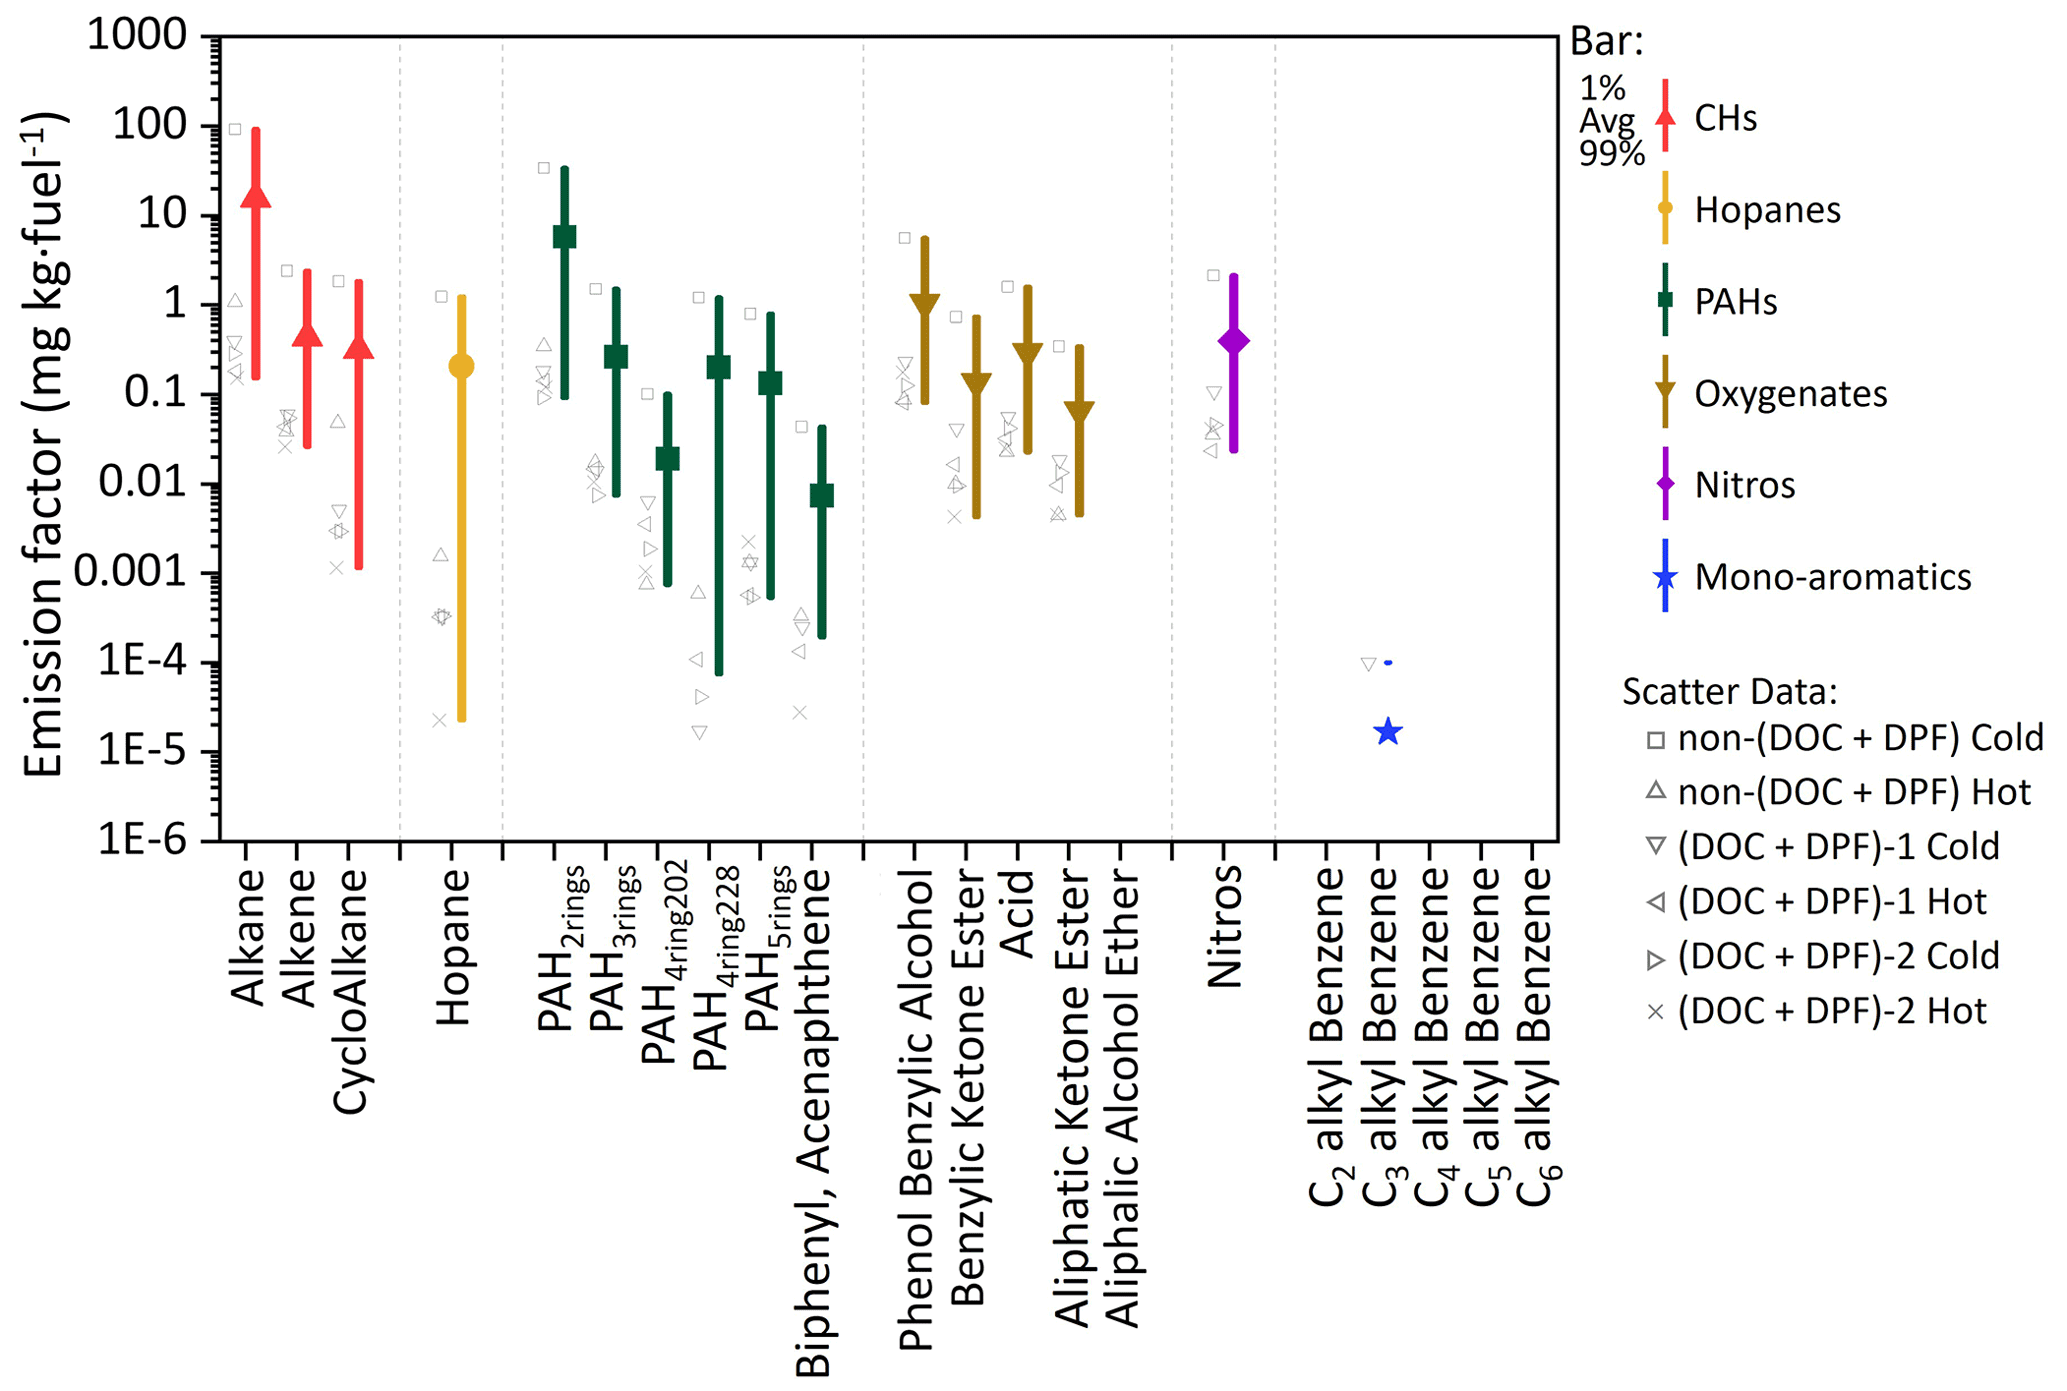
Figure 1The measured EFs (mg kg−1 of fuel) of the 21 categories of HDDV-emitted I/SVOCs in the particle phase. Colored bars and colored/shaped scatters represent different organic species and driving cycles, respectively. The scatter points on the left side of the bars represent the averaged EFs measured from different driving conditions or test vehicles. The square dots in the middle of each bar denote the average value, and the lower and upper boundaries of the bar denote the 1st and 99th percentiles of the values, respectively.
In general, alkanes are the most abundant species, comprising 22 %–63 % of the total particulate I/SVOCs, followed by two-ring PAHs (20 %–33 %) and phenol benzylic alcohols (14 %–17 %). The EFs of alkanes derived from non-(DOC + DPF) vehicles under the cold-start condition average 92±42.8 mg kg−1 of fuel, which is 2 orders of magnitude higher than that of hot-start cycle and (DOC + DPF) vehicles, as illustrated by the gray squares in Fig. 1. Alkenes and cycloalkanes show commensurate EFs, with average values of 2.4±1.1 and 1.8±0.9 mg kg−1 of fuel for the cold-start driving cycle and 0.04±0.01 and 0.05±0.02 mg kg−1 of fuel for the hot-start driving cycle for non-(DOC + DPF) vehicles, accounting for minor parts of the total particulate I/SVOCs. The emission of the two species is further reduced after the installation of aftertreatment devices.
Two-ring to five-ring PAHs are frequently detected in particulate I/SVOCs, in contrast to the gaseous I/SVOCs for which only two-ring to four-ring PAHs were observed (He et al., 2022). The averaged EFs of the PAH subgroup vary significantly. For example, for non-(DOC + DPF) vehicles operated under cold-start driving condition, two-ring PAHs are detected in abundant concentrations (33.8±15.7 mg kg−1 of fuel), whereas three-ring, four-ring, and five-ring PAHs are detected at much lower concentrations (1.5±0.7, 1.3±0.6, and 0.3±0.1 mg kg−1 of fuel, respectively). It has been reported that 16 priority PAHs listed by the United States Environment Protection Agency account for a minor fraction of the total PAH mass, and the non-targeted analysis has highlighted the significance of the unresolved PAHs (An et al., 2022; Chen et al., 2022). The two isomers, biphenyl and acenaphthene, contribute least (less than 0.2 %) within the PAH subgroup, which is consistent with previous findings (Hazarika et al., 2019).
Oxygenated compounds, including phenol benzylic alcohols, aliphatic ketones, benzylic ketones, and acids are routinely detected. The EFs sum to over 7 % of the total mass. Aliphatic alcohols are observed to be abundant in the gas phase but are not detected in particulate I/SVOCs (He et al., 2022). The installation of DPFs and DOCs reduces the emission of oxygenates by over 93 %–99 %. For instance, the EF of benzylic alcohols of non-(DOC + DPF) vehicles is 2.83 mg kg−1 of fuel (average of cold-start and hot-start conditions) whereas that of (DOC + DPF) vehicles is 0.15 mg kg−1 of fuel (average of cold-start and hot-start conditions).
The EF of nitros is measured to be 0.4 mg kg−1 of fuel on average, taking up 1.6 % of the total mass. The installation of DPFs and DOCs reduces the emission of nitros by over 95 %, from 1.08 to 0.05 mg kg−1 of fuel (average of cold-start and hot-start conditions). Monoaromatic compounds (i.e., C2–C6 alkyl-substituted benzenes), which were measured to take up over 10 % of the gaseous I/SVOCs, are negligible constituents in the particle phase (He et al., 2022).
3.2 Volatility distribution of the speciated I/SVOCs and the comparison between cold and hot starts
Figure 2 displays the volatility distribution of the speciated I/SVOCs under the cold-start and hot-start driving conditions for non-(DOC + DPF) and (DOC + DPF) vehicles. The inset pie charts illustrate the color-coded mass contributions of each compound category. The absolute values of the I/SVOC EFs distributed in each volatility and O : C bin are summarized in Tables S3–S8. The calculation of the saturation mass concentration is presented in the Supplement (Sect. S4). The volatility distributions among the four test conditions, i.e., cold-start non-(DOC + DPF) (CwoAT), hot-start non-(DOC + DPF) (HwoAT), cold-start (DOC + DPF) (CwiAT), and hot-start (DOC + DPF) (HwiAT), do not vary much except for the two peaks at log µg m−3 and log µg m−3 under CwoAT and HwoAT conditions (Fig. 2a and b, respectively). The abnormal abundant emissions indicate intensive incomplete combustion processes, especially under the cold-start condition. The high emissions at the low-volatility end vanish after the installation of a DOC and DPF (Fig. 2a vs. Fig. 2c and Fig. 2b vs. Fig. 2d), revealing that the aftertreatment devices eliminate the low-volatility compounds (mostly alkanes) efficiently. Great environmental benefits are thereby expected with the advancement of aftertreatment technologies.
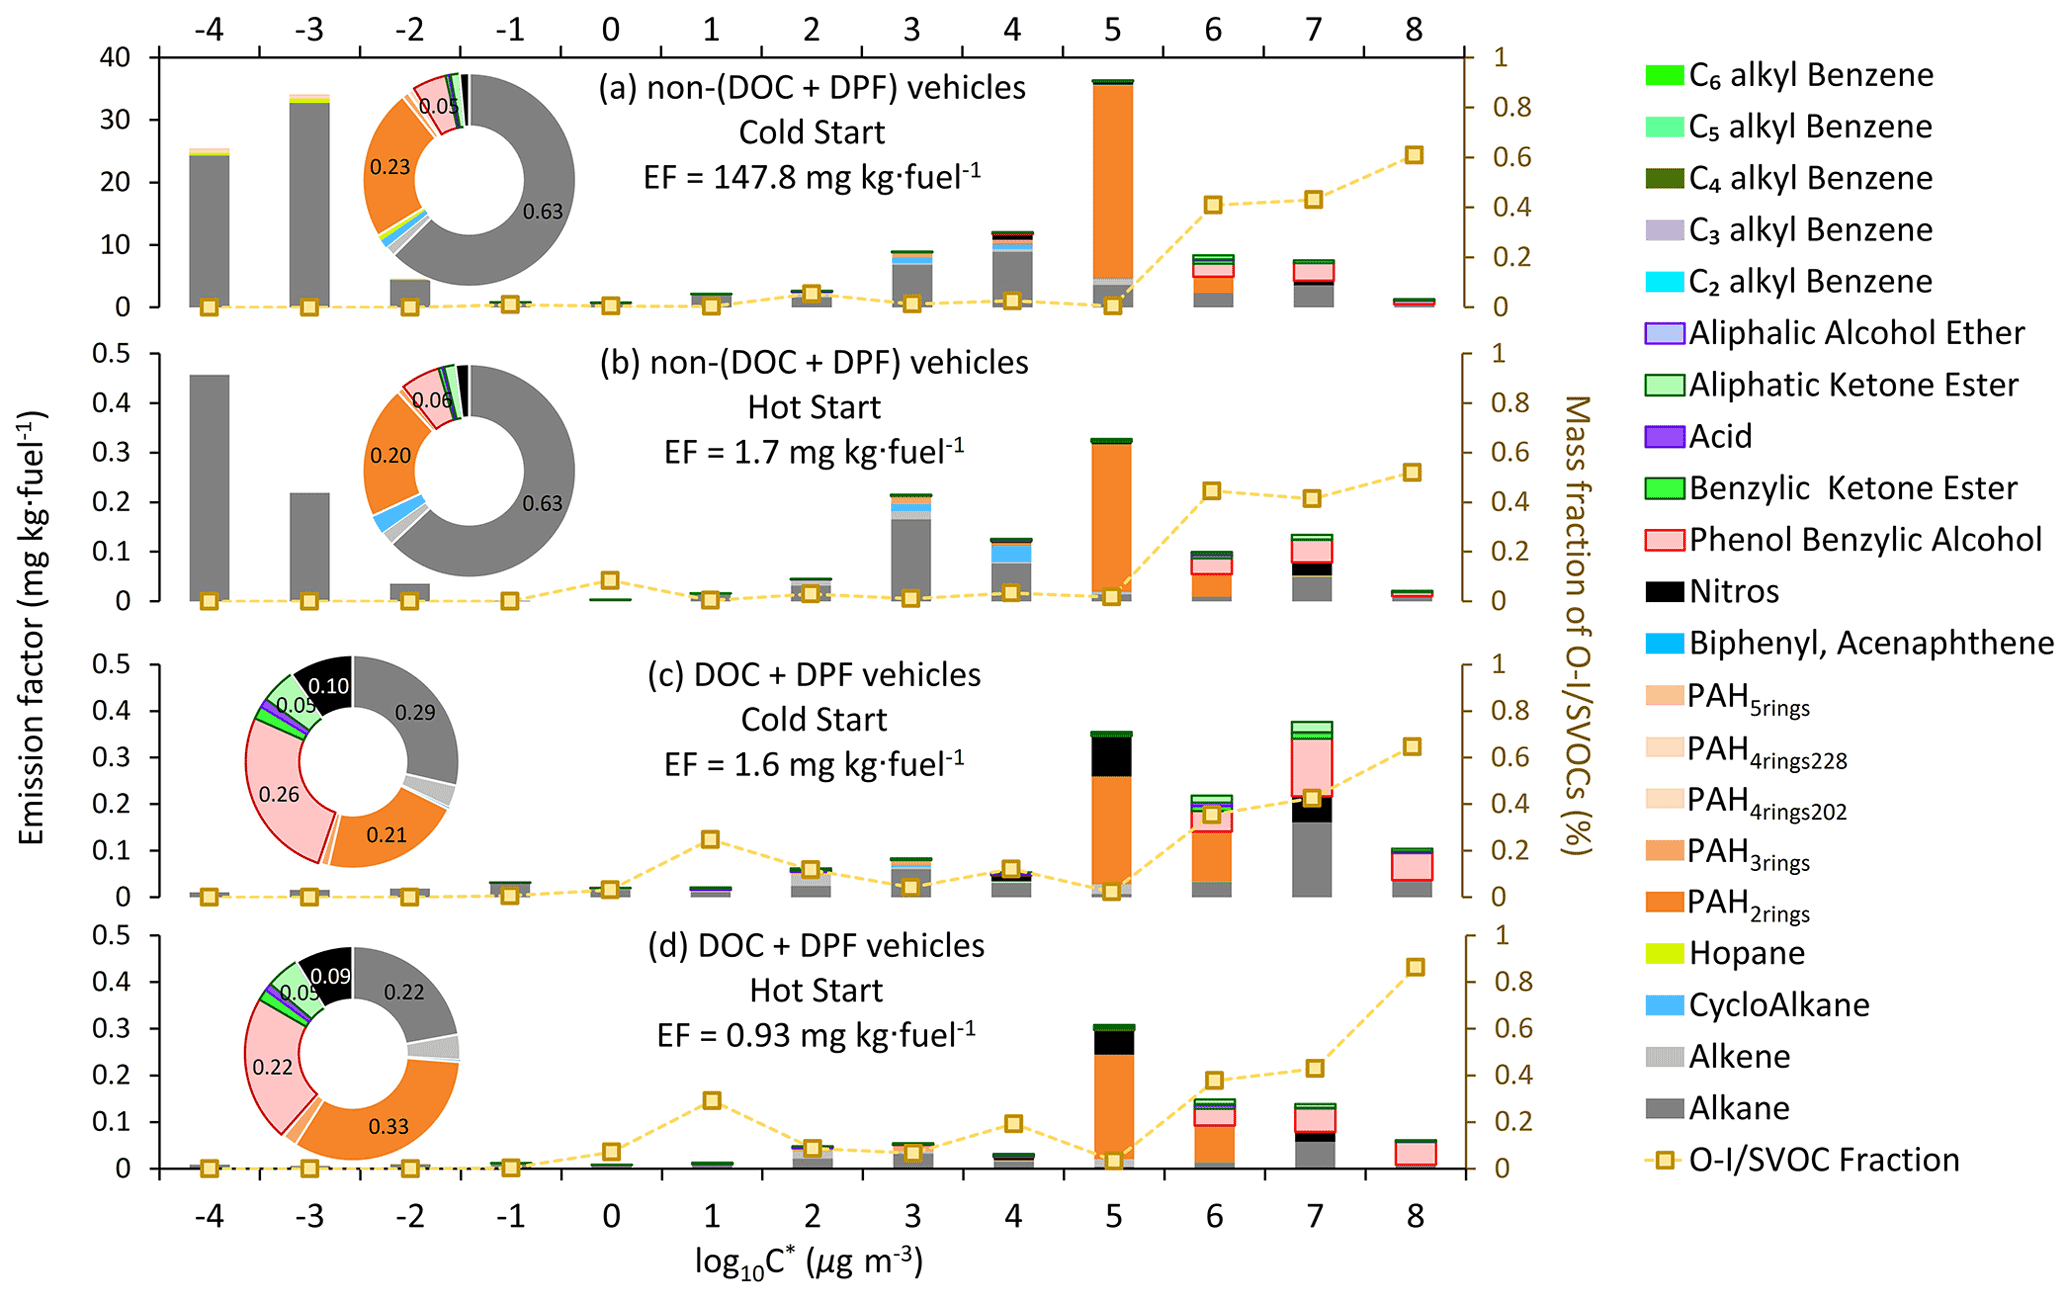
Figure 2EFs of particulate I/SVOCs under the cold-start and hot-start driving conditions. Different colored bars represent different compound categories. The mass fraction of the O-I/SVOCs, indicated by the scattered squares, is scaled by the right axis. The inset pie charts are the mass fractions of different compound categories, and the numbers show the mass contributions of the top few species.
The majority of particulate I/SVOCs distribute in the volatility range of log to 8 µg m−3, whereas the specified compound categories distribute differently and could be classified into three groups. First, alkanes are observed within the whole volatility range at an abundant level. Second, hopanes, PAH4rings, and PAH5rings dominantly reside in the volatility range of log µg m−3. For example, about 44 % of the hopane mass is measured in the volatility bin of log µg m−3. Third, low-molecular-weight PAHs, oxygenated compounds, and nitros are primarily present in the volatility range of log µg m−3. For example, phenol benzylic alcohols, the most abundant oxygenated compounds observed in particulate I/SVOCs, entirely partition into the high-volatility range.
The mass fractions of oxygenated I/SVOCs (O-I/SVOCs) under cold-start and hot-start driving conditions in the gas and particle phases are shown in Fig. S3. The impacts of O-I/SVOCs on SOA formation are complex. On the one hand, the formation potential of oxidized components is lower than that of hydrocarbons, for example alkanes (Chacon-Madrid and Donahue, 2011; Donahue et al., 2011; Ziemann, 2011). On the other hand, the increasing O : C ratio adds fragmentation on the carbon skeleton, which would facilitate SOA formation (Donahue et al., 2012; Kroll et al., 2009). An increasing trend in the mass fraction of particulate O-I/SVOCs from the low-volatility end to the high-volatility end is clearly demonstrated, whereas a bimodal pattern is observed in gaseous O-I/SVOCs. The gaseous O-I/SVOCs were divided into two major groups, with one group peaking in the volatility range of log to 8 µg m−3 and another group prevailing in the volatility range of log to 3 µg m−3. The two groups possess different chemical structures and functional groups. They have been fully addressed in previous work and will not be repeated here (He et al., 2022). By contrast, one compound category, phenol benzylic alcohols, dominates in the particulate O-I/SVOCs. The mass fraction of phenol benzylic alcohols is 5 % and 6 % for non-(DOC + DPF) vehicles. The mass ratio increases to 26 % and 22 % for (DOC + DPF) vehicles under cold-start and hot-start conditions, respectively. It contributes significantly to the total mass in the high-volatility range of log to 8 µg m−3.
3.3 The EF distribution of particulate I/SVOCs
Figures 3 and 4 display the EF distribution of the speciated particulate I/SVOCs on a two-dimensional volatility basis set (2D-VBS) space of the P1, P2, P3, and whole (W_cold and W_hot) driving cycles. The absolute values of I/SVOC EFs distributed in each volatility and O : C bin are summarized in Tables S3–S12 in the Supplement.
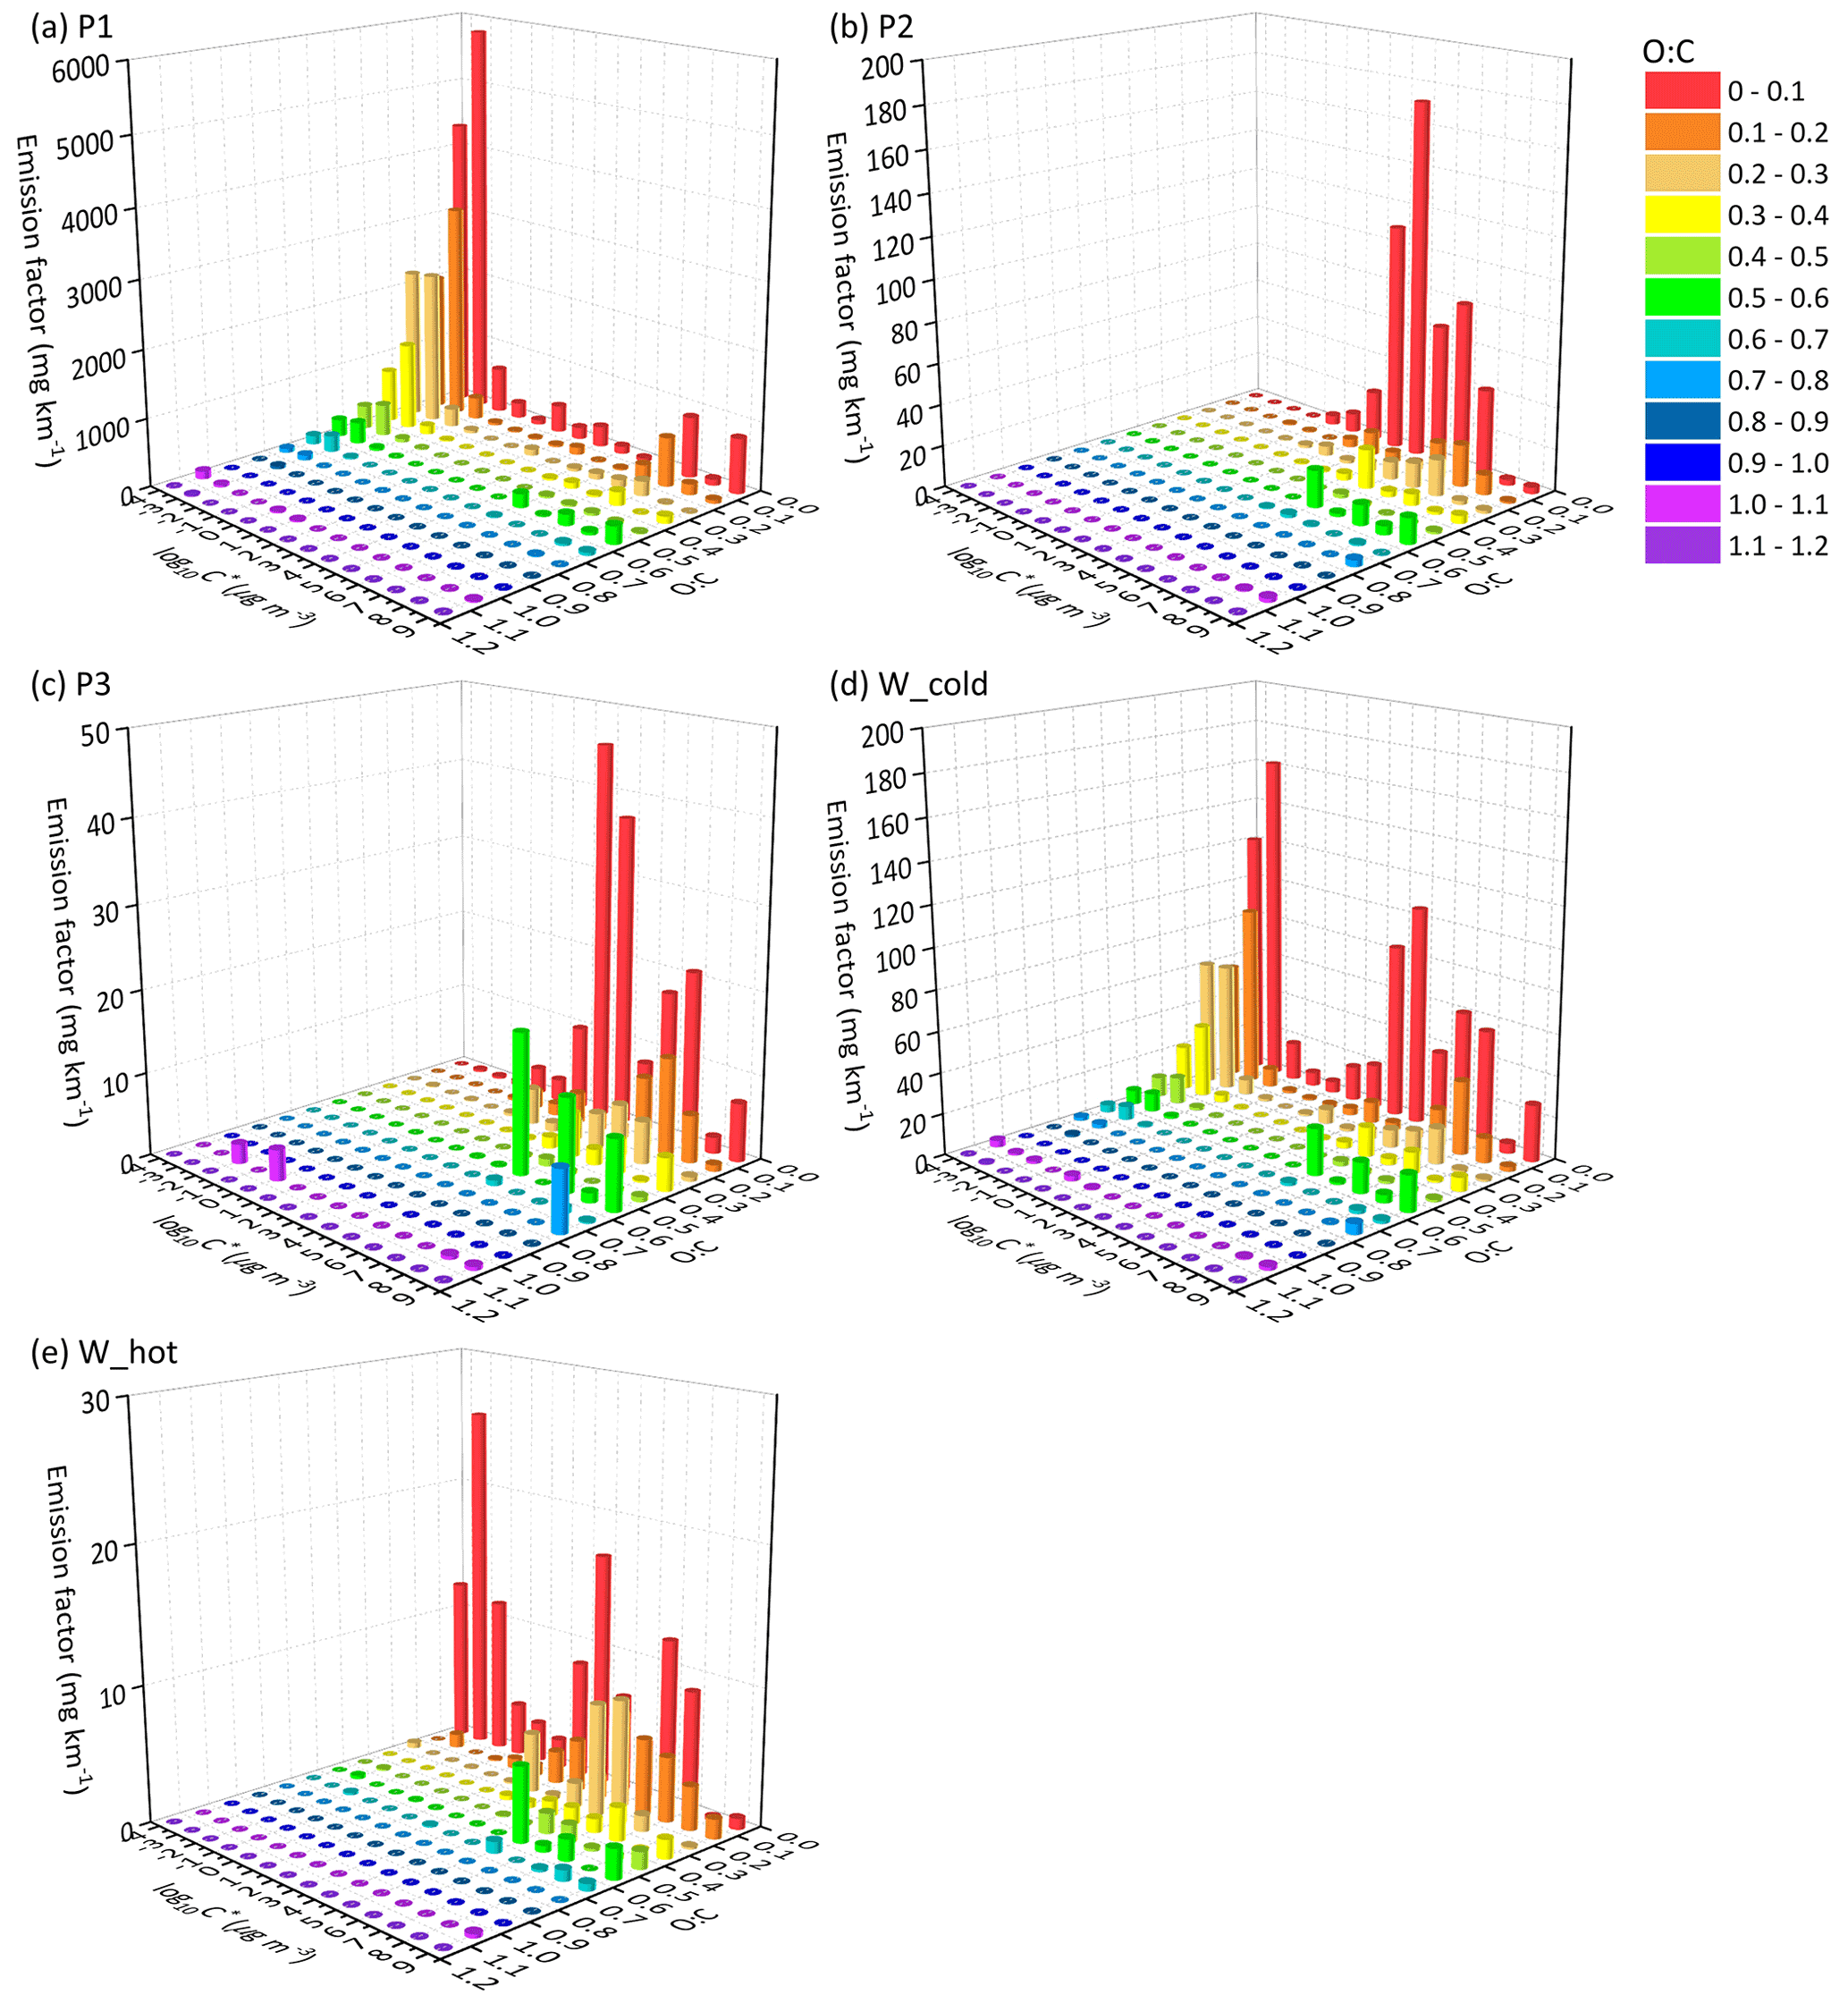
Figure 3The EF distribution of the speciated I/SVOCs of non-(DPF + DOC) vehicles on a 2D-VBS space of (a) low-speed-stage (P1), (b) middle-speed-stage (P2), (c) high-speed-stage (P3), (d) whole (W_cold), and whole (W_hot) driving cycles. Different colors indicate different O : C ratios segmented into 12 bins: 0–0.1, 0.1–0.2, 0.2–0.3, 0.3–0.4, 0.4–0.5, 0.5–0.6, 0.6–0.7, 0.7–0.8, 0.8–0.9, 0.9–1.0, and 1.1–1.2.
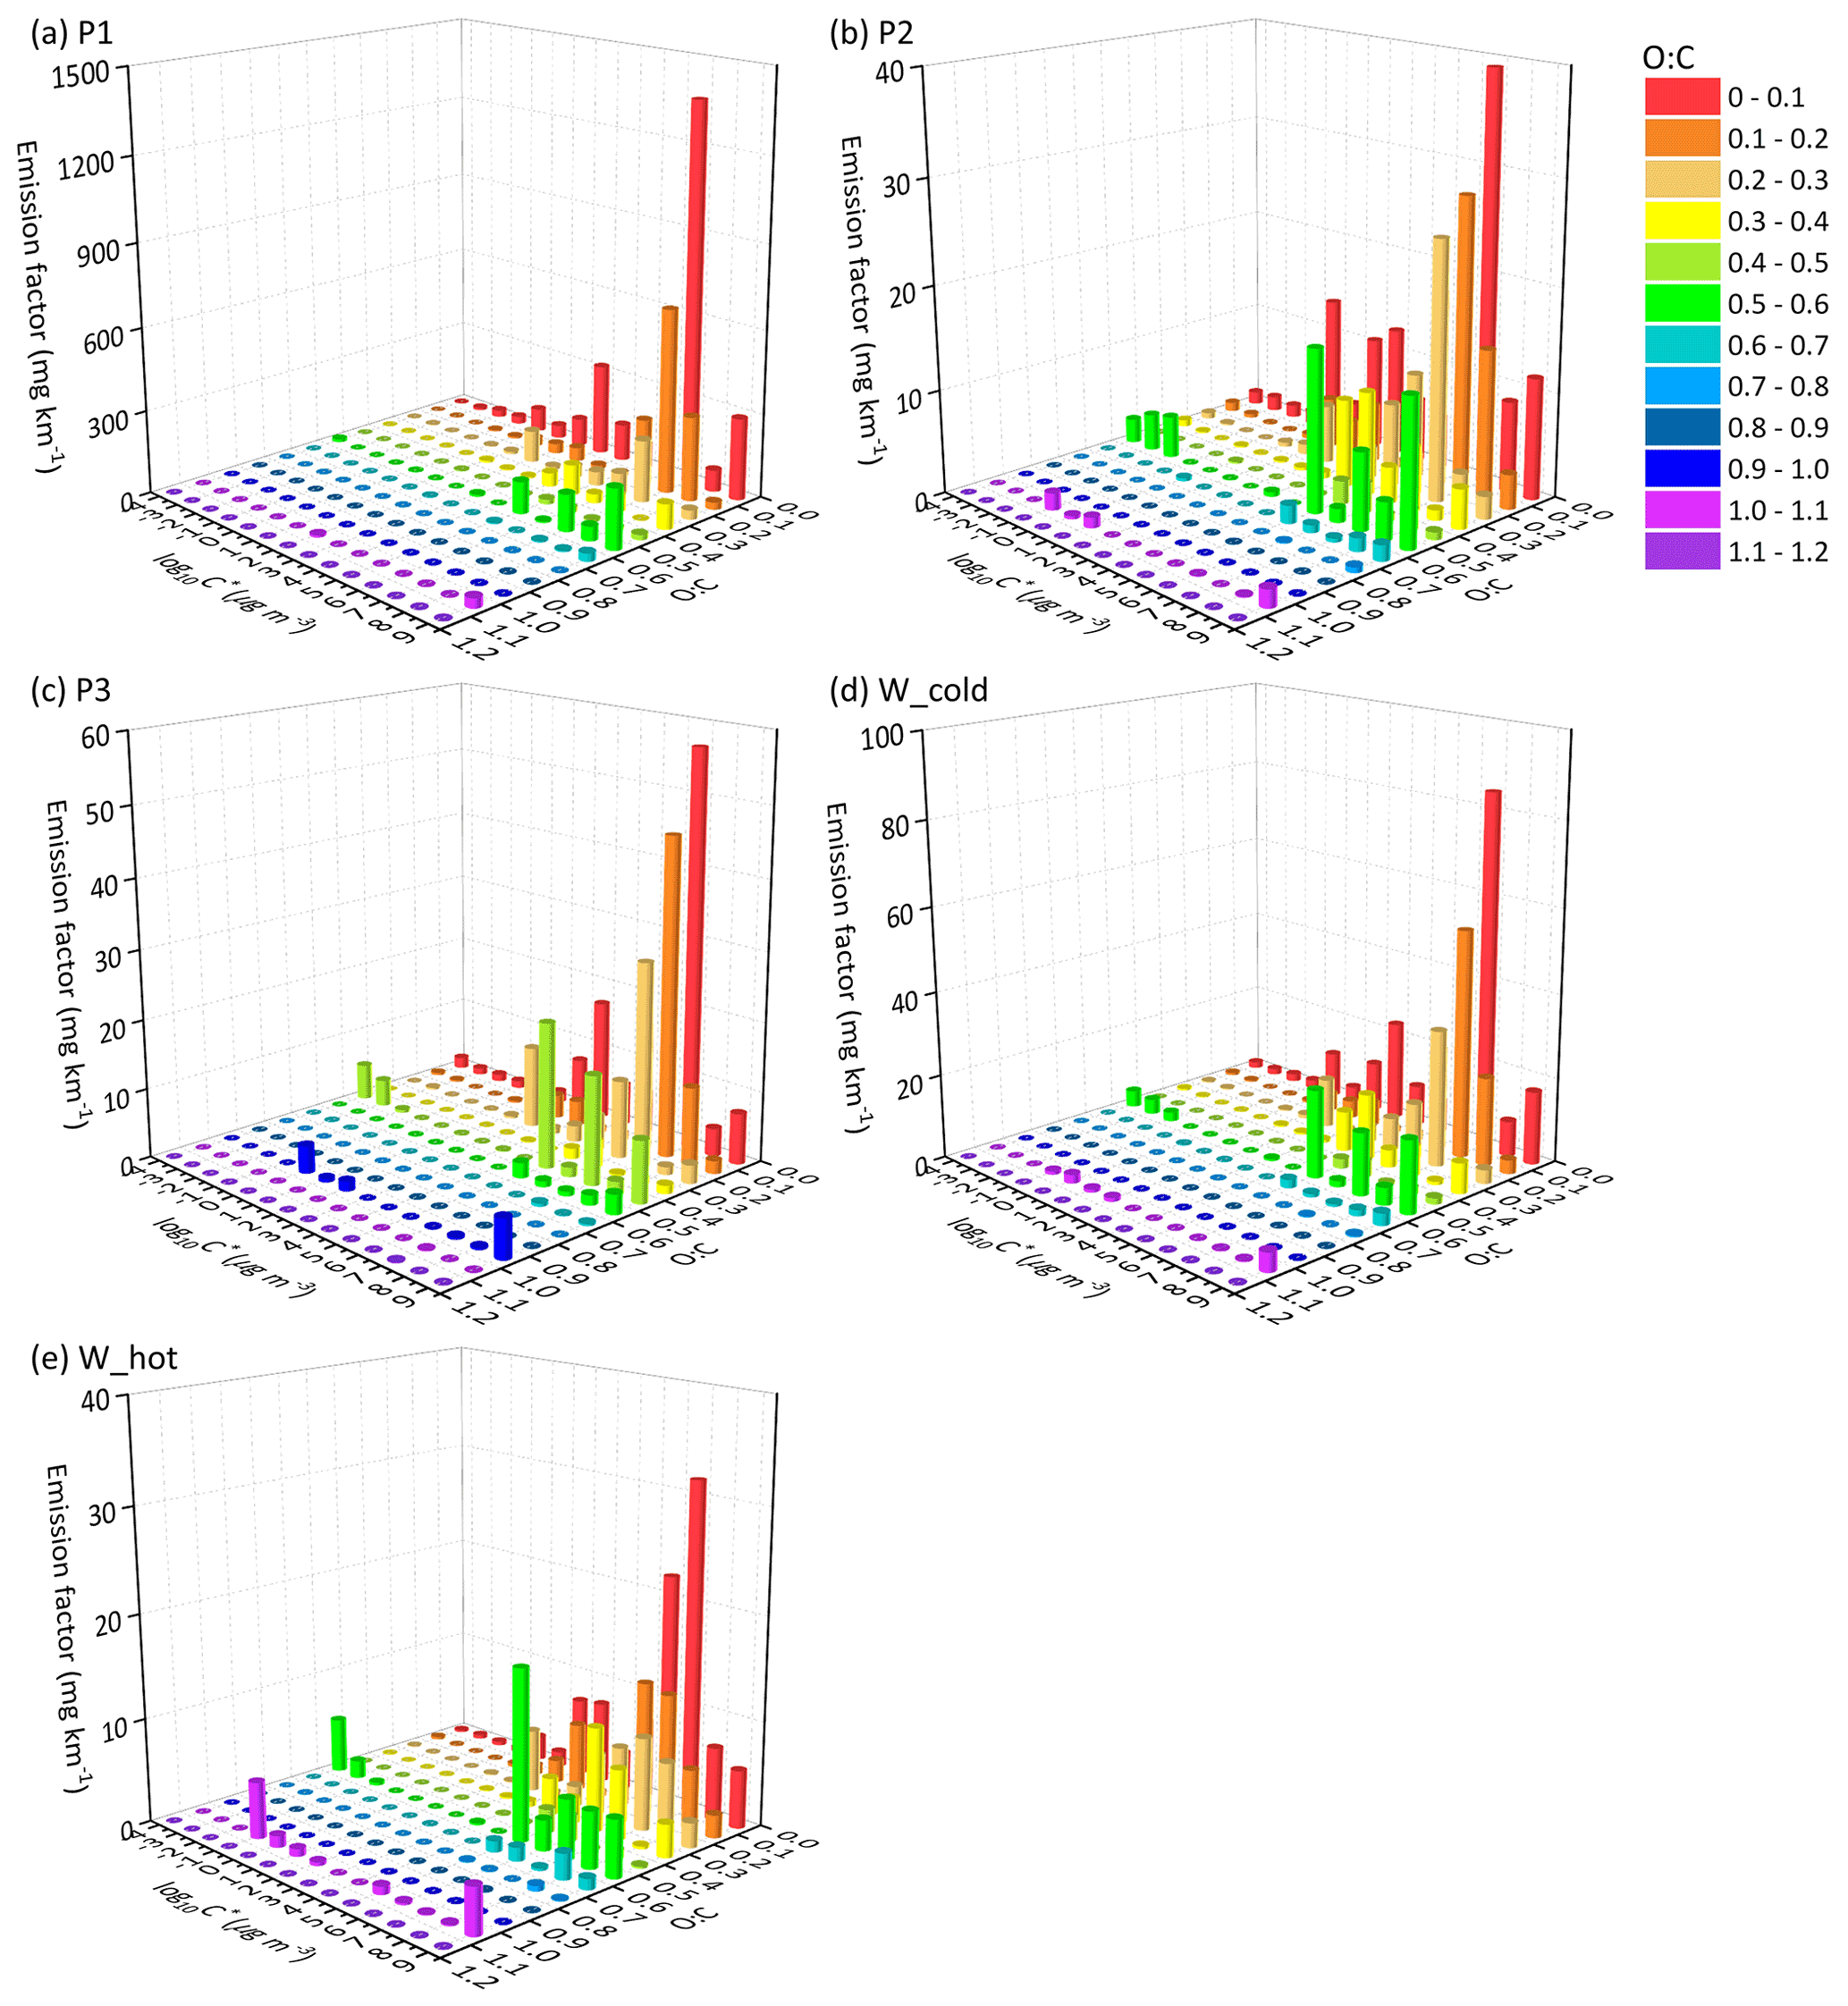
Figure 4The EF distribution of the speciated I/SVOCs of (DPF + DOC) vehicles on a 2D-VBS space of (a) low-speed stage (P1), (b) middle-speed stage (P2), (c) high-speed stage (P3), (d) whole (W_cold), and whole (W_hot) driving cycles. Different colors indicate different O : C ratios segmented into 12 bins: 0–0.1, 0.1–0.2, 0.2–0.3, 0.3–0.4, 0.4–0.5, 0.5–0.6, 0.6–0.7, 0.7–0.8, 0.8–0.9, 0.9–1.0, and 1.1–1.2.
Distinct distribution patterns are observed between different speed stages. For non-(DPF + DOC) vehicles, peak signals of P1 are detected at low-volatility and low O : C ratio bins (i.e., log to −4 µg m−3 and O : C < 0.3), whereas those of P2 and P3 are measured at log to 7 µg m−3 and the fraction of I/SVOCs with higher O : C ratio increases, especially at the high-speed stage (P3). For example, the fractions of I/SVOCs with O : C > 0.3 (0.4, 0.5) are 18.4 % (10.2 %, 7.0 %), 13.4 % (8.3 %, 7.6 %), and 25.3 % (19.4 %, 18.6 %) for the P1, P2, and P3 stages. The fraction of I/SVOCs with a higher O : C ratio decreases rapidly to less than 10 % for low- and middle-speed stages; in contrast, the fraction remains at a comparable level for the high-speed stage. The emission characteristics of the whole driving cycle combine the patterns of the separate speed phases, and a bimodal trend is observed, as displayed in Fig. 5d and e.
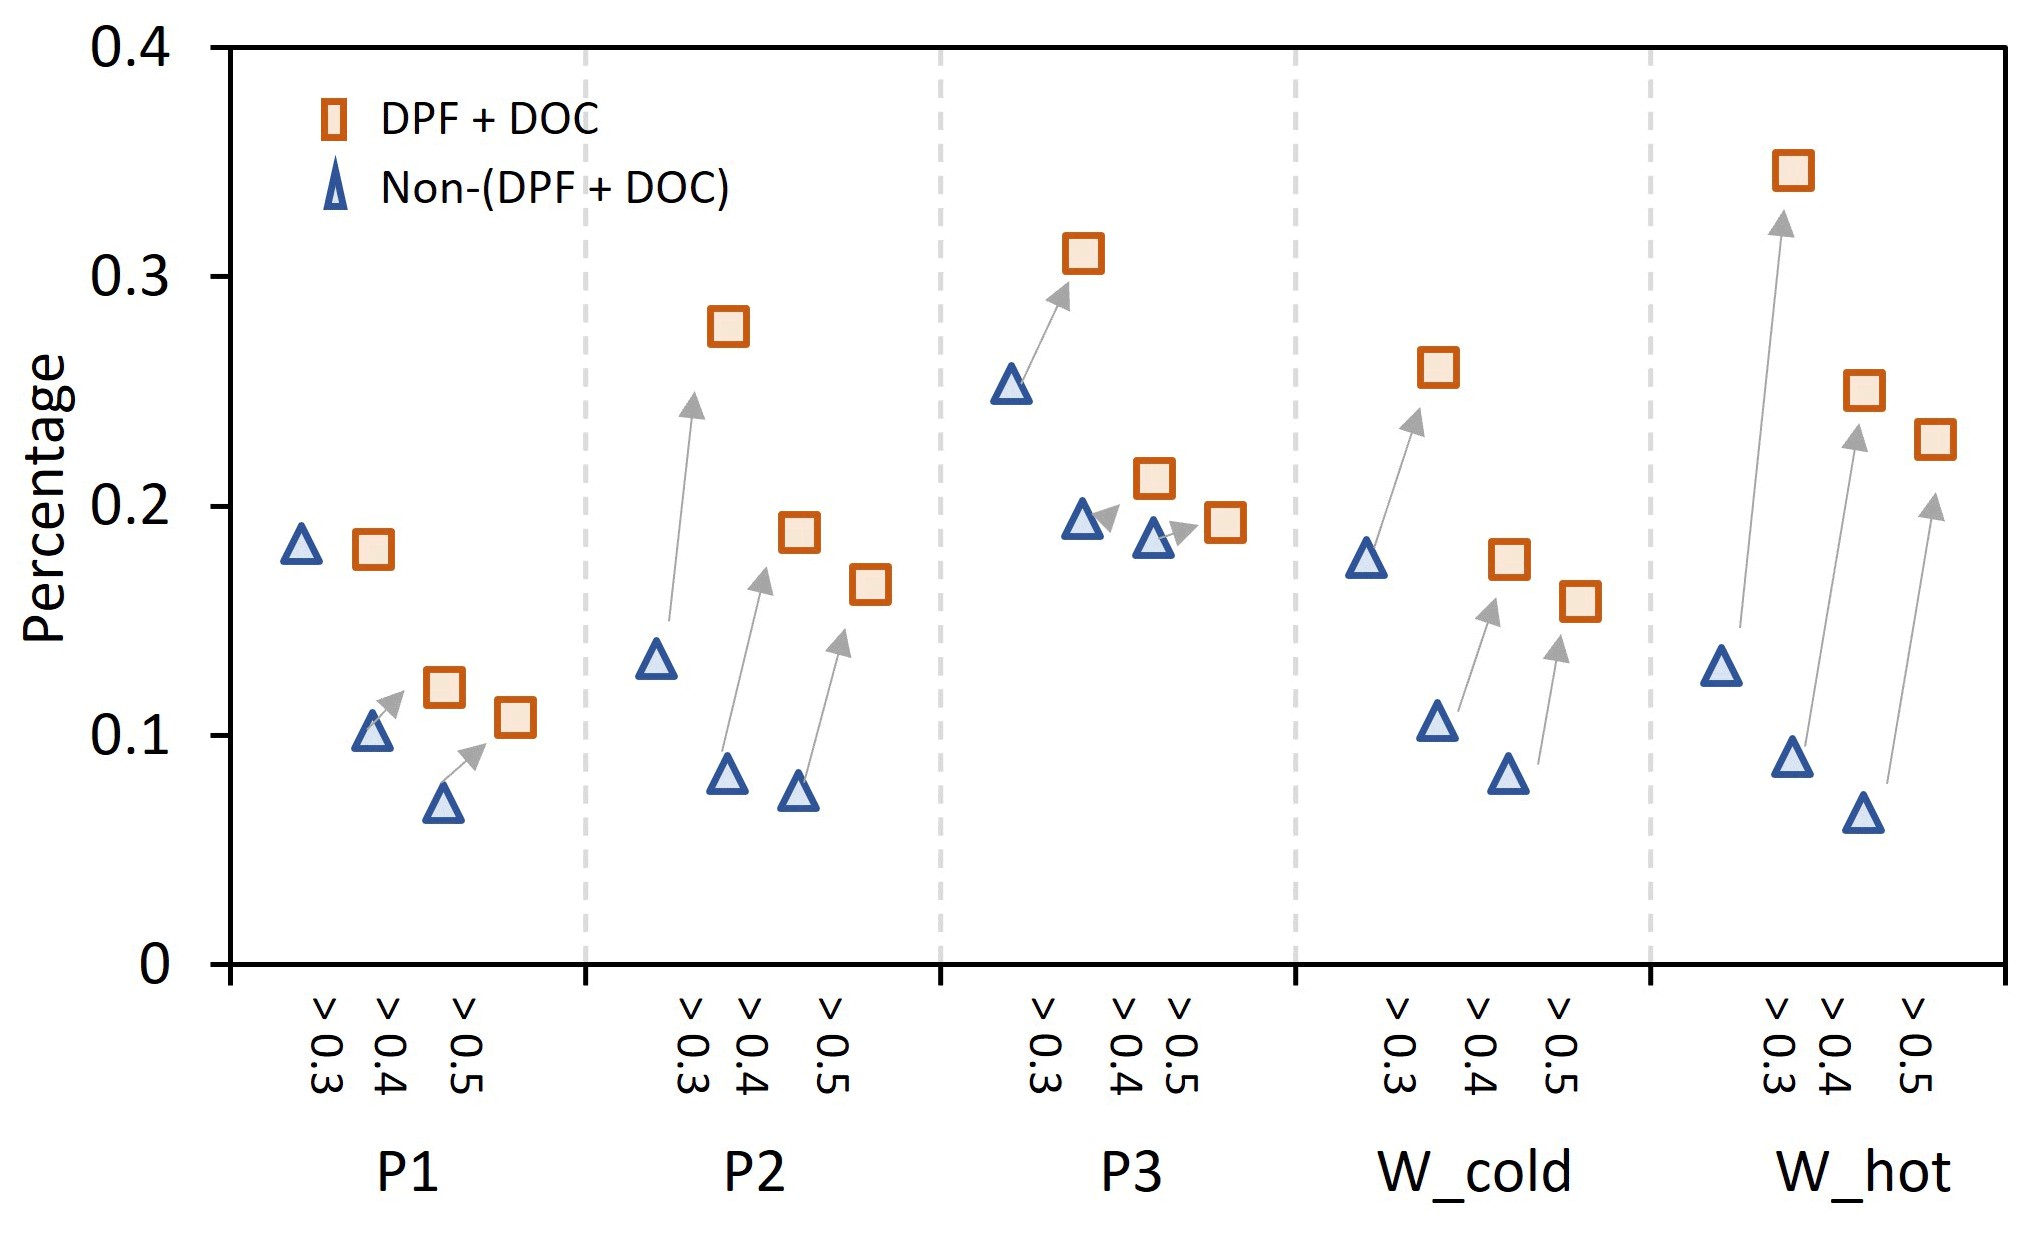
Figure 5The increment of I/SVOCs with O : C >0.3, 0.4, and 0.5 from non-(DPF + DOC) to (DPF + DOC) vehicles under the low-speed stage (P1), middle-speed stage (P2), high-speed stage (P3), and whole (W_cold and W_cold) driving cycles.
After the installation of aftertreatment devices, the peak signals of P1 are detected in the high-volatility bins (i.e., log to 7 µg m−3 and low O : C range). In comparison with non-(DPF + DOC) vehicles, the EF volatility distribution of P1 resembles that of P2 and P3, whereas the fraction of I/SVOCs with a higher O : C ratio for P1 is still lower than that for P2 and P3. The fractions of I/SVOCs with O : C > 0.3 (0.4, 0.5) are 18.1 % (12.1 %, 10.8 %), 27.8 % (18.9 %, 16.6 %), and 31.0 % (21.2 %, 19.3 %) for the P1, P2, and P3 stages, considering that the O : C ratio of the bulk organic species varies from 0.25 to 0.5.
Comparing the EF distribution of I/SVOCs emitted by different types of vehicles under the same driving conditions, as shown in Fig. 5, it is clearly demonstrated that the aftertreatment devices favor the formation of I/SVOCs with a higher oxidation state. DOCs promote the oxidation of exhaust gases and the organics filtrated by DPFs, and the I/SVOCs with O : C > 0.3 (0.4, 0.5) under W_hot conditions increase from 0.13 to 0.35 (0.11 to 0.18, 0.08 to 0.16) after the installation of these aftertreatment devices. The respective fractions under W_cold conditions increase from 0.18 to 0.26, from 0.09 to 0.25, and from 0.07 to 0.23, respectively.
3.4 Gas–particle partitioning of HDDV-emitted I/SVOCs and the uncertainties/artifacts
Figure 6 shows the g–p partitioning of I/SVOCs by different compound categories. Generally, the I/SVOCs predominantly partition to the gas phase, with a few exceptions: hopanes and two-ring, four-ring, and five-ring PAHs. Distinct patterns are observed between vehicles with and without DPFs and DOCs. For example, the particle phase contributes 7.4 % to the total I/SVOC mass for non-(DPF + DOC) vehicles, whereas it accounts for less than 0.2 % for (DPF + DOC) vehicles. Similar mass distributions are observed for alkanes, three-ring PAHs, and oxygenated species, thereby confirming the high particle removal efficiency of the aftertreatment devices. Monoaromatic compounds are not detected in the particle phase, regardless of the aftertreatment devices. Over 40 % of four-ring PAHs partition to the particle phase for non-(DPF + DOC) vehicles, and this proportion is reduced to less than 0.1 % when DPF and DOC systems are installed. The particle fraction of two-ring PAHs is 57 %, whereas that of three-ring, four-ring, and five-ring PAHs are 8.4 %, 43.7 %, and 100 %, respectively.
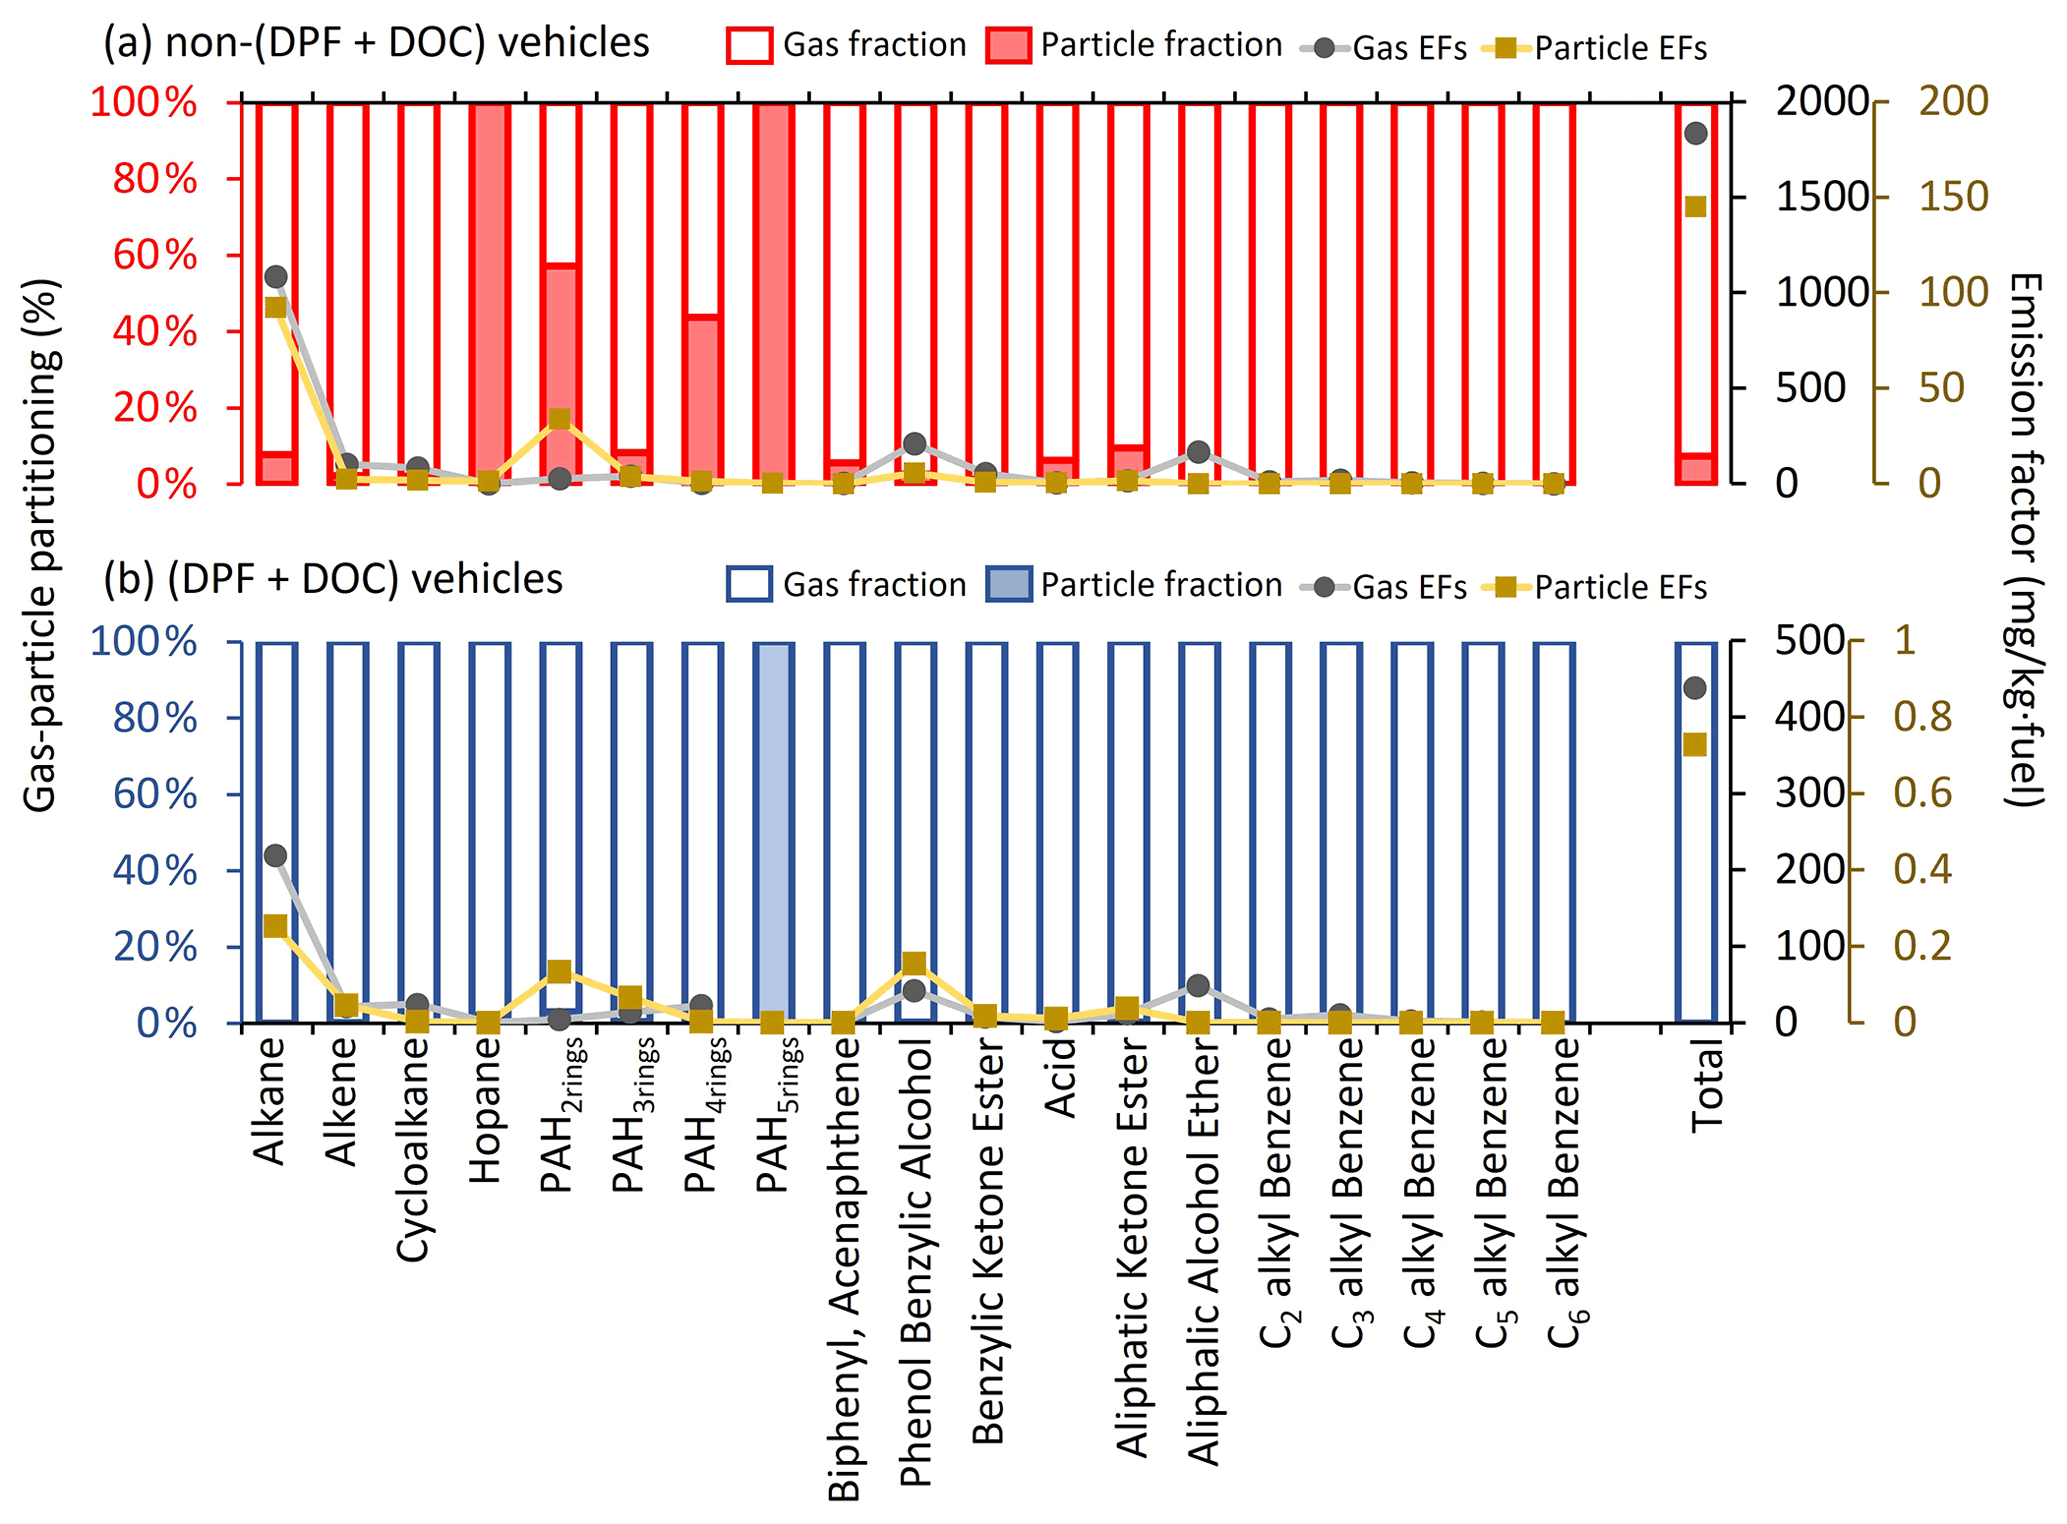
Figure 6The gas–particle partitioning of speciated I/SVOCs emitted from (a) non-(DPF + DOC) vehicles and (b) (DPF + DOC) vehicles. The hollow and filled columns represent the gas and particle fractions, respectively. The gray dots and brown squares represent the EFs of the gaseous and particulate I/SVOCs, respectively.
The adsorption of gaseous I/SVOCs onto filters causes negative biases in the measured gas-phase concentration and positive artifacts in the measured particle-phase concentration (Turpin et al., 1994). Compared with quartz filter, which significantly absorbs vapors (May et al., 2013b), Teflon has a small surface area and is relatively inert. The OA concentration in the tailpipe is orders of magnitude higher than that in the ambient air, even after dilution in the CVS system. With such high OA loadings, the g–p partitioning shifts to the particle phase. Although inevitable, the bias should be closely watched. For example, the sampling tube is short enough (less than 50 cm) to minimize the g–p conversion in the sampling system (the residence time is less than the timescale to reach g–p equilibrium) (Saleh et al., 2013), and Teflon filter is deployed instead of a quartz filter. The good news is that there will be a significant pressure drop before and after the Teflon filter, and the lower pressure behind the Teflon drives the g–p partitioning to the gas phase, which offsets the vapor loss to some extent (Turpin et al., 1994).
We then quantify the sampling artifacts. As shown in Fig. 7, the particle mass fraction increases gradually from log to −4 µg m−3. Similar trends have previously been observed (Lu et al., 2018). There is a peak in the volatility range of log to 7 µg m−3 when the particle mass fraction fluctuates around 10 % (Fig. 7a). The particle fraction decreases to less than 1 % in the volatility range of log to 2 µg m−3. It is highly likely that the peak reflects the sampling artifacts originating from the vapor loss to the quartz filter. The DOC component oxidizes and removes the exhausted gases efficiently, as a consequence of which the sampling artifacts are reduced (i.e., from 10 % to 1 %). The vapor loss occurs in a certain volatility range instead of over the whole volatility range (e.g., log to 7 µg m−3) and is dominant in the log µg m−3 bin in this study. The gaseous IVOCs in the log µg m−3 bin may be too volatile to be absorbed by quartz filter. For non-(DPF + DOC) vehicles, the particle fraction is approximately 1 % in the log µg m−3 and log µg m−3 bins (the volatility bins adjacent to the bins with sampling artifacts). If we assume that the particle fraction baseline is 1 % in the volatility range of log to 8 µg m−3, we may deduce that the vapor loss to quartz filter results in a negative bias for the gaseous I/SVOCs mass, with an upper limit of 9 %, and approximately 90 % of the particulate I/SVOCs result from sampling artifacts in the volatility range of log to 7 µg m−3. It is also worth mentioning that the absorption bias varies significantly for different compound categories. For example, substantial two-ring PAHs are detected in the particle phase, whereas no notable sampling artifacts are observed for phenol benzylic alcohols and benzylic ketone esters.
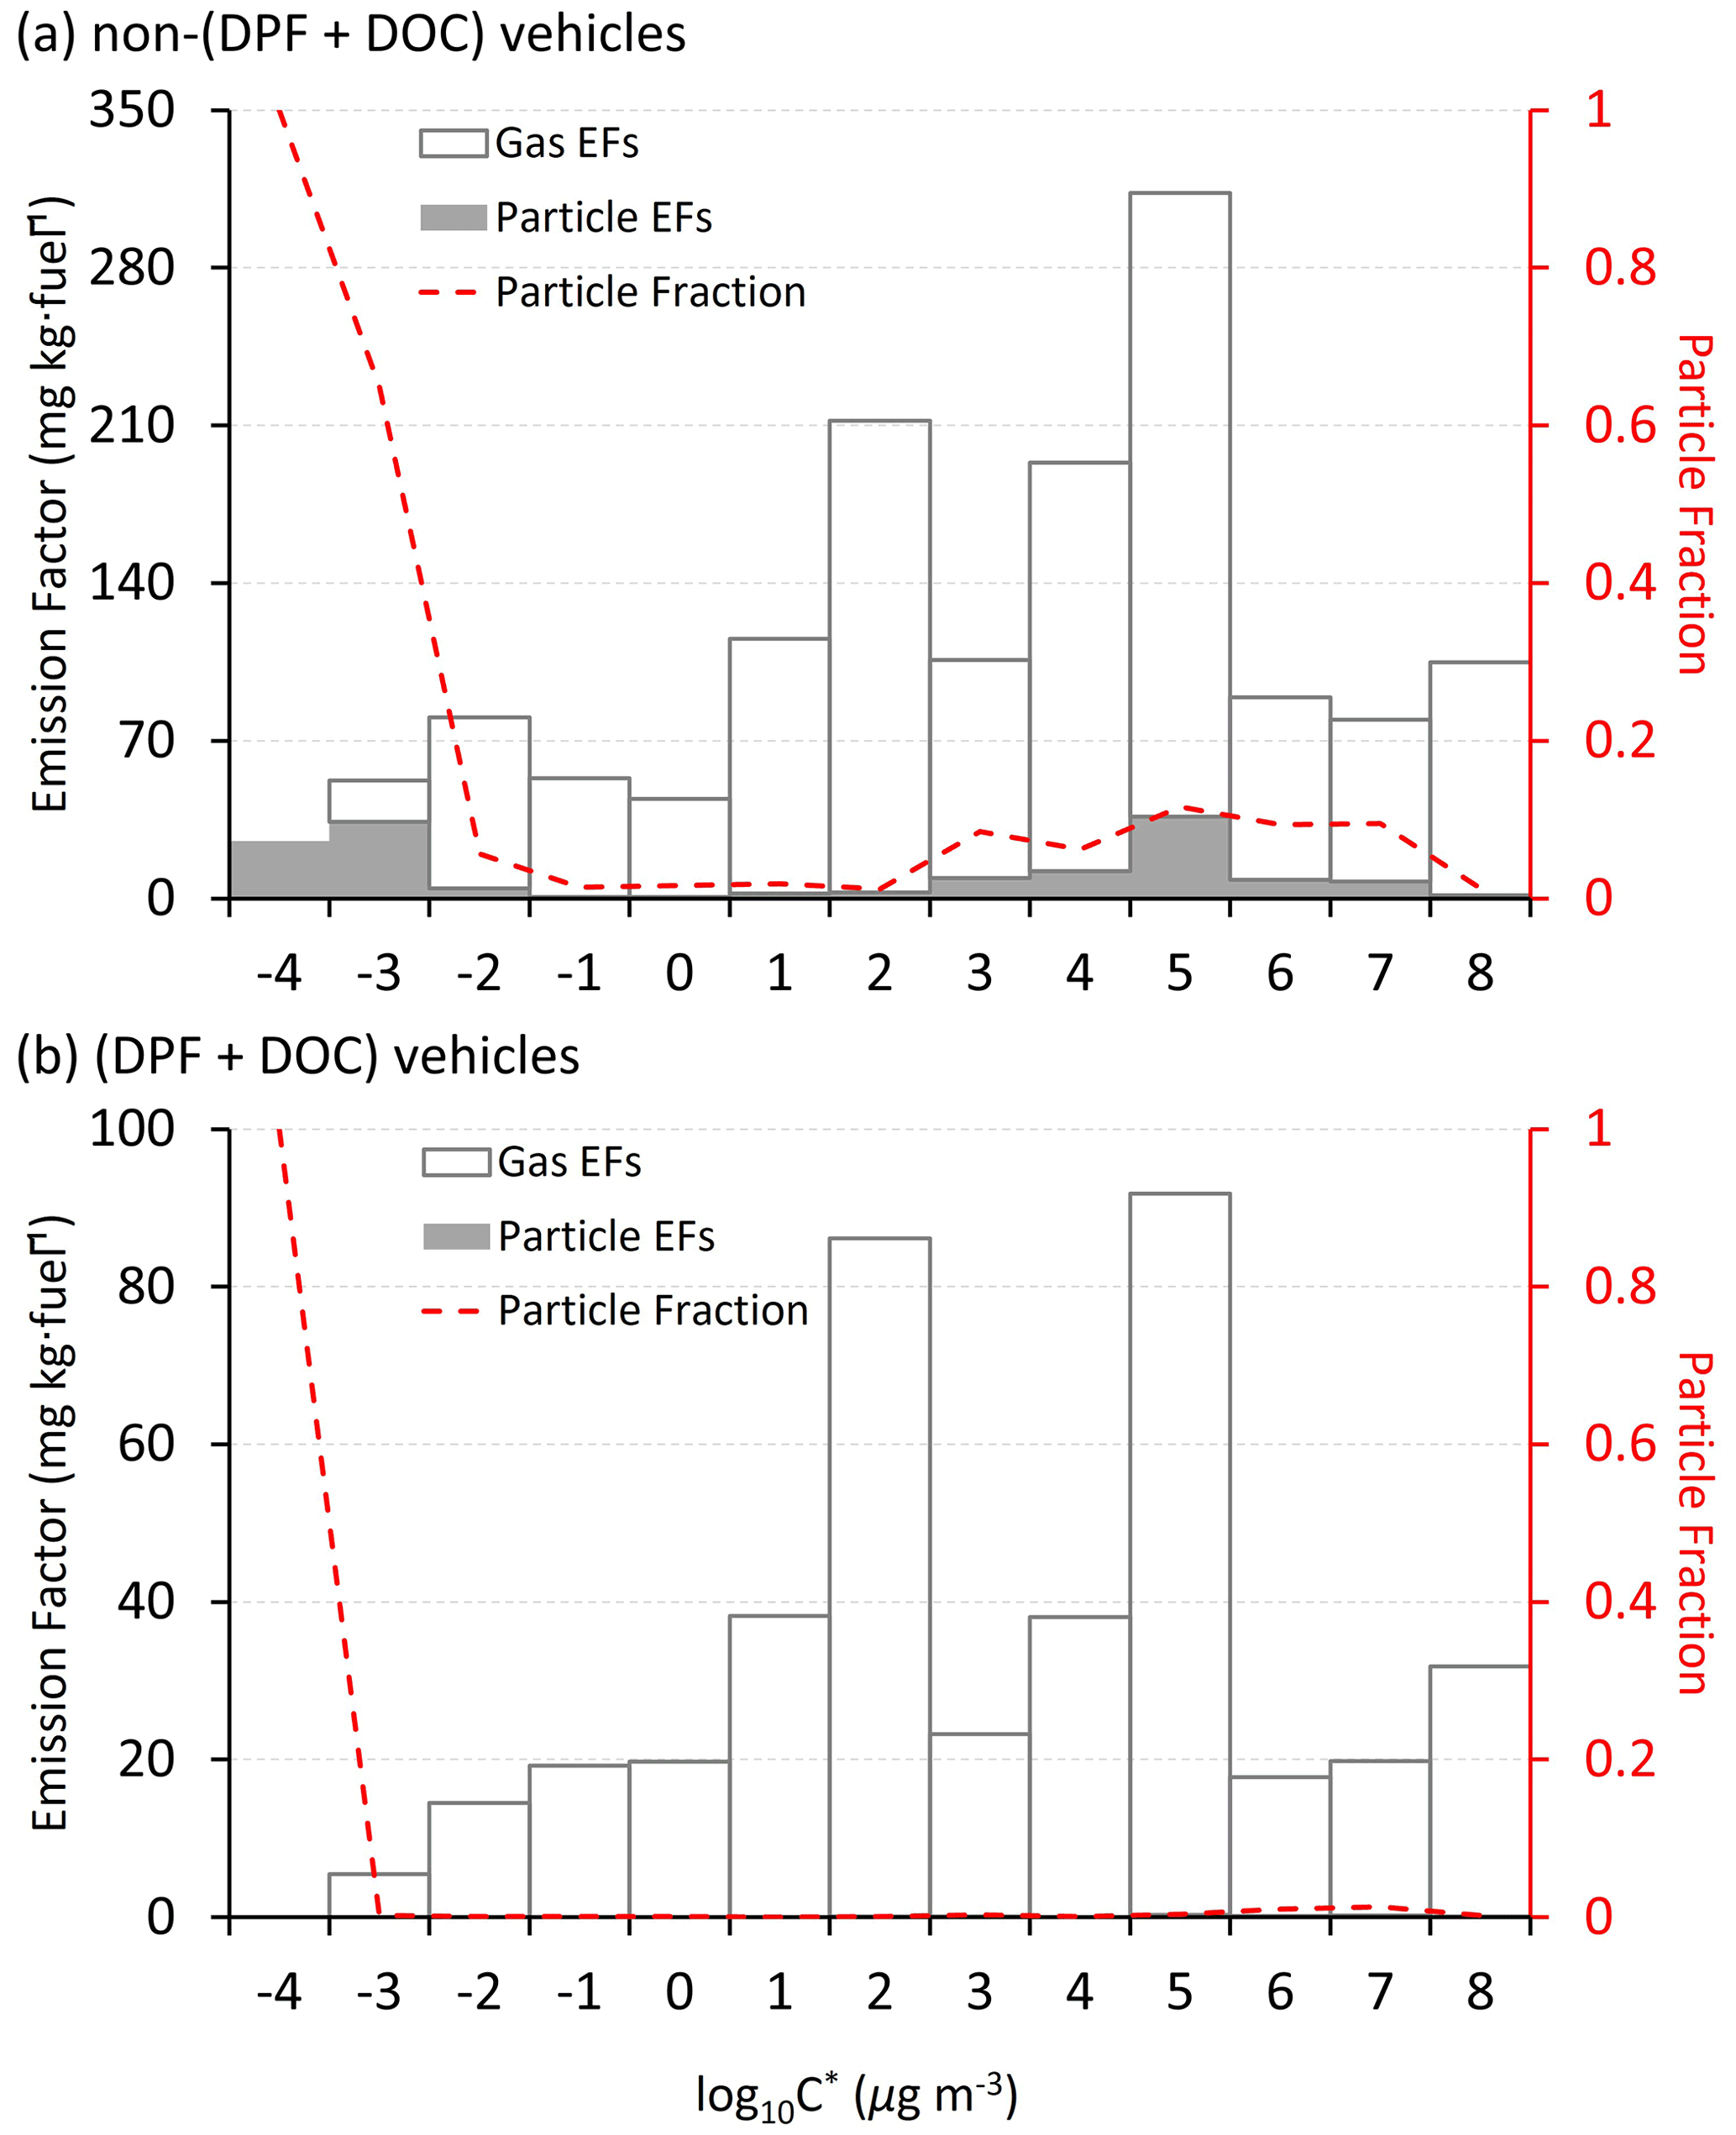
Figure 7The EFs of gaseous and particulate I/SVOCs (the respective hollow and filled stack columns) and the particle mass fraction (red dashed line) in each volatility bin computed for (a) non-(DPF + DOC) vehicles and (b) (DPF + DOC) vehicles.
Chassis dynamometer tests of HDDVs complying with multiple emission standards are conducted to characterize the particulate I/SVOCs. Thousands of individual organic compounds are detected and classified, and alkanes and phenolic compounds are observed to be the most abundant groups. The species-by-species g–p partitioning of the I/SVOCs are discussed separately for vehicles with and without aftertreatment devices. Generally, the I/SVOCs dominantly partition to the gas phase. For non-(DPF + DOC) vehicles, the gaseous I/SVOCs account for ∼ 93 % of the total mass, except for hopane, PAH4rings, and PAH5rings. For (DPF + DOC) vehicles, the particulate fraction of I/SVOCs is further reduced to less than 2 %. Sampling artifacts due to quartz filter absorbing organic vapors are confirmed by the abnormal high signal of two-ring PAHs, and the uncertainties are discussed thoroughly.
Speciation information is urgently required to better predict the thermodynamics of oxidation chemistry. The application of GC × GC ToF-MS and self-constructed data-processing programs achieve detailed identification and quantification of particulate I/SVOCs. Although not resolved at the molecular level, the species-specific information enables us to better characterize the emission scenarios and guides the implementation of control strategies in the future. This approach is versatile and could be applied not only to vehicle emissions but also to other significant sources prevailing in typical environments (e.g., biomass burning and ship emissions) as well as to ambient samples collected at receptor sites. Using the speciated I/SVOC data in atmospheric models and emission inventories, we expect a significantly improved estimation of SOA, both locally and globally.
The measurement data used in this study are available from https://figshare.com/articles/dataset/Emission_factor_summary_the_g-p_partition_and_the_removal_effciency_xlsm/19994603 (He, 2022).
The supplement related to this article is available online at: https://doi.org/10.5194/acp-22-13935-2022-supplement.
XH was responsible for conceptualizing the study; developing the methodology; carrying out the validation, investigation, and formal analysis; writing the original manuscript; curating the data; creating the figures; and funding acquisition. XuZ contributed to project management, validation, reviewing and editing the manuscript, and funding acquisition. SZ and XW were responsible for validating the results and reviewing and editing the manuscript. TC, XiZ, GH, YiC, LH, XC, and YuC carried out the investigation. SW acquired resources and funding and reviewed and edited the manuscript. YW acquired resources and funding and supervised the study.
The contact author has declared that none of the authors has any competing interests.
The contents of this paper are solely the
responsibility of the authors and do not necessarily represent the official
views of the sponsors.
Publisher's note: Copernicus Publications remains neutral with regard to jurisdictional claims in published maps and institutional affiliations.
This research has been supported by the National Natural Science Foundation of China (grant nos. 51978404, 41977180, 42105100, and 22188102) and the Basic Research of Shenzhen Science and Technology Innovation Commission (grant no. JCYJ20190808145218827).
This paper was edited by Zhibin Wang and reviewed by Guoliang Shi and two anonymous referees.
Alam, M. S., Zeraati-Rezaei, S., Stark, C. P., Liang, Z. R., Xu, H. M., and Harrison, R. M.: The characterisation of diesel exhaust particles – composition, size distribution and partitioning, Faraday Discuss., 189, 69–84, https://doi.org/10.1039/c5fd00185d, 2016.
Alam, M. S., Zeraati-Rezaei, S., Xu, H., and Harrison, R. M.: Characterization of Gas and Particulate Phase Organic Emissions (C9–C37) from a Diesel Engine and the Effect of Abatement Devices, Environ. Sci. Technol., 53, 11345–11352, https://doi.org/10.1021/acs.est.9b03053, 2019.
Alier, M., van Drooge, B. L., Dall'Osto, M., Querol, X., Grimalt, J. O., and Tauler, R.: Source apportionment of submicron organic aerosol at an urban background and a road site in Barcelona (Spain) during SAPUSS, Atmos. Chem. Phys., 13, 10353–10371, https://doi.org/10.5194/acp-13-10353-2013, 2013.
An, Z., Li, X., Yuan, Y., Duan, F., and Jiang, J.: Large contribution of non-priority PAHs in atmospheric fine particles: Insights from time-resolved measurement and nontarget analysis, Environ. Int., 163, 107193, https://doi.org/10.1016/j.envint.2022.107193, 2022.
Chacon-Madrid, H. J. and Donahue, N. M.: Fragmentation vs. functionalization: chemical aging and organic aerosol formation, Atmos. Chem. Phys., 11, 10553–10563, https://doi.org/10.5194/acp-11-10553-2011, 2011.
Chen, J. J., Jakober, C., Clegg, S., and Kleeman, M. J.: Theoretical versus Observed Gas-Particle Partitioning of Carbonyl Emissions from Motor Vehicles, J. Air Waste Manage., 60, 1237–1244, https://doi.org/10.3155/1047-3289.60.10.1237, 2010.
Chen, T., Zheng, X., He, X., You, Y., Huang, G. H., Cao, Y. H., He, L. Q., and Wu, Y.: Comprehensive characterization of polycyclic aromatic hydrocarbon emissions from heavy-duty diesel vehicles utilizing GC × GC-ToF-MS, Sci. Total Environ., 833, 155127, https://doi.org/10.1016/j.scitotenv.2022.155127, 2022.
Chen, T. Z., Liu, Y. C., Liu, C. G., Liu, J., Chu, B. W., and He, H.: Important role of aromatic hydrocarbons in SOA formation from unburned gasoline vapor, Atmos. Environ., 201, 101–109, https://doi.org/10.1016/j.atmosenv.2019.01.001, 2019.
Dallmann, T. R., Kirchstetter, T. W., DeMartini, S. J., and Harley, R. A.: Quantifying On-Road Emissions from Gasoline-Powered Motor Vehicles: Accounting for the Presence of Medium- and Heavy-Duty Diesel Trucks, Environ. Sci. Technol., 47, 13873–13881, https://doi.org/10.1021/es402875u, 2013.
Donahue, N. M., Epstein, S. A., Pandis, S. N., and Robinson, A. L.: A two-dimensional volatility basis set: 1. organic-aerosol mixing thermodynamics, Atmos. Chem. Phys., 11, 3303–3318, https://doi.org/10.5194/acp-11-3303-2011, 2011.
Donahue, N. M., Henry, K. M., Mentel, T. F., Kiendler-Scharr, A., Spindler, C., Bohn, B., Brauers, T., Dorn, H. P., Fuchs, H., Tillmann, R., Wahner, A., Saathoff, H., Naumann, K. H., Mohler, O., Leisner, T., Muller, L., Reinnig, M. C., Hoffmann, T., Salo, K., Hallquist, M., Frosch, M., Bilde, M., Tritscher, T., Barmet, P., Praplan, A. P., DeCarlo, P. F., Dommen, J., Prevot, A. S. H., and Baltensperger, U.: Aging of biogenic secondary organic aerosol via gas-phase OH radical reactions, P. Natl. Acad. Sci. USA, 109, 13503–13508, https://doi.org/10.1073/pnas.1115186109, 2012.
Faridi, S., Bayat, R., Cohen, A. J., Sharafkhani, E., Brook, J. R., Niazi, S., Shamsipour, M., Amini, H., Naddafi, K., and Hassanvand, M. S.: Health burden and economic loss attributable to ambient PM2.5 in Iran based on the ground and satellite data, Sci. Rep.-UK, 12, 14386, https://doi.org/10.1038/s41598-022-18613-x, 2022.
Franklin, M., Koutrakis, P., and Schwartz, J.: The role of particle composition on the association between PM2.5 and mortality, Epidemiology, 19, 680–689, https://doi.org/10.1097/EDE.0b013e3181812bb7, 2008.
Gentner, D. R., Harley, R. A., Miller, A. M., and Goldstein, A. H.: Diurnal and Seasonal Variability of Gasoline-Related Volatile Organic Compound Emissions in Riverside, California, Environ. Sci. Technol., 43, 4247–4252, https://doi.org/10.1021/es9006228, 2009.
Gentner, D. R., Isaacman, G., Worton, D. R., Chan, A. W. H., Dallmann, T. R., Davis, L., Liu, S., Day, D. A., Russell, L. M., Wilson, K. R., Weber, R., Guha, A., Harley, R. A., and Goldstein, A. H.: Elucidating secondary organic aerosol from diesel and gasoline vehicles through detailed characterization of organic carbon emissions, P. Natl. Acad. Sci. USA, 109, 18318–18323, https://doi.org/10.1073/pnas.1212272109, 2012.
Grieshop, A. P., Donahue, N. M., and Robinson, A. L.: Is the gas-particle partitioning in alpha-pinene secondary organic aerosol reversible?, Geophys. Res. Lett., 34, L14810, https://doi.org/10.1029/2007GL029987, 2007.
Harvey, R. M., Bateman, A. P., Jain, S., Li, Y. J., Martin, S., and Petrucci, G. A.: Optical Properties of Secondary Organic Aerosol from cis-3-Hexenol and cis-3-Hexenyl Acetate: Effect of Chemical Composition, Humidity, and Phase, Environ. Sci. Technol., 50, 4997–5006, https://doi.org/10.1021/acs.est.6b00625, 2016.
Hazarika, N., Das, A., Kamal, V., Anwar, K., Srivastava, A., and Jain, V. K.: Particle phase PAHs in the atmosphere of Delhi-NCR: With spatial distribution, source characterization and risk approximation, Atmos. Environ., 200, 329–342, https://doi.org/10.1016/j.atmosenv.2018.11.064, 2019.
He, X.: Measurement data for “Comprehensive characterization of particulate intermediate-volatility and semi-volatile organic compounds (I/SVOCs) from heavy-duty diesel vehicles using two-dimensional gas chromatography time-of-flight mass spectrometry”, FigShare [data set], https://figshare.com/articles/dataset/Emission_factor_summary_the_g-p_partition_and_the_removal_effciency_xlsm/19994603, last access: 28 October 2022.
He, X., Wang, Q. Q., Huang, X. H. H., Huang, D. D., Zhou, M., Qiao, L. P., Zhu, S. H., Ma, Y. G., Wang, H. L., Li, L., Huang, C., Xu, W., Worsnop, D. R., Goldstein, A. H., and Yu, J. Z.: Hourly measurements of organic molecular markers in urban Shanghai, China: Observation of enhanced formation of secondary organic aerosol during particulate matter episodic periods, Atmos. Environ., 240, 1–14, 2020.
He, X., Zheng, X., Yan, Y., Zhang, S. J., Zhao, B., Wang, X., Huang, G. H., Chen, T., Cao, Y. H., He, L. Q., Chang, X., Wang, S. X., and Wu, Y.: Comprehensive chemical characterization of gaseous I/SVOC emissions from heavy-duty diesel vehicles using two-dimensional gas chromatography time-of-flight mass spectrometry, Environ. Pollut., 305, 119284, https://doi.org/10.1016/j.envpol.2022.119284, 2022.
Huang, C., Wang, H. L., Li, L., Wang, Q., Lu, Q., de Gouw, J. A., Zhou, M., Jing, S. A., Lu, J., and Chen, C. H.: VOC species and emission inventory from vehicles and their SOA formation potentials estimation in Shanghai, China, Atmos. Chem. Phys., 15, 11081–11096, https://doi.org/10.5194/acp-15-11081-2015, 2015.
Kawashima, H., Minami, S., Hanai, Y., and Fushimi, A.: Volatile organic compound emission factors from roadside measurements, Atmos. Environ., 40, 2301–2312, https://doi.org/10.1016/j.atmosenv.2005.11.044, 2006.
Kleindienst, T. E., Jaoui, M., Lewandowski, M., Offenberg, J. H., and Docherty, K. S.: The formation of SOA and chemical tracer compounds from the photooxidation of naphthalene and its methyl analogs in the presence and absence of nitrogen oxides, Atmos. Chem. Phys., 12, 8711–8726, https://doi.org/10.5194/acp-12-8711-2012, 2012.
Kroll, J. H., Smith, J. D., Che, D. L., Kessler, S. H., Worsnop, D. R., and Wilson, K. R.: Measurement of fragmentation and functionalization pathways in the heterogeneous oxidation of oxidized organic aerosol, Phys. Chem. Chem/ Phys., 11, 8005–8014, https://doi.org/10.1039/b905289e, 2009.
Li, J. L., Wang, W. G., Li, K., Zhang, W. Y., Peng, C., Liu, M. Y., Chen, Y., Zhou, L., Li, H., and Ge, M. F.: Effect of chemical structure on optical properties of secondary organic aerosols derived from C-12 alkanes, Sci. Total Environ., 751, 141620, https://doi.org/10.1016/j.scitotenv.2020.141620, 2021.
Li, K., Li, J. L., Wang, W. G., Li, J. J., Peng, C., Wnag, D., and Ge, M. F.: Effects of Gas-Particle Partitioning on Refractive Index and Chemical Composition of m-Xylene Secondary Organic Aerosol, J. Phys. Chem. A, 122, 3250–3260, https://doi.org/10.1021/acs.jpca.7b12792, 2018.
Li, Y. J., Zhu, Y., Liu, W. J., Yu, S. Y., Tao, S., and Liu, W. X.: Modeling multimedia fate and health risk assessment of polycyclic aromatic hydrocarbons (PAHs) in the coastal regions of the Bohai and Yellow Seas, Sci. Total Environ., 818, 151789, https://doi.org/10.1016/j.scitotenv.2021.151789, 2022.
Liu, Y., Gao, Y., Yu, N., Zhang, C., Wang, S., Ma, L., Zhao, J., and Lohmann, R.: Particulate matter, gaseous and particulate polycyclic aromatic hydrocarbons (PAHs) in an urban traffic tunnel of China: Emission from on-road vehicles and gas-particle partitioning, Chemosphere, 134, 52–59, https://doi.org/10.1016/j.chemosphere.2015.03.065, 2015.
Liu, Y. X., Li, Y. J., Yuan, Z. B., Wang, H. L., Sha, Q. E., Lou, S. R., Liu, Y. H., Hao, Y. Q., Duan, L. J., Ye, P. L., Zheng, J. Y., Yuan, B., and Shao, M.: Identification of two main origins of intermediate-volatility organic compound emissions from vehicles in China through two-phase simultaneous characterization, Environ. Pollut., 281, 117020, https://doi.org/10.1016/j.envpol.2021.117020, 2021.
Lu, Q., Zhao, Y., and Robinson, A. L.: Comprehensive organic emission profiles for gasoline, diesel, and gas-turbine engines including intermediate and semi-volatile organic compound emissions, Atmos. Chem. Phys., 18, 17637–17654, https://doi.org/10.5194/acp-18-17637-2018, 2018.
Luo, Z., Wang, Y., Lv, Z., He, T., Zhao, J., Wang, Y., Gao, F., Zhang, Z., and Liu, H.: Impacts of vehicle emission on air quality and human health in China, Sci. Total Environ., 813, 152655, https://doi.org/10.1016/j.scitotenv.2021.152655, 2022.
May, A. A., Presto, A. A., Hennigan, C. J., Nguyen, N. T., Gordon, T. D., and Robinson, A. L.: Gas-particle partitioning of primary organic aerosol emissions: (1) Gasoline vehicle exhaust, Atmos. Environ., 77, 128–139, https://doi.org/10.1016/j.atmosenv.2013.04.060, 2013a.
May, A. A., Presto, A. A., Hennigan, C. J., Nguyen, N. T., Gordon, T. D., and Robinson, A. L.: Gas-Particle Partitioning of Primary Organic Aerosol Emissions: (2) Diesel Vehicles, Environ. Sci. Technol., 47, 8288–8296, https://doi.org/10.1021/es400782j, 2013b.
Nguyen, G. T. H., Nguyen, T. T. T., Shimadera, H., Uranishi, K., Matsuo, T., and Kondo, A.: Estimating Mortality Related to O-3 and PM2.5 under Changing Climate and Emission in Continental Southeast Asia, Aerosol Air Qual. Res., 22, 220105, https://doi.org/10.4209/aaqr.220105, 2022.
Paasonen, P., Kupiainen, K., Klimont, Z., Visschedijk, A., Denier van der Gon, H. A. C., and Amann, M.: Continental anthropogenic primary particle number emissions, Atmos. Chem. Phys., 16, 6823–6840, https://doi.org/10.5194/acp-16-6823-2016, 2016.
Poorfakhraei, A., Tayarani, M., and Rowangould, G.: Evaluating health outcomes from vehicle emissions exposure in the long range regional transportation planning process, J. Transp. Health, 6, 501–515, https://doi.org/10.1016/j.jth.2017.05.177, 2017.
Presto, A. A., Miracolo, M. A., Kroll, J. H., Worsnop, D. R., Robinson, A. L., and Donahue, N. M.: Intermediate-Volatility Organic Compounds: A Potential Source of Ambient Oxidized Organic Aerosol, Environ. Sci. Technol., 43, 4744–4749, https://doi.org/10.1021/es803219q, 2009.
Qi, L. J., Liu, H., Shen, X. E., Fu, M. L., Huang, F. F., Man, H. Y., Deng, F. Y., Shaikh, A. A., Wang, X. T., Dong, R., Song, C., and He, K. B.: Intermediate-Volatility Organic Compound Emissions from Nonroad Construction Machinery under Different Operation Modes, Environ. Sci. Technol., 53, 13832–13840, https://doi.org/10.1021/acs.est.9b01316, 2019.
Ridley, D. A., Heald, C. L., Ridley, K. J., and Kroll, J. H.: Causes and consequences of decreasing atmospheric organic aerosol in the United States, P. Natl. Acad. Sci. USA, 115, 290–295, https://doi.org/10.1073/pnas.1700387115, 2018.
Saleh, R., Donahue, N. M., and Robinson, A. L.: Time Scales for Gas-Particle Partitioning Equilibration of Secondary Organic Aerosol Formed from Alpha-Pinene Ozonolysis, Environ. Sci. Technol., 47, 5588–5594, https://doi.org/10.1021/es400078d, 2013.
Sitaras, I. E., Bakeas, E. B., and Siskos, P. A.: Gas/particle partitioning of seven volatile polycyclic aromatic hydrocarbons in a heavy traffic urban area, Sci. Total Environ., 327, 249–264, https://doi.org/10.1016/j.scitotenv.2003.08.022, 2004.
Stewart, G. J., Nelson, B. S., Drysdale, W. S., Acton, W. J. F., Vaughan, A. R., Hopkins, J. R., Dunmore, R. E., Hewitt, C. N., Nemitz, E., Mullinger, N., Langford, B., Shivani, Reyes-Villegas, E., Gadi, R., Rickard, A. R., Lee, J. D., and Hamilton, J. F.: Sources of non-methane hydrocarbons in surface air in Delhi, India, Faraday Discuss., 226, 409–431, https://doi.org/10.1039/d0fd00087f, 2021a.
Stewart, G. J., Acton, W. J. F., Nelson, B. S., Vaughan, A. R., Hopkins, J. R., Arya, R., Mondal, A., Jangirh, R., Ahlawat, S., Yadav, L., Sharma, S. K., Dunmore, R. E., Yunus, S. S. M., Hewitt, C. N., Nemitz, E., Mullinger, N., Gadi, R., Sahu, L. K., Tripathi, N., Rickard, A. R., Lee, J. D., Mandal, T. K., and Hamilton, J. F.: Emissions of non-methane volatile organic compounds from combustion of domestic fuels in Delhi, India, Atmos. Chem. Phys., 21, 2383–2406, https://doi.org/10.5194/acp-21-2383-2021, 2021b.
Sun, J., Shen, Z. X., Zhang, T., Kong, S. F., Zhang, H. A., Zhang, Q., Niu, X. Y., Huang, S. S., Xu, H. M., Ho, K. F., and Cao, J. J.: A comprehensive evaluation of PM2.5-bound PAHs and their derivative in winter from six megacities in China: Insight the source-dependent health risk and secondary reactions, Environ. Int., 165, 107344, https://doi.org/10.1016/j.envint.2022.107344, 2022a.
Sun, S. Y., Zheng, N., Wang, S. J., Li, Y. Y., Hou, S. N., An, Q. R., Chen, C. C., Li, X. Q., Ji, Y. N., and Li, P. Y.: Inhalation Bioaccessibility and Risk Assessment of Metals in PM2.5 Based on a Multiple-Path Particle Dosimetry Model in the Smelting District of Northeast China, Int. J. Env. Res. Pub. He., 19, 8915, https://doi.org/10.3390/ijerph19158915, 2022b.
Tecer, L. H., Alagha, O., Karaca, F., Tuncel, G., and Eldes, N.: Particulate matter (PM2.5, PM10–2.5, and PM10) and children's hospital admissions for asthma and respiratory diseases: A bidirectional case-crossover study, J. Toxicol. Env. Heal. A, 71, 512–520, https://doi.org/10.1080/15287390801907459, 2008.
Tkacik, D. S., Presto, A. A., Donahue, N. M., and Robinson, A. L.: Secondary Organic Aerosol Formation from Intermediate-Volatility Organic Compounds: Cyclic, Linear, and Branched Alkanes, Environ. Sci. Technol., 46, 8773–8781, https://doi.org/10.1021/es301112c, 2012.
Turpin, B. J., Huntzicker, J. J., and Hering, S. V.: Investigation of Organic Aerosol Sampling Artifacts in the Los-Angeles Basin, Atmos. Environ., 28, 3061–3071, https://doi.org/10.1016/1352-2310(94)00133-6, 1994.
Wang, X. L., Sato, T., and Xing, B. S.: Size distribution and anthropogenic sources apportionment of airborne trace metals in Kanazawa, Japan, Chemosphere, 65, 2440–2448, 2006.
Zhao, Y., Hennigan, C. J., May, A. A., Tkacik, D. S., De Gouw, J. A., Gilman, J. B., Kuster, W. C., Borbon, A., and Robinson, A. L.: Intermediate-Volatility Organic Compounds: A Large Source of Secondary Organic Aerosol, Environ. Sci. Technol., 48, 13743–13750, https://doi.org/10.1021/es5035188, 2014.
Zhao, Y. L., Kreisberg, N. M., Worton, D. R., Isaacman, G., Weber, R. J., Liu, S., Day, D. A., Russell, L. M., Markovic, M. Z., VandenBoer, T. C., Murphy, J. G., Hering, S. V., and Goldstein, A. H.: Insights into Secondary Organic Aerosol Formation Mechanisms from Measured Gas/Particle Partitioning of Specific Organic Tracer Compounds, Environ. Sci. Technol., 47, 3781–3787, https://doi.org/10.1021/es304587x, 2013.
Ziemann, P. J.: Effects of molecular structure on the chemistry of aerosol formation from the OH-radical-initiated oxidation of alkanes and alkenes, Int. Rev. Phys. Chem., 30, 161–195, https://doi.org/10.1080/0144235x.2010.550728, 2011.