the Creative Commons Attribution 4.0 License.
the Creative Commons Attribution 4.0 License.
 | 28 Oct 2022
Measurement report: Investigation of pH- and particle-size-dependent chemical and optical properties of water-soluble organic carbon: implications for its sources and aging processes
Yuanyuan Qin
Juanjuan Qin
Xiaobo Wang
Kang Xiao
Ting Qi
Yuwei Gao
Xueming Zhou
Shaoxuan Shi
Jingnan Li
Jingsi Gao
Ziyin Zhang
Jihua Tan
Rongzhi Chen
Knowledge of the chemical structures and optical properties of water-soluble organic carbon (WSOC) is critical considering its involvement in many key aerosol-associated chemical reactions and its potential impacts on climate radiative forcing. This study investigates the coupled effects of pH and particle size on the chemical structures (functional groups) and optical properties (UV/fluorescence properties) of WSOC and further explores the source and aging of WSOC constituents. The results showed that the specific UV absorbance at a wavelength of 254 nm (SUVA254) and mass absorption efficiency at a wavelength of 365 nm (MAE365) were higher in smaller than larger particles, revealing the relatively higher aromaticity/molecular weight and more freshness of WSOC in smaller particles. A decrease in aromaticity/molecular weight of WSOC in larger particles was caused by the degradation reaction that occurred during the aging process. The carboxylic groups tend to be enriched in larger particles, whereas the contribution of phenolic groups was generally higher in smaller particles. The changes in the fluorescence peak position suggested that hydroxyl groups play a leading role in pH-responsive fluorescence in summer, while carboxylic and nitro groups play a dominant role in winter. Overall, the chromophores in smaller particles showed a more pronounced pH dependence, which might be related to the higher content of aromatic species in WSOC in these particle size ranges. Specifically, the climate impact of WSOC would be enhanced with increasing pH. The pH- and particle-size-dependent chemical and optical properties of WSOC provide insights into the structure, source, and aging of WSOC, which will ultimately improve the accuracy of assessing the climate effects of WSOC.
- Article
(8663 KB) - Full-text XML
- BibTeX
- EndNote


Water-soluble organic carbon (WSOC; see Appendix A for a list of abbreviations) comprises a considerable fraction of organic aerosol mass (10 %–80 %) (Horník et al., 2021) and plays important roles in climate change (Chen et al., 2020; Sun et al., 2011) and air quality (Snyder et al., 2009). WSOC is released from anthropogenic (e.g., biomass burning and coal combustion) and natural sources and can also be formed through complex secondary reactions (Yu et al., 2017; Wu et al., 2018). The sources of WSOC vary significantly with location and season; e.g., WSOC in PM2.5 was primarily derived from secondary aerosol formation and biomass burning in Korea (Park et al., 2015) and from coal combustion, biogenic emission, and secondary aerosol formation in winter and biogenic emission and secondary oxygenation of vehicle exhaust in summer in a northwestern Chinese city (Qin et al., 2018).
The formation and transformation of WSOC in atmospheric particulate matter is highly complex. Existing studies mostly focused on investigating the concentration levels and optical and chemical characteristics of bulk WSOC in PM2.5 (Xiang et al., 2017; Ma et al., 2022). Studies focusing on size-resolved WSOC are still limited; e.g., earlier studies focused on exploring the size distribution of WSOC (Timonen et al., 2008; Deshmukh et al., 2016), and a few recent studies investigated the optical properties of size-resolved WSOC (Chen et al., 2019; J. Qin et al., 2022). The sources, formation mechanisms, and transformation processes of WSOC are strongly related to particle size distribution (Chen et al., 2019). Therefore, the size distribution of WSOC can serve as a good indicator of its sources, fate, and aging processes (Boreddy et al., 2021; Jang et al., 2019; Frka et al., 2018). For example, Frka et al. (2018) found that wood burning was the most important source of humic-like substances (HULISs) in the aerosol accumulation mode (from ∼0.1 to ∼2 µm) during the autumn and winter; Jang et al. (2019) reported that HULISs in smaller particles were likely derived from local sources, while in larger particles they were from secondary organic aerosol (SOA) in the atmosphere, and J. Qin et al. (2022) found that the fluorescence properties of WSOC varied with the particle size and the fluorescence characteristics of different particle sizes could be used to reveal the aging of WSOC. To date, a knowledge gap still remains regarding the aging, fate, and important atmospheric processes modulating the chemical and physical properties of WSOC due to the dearth of WSOC-focused research in different particle sizes and the limitations of analytical methods.
However, only investigating the chemical and optical properties of WSOC cannot fully understand its formation and transformation processes because environmental conditions, such as relative humidity (RH); solar radiation intensity; and temperature can affect the physical and chemical properties of aerosol particles (Bousiotis et al., 2021; Ge et al., 2021). Besides, aerosol acidity (pH) affects the formation of SOA via altering chemical reaction pathways (Ault, 2020) and ultimately affect the global climate. It should be noted that aerosol pH increased with increasing particle size (Craig et al., 2018). Due to the complexity of the physicochemical properties of size-resolved aerosols, our understanding of their pH and pH-dependent behavior is still lacking. Examining pH-dependent chemical structures and optical properties of size-resolved WSOC would be a worthy attempt to help reveal their formation mechanisms.
The commonly used analytical methods to characterize the optical properties of WSOC are three-dimensional excitation–emission matrix (EEM) spectroscopy and ultraviolet–visible (UV–Vis) absorption spectroscopy (Zhang et al., 2021; Yang et al., 2020). The EEM spectroscopy is a rapid as well as informative method to identify chromophores that may not be distinguished by UV–Vis absorption spectroscopy (Chen et al., 2019; Xiao et al., 2020). Therefore, EEM spectroscopy has been widely applied in atmospheric WSOC characterization (Fu et al., 2015; Qin et al., 2018). However, such a technique has not been widely applied to investigate the fluorescence properties of WSOC in different particle sizes. Fourier transform infrared (FTIR) spectroscopy has been frequently used for the identification of WSOC functional groups (Chen et al., 2016a), although this analysis is difficult to perform quantitatively. pH titration enables qualitative and quantitative analyses of functional groups on the surface of substances (Zhang et al., 2011; Xiao et al., 2014), and this approach has recently been successfully applied to the characterization of WSOC in ambient PM2.5 (Qin et al., 2021) but not yet on size-resolved WSOC.
To better understand the structure, source, and aging of WSOC, this study explored the optical properties and chemical structures from the perspective of pH and particle size response. Firstly, the optical properties of four WSOC samples with representative particle sizes of <0.26, 0.44–0.77, 1.40–2.50, and 2.50–10.0 µm were determined with a UV–Vis absorption spectroscopy and EEM fluorescence spectroscopy combined with parallel factor analysis (PARAFAC). Then, the functional groups of WSOC were analyzed using FTIR spectroscopy and pH titration. Subsequently, the influence of pH on the optical properties of WSOC in different particle sizes was examined. Finally, the environmental implications of pH-dependent and particle-size-dependent behaviors of WSOC were discussed.
2.1 Sample collection and preparation
2.1.1 Sample collection
Particulate samples were collected on the roof of a building (∼20 m above the ground) inside the campus of the University of Chinese Academy of Sciences (40∘24′ N, 116∘40′ E) in Huairou District, Beijing, China. The sampling site is in a typical urban environment surrounded by schools, research institutes, and hospitals. There were no obvious industrial sources nearby, and pollutants were mainly derived from regional transport. The samples were collected on prebaked (under 550 ∘C for 5.5 h) quartz fiber filters (∅90 mm, Whatman) using a six-stage micro-orifice uniform deposit impactor (MOUDI), with aerodynamic cut-point diameters of 0.26, 0.44, 0.77, 1.40, 2.50, and 10.0 µm. A total of 46 sets of six-stage size-segregated aerosol samples were collected during 2 summer months and 1 winter month from June 2019 to August 2020, with 35 sets of six-stage size-segregated aerosol samples in summer and 11 sets of six-stage size-segregated aerosol samples in winter. To collect a sufficient mass of particulate matter in each sample, the sampling duration for each individual sample was selected based on the degree of air pollution with a minimum of 1 polluted day to a maximum of 7 clean days, but all the sampling started at 08:00 and ended at 07:00 for 1–7 d. The collected samples were then stored at −20 ∘C until further analysis.
2.1.2 WSOC extraction
A quarter of all filters of each size (summer/winter) were mixed together in a bottle and extracted twice via ultrasonication in Milli-Q water for 15 min to achieve the extensive release of solubilized WSOC, and then the extracted liquid was filtered through a 0.22 µm membrane filter to remove insoluble suspensions. Blank filters, used for background checks, were also extracted under the same conditions. The average WSOC concentration of the blank filter was 0.39 mg L−1.
2.1.3 pH titration
HCl and NaOH were used to adjust the pH of the WSOC solutions. The pH of the WSOC for UV–Vis absorption and EEM fluorescence spectrometry was controlled in the range of 2–10 at an unit interval of 1 and recorded using a pH meter (Mettler Toledo, Switzerland). The pH meter was calibrated before running any titration. The raw pH of WSOC with particle sizes of <0.26, 0.44–0.77, 1.40–2.50, and 2.50–10.0 µm was 5.61, 5.75, 5.89, and 6.19, respectively, in summer, and 6.19, 6.49, 6.64, and 6.83, respectively, in winter.
The distribution of acidic groups was also obtained by pH titration as described in detail elsewhere (Wang and Waite, 2009). Briefly, prior to titration, a 50 mL WSOC solution was first acidified to a pH below 3 by addition of HCl solution, and then the titration was performed until the pH was higher than 10 by stepwise addition of 0.1 M NaOH. Throughout the titration, the WSOC solution was bubbled with pure N2 to remove CO2 from the air.
2.2 Instrumental analysis
2.2.1 Total organic carbon (TOC) and FTIR analysis
The WSOC concentration was quantified by a TOC analyzer (multi N/C 3100, Analytik Jena AG, Germany). Prior to measurement, a drop of 2 mol L−1 HCl was added to the WSOC solution to remove the interference of inorganic carbon.
A PerkinElmer FTIR (Frontier) spectrometer was employed to investigate the functional groups of WSOC. A fully dried mixture of the lyophilized WSOC and KBr was ground in an agate mortar and pressed into disks for FTIR analysis. FTIR spectra were recorded in the range of 4000–400 cm−1 with a 1 cm−1 interval at a spectral resolution of 4 cm−1. Pure KBr was measured under the same conditions, and its spectra were subtracted from the sample spectra for background correction.
2.2.2 UV–Vis absorption and EEM fluorescence spectra
UV–Vis absorption and EEM fluorescence spectra of WSOC were recorded in a 1 cm path-length quartz cell using a UV–Vis spectrophotometer (UV-2401PC, Shimadzu, Japan) and a fluorescence spectrophotometer (Agilent Cary Eclipse, United States), respectively. The UV–Vis absorption spectra for all samples were measured over the wavelength range from 200 to 500 nm with an interval of 1 nm. The EEM fluorescence spectra were recorded in the wavelength range of 200 to 400 nm for excitation and 250 to 500 nm for emission with an interval of 5 nm.
2.3 Data analysis
2.3.1 Acidic-group distributions
The distribution of acidic groups (pKa and group density) was calculated from the pH titration data using linear programming optimization as follows (Wang and Waite, 2009):
where the term ΣCjαij is the sum of unreacted functional groups at each titration step (i=1, m), Cj denotes the concentration of the jth functional group, Ka,j (j=1, n) represents the conditional dissociation constants (), and CANC denotes the acid-neutralizing capacity of the system (defined as the sum of all non-reacting cations minus non-reacting anions). The concentrations of acid ([acid]) and carbonate ([carb] = [HCO] + 2[CO]) were zero in this study since the titration starting pH was below 3.
2.3.2 UV–Vis absorption spectra
Based on the UV–Vis absorption spectra, the specific UV absorbance at a wavelength of 254 nm (SUVA254, m2 g−1), mass absorption efficiency (MAEλ, m2 g−1), absorption Ångström exponent (AAE), and the difference absorbance spectra (Δ absorbance (λ), m2 g−1) were calculated according to the following equations (Jane et al., 2017):
where Aλ denotes the absorbance at wavelength λ, C is the mass concentration of WSOC, L is the cell path length (1 cm), and K is a constant related to light absorption. Additionally, the A(λ)pH and A(λ)ref are the absorption spectra at a different pH and at a reference pH (2 and 7), respectively.
2.3.3 EEM and PARAFAC analysis
The raw EEM spectra were processed using the following procedure described in detail elsewhere (Xiao et al., 2018b). The pure water was subtracted from the EEM spectra of WSOC as background correction. The interfering fluorescence signals of the Rayleigh and Raman scattering were then eliminated by an interpolation technique. The UV–Vis absorbance in the wavelength range of 200–500 nm was used to correct the inner-filter effect of fluorescence intensity. Subsequently, the fluorescence intensity was normalized to Raman units (R.U.) using the Raman peak area of pure water and was further divided by the TOC concentration to obtain the specific fluorescence intensity per unit TOC (SFI). Detailed information on EEM fluorescence properties, such as the average fluorescence intensity per unit TOC at each emission wavelength (FIm TOC), apparent quantum yield (AQY), and Stokes shift, were further extracted. AQY is defined as the ratio of the number of emitted photons to the number of absorbed photons after the fluorophores absorbing light (Xiao et al., 2018b). The Stokes shift is defined as the difference between the excitation and emission wavenumbers and can be calculated as follows:
where FI is the fluorescence intensity; l is the fluorescence intensity at each Ex/Em wavelength position; N is the total number of EEM data; NEx denotes the total number of data under each Ex wavelength position; UVA is the average absorbance; and λEx and λEm are the excitation and emission wavelengths (nm), respectively.
The different independent fluorescent components were identified by PARAFAC analysis using the DOMFLuor toolbox (Wang et al., 2022). Three independent components were acquired based on split half analysis, residual analysis, and visual inspection (Wu et al., 2011). Additionally, the independent-sample t test was used to evaluate the seasonal differences in light absorption and fluorescence properties of WSOC.
2.4 Quality assurance and quality control
Quality assurance and quality control (QA/QC) procedures were applied through the laboratory and instrumental-analysis processes. Before sampling, all quartz fiber filters were baked at 550 ∘C for 5.5 h. Prior to analysis, all vials were washed with Milli-Q water, dried, and preheated at 550 ∘C for 5.5 h in a muffle furnace and then wrapped in aluminum foil before being used. WSOC extraction and measurement were conducted in a designated laboratory. All WSOC concentrations, UV–Vis absorption spectra, EEM fluorescence spectra, and functional groups data were blank-corrected. All instruments operated in this study required regular calibration. Sterile gloves and robes were worn throughout the experimental procedure to avoid contamination and to ensure the accuracy of the test results.
3.1 Optical properties and chemical structures of WSOC
3.1.1 Optical properties at raw pH
The light absorption and fluorescence properties of WSOC varied with particle size (Table 1). Higher SUVA254 for particles of <0.26 µm than other particle sizes highlighted the relatively higher aromaticity/molecular weight of WSOC in smaller particles (Cawley et al., 2013). Baduel et al. (2011) found that HULISs undergo degradation under UV and ozone conditions, which in turn reduces their aromaticity and molecular weight. Thus, the higher SUVA254 values in smaller particles in this study may be due to fresh WSOC in these particle size ranges. In contrast, WSOC in larger particles undergoes a series of degradation reactions during the aging process, resulting in a decrease in aromaticity/molecular weight. The MAE365 values of particles in the size range of <0.26, 0.44–0.77, 1.40–2.50, and 2.50–10.0 µm were 0.1258, 0.1321, 0.1014, and 0.1145 m2 g−1 in summer, respectively, and 1.2615, 0.7991, 0.8206, and 0.3707 m2 g−1 in winter, respectively, indicating that WSOC in smaller particles had stronger light absorption capabilities (Huang et al., 2022). This is because WSOC in smaller particles contained more chromophores, such as nitrogen chromophores (see Sect. 3.1.2), resulting in stronger light absorption capabilities (Wu et al., 2018). The average AAE values were the highest in particle sizes of <0.26 µm, suggesting the existence of more wavelength dependence light absorption properties in smaller particles (Wu et al., 2018).
Table 1The optical properties of WSOC in particles of different size ranges (µm) at raw pH.
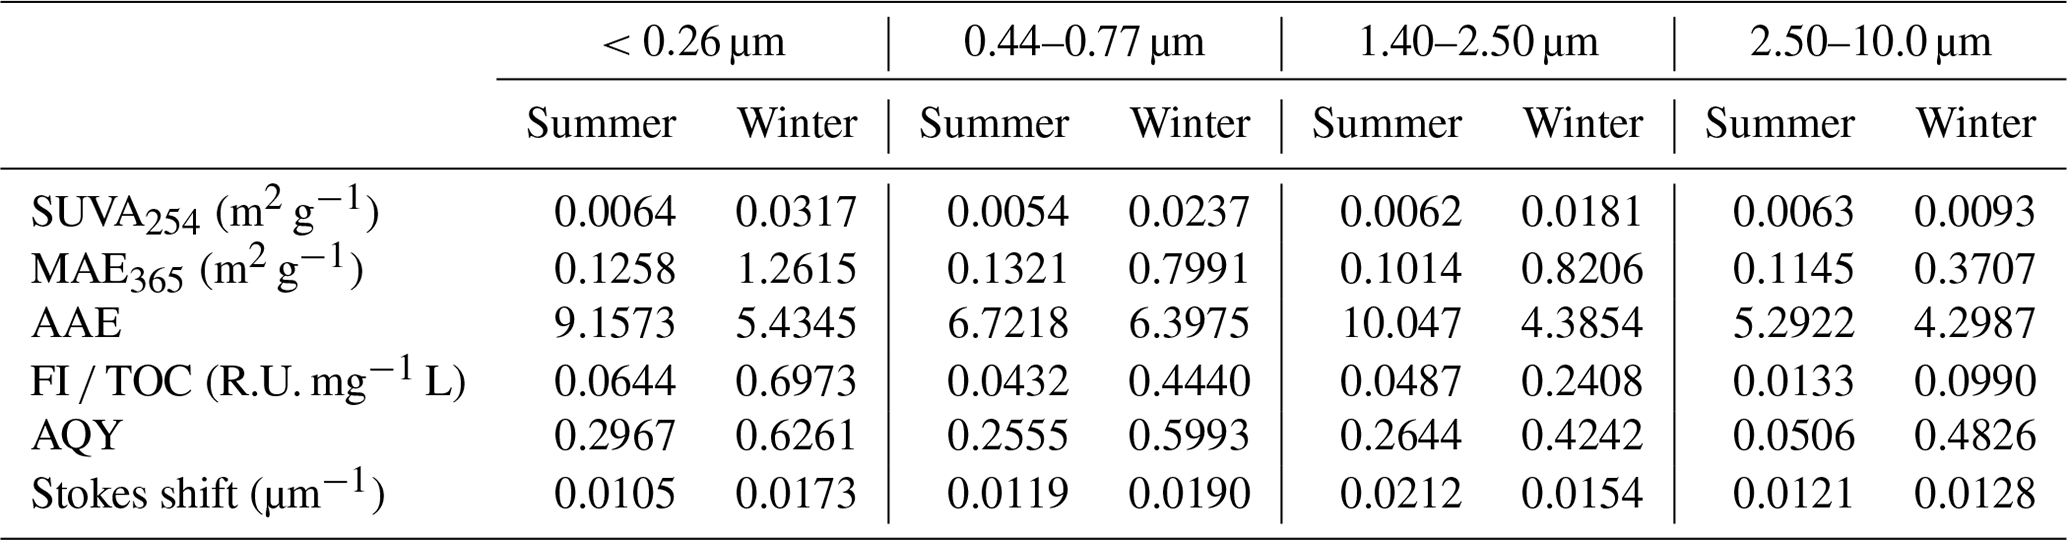
The overall fluorescence intensity per TOC (FI TOC) decreased steadily with increasing particle size (Table 1). The fluorescence intensity was higher for fresh than aged brown carbon (BrC), as previously observed by Fan et al. (2020). Therefore, the FI TOC further highlights that WSOC may have undergone a cascade of aging processes (e.g., photochemical aging and oxidative aging) with increasing particle size and thus has weaken its fluorescence intensity (Kuang et al., 2021; Wu et al., 2021). AQY exhibited a similar trend to FI TOC, indicating that a large scale of the π-conjugated system and fewer electron-withdrawing groups (e.g. –NH and –COOH) seemed to be present in smaller particles (Xiao et al., 2020, 2018b). For summer WSOC, the Stokes shift in the particle size of 1.40–2.50 µm was higher than that of the other particle sizes, indicating greater energy loss due to relaxation in the excited states of the fluorophores in larger particles. For winter WSOC, however, the particle sizes of 0.44–0.77 µm showed an even higher Stokes shift.
It is noteworthy that the light absorption and fluorescence properties of WSOC exhibited strong seasonal variations, with higher SUVA254 and MAE365 values in winter than in summer. This suggests higher aromaticity/molecular weight and more chromophores of WSOC in winter. The different sources and/or formation processes associated with different weather conditions (e.g., temperature and relative humidity) between the two seasons likely caused the seasonal variations in WSOC properties mentioned above. Literature-reported MAE365 from different sources showed values of 0.76–2.47 m2 g−1 for biomass-burning smoke, 0.20–1.33 m2 g−1 for fossil fuel combustion, and m2 g−1 for biogenic SOA (Geng et al., 2020). Our previous study also found higher MAE365 from combustion sources than ambient samples (Y. Qin et al., 2022b). The MAE365 values observed in the present study suggest that WSOC may be mainly derived from secondary formation in summer and from mixed sources of primary emissions (e.g., biomass burning and fossil fuel combustion) in winter. The FI TOC values also exhibited strong seasonal variations with 4–10 times higher values in winter than in summer, indicating enhanced photooxidation or photobleaching reactions of WSOC in summer due to stronger UV light. Furthermore, there are significant seasonal variations in the optical properties (e.g., SUVA254, MAE365, and FI TOC) of WSOC in smaller particles (t test, p=0.021), compared to the relatively flat seasonal patterns in larger particles, further suggesting significant seasonal differences in the sources and chemical structures of WSOC in smaller particles.
3.1.2 Functional groups analysis at raw pH
The FTIR spectra of WSOC in particles of different sizes are presented in Fig. 1. The FTIR spectra predominantly exhibited the presence of oxygen-containing functional groups and aliphatic C–H groups for all samples (Duarte et al., 2005). Strong absorptions of C–OH (3429 cm−1) were observed for all samples, indicating that WSOC contained abundant phenol, hydroxyl, and carboxyl groups (Duarte et al., 2005). A weak absorption at 3175 cm−1 was observed in both < 0.26 and 0.44–0.77 µm samples, typically corresponding to the N–H stretching vibration of amines and amides (Huo et al., 2008), but this feature was not shown in the spectra of the large particles, indicating a higher amide content in smaller particles. In addition, an absorption peak at 1720 cm−1 was only present in the smallest particles with sizes of <0.26 µm in summer, which was attributed to the unconjugated C=O stretching mainly of carbonyl carbon (Hu et al., 2019). A peak at 1641 cm−1 was also previously reported, which was attributed to conjugated carbonyl (C=O) groups and aromatic rings (C=C) (Zhang et al., 2022). A strong and sharp absorption at 1389 cm−1 is usually attributed to the C–H asymmetric bending vibrations of methyl groups in aliphatic chains (Duarte et al., 2007; Colthup, 2012). These results suggest that WSOC of different sizes contains abundant branched structures. The presence of a peak at 1114 cm−1 typically corresponded to the stretching vibration of C–OH, mainly alcohol (Chen et al., 2017). Strong absorptions of the out-of-plane vibrations of C–H (625 cm−1) and C=C (827 cm−1) groups were observed in the spectra, indicating that WSOC also contained abundant alkenes (Duarte et al., 2007). It is obvious that smaller particles contained more oxygenated species and nitrogenous compounds than larger particles did. Nitrogenous organic compounds with different aromatic structures are considered to be important light absorbers (Wu et al., 2022), resulting in stronger light absorption of WSOC in smaller particles. This is consistent with the results from the optical absorption properties analysis discussed in Sect. 3.1.1.
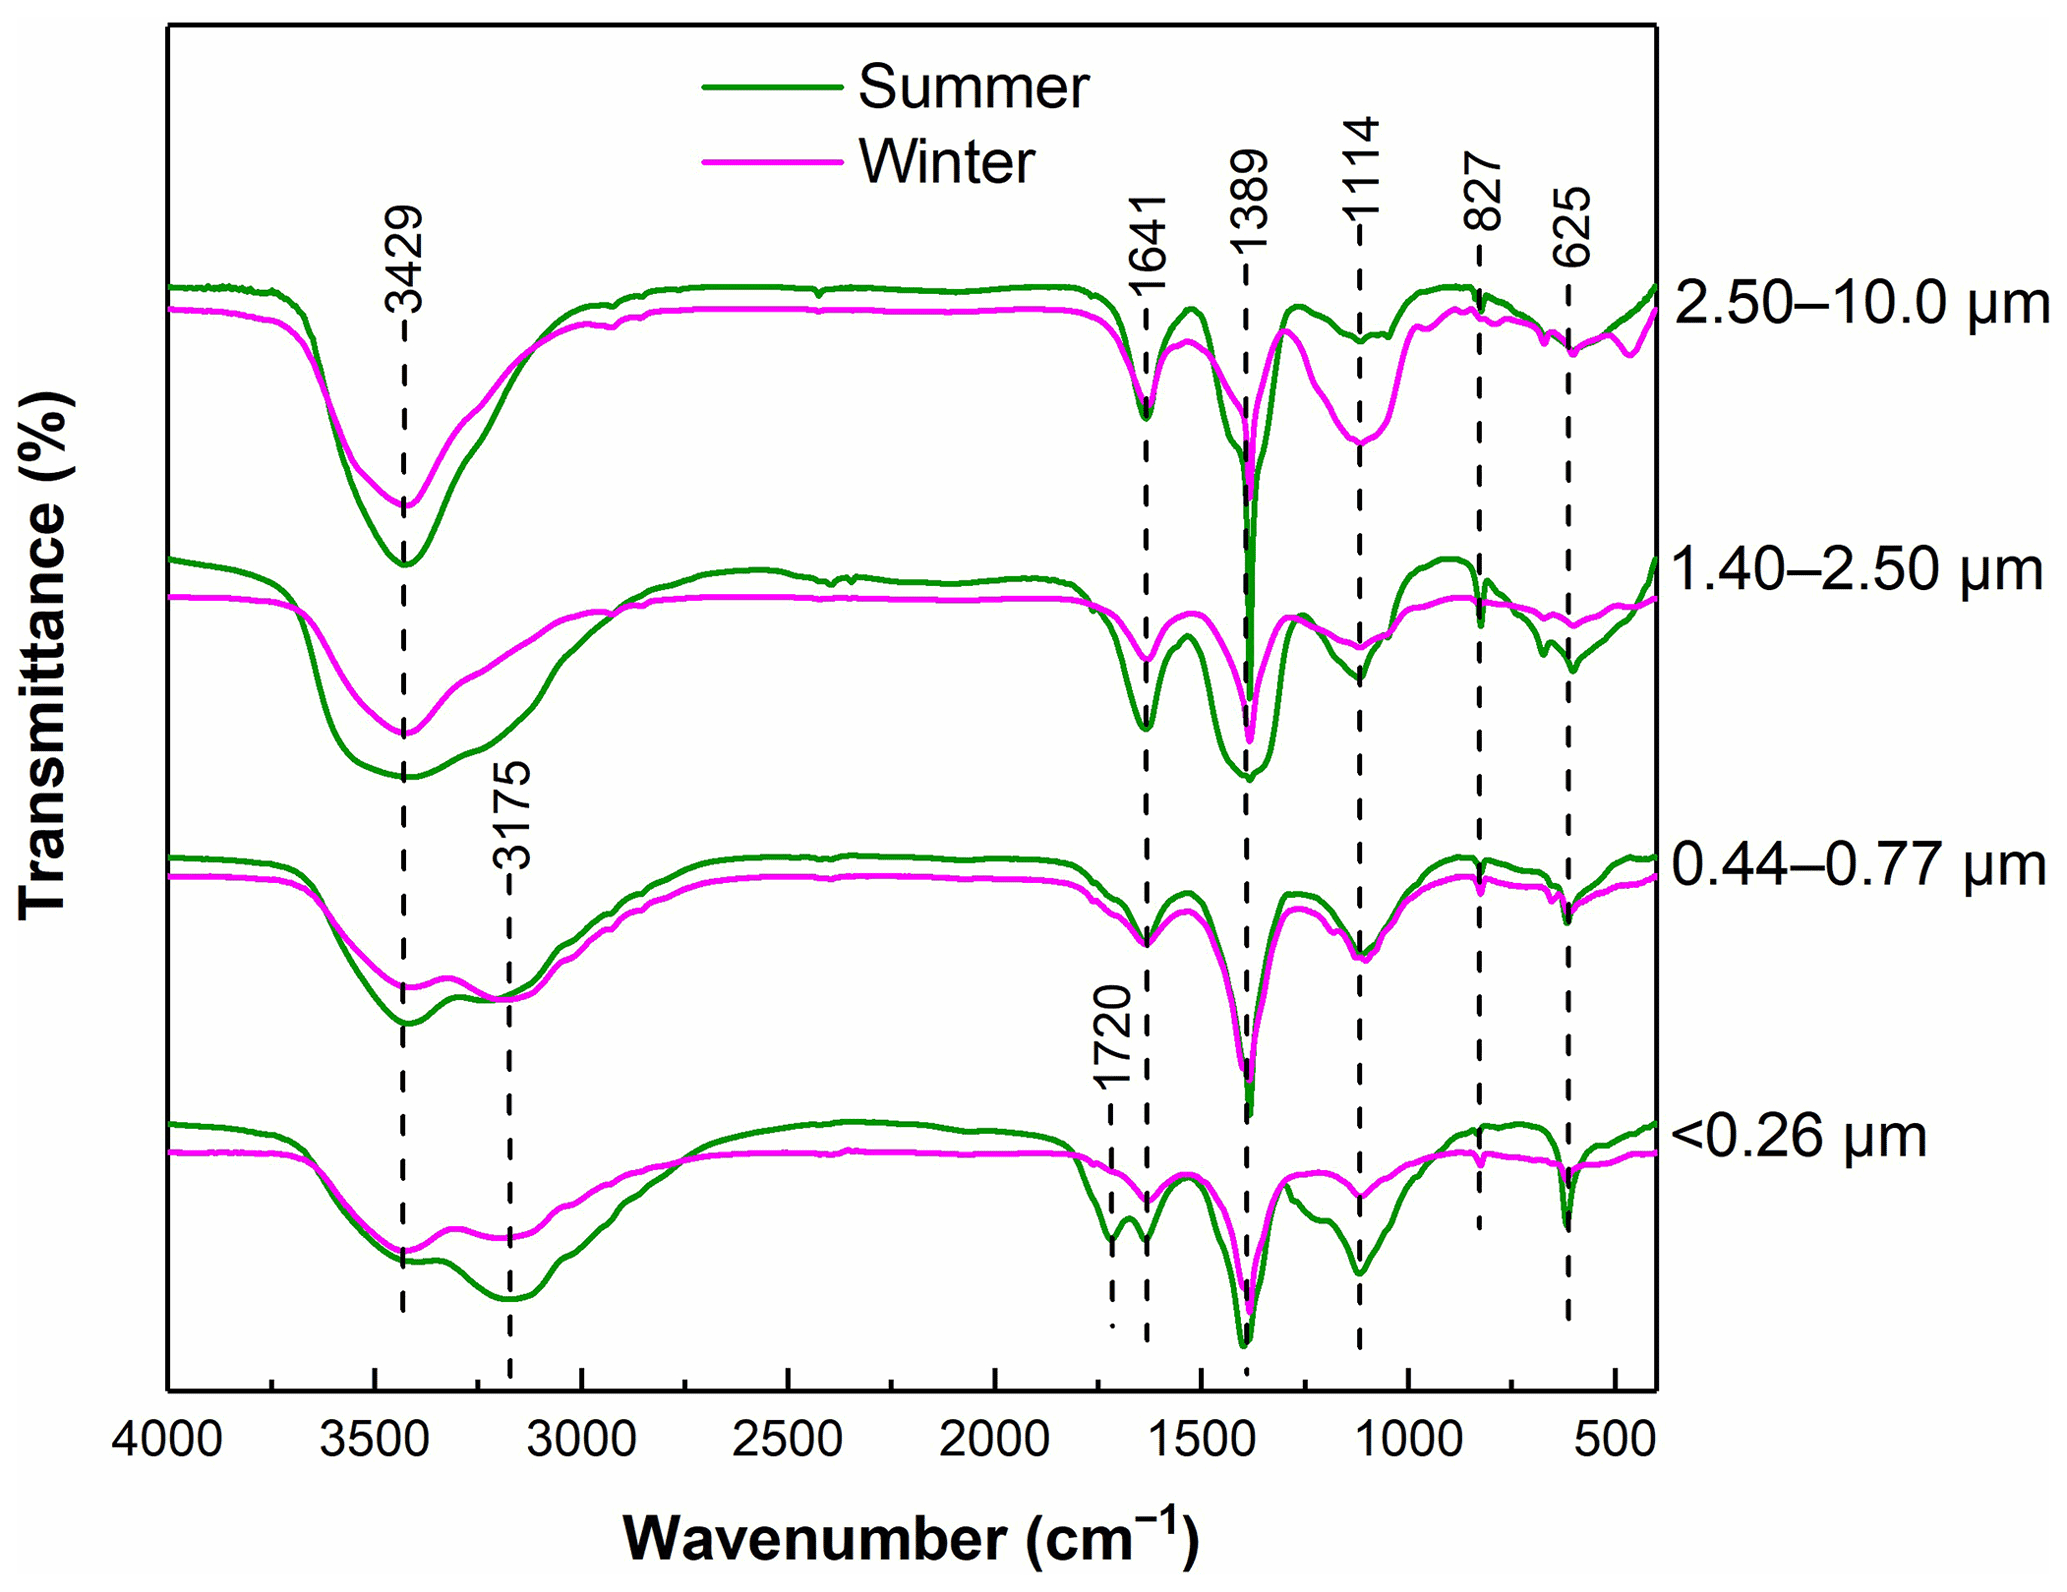
Figure 1FTIR spectra of WSOC in particles of different sizes in summer and winter at raw pH.
3.1.3 Acidic-group distributions
Figure 2 shows the distributions of the acidic groups of WSOC with a pKa in the range of 3.0–9.0. The pKa values of carboxylic and phenolic groups are in the range of 3.5–5.6 and 8.1–9.0, respectively, and the pKa range of 6.3–7.9 may be an overlapping region among weak carboxylic groups, phosphoric acids, or phenols (Mu et al., 2019). The contribution of (strong) carboxylic groups showed a clear characteristic of particle size distribution, with the highest percentage in sizes of 1.40–2.50 µm and the lowest one in sizes of <0.26 µm, reflecting that (strong) carboxylic groups tend to exist in larger particles, a phenomenon that is consistent with the findings in AQY mentioned above. In contrast, the contribution of (strong) phenolic groups was the highest in smaller particles (<0.77 µm) and the lowest in larger particles (1.40–2.50 µm). This pattern indicates that the phenolic groups were abundant in WSOC of smaller particles. It has been demonstrated that aromatic compounds (e.g., phenol) are abundant in biomass-burning particles (Laskin et al., 2015; Lin et al., 2016; Sannigrahi et al., 2006). Additionally, nitrophenols and their derivatives have been found to be possibly associated with the gas-phase oxidation of anthropogenic volatile organic compounds (VOCs) and aqueous-phase oxidation processes in polluted high-NOx environments (Frka et al., 2022; Wang et al., 2019). Therefore, the size distribution of the acidic group clearly indicates that WSOC with sizes of <0.77 µm mainly originated from biomass burning, although the contribution of secondary formation should not be completely neglected. Overall, the contribution of strong phenolic groups (>54 %) was higher than that of carboxyl groups in all samples except particle sizes of 1.40–2.50 µm. This result indicates that phenolic groups were more abundant than carboxylic groups in WSOC. Meanwhile, except for particle sizes of 1.40–2.50 µm, the contribution of carboxyl was higher and the phenolic group was lower in summer than in winter.

Figure 2The distribution of the acidic group of WSOC in particles of different sizes in summer and winter.
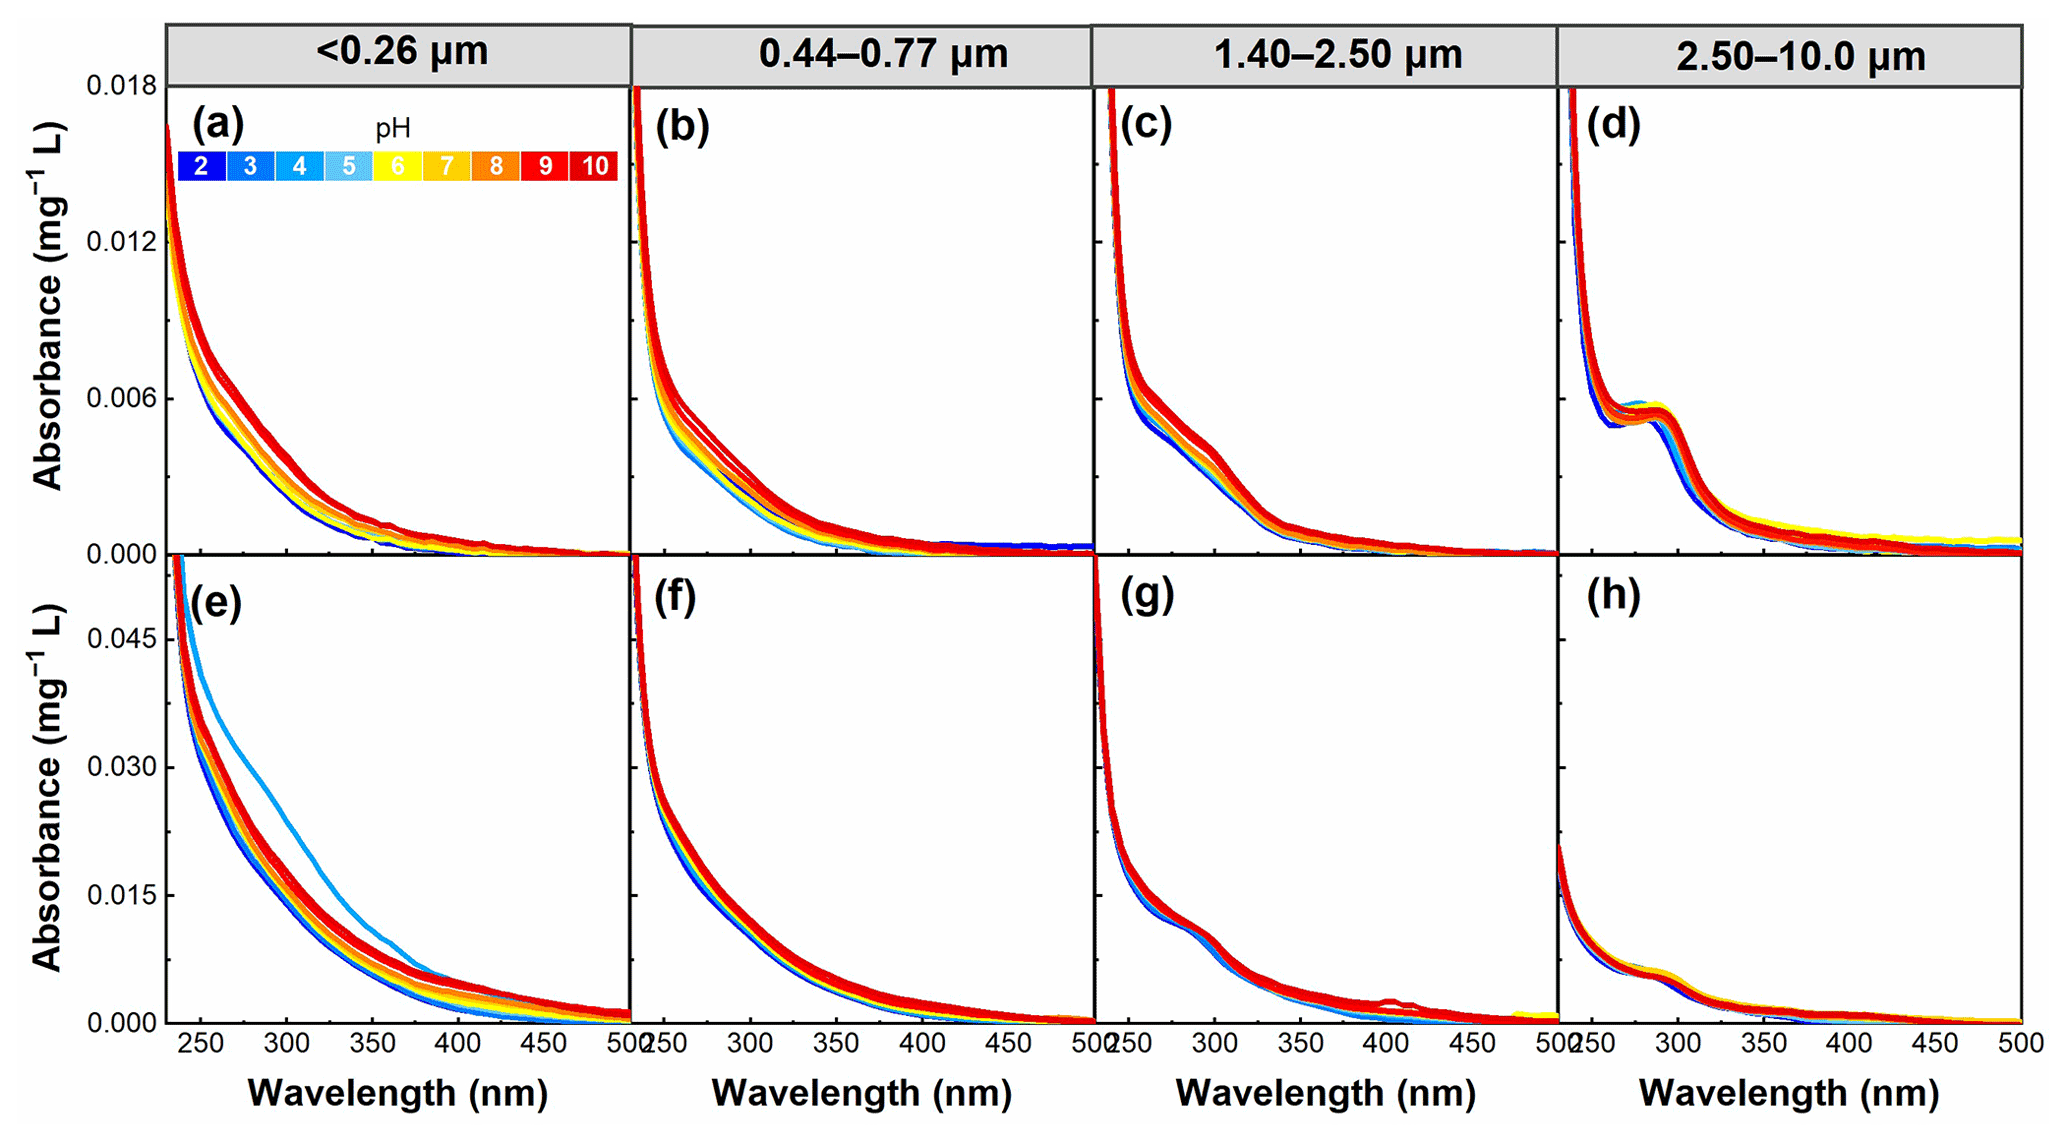
Figure 3pH dependence of absorption per unit mass of WSOC in particles of different sizes in summer (a–d) and winter (e–h) in the pH range of 2–10.
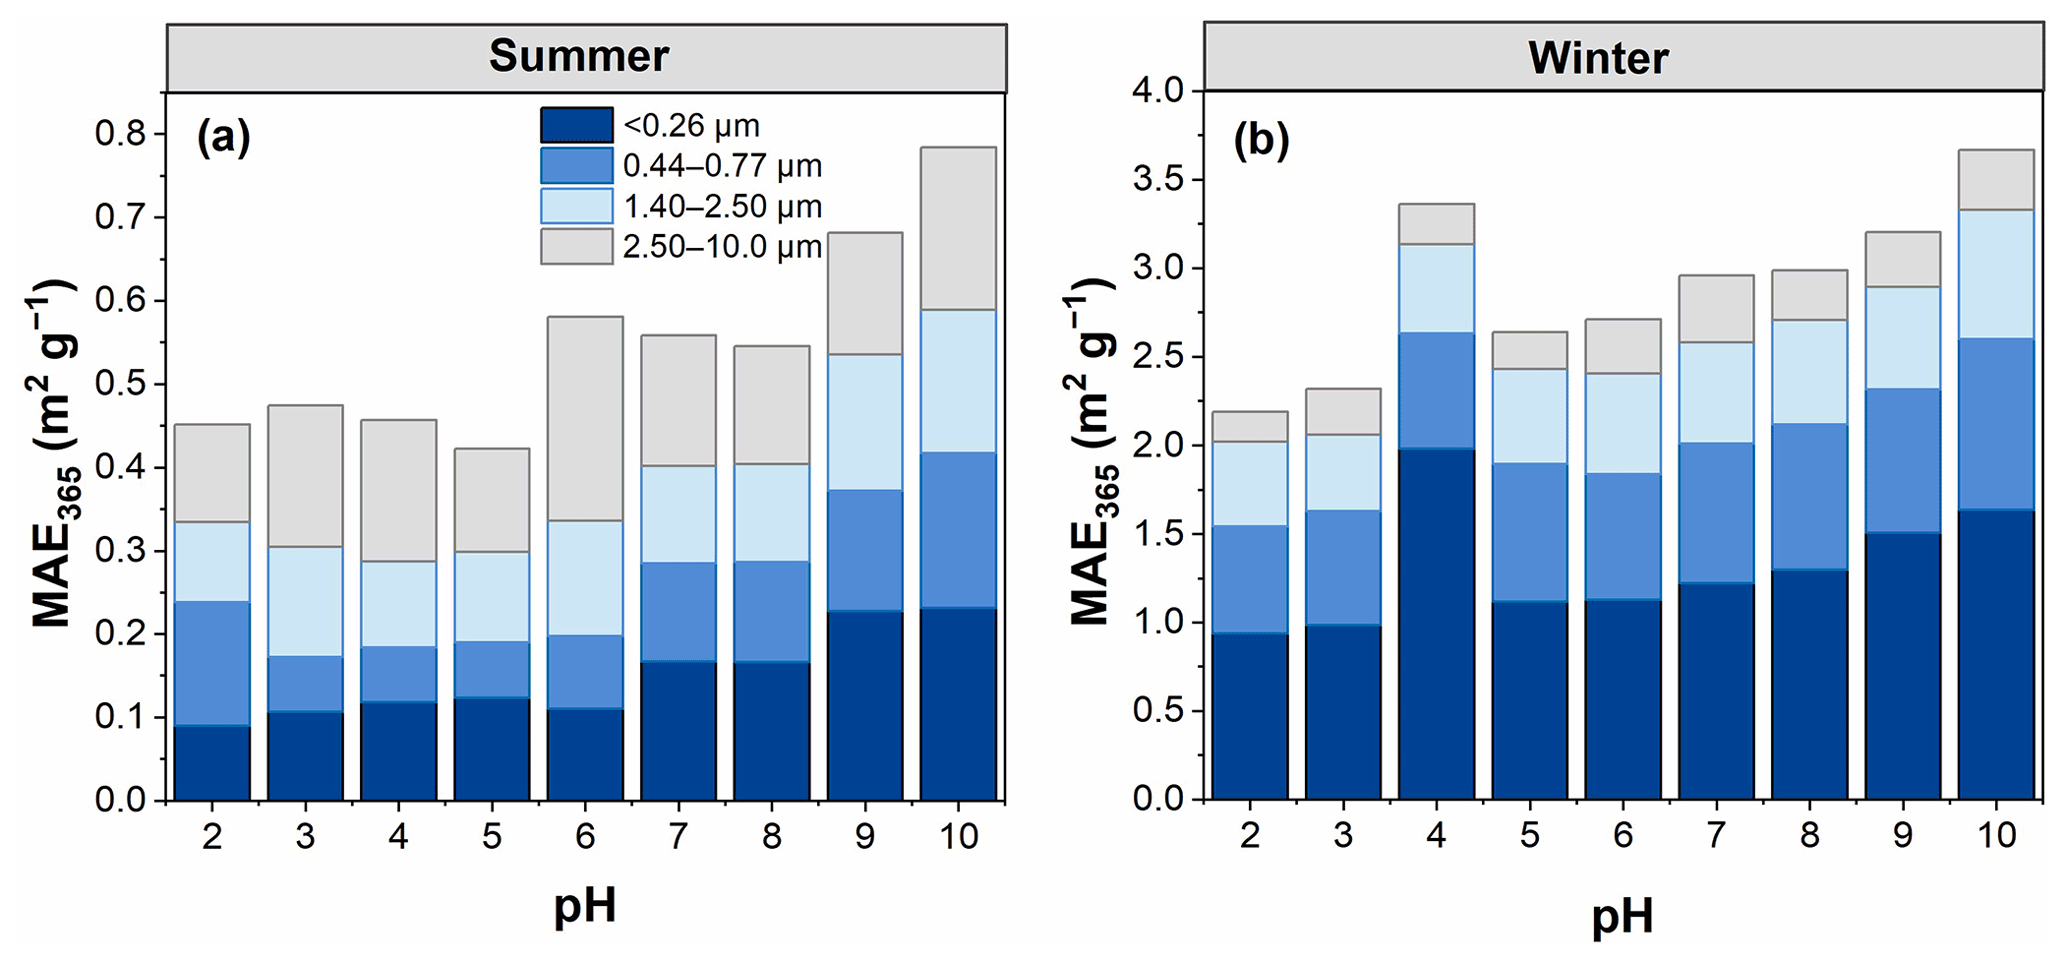
Figure 4pH dependence of MAE365 for WSOC in particles of different sizes in (a) summer and (b) winter in the pH range of 2–10.
3.2 Role of pH on UV–Vis absorption spectra
3.2.1 Absorption spectra
In addition to the particle size, the aerosol pH is another factor affecting the structure of WSOC chromophores. As shown in Fig. 3, the absorption of WSOC gradually increased with increasing pH for almost all samples, which may be related to the deprotonation of aromatic WSOC chromophores (Korshin et al., 1997; Young et al., 2018). On average, the absorbance for particle sizes of <0.26, 0.44–0.77, 1.40–2.50, and 2.50–10.0 µm increased by 4.6 %, 1.3 %, 0.6 %, and 0.9 %, respectively, per unit pH increase in summer, and by 1.3 %, 0.5 %, 0.5 %, and 2.9 %, respectively, in winter. The results suggest that the absorption in particle sizes of <0.26 and 0.44–0.77 µm in summer and <0.26 and 2.50–10.0 µm in winter showed a more pronounced pH dependence, as further illustrated below.
3.2.2 Mass absorption efficiency at 365 nm (MAE365)
The MAE365 values showed a clear trend; that is, an overall increase in MAE365 was observed with increasing pH (Fig. 4), consistent with the results of a previous study (Mo et al., 2017). This finding indicates that WSOC had a stronger light absorption capability at high pH. However, the MAE365 for particles <0.26 µm in winter exhibited the highest value at pH 4, most likely because WSOC of particles in this size range was significantly influenced by the group of pKa values near this pH value. The pH-dependent MAE365 suggests that under different pH conditions WSOC may have a different impact on climate (i.e., climate impact would be enhanced as pH increases) (Aiona et al., 2018). Overall, the average MAE365 for particles of <0.26 µm changed more sharply with increasing pH (with a 12.7 % increase per pH unit) due to the stronger pH dependence of the absorption spectra of smaller particles compared to the cases of larger particles, as described above. Phillips et al. (2017) found that the variations of the light absorption properties of BrC with pH were the result of structural changes in the nitro-aromatics and phenols. More aromatic species were found in the smaller than larger particles in this study (Table 1). Therefore, the strong dependence of light absorption properties on pH in smaller particles might be related to the higher content of aromatic species (e.g., nitro-aromatic species) in WSOC.
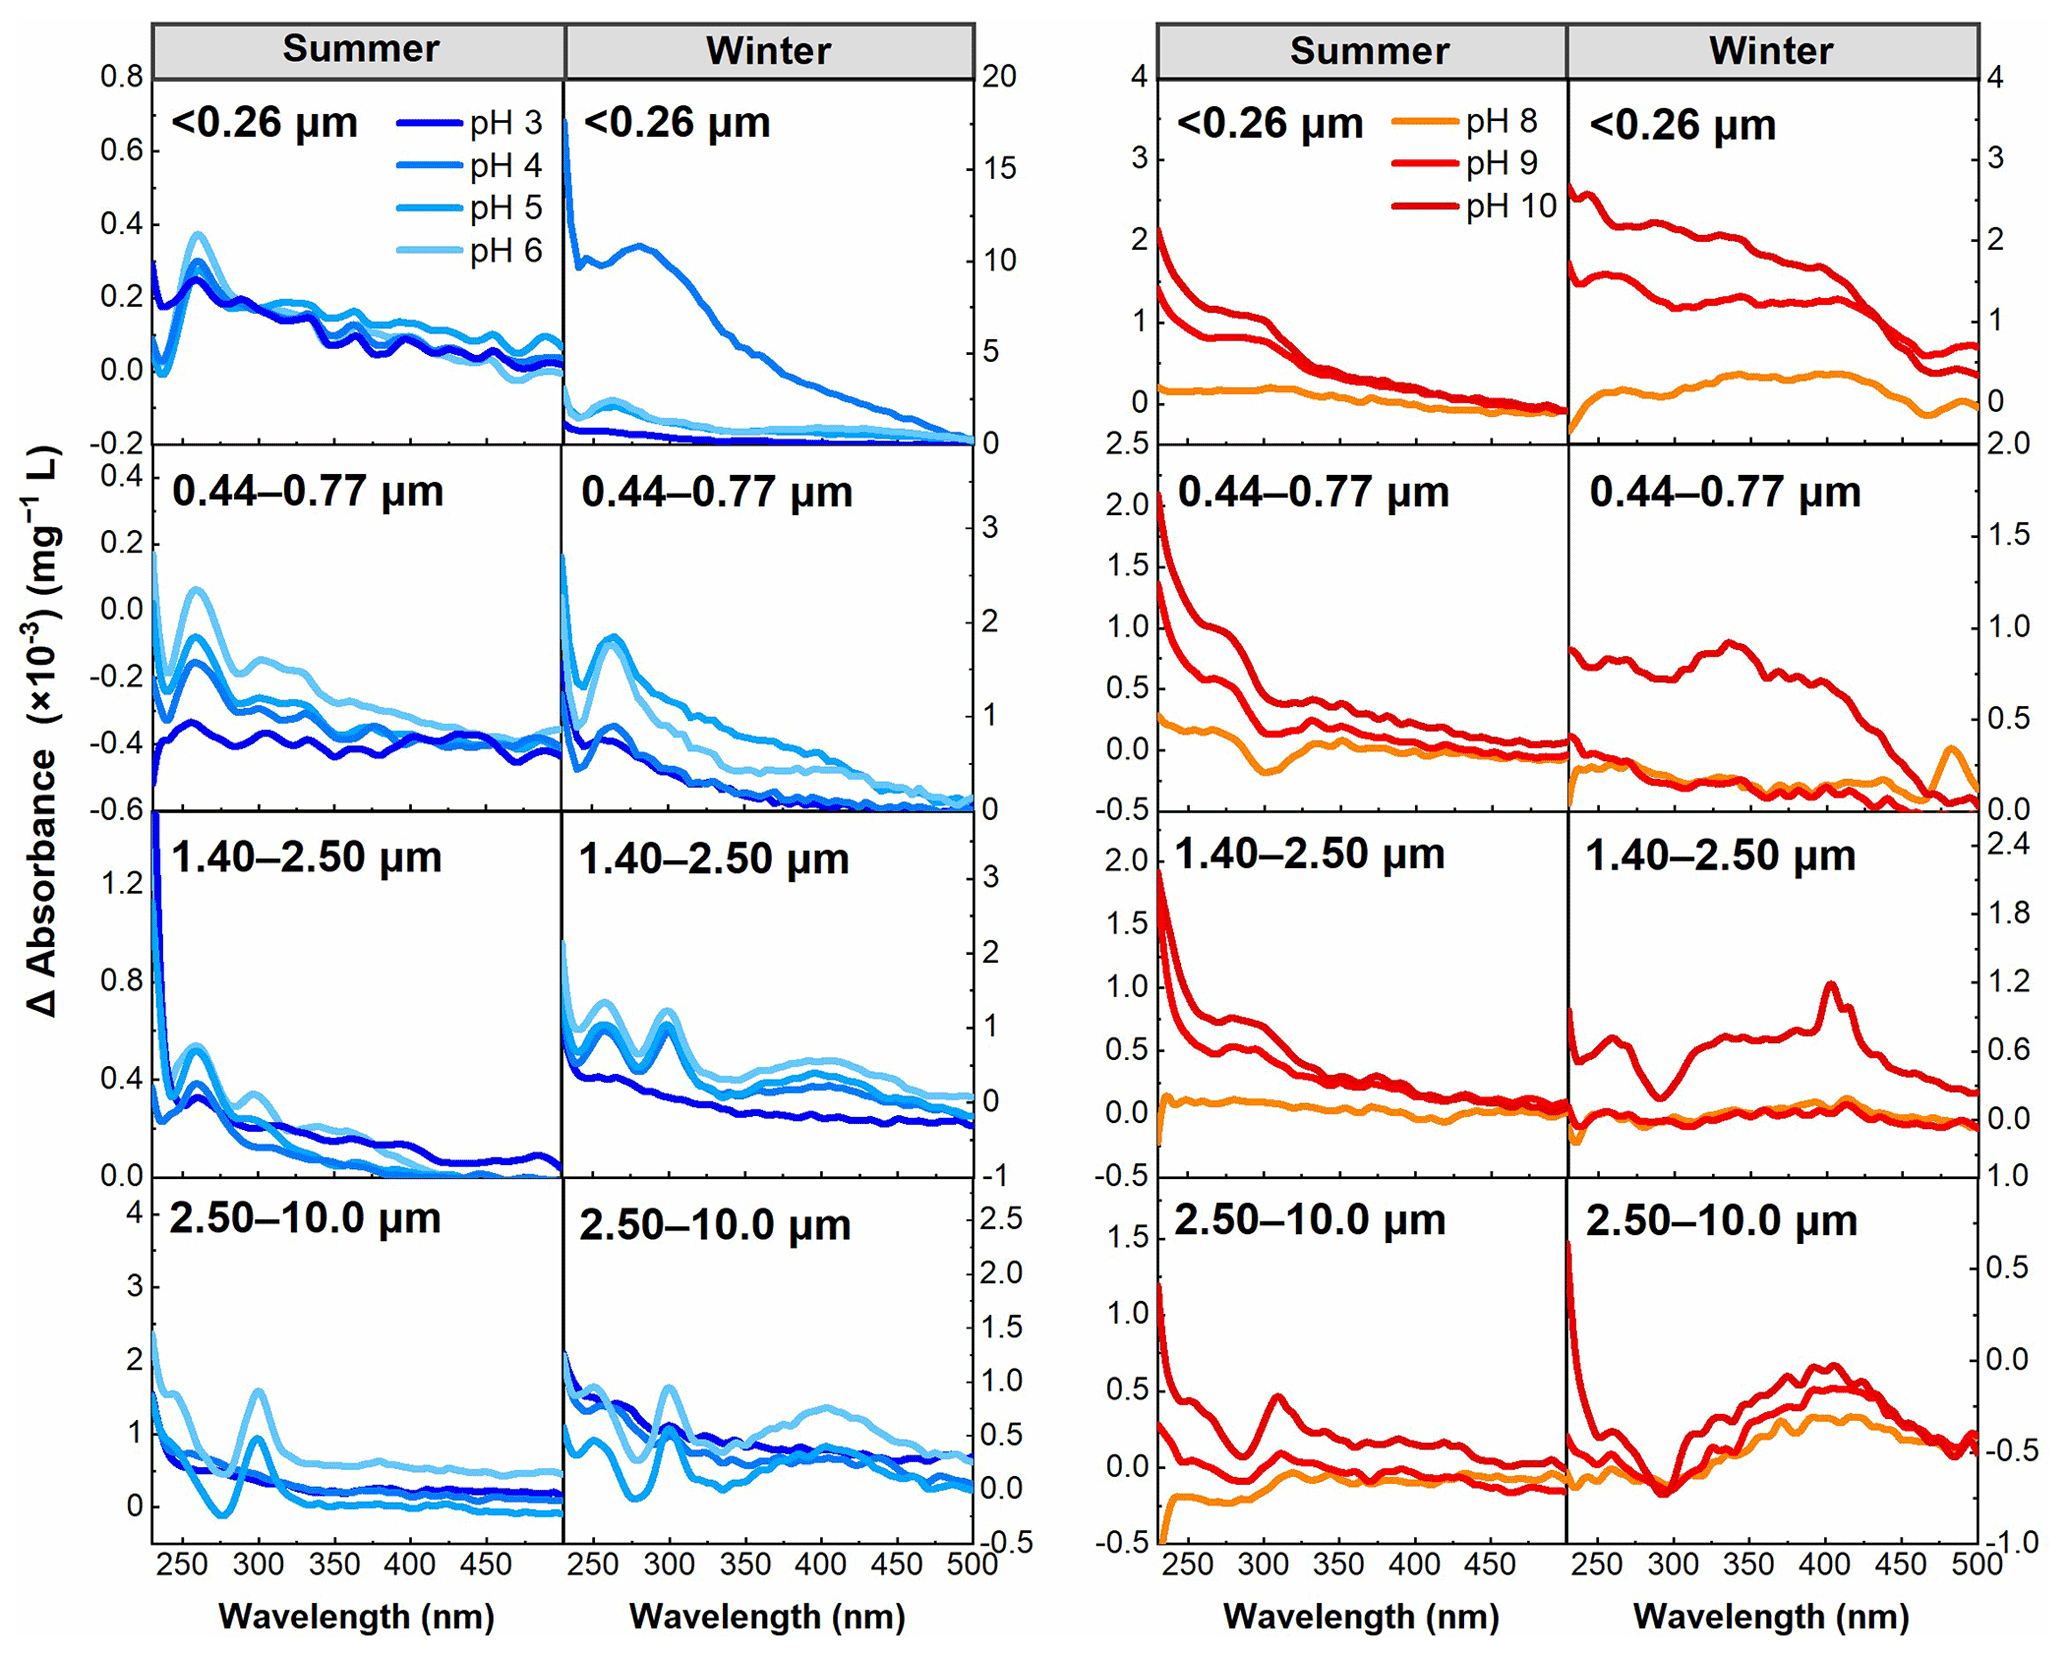
Figure 5Δ absorbance of WSOC in particles of different sizes in winter and summer in the pH range of 2–10.
3.2.3 Difference absorbance spectra (Δ absorbance)
Following the work of Dryer et al. (2008), the Δ absorbance can identify whether specific spectral bands defined as carboxyl and phenolic groups undergo significant changes within their corresponding pH ranges. Therefore, the Δ absorbance (λ) was calculated in this study to examine the behavior of groups in resonance with chromophores in WSOC under pH titration. Based on the distribution of the pKa values of carboxyl (3.0–5.6) and phenolic groups (>8.0), carboxyl plays a major role in the absorbance in the range of approximately pH 3.0–6.0, while phenolic groups should predominate at pH >8.0.
The results summarized in Fig. 5 show that the most notable feature bands of Δ absorbance were observed at about 270 nm in almost all samples in the pH 3.0–6.0 range associated with the carboxyl group (Phillips et al., 2017), although an absorption band at about 300 nm was also observed for particle sizes of >2.50 µm in summer and winter, suggesting the presence of at least two distinct chromophores deprotonated for particle sizes of >2.50 µm in this pH range (Liu et al., 2020). However, the absorption band at about 270 nm was not observed for particle sizes of 2.50–10.0 µm in summer, suggesting that the carboxyl deprotonation feature was inhibited compared to other samples. For the pH 8.0–10 range, an enhanced absorption band was primarily centered between 300 and 400 nm, and this band is approximately the position of the phenolic group, indicating that phenolic groups play a major role in this pH range (Schendorf et al., 2019).
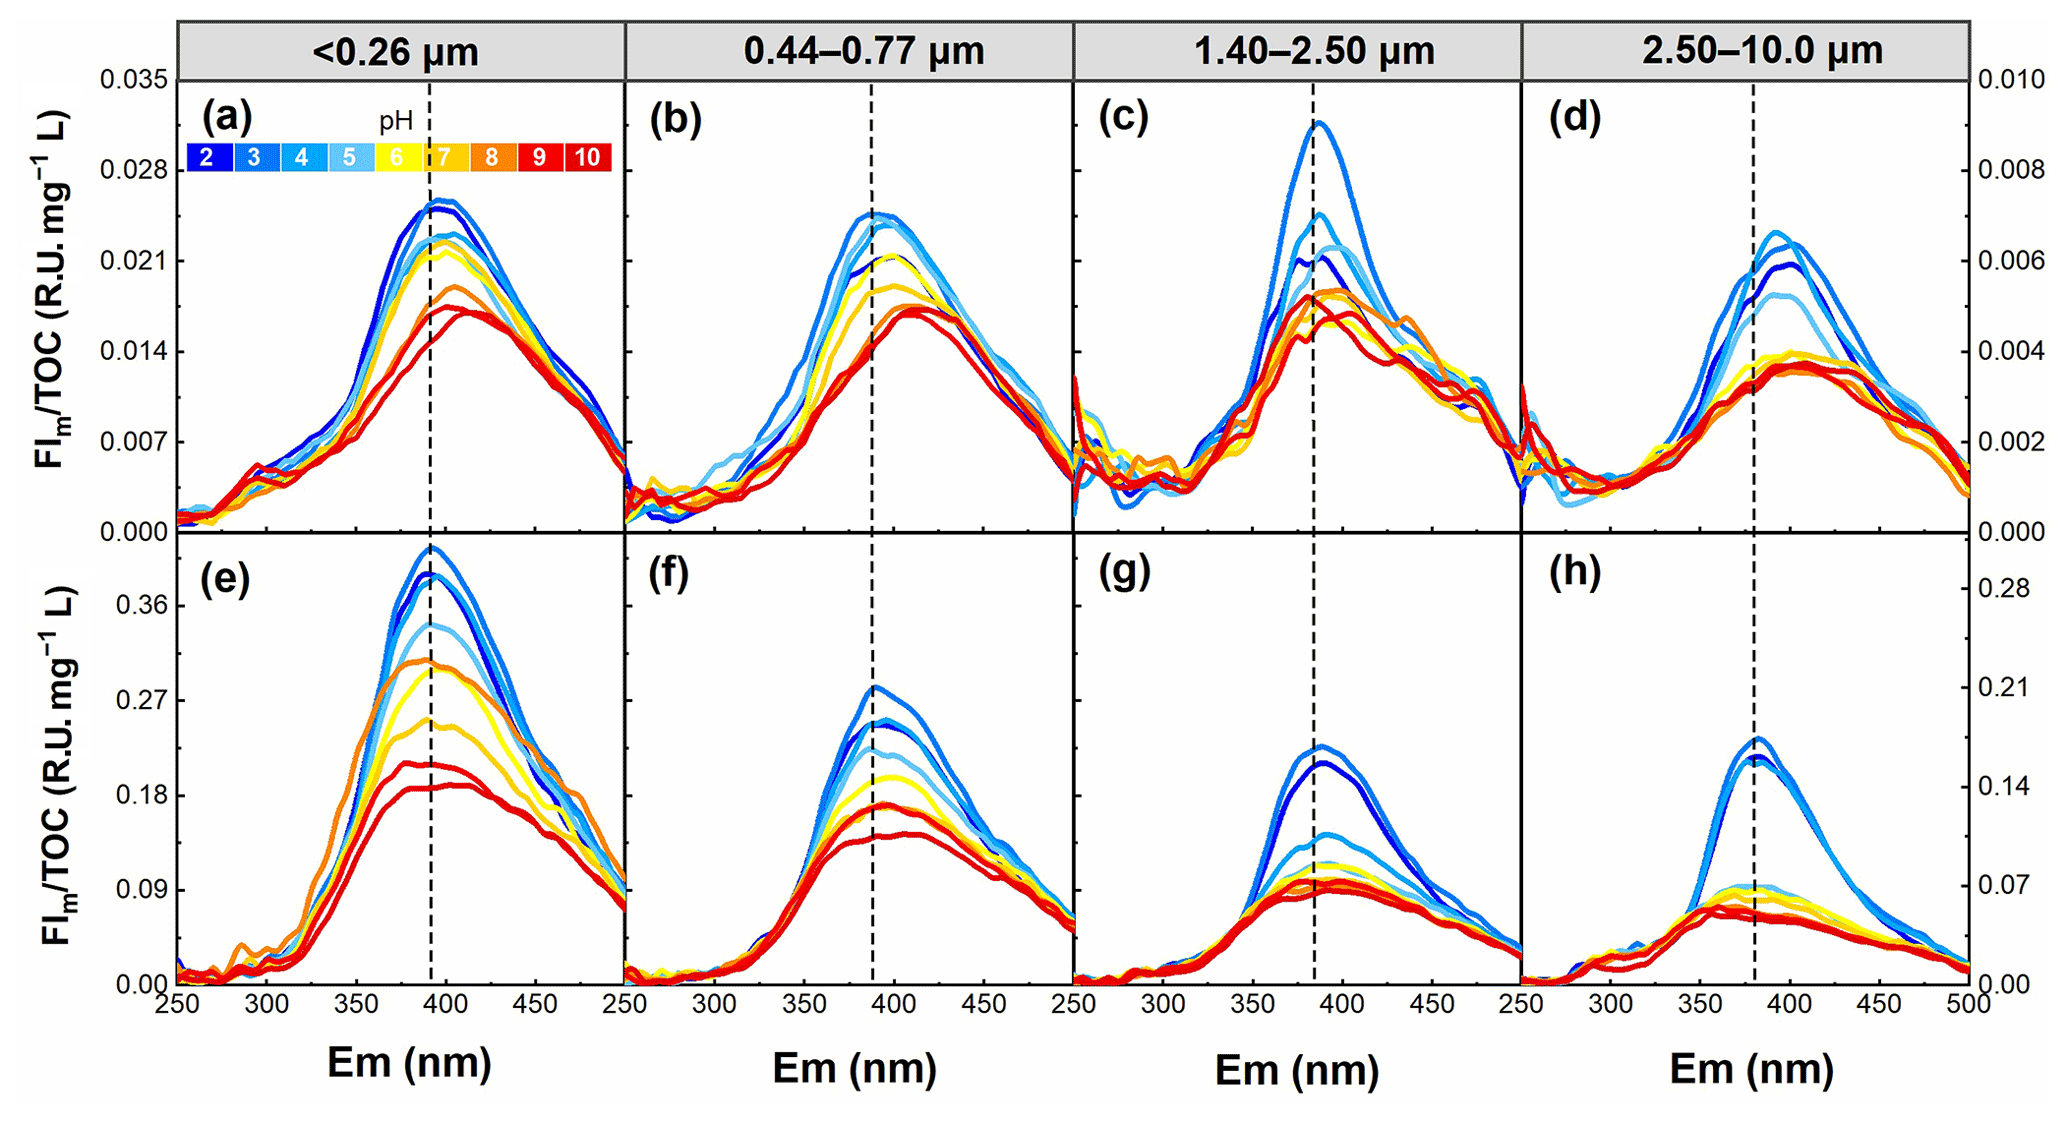
Figure 6pH dependence of the FIm TOC for WSOC in particles of different sizes in summer (a–d) and winter (e–h) in the pH range of 2–10.

Figure 7pH dependence of the FI TOC for WSOC in particles of different sizes in (a) summer and (b) winter in the pH range of 2–10.
3.3 Role of pH on EEM fluorescence spectra
3.3.1 EEM fluorescence properties
To examine the role of pH on the fluorescence intensity and peak position of WSOC from different particle sizes, the FIm TOC of WSOC was calculated from the EEM spectra and is plotted in Fig. 6. Overall, the FIm TOC of all samples generally decreased with increasing pH. This trend was verified by the results in Fig. 7, where from pH 2 to 10, FI TOC first slightly increased and then significantly decreased with increasing pH. On average, the FI TOC of <0.26, 0.44–0.77, 1.40–2.50, and 2.50–10.0 µm decreased by 3.8 %, 3.5 %, 4.7 %, and 6.8 %, respectively, per unit pH increase in winter, values which are significantly higher than those (0.6 %, 1.7 %, 0.2 %, and 2.5 %, respectively) in summer. Furthermore, a redshift of fluorescence peak positions with increasing pH was observed in summer (Fig. 6), but the opposite trend was observed in winter (blueshift). Protonation and dissociation of the acidic/basic groups in aromatic compounds can generally lead to a shift in fluorophores (Coble et al., 2014; Schulman et al., 1985). For example, the dissociation of the electron withdrawing groups (e.g., –COOH and –NO2) leads to a blueshift in fluorophores, while the dissociation of the electron donating groups (e.g., –OH) results in a redshift in fluorophores (Schulman et al., 1985). In this regard, we speculate that the hydroxyl groups play a leading role in pH-responsive fluorescence in summer samples, while carboxylic and nitro groups play a dominant role in winter samples.
3.3.2 PARAFAC components
To investigate the types of fluorescence components in WSOC in different particle sizes, the EEM spectra were decomposed into three fluorescent components (C1, C2, and C3), as shown in Fig. 8. The chemical components corresponding to C1 and C2 were assigned to more oxygenated humic-like (HULIS1) and less oxygenated humic-like (HULIS2) fluorophores, respectively (Qin et al., 2018, 2021; Chen et al., 2016b; Xiao et al., 2018a), while those corresponding to C3 were assigned to protein-like organic matter (Chen et al., 2016b).
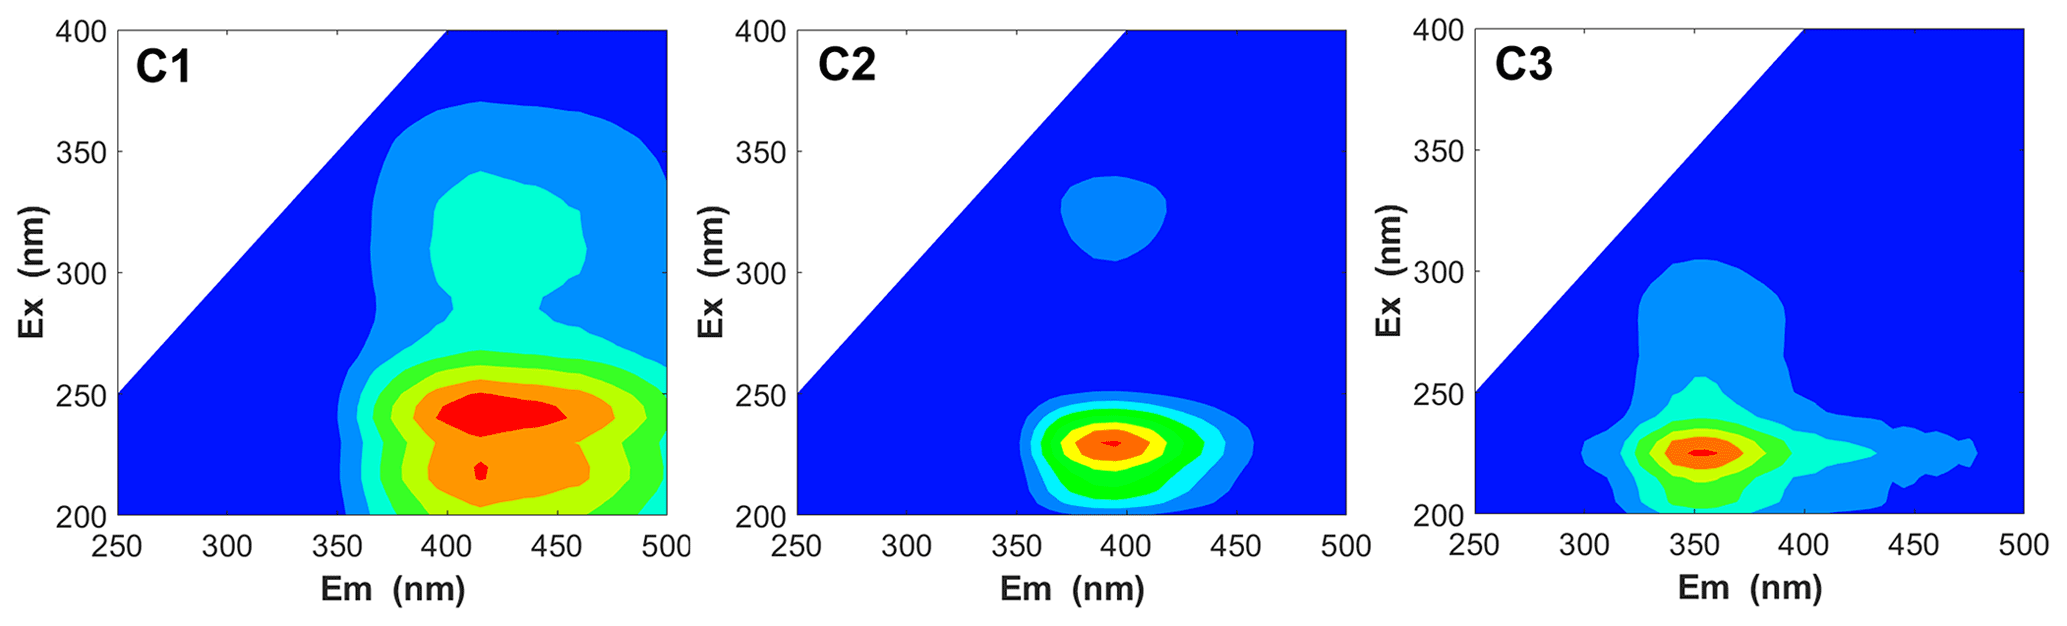
Figure 8The PARAFAC analysis identified fluorescence components (C1, C2, and C3) for all WSOC samples.
The peak intensities of the fluorescent components (Fmax) are shown in Fig. 9. pH also had an important effect on the Fmax of the fluorescent components of WSOC. Fmax of different fluorescent components showed a similar variation pattern with increasing pH. For example, Fmax of all fluorescence components showed a peak at pH 3 and then tended to decrease with increasing pH. However, the magnitude of the effect of pH on Fmax of different fluorescent components was different. In contrast, HULIS2 fluorophores varied significantly, while HULIS1 fluorophores and protein-like organic matter varied slightly with pH. The HULIS2 fluorophores showed the most susceptibility to acidity, likely indicative of a greater proportion of acidic/basic groups in HULIS2 fluorophores.
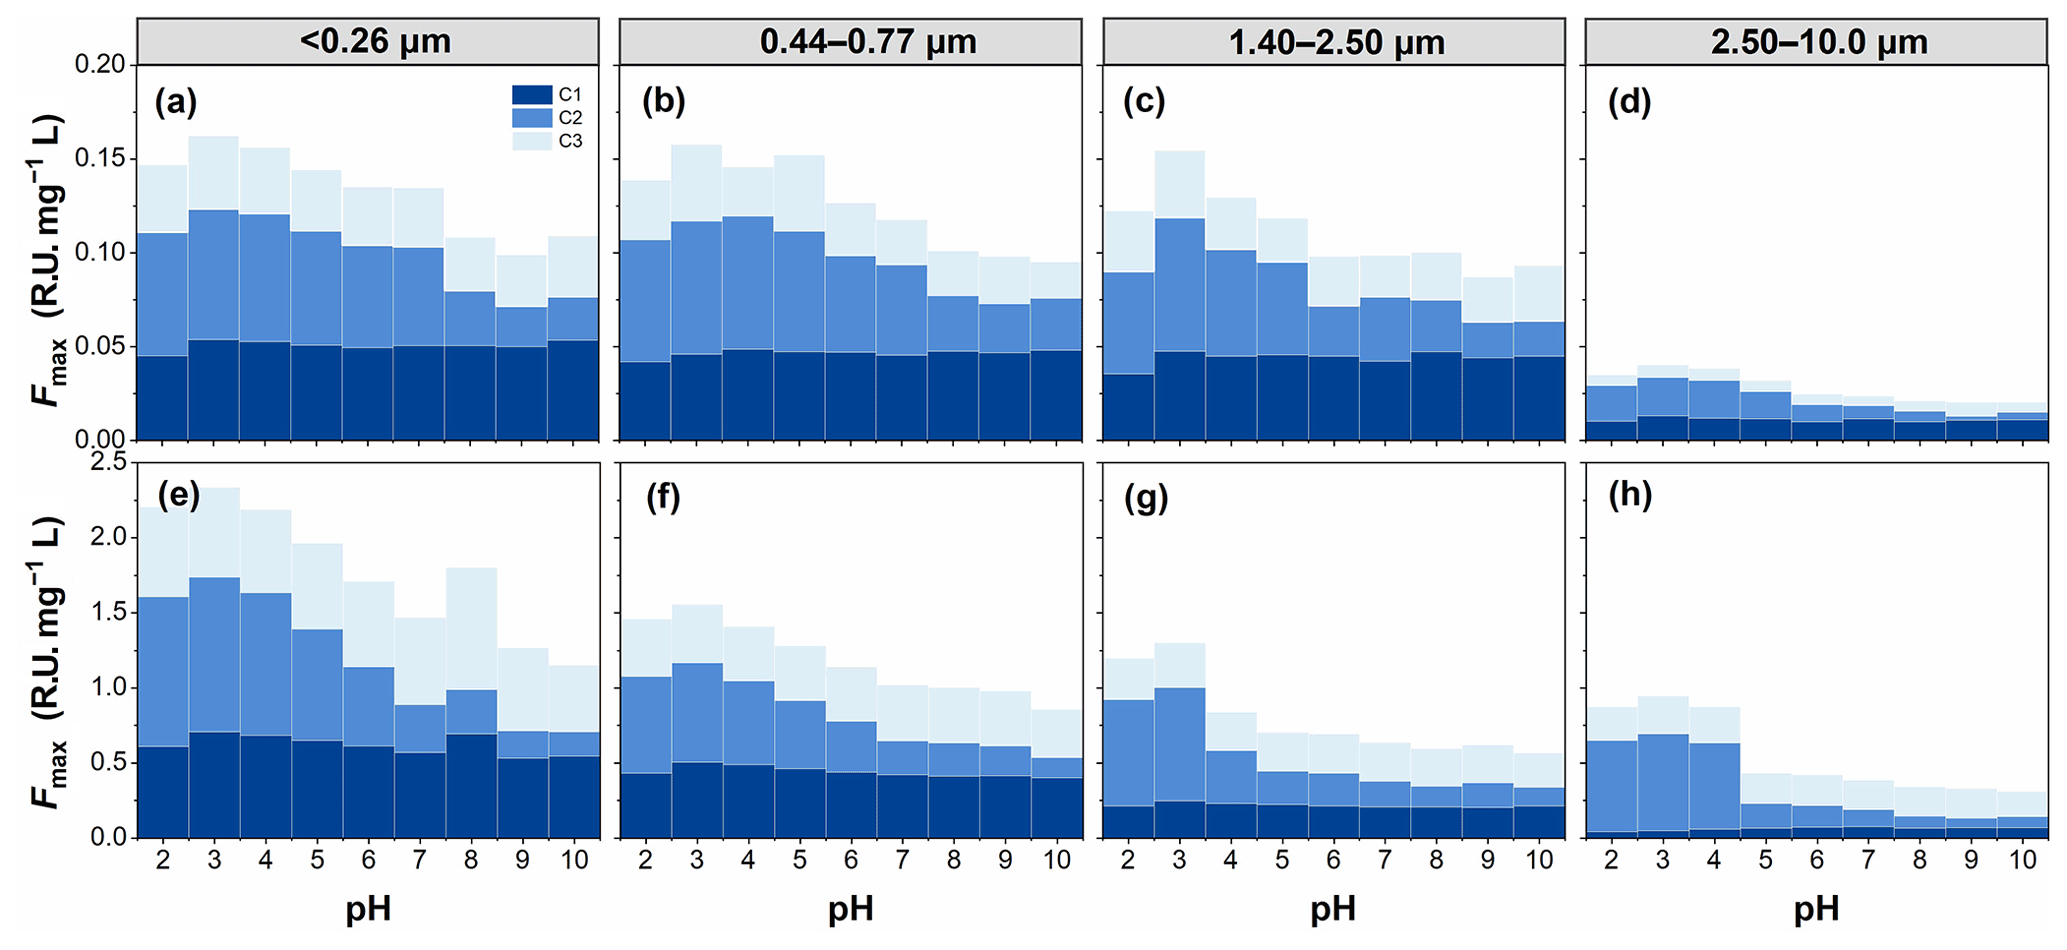
Figure 9pH dependence of the Fmax of fluorescence components for WSOC in particles of different sizes in summer (a–d) and winter (e–h) in the pH range of 2–10.
3.3.3 Deep properties of fluorescence
The AQY and Stokes shift were used to investigate the efficiency and energy change of the fluorescence process of WSOC. As shown in Fig. 10, AQY was also pH dependent in all WSOC samples, and it generally decreased with increasing pH. This result is similar to a conclusion reported in our previous study (Qin et al., 2021). It has been reported that a larger rate of non-radiative transition seems to be favorable for the AQY of fluorophores (Xiao et al., 2020). Thus, our AQY data presented here indicate the rate of non-radiative transition of the WSOC fluorophores decreased with increasing pH. Additionally, a high AQY of a substance means that only a small portion of the absorbed radiative energy will be converted into heat, thus reducing its heating effect (Aiona et al., 2018). Hence, the pH-dependent AQY presented above further confirms that the impact of WSOC on climate would be enhanced with increasing pH.
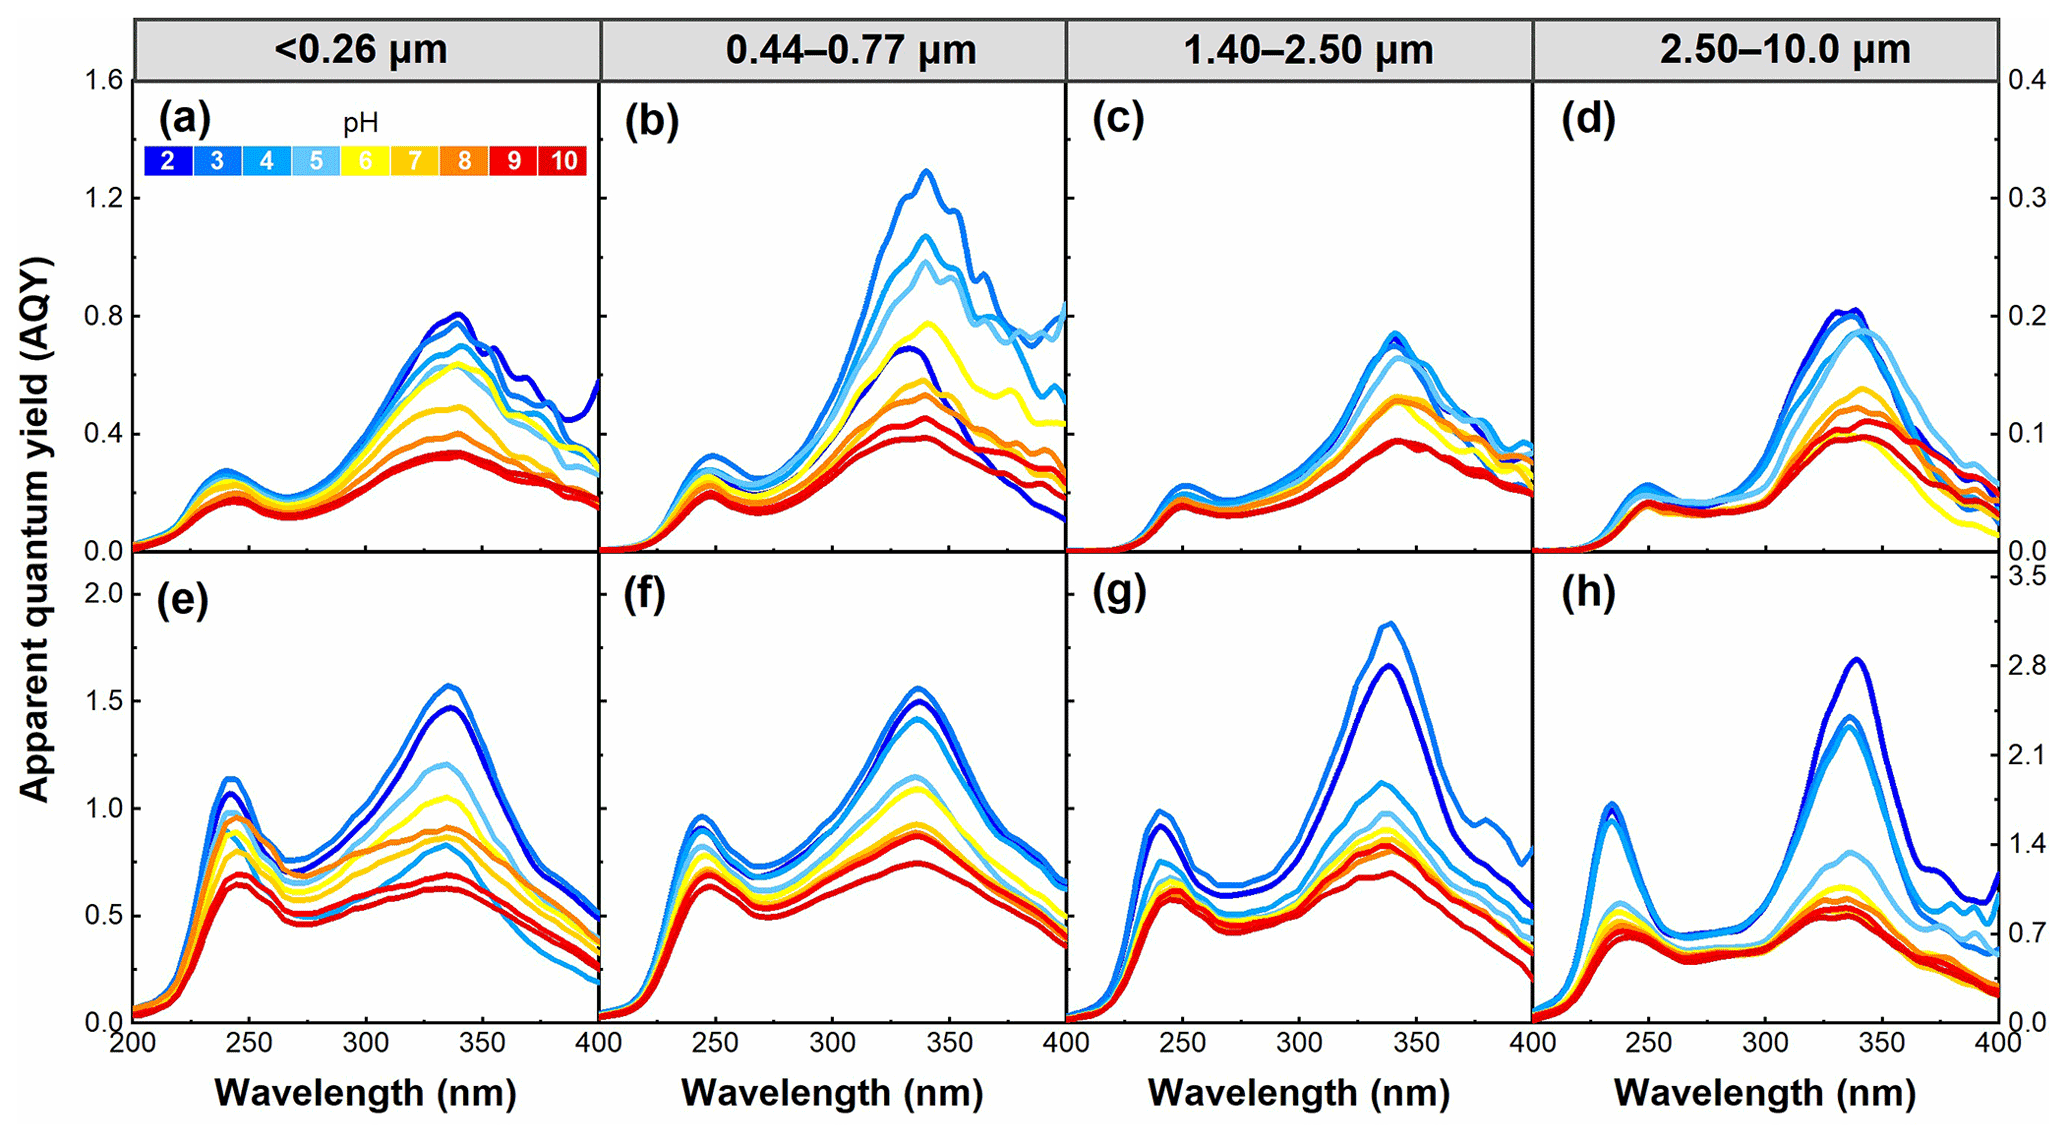
Figure 10pH dependence of apparent quantum yield (AQY) for WSOC in particles of different sizes in summer (a–d) and winter (e–h) in the pH range of 2–10.
The Stokes shift is an important energy parameter of fluorescence that can be affected by the chemical environment of the fluorophore (Xiao et al., 2019). As shown in Fig. 11, there was a common feature in all samples showing WSOC having two distinct peaks at Stokes shifts around 0.7 and 2.0 µm−1. However, WSOC with lower pH tends to have higher intensity at high Stokes shift values (about 2.0 µm−1). This trend was evident in winter samples, which probably resulted from the high content of aromatic compounds in these samples (with the extensive π-conjugated system) because pH had an important impact on the π-conjugated systems and thus changed Stokes shifts of WSOC (Xiao et al., 2019). Furthermore, summer WSOC tends to have higher Stokes shifts (at about 2.0 µm−1) at higher pH, except for particles of 2.50–10.0 µm. In contrast, winter samples usually have lower Stokes shifts (at about 2.0 µm−1) at higher pH.
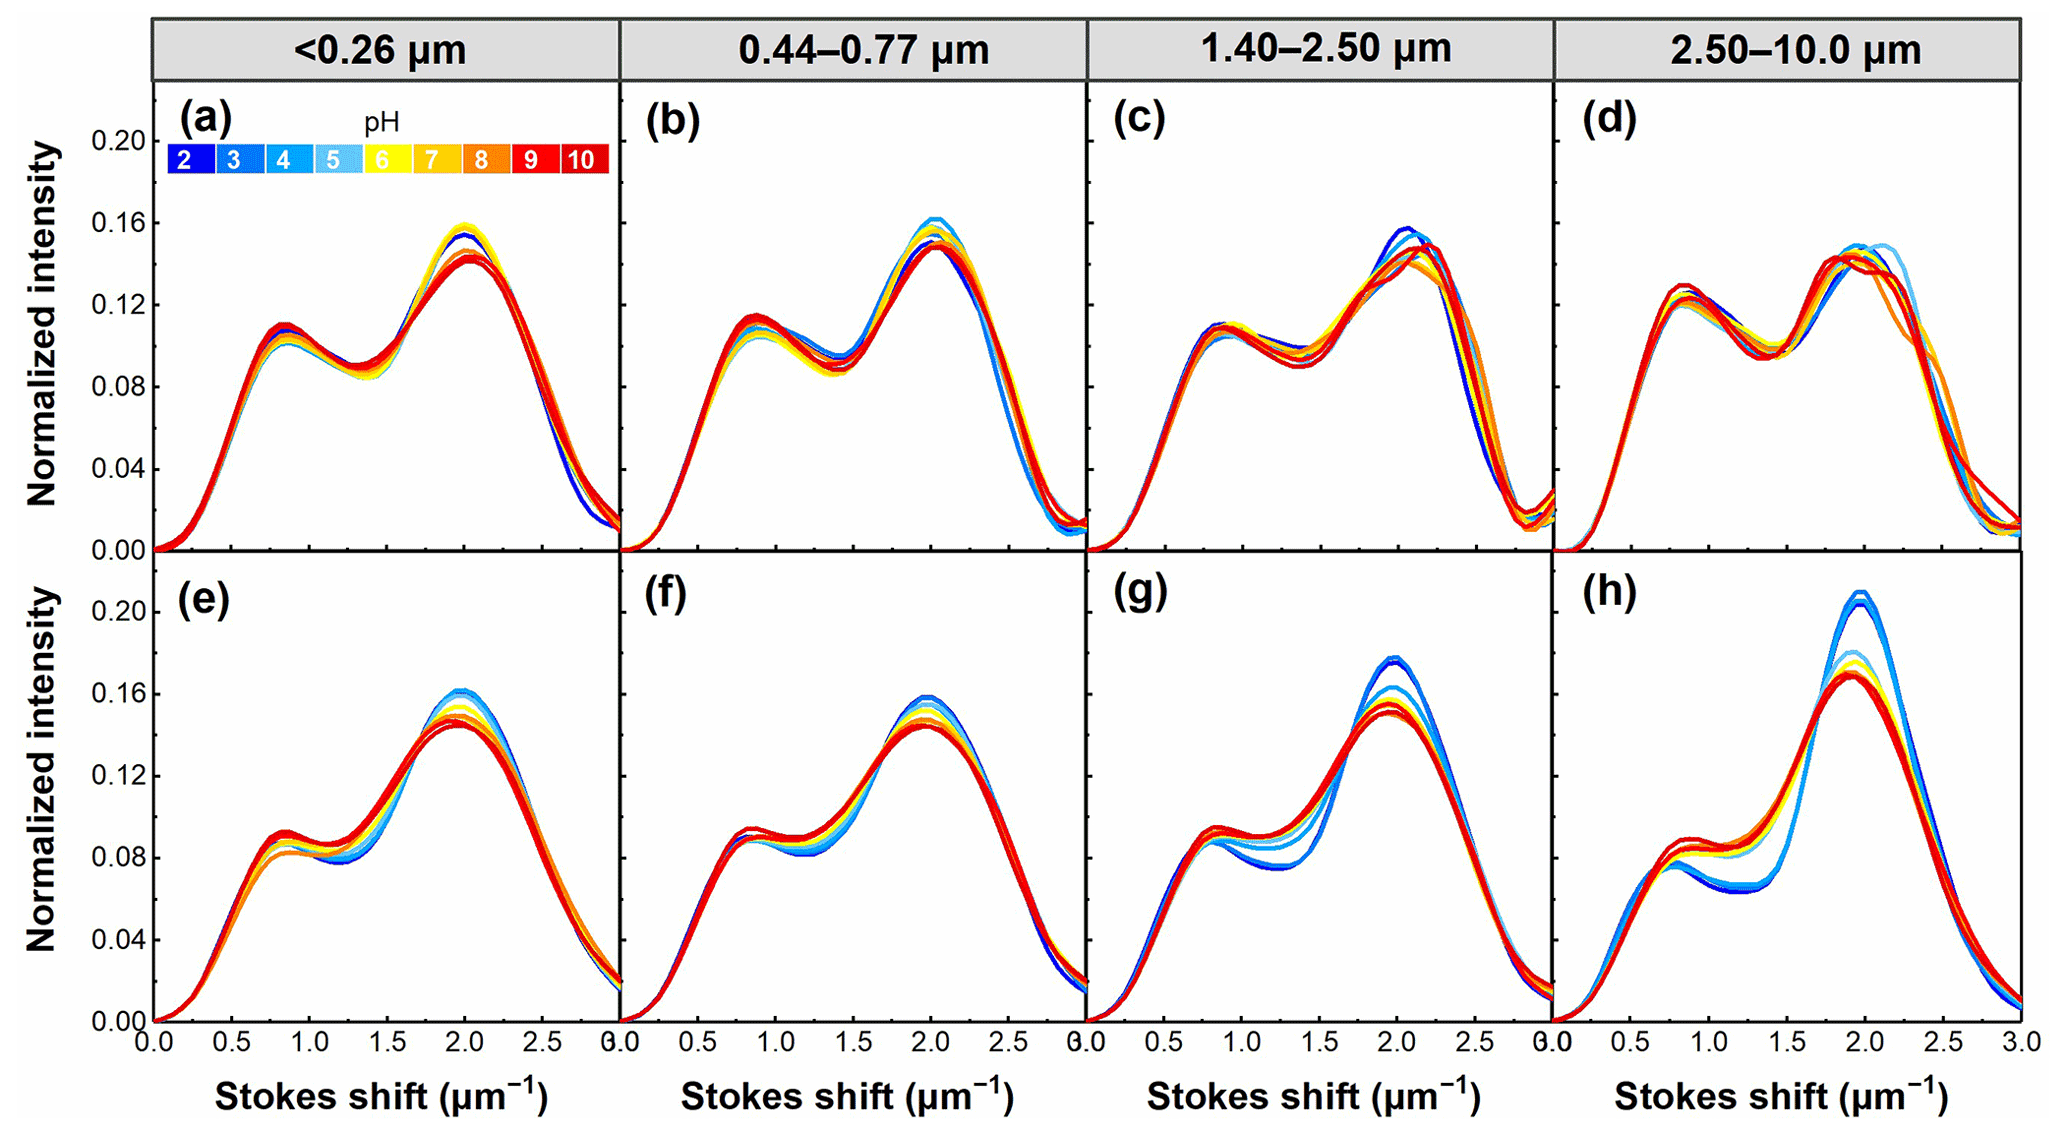
Figure 11pH dependence of the Stokes shift for WSOC in particles of different sizes in summer (a–d) and winter (e–h) in the pH range of 2–10.
In this study, we examined how the chemical structures and optical properties of WSOC were affected by pH and particle size, which varied with season, source, and particle aging. For different particle sizes, higher SUVA254, MAE365, and FI TOC were observed in smaller particles, suggesting the relatively higher aromaticity/molecular weight and more freshness of WSOC in smaller particles. In contrast, WSOC in larger particles underwent a series of degradation reactions during the aging process, leading to reduced aromaticity/molecular weight. The most significant seasonal differences in the optical properties (e.g., SUVA254, MAE365, and FI TOC) were observed for WSOC in the smallest particles (t test, p=0.021), suggesting significant seasonal differences in the sources and chemical structures of WSOC in small particles. WSOC in smaller particles contained more nitrogen-containing compounds with aromatic structures, leading to a stronger light absorption, compared to the case of larger particles. The carboxylic groups tend to be enriched in larger particles (1.40–2.50 µm), whereas the contribution of phenolic groups was the highest in smaller particles (<0.77 µm) and the lowest in larger particles (1.40–2.50 µm), indicating that WSOC with sizes of <0.77 µm was most likely derived from biomass burning, although the contribution from a secondary formation source cannot be completely excluded. For different pH responsive properties, MAE365 generally increased with increasing pH, indicating WSOC had a stronger light absorption capability at high pH, in which smaller particles showed much stronger susceptibility to pH change due to the higher content of aromatic species in their WSOC. Moreover, the FI TOC, Fmax, and AQY showed a peak at a pH of 3 and then significantly decreased with increasing pH. The results of PARAFAC analysis showed that the different fluorescent components showed a similar variation pattern with increasing pH, but the HULIS2 fluorophores were most sensitive to acidity.
The results presented in this study suggest that the chemical characteristics and optical properties of WSOC with different particle sizes can provide information on their sources and atmospheric aging processes. The variation of both MAE365 and AQY of WSOC with increasing pH suggested the enhanced impact of WSOC on climate. Aerosol pH is often acidic, and acidity decreases with increasing particle size (Battaglia et al., 2017; Craig et al., 2018). In this regard, the radiative forcing of WSOC in real atmospheric environments may be overestimated if the effect of pH is not considered, especially for WSOC in smaller particles. For example, aerosol radiative forcing may be overestimated based on an aerosol pH value of 7 instead of those at lower values, such as a pH of 2 (Pandey et al., 2020). The impact of pH on the light absorption properties is stronger for smaller particles, which may represent a pH effect on fresh WSOC, as we previously reported (Y. Qin et al., 2022b). These findings have important implications in applying optical properties for identifying the chemical structures and sources of WSOC and improving the accuracy of assessing the climate effects of WSOC.
| AAE | Absorption Ångström exponent |
| AQY | Apparent quantum yield |
| Δ absorbance (λ) | Difference absorbance spectra |
| BrC | Brown carbon |
| EEM | Three-dimensional excitation–emission matrix |
| FI TOC | Average fluorescence intensity per unit TOC |
| FIm TOC | Average fluorescence intensity per unit TOC at each emission wavelength |
| Fmax | Peak intensities of the fluorescent components |
| FTIR | Fourier transform infrared |
| HULISs | Humic-like substances |
| HULIS1 | More oxygenated humic-like |
| HULIS2 | Less oxygenated humic-like |
| MAE365 | Mass absorption efficiency at a wavelength of 365 nm |
| PARAFAC | Parallel factor analysis |
| RH | Relative humidity |
| R.U. | Raman units |
| SOA | Secondary organic aerosol |
| SUVA254 | UV absorbance at a wavelength of 254 nm |
| TOC | Total organic carbon |
| UV–Vis | Ultraviolet–visible |
| VOCs | Volatile organic compounds |
| WSOC | Water-soluble organic carbon |
The data used in this study are available on the Zenodo data repository platform at https://doi.org/10.5281/zenodo.7067423 (Y. Qin et al., 2022a).
JT and YZ designed the experiments and finalized the article. YQ, JQ, and YG performed the measurements. YQ performed the data analysis and wrote the article with the assistance of KX. XW collected the samples. TQ, XZ, SS, and JL provided useful comments on the article. JG, ZZ, and RC discussed the results.
The contact author has declared that none of the authors has any competing interests.
Publisher's note: Copernicus Publications remains neutral with regard to jurisdictional claims in published maps and institutional affiliations.
The authors thank the editor and anonymous reviewer for their helpful comments.
This research has been supported by the National Natural Science Foundation of China (grant nos. 41675127 and 41975168).
This paper was edited by Irena Grgić and reviewed by one anonymous referee.
Aiona, P. K., Luek, J. L., Timko, S. A., Powers, L. C., Gonsior, M., and Nizkorodov, S. A.: Effect of photolysis on absorption and fluorescence spectra of light-absorbing secondary organic aerosols, ACS Earth. Space. Chem., 2, 235–245, https://doi.org/10.1021/acsearthspacechem.7b00153, 2018.
Ault, A. P.: Aerosol acidity: Novel measurements and implications for atmospheric chemistry, Acc. Chem. Res., 53, 1703–1714, https://doi.org/10.1021/acs.accounts.0c00303, 2020.
Baduel, C., Monge, M. E., Voisin, D., Jaffrezo, J. L., George, C., Haddad, I. E., Marchand, N., and D'Anna, B.: Oxidation of atmospheric humic like substances by ozone: A kinetic and structural analysis approach, Environ. Sci. Technol., 45, 5238–5244, https://doi.org/10.1021/es200587z, 2011.
Battaglia, M. A., Douglas, S., and Hennigan, C. J.: Effect of the urban heat island on aerosol pH, Environ. Sci. Technol., 51, 13095–13103, https://doi.org/10.1021/acs.est.7b02786, 2017.
Boreddy, S. K. R., Hegde, P., and Aswini, A. R.: Chemical characteristics, size distributions, and aerosol liquid water in size-resolved coastal urban aerosols allied with distinct air masses over tropical peninsular India, ACS Earth. Space. Chem., 5, 457–473, https://doi.org/10.1021/acsearthspacechem.0c00282, 2021.
Bousiotis, D., Brean, J., Pope, F. D., Dall'Osto, M., Querol, X., Alastuey, A., Perez, N., Petäjä, T., Massling, A., Nøjgaard, J. K., Nordstrøm, C., Kouvarakis, G., Vratolis, S., Eleftheriadis, K., Niemi, J. V., Portin, H., Wiedensohler, A., Weinhold, K., Merkel, M., Tuch, T., and Harrison, R. M.: The effect of meteorological conditions and atmospheric composition in the occurrence and development of new particle formation (NPF) events in Europe, Atmos. Chem. Phys., 21, 3345–3370, https://doi.org/10.5194/acp-21-3345-2021, 2021.
Cawley, K. M., McKnight, D. M., Miller, P., Cory, R., Fimmen, R. L., Guerard, J., Dieser, M., Jaros, C., Chin, Y. P., and Foreman, C.: Characterization of fulvic acid fractions of dissolved organic matter during ice-out in a hyper-eutrophic, coastal pond in Antarctica, Environ. Res. Lett., 8, 045–015, https://doi.org/10.1088/1748-9326/8/4/045015, 2013.
Chen, Q., Ikemori, F., Higo, H., Asakawa, D., and Mochida, M.: Chemical structural characteristics of HULIS and other fractionated organic matter in urban aerosols: Results from mass spectral and FT-IR analysis, Environ. Sci. Technol., 50, 1721–1730, https://doi.org/10.1021/acs.est.5b05277, 2016a.
Chen, Q., Miyazaki, Y., Kawamura, K., Matsumoto, K., Coburn, S., Volkamer, R., Iwamoto, Y., Kagami, S., Deng, Y., Ogawa, S., Ramasamy, S., Kato, S., Ida, A., Kajii, Y., and Mochida, M.: Characterization of chromophoric water-soluble organic matter in urban, forest, and marine aerosols by HR-ToF-AMS analysis and excitation–emission matrix spectroscopy, Environ. Sci. Technol., 50, 10351–10360, https://doi.org/10.1021/acs.est.6b01643, 2016b.
Chen, Q., Ikemori, F., Nakamura, Y., Vodicka, P., Kawamura, K., and Mochida, M.: Structural and light-absorption characteristics of complex water-insoluble organic mixtures in urban submicrometer aerosols, Environ. Sci. Technol., 51, 8293–8303, https://doi.org/10.1021/acs.est.7b01630, 2017.
Chen, Q., Mu, Z., Song, W., Wang, Y., Yang, Z., Zhang, L., and Zhang, Y. L.: Size-resolved characterization of the chromophores in atmospheric particulate matter from a typical coal-burning city in China, J. Geophys. Res.-Atmos., 124, 10546–10563, https://doi.org/10.1029/2019JD031149, 2019.
Chen, Q., Li, J., Hua, X., Jiang, X., Mu, Z., Wang, M., Wang, J., Shan, M., Yang, X., and Fan, X.: Identification of species and sources of atmospheric chromophores by fluorescence excitation-emission matrix with parallel factor analysis, Sci. Total. Environ., 718, 137322, https://doi.org/10.1016/j.scitotenv.2020.137322, 2020.
Coble, P., Lead, J., Baker, A., Reynolds, D. M., and Spencer, R. (Eds.): Aquatic Organic Matter Fluorescence, Cambridge University Press, New York, USA, https://doi.org/10.1017/CBO9781139045452, 2014.
Colthup, N. B., Daly, L. H., and Wiberley, S. E. (Eds.): Introduction to Infrared and Raman Spectroscopy, Academic press, New York and London, https://doi.org/10.1016/B978-0-08-091740-5.50003-X, 1990.
Craig, R. L., Peterson, P. K., Nandy, L., Lei, Z., Hossain, M. A., Camarena, S., Dodson, R. A., Cook, R. D., Dutcher, C. S., and Ault, A. P.: Direct determination of aerosol pH: Size-resolved measurements of submicrometer and supermicrometer aqueous particles, Anal. Chem., 90, 11232–11239, https://doi.org/10.1021/acs.analchem.8b00586, 2018.
Deshmukh, D. K., Kawamura, K., Lazaar, M., Kunwar, B., and Boreddy, S. K. R.: Dicarboxylic acids, oxoacids, benzoic acid, α-dicarbonyls, WSOC, OC, and ions in spring aerosols from Okinawa Island in the western North Pacific Rim: size distributions and formation processes, Atmos. Chem. Phys., 16, 5263–5282, https://doi.org/10.5194/acp-16-5263-2016, 2016.
Dryer, D. J., Korshin, G. V., and Fabbricino, M.: In situ examination of the protonation behavior of fulvic acids using differential absorbance spectroscopy, Environ. Sci. Technol., 42, 6644–6649, https://doi.org/10.1021/es800741u, 2008.
Duarte, R. M. B. O., Pio, C. A., and Duarte, A. C.: Spectroscopic study of the water-soluble organic matter isolated from atmospheric aerosols collected under different atmospheric conditions, Anal. Chim. Acta, 530, 7–14, https://doi.org/10.1016/j.aca.2004.08.049, 2005.
Duarte, R. M. B. O., Santos, E. B. H., Pio, C. A., and Duarte, A. C.: Comparison of structural features of water-soluble organic matter from atmospheric aerosols with those of aquatic humic substances, Atmos. Environ., 41, 8100–8113, https://doi.org/10.1016/j.atmosenv.2007.06.034, 2007.
Fan, X., Cao, T., Yu, X., Wang, Y., Xiao, X., Li, F., Xie, Y., Ji, W., Song, J., and Peng, P.: The evolutionary behavior of chromophoric brown carbon during ozone aging of fine particles from biomass burning, Atmos. Chem. Phys., 20, 4593–4605, https://doi.org/10.5194/acp-20-4593-2020, 2020.
Frka, S., Grgiæ, I., Turiè, J., Gini, M. I., and Eleftheriadis, K.: Seasonal variability of carbon in humic-like matter of ambient size-segregated water soluble organic aerosols from urban background environment, Atmos. Environ., 173, 239–247, https://doi.org/10.1016/j.atmosenv.2017.11.013, 2018.
Frka, S., Šala, M., Brodnik, H., Štefane, B., Krofliè, A., and Grgiæ, I.: Seasonal variability of nitroaromatic compounds in ambient aerosols: Mass size distribution, possible sources and contribution to water-soluble brown carbon light absorption, Chemosphere, 299, 134381, https://doi.org/10.1016/j.chemosphere.2022.134381, 2022.
Fu, P., Kawamura, K., Chen, J., Qin, M., Ren, L., Sun, Y., Wang, Z., Barrie, L. A., Tachibana, E., and Ding, A.: Fluorescent water-soluble organic aerosols in the High Arctic atmosphere, Sci. Rep.-UK, 5, 9845, https://doi.org/10.1038/srep09845, 2015.
Ge, M., Tong, S., Wang, W., Zhang, W., Chen, M., Peng, C., Li, J., Zhou, L., Chen, Y., and Liu, M.: Important oxidants and their impact on the environmental effects of aerosols, J. Phys. Chem. A., 125, 3813–3825, https://doi.org/10.1021/acs.jpca.0c10236, 2021.
Geng, X., Mo, Y., Li, J., Zhong, G., Tang, J., Jiang, H., Ding, X., Malik, R. N., and Zhang, G.: Source apportionment of water-soluble brown carbon in aerosols over the northern South China Sea: Influence from land outflow, SOA formation and marine emission, Atmos. Environ., 229, 117484, https://doi.org/10.1016/j.atmosenv.2020.117484, 2020.
Horník, Š., Sýkora, J., Pokorná, P., Vodièka, P., Schwarz, J., and Dímal, V.: Detailed NMR analysis of water-soluble organic compounds in size-resolved particulate matter seasonally collected at a suburban site in Prague, Atmos. Environ., 267, 118757, https://doi.org/10.1016/j.atmosenv.2021.118757, 2021.
Hu, B., Wang, P., Wang, C., Qian, J., Bao, T., and Shi, Y.: Investigating spectroscopic and copper-binding characteristics of organic matter derived from sediments and suspended particles using EEM-PARAFAC combined with two-dimensional fluorescence/FTIR correlation analyses, Chemosphere, 219, 45–53, https://doi.org/10.1016/S1352-2310(02)00654-4, 2019.
Huang, S., Luo, Y., Wang, X., Zhang, T., Lei, Y., Zeng, Y., Sun, J., Che, H., Xu, H., Cao, J., and Shen, Z.: Optical properties, chemical functional group, and oxidative activity of different polarity levels of water-soluble organic matter in PM2.5 from biomass and coal combustion in rural areas in Northwest China, Atmos. Environ., 283, 119179, https://doi.org/10.1016/j.atmosenv.2022.119179, 2022.
Huo, S., Xi, B., Yu, H., He, L., and Fan, S.: Characteristics of dissolved organic matter (DOM) in leachate with different landfill ages, J. Environ. Sci., 20, 492–498, https://doi.org/10.1016/S1001-0742(08)62085-9, 2008.
Jane, S. F., Winslow, L. A., Remucal, C. K., and Rose, K. C.: Long-term trends and synchrony in dissolved organic matter characteristics in Wisconsin, USA, lakes: quality, not quantity, is highly sensitive to climate, J. Geophys. Res.-Biogeo., 122, 546–561, https://doi.org/10.1002/2016JG003630, 2017.
Jang, K. S., Choi, A. Y., Choi, M., Kang, H., Kim, T. W., and Park, K. T.: Size-segregated chemical compositions of HULISs in ambient aerosols collected during the winter season in Songdo, South Korea, Atmosphere, 10, 226, https://doi.org/10.3390/atmos10040226, 2019.
Korshin, G. V., Li, C. W., and Benjamin, M. M.: The decrease of UV absorbance as an indicator of TOX formation, Water Res., 31, 946–949, https://doi.org/10.1016/S0043-1354(96)00393-4, 1997.
Kuang, Y., Shang, J., and Chen, Q.: Effect of ozone aging on light absorption and fluorescence of brown carbon in soot particles: The important role of polycyclic aromatic hydrocarbons, J. Hazard. Mater., 413, 125406, https://doi.org/10.1016/j.jhazmat.2021.125406, 2021.
Laskin, A., Laskin, J., and Nizkorodov, S. A.: Chemistry of atmospheric brown carbon, Chem. Rev., 115, 4335–4382, https://doi.org/10.1021/cr5006167, 2015.
Lin, P., Aiona, P. K., Li, Y., Shiraiwa, M., Laskin, J., Nizkorodov, S. A., and Laskin, A.: Molecular characterization of brown carbon in biomass burning aerosol particles, Environ. Sci. Technol., 50, 11815–11824, https://doi.org/10.1021/acs.est.6b03024, 2016.
Liu, S., Benedetti, M. F., Han, W., and Korshin, G. V.: Comparison of the properties of standard soil and aquatic fulvic and humic acids based on the data of differential absorbance and fluorescence spectroscopy, Chemosphere., 261, 128189, https://doi.org/10.1016/j.chemosphere.2020.128189, 2020.
Ma, L., Li, Z., Li, B., Fu, D., Sun, X., Sun, S., Lu, L., Jiang, J., Meng, F., Qi, H., and Zhang, R.: Light-absorption and fluorescence fingerprinting characteristics of water and methanol soluble organic compounds in PM2.5 in cold regions of Northeast China, Sci. Total. Environ., 832, 155081, https://doi.org/10.1016/j.scitotenv.2022.155081, 2022.
Mo, Y., Li, J., Liu, J., Zhong, G., Cheng, Z., Tian, C., Chen, Y., and Zhang, G.: The influence of solvent and pH on determination of the light absorption properties of water-soluble brown carbon, Atmos. Environ., 161, 90–98, https://doi.org/10.1016/j.atmosenv.2017.04.037, 2017.
Mu, S., Wang, S., Liang, S., Xiao, K., Fan, H., Han, B., Liu, C., Wang, X., and Huang, X.: Effect of the relative degree of foulant “hydrophobicity” on membrane fouling, J. Membr. Sci., 570, 1–8, https://doi.org/10.1016/j.memsci.2018.10.023, 2019.
Pandey, A., Hsu, A., Tiwari, S., Pervez, S., and Chakrabarty, R. K.: Light absorption by organic aerosol emissions rivals that of black carbon from residential biomass fuels in South Asia, Environ. Sci. Technol. Lett., 7, 266–272, https://doi.org/10.1021/acs.estlett.0c00058, 2020.
Park, S., Cho, S. Y., and Bae, M. S.: Source identification of water-soluble organic aerosols at a roadway site using a positive matrix factorization analysis, Sci. Total. Environ., 533, 410–421, https://doi.org/10.1016/j.scitotenv.2015.07.004, 2015.
Phillips, S. M., Bellcross, A. D., and Smith, G. D.: Light absorption by brown carbon in the Southeastern United States is pH-dependent, Environ. Sci. Technol., 51, 6782–6790, https://doi.org/10.1021/acs.est.7b01116, 2017.
Qin, J., Zhang, L., Zhou, X., Duan, J., Mu, S., Xiao, K., Hu, J., and Tan, J.: Fluorescence fingerprinting properties for exploring water-soluble organic compounds in PM2.5 in an industrial city of northwest China, Atmos. Environ., 184, 203–211, https://doi.org/10.1016/j.atmosenv.2018.04.049, 2018.
Qin, J., Tan, J., Zhou, X., Yang, Y., Qin, Y., Wang, X., Shi, S., Xiao, K., and Wang, X.: Measurement report: Particle-size-dependent fluorescence properties of water-soluble organic compounds (WSOCs) and their atmospheric implications for the aging of WSOCs, Atmos. Chem. Phys., 22, 465–479, https://doi.org/10.5194/acp-22-465-2022, 2022.
Qin, Y., Yang, Y., Qin, J., Zhang, L., Guo, S., Zhou, X., Chen, R., Tan, J., Xiao, K., and Wang, X.: pH-responsive fluorescence EEM to titrate the interaction between fluorophores and acid/base groups in water-soluble organic compounds of PM2.5, Environ. Sci. Technol. Lett., 8, 108–113, https://doi.org/10.1021/acs.estlett.0c00645, 2021.
Qin, Y., Qin, J., Wang, X., Xiao, K., Qi, T., Gao, Y., Zhou, X., Shi, S., Li, J., Gao, J., Zhang, Z., Tan, J., Zhang, Y., and Chen, R.: Measurement Report: Investigation of pH- and particle-size-dependent chemical and optical properties of water-soluble organic carbon: implications for its sources and aging processes, Zenodo [data set], https://doi.org/10.5281/zenodo.7067423, 2022a.
Qin, Y., Qin, J., Zhou, X., Yang, Y., Chen, R., Tan, J., Xiao, K., and Wang, X.: Effects of pH on light absorption properties of water-soluble organic compounds in particulate matter emitted from typical emission sources, J. Hazard. Mater., 424, 127688, https://doi.org/10.1016/j.jhazmat.2021.127688, 2022b.
Sannigrahi, P., Sullivan, A. P., Weber, R. J., and Ingall, E. D.: Characterization of water-soluble organic carbon in urban atmospheric aerosols using solid-state 13C NMR spectroscopy, Environ. Sci. Technol., 40, 666–672, https://doi.org/10.1021/es051150i, 2006.
Schendorf, T. M., Del Vecchio, R., Bianca, M., and Blough, N. V.: Combined effects of pH and borohydride reduction on the optical properties of humic substances (HS): A comparison of optical models, Environ. Sci. Technol., 53, 6310–6319, https://doi.org/10.1021/acs.est.9b01516, 2019.
Schulman, S. G., Winefordner, J. D., and Kolthoff, I. M. (Eds.): Molecular Luminescence Spectroscopy: Methods and Applications, Wiley, New York, 1985.
Snyder, D. C., Rutter, A. P., Collins, R., Worley, C., and Schauer, J. J.: Insights into the origin of water soluble organic carbon in atmospheric fine particulate matter, Aerosol Sci. Technol., 43, 1099–1107, https://doi.org/10.1080/02786820903188701, 2009.
Sun, Y., Zhang, Q., Zheng, M., Ding, X., Edgerton, E. S., and Wang, X.: Characterization and source apportionment of water-soluble organic matter in atmospheric fine particles (PM2.5) with high-resolution aerosol mass spectrometry and GC–MS, Environ. Sci. Technol., 45, 4854–4861, https://doi.org/10.1021/es200162h, 2011.
Timonen, H., Saarikoski, S., Tolonen-Kivimäki, O., Aurela, M., Saarnio, K., Petäjä, T., Aalto, P. P., Kulmala, M., Pakkanen, T., and Hillamo, R.: Size distributions, sources and source areas of water-soluble organic carbon in urban background air, Atmos. Chem. Phys., 8, 5635–5647, https://doi.org/10.5194/acp-8-5635-2008, 2008.
Wang, L., Wang, Y., Li, Y., Zhang, W., Zhang, H., Niu, L., and Habibul, N.: Benthic biofilm bacterial communities and their linkage with water-soluble organic matter in effluent receivers, Int. J. Environ., 19, 1994, https://doi.org/10.3390/ijerph19041994, 2022.
Wang, X. M. and Waite, T. D.: Role of gelling soluble and colloidal microbial products in membrane fouling, Environ. Sci. Technol., 43, 9341–9347, https://doi.org/10.1021/es9013129, 2009.
Wang, Y., Hu, M., Wang, Y., Zheng, J., Shang, D., Yang, Y., Liu, Y., Li, X., Tang, R., Zhu, W., Du, Z., Wu, Y., Guo, S., Wu, Z., Lou, S., Hallquist, M., and Yu, J. Z.: The formation of nitro-aromatic compounds under high NOx and anthropogenic VOC conditions in urban Beijing, China, Atmos. Chem. Phys., 19, 7649–7665, https://doi.org/10.5194/acp-19-7649-2019, 2019.
Wu, C., Zhu, B., Liang, W., Ruan, T., and Jiang, G.: Molecular characterization of nitrogen-containing organic compounds in fractionated atmospheric humic-like substances (HULIS) and its relationship with optical properties, Sci. Total. Environ., 832, 155043, https://doi.org/10.1016/j.scitotenv.2022.155043, 2022.
Wu, G., Wan, X., Gao, S., Fu, P., Yin, Y., Li, G., Zhang, G., Kang, S., Ram, K., and Cong, Z.: Humic-like substances (HULIS) in aerosols of central Tibetan Plateau (Nam Co, 4730 m asl): Abundance, light absorption properties, and sources, Environ. Sci. Technol., 52, 7203–7211, https://doi.org/10.1021/acs.est.8b01251, 2018.
Wu, G., Fu, P., Ram, K., Song, J., Chen, Q., Kawamura, K., Wan, X., Kang, S., Wang, X., Laskin, A., and Cong, Z.: Fluorescence characteristics of water-soluble organic carbon in atmospheric aerosol, Environ. Pollut., 268, 115906, https://doi.org/10.1016/j.envpol.2020.115906, 2021.
Wu, J., Zhang, H., He, P. J., and Shao, L. M.: Insight into the heavy metal binding potential of dissolved organic matter in MSW leachate using EEM quenching combined with PARAFAC analysis, Water Res., 45, 1711–1719, https://doi.org/10.1016/j.watres.2010.11.022, 2011.
Xiang, P., Zhou, X., Duan, J., Tan, J., and He, K.: Chemical characteristics of water-soluble organic compounds (WSOC) in PM2.5 in Beijing, China: 2011–2012, Atmos. Res., 183, 104–112, https://doi.org/10.1016/j.atmosres.2016.08.020, 2017.
Xiao, K., Shen, Y. X., Liang, S., Liang, P., Wang, X. M., and Huang, X.: A systematic analysis of fouling evolution and irreversibility behaviors of MBR supernatant hydrophilic/hydrophobic fractions during microfiltration, J. Membr. Sci., 467, 206–216, https://doi.org/10.1016/j.memsci.2014.05.030, 2014.
Xiao, K., Liang, S., Xiao, A., Lei, T., Tan, J., Wang, X., and Huang, X.: Fluorescence quotient of excitation–emission matrices as a potential indicator of organic matter behavior in membrane bioreactors, Environ. Sci. Water Res. Technol., 4, 281–290, https://doi.org/10.1039/C7EW00270J, 2018a.
Xiao, K., Shen, Y., Sun, J., Liang, S., Fan, H., Tan, J., Wang, X., Huang, X., and Waite, T. D.: Correlating fluorescence spectral properties with DOM molecular weight and size distribution in wastewater treatment systems, Environ. Sci. Water Res. Technol., 4, 1933–1943, https://doi.org/10.1039/C8EW00504D, 2018b.
Xiao, K., Han, B., Sun, J., Tan, J., Yu, J., Liang, S., Shen, Y., and Huang, X.: Stokes shift and specific fluorescence as potential indicators of organic matter hydrophobicity and molecular weight in membrane bioreactors, Environ. Sci. Technol., 53, 8985–8993, https://doi.org/10.1021/acs.est.9b02114, 2019.
Xiao, K., Yu, J., Wang, S., Du, J., Tan, J., Xue, K., Wang, Y., and Huang, X.: Relationship between fluorescence excitation-emission matrix properties and the relative degree of DOM hydrophobicity in wastewater treatment effluents, Chemosphere., 254, 126830, https://doi.org/10.1016/j.chemosphere.2020.126830, 2020.
Yang, Y., Qin, J., Qi, T., Zhou, X., Chen, R., Tan, J., Xiao, K., Ji, D., He, K., and Chen, X.: Fluorescence characteristics of particulate water-soluble organic compounds emitted from coal-fired boilers, Atmos. Environ., 223, 117297, https://doi.org/10.1016/j.atmosenv.2020.117297, 2020.
Young, T. R., Li, W., Guo, A., Korshin, G. V., and Dodd, M. C.: Characterization of disinfection byproduct formation and associated changes to dissolved organic matter during solar photolysis of free available chlorine, Water Res., 146, 318–327, https://doi.org/10.1016/j.watres.2018.09.022, 2018.
Yu, J., Yu, G. H., Park, S., and Bae, M. S.: Chemical and absorption characteristics of water-soluble organic carbon and humic-like substances in size-segregated particles from biomass burning emissions, Asian J. Atmos. Environ., 11, 96–106, https://doi.org/10.5572/ajae.2017.11.2.096, 2017.
Zhang, T., Shen, Z., Zeng, Y., Cheng, C., Wang, D., Zhang, Q., Lei, Y., Zhang, Y., Sun, J., Xu, H., Ho, S. S. H., and Cao, J.: Light absorption properties and molecular profiles of HULIS in PM2.5 emitted from biomass burning in traditional “Heated Kang” in Northwest China, Sci. Total. Environ., 776, 146014–146022, https://doi.org/10.1016/j.scitotenv.2021.146014, 2021.
Zhang, T., Huang, S., Wang, D., Sun, J., Zhang, Q., Xu, H., Hang Ho, S. S., Cao, J., and Shen, Z.: Seasonal and diurnal variation of PM2.5 HULIS over Xi'an in Northwest China: Optical properties, chemical functional group, and relationship with reactive oxygen species (ROS), Atmos. Environ., 268, 118782, https://doi.org/10.1016/j.atmosenv.2021.118782, 2022.
Zhang, Y., Wei, D., Huang, R., Yang, M., Zhang, S., Dou, X., Wang, D., and Vimonses, V.: Binding mechanisms and QSAR modeling of aromatic pollutant biosorption on Penicillium oxalicum biomass, Chem. Eng. J., 166, 624–630, https://doi.org/10.1016/j.cej.2010.11.034, 2011.