the Creative Commons Attribution 4.0 License.
the Creative Commons Attribution 4.0 License.
 | 26 Oct 2022
Sources of surface O3 in the UK: tagging O3 within WRF-Chem
Johana Romero-Alvarez
Aurelia Lupaşcu
Douglas Lowe
Alba Badia
Scott Archer-Nicholls
Steve Dorling
Claire E. Reeves
Tim Butler
Tropospheric ozone (O3) concentrations depend on a combination of hemispheric, regional, and local-scale processes. Estimates of how much O3 is produced locally vs. transported from further afield are essential in air quality management and regulatory policies. Here, a tagged-ozone mechanism within the Weather Research and Forecasting model coupled with chemistry (WRF-Chem) is used to quantify the contributions to surface O3 in the UK from anthropogenic nitrogen oxide (NOx) emissions from inside and outside the UK during May–August 2015. The contribution of the different source regions to three regulatory O3 metrics is also examined. It is shown that model simulations predict the concentration and spatial distribution of surface O3 with a domain-wide mean bias of −3.7 ppbv. Anthropogenic NOx emissions from the UK and Europe account for 13 % and 16 %, respectively, of the monthly mean surface O3 in the UK, as the majority (71 %) of O3 originates from the hemispheric background. Hemispheric O3 contributes the most to concentrations in the north and the west of the UK with peaks in May, whereas European and UK contributions are most significant in the east, south-east, and London, i.e. the UK's most populated areas, intensifying towards June and July. Moreover, O3 from European sources is generally transported to the UK rather than produced in situ. It is demonstrated that more stringent emission controls over continental Europe, particularly in western Europe, would be necessary to improve the health-related metric MDA8 O3 above 50 and 60 ppbv. Emission controls over larger areas, such as the Northern Hemisphere, are instead required to lessen the impacts on ecosystems as quantified by the AOT40 metric.
- Article
(8072 KB) - Full-text XML
-
Supplement
(2639 KB) - BibTeX
- EndNote


Tropospheric ozone (O3) is a pollutant of concern for policy-makers because of its detrimental effects on human health, agriculture, and ecosystems (Fuhrer, 2009; WHO, 2016). Near ground level, O3 has a typical atmospheric lifetime of a few hours. In the free troposphere, however, the lifetime can be up to several weeks (Stevenson et al., 2006), and O3 can be transported from its point of production downwind over long distances crossing countries and continents (Wild et al., 2004; HTAP, 2010). The concentration of O3 at a given location is therefore dictated by a combination of hemispheric, regional, and local-scale factors (Jenkin, 2008). Examples of this are long-range transport of O3 and its precursors, including stratospheric intrusions, and photochemical reactions happening on a local and regional scale (e.g. Monks, 2000; HTAP, 2010).
The production of O3 in the troposphere is highly non-linear. It depends on the abundance of nitrogen oxides (NOx= NO2+ NO) and peroxy radicals (HO2) produced after the oxidation of volatile organic compounds (VOCs) by hydroxyl radicals (OH) (Monks, 2005). The reaction of NO with HO2 and the subsequent photolysis of NO2 generating O3 constitute the primary known mechanism of O3 production (Atkinson, 2000; Monks, 2005). NOx concentrations determine whether O3 is produced or chemically removed (Monks, 2005). In the rural areas of most industrialized countries, where NOx is available at moderate levels, the rate of O3 formation increases with increasing NOx concentrations (NOx-limited regime). In more polluted areas, by contrast, high NOx concentrations inhibit O3 formation as this begins being depleted by NO (NOx titration effect). Subsequent formation of nitric acid (HNO3) from the reaction of NO2 with OH constitutes a major endpoint for O3 in such environments (Monks, 2005). However, elevated inputs of non-methane VOCs (NMVOCs) can increase the production of O3 as the reaction of VOCs with OH radicals become more significant (NOx-saturated regime).
Furthermore, O3 concentrations also depend on O3 deposition; uptake by vegetation; and meteorological variables such as temperature, winds (direction and speed), solar radiation intensity, and precipitation (e.g. Sillman, 1999; Coyle et al., 2002). For instance, high-O3-concentration episodes in the UK have been associated with heatwave periods (Finch and Palmer, 2020). The contribution of each process varies with location. Remote sites are largely controlled by hemispheric background O3 (Pilling et al., 2009). Photochemical pollution episodes, on the other hand, are more severe in the south and east of the UK, and O3 titration by NOx is higher in urban areas (Jenkin, 2008).
In the UK, tighter UK and European precursor emission controls in the last 30 years have led to a substantial decrease in the concentration of O3 primary precursors and successfully reduced the severity of the high-O3-concentration episodes (Pilling et al., 2009; Derwent et al., 2018; Finch and Palmer, 2020). Even so, exposure to surface O3 continues to cause considerable damage to human health in Europe and the UK, leading to an estimated 17 000 premature deaths in 2015 (EEA, 2017). Evidence suggests that annual mean O3 concentrations in the UK have been increasing in urban and suburban areas and to a lesser extent in rural areas (Jenkin, 2008; Pilling et al., 2009; Munir et al., 2013; Finch and Palmer, 2020). Reductions in NOx emissions, mainly by road traffic, have led to reductions in the O3 scavenging in urban areas so that O3 concentrations have generally increased (Finch and Palmer, 2020). The increase in rural areas, on the other hand, has been largely driven by rising hemispheric O3 levels, up to +0.31 ppbv a year over the 20-year 1987–2007 period (Derwent et al., 2007) and +0.25 ppbv a year over the 25-year period (Derwent et al., 2013). Accordingly, increasing emissions of precursors in Asia and North America influence O3 concentrations entering Europe from the North Atlantic, offsetting the effects of European regional emission reductions on O3 (HTAP, 2010; Derwent et al., 2018). Therefore, efficient emission control policies aimed at reducing O3 concentration in a given region require a holistic assessment of both O3 transport from outside the region and in situ O3 production. Such quantitative estimations can be made by applying source–receptor methods (S–R) within chemical transport models (CTMs).
S–R studies often compare model simulations that include all anthropogenic emissions with those obtained after modifying emissions from a region of interest (the so-called perturbation approach). However, as O3 chemistry is highly non-linear, this approach can lead to unrealistic attribution estimates; e.g. Emmons et al. (2012) underestimated the O3 contribution by up to a factor of 4 when perturbing NO emissions by 20 %. Tagged-ozone methods, on the other hand, use additional diagnostics to follow the reaction of different emissions to the formation of O3, making the approach suited to investigating the contribution of different precursors (Emmons et al., 2012; Grewe et al., 2012; Butler et al., 2018).
Several studies have investigated the contribution of intercontinental transport to O3 in Europe, in particular from North America and Asia, using different modelling techniques (e.g. Li, 2002; Derwent et al., 2004; Auvray and Bey, 2005; Sudo and Akimoto, 2007; Derwent et al., 2008; Emmons et al., 2012; Derwent et al., 2015; Mertens et al., 2018; Butler et al., 2018; Lupaşcu and Butler, 2019; Butler et al., 2020). However, these studies do not provide a quantitative estimate of the contribution of the different source regions to the total amount of O3 over the UK at a regional scale but rather an estimate at a national scale or at individual locations across Europe or for the European region as a whole.
The present study quantifies the contributions to surface O3 in 12 receptor regions in the UK from anthropogenic NOx emissions from inside and outside the UK using the tagged-ozone method developed in Lupaşcu and Butler (2019). Dividing the UK into several regions serves to separate meteorological features and chemical environments that are known to impact the spatial distribution and temporal variation in air pollutants such as O3 (Coyle et al., 2002; Jenkin, 2008). We focus on summer 2015, which saw several heatwaves causing elevated O3 values in central and western Europe that exceeded the European Union (EU) information threshold of a 1 h average mixing ratio of 90 ppbv (Tarrason et al., 2016). We also look at the impact of O3 on human exposure, crops, and vegetation using two well-known O3 metrics, the MDA8 and the AOT40. The MDA8 is a health-related metric commonly used to assess the impacts of O3 exposure on the population (e.g. Reidmiller et al., 2009; Stock et al., 2013; Mar et al., 2016). The metric is defined as the maximum daily 8 h average (MDA8) O3 values (in ppbv) and is strongly influenced by photochemical episodes (Pilling et al., 2009). The AOT40 (accumulated O3 above a threshold of 40 ppbv) is commonly used to assess the effects of O3 on crops and vegetation and is based on exposure over 40 ppbv using only the 1 h values measured during daylight hours.
The Weather Research and Forecasting model coupled with chemistry (WRF-Chem) settings, including an introduction to the tagging approach and a summary of the model evaluation for NO, NO2, and O3, are presented in Sect. 2. Model evaluation is discussed in detail in the Supplement. Results for the contributions of UK and European precursor emissions, along with transport across the lateral model boundaries to surface O3 in the UK, are presented and discussed in Sect. 3. Section 4 summarizes our findings.
We used the Weather Research and Forecasting model (WRF) version 3.7.1 (Powers et al., 2017) coupled with chemistry (WRF-Chem) (Grell et al., 2005). The model domain was centred at 53∘ N, 3∘ E, covering most of Europe, as shown in Fig. 1a. The spatial resolution was set to 27 km × 27 km, with 35 vertical levels starting from the surface up to 10 hPa.

Figure 1Source regions and receptors: (a) division of domain into nine source regions. Note that the Rest_Eu source region also includes ship emissions from the Atlantic, Mediterranean, and Baltic Sea, whilst emissions from shipping routes in the North Sea and the English Channel are tagged as NOS. The blue line surrounding the domain indicates the lateral-boundaries (LB) tag. (b) Map of the UK showing the receptor regions.
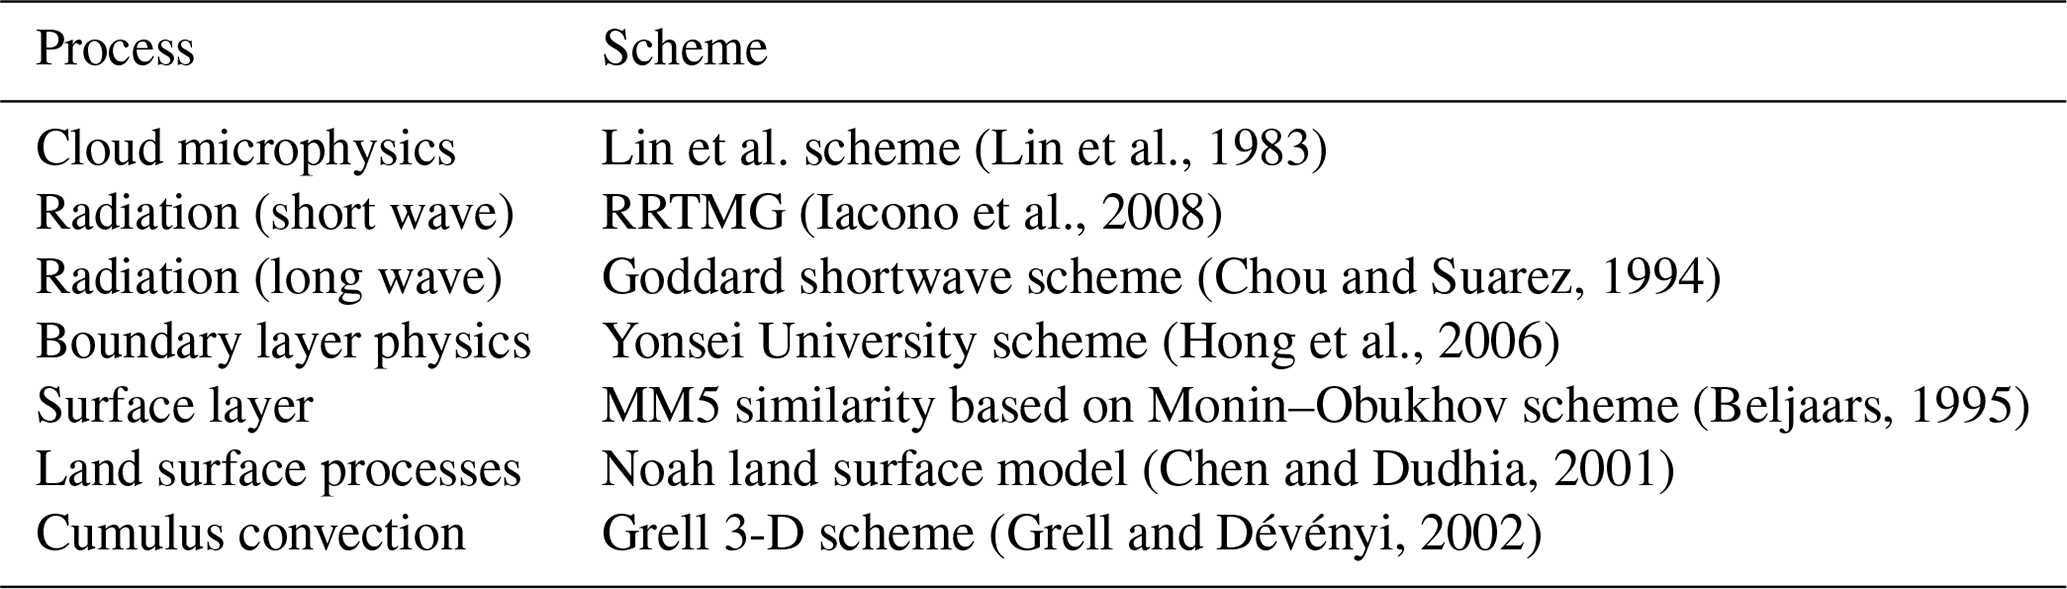
The initial and boundary conditions (ICs and BCs, respectively) for meteorology were obtained from the ERA-Interim reanalysis dataset (Dee et al., 2011), which has a spatial grid resolution of 0.75∘ × 0.75∘ and 6 h temporal resolution. ICs and BCs for the chemistry fields were extracted from global simulations produced by the Model for Ozone and Related chemical Tracers (MOZART-4) Goddard Earth Observing System-5 (GEOS-5) (Emmons et al., 2010). BCs were ingested into the model every 3 h. The schemes used to parameterize the atmospheric processes are listed in Table 1. These are the same schemes deployed in Mar et al. (2016) to evaluate meteorology, O3, and NOx fields in a European domain using the MOZART-4 chemical mechanism.
Simulations were conducted for the period between 24 April and 31 August 2015 for gas-phase chemistry using a tagged-ozone mechanism based on the MOZART-4 chemical scheme. Note that omission of heterogeneous chemistry can lead to overestimation of NO2 due to the absence of aerosol nitrate formation through the reaction of OH + NO2 as well as N2O5 hydrolysis, which represents an important sink for NO2 (Badia and Jorba, 2015; Archer-Nicholls et al., 2014; Stone et al., 2014). The first week of output was treated as model spin-up and hence discarded. The meteorology was not nudged but re-started every 3 d as in the methodology adopted in the second phase of the Air Quality Model Evaluation International Initiative (AQMEII) (e.g. Im et al., 2014). This decision was made after a test analysis showed that nudging of winds above the planetary boundary layer (PBL) and temperature at all layers, as done in Mar et al. (2016), leads to a representation of hourly NO2 and O3 mixing ratios in the East Anglia region (in the east of the UK) that is inconsistent with observations. The nudging simulation predicted shallower boundary layers compare with that obtained using the re-starting method, particularly over the Norfolk coast, leading to high concentrations of NO2, especially at nighttime, and larger O3 lost due to increased dry deposition. Anthropogenic emissions of carbon monoxide (CO), NOx, sulfur dioxide (SO2), and total NMVOCs for the European domain, including shipping lanes, were taken from the TNO-MACC-III European inventory (Kuenen et al., 2014) for the year 2011. The emissions were provided as yearly totals (kg yr−1) by source sector following the SNAP (selected nomenclature for sources of air pollution) convention at a 0.125∘ × 0.0625∘ longitude-latitude resolution. For the UK domain, emissions were taken from the UK National Atmospheric Emissions Inventory (NAEI) for the year 2014, http://naei.beis.gov.uk/ (last access: 20 January 2022), which has a spatial resolution of 1 km × 1 km. Biogenic emissions were calculated online using the Model of Emissions of Gases and Aerosols from Nature (MEGAN) version 2.04 (Guenther et al., 2012).
2.1 O3 tagging mechanism
The contribution of hemispheric O3 and domestic and European anthropogenic emissions to tropospheric O3 in the UK is studied using the O3 tagging technique developed in Lupaşcu and Butler (2019), in which O3 molecules are labelled according to the identity of their source regions. This is achieved by tagging NOx emissions at selected source regions and tracking them through the formation of O3, including the recycling of NOx via the production of odd nitrogen species (e.g. peroxyacetyl nitrate (PAN), nitric acid (HNO3), and organic nitrates).
To implement the tagging method, a new chemical mechanism was created, “mozart_tag_kpp (chemopt = 113)”, containing the original chemical reactions in the MOZART-4 mechanism plus a duplicated set of reactions with additional tracers accounting for the source regions of interest. See Appendix A in Lupaşcu and Butler (2019) for a list of the model's edits to accommodate the new mechanism in WRF-Chem. The present study uses different sources and receptor regions. Furthermore, it does not attribute the contributions from the lateral boundary to any specific geographical location (e.g. the Task Force on Hemispheric Transport of Air Pollution, TF HTAP regions) as in Lupaşcu and Butler (2019). Instead, the lateral boundary is tagged as a single source. O3 formation requires both NOx and peroxy radicals from VOCs. Several tagging methods exist that can take different approaches to estimate the attribution of O3 to these two chemically distinct precursors (Butler et al., 2018). Butler et al. (2020) demonstrate that anthropogenic NMVOC emissions play a marginal role in regional-scale O3 production, with methane and biogenic VOCs being the most relevant chemical species for O3 production. As the present study primarily focuses on the anthropogenic influence on O3, the use of NOx tagging for O3 source attribution is considered appropriate.
2.2 Receptors and source regions
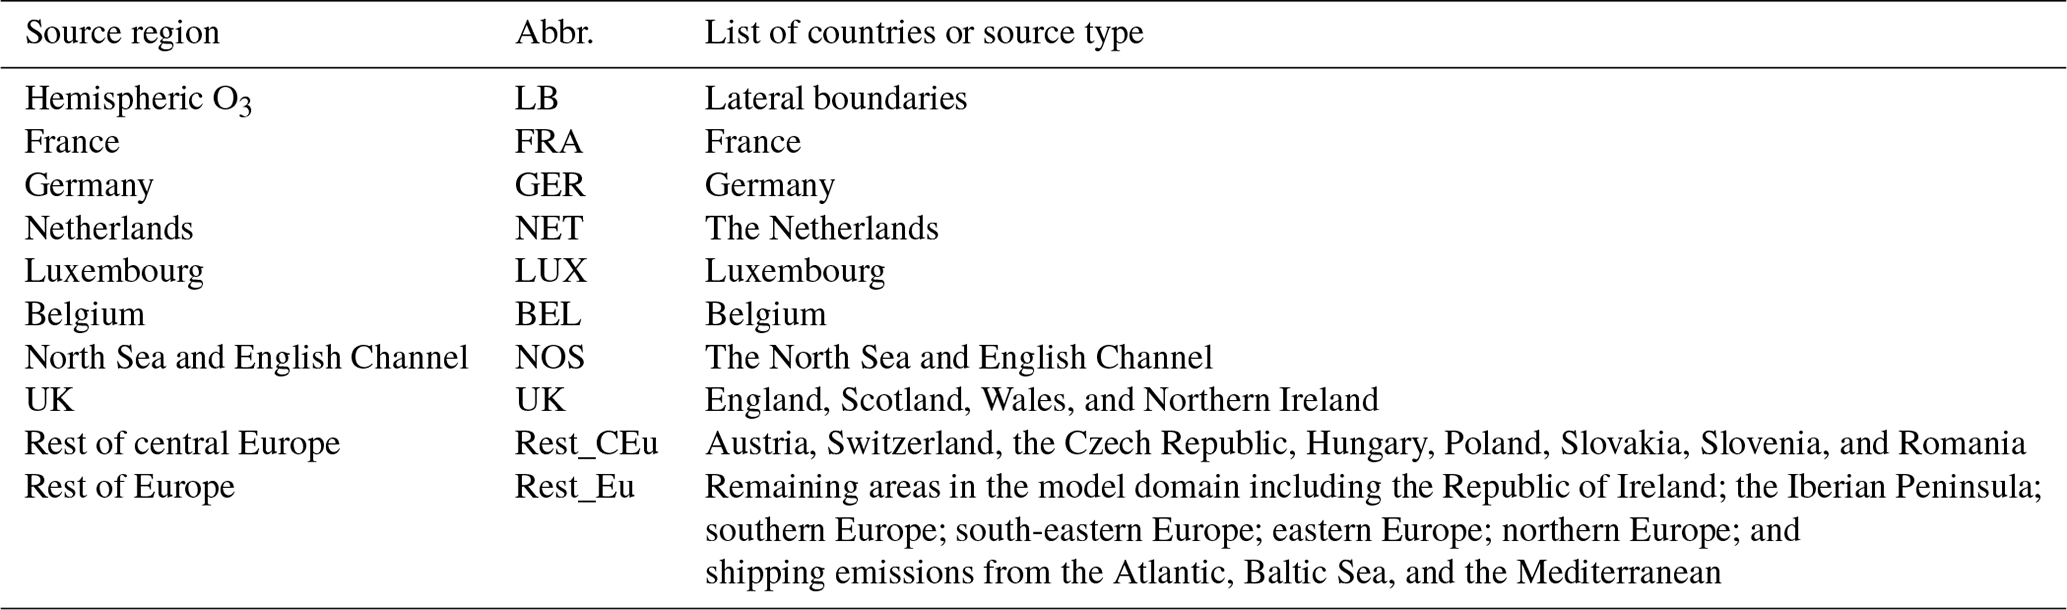
Table 2 lists the tagged sources and receptor regions also highlighted in Fig. 1a and b, respectively. The chemical lateral boundary is defined as an independent source region (LB) and is provided by the MOZART-4 GEOS-5 model. Note that the LB-tagged region also includes O3 contributions of stratospheric origin. Moreover, all O3 that enters the model domain through the lateral boundaries is tagged as LB, and there is no feedback between the global model and WRF-Chem.
To generate the receptor regions, the UK domain is divided into its 12 administrative regions as used in previous air quality studies such as Heal et al. (2013), as shown in Fig. 1b: East Anglia, South East, London, South West, Wales, West Midlands, East Midlands, Yorkshire and Humberside, North East, North West, Northern Ireland, and Scotland.
The UK is well known for the regional variability in its weather. Generally, places in the east and south tend to be drier, warmer, sunnier, and less windy than those in the west and north (Jenkin, 2008). Thus, dividing the UK into several regions also serves to separate relevant meteorological features such as temperature, sunshine, precipitation, and wind, as well as emissions within each region that are known to have an impact on the spatial distribution and temporal variation in air pollutants such as O3 (Coyle et al., 2002; Jenkin, 2008).
2.3 O3 metrics for source contribution assessment
Current European and national air quality standards to mitigate the effects of O3 on human health are expressed as 8 h averages. The regulatory framework establishes that the maximum 8 h mean O3 concentration (MDA8) should not exceed 120 µg m−3 (∼ 60 ppbv) in the EU, and 100 µg m−3 (∼ 50 ppbv) in the UK. Here, the contributions to these health metrics were estimated by computing an 8 h moving mean of O3 for each receptor region and selecting the days when the MDA8 exceeded 50 and 60 ppbv between May and August 2015. Once these were identified, tagged O3 concentrations were extracted for the same periods and used in the analysis. The AOT40 is defined as the accumulated excess of hourly O3 concentrations above 40 ppbv measured during daylight hours (between 08:00 and 20:00) central European time (CET) over a typical 3-month growing season May–July. Here, the contribution of tagged O3 to the cumulative metric AOT40 was calculated as the sum of the difference between hourly mixing ratios when O3 exceeded the 40 ppbv threshold and 40 ppbv between 08:00 and 20:00 central European time (CET) from May–July over the most relevant arable farming areas in the UK, East Anglia, and the South East; see Eq. (1). The target value in the EU and UK is 9000 ppbv h−1 (∼ 18000 µg m−3 h−1) over a typical 3-month growing season (May–July) averaged over 5 years.
2.4 Model evaluation: NO, NO2, and O3
Observational data were taken from the UK's Met Office Integrated Data Archive System and the European Monitoring and Evaluation Programme (EMEP). The EMEP air quality monitoring network records hourly measurements at regional background sites, mostly in farmland and rural areas (Tørseth et al., 2012). The choice to only analyse background representative stations is based on the need to provide an evaluation with spatial scales consistent with the model resolution. Kuik et al. (2016), for example, have shown that a 15 km resolution is too coarse to resolve the differences between urban and rural atmospheric chemical composition. The resolution of the domain considered here is even coarser. The EMEP network was therefore selected as it provides surface measurements at sites intended to represent regional background pollution.
Model evaluation is detailed in the Supplement. Table S2 in the Supplement summarizes the domain-wide statistical performance for NO, NO2, and O3. The predicted temporal correlation coefficient (r) for NO and NO2 is fairly low (0.3), which is a feature also exhibited in other regional studies in Europe using WRF-Chem, e.g. Tuccella et al. (2012), Pirovano et al. (2012), and Lupaşcu et al. (2022). The model underestimates NO mixing ratios in most analysed sites with a domain-wide mean bias (MB) of −0.3 ppbv. NO2 mixing ratios, on the other hand, are generally overestimated with a domain-wide MB of 0.31 ppbv and no specific patterns distinguished in the bias distribution. This is consistent with the negative NO and positive NO2 biases obtained across Europe using MOZART-4 chemistry reported in Mar et al. (2016).
The model's temporal variation in hourly O3 concentrations at most sites is well represented, with an average r value of 0.6. The model tends to underestimate concentrations in most locations, with a domain-wide mean bias of −3.7 µg m−3. Correlation values above 0.5 are obtained in most sites, particularly in the UK; see Fig. S4a in the Supplement. In contrast, low r values (∼ 0.4) are concentrated in high-altitude sites, which might indicate difficulties in the model representing O3 transport. This is in line with previous studies using MOZART-4 chemistry, such as Knote et al. (2014), showing low production of peroxyacetyl nitrates (PANs), which are an essential reservoir for NO2 and a key player in remote O3 production. Correlation values are consistent with summertime O3 values below 0.40 reported in the WRF-Chem model evaluation over a European domain in Mar et al. (2016) using MOZART-4 chemistry.
Figure 2 shows that the day-to-day variation in hourly O3 mixing ratios is well represented by the model, except for large under-predictions during 1–3 July and 22–24 August, particularly at stations on the east coast, e.g. Weybourne. Note that the observed maximum hourly O3 at this site is larger than those seen inland, e.g. Lullington Heath and Harwell (2015). This may indicate inflow of O3 and precursors from nearby large metropolitan areas within the UK (e.g. London) or longer-range transport from continental Europe. Thus, underestimation of O3 during those days may be caused by uncertainties in O3 transport. This feature has also been identified in other source apportionment studies such as Lupaşcu and Butler (2019).
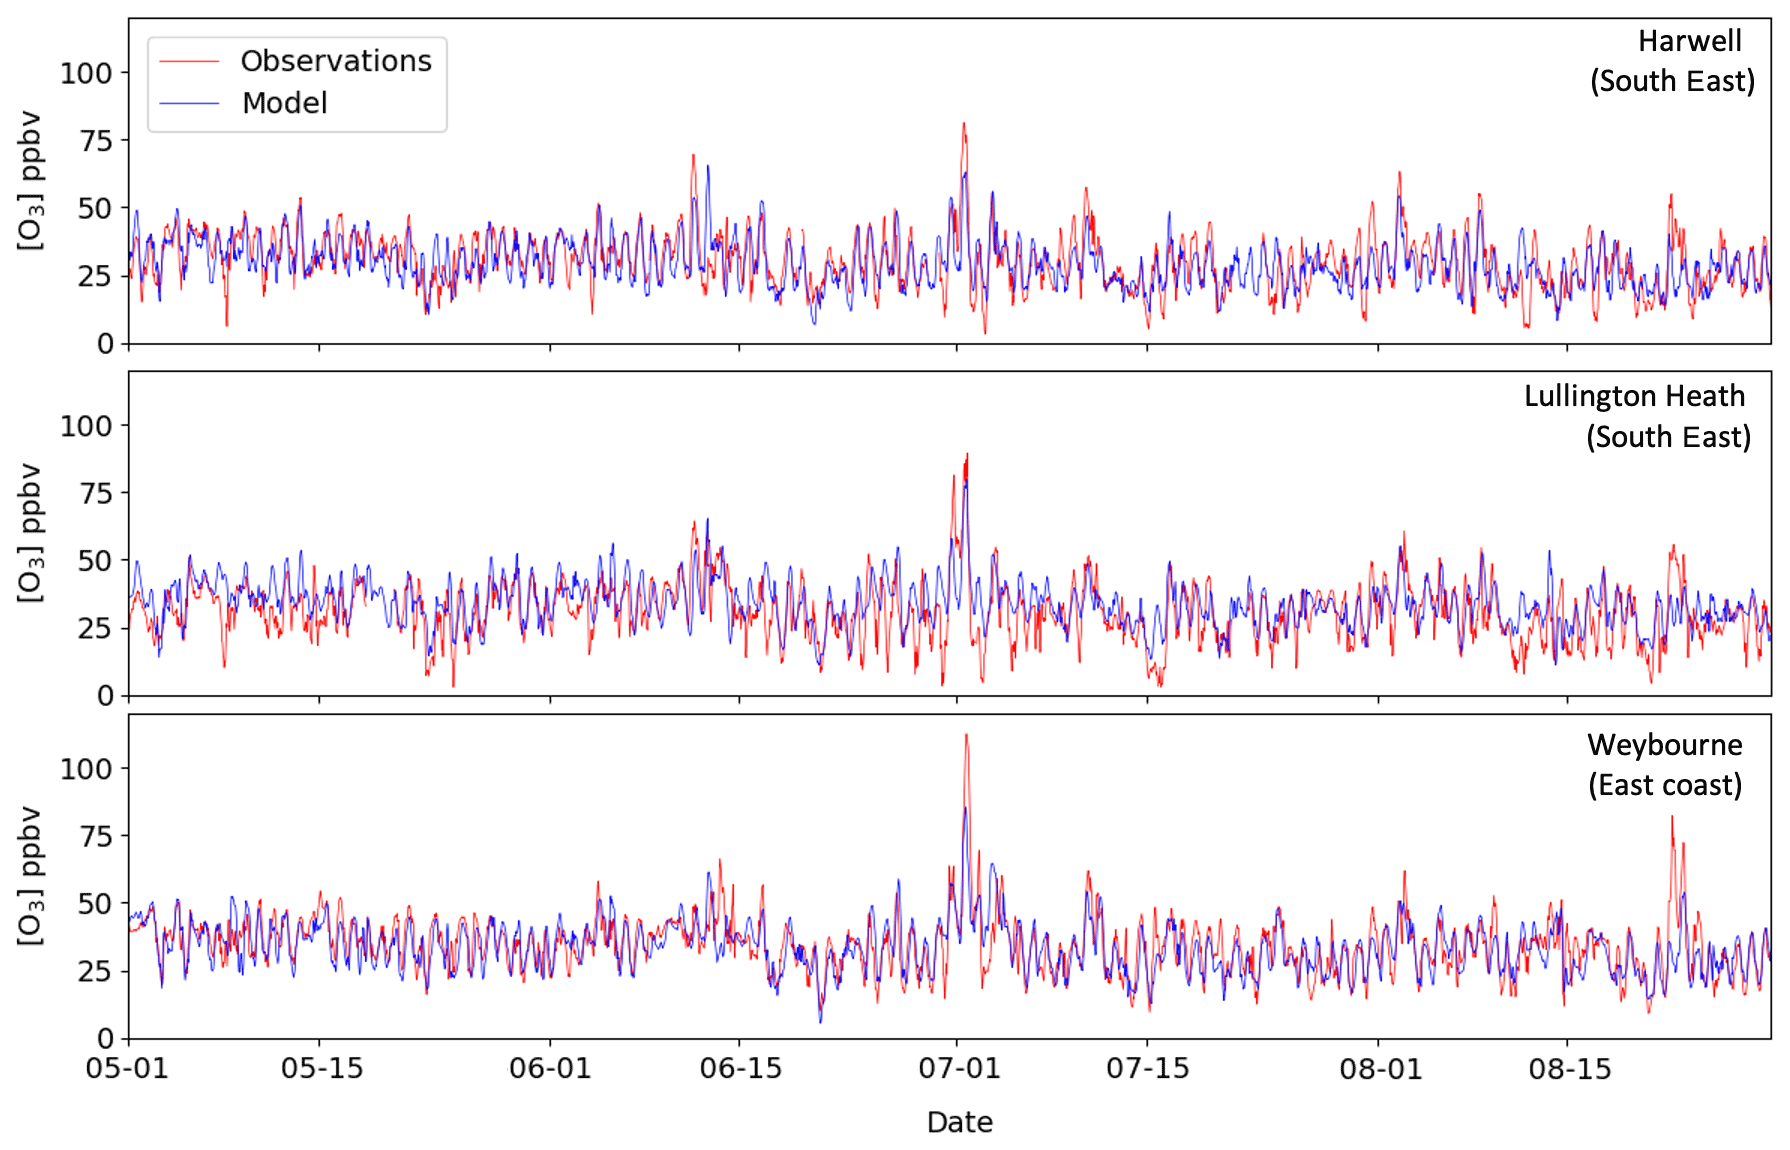
Figure 2Modelled and observed hourly O3 mixing ratios from May to August 2015 at three sites over the UK. The date is given in the format month-day.
3.1 Contributions from tagged sources
3.1.1 Spatial distribution and temporal variation
Consistent with previous work (e.g, Karamchandani et al., 2017; Lupaşcu and Butler, 2019; Butler et al., 2020), the hemispheric O3 level, represented here by the LB source region, dominated the monthly O3 concentrations in the UK during the entire study period with a mean relative contribution of ∼ 71 %, exhibiting a maximum in May (mean 76 %), a minimum in June (mean 66 %), and an increase in August (mean 72 %); see Fig. 3. The mean contribution from the Europe (Eu) super-region (FRA, GER, NET, LUX, BEL, NOS, Rest_CEu, and Rest_Eu; see Fig. 1a for delineation of regions and Table 2 for abbreviation definitions) accounts for nearly 16 % of the simulated monthly mean O3. The largest Eu super-region contributions are observed in the UK locations that are closer to continental Europe and that together contain about 40 % of the UK population (East Anglia, the London area, the South East, and Yorkshire and Humberside). The smallest Eu super-region contributions are observed over Scotland (May and June) and Ireland (July and August). Emissions from UK sources, on the other hand, accounted for about 13 % of the simulated monthly O3. The domestic contributions tend to increase in June and decrease again in August. This monthly variation in the O3 contributions is mainly caused by larger photochemical activity taking place during the summer months (e.g. Monks, 2005). Under these conditions, O3 is formed by reactions involving the oxidation of NMVOCs in the presence of NOx and under the influence of solar radiation.

Figure 3Monthly relative contributions (%) to surface O3 in the UK from May to August 2015 from (a) the lateral boundaries (LB) and (b) the UK and the Eu super-region. The lower and upper end of the boxes indicate the 25th and 75th percentiles, the central bar the median, and the red square the mean. Whiskers indicate the maximum and minimum. Note the differences in the scale in the y axis.
The spatial distribution of the monthly O3 concentrations and the absolute contribution of the source regions (UK, LB, and Eu super-region) to surface O3 in the UK are shown in Fig. 4. The first column shows that the monthly surface O3 concentrations are higher in May than during the summer months, in particular over Ireland, most of the Atlantic Ocean, north of the UK, Scandinavia, and the northern North Sea. This is consistent with the Northern Hemisphere mid-latitude spring maximum (Monks, 2000), which is characteristic of remote locations and attributed to both transport of O3 from the stratosphere to the troposphere (Monks, 2000) and transport of O3 produced from anthropogenically emitted precursors (NOx and VOCs) (Monks, 2000; Butler et al., 2018). By contrast, the south-east of the UK, the southern North Sea, and continental Europe exhibit sustained high O3 mixing ratios throughout the entire analysed period (May to August), reflecting a spring–summer maximum that is frequently attributed to photochemical O3 production (Monks, 2000).
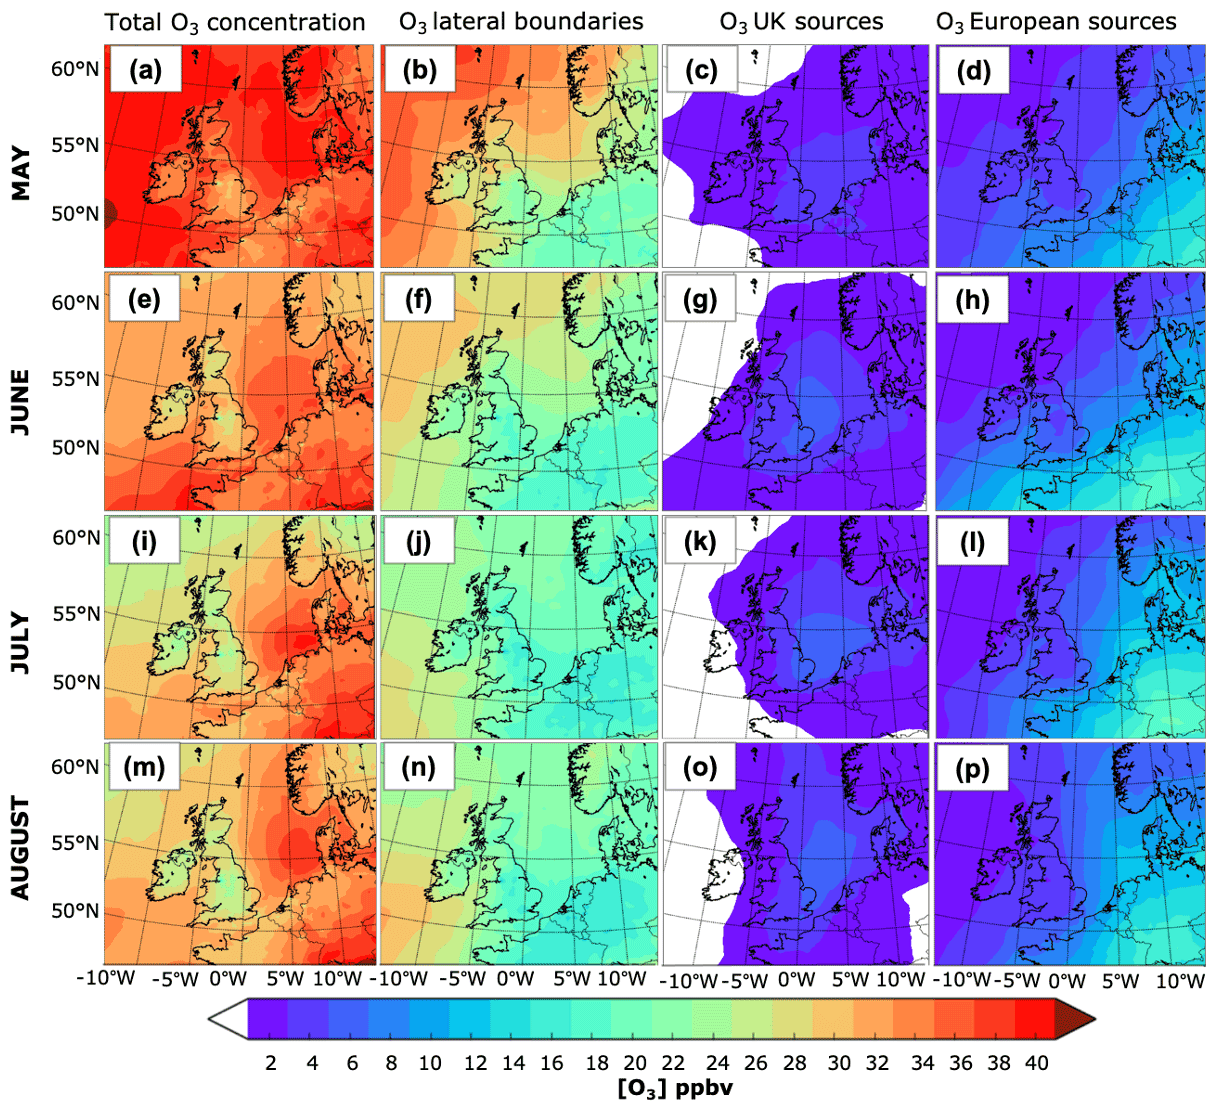
Figure 4Spatial distribution of the monthly mean surface O3 from May to August 2015. The first column depicts the mean O3 mixing ratio in May, June, July, and August; the absolute monthly contribution from the lateral boundaries is shown in the second column; the third column shows the contribution from UK emissions; and the contribution from the Eu super-region, which includes emissions from the main shipping routes over the European seas and the Atlantic, is presented in the fourth column.
A marked latitudinal gradient is observed in the monthly O3 mixing ratios, in particular during June, July, and August. Over the ocean areas, O3 concentrations tend to be higher at the lower latitudes and in the North Sea; see Fig. 4e, i, and m. Mean O3 mixing ratios as low as 22 ppbv (Fig. 4i) are observed in most of the UK and Scandinavia in July, while mixing ratios as high as 32 ppbv (Fig. 4e) are calculated for southern locations in the UK and western Europe in June. This is consistent with previous estimates such as those in Butler et al. (2018). Part of the latitudinal gradient in surface O3 over land can be attributed to the changing O3 mixing ratios arriving from the Atlantic Ocean. Moreover, high mixing ratios in the south-east UK during summertime are generally associated with photochemical production of O3 (Monks et al., 2005), in particular from anthropogenic NOx and biogenic NMVOC emissions (Atkinson, 2000; Butler et al., 2018) as well as transport of O3 rich air masses from continental Europe during anticyclonic conditions (Jenkin et al., 2002; Lee et al., 2006; Francis et al., 2011; Romero-Alvarez et al., 2022). Low mean O3 mixing ratios (as low as 20 ppbv), on the other hand, are observed in the vicinity of the main urban centres, e.g. Greater Manchester, the Midlands, and the London area (first column, Fig. 4). This is because strong titration by excessive local NOx emissions takes place over the main urban centres, whereas high O3 production rates are expected in the outskirts following the progressive reduction in NOx concentration relative to that of NMVOCs (Jenkin, 2008). Note that the latitudinal gradient across the UK is not evident in high-altitude areas in Wales and northern England, which have relatively high concentrations of O3. This is because much of the time high-altitude areas are above the shallow boundary layers that form over the lower-lying land and experience therefore larger exposure to O3.
A suitable way to identify the areas influenced by fresh NOx emissions is comparing the mixing ratios of O3 and Ox (i.e. O3 + NO2). Ox is considered a conservative quantity as it is, to a large extent, free from the titration effect of NO + O3 → NO2 (Kley et al., 1994). The effect of titration for July is evident in Fig. 5. When Ox is considered, the mixing ratios tend to increase over the main urban centres such as London, Birmingham, Nottingham, Sheffield, and Greater Manchester and to a lesser extent over Edinburgh and Glasgow. The NO titration effect is also observed within the main urban centres in continental Europe and along the shipping lanes over the North Sea and the English Channel due to the high NO content of ship emissions compared with those from NMVOCs (Aulinger et al., 2016).
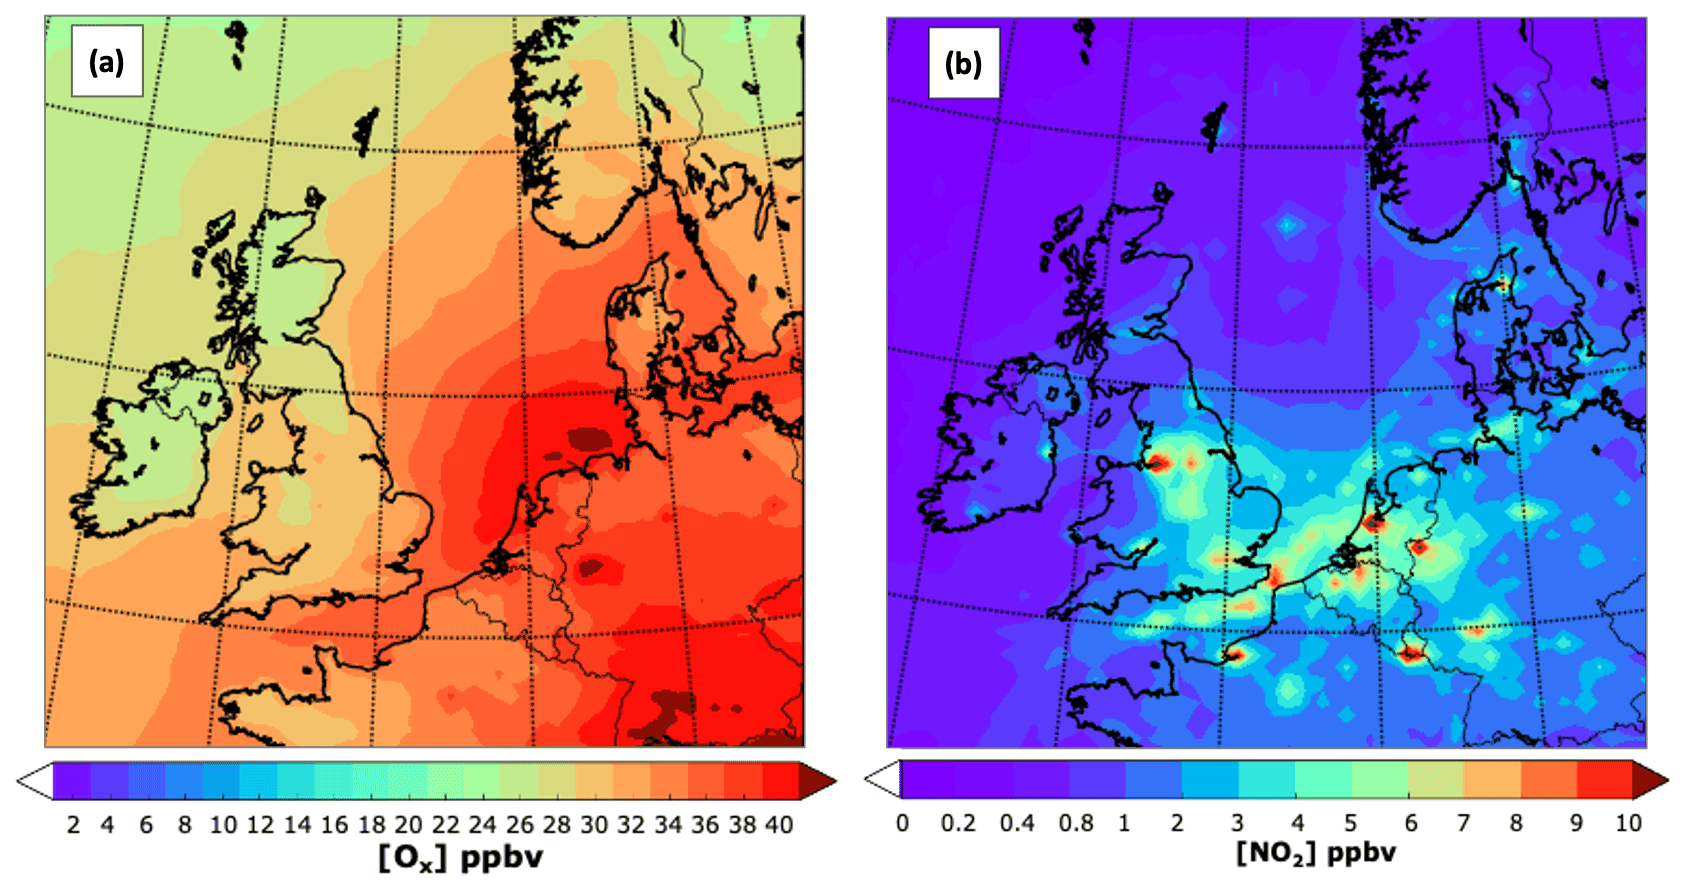
Figure 5Close-up of the spatial distribution for July 2015 of (a) the mean Ox mixing ratio (O3 + NO2) and (b) NO2. Note the different scales.
The decrease in the monthly average O3 mixing ratios towards the summer months over the Atlantic Ocean and most of the British Isles coincides with a progressive reduction in the contribution from LB O3 over the same areas (second column in Fig. 4). Over remote marine areas, it is likely that the decrease in total O3 is due to an increase in the photochemical activity and concentration of water vapour during the summer months. O3 concentrations over land, on the other hand, are likely to be altered by both the changing background contribution from over the ocean and processes occurring at the regional and local scale (Jenkin, 2008). Such processes include O3 scavenging near emission sources, changes in meteorology (wind direction influencing transport and temperature and radiation influencing photochemical production of O3), and planetary boundary layer stability (influencing vertical mixing and deposition) (Pilling et al., 2009). In addition, LB O3 can be chemically lost near emission sources, e.g. the Midlands and London area, shipping lanes, and over an extended area on the southern part of the Atlantic Ocean, as shown in the map of the net midday (11:00–14:00 UTC) near-surface LB O3 chemical production rate in Fig. 6. The figure also shows how the absolute contribution from the LB decreases southwards and eastwards. Over the Atlantic, part of this can be attributed to a greater chemical O3 sink due to the increase in photolysis of O3 and subsequent production of OH radicals from water vapour (Johnson et al., 1999). Transport of O3 from the stratosphere might also influence the spatial gradient in the contributions.
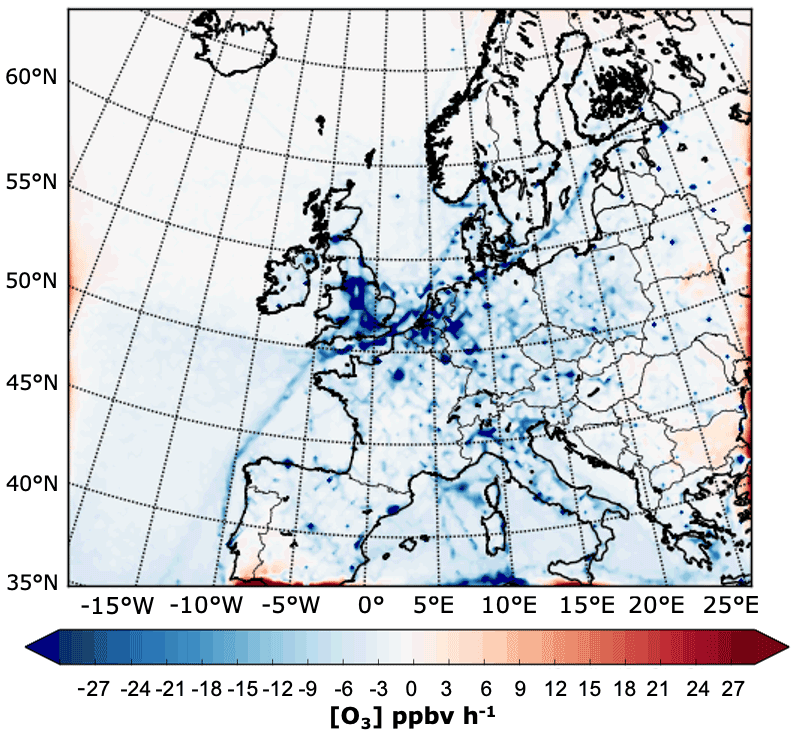
Figure 6Net midday (11:00–14:00 UTC) near-surface lateral-boundary O3 chemical production rate in ppbv h−1 in July 2015. Note that O3 production is driven by tagged LB NOx that has entered the model domain via the lateral boundaries.
A marked reduction in LB O3 is observed over the UK in column 2, Fig. 4 (e.g. a decrease of ∼ 10 ppbv between LB O3 over the ocean and the UK). Depletion of surface O3 by dry deposition and chemical loss processes within the UK, such as the reaction of O3 with NO, may help explain the observed spatial gradient. Reductions in LB O3 due to the effect of local O3 scavenging by reaction with NO in the urban centres as illustrated in Fig. 7 might be an additional cause.
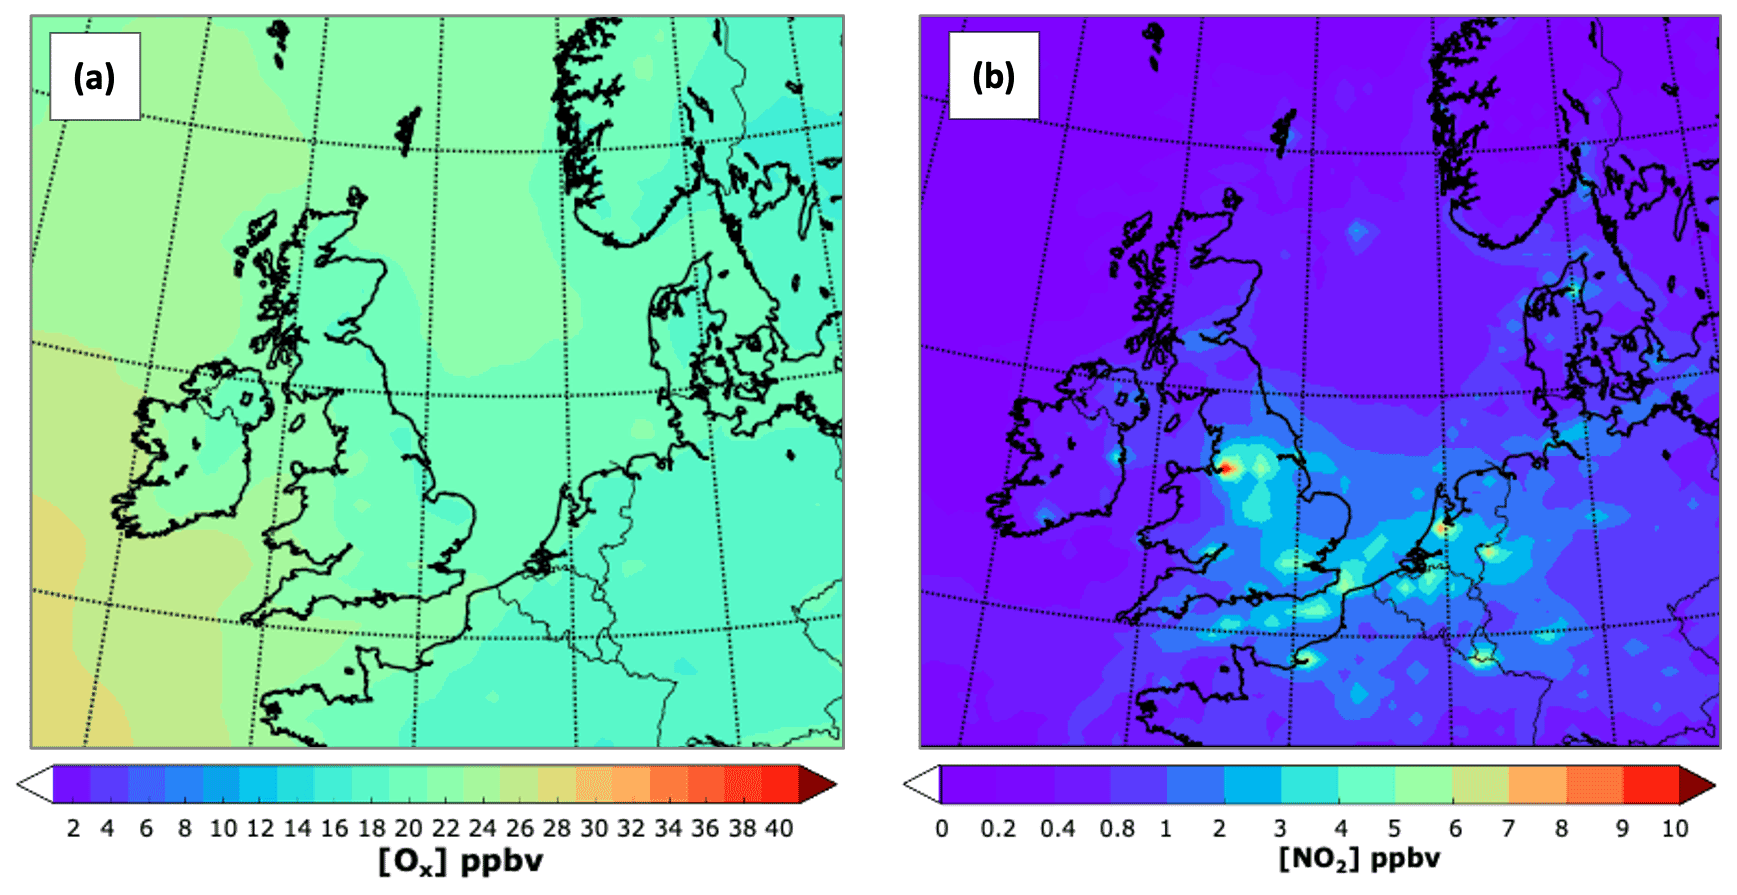
Figure 7Close-up of the spatial distribution for July 2015 of (a) the lateral-boundary mean Ox mixing ratio (O3+ NO2) and (b) NO2. Note the different scales in (b).
Whereas the absolute contribution from the LB over the UK tends to decline with distance towards the south-east, the absolute contribution of UK anthropogenic NOx emissions to the mean surface O3 over the UK (Fig. 4, third column) decreases from the south-east to the north and west. The mean contribution of the UK-to-UK surface O3 concentrations is marginal. Over most of the north and the west, the UK contributions ranged from 1–3 ppbv. By contrast, maximum UK contributions can reach up to 7 ppbv in the east and the Midlands during the summer months. These areas tend to be drier, warmer, and sunnier than those regions further west and north, features that are conducive to photochemical O3 formation (e.g. Coyle et al., 2002; Jenkin, 2008). Furthermore, these regions contain some of the UK's largest cities (e.g. London, Birmingham, Nottingham, Manchester, and Leeds), which can lead to net O3 formation downwind of the emission sources where the NOx titration effect is reduced. Indeed, overall, the south and east of the UK exhibit the highest midday (11:00–14:00) O3 chemical production from UK anthropogenic sources; see Fig. 8a. Lower O3 chemical production is instead observed in the west and the north beyond Yorkshire and Humberside, as shown in Fig. 8a. On the other hand, the UK makes a positive contribution to O3, of around 4–8 ppbv, downwind over continental Europe.
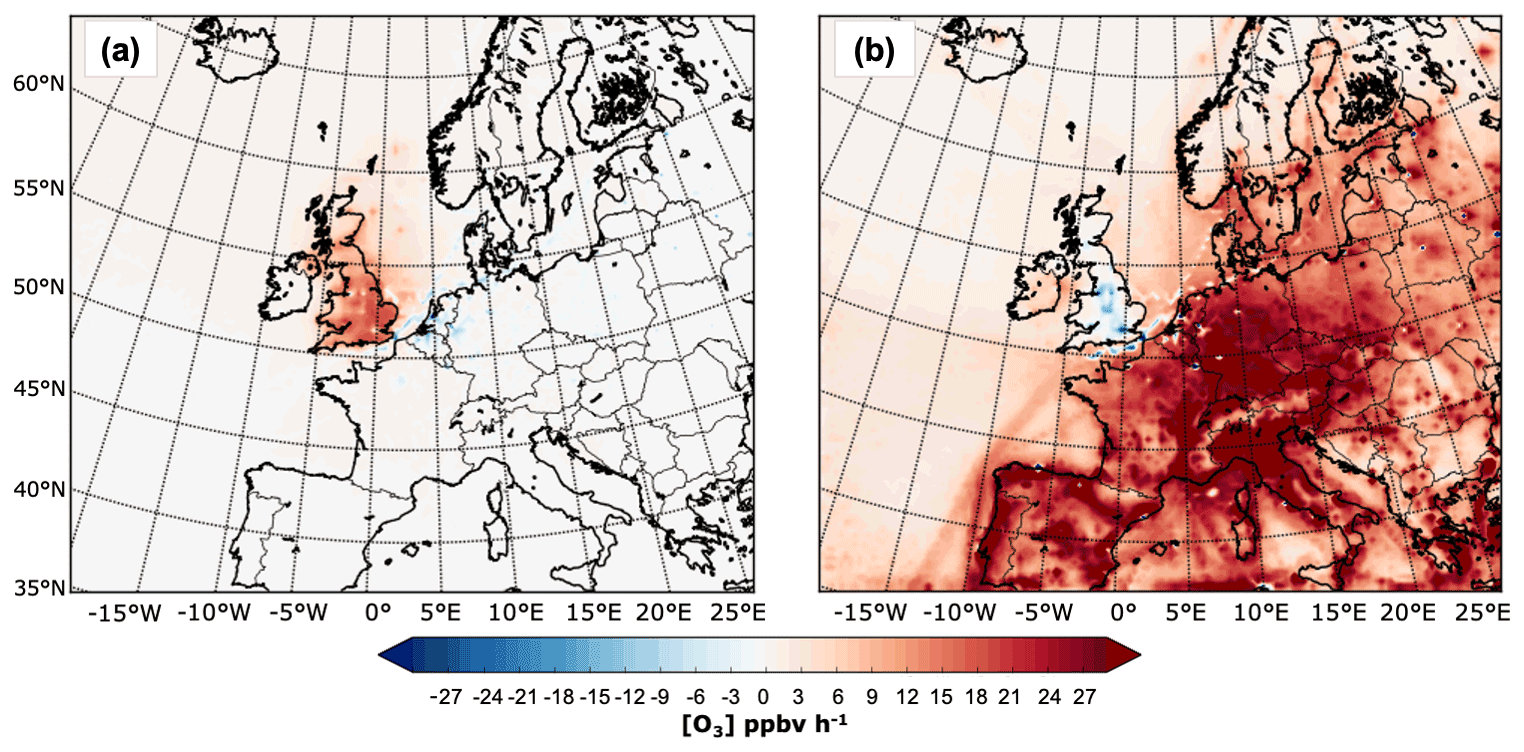
Figure 8Net midday (11:00–14:00 UTC) surface chemical production rate in ppbv h−1 in July 2015 for O3 from the UK (a) and European anthropogenic NOx emissions (b).
The contribution from European NOx emissions to the mean surface O3 over the UK (Fig. 4, fourth column) is comparable to that observed from the UK contribution and tends to be higher along much of the eastern, southern, and south-west borders, reaching up to 10 ppbv in East Anglia during July. This reflects the effective transport of continental O3 by south-easterly winds during high-O3-pollution events. The European contributions then decrease towards the northern and western areas of the UK, with a minimum (1–3 ppbv) over Scotland and Ireland. Figure 8b demonstrates that surface O3 from anthropogenic sources from the Eu super-region is mainly produced outside the UK. This indicates that the contribution from EU emissions to UK surface O3 is predominantly due to transport of O3 rather than its NOy precursors. Also, O3 from EU sources is chemically lost near the largest cities in the UK (e.g. the London area, Birmingham, Nottingham, Manchester, and Leeds) and in the English Channel and North Sea, as shown in the plot of the net midday surface chemical O3 production rate from European anthropogenic NOx emissions in Fig. 8b. Chemical production is generally concentrated over central Europe and the Baltic Sea. By contrast, chemical loss happens within the main urban centres; near point sources; and along the shipping routes around western Europe, the North Sea, and the English Channel, e.g. sites previously identified to be influenced by NOx titration.
3.1.2 Regional dependence
The modelled contributions of the different source regions to the UK receptor regions for May are presented in Fig. 9. The figure contains 12 nested pie charts, each one associated with a receptor region in the UK that shows the absolute and relative contributions to O3 mixing ratios in the UK from all anthropogenic NOx sources, including ship emissions. Note that the contributions from the Rest_Eu source need to be carefully interpreted since these include emissions from the Republic of Ireland, Iberian Peninsula, southern EU, south-eastern EU, eastern EU, and northern EU and ship emissions from the Atlantic, Baltic Sea, and Mediterranean.
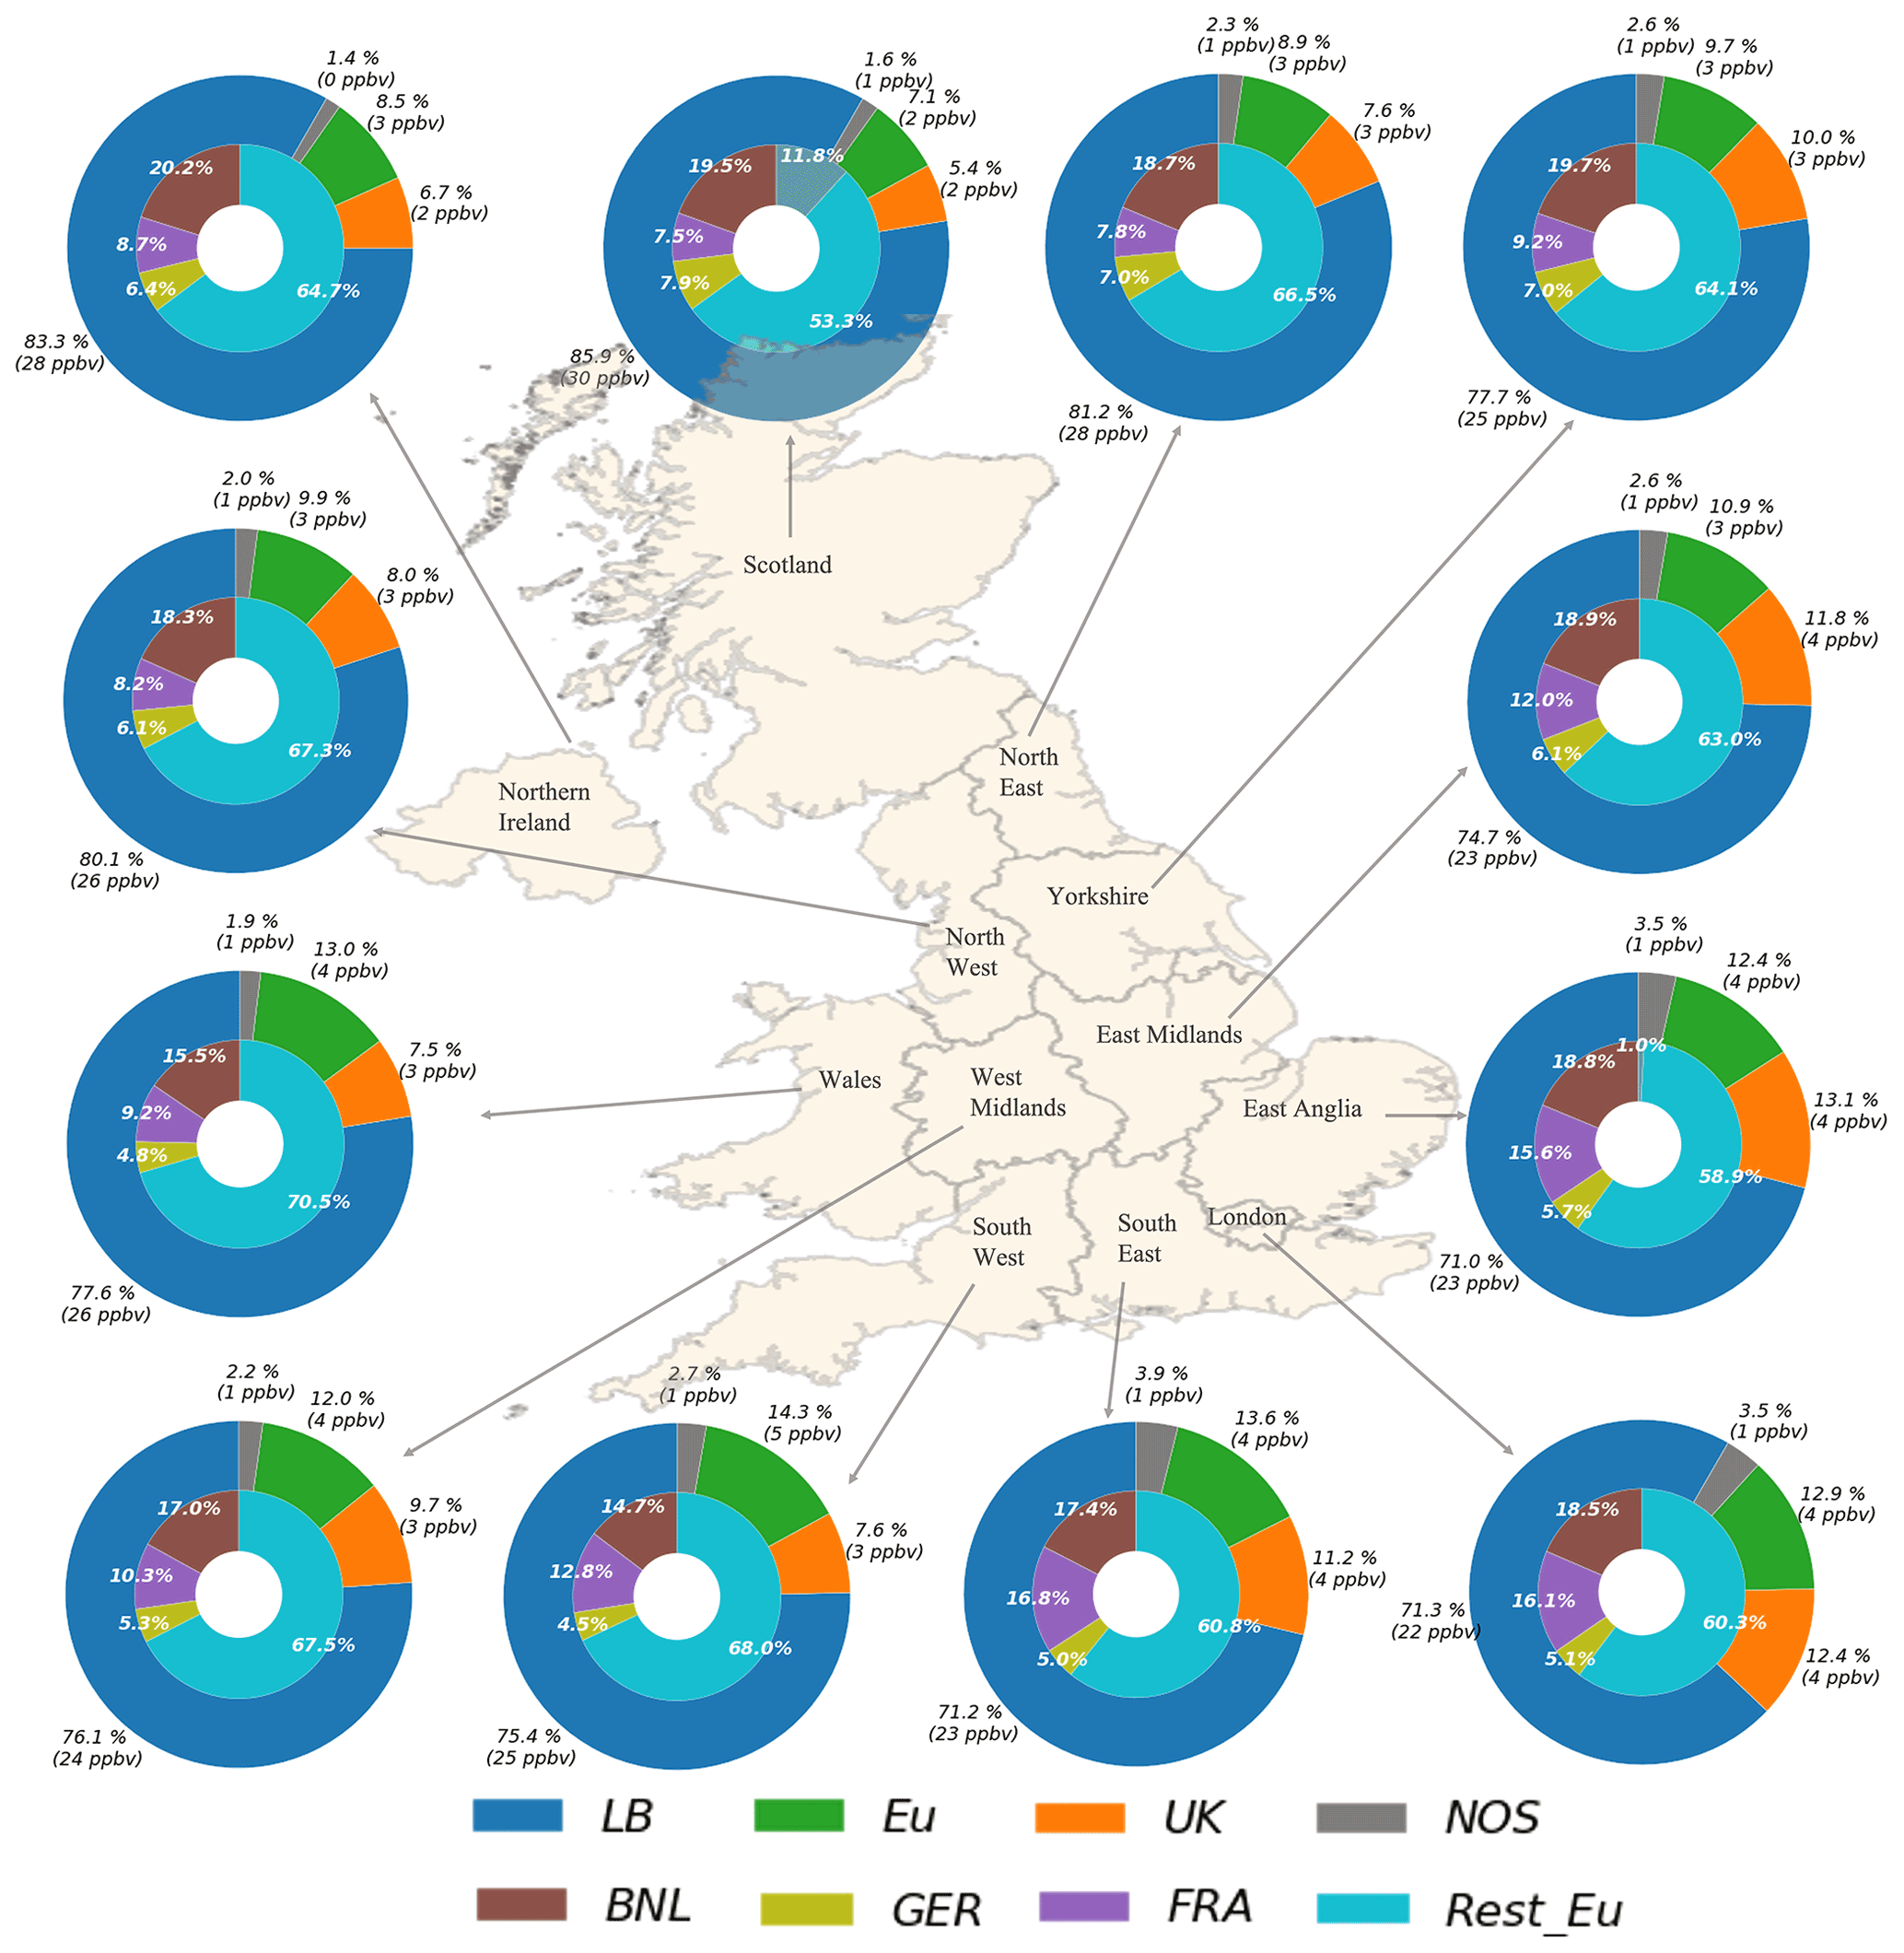
Figure 9Simulated contributions to the mean O3 mixing ratios in May 2015 over 12 receptors regions in the UK. The outer circle depicts the contributions from LB, the UK, the Eu super-region (Eu), and the NOS. The inner circle breaks down the contribution from the Eu super-region into four sub-regions: Benelux (BNL), France (FRA), Germany (GER), and the rest of Europe (Rest_Eu). Note that the values correspond to the contributions from anthropogenic sources only, with the exception of the LB contributions, which include O3 of stratospheric origin.
The LB source is the principal contributor to the modelled mean O3 mixing ratios in every receptor region. The contributions peak in May (mean absolute contribution 25 ppbv), reflecting the seasonal cycling in the northern hemispheric background O3 (e.g. Monks, 2000; Pilling et al., 2009). Contributions from this source are more prominent in the regions located in the north, east, and north-west of the UK, e.g. Scotland (30 ppbv), Northern Ireland (28 ppbv), North East (27 ppbv), the North West (26 ppbv), and Wales (26 ppbv). These regions contain about 20 % of the UK population and are primarily impacted by westerly flows and associated hemispheric O3 background due to their geographical position (Pilling et al., 2009). Also, they generally experience less than 10 d with O3 concentrations above the EU limit of 120 µg m−3 (DEFRA, 2020) because of low NOx emissions locally. The contributions from the LB source in the South East, East Anglia, and East Midlands, on the other hand, can be up to 8 ppbv smaller than in the east of the UK, particularly during summertime; see Figs. S10–S11 in the Sect. S2 in the Supplement.
The UK contributions are generally more significant in the east, south-east, and Midlands, showing a maximum value in June and July in every receptor area (Figs. S10 and S11 in the Supplement). The source region provides up to 20 % of the surface O3 mixing ratios in East Anglia, 18 % in the London area and East Midlands, and 16 % in Yorkshire and Humberside and the South East, making it the second-biggest source of O3 in these locations after the LB. This area incorporates about 50 % of the UK population and often experiences more than 10 d with O3 concentrations above the EU and UK O3 threshold (concentration >120 and 100 µg m−3, respectively) (DEFRA, 2020). The Eu super-region, on the other hand, is the second-largest source region in the northern and western UK, with contributions in summertime reaching up to 10 % in Scotland and 16 % in the South West, England, and 14 % in Wales. Regardless, this source region still significantly impacts the South East, East Anglia, and London, where the relative contributions can increase from 13 %, 12 %, and 13 % in May to 16 %, 15 %, and 16 %, respectively, in July.
The contributions from ship emissions from the North Sea and English Channel are significantly lower than those from UK sources and the Eu super-region (3 %–4 % of the total contribution in the South East and East Anglia in May and up to 6 % of the total surface O3 during the summer months). The impact is also less important in the west than in the east and south of the UK due to the proximity with the region. As for the relative contributions from the different Eu sub-regions (inner circle in Fig. 9), these are largely influenced by the geographical situation of the receptors and the predominant wind direction. In every receptor, the principal contributor from the Eu super-region is the Rest_Eu source region, providing between 60 %–70 % of the Eu super-region O3 in May and up to 83 % of the O3 during summertime. The relative contributions of the Rest_Eu region are larger in the northern and western locations, in particular during the summer months when there is a marked difference in the distribution of the contributions across the UK regions. The summer months see an increase in the input from France, Germany, and the Benelux region, in particular during anticyclonic weather conditions and over the receptor regions located in the south and east of the UK (e.g. the South East, East Anglia, the London area, and the East Midlands); see Figs. S10–S11 in the Supplement. This is consistent with results of studies on extreme O3 in the EU and the UK reporting an increase in surface O3 concentrations under anticyclonic conditions (e.g. Pope et al., 2016; Ordóñez et al., 2017; Romero-Alvarez et al., 2022). Romero-Alvarez et al. (2022), in particular, have shown that a wide area of high pressure centred over the Netherlands coast affected most of England during the first days of July 2015. During the same period, regions such as East Anglia reported increases in O3 mixing ratios of up to 16.6 ppbv h−1 that overlapped with wind direction changes from south-south-west to south-south-east.
Depending on the predominance of the wind direction (south-south-east and south-south-west), O3 from anthropogenic sources within France can impact both the west and the east of the UK. The contribution is greater in the southern UK due to the proximity to the source region. The contributions from the Benelux region and Germany are more significant in the east of the UK due to the proximity with the continent and association with easterly flows (east and south-east); about 14 % and 6 % of the Eu super-region in East Anglia during the summer months come from these two source regions, respectively.
Notably, anticyclonic conditions and easterly winds in the UK have been associated with enhanced O3 concentrations, whereas cyclonic conditions and westerly winds have been linked to O3 transport from the UK mainland and cleaner air from the North Atlantic (Jenkin et al., 2002; Pope et al., 2016; Romero-Alvarez et al., 2022). The contribution patterns described above may thus serve as predictors of future O3 source apportionment over the UK regions.
3.2 Contributions to regulatory O3 metrics
3.2.1 MDA8 O3 exceeding 50 ppbv
The mean contribution from each source region for the hours when the MDA8 O3 exceeded 50 ppbv at each receptor area from May to August is presented in Fig. 10. The figure shows large contributions from source regions that were not seen as dominant sources. France, for example, becomes a major source, particularly in receptors in densely populated areas such as the south and east of the UK. The absolute mean contributions at the sites sometimes exceed the input from the LB O3 (mean value ranging between 10 and 15 ppbv and maximum reaching up to 35 ppbv in the London area). The impact of UK NOx on O3 varies across the sites, but in general, its share increased from the south-east to the north. In the Midlands, the North East, the North West, Scotland, and Yorkshire and Humberside, O3 from UK sources becomes dominant, surpassing the LB mean input in most receptors. In the remaining locations, the UK source is the third-largest input for surface O3 except for the South West, where most of the O3 comes from France (mean ∼ 18 ppbv), the LB (mean ∼ 14 ppbv), NOS (mean ∼ 6 ppbv), and Rest_Eu (mean ∼ 8 ppbv). The impact from the shipping component (NOS) also becomes important in all receptor regions with an estimated mean of 4–7 ppbv. O3 from central Eu, Germany, the Netherlands, Belgium, and Luxembourg, on the other hand, is almost negligible in the west of the UK (mean less than 1 ppbv). However, its impact increases towards the east and north with mean values ranging about 1–6 ppbv (e.g. in the East Midlands, the North East, Yorkshire and Humberside, and Scotland), reflecting the efficient transport of pollutant-loaded air masses under anticyclonic conditions.
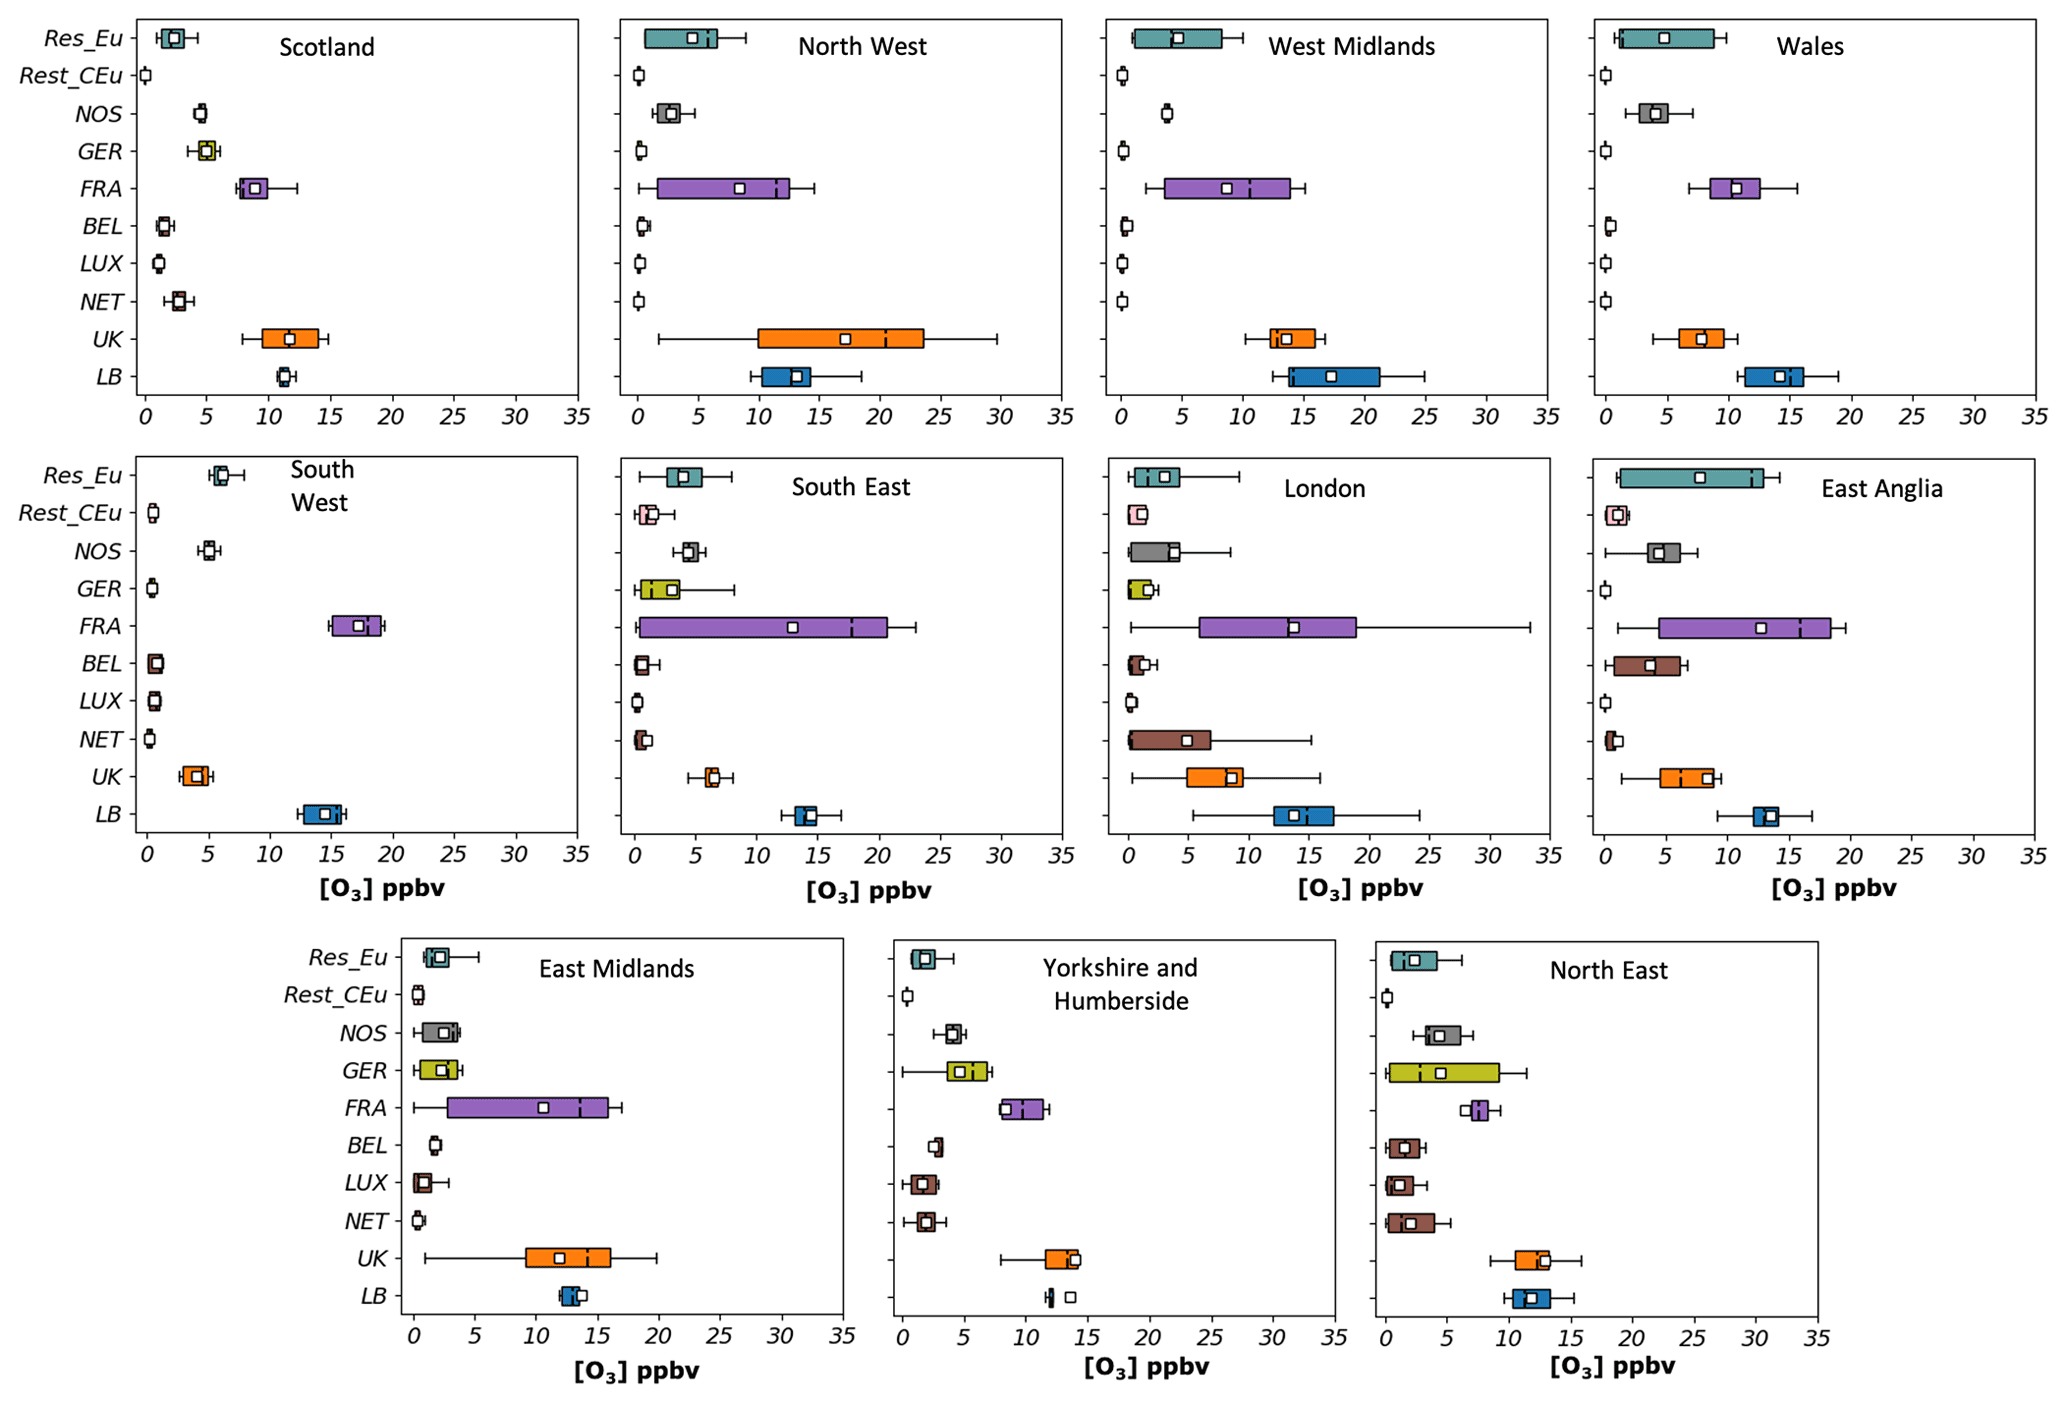
Figure 10Hourly contributions (in ppbv) to surface O3 at 11 UK receptor regions from 10 source regions (UK, background (LB), the Netherlands, Luxembourg, Belgium, France, Germany, the rest of central Europe (Rest_CEu), the North Sea and English Channel (NOS), and the rest of Eu) during days when the MDA8 is above 50 ppbv between May and August. The lower and upper ends of the boxes indicate the 25th and 75th percentiles, the dashed black line the median, the white boxes the mean, and the whiskers the minima and maxima.
3.2.2 MDA8 O3 exceeding 60 ppbv
Figure 11 shows the mean contribution at each receptor area to hourly surface O3 when the MDA8 O3 exceeded the 60 ppbv thresholds. There were two occasions when the modelled MDA8 exceeded 60 ppbv, the main occasion being the episode on 1 July. Romero-Alvarez et al. (2022) have shown that MDA8 O3 above 50 ppbv in the South East and East Anglia regions in July 2015 coincided with days when easterly winds prevailed (east-south-east flows). In contrast, MDA8 O3 above 60 ppbv coincided with a shift in the wind direction from east-south-east to south-south-east and south and a sharp rise in the surface temperature.
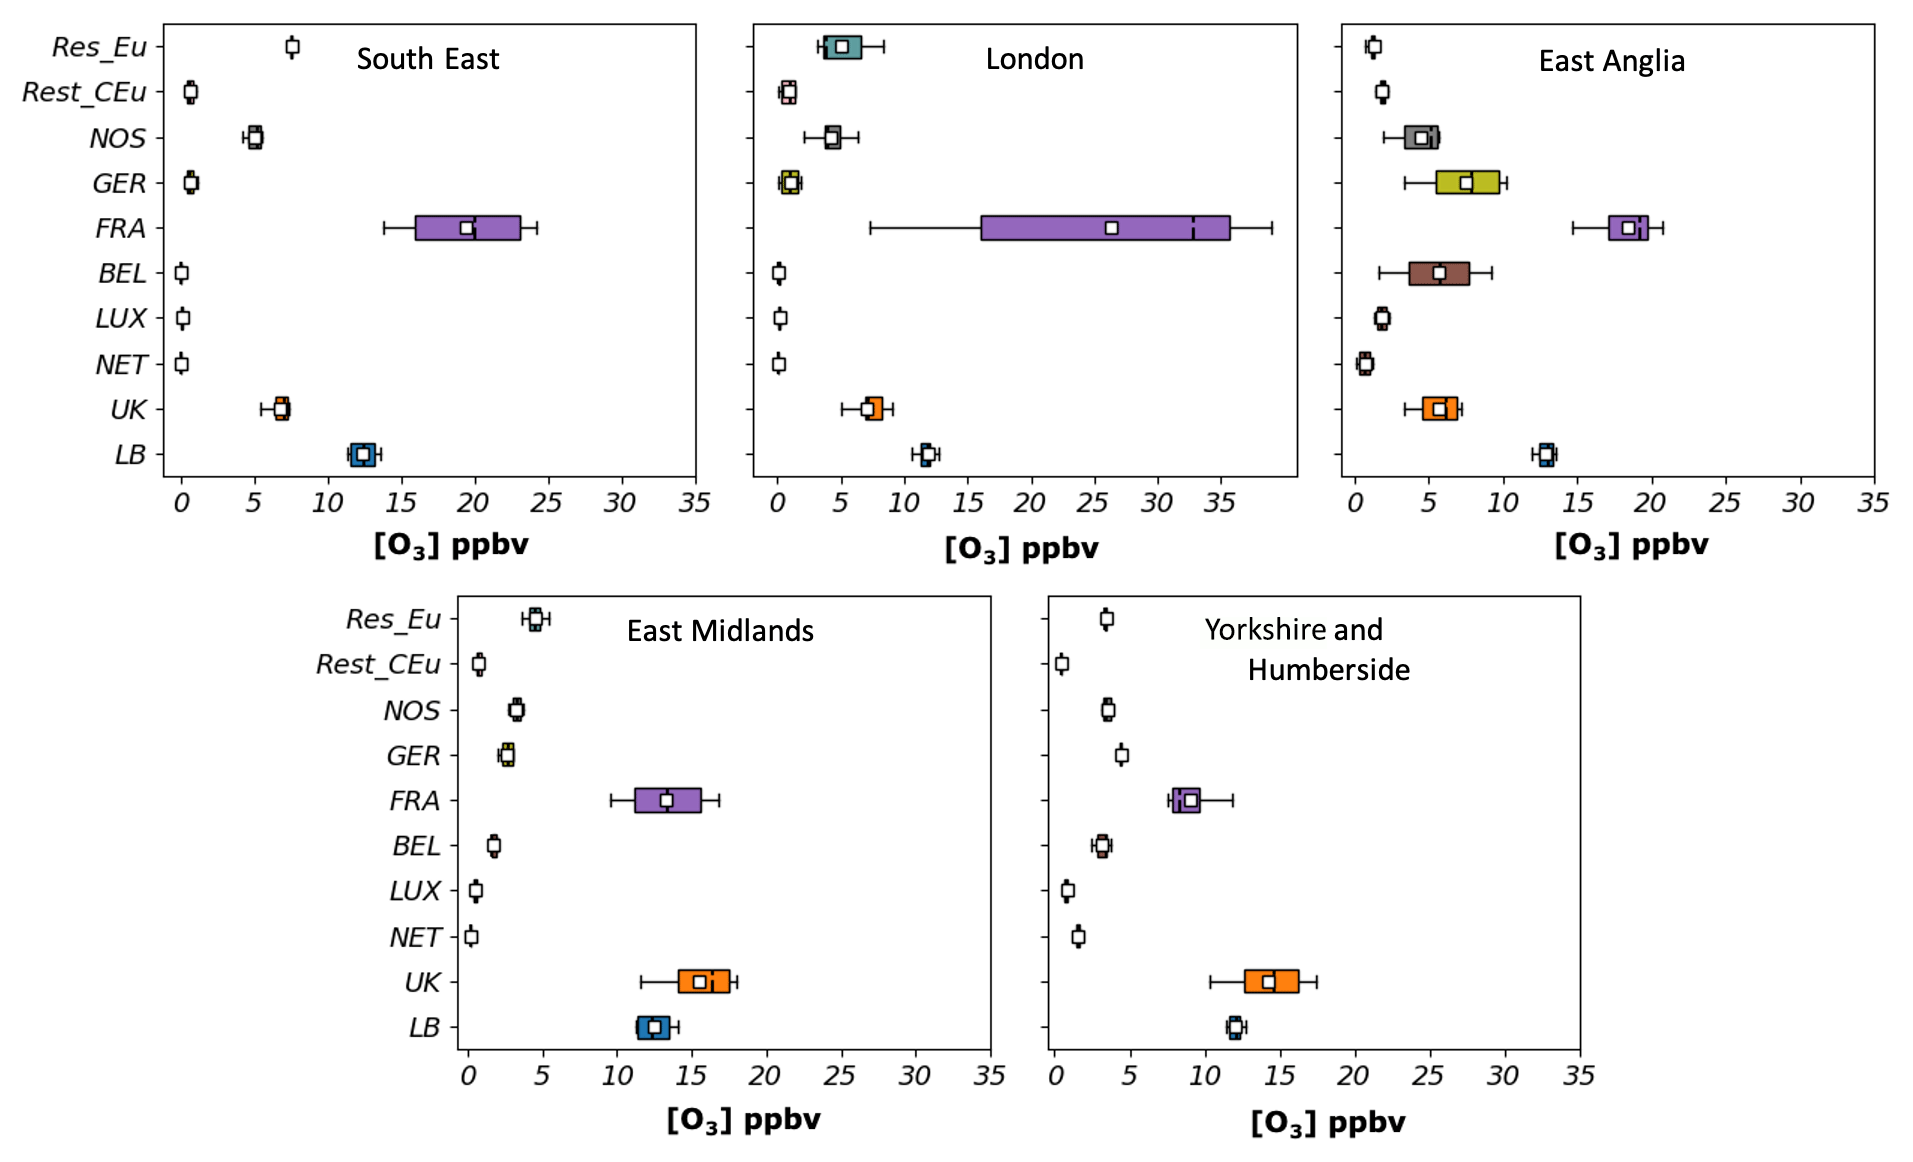
Figure 11Hourly contributions (in ppbv) to surface O3 at 5 UK receptor regions from 10 source regions (UK, background (LB), the Netherlands, Luxembourg, Belgium, France, Germany, the rest of central Europe (Rest_CEu), the North Sea and English Channel (NOS), and the rest of Eu) during days when the MDA8 is above 60 ppbv between May and August. The lower and upper ends of the boxes indicate the 25th and 75th percentiles, the dashed black line the median, the white boxes the mean, and the whiskers the minima and maxima.
France was the most significant contributor to the build-up of O3 when the mixing ratios exceeded the EU threshold in the South East (mean ∼ 18 ppbv), East Anglia (mean ∼ 21 ppbv), and the London area (mean ∼ 26 ppbv) because convergence of westerly and south-easterly winds in the west of the UK diverted the contributions of domestic sources from these regions, as reported in Romero-Alvarez et al. (2022). O3 from UK NOx emissions, on the other hand, has a greater impact on the East Midlands (mean ∼ 16 ppbv) and Yorkshire and Humberside (mean ∼ 15 ppbv). In the South East and the London area, the contributions from Rest_Eu equal those from UK O3, while the influence is comparable to that from the west and central Europe in the rest of the regions. As in the contributions to the MDA8 O3 threshold of 50 ppbv above, the lateral-boundary component remained nearly constant in all receptor areas with a mean contribution of about 12 ppbv. This is because most of the UK's weather was dominated by anticyclonic conditions. The impacts from the North Sea and the English Channel are also important in all receptor regions, with a mean between 4–7 ppbv. Results suggest that ship emissions along these routes affect the air quality of the UK, particularly over the east and south-east. However, the current model configuration does not consider the chemical evolution of the different emitted species (chemical loss and production rates) during the dispersion of the ship plume. In fact, once species are emitted, they are instantaneously mixed in each model grid cell (27 km × 27 km). In the case of chemically reactive species such as NOx, this can lead to overestimations of both NOx and O3 concentrations due to the non-linearity of the chemical processes involving NOx and O3 evolution during the dispersion of the ship plume (e.g. Huszar et al., 2010; Van Der Werf et al., 2010).
3.2.3 AOT40 index
The average simulated AOT40 for 2015 in the two most relevant arable areas in the UK – East Anglia and the South East – is 3674 and 1833 µg m−3 h−1, respectively (the target value for the EU and UK is ∼ 18 000 µg m−3 h−1). Figure 12 shows the source contributions to the surface O3 when the mixing ratio exceeded 40 ppbv during the daytime hours (08:00 and 20:00) central European time from May to July in two receptor regions in the UK. When exceedances to the hourly surface O3 mixing ratios above 40 ppbv are considered, the LB component becomes the dominant source in both receptor regions (estimated mean concentration between 21–24 ppbv) as its threshold is close to the tropospheric baseline ozone level associated with maritime North Atlantic air masses. The second-largest contributor is the UK with a higher impact in the East Anglia region (estimated mean concentration 10 ppbv) than in the South East (estimated mean concentration 6 ppbv). The third, fourth, and fifth contributions in East Anglia come from the Rest_Eu and Rest_CEu regions and France, while in the South East the contributions come from the North Sea and English Channel, Rest_Eu, and Germany. The contributions from the Netherlands, Belgium, and Luxembourg become almost negligible.

Figure 12Hourly contributions (in ppbv) to surface O3 at 2 UK receptor regions from 10 source regions (UK, background (LB), the Netherlands, Luxembourg, Belgium, France, Germany, the rest of central Europe, the North Sea and English Channel (NOS), and the rest of Eu) for the AOT40 between May and August. The lower and upper ends of the boxes indicate the 25th and 75th percentiles, the dashed black line the median, the white boxes the mean, and the whiskers the minima and maxima.
Note that the AOT40 metric assesses the impacts of O3 on the vegetation by considering an O3 threshold (e.g. concentrations above 40 ppbv) during the months when plant growth is most likely to be affected and when daytime O3 concentrations are at their highest. However, research experiments have shown that the response of plants to O3 exposure is non-linear due to a mismatch between the peak daytime O3 concentrations and stomatal opening (Heath et al., 2009). This means that the effective amount of O3 taken up by plants is not always correlated to the ambient O3 concentrations. The AOT40 index does not account for the plant's physiological control of stomatal opening, which limits the potential of the index to accurately assess the impacts of O3 on the vegetation. Future work should consider flux-based metrics, which have proven to be more suitable for ozone risk assessment on plants as they take into account the ambient concentration of O3, the physiological control on stomatal openings, and the efficiency of the leaf antioxidant system (Fares et al., 2010) as well as improved the O3 deposition routines in WRF-Chem so that they can take into account factors such as stomatal opening cycles.
An O3 tagging technique within the WRF-Chem model was used to investigate the origin of surface O3 from May to August 2015 and the contribution of different source regions to O3 regulatory metrics in the UK. Evaluation against observations presented in the Supplement has shown that the model setup gives a good representation of O3 in the European domain.
Domain-wide examination demonstrates that the hemispheric O3, here represented by lateral-boundary O3, has the largest impact on the concentrations of O3 in the UK, with an estimated 71 % of the modelled monthly mean surface O3 coming from this source region. About 16 % of modelled surface O3 is produced from anthropogenic NOx emissions within the EU that contain lumped NOx emissions from continental Europe; the Republic of Ireland; and ship emissions in the Atlantic, North Sea, Baltic Sea, and Mediterranean. UK emissions (England, Scotland, Wales, and Northern Ireland) contributed 13 %.
Assessment of the contributions to different receptor regions in the UK revealed that the UK relative contribution to UK surface O3 tends to be higher in June and July with a marked spatial gradient, with high mixing ratios obtained in the south-east and lower values in the north and west. In fact, UK NOx emissions are the second-largest contributor to surface O3 in the East Midlands, the West Midlands, Yorkshire and Humberside, East Anglia, the South East, and the London area after the lateral-boundary source region. The monthly and spatial variation in the contribution of UK NOx emissions to UK surface O3 is primarily caused by larger photochemical activity taking place during the summer months in the south and downwind of emission sources. Similarly, the absolute contribution from European sources to UK surface O3 tends to be higher in June and July and along much of the eastern, southern, and south-west borders, reflecting the effective transport of continental O3 by south-easterly winds during O3 pollution events. The tagging technique also shows that O3 from this region is generally transported to the UK rather than produced in situ.
O3 tagging has also made it possible to demonstrate that more stringent emission controls would be required in different source regions for compliance with UK and EU O3 standards, e.g. MDA8 O3 of 50 and 60 ppbv. Emission controls in France, in particular, would significantly reduce O3 concentrations in densely populated areas such as the South East, the South West, and East Anglia, while domestic emission controls are more relevant for the Midlands and the north of the UK. Exposure thresholds, such as those considered in the AOT40 O3 metric, are instead most affected by lateral-boundary components in the first place followed by UK NOx emissions. Emission controls in regions such as the East Midlands, the West Midlands, Yorkshire and Humberside, East Anglia, the South East, and the London area will aid in the mitigation of the impacts on crops. Nonetheless, emission controls will also be necessary over the larger Northern Hemisphere area.
The results from model simulation should be interpreted in the context of the observed bias in O3 (domain mean bias (MB) µg m−3) and the underestimation of the number of days with MDA8 O3 above 50 and 60 ppbv and the AOT40 metric. Also, controlling emissions of NO would not necessarily translate into a reduction in O3 concentration in the UK. In fact, for the AOT40 measure in rural regions it seems that reducing UK emissions might well still help improve the situation, whereas for urban regions, reducing NOx will increase O3 concentrations due to a reduction in the titration effect. In this regard, future work should consider extending the tagging mechanism to include the competing NOx–VOC interactions in O3 production. Emission perturbation studies might also complement the investigation by adding an understanding of response of O3 to different emission control scenarios.
The WRF-Chem model is publicly available at http://www2.mmm.ucar.edu/wrf/users/download/get_source.html (last access: 15 December 2020; NCAR, 2020). The modification described in Sect. 2 as well as the model output is available online via Zenodo at https://doi.org/10.5281/zenodo.6968040 (Romero-Alvarez, 2022a) and https://doi.org/10.5281/zenodo.6968649 (Romero-Alvarez, 2022b).
The supplement related to this article is available online at: https://doi.org/10.5194/acp-22-13797-2022-supplement.
JRA designed the study, conducted the numerical simulations, and analysed the data. The original tagging method was developed by AL and TB and adapted by JRA for this study. DL and SAN developed the emissions pre-processor. JRA wrote the paper under the supervision of CER, SD, and AB, with contribution from all authors.
At least one of the (co-)authors is a member of the editorial board of Atmospheric Chemistry and Physics. The peer-review process was guided by an independent editor, and the authors also have no other competing interests to declare.
Publisher's note: Copernicus Publications remains neutral with regard to jurisdictional claims in published maps and institutional affiliations.
The authors would like to thank Fabio Di Gioacchino and Ravan Ahmadov for providing feedback. We thank Leo Earl and Jimmy Cross (high-performance computing UEA) for their support in the compilation of the WRF-Chem model. We thank TNO for access to the TNO-MACC-III emissions inventory. The WRF-Chem simulations were performed on the high-performance research computer of the University of East Anglia, UK. We acknowledge the use of the WRF-Chem preprocessor tools (bio_emiss and fire_emiss, mozbc) provided by the Atmospheric Chemistry Observations & Modeling Lab (ACOM) of NCAR.
This research has been supported by the European Research Council; FP7 Ideas (ASIBIA (grant no. 616938)); the University of East Anglia; the Federal Ministry of Education and Research of Germany (BMBF); and the Ministry for Science, Research and Culture of the state of Brandenburg (MWFK; grant no. 01US1701).
This paper was edited by Andreas Hofzumahaus and reviewed by two anonymous referees.
Archer-Nicholls, S., Lowe, D., Utembe, S., Allan, J., Zaveri, R. A., Fast, J. D., Hodnebrog, Ø., Denier van der Gon, H., and McFiggans, G.: Gaseous chemistry and aerosol mechanism developments for version 3.5.1 of the online regional model, WRF-Chem, Geosci. Model Dev., 7, 2557–2579, https://doi.org/10.5194/gmd-7-2557-2014, 2014.
Atkinson, R.: Atmospheric chemistry of VOCs and NOx, Atmos. Environ., 34, 2063–2101, https://doi.org/10.1016/S1352-2310(99)00460-4, 2000.
Aulinger, A., Matthias, V., Zeretzke, M., Bieser, J., Quante, M., and Backes, A.: The impact of shipping emissions on air pollution in the greater North Sea region – Part 1: Current emissions and concentrations, Atmos. Chem. Phys., 16, 739–758, https://doi.org/10.5194/acp-16-739-2016, 2016.
Auvray, M. and Bey, I.: Long-range transport to Europe: Seasonal variations and implications for the European ozone budget, J. Geophys. Res.-Atmos., 110, 1–22, https://doi.org/10.1029/2004JD005503, 2005.
Badia, A. and Jorba, O.: Gas-phase evaluation of the online NMMB/BSC-CTM model over Europe for 2010 in the framework of the AQMEII-Phase2 project, Atmos. Environ., 115, 657–669, https://doi.org/10.1016/j.atmosenv.2014.05.055, 2015.
Beljaars, A. C. M.: The parametrization of surface fluxes in large scale models under free convection, Q. J. Roy. Meteor. Soc., 121, 255–270. https://doi.org/10.1002/qj.49712152203, 1995.
Butler, T., Lupascu, A., Coates, J., and Zhu, S.: TOAST 1.0: Tropospheric Ozone Attribution of Sources with Tagging for CESM 1.2.2, Geosci. Model Dev., 11, 2825–2840, https://doi.org/10.5194/gmd-11-2825-2018, 2018.
Butler, T., Lupascu, A., and Nalam, A.: Attribution of ground-level ozone to anthropogenic and natural sources of nitrogen oxides and reactive carbon in a global chemical transport model, Atmos. Chem. Phys., 20, 10707–10731, https://doi.org/10.5194/acp-20-10707-2020, 2020.
Chen, F. and Dudhia, J.: Coupling an Advanced Land Surface–Hydrology Model with the Penn State–NCAR MM5 Modeling System. Part I: Model Implementation and Sensitivity, Mon. Weather Rev., 129, 569–585, https://doi.org/10.1175/1520-0493(2001)129<0569:CAALSH>2.0.CO;2, 2001.
Chou, M.-D. and Suarez, M. J.: An efficient thermal infrared radiation parameterization for use in general circulation models, NASA Tech. Memo, 104606, 85, http://citeseerx.ist.psu.edu/viewdoc/summary?doi=10.1.1.26.4850 (last access: 20 January 2022), 1994.
Coyle, M., Smith, R. I., Stedman, J. R., Weston, K. J., and Fowler, D.: Quantifying the spatial distribution of surface ozone concentration in the UK, Atmos. Environ., 36, 1013–1024, https://doi.org/10.1016/S1352-2310(01)00303-X, 2002.
Dee, D. P., Uppala, S. M., Simmons, A. J., Berrisford, P., Poli, P., Kobayashi, S., Andrae, U., Balmaseda, M. A., Balsamo, G., Bauer, P., Bechtold, P., Beljaars, A. C. M., van de Berg, L., Bidlot, J., Bormann, N., Delsol, C., Dragani, R., Fuentes, M., Geer, A. J., Haimberger, L., Healy, S.B., Hersbach, H., Holm, E.V., Isaksen, L., Kallberg, P., Koehler, M., Matricardi, M., McNally, A. P., Monge-Sanz, B. M., Morcrette, J. J., Park, B. K., Peubey, C., de Rosnay, P., Tavolato, C., Thepaut, J. N., and Vitart, F.: The ERA-Interim reanalysis: Configuration and performance of the data assimilation system, Q. J. Roy. Meteor. Soc., 137, 553–597, https://doi.org/10.1002/qj.828, 2011.
DEFRA: Air Pollution in the UK, Report, https://uk-air.defra.gov.uk/assets/documents/annualreport/air_pollution_uk_2019_issue_1.pdf (last access: 20 January 2022), 2020.
Derwent, R. G., Stevenson, D. S., Collins, W. J., and Johnson, C. E.: Intercontinental transport and the origins of the ozone observed at surface sites in Europe, Atmos. Environ., 38, 1891–1901, https://doi.org/10.1016/j.atmosenv.2004.01.008, 2004.
Derwent, R. G, Simmonds, P. G., Manning, A. J., and Spain, T. G.: Trends over a 20-year period from 1987 to 2007 in surface ozone at the atmospheric research station, Mace Head, Ireland, Atmos. Environ., 41, 9091–9098, https://doi.org/10.1016/j.atmosenv.2007.08.008, 2007.
Derwent, R. G., Stevenson, D. S., Doherty, R. M., Collins, W. J., and Sanderson, M. G.: How is surface ozone in Europe linked to Asian and North American NOx emissions?, Atmos. Environ., 42, 7412–7422, https://doi.org/10.1016/j.atmosenv.2008.06.037, 2008.
Derwent, R. G, Manning, A. J., Simmonds, P. G., Spain, T. G., and O'Doherty, S.: Analysis and interpretation of 25 years of ozone observations at the Mace Head Atmospheric Research Station on the Atlantic Ocean coast of Ireland from 1987 to 2012, Atmos. Environ., 80, 361–368, https://doi.org/10.1016/j.atmosenv.2013.08.003, 2013.
Derwent, R. G., Utembe, S. R., Jenkin, M. E., and Shallcross, D. E.: Tropospheric ozone production regions and the intercontinental origins of surface ozone over Europe, Atmos. Environ., 112, 216–224, https://doi.org/10.1016/j.atmosenv.2015.04.049, 2015.
Derwent, R. G., Manning, A. J., Simmonds, P. G., Spain, T. G., and O'Doherty, S.: Long-term trends in ozone in baseline and European regionally-polluted air at Mace Head, Ireland over a 30-year period, Atmos. Environ., 179, 279–287, https://doi.org/10.1016/j.atmosenv.2018.02.024, 2018.
EEA: Air quality in Europe – 2017 report, European Environmental Agency, https://doi.org/10.2800/850018, 2017.
Emmons, L. K., Walters, S., Hess, P. G., Lamarque, J.-F., Pfister, G. G., Fillmore, D., Granier, C., Guenther, A., Kinnison, D., Laepple, T., Orlando, J., Tie, X., Tyndall, G., Wiedinmyer, C., Baughcum, S. L., and Kloster, S.: Description and evaluation of the Model for Ozone and Related chemical Tracers, version 4 (MOZART-4), Geosci. Model Dev., 3, 43–67, https://doi.org/10.5194/gmd-3-43-2010, 2010.
Emmons, L. K., Hess, P. G., Lamarque, J.-F., and Pfister, G. G.: Tagged ozone mechanism for MOZART-4, CAM-chem and other chemical transport models, Geosci. Model Dev., 5, 1531–1542, https://doi.org/10.5194/gmd-5-1531-2012, 2012.
Fares, S., Goldstein, A., and Loreto, F.: Determinants of ozone fluxes and metrics for ozone risk assessment in plants, J. Exp. Bot., 61, 629–633, https://doi.org/10.1093/jxb/erp336, 2010.
Finch, D. P. and Palmer, P. I.: Increasing ambient surface ozone levels over the UK accompanied by fewer extreme events, Atmos. Environ., 237, 117627, https://doi.org/10.1016/j.atmosenv.2020.117627, 2020.
Francis, X. V., Chemel, C., Sokhi, R. S., Norton, E. G., Ricketts, H. M. A., and Fisher, B. E. A.: Mechanisms responsible for the build-up of ozone over South East England during the August 2003 heatwave, Atmos. Environ., 45, 6880–6890, https://doi.org/10.1016/j.atmosenv.2011.04.035, 2011.
Fuhrer, J.: Ozone risk for crops and pastures in present and future climates, Naturwissenschaften, 96, 173–194, https://doi.org/10.1007/s00114-008-0468-7, 2009.
Grell, G. A. and Dévényi, D.: A generalized approach to parameterizing convection combining ensemble and data assimilation techniques, Geophys. Res. Lett., 29, 10–13, https://doi.org/10.1029/2002GL015311, 2002.
Grell, G. A., Peckham, S. E., Schmitz, R., McKeen, S. A., Frost, G., Skamarock, W. C., and Eder, B.: Fully coupled “online” chemistry within the WRF model, Atmos. Environ., 39, 6957–6975, https://doi.org/10.1016/j.atmosenv.2005.04.027, 2005.
Grewe, V., Dahlmann, K., Matthes, S., and Steinbrecht, W.: Attributing ozone to NOx emissions: Implications for climate mitigation measures, Atmos. Environ., 59, 102–107, https://doi.org/10.1016/j.atmosenv.2012.05.002, 2012.
Guenther, A. B., Jiang, X., Heald, C. L., Sakulyanontvittaya, T., Duhl, T., Emmons, L. K., and Wang, X.: The Model of Emissions of Gases and Aerosols from Nature version 2.1 (MEGAN2.1): an extended and updated framework for modeling biogenic emissions, Geosci. Model Dev., 5, 1471–1492, https://doi.org/10.5194/gmd-5-1471-2012, 2012.
Heal, M. R., Heaviside, C., Doherty, R. M., Vieno, M., Stevenson, D. S., and Vardoulakis, S.: Health burdens of surface ozone in the UK for a range of future scenarios, Environ. Int., 61, 36–44, https://doi.org/10.1016/j.envint.2013.09.010, 2013.
Heath, R. L., Lefohn, A. S., and Musselman, R. C.: Temporal processes that contribute to nonlinearity in vegetation responses to ozone exposure and dose, Atmos. Environ., 43, 2919–2928, https://doi.org/10.1016/j.atmosenv.2009.03.011, 2009.
Hong, S.-Y., Noh, Y., and Dudhia, J.: A new vertical diffusion package with an explicit treatment of entrainment processes, Mon. Weather Rev., 134, 2318–2341, https://doi.org/10.1175/MWR3199.1, 2006.
HTAP: Hemispheric Transport of Air Pollution 2010, Part A: Ozone and Particulate Matter, Air Pollution Studies, No. 17, Geneva, Switzerland, ISBN 9789211170436, 2010.
Huszar, P., Cariolle, D., Paoli, R., Halenka, T., Belda, M., Schlager, H., Miksovsky, J., and Pisoft, P.: Modeling the regional impact of ship emissions on NOx and ozone levels over the Eastern Atlantic and Western Europe using ship plume parameterization, Atmos. Chem. Phys., 10, 6645–6660, https://doi.org/10.5194/acp-10-6645-2010, 2010.
Iacono, M. J., Delamere, J. S., Mlawer, E. J., Shephard, M. W., Clough, S. A., and Collins, W. D.: Radiative forcing by long-lived greenhouse gases: Calculations with the AER radiative transfer models, J. Geophys. Res.-Atmos., 113, 1–8, https://doi.org/10.1029/2008JD009944, 2008.
Im, U., Bianconi, R., Solazzo, E., Kioutsioukis, I., Badia, A., Balzarini, A., Baró, R., Bellasio, R., Brunner, D., Chemel, C., Curci, G., Denier van der Gon, H., Flemming, J., Forkel, R., Giordano, L., Jiménez-Guerrero, P., Hirtl, M., Hodzic, A., Honzak, L., Jorba, O.,Knote, C., Kuenen, J. J. P., Makar, P. A., Manders-Groot, A.,Neal, L., Pérez, J. L., Pirovano, G., Pouliot, G., San Jose,R., Savage, N., Schroder, W., Sokhi, R. S., Syrakov, D., To-rian, A., Tuccella, P., Werhahn, J., Wolke, R., Yahya, K., Zabkar, R., Zhang, Y., Zhang, J., Hogrefe, C., and Galmarini, S.: Evaluation of operational on-line-coupled regional air quality models over Europe and North America in the context of AQMEII phase 2. Part I: Ozone, Atmos. Environ., 115, 404–420, https://doi.org/10.1016/j.atmosenv.2014.09.042, 2014.
Jenkin, M. E.: Trends in ozone concentration distributions in the UK since 1990: Local, regional and global influences, Atmos. Environ., 42, 5434–5445, https://doi.org/10.1016/j.atmosenv.2008.02.036, 2008.
Jenkin, M. E., Davies, T. J., and Stedman, J. R.: The origin and day of week dependence of photochemical ozone episodes in the UK, Atmos. Environ., 36, 999–1012, https://doi.org/10.1016/S1352-2310(01)00360-0, 2002.
Johnson, C. E., Collins, W. J., Stevenson, D. S., and Derwent, R. G.: Relative roles of climate and emissions changes on future tropospheric oxidant concentrations, J. Geophys. Res.-Atmos., 104, 18631–18645, https://doi.org/10.1029/1999JD900204, 1999.
Karamchandani, P., Long, Y., Pirovano, G., Balzarini, A., and Yarwood, G.: Source-sector contributions to European ozone and fine PM in 2010 using AQMEII modeling data, Atmos. Chem. Phys., 17, 5643–5664, https://doi.org/10.5194/acp-17-5643-2017, 2017.
Kley, D., Geiss, H., and Mohnen, V. A.: Tropospheric ozone at elevated sites and precursor emissions in the United States and Europe, Atmos. Environ., 28, 149–158, https://doi.org/10.1016/1352-2310(94)90030-2, 1994.
Knote, C., Tuccella, P., Curci, G., Emmons, L., Orlando, J. J., Madronich, S., Baró, R., Jiménez-Guerrero, P., Luecken, D., Hogrefe, C., Forkel, R., Werhahn, J., Hirtl, M., Pérez, J. L., San José, R., Giordano, L., Brunner, D., Yahya, K., and Zhang, Y.: Influence of the choice of gas-phase mechanism on predictions of key gaseous pollutants during the AQMEII phase-2 intercomparison, Atmos. Environ., 115, 553–568, https://doi.org/10.1016/j.atmosenv.2014.11.066, 2014.
Kuenen, J. J. P., Visschedijk, A. J. H., Jozwicka, M., and Denier van der Gon, H. A. C.: TNO-MACC_II emission inventory; a multi-year (2003–2009) consistent high-resolution European emission inventory for air quality modelling, Atmos. Chem. Phys., 14, 10963–10976, https://doi.org/10.5194/acp-14-10963-2014, 2014
Kuik, F., Lauer, A., Churkina, G., Denier van der Gon, H. A. C., Fenner, D., Mar, K. A., and Butler, T. M.: Air quality modelling in the Berlin–Brandenburg region using WRF-Chem v3.7.1: sensitivity to resolution of model grid and input data, Geosci. Model Dev., 9, 4339–4363, https://doi.org/10.5194/gmd-9-4339-2016, 2016.
Lee, J. D., Lewis, A. C., Monks, P. S., Jacob, M., Hamilton, J. F., Hopkins, J. R., Watson, N. M., Saxton, J. E., Ennis, C., Carpenter, L. J., Carslaw, N., Fleming, Z., Bandy, B. J., Oram, D. E., Penkett, S. A., Slemr, J., Norton, E., Rickard, A. R., K Whalley, L., Heard, D. E., Bloss, W. J., Gravestock, T.,Smith, S. C., Stanton, J., Pilling, M. J., and Jenkin, M. E.: Ozone photochemistry and elevated isoprene during the UK heatwave of august 2003, Atmos. Environ., 40, 7598–7613, https://doi.org/10.1016/j.atmosenv.2006.06.057, 2006.
Lin, Y.-L., Farley, R. D., and Orville, H. D.: Bulk Parameterization of the Snow Field in a Cloud Model, J. Clim. Appl. Meteorol., 22, 1065–1092, https://doi.org/10.1175/1520-0450(1983)022<1065:BPOTSF>2.0.CO;2, 1983.
Li, Q.: Transatlantic transport of pollution and its effects on surface ozone in Europe and North America, J. Geophys. Res., 107, 4166, https://doi.org/10.1029/2001JD001422, 2002.
Lupaşcu, A. and Butler, T.: Source attribution of European surface O3 using a tagged O3 mechanism, Atmos. Chem. Phys., 19, 14535–14558, https://doi.org/10.5194/acp-19-14535-2019, 2019.
Lupaşcu, A., Otero, N., Minkos, A., and Butler, T.: Attribution of surface ozone to NOx and volatile organic compound sources during two different high ozone events, Atmos. Chem. Phys., 22, 11675–11699, https://doi.org/10.5194/acp-22-11675-2022, 2022.
Mar, K. A., Ojha, N., Pozzer, A., and Butler, T. M.: Ozone air quality simulations with WRF-Chem (v3.5.1) over Europe: model evaluation and chemical mechanism comparison, Geosci. Model Dev., 9, 3699–3728, https://doi.org/10.5194/gmd-9-3699-2016, 2016.
Mertens, M., Grewe, V., Rieger, V. S., and Jöckel, P.: Revisiting the contribution of land transport and shipping emissions to tropospheric ozone, Atmos. Chem. Phys., 18, 5567–5588, https://doi.org/10.5194/acp-18-5567-2018, 2018.
Monks, P. S.: A review of the observations and origins of the spring ozone maximum, Atmos. Environ., 34, 3545–3561, https://doi.org/10.1016/S1352-2310(00)00129-1, 2000.
Monks, P. S.: Gas-phase radical chemistry in the troposphere, Chem. Soc. Rev., 34, 376–395, https://doi.org/10.1039/b307982c, 2005.
Munir, S., Chen, H., and Ropkins, K.: Quantifying temporal trends in ground level ozone concentration in the UK, Sci. Total Environ., 458–460, 217–227, https://doi.org/10.1016/j.scitotenv.2013.04.045, 2013.
NCAR: WRF-Chem model, NCAR [code], http://www2.mmm.ucar.edu/wrf/users/download/get_source.html, last access: 15 December 2020.
Ordóñez, C., Barriopedro, D., García-Herrera, R., Sousa, P. M., and Schnell, J. L.: Regional responses of surface ozone in Europe to the location of high-latitude blocks and subtropical ridges, Atmos. Chem. Phys., 17, 3111–3131, https://doi.org/10.5194/acp-17-3111-2017, 2017.
Pilling, M., ApSimon, H., Carruthers, D., Carslaw, D., Colvile, R., Derwent, D., Dorling, S., Fisher, B., Harrison, R., Heal, M., Laxen, D., Lindley, S., McCrae, I., and Stedman, J.: Ozone in the United Kingdom, Defra Defra publications, Department for the Environment, Food and Rural Affairs, London, 156 pp., ISBN: 978-0-85521-184-4, 2009.
Pirovano, G., Balzarini, A., Bessagnet, B., Emery, C., Kallos, G., Meleux, F., Mitsakou, C., Nopmongcol, U., Riva,G., and Yarwood, G.: Investigating impacts of chemistry and transport model formulation on model performance at European scale, Atmos. Environ., 53, 93–109, https://doi.org/10.1016/j.atmosenv.2011.12.052, 2012.
Pope, R. J., Butt, E. W., Chipperfield, M. P., Doherty, R. M., Fenech, S., Schmidt, A., Arnold, S. R., and Savage, N. H.: The impact of synoptic weather on UK surface ozone and implications for premature mortality, Environ. Res. Lett., 11, 124004, https://doi.org/10.1088/1748-9326/11/12/124004, 2016.
Powers, J. G., Klemp, J. B., Skamarock, W. C., Davis, C. A., Dudhia, J., Gill, D. O., Coen, J. L., Gochis, D. J., Ahmadov, R., Peckham, S. E., Grell, G. A., Michalakes, J., Trahan, S., Benjamin, S. G., Alexander, C. R., Dimego, G. J., Wang, W., Schwartz, C. S., Romine, G. S., Liu, Z., Sny-der, C., Chen, F., Barlage, M., Yu, W., and Duda, M. G.: The weather research and forecasting model: Overview, system efforts, and future directions, B. Am. Meteorol. Soc., 98, 1717–1737, https://doi.org/10.1175/BAMS-D-15-00308.1, 2017.
Reidmiller, D. R., Fiore, A. M., Jaffe, D. A., Bergmann, D., Cuvelier, C., Dentener, F. J., Duncan, B. N., Folberth, G., Gauss, M., Gong, S., Hess, P., Jonson, J. E., Keating, T., Lupu, A., Marmer, E., Park, R., Schultz, M. G., Shindell, D. T., Szopa, S., Vivanco, M. G., Wild, O., and Zuber, A.: The influence of foreign vs. North American emissions on surface ozone in the US, Atmos. Chem. Phys., 9, 5027–5042, https://doi.org/10.5194/acp-9-5027-2009, 2009.
Romero-Alvarez, J.: WRF-Chem ozone tagging output, Zenodo [code], https://doi.org/10.5281/zenodo.6968040, 2022a.
Romero-Alvarez, J.: WRF-Chem ozone tagging output, Zenodo [data set], https://doi.org/10.5281/zenodo.6968649, 2022b.
Romero-Alvarez, J., Lupaşcu, A., Lowe, D., Archer-Nicholls, L., Bloss, W., Reeves, C., and Butler, T.: The source of ozone during a high concentration episode in South England, in preparation, 2022.
Sillman, S.: The relation between ozone, NO and hydrocarbons in urban and polluted rural environments, Atmos. Environ., 33, 1821–1845, https://doi.org/10.1016/S1352-2310(98)00345-8, 1999.
Stevenson, D. S., Dentener, F. J., Schultz, M. G., Ellingsen, K., van Noije, T. P. C., Wild, O., Zeng, G., Amann, M., Atherton, C. S., Bell, N., Bergmann, D. J., Bey, I., Butler, T., Cofala, J., Collins, W. J., Derwent, R. G., Doherty, R. M., Drevet, J., Eskes, H. J., Fiore, A. M., Gauss, M., Hauglustaine, D. A., Horowitz, L. W., Isaksen, I. S. A., Krol, M. C., Lamarque, J.-F., Lawrence, M. G., Montanaro, V., Muller, J. F., Pitari, G., Prather, M. J., Pyle, J. A., Rast, S., Rodriguez, J. M., Sanderson, M. G., Savage, N. H., Shindell, D. T., Strahan, S. E., Sudo, K., and Szopa, S.: Multimodel ensemble simulations of present-day and near-future tropospheric ozone, Geophys. Res. Lett., 111, D08301, https://doi.org/10.1029/2005JD006338, 2006.
Stock, Z. S., Russo, M. R., Butler, T. M., Archibald, A. T., Lawrence, M. G., Telford, P. J., Abraham, N. L., and Pyle, J. A.: Modelling the impact of megacities on local, regional and global tropospheric ozone and the deposition of nitrogen species, Atmos. Chem. Phys., 13, 12215–12231, https://doi.org/10.5194/acp-13-12215-2013, 2013.
Stone, D., Evans, M. J., Walker, H., Ingham, T., Vaughan, S., Ouyang, B., Kennedy, O. J., McLeod, M. W., Jones, R. L., Hopkins, J., Punjabi, S., Lidster, R., Hamilton, J. F., Lee, J. D., Lewis, A. C., Carpenter, L. J., Forster, G., Oram, D. E., Reeves, C. E., Bauguitte, S., Morgan, W., Coe, H., Aruffo, E., Dari-Salisburgo, C., Giammaria, F., Di Carlo, P., and Heard, D. E.: Radical chemistry at night: comparisons between observed and modelled HOx, NO3 and N2O5 during the RONOCO project, Atmos. Chem. Phys., 14, 1299–1321, https://doi.org/10.5194/acp-14-1299-2014, 2014.
Sudo, K. and Akimoto, H.: Global source attribution of tropospheric ozone: Long-range transport from various source regions, J. Geophys. Res.-Atmos., 112, 1–21, https://doi.org/10.1029/2006JD007992, 2007.
Tarrason, L., Hamer, P., Guerreiro, C., Meleux, F., and Rouil, L.: Interim Annual Assessment Report for 2015 – European air quality in 2015, https://doi.org/10.13140/RG.2.2.15127.78249, 2016.
Tørseth, K., Aas, W., Breivik, K., Fjæraa, A. M., Fiebig, M., Hjellbrekke, A. G., Lund Myhre, C., Solberg, S., and Yttri, K. E.: Introduction to the European Monitoring and Evaluation Programme (EMEP) and observed atmospheric composition change during 1972–2009, Atmos. Chem. Phys., 12, 5447–5481, https://doi.org/10.5194/acp-12-5447-2012, 2012.
Tuccella, P., Curci, G., Visconti, G., Bessagnet, B., and Menut,L.: Modeling of gas and aerosol with WRF/Chem over Europe: Evaluation and sensitivity study, J. Geophys. Res., 117, D03303, https://doi.org/10.1029/2011JD016302, 2012.
van der Werf, G. R., Randerson, J. T., Giglio, L., Collatz, G. J., Mu, M., Kasibhatla, P. S., Morton, D. C., DeFries, R. S., Jin, Y., and van Leeuwen, T. T.: Global fire emissions and the contribution of deforestation, savanna, forest, agricultural, and peat fires (1997–2009), Atmos. Chem. Phys., 10, 11707–11735, https://doi.org/10.5194/acp-10-11707-2010, 2010.
Wild, O., Pochanart, P., and Akimoto, H.: Trans-Eurasian transport of ozone and its precursors, J. Geophys. Res.-Atmos., 109, 1–16, https://doi.org/10.1029/2003JD004501, 2004.
World Health Organization (WHO): Ambient Air Pollution: A Global Assessment Of Exposure And Burden Of Disease, Vol. 121, World Health Organization, Geneva, 1–131, ISBN 9789241511353, 2016.