the Creative Commons Attribution 4.0 License.
the Creative Commons Attribution 4.0 License.
 | 21 Oct 2022
The influence of the addition of isoprene on the volatility of particles formed from the photo-oxidation of anthropogenic–biogenic mixtures
Aristeidis Voliotis
Yunqi Shao
Thomas J. Bannan
Michael Flynn
Spyros N. Pandis
Carl J. Percival
M. Rami Alfarra
Gordon McFiggans
In this study, we investigate the influence of isoprene on the volatility of secondary organic aerosol (SOA) formed during the photo-oxidation of mixtures of anthropogenic and biogenic precursors. The SOA particle volatility was quantified using two independent experimental techniques (using a thermal denuder and the Filter Inlet for Gas and Aerosols iodide high-resolution time-of-flight Chemical Ionisation Mass Spectrometer – FIGAERO-CIMS) in mixtures of α-pinene/isoprene, o-cresol/isoprene, and α-pinene/o-cresol/isoprene. Single-precursor experiments at various initial concentrations and results from previous α-pinene/o-cresol experiments were used as a reference. The oxidation of isoprene did not result in the formation of detectable SOA particle mass in single-precursor experiments. However, isoprene-derived products were identified in the mixed systems, likely due to the increase in the total absorptive mass. The addition of isoprene resulted in mixture-dependent influence on the SOA particle volatility. Isoprene made no major change to the volatility of α-pinene SOA particles, though changes in the SOA particle composition were observed and the volatility was reasonably predicted based on the additivity. Isoprene addition increased o-cresol SOA particle volatility by % of the total mass/signal, respectively, indicating a potential to increase the overall volatility that cannot be predicted based on the additivity. The addition of isoprene to the α-pinene/o-cresol system (i.e. α-pinene/o-cresol/isoprene) resulted in slightly fewer volatile particles than those measured in the α-pinene/o-cresol systems. The measured volatility in the α-pinene/o-cresol/isoprene system had an ∼6 % higher low volatile organic compound (LVOC) mass/signal compared to that predicted assuming additivity with a correspondingly lower semi-volatile organic compound (SVOC) fraction. This suggests that any effects that could increase the SOA volatility from the addition of isoprene are likely outweighed by the formation of lower-volatility compounds in more complex anthropogenic–biogenic precursor mixtures. Detailed chemical composition measurements support the measured volatility distribution changes and showed an abundance of unique-to-the-mixture products appearing in all the mixed systems accounting for around 30 %–40 % of the total particle-phase signal. Our results demonstrate that the SOA particle volatility and its prediction can be affected by the interactions of the oxidized products in mixed-precursor systems, and further mechanistic understanding is required to improve their representation in chemical transport models.
- Article
(2424 KB) - Full-text XML
-
Supplement
(1255 KB) - BibTeX
- EndNote


Aerosol particles are ubiquitous in the atmosphere. They influence the Earth's climate directly through scattering and absorption of solar radiation as well as indirectly by altering cloud properties (Ramanathan et al., 2001; Andreae and Rosenfeld, 2008). Moreover, particulate matter (PM) affects human health and is associated with millions of deaths and reduced life expectancy (Cohen et al., 2017; Brunekreef and Holgate, 2002; Cohen et al., 2005). An accurate representation of the aerosol particles and their associated impacts in predictive models can contribute to the development of more effective mitigation policies.
The organic aerosol (OA) fraction comprises 20 %–90 % of the total fine PM mass and may originate from numerous sources and chemical processes (Jimenez et al., 2009; Kanakidou et al., 2005). Secondary organic aerosol (SOA) is formed from the oxidation of volatile (VOCs), intermediate volatility (IVOCs), and semi-volatile (SVOCs) organic compounds in the atmosphere and accounts for a substantial part of the OA (Srivastava et al., 2018; Hallquist et al., 2009). The diversity of emission sources and transformation pathways of SOA results in a chemically highly complex mixture (Goldstein and Galbally, 2007), which is extremely challenging to represent accurately in predictive models (Shrivastava et al., 2017; Hallquist et al., 2009).
The majority of predictive models currently represent SOA in a simplified way (Tsigaridis et al., 2014; Shrivastava et al., 2017). The SOA particle mass is usually predicted based on the extrapolation of the SOA yields from single SOA precursor laboratory studies (Kanakidou et al., 2005). Recently, the volatility basis set (VBS; Donahue et al., 2006, 2012) under the assumption of equilibrium absorptive partitioning has been developed and implemented in such models to predict the formation and evolution of SOA (Shrivastava et al., 2011; Giani et al., 2019; Koo et al., 2014; Tsimpidi et al., 2018). The SOA volatility distribution used in such models is obtained directly or indirectly from laboratory/field studies (Zhao et al., 2016; Giani et al., 2019). Additivity is implicitly assumed, as the coexistence of multiple reacting VOCs does not affect the volatility distribution of the SOA formed from each precursor. However, despite these advances, computer models still face challenges in accurately predicting the SOA loadings (Shrivastava et al., 2017), potentially due to the lack of parameterizations capturing explicit physical and chemical processes occurring as the OA forms and evolves in the atmosphere (Shrivastava et al., 2015; McFiggans et al., 2019; Jimenez et al., 2009; Donahue et al., 2012).
Recent laboratory evidence demonstrated that the SOA formation potential in the presence of multiple precursors can be affected by the mechanistic interactions between the products (McFiggans et al., 2019; Shilling et al., 2019; Berndt et al., 2018a). The SOA particle volatility can also change due to those interactions, for example in the anthropogenic–biogenic VOC systems investigated by Voliotis et al. (2021). It is important to understand the molecular interactions that have a central impact on the SOA formation and properties in the presence of multiple VOC precursors. Considering that the ambient atmosphere is a complex mixture of various anthropogenic and biogenic VOCs (aVOCs and bVOCs, respectively), these findings highlight the need to investigate the volatility changes in mixtures and their implications for the SOA formation and transformation.
The volatility of the oxidation products formed either in the gas or particle phase is largely controlled by the attained functionalities (McFiggans et al., 2010; Barley et al., 2009; Topping et al., 2011) as well as the molecular weight of the molecules (Kroll and Seinfeld, 2008; Shrivastava et al., 2017). The oxidation products of multiple coexisting VOC precursors may react with each other in either phase through radical termination reactions (Schervish and Donahue, 2020), leading to the formation of unique products. These interactions can also inhibit the formation of products that would otherwise have been formed in simpler systems, a process known as product scavenging (McFiggans et al., 2019). In our recent work on mixtures of α-pinene and o-cresol, we have established a methodology to investigate the links between the SOA composition and volatility in experiments conducted in an atmospheric simulation chamber (Voliotis et al., 2021). More specifically, we showed that the unique products found in the mixture had a high oxygen content, molecular weight (MW), and oxidation state (, resulting in lowering of the average particle volatility. At the same time, the scavenging of high-MW and low-volatility α-pinene-derived products was increasing the SOA volatility. These processes resulted in a volatility distribution of the mixture being somewhere in between those measured in the single-precursor experiments. Understanding the impacts of those interactions on the SOA particle volatility in multiple mixed-precursor systems might therefore improve their representation in predictive models.
In this paper, we extend our previous work in mixtures of α-pinene and o-cresol by adding isoprene, the most abundant BVOC with low SOA particle yield (Carlton et al., 2009), to the reacting mixtures. We investigate the SOA particle volatility changes in the photo-oxidation of isoprene-containing binary systems (α-pinene/isoprene and o-cresol/isoprene) and also ternary mixtures (i.e. α-pinene/o-cresol/isoprene). We then evaluate whether the photochemical evolution of mixed VOC systems leads to particles with comparable volatility to the sum of the individual systems assuming additivity. Detailed SOA chemical composition measurements are used to contextualize our findings and to interpret any similarities or discrepancies between the measured and predicted SOA particle volatility.
2.1 Experimental procedure
In this work, we assess the influence of isoprene on the volatility of SOA formed from the photo-oxidation of α-pinene, o-cresol, and their mixture in the presence of NOx and neutral inorganic seed particles using the Manchester Aerosol Chamber (MAC). Three types of experiments were conducted: (a) single-precursor experiments, in which the photo-oxidation of each precursor was studied individually, (b) binary experiments, in which the photo-oxidation of mixtures of α-pinene/isoprene and o-cresol/isoprene was studied, and (c) ternary experiments, in which all three precursors, α-pinene, o-cresol, and isoprene, were oxidized simultaneously. Following Voliotis et al. (2021, 2022), all experiments were designed to start with initial iso-reactivity; the injected VOC concentrations were selected based on the ratios of the inverse of their IUPAC-recommended rate constants at 298 K towards the OH (see Voliotis et al., 2022). This approach ensures that at the beginning of each experiment each VOC in the mixture will have equal chances of reacting with the dominant oxidant, and thereby they will have equal contributions to the first generation of products. The production of ozone during the experiments due to the presence of NOx (Atkinson, 2000) and the formation of oxidation products with their own reactivity towards both major oxidants ensure that the systems will deviate from iso-reactivity to a greater or lesser extent during the experiments.
In all single-precursor experiments, isoprene did not form SOA particle mass above the background levels (i.e. ∼1 µg m−3). Therefore, the isoprene single-precursor experiments are not discussed further. This effectively zero SOA particle mass yield of isoprene enables straightforward comparison of the composition and volatility between systems. In the binary systems, comparing the SOA particle composition and volatility of the mixture with those obtained at the respective single-precursor experiments (e.g. α-pinene/isoprene versus α-pinene) can provide direct evidence of the changes due the addition of isoprene. Similarly, in the ternary mixture, comparing its composition and volatility with the α-pinene/o-cresol system can illustrate the influence of isoprene on the behaviour of that mixture. What is less straightforward is the effect of the initial VOC concentrations used in the single, binary, and ternary experiments. The use of different concentrations was necessary to achieve similar initial reactivity between the systems. Consequently, to investigate the effect of the initial VOC concentration on the SOA particle composition and volatility, we conducted additional single-precursor experiments at half and one-third initial concentration for α-pinene and at half the initial levels for o-cresol. The α-pinene and o-cresol single-precursor at full reactivity and the α-pinene/o-cresol mixture experiments have been described in detail in Voliotis et al. (2021). Their results are summarized in the section comparing the composition and volatility across systems and reactivity levels.
In order to explore the role of mechanistic interactions in the mixtures, we estimate the expected SOA volatility in all the binary and ternary mixtures by summing the volatility distributions obtained from the respective single-precursor systems (i.e. based on additivity). Details are provided in Sect. 2.4.3. Briefly, in the isoprene-containing binary systems, i.e. α-pinene/isoprene and o-cresol/isoprene, the expected SOA particle volatility will be equal to those measured in the α-pinene and o-cresol single-precursor experiments, respectively, adjusted to the same total absorptive mass. In systems where more than one precursor contributes to the SOA mass (i.e. α-pinene/o-cresol and ternary), such predictions may provide additional insights into the roles that mixing might play in SOA particle formation. The difference between the measured and expected (predicted) volatility distributions can serve as a quantitative metric of the magnitude of the effect of the molecular interactions on the SOA particle volatility.
All the experiments were performed under moderate relative humidity (50±5 %) and room temperature (24±2 ∘C) in the presence of NO2 (VOC NO ppb ppb−1) and ammonium sulfate seed particles (54±11 µg m−3). A summary of the initial experimental conditions is provided in Table 1. Each experiment was performed following procedures described in detail in Voliotis et al. (2021, 2022). Briefly, the “chamber stabilization” phase (∼1 h) was initialized when the chamber was filled with clean air in the absence of any of the reactants, followed by the “dark unreactive” phase (∼1 h) where all the reactants (VOC, NO2, and seeds) were added in the dark. The “experiment” phase (∼6 h) started when the lights were turned on, indicating the initialization of the photo-oxidation and SOA production. The data collected during the “chamber stabilization” and the “dark unreactive” phase were used as baselines to correct the data obtained during the “experiment” phase (see Sect. 2.4.1). Prior to and after each experiment the chamber was flushed with a high flow rate (∼3 m3 min−1) of purified air. The initial concentrations in the clean chamber were particle number concentrations ≤15 cm−3, O3≤1 ppb, NOx≤8 ppb (NO ≤ 6 ppb; NO2 ≤ 2 ppb), and VOC ∼0 ppb (Shao et al., 2022).
Table 1Summary of initial experimental conditions.

NA: not available data.
2.1.1 Manchester Aerosol Chamber
All the experiments were conducted at the 18 m3 fluorinated ethylene propylene (FEP) MAC, operating as a batch reactor (Shao et al., 2022). The MAC is enclosed in a temperature and relative humidity-controlled housing. Due to its design, the chamber can expand and collapse as the air volume changes and thereby does not require dilution of the sample. The mixing and temperature control is achieved with the usage of an air conditioning unit (Denco C3-05), which circulates air around the chamber housing at a high flow rate, setting its walls in constant motion and resulting in effective mixing throughout the experiments. A combination of two 6 kW Xenon arc lamps (XBO 6000 W/HSLA OFR, Osram) equipped with quartz glass filters and a series of halogen lamps (Solux 50 W/4700 K, Solux MR16, USA) is used to illuminate the chamber mimicking the atmospheric radiation spectrum as closely as possible (Shao et al., 2022). Steady-state actinometry experiments showed a photolysis rate of NO2 ( at 0.135±0.024 min−1, while the average OH concentrations for all experiments conducted here were estimated at around molec. cm−3 (Voliotis et al., 2022). VOCs are produced by evaporating the corresponding liquids (α-pinene, isoprene, and o-cresol; Sigma-Aldrich, GC grade ≥99.99 % purity) in a gently heated glass bulb and are transferred to the MAC using an electronic capture device-grade nitrogen stream (ECD N2; N4.8 purity ≥99.998 %). An aerosol generator (Topaz model ATM 230) was employed to produce seed particles using aqueous solutions of ammonium sulfate of concentration 10 g L−1 (Puratonic, 99.999 % purity). This resulted in a seed population with a mode diameter of 67±6 nm and a total surface area of nm2 cm−3. NO2 is added to the chamber using custom-made cylinders (10 % ) using ECD N2 as a carrier gas. Seeds, NO2, and VOCs are added to the chamber at a high flow rate (∼3 m3 min−1), ensuring rapid initial mixing (Shao et al., 2022).
2.2 Instrumentation
Particle size distributions in the range of 10–670 nm were measured employing a scanning mobility particle sizer (SMPS; TSI DMA 3081 and CPC 3776, TSI Inc., USA). Non-refractory aerosol chemical composition was measured using a high-resolution aerosol mass spectrometer (HR-AMS), regularly calibrated according to well-known and previously published procedures (Jimenez et al., 2003; Allan et al., 2004; Voliotis et al., 2021). A thermal denuder (TD) installed upstream of the SMPS and HR-AMS and operated at 30–90 ∘C in 12 steps was used to study the aerosol evaporation during the last 2 h of each experiment. During that period, the SMPS and HR-AMS sampling was alternated between the TD and the main sampling line (i.e. bypass) every 6 and 4 min, respectively. The Filter Inlet for Gas and Aerosols (Lopez-Hilfiker et al., 2014) coupled to an iodide high-resolution time-of-flight Chemical Ionisation Mass Spectrometer (Lee et al., 2014; hereafter FIGAERO-CIMS) was used to provide near-real-time gas- and particle-phase compositions. A semi-continuous gas chromatograph (6850 Agilent) coupled to a mass spectrometer (5975C Agilent; hereafter GC-MS) equipped with a thermal desorption unit (Markes TT-24/7) was used to monitor the concentration of VOC precursors during the experiments. All the instruments were sampling air from the middle of the chamber using stainless steel and PTFE tubing (OD: ) for the particle- and gas-phase measurements.
The FIGAERO-CIMS was configured to operate in cyclic mode using the following procedure: (i) 30 min of gas-phase sampling at 1 L min−1 and simultaneous particle collection on a PTFE filter (Zefluor, 2.0 µm pore size) at 1 L min−1, (ii) 15 min thermal desorption of the collected particles from ambient to 200 ∘C using ultra-high-purity (UHP) N2 as a carrier gas, (iii) 10 min soaking period, where the temperature was held constant at 200 ∘C and (iv) 10 min of cooling period. The sample flow over the PTFE filter and downstream of the exhaust of the ion molecule region (IMR) was continuously monitored using two MKS mass flow meters to ensure known volumes of air sampled. The instrument was run in negative-ion mode with I− reagent ion in all the experiments. The reagent ions were produced by passing CH3I and UHP N2 over a 210Po radioactive source introduced directly into the IMR. Due to the particularly low organic concentrations in the first hours of the experiments with the o-cresol and o-cresol/isoprene systems as well as for comparison with the TD measurements, all the results shown here by the FIGAERO-CIMS correspond to the data obtained during the last FIGAERO-CIMS cycle of each experiment (i.e. >5 h after lights on).
As a result of a lack of calibration standards and the experimental limitations associated with the FIGAERO-CIMS operation, the quantification of the observed signals remains challenging (Riva et al., 2019). Consequently, in this study, uniform instrument sensitivity was assumed for all the detected products. Detailed description of the instrumentation and the experimental set-up is provided in Voliotis et al. (2021).
2.3 Background corrections and data treatment
The mass fraction remaining (MFR) of the aerosol particles after passing through the TD unit at each temperature step was calculated as the ratio of the SOA particle mass (measured by the HR-AMS) passing through the TD to the average SOA particle mass at the bypass line before and after each temperature step. The particle losses in each temperature in the TD were estimated based on characterization experiments conducted with the same instrument configuration using sodium chloride particles and a SMPS measuring the total particle mass. The obtained SOA particle MFR was then corrected to account for particle losses in the TD (Voliotis et al., 2021). The HR-AMS collection efficiency was assumed to be the same at all temperatures used.
The Tofware package in Igor Pro (v. 3.2.1., Wavemetrics) (Stark et al., 2015) was employed for the data analysis and peak identification of the FIGAERO-CIMS data. I−, CH2O2I−, I, and I were used for the mass-to-charge () calibration, resulting in an error of less than 3 ppm. The HR analysis and peak identification were performed in the 190–550 range based on the mass defect until no possible formulas were available within a reasonable fitting error (6 ppm). In all the experiments conducted, this resulted in ≥70 % of the total signal (excluding reagent ions) being assigned. All the HR peaks that had signal-to-noise ratios below 2 () were removed from the analysis. In this work, only the assigned fraction of the signal is considered. After the peak identification procedure, the data collected in each thermal desorption (hereafter particle phase) and gas-phase sampling cycles were grouped separately, and each HR peak was background-corrected according to Voliotis et al. (2021). Briefly, in order to account for any potential instrument contamination in either phase as well as any chamber background and/or filter/seed effects, a two-step correction procedure was followed. In the first step, the data collected during the assumed “instrument background” periods in each cycle were subtracted from the measured data to account for any potential instrument contamination. During the gas-phase sampling, the instrument was periodically flushed with high-purity N2 in order to establish a dynamic gas-phase “instrument background” signal, which was subtracted from the measurements. A corresponding “instrument background” was assumed for the particle-phase measurements to be the 60th–90th second of the desorption cycle as shown in Voliotis et al. (2021). In the second step, the data collected during the “chamber stabilization” phase (see Sect. 2.1) were subtracted from the gas-phase measurements to account for any potential background gas-phase species in the MAC. Correspondingly, to account for any potential chamber background and/or seed effects, the particle-phase data collected during the “dark unreactive” phase (i.e. background filter collected when the chamber was filled with the VOC(s) and seed particles in the dark) were subtracted from the particle-phase measurements.
2.4 SOA particle volatility estimation
The SOA particle volatility was estimated here based on both the TD and FIGAERO-CIMS measurements. The SOA particle volatility from the TD measurements was estimated using the algorithm of Karnezi et al. (2014). The algorithm is based on the thermodynamic mass transfer model of Riipinen et al. (2010) and employs forward and inverse modelling combined with an error propagation and minimization procedure to interpret the MFR data. Briefly, the model selects appropriate volatility distributions expressed in the VBS framework, enthalpies of vaporization, and mass accommodation coefficients to fit the MFR data. Any potential temperature gradients in the TD are neglected, while the size distribution of the aerosol particles is considered to be monodisperse, having a diameter equal to the mean volumetric diameter (defined by the SMPS measurements). Furthermore, in addition to the MFR and the mean volumetric diameter, the model uses the characteristics of the TD, such as the length of the heating section (0.51 m) and the aerosol residence time (31 s), and the SOA particle characteristics, such as the density (1.4 g cm−3) and the total absorptive mass concentration (Ctot). Here, the volatility distributions were estimated in the 10g m region.
The SOA particle volatility can be estimated from the FIGAERO-CIMS measurements based on various approaches (e.g. explicit calibrations with compounds of known vapour pressure, absorptive partitioning calculations, and empirical equations; e.g. Bannan et al., 2019; Stark et al., 2017). In our previous work (Voliotis et al., 2021), we contrasted the volatilities obtained from the partitioning approach with those from the thermogram-based approach using explicit Tmax−Vp calibrations for a subset of the systems studied here. Despite us showing that the volatility quantification from both approaches was challenging, the volatility derived from the partitioning calculations was more realistic and broadly comparable with the concurrent TD measurements. Therefore, in this study, we selected the partitioning approach to estimate the SOA particle volatility from the FIGAERO-CIMS measurements. The SOA particle volatility was estimated using the gas- and particle-phase concentrations (ions m−3) of each identified ion and the absorptive partitioning theory (Pankow, 1994). Briefly, the partitioning coefficient (fp) of each identified HR peak was calculated as
where Particlei and Gasi are the concentrations of each HR peak in the particle and gas phases (ions m−3), respectively. Based on the absorptive partitioning theory, the fp was converted to effective saturation concentration (C∗) using the total absorptive mass. For ease of interpretation, in the current paper we consider only the mass of organic material in the particle to be an effective absorptive medium in the partitioning of organic species. This is a reasonable approach since the nominally injected mass of inorganic seed particles was constant in all experiments, and it is likely that the strong non-ideality in the mixing with inorganic components will lead to modest, if any, enhancement in the component's partitioning. The resultant volatility of the identified compounds in each system was expressed in logarithmically spaced bins in the VBS framework as
In either of these approaches, the sum of the volatility bins having µg m−3 was considered as low volatile organic compounds (LVOCs), the sum those between µg m−3 were considered as semi-volatile organic compounds (SVOCs) and the sum of those with were considered as intermediate volatile organic compounds (IVOCs). It should be noted that in both volatility estimation approaches, the bin with may also include any extremely low-volatility VOCs (ELVOCs) present. Similarly, in the TD results, the bin with may include compounds with even higher volatility that belong in the IVOC fraction.
2.5 SOA particle volatility prediction assuming additivity
The SOA particle volatility of the α-pinene/o-cresol and α-pinene/o-cresol/isoprene systems was estimated based on additivity that assumes no chemical interactions between the products of the various precursors. More specifically, the predicted mass fraction (PMF) of the products of each individual precursor (VOCi) in the organic aerosol phase was estimated based on the VOC consumption (ΔVOCi) and the SOA yields measured ( in the single-precursor experiments as
Subsequently, the volatility distributions of the SOA products of precursor i in the binary/ternary systems were estimated by weighting the sum of the volatility distributions measured in the single-precursor experiments with their predicted mass fractions:
where P is the predicted effective saturation concentration in the volatility bin j and is the effective saturation concentration of the products measured in the single-precursor experiments of each VOCi involved at bin j.
The different total SOA concentrations (Ctot) in the experiments conducted for each system and reactivity level (Table 1) also affect the gas–particle partitioning of the species (Pankow, 1994) and thereby the resulting measured volatility distributions. Therefore, in order to predict the volatility distributions with this approach assuming additivity, all the measured volatilities have to be adjusted to the same Ctot. For the volatility distributions obtained by the TD, we can adjust the measured volatility distributions by running simulations at the desired total absorptive mass concentration (see Sect. 2.5). The volatility distribution measured by the FIGAERO-CIMS at a certain Ctot can be adjusted to any desired Ctot by calculating the partitioning coefficient (fp) of each of the identified species, i, at the measured and desired Ctot:
where is the estimated effective saturation concentration of each individual species derived from the partitioning approach at the Ctot levels of each individual experiment (Eq. 2). By multiplying the particle-phase FIGAERO-CIMS signal of each individual compound i by the ratio of the fp at the desired to measured Ctot, we can estimate the signal contribution of each compound due to the change in its partitioning behaviour as a result of the different Ctot.
3.1 Single VOC system volatility at various reactivity levels
Figure 1 shows the retrieved volatility distributions from the TD and from the FIGAERO-CIMS along with the identified compounds in the particle phase expressed in the two-dimensional volatility basis set space (2D-VBS) for the α-pinene experiments conducted at half and one-third initial reactivity (see Sect. 2.1.).
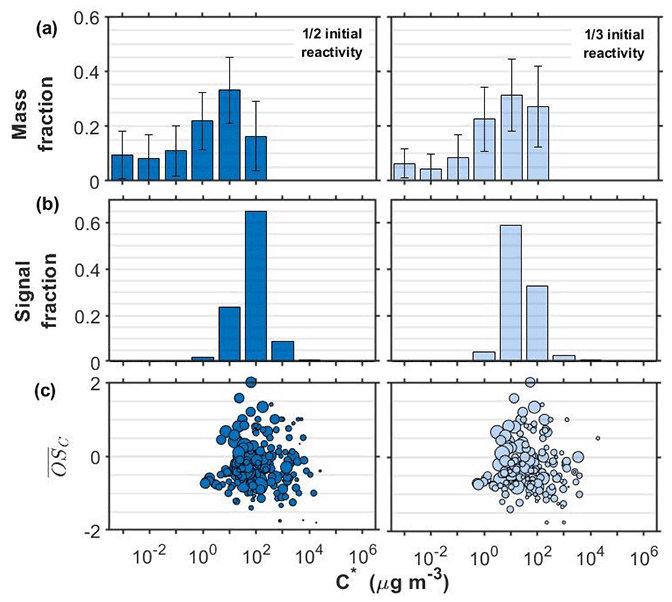
Figure 1SOA particle volatility distributions from (a) the TD measurements (± retrieval uncertainty) and (b) the FIGAERO-CIMS measurements in the α-pinene experiments conducted at half and one-third initial reactivity. (c) All the products identified by the FIGAERO-CIMS are shown as a function of their volatility (C∗) and their average carbon oxidation state ( sized by the square root of their particle-phase signal.
The volatility distributions obtained by the two independent methods in all experiments/systems were considerably different, in line with previous studies (Stark et al., 2017; Voliotis et al., 2021). Note that the volatility distributions from the TD measurements were expressed as a function of the total SOA particle mass whereas from the FIGAERO-CIMS as a function of the total signal, assuming uniform sensitivity. Further, the signal-to-noise limitations of the FIGEARO-CIMS can limit its ability to quantify compounds with low concentrations and low C∗. Similar problems can also appear for more volatile compounds with low concentrations (Du et al., 2022). This often results in an artificial narrowing of the reported volatility distributions. In spite of these limitations, the results from both approaches can be used to assess the volatility changes when comparing such systems, as discussed in detail in Voliotis et al. (2021).
The volatility distributions estimated in the α-pinene experiments at the two initial concentration levels appeared to be different according to the FIGAERO-CIMS. The estimated volatility distribution was shifted towards the lower-volatility range as the SOA concentration was reduced from the full reactivity experiments (Fig. S1 in the Supplement) to the one third (Fig. 1). This is consistent with the predictions of the partitioning theory (Donahue et al., 2006). The uncertainty of the volatility distributions estimated from the TD technique did not allow the differentiation of the volatility of the two SOA systems in this case. The chemical composition of the products identified supports these trends and suggests that the lower the initial concentration, the stronger the contributions of products with µg m−3 and . On the other hand, at the higher concentration experiments, compounds with µg m−3 and appear to contribute more to the total signal (Figs. 1c and S1).
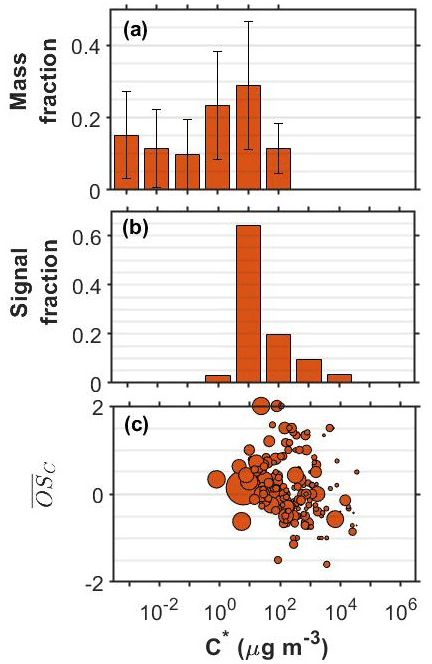
Figure 2SOA particle volatility distributions from (a) the TD measurements (± retrieval uncertainty) and (b) the FIGAERO-CIMS measurements in the o-cresol experiments conducted at half initial reactivity. (c) All the products identified by the FIGERO-CIMS are shown as a function of their volatility (C∗) and their oxidation state ( sized by the square root of their particle-phase signal.
Figure 2 shows the corresponding volatility and 2-D VBS plots for the o-cresol experiment conducted at half reactivity. The volatility derived from the FIGAERO-CIMS had substantial contributions at the µg m−3 volatility bin and around 40 % of the signal was in the 102−104 µg m−3 range. The distribution from the TD also peaked at µg m−3 but suggested that 60 % of the SOA particle mass had effective volatility less than or equal to 1 µg m−3. The SOA particle volatility distribution retrieved by the TD method was similar to that measured in the full reactivity experiments of Voliotis et al. (2021) as shown in Fig. S1. According to the FIGAERO-CIMS measurements, a little higher contributions of more volatile material with µg m−3 were observed at the lower initial reactivity experiment (40 % versus 17 % of the signal). The relatively narrow FIGAERO-CIMS volatility distributions in the o-cresol experiments are partially due to the dominance of the product(s) with elemental formula C7H7NO4, which accounted for a substantial amount of the particle-phase signal. For example, at the full initial reactivity experiments they accounted for 48 % of the SOA particle signal (Voliotis et al., 2021). In the half reactivity experiment the C7H7NO4 product(s) accounted for 34 % of the total particle-phase signal and leading to the lower fraction of the compounds with µg m−3 and the corresponding increase in the more volatile fraction. The chemical characteristics of the compounds identified in these systems, expressed in the O:C versus H:C and the nC versus nO space showed somewhat higher signal contributions of more oxygenated compounds in the full initial reactivity experiments (Fig. S2).
3.2 Volatility and composition of the mixtures
Figure 3 shows the measured and predicted particle volatility distributions from the TD and the FIGAERO-CIMS in all the systems investigated. The bars in the FIGAERO-CIMS volatility distributions show the contributions of the products derived from each individual precursor, those that had common elemental formulas between the systems, as well as those that were only identified in each mixed system.
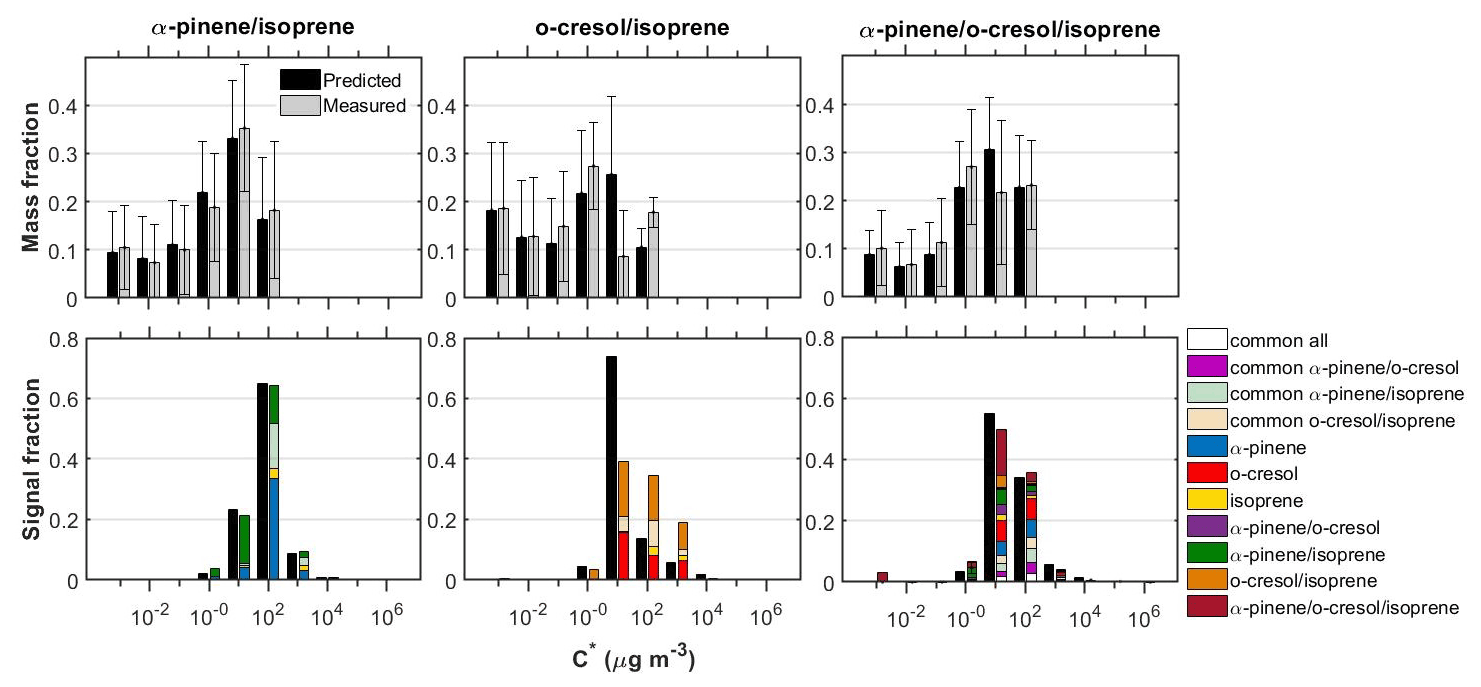
Figure 3Measured and predicted SOA particle volatility distributions from the TD measurements (± retrieval uncertainty) (top panels) and from the FIGAERO-CIMS measurements (bottom panels) in all the mixed systems investigated. The volatility distributions from the FIGAERO-CIMS with ±1σ are shown in the Supplement (Fig. S3). The coloured bars in the top and bottom panels represent the measurements and the black bars the predictions. The coloured bars in the bottom panels are separated to show the signal contributions of the products in each volatility bin. “Common” was classified as the products that were identified in each mixture as well as at the respective single-precursor experiments of that mixture. The remaining products had elemental formulas that were unique to each single-precursor or mixture system.
Although the SOA mass formed in the isoprene single-precursor experiments was found to be below our background (∼1 µg m−3), in all the isoprene-containing systems studied here we were able to attribute a small fraction of the total FIGAERO-CIMS signal (≤6 %) to isoprene-derived products. It is currently unclear whether the presence of these products is significant and/or could be attributed to a potentially high and/or differential sensitivity of our technique (e.g. Lee et al., 2014). Nonetheless, a likely explanation could be the significantly higher levels of total absorptive mass found in the binary systems opposed to the single precursor isoprene, which would have favoured the partitioning of the more volatile species (Fig. S4). In support of this, it can be seen from Figs. 4 and 5 that the majority of the isoprene-derived products have µg m−3, which would cause these products to remain predominantly in the gas phase in the single-isoprene experiments where the total absorptive mass was ≤1 µg m−3.
The SOA particle volatility measured in the α-pinene/isoprene system from the TD method peaked at µg m−3, while that from the FIGAERO-CIMS showed the highest signal contributions in the µg m−3 bin. About 33 % of the FIGAERO-CIMS total particle-phase signal can be attributed to products that were uniquely identified in the mixture, while about 42 % and 6 % were due to products that have been identified in the α-pinene and isoprene single-precursor experiments, respectively. The remaining ∼18 % is attributable to compounds with elemental formulas that have been observed in both single-precursor systems and the binary system (“common” compounds) that our technique is unable to resolve. In this system, the observed unique-to-the-mixture products (annotated as α-pinene/isoprene in Figs. 3–5) had volatilities spanning a wide range of 1 to 103 µg m−3, with the highest contributions in the 10 and 100 µg m−3 bins. Figure 4a depicts all the identified compounds in the O:C versus H:C, nC versus nO, nC versus , and versus C∗ spaces. The α-pinene-derived products in the mixture had similar chemical characteristics, though they exhibited higher signal contributions in the nC ≥ 10 and –0 ranges. The isoprene-derived products in the mixture had low nC (nC ≤ 6) and relatively high (). The unique-to-the-mixture products with the highest signal contributions mostly had 7–10 carbon atoms, moderate oxygen content (3–5 oxygen atoms), and relatively high (>0.5) and H:C (>1.5). Considerable contributions are also observed for unique products with six carbon atoms or less, high , and O:C (O:C = ∼1). Examples from these unique products found in this binary system in descending order of signal contributions had assigned elemental formulas: C8H14NO4, C8H10O4, C7H12NO5, and C9H12O3.
The SOA particle volatility distribution measured in the o-cresol/isoprene system from both techniques was relatively broad. The volatility distributions obtained from the FIGAERO-CIMS showed higher variability between the two experiments conducted compared to the other mixed systems (Fig. S3). According to the TD technique, there were substantial mass contributions in both the lower-volatility (10 µg m−3) and higher-volatility (10–100 µg m−3) bins. On the other hand, according to the FIGAERO-CIMS measurements, the SOA particles were considerably more volatile, with a substantial fraction, around 20 %, of the particle-phase signal being in the IVOC region ( µg m−3). The SOA concentration in these experiments was of the order of 10 µg m−3, so the presence of such high concentrations of IVOCs in the particulate phase can be explained either by very high corresponding IVOC concentrations in the gas phase or by a significant underestimation of the less volatile SOA components by the FIGAERO-CIMS technique.
A large number of unique-to-the-mixture products were identified in the o-cresol/isoprene system that accounted for around 46 % of the particle-phase signal, having a wide range of volatilities and . The largest fraction of these products had appreciable signal contributions (19 %) at high nC (≥8) and O:C (≥0.7). Examples of such products identified in this system in descending order of signal contributions had assigned elemental formulas: C10H11O2, C11H12O6, C9H13O3 and C13H14O5. The o-cresol-derived products in the mixture on the other hand were mostly centred at nC = 7 and H:C = ∼1.1, at varying and nO numbers, while the isoprene-derived products had nC ≤ 5 and (Fig. 4b).
The particle volatility distribution retrieved from the TD measurements in the ternary system (i.e. α-pinene/o-cresol/isoprene) indicated that around 70 % of the SOA mass was approximately evenly distributed in the 1–100 µg m−3 range, with the rest of the material having lower volatility. The distributions derived from the FIGAERO-CIMS suggested that around 80 % of the SOA signal was due to compounds with C∗ in 10–100 µg m−3, a result relatively consistent with that of the TD. According to the TD measurements, LVOCs represented 29 % and SVOCs 71 % of the SOA particle mass, while according to the FIGAERO-CIMS there were 6 % LVOCs and 87 % SVOCs, and 7 % of the total signal was IVOCs.

Figure 4Hydrogen to carbon (H:C) by oxygen to carbon (O:C), number of carbon atoms (nC) by number of oxygen atoms (nO), carbon oxidation state ( by nC and by effective saturation concentration (C∗) of all the individual products identified in the (a) α-pinene/isoprene and (b) o-cresol/isoprene systems. The products that were uniquely found in the mixture are depicted with different colours. All the symbols are sized based on the particle-phase signal of each product in the FIGAERO-CIMS.
Figure 5 shows all the identified compounds found in the ternary system in the O:C versus H:C, nC versus nO, nC versus , and versus C∗ spaces. In this ternary system, the SOA particle chemical composition was complex, with 27 % of the total particle-phase signal of the FIGAERO-CIMS being attributed to products with common elemental formulas between experiments. Another 11 % was attributed to α-pinene products, 15 % to o-cresol products, and 3 % to isoprene products. The products that were found only in the binary systems accounted for 22 % of the total signal: 6 % for the unique products of the α-pinene/o-cresol, 5 % for the o-cresol/isoprene, and 11 % for the unique products of the α-pinene/isoprene system. Finally, 23 % of the signal was due to products found only in the ternary mixture. The majority of these unique ternary mixture products had moderate volatility ( µg m−3) and a relatively high number of carbons (more than seven). Their chemical characteristics, as illustrated in Fig. 5, spanned across a wide range of H:C, nO, and . Their O:C was between 0.3 and 0.8. Characteristic examples of the elemental formulas of such products in descending order of signal contributions were C12H10O4, C9H6O3, C6H7NO5, C8H13NO7, C13H15NO5, and C14H15NO5.
4.1 Influence of isoprene in binary mixtures
Considering that isoprene did not form any SOA particle mass above our background levels in all the single-precursor experiments using neutral ammonium sulfate seeds, the predicted mass contribution of its products in the binary mixtures is zero. Therefore, to investigate its influence on the SOA particle volatility in the binary mixtures under such conditions, we can predict the volatility distributions in all the isoprene-containing binary systems as being equal to that measured by the other precursor, adjusted at the same Ctot levels. Considering that, in the binary systems, only half of the total initial reactivity of the system was attributed to each of the precursors, the experiments at half initial reactivity were used to make such predictions.
In the α-pinene/isoprene mixture, the measured and predicted SOA volatility distributions estimated by both techniques were similar to the single-precursor system (Figs. 1, 3, and S5), a result consistent with the almost identical total SOA particle levels (∼60 µg m−3; Fig. S4). In particular, the LVOC and SVOC mass fractions in the TD measurements were about 28 % and 72 %, while in the FIGAERO-CIMS measurements the LVOC, SVOC, and IVOC content was about 0 %, 87 %, and 13 %, respectively (Fig. S5), though caution should be employed in the interpretation of broad volatility classification since differences in the detail may be lost. This suggests that the addition of isoprene to the reacting α-pinene system had little effect on the volatility of the produced SOA particles that can be predicted assuming additivity. This may imply that any potential molecular interactions are unimportant in terms of SOA particle mass and/or that the unique-to-the-mixture products formed are contributing to the SOA particle mass appreciably, but their similar volatility to the α-pinene products makes the net effect negligible. This is relatively consistent with the results of Ylisirniö et al. (2020), who reported minimal to modest changes in the SOA volatility from mixtures of real plant emissions and sesquiterpenes compared to single biogenic precursor experiments.
Even if the change in the overall SOA volatility distribution was small, the chemical information obtained in this system suggested changes in the SOA particle composition. More specifically, the products that appeared in the nC = 11–14, –0.5 and µg m−3 space in the α-pinene system were absent in the SOA particles of the binary system (Figs. 1 and 4). At the same time, unique-to-the-mixture products with nC ≥ 14 and and µg m−3 were formed. Although previous works have showed significant presence of molecules with nC = 15 in this system (e.g. Berndt et al., 2018b), here, we were not able to reliably identify such molecules. This could be either attributed to the potentially very low signal of those products that were missed from our peak identification protocol and/or that these products were prone to thermal decomposition during the FIGAERO desorption cycle. These might also explain the relatively low signal fraction of the nC > 10 products identified (4 %–5 %). Furthermore, unique-to-the-mixture products with moderate nC and similar chemical characteristics (i.e. H:C, O:C, and volatility with those measured in the α-pinene single-precursor experiments were also formed (Fig. 4). These observations indicate that the mixing of isoprene with α-pinene can alter the chemical composition of the SOA particles however, the net effect of these changes on the overall SOA volatility is minor. At least partially, this can be attributed to the similar elemental composition and volatility distribution that the unique-to-the-mixture products have with those found in the α-pinene single-precursor experiments.
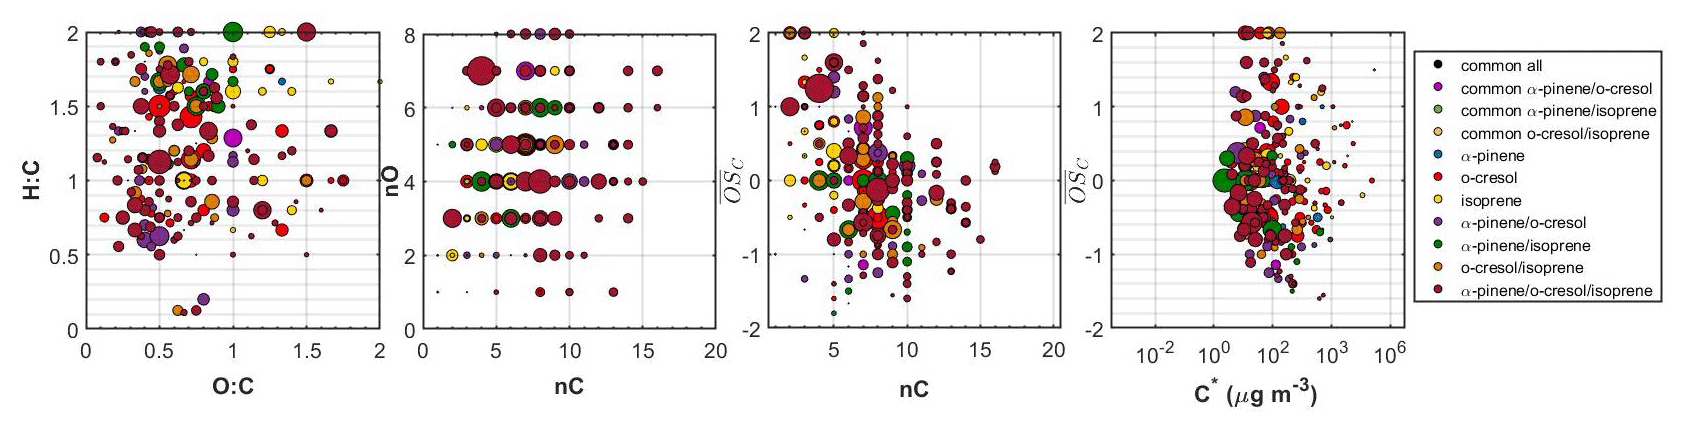
Figure 5Hydrogen to carbon (H:C) by oxygen to carbon (O:C), number of carbon atoms (nC) by number of oxygen atoms (nO), carbon oxidation state ( by nC, and by effective saturation concentration (C∗) of all the individual products identified in the ternary system. The dots are sized based on the square root of their particle-phase signal in the FIGAERO-CIMS. The products that were common between all systems, those that were common between α-pinene, o-cresol, and their mixture, those that were associated with either precursor, those that were unique products of each binary system, as well as those that were unique products of the ternary mixture are depicted with separate colours.
On the other hand, in the o-cresol/isoprene system, the particle volatility derived from both methods was significantly different to that obtained in the o-cresol system, which resulted in different measured than predicted volatilities (Fig. 3). In particular, the FIGAERO-CIMS measurements showed that the o-cresol/isoprene system had a ∼10 % increased measured than predicted IVOC signal fraction with a corresponding decrease in the SVOC fraction. The TD measurements showed a similar LVOC/SVOC split between the measured and predicted volatilities, yet the measured volatility distributions exhibited significantly higher contributions in the µg m−3 bin (18 % versus 11 % of the total mass; Fig. 3).
Previous studies have showed that when isoprene is mixed with another aVOC, the SOA particle yields can be reduced (Jaoui et al., 2008; Vivanco et al., 2013; Ahlberg et al., 2017). This may imply that either the potential molecular interactions resulted in higher-volatility products that remained in larger fractions in the gas phase, or that isoprene was scavenging the available OH, thus reducing the SOA particle mass formed from the oxidation of o-cresol. In our set of experiments SOA particle yield of o-cresol was reduced by the presence of isoprene (Table 1), suggesting that both are likely explanations. Another explanation could be that the presence of isoprene could have altered the oxidation pathways of o-cresol, leading to the formation of higher-volatility products or a combination of the above. Clearly, these results highlight the need for mechanistic studies investigating the SOA formation from that binary system.
Alternatively, the increased IVOC fraction in this system could be attributed to pronounced thermal decomposition of its products (Stark et al., 2017). We have assessed the potential effect of thermal decomposition in our systems by adopting the parametrization provided by Yang et al. (2021) based on the double-bond equivalent (DBE > 2), the nO (nO > 4), and Tmax (Tmax>72 ∘C). In all the systems investigated here, ∼0 %–3 % of the total IVOC signal can be attributed to considerably thermally decomposed products. Therefore, this suggests that the thermal decomposition that might be occurring in the o-cresol/isoprene system is not significantly higher than any other system and cannot explain the particularly high IVOC fraction that was observed. Of course, it should be noted that the parametrization provided by Yang et al. (2021) has been derived with a particular instrument under certain operation conditions and might not be universally applicable. Still, it might be used here as a relative comparison between the systems.
The chemical composition of the products identified in the particle phase in each of the two systems (i.e. o-cresol and o-cresol/isoprene) reveal significant differences. Almost all the o-cresol-derived products observed in the single-precursor experiment in the nC = 7 and as well as those in the nC > 7 and –1.5 space were not observed in the mixture (Figs. 4 and S2). At the same time, a number of unique-to-the-mixture products were identified in the nC > 7 and and in the nC ≤ 6 and at varying spaces. Furthermore, isoprene-derived and unique-to-the-mixture products were also observed that had low nC and high C∗. The majority of these products exhibited relatively lower nC and O:C compared to the products identified in the o-cresol system, which likely supports the increase in the more volatile fraction of the mixture. These suggest, if anything, that the potential molecular interactions of the oxidized products in the gaseous or particulate phase in this system can increase the volatility of the mixture. Based on our results, the most likely explanation is the formation of unique-to-the-mixture products with different chemical characteristics and higher volatility and the simultaneous scavenging of o-cresol products with lower volatility (Figs. 4 and S2).
4.2 Influence of isoprene in ternary mixtures
To assess the influence of the effectively zero-yield isoprene on the SOA particle volatility of the α-pinene/o-cresol mixture, both precursors with appreciable particle yields, the mass fractions of the SOA particles that correspond to each precursor were estimated. Such estimations were achieved assuming additivity based on the corresponding reacted VOC concentrations measured in the mixed system and the yields measured in the single-precursor experiments. Here, the high SOA particle yields of α-pinene (Table 1) resulted in a high predicted mass fraction of the corresponding products in the SOA particles formed in the ternary system ( %), like in the α-pinene/o-cresol system (69±3 %; see Fig. S6). These fractions were then used as weighting factors for the volatility distributions obtained in the single-precursor experiments in order to estimate the expected volatility distributions of the mixtures based on the additivity. Here, the volatility distributions of the α-pinene at one-third initial reactivity and the o-cresol at half reactivity were used to make such predictions.
The high SOA particle volatility observed in the α-pinene single-precursor system from both techniques contributed substantially to the predicted volatilities in these systems that were generally higher than those measured (Figs. 1, 3 and S6). In the ternary mixture, the predicted volatility distributions from both techniques showed highest contributions at µg m−3. The measured SVOC fraction was found to be slightly lower compared to that predicted both in the FIGAERO-CIMS (86 versus 92 % of the total signal) and the TD measurements (71 versus 77 % of the total mass), with a corresponding increase in the LVOC fraction. Therefore, this suggests that the addition of isoprene has the potential to reduce the volatility of this mixture.
In more detail, the TD measurements showed that the ternary system had a similar SOA particle volatility to the α-pinene/o-cresol system (Fig. S5), yet with somewhat higher mass contributions in the µg m−3 region (55 versus 49 % of the total mass, respectively; Figs. 3 and S6). Similar trends are observed in the FIGAERO-CIMS measurements, where considerably higher signal contributions in the µg m−3 region were observed in the ternary system compared to the α-pinene/o-cresol (55 versus 30 % of the total signal, respectively; Figs. 3 and S6). This suggests that the addition of isoprene in this system can affect the volatility of the SOA particles. Similarly to the other mixed systems, the Ctot in the ternary mixture was lower than that measured in the α-pinene/o-cresol system, roughly by a factor of 2.5 (Fig. S4). The adjusted volatility distributions of the α-pinene/o-cresol system to the Ctot levels of the ternary system from either method were almost identical to those measured (≤3 % of the total mass/signal; Figs. S6 and S7). This demonstrates that any differences in the partitioning behaviour of the species due to the different Ctot levels in the experiments conducted in these systems had a relatively small effect on the measured particle volatility distributions that are expressed in logarithmic scale. Consequently, the addition of isoprene in the α-pinene/o-cresol system can further reduce the volatility of the system (see Fig. S6).
An alternative approach to assess the additivity in this complex system is to predict the SOA particle volatility based on those measured in a single system and a binary system, for example based on the o-cresol and α-pinene/isoprene systems. In this case, the weights (or predicted mass fractions) can be calculated based on the VOC decay measured in the ternary system and the SOA particle yields of the o-cresol and α-pinene/isoprene systems. This can be done for all possible pairs of single and binary systems, i.e. o-cresol + (α-pinene/isoprene), α-pinene + (o-cresol/isoprene), and isoprene + (α-pinene/o-cresol), and such predictions are shown in Fig. S8 from both techniques against the measured values. The measured volatility distributions are lower compared to those predicted in all cases and for both techniques, further confirming that the chemical interactions occurring in this system will lower the resultant SOA particle volatility. Clearly, however, the degree of the discrepancy between the measured and predicted volatility distributions is dependent on the calculation method, e.g. higher deviation in the isoprene + (α-pinene/o-cresol) than in the α-pinene + (o-cresol/isoprene). This illustrates that the volatility prediction in mixed systems (and perhaps similarly, the SOA particle yield predictions) is not straightforward and likely, will be unable to capture the complex interactions of the mixed systems. This should probably be expected considering that the NOx trends and the production of O3 at similar initial VOC NOx can substantially vary between single-precursor or mixture experiments (Voliotis et al., 2022), suggesting that the chemical regime of the experiments is system-dependent. Further, the differential reactivity of the oxidized products towards the OH and O3 along with radical cross-reactions that evidently lead to the formation of unique-to-the-mixture products will ensure deviation from the additivity to an unknown extent.
The chemical composition of the SOA formed in the ternary mixture was highly complex. The oxidation products of α-pinene and o-cresol contributed to the SOA particles considerably, but nearly half of the FIGAERO-CIMS particle-phase signal was attributed to unique products found in the binary and/or ternary mixtures (Fig. 3). The elemental compositions of all the unique products spanned a wide range in the O:C, H:C, nC, and nO space, making the comparison between the systems challenging (Fig. 5). Overall, the largest fraction, the unique-to-the-mixture products (about 80 %), appeared to have volatilities in the –10 µg m−3 range, suggesting that they were semi-volatile. It is unclear to what extent the identified unique-to-the-mixture products are due to changes in the oxidation pathways of each precursor involved due to the mixing or as radical cross-reaction products or a combination of both. Mechanistic studies and/or analytical studies that can provide molecular structure information might help identify the characteristics of those products and their formation pathways.
Previously, we have shown that the unique products of the α-pinene/o-cresol system have, on average, higher molecular weight, average carbon oxidation state, oxygen content and consequently lower volatility than the products of either precursor (Voliotis et al., 2021). The simultaneous scavenging of higher molecular weight and lower-volatility α-pinene products in that system resulted in a volatility distribution in between those measured in the single-precursor systems. Here, we quantify that the molecular interactions of the products may lower the overall volatility of the α-pinene/o-cresol system by ∼6 %–11 % (see Fig. S6). Expanding this to the ternary system with the addition of isoprene, we also find that the molecular interactions still lead to the formation of lower-volatility SOA particles than that predicted based on the additivity, despite the interactions from the mixing of o-cresol and isoprene likely leading to higher-volatility SOA (Fig. 3).
The results shown above suggest that predicting the SOA particle volatility based on the additivity cannot always represent all the mixtures of anthropogenic and biogenic precursors. The molecular interactions that may occur between the oxidized products in mixtures have therefore the potential to alter the SOA composition and volatility. Clearly, mechanistic studies are needed to unravel the nature of those interactions and may help to develop advanced frameworks that can capture their trajectories.
4.3 Atmospheric implications
The atmospheric environment is a complex mixture of thousands of anthropogenic and biogenic VOCs, IVOCs, and SVOCs reacting simultaneously. To date, the prediction of the SOA mass loadings in chemical transport models has been carried out assuming that the SOA particle yields of one precursor for a given SOA concentration and VOC NOx ratio are not affected by the presence of the other organic vapours (Tsimpidi et al., 2018). The results of this study show that, upon mixing anthropogenic and biogenic precursors, the underlying molecular interactions have the potential to alter the SOA composition and volatility. The effect is less pronounced in the biogenic–biogenic mixtures investigated but can be noteworthy in anthropogenic–biogenic mixtures. Previous ambient observations showed increased SOA particle contributions when anthropogenic and biogenic emissions were mixed (Hoyle et al., 2011; Shilling et al., 2013; Shrivastava et al., 2019). Our results show that the unique-to-the-mixture products of the anthropogenic–biogenic mixtures may have either higher (i.e. o-cresol/isoprene) or lower volatility (i.e. α-pinene/o-cresol) than those observed in the respective single-precursor experiments. However, in more complex mixtures (i.e. α-pinene/o-cresol/isoprene) the formation of lower-volatility products likely outweighs the formation of products with higher volatility. Consequently, it may partly explain the increased SOA particle loadings when biogenic and anthropogenic emissions are mixed.
It should however be noted that the experiments conducted in this study were performed in a batch reactor using high concentrations of VOC precursors, in order to form adequate amounts of SOA particles. At the same time, the concentrations of the oxidants in our systems were at atmospherically relevant levels. This resulted in appreciable amounts of VOC(s) remaining at the end of each experiment (see Fig. 2 in Voliotis et al., 2022). In turn, this might suggest a continuous formation of earlier-generation products during our experiments that might contributed to the relatively high volatility observed.
Furthermore, the high initial VOC concentrations used in our systems are expected to promote the RO2–RO2 cross-reactions and suppress the RO2–HO2 reactions (Peng and Jimenez, 2020; Schervish and Donahue, 2020), which are thought to be the main radical termination pathway in the atmosphere (Tan et al., 2018), in addition to RO2 + NO on certain occasions (Orlando and Tyndall, 2012). Therefore, the increased fraction of unique-to-the-mixture products observed in this study might be associated with the specific oxidative conditions defined by our experimental set-up. Considering that the unique-to-the-mixture products were found to decrease the SOA particle volatility in the α-pinene/o-cresol and in the ternary systems, while they increased the volatility in the o-cresol/isoprene system, it could be hypothesized that, in low-RO2:HO2 conditions (i.e. ), the effect could be suppressed to an unknown extent. Although we are unable to quantify the mass fractions of the unique products due to analytical limitations, our results might still represent certain atmospheric conditions. Such an example might be clean environments where the RO2:HO2 has been found to be high (; Stevens et al., 1997; Carslaw et al., 2002). Nonetheless, our scope here is not to provide volatility distributions that can be extrapolated globally but to demonstrate that the molecular interactions have the potential to alter the SOA particle composition and volatility, with consequent implications for the air quality and climate predictions.
In this study, we extended our previous work on mixtures of α-pinene and o-cresol with the addition of a low-yield precursor, isoprene, and we investigated the SOA particle volatility in binary mixtures of biogenic–biogenic (α-pinene/isoprene) and anthropogenic–biogenic (o-cresol/isoprene) precursors in a batch reactor. We further moved beyond the binary mixtures by combining the above precursors simultaneously in ternary mixtures (α-pinene/o-cresol/isoprene).
The α-pinene/isoprene system had a comparable volatility distribution to that measured in the α-pinene single-precursor experiments that resulted to similar volatility predictions assuming additivity. Therefore, the SOA volatility from the oxidation of α-pinene was not influenced by the addition of isoprene. Nonetheless, there were evident changes in the SOA chemical composition with the suppression in the formation of some of the α-pinene products and the formation of products that were uniquely observed in the mixture. The unique products had a similar volatility distribution to the components of the α-pinene SOA system thus potentially explaining the small effect of their formation on the overall SOA volatility formed in the binary system.
In contrast, the addition of isoprene to o-cresol reacting system resulted in the increase in the contribution of higher-volatility components to the SOA particles. In particular, the measured volatility was higher than the one predicted by up to ∼5 %–15 % of the total mass/signal. The unique-to-the-mixture products contributed significantly to the total signal and a significant fraction of which had lower number of carbon and oxygen atoms and higher H:C compared the products identified in the o-cresol experiments, supporting the observed higher volatility.
The measured SOA particle volatility of the ternary system was lower than that predicted by ∼6 % of the total mass/signal, demonstrating that the molecular interactions from the addition of isoprene in the α-pinene/o-cresol reacting system can reduce the overall volatility. The SOA chemical composition of that mixture was diverse, with contributions of products from all the VOCs involved, unique products of all the binary systems, as well as unique products of the ternary mixture, making the comparison between systems challenging.
The results described in this study suggest that the changes in the products formed when mixing anthropogenic and biogenic precursors might result in a net decrease or increase in the overall SOA volatility that is system-dependent. On the other hand, the similarity in the predicted and measured volatility distributions in the mixed biogenic system (i.e. α-pinene/isoprene) shows that the changes in the products formed have a modest influence on the SOA volatility. Therefore, the molecular interactions that result from the mixing of anthropogenic and biogenic precursors can have a varying effect on the SOA volatility distribution of the systems and are not negligible. Clearly, the individual precursors involved and thereby the resultant oxidation products determine the magnitudes of those interactions as well as the characteristics of the unique products formed, in turn affecting the volatility distribution of the SOA particles. The attribution of these changes to specific processes remains unknown and highlights the need for mechanistic studies. The results presented here capture only certain atmospheric conditions, and therefore the investigated chemical regimes, oxidants, and VOCs should be extended.
All the data used in this work are available upon request from the corresponding authors.
The supplement related to this article is available online at: https://doi.org/10.5194/acp-22-13677-2022-supplement.
AV and GM developed the concept of this paper. AV, YW, YS, and MD conducted the experiments. SNP provided the volatility retrieval algorithm. TJB provided on-site help in deploying the FIGAERO-CIMS. MF provided on-site help in deploying the TD unit. AV conducted the data analysis and wrote the manuscript with inputs from all the co-authors.
At least one of the (co-)authors is a member of the editorial board of Atmospheric Chemistry and Physics. The peer-review process was guided by an independent editor, and the authors also have no other competing interests to declare.
Publisher’s note: Copernicus Publications remains neutral with regard to jurisdictional claims in published maps and institutional affiliations.
The Manchester Aerosol Chamber received funding from the European Union's Horizon 2020 research and innovation programme under grant agreement no. 730997, which supports the EUROCHAMP2020 research programme. Aristeidis Voliotis was supported by the President's Doctoral Scholarship from the University of Manchester and by the Natural Environment Research Council (NERC) EAO Doctoral Training Partnership. M. Rami Alfarra was financially supported by the Natural Environment Research Council (NERC) through the UK National Centre for Atmospheric Science (NCAS). Instrumentational support was funded through the NERC Atmospheric Measurement and Observational Facility (AMOF). Carl J. Percival's work was carried out at the Jet Propulsion Laboratory, California Institute of Technology, under contract with the National Aeronautics and Space Administration (NASA) and was supported by the Upper Atmosphere Research and Tropospheric Chemistry Program.
This research has been supported by the Natural Environment Research Council through the Doctoral Training Partnership (grant no. NE/L002469/1).
This paper was edited by Zhibin Wang and reviewed by two anonymous referees.
Ahlberg, E., Falk, J., Eriksson, A., Holst, T., Brune, W. H., Kristensson, A., Roldin, P., and Svenningsson, B.: Secondary organic aerosol from VOC mixtures in an oxidation flow reactor, Atmos. Environ., 161, 210–220, https://doi.org/10.1016/j.atmosenv.2017.05.005, 2017.
Allan, J. D., Delia, A. E., Coe, H., Bower, K. N., Alfarra, M. R., Jimenez, J. L., Middlebrook, A. M., Drewnick, F., Onasch, T. B., Canagaratna, M. R., Jayne, J. T., and Worsnop, D. R.: A generalised method for the extraction of chemically resolved mass spectra from aerodyne aerosol mass spectrometer data, J. Aerosol. Sci., 35, 909–922, https://doi.org/10.1016/j.jaerosci.2004.02.007, 2004.
Andreae, M. O. and Rosenfeld, D.: Aerosol–cloud–precipitation interactions, Part 1. The nature and sources of cloud-active aerosols, Earth-Sci. Rev., 89, 13–41, https://doi.org/10.1016/j.earscirev.2008.03.001, 2008.
Atkinson, R.: Atmospheric chemistry of VOCs and NOx, Atmos. Environ., 34, 2063–2101, https://doi.org/10.1016/S1352-2310(99)00460-4, 2000.
Bannan, T. J., Le Breton, M., Priestley, M., Worrall, S. D., Bacak, A., Marsden, N. A., Mehra, A., Hammes, J., Hallquist, M., Alfarra, M. R., Krieger, U. K., Reid, J. P., Jayne, J., Robinson, W., McFiggans, G., Coe, H., Percival, C. J., and Topping, D.: A method for extracting calibrated volatility information from the FIGAERO-HR-ToF-CIMS and its experimental application, Atmos. Meas. Tech., 12, 1429–1439, https://doi.org/10.5194/amt-12-1429-2019, 2019.
Barley, M., Topping, D. O., Jenkin, M. E., and McFiggans, G.: Sensitivities of the absorptive partitioning model of secondary organic aerosol formation to the inclusion of water, Atmos. Chem. Phys., 9, 2919–2932, https://doi.org/10.5194/acp-9-2919-2009, 2009.
Berndt, T., Scholz, W., Mentler, B., Fischer, L., Herrmann, H., Kulmala, M., and Hansel, A.: Accretion Product Formation from Self- and Cross-Reactions of RO2 Radicals in the Atmosphere, 57, 3820–3824, https://doi.org/10.1002/anie.201710989, 2018a.
Berndt, T., Mentler, B., Scholz, W., Fischer, L., Herrmann, H., Kulmala, M., and Hansel, A.: Accretion Product Formation from Ozonolysis and OH Radical Reaction of α-Pinene: Mechanistic Insight and the Influence of Isoprene and Ethylene, Environ. Sci. Technol., 52, 11069–11077, https://doi.org/10.1021/acs.est.8b02210, 2018b.
Brunekreef, B. and Holgate, S. T.: Air pollution and health, The Lancet, 360, 1233–1242, https://doi.org/10.1016/S0140-6736(02)11274-8, 2002.
Carlton, A. G., Wiedinmyer, C., and Kroll, J. H.: A review of Secondary Organic Aerosol (SOA) formation from isoprene, Atmos. Chem. Phys., 9, 4987–5005, https://doi.org/10.5194/acp-9-4987-2009, 2009.
Carslaw, N., Creasey, D. J., Heard, D. E., Jacobs, P. J., Lee, J. D., Lewis, A. C., McQuaid, J. B., Pilling, M. J., Bauguitte, S., Penkett, S. A., Monks, P. S., and Salisbury, G.: Eastern Atlantic Spring Experiment 1997 (EASE97) 2. Comparisons of model concentrations of OH, HO2, and RO2 with measurements, J. Geophys. Res.-Atmos., 107, 5–16, https://doi.org/10.1029/2001JD001568, 2002.
Cohen, A. J., Ross Anderson, H., Ostro, B., Pandey, K. D., Krzyzanowski, M., Künzli, N., Gutschmidt, K., Pope, A., Romieu, I., Samet, J. M., and Smith, K.: The Global Burden of Disease Due to Outdoor Air Pollution, J. Toxicol. Env. Heal. A, 68, 1301–1307, https://doi.org/10.1080/15287390590936166, 2005.
Cohen, A. J., Brauer, M., Burnett, R., Anderson, H. R., Frostad, J., Estep, K., Balakrishnan, K., Brunekreef, B., Dandona, L., Dandona, R., Feigin, V., Freedman, G., Hubbell, B., Jobling, A., Kan, H., Knibbs, L., Liu, Y., Martin, R., Morawska, L., Pope, C. A., III, Shin, H., Straif, K., Shaddick, G., Thomas, M., van Dingenen, R., van Donkelaar, A., Vos, T., Murray, C. J. L., and Forouzanfar, M. H.: Estimates and 25-year trends of the global burden of disease attributable to ambient air pollution: an analysis of data from the Global Burden of Diseases Study 2015, The Lancet, 389, 1907–1918, https://doi.org/10.1016/S0140-6736(17)30505-6, 2017.
Donahue, N. M., Robinson, A. L., Stanier, C. O., and Pandis, S. N.: Coupled partitioning, dilution, and chemical aging of semivolatile organics, Environ. Sci. Technol., 40, 2635–2643, 2006.
Donahue, N. M., Kroll, J. H., Pandis, S. N., and Robinson, A. L.: A two-dimensional volatility basis set – Part 2: Diagnostics of organic-aerosol evolution, Atmos. Chem. Phys., 12, 615–634, https://doi.org/10.5194/acp-12-615-2012, 2012.
Du, M., Voliotis, A., Shao, Y., Wang, Y., Bannan, T. J., Pereira, K. L., Hamilton, J. F., Percival, C. J., Alfarra, M. R., and McFiggans, G.: Combined application of online FIGAERO-CIMS and offline LC-Orbitrap mass spectrometry (MS) to characterize the chemical composition of secondary organic aerosol (SOA) in smog chamber studies, Atmos. Meas. Tech., 15, 4385–4406, https://doi.org/10.5194/amt-15-4385-2022, 2022.
Giani, P., Balzarini, A., Pirovano, G., Gilardoni, S., Paglione, M., Colombi, C., Gianelle, V. L., Belis, C. A., Poluzzi, V., and Lonati, G.: Influence of semi- and intermediate-volatile organic compounds (S/IVOC) parameterizations, volatility distributions and aging schemes on organic aerosol modelling in winter conditions, Atmos. Environ., 213, 11–24, https://doi.org/10.1016/j.atmosenv.2019.05.061, 2019.
Goldstein, A. H. and Galbally, I. E.: Known and unexplored organic constituents in the earth's atmosphere, Environ. Sci. Technol., 41, 1514–1521, 2007.
Hallquist, M., Wenger, J. C., Baltensperger, U., Rudich, Y., Simpson, D., Claeys, M., Dommen, J., Donahue, N. M., George, C., Goldstein, A. H., Hamilton, J. F., Herrmann, H., Hoffmann, T., Iinuma, Y., Jang, M., Jenkin, M. E., Jimenez, J. L., Kiendler-Scharr, A., Maenhaut, W., McFiggans, G., Mentel, Th. F., Monod, A., Prévôt, A. S. H., Seinfeld, J. H., Surratt, J. D., Szmigielski, R., and Wildt, J.: The formation, properties and impact of secondary organic aerosol: current and emerging issues, Atmos. Chem. Phys., 9, 5155–5236, https://doi.org/10.5194/acp-9-5155-2009, 2009.
Hoyle, C. R., Boy, M., Donahue, N. M., Fry, J. L., Glasius, M., Guenther, A., Hallar, A. G., Huff Hartz, K., Petters, M. D., Petäjä, T., Rosenoern, T., and Sullivan, A. P.: A review of the anthropogenic influence on biogenic secondary organic aerosol, Atmos. Chem. Phys., 11, 321–343, https://doi.org/10.5194/acp-11-321-2011, 2011.
Jaoui, M., Edney, E. O., Kleindienst, T. E., Lewandowski, M., Offenberg, J. H., Surratt, J. D., and Seinfeld, J. H.: Formation of secondary organic aerosol from irradiated α-pinene/toluene/NOx mixtures and the effect of isoprene and sulfur dioxide, J. Geophys. Res.-Atmos., 113, D09303, https://doi.org/10.1029/2007JD009426, 2008.
Jimenez, J. L., Jayne, J. T., Shi, Q., Kolb, C. E., Worsnop, D. R., Yourshaw, I., Seinfeld, J. H., Flagan, R. C., Zhang, X. F., Smith, K. A., Morris, J. W., and Davidovits, P.: Ambient aerosol sampling using the Aerodyne Aerosol Mass Spectrometer, J. Geophys. Res.-Atmos., 108, 8425, https://doi.org/10.1029/2001jd001213, 2003.
Jimenez, J. L., Canagaratna, M. R., Donahue, N. M., Prevot, A. S. H., Zhang, Q., Kroll, J. H., DeCarlo, P. F., Allan, J. D., Coe, H., Ng, N. L., Aiken, A. C., Docherty, K. S., Ulbrich, I. M., Grieshop, A. P., Robinson, A. L., Duplissy, J., Smith, J. D., Wilson, K. R., Lanz, V. A., Hueglin, C., Sun, Y. L., Tian, J., Laaksonen, A., Raatikainen, T., Rautiainen, J., Vaattovaara, P., Ehn, M., Kulmala, M., Tomlinson, J. M., Collins, D. R., Cubison, M. J., Dunlea, E. J., Huffman, J. A., Onasch, T. B., Alfarra, M. R., Williams, P. I., Bower, K., Kondo, Y., Schneider, J., Drewnick, F., Borrmann, S., Weimer, S., Demerjian, K., Salcedo, D., Cottrell, L., Griffin, R., Takami, A., Miyoshi, T., Hatakeyama, S., Shimono, A., Sun, J. Y., Zhang, Y. M., Dzepina, K., Kimmel, J. R., Sueper, D., Jayne, J. T., Herndon, S. C., Trimborn, A. M., Williams, L. R., Wood, E. C., Middlebrook, A. M., Kolb, C. E., Baltensperger, U., and Worsnop, D. R.: Evolution of Organic Aerosols in the Atmosphere, Science, 326, 1525–1529, 2009.
Kanakidou, M., Seinfeld, J. H., Pandis, S. N., Barnes, I., Dentener, F. J., Facchini, M. C., Van Dingenen, R., Ervens, B., Nenes, A., Nielsen, C. J., Swietlicki, E., Putaud, J. P., Balkanski, Y., Fuzzi, S., Horth, J., Moortgat, G. K., Winterhalter, R., Myhre, C. E. L., Tsigaridis, K., Vignati, E., Stephanou, E. G., and Wilson, J.: Organic aerosol and global climate modelling: a review, Atmos. Chem. Phys., 5, 1053–1123, https://doi.org/10.5194/acp-5-1053-2005, 2005.
Karnezi, E., Riipinen, I., and Pandis, S. N.: Measuring the atmospheric organic aerosol volatility distribution: a theoretical analysis, Atmos. Meas. Tech., 7, 2953–2965, https://doi.org/10.5194/amt-7-2953-2014, 2014.
Koo, B., Knipping, E., and Yarwood, G.: 1.5-Dimensional volatility basis set approach for modeling organic aerosol in CAMx and CMAQ, Atmos. Environ., 95, 158–164, https://doi.org/10.1016/j.atmosenv.2014.06.031, 2014.
Kroll, J. H. and Seinfeld, J. H.: Chemistry of secondary organic aerosol: Formation and evolution of low-volatility organics in the atmosphere, Atmos. Environ., 42, 3593–3624, https://doi.org/10.1016/j.atmosenv.2008.01.003, 2008.
Lee, B. H., Lopez-Hilfiker, F. D., Mohr, C., Kurten, T., Worsnop, D. R., and Thornton, J. A.: An Iodide-Adduct High-Resolution Time-of-Flight Chemical-Ionization Mass Spectrometer: Application to Atmospheric Inorganic and Organic Compounds, Environ. Sci. Technol., 48, 6309–6317, https://doi.org/10.1021/es500362a, 2014.
Lopez-Hilfiker, F. D., Mohr, C., Ehn, M., Rubach, F., Kleist, E., Wildt, J., Mentel, Th. F., Lutz, A., Hallquist, M., Worsnop, D., and Thornton, J. A.: A novel method for online analysis of gas and particle composition: description and evaluation of a Filter Inlet for Gases and AEROsols (FIGAERO), Atmos. Meas. Tech., 7, 983–1001, https://doi.org/10.5194/amt-7-983-2014, 2014.
McFiggans, G., Topping, D. O., and Barley, M. H.: The sensitivity of secondary organic aerosol component partitioning to the predictions of component properties – Part 1: A systematic evaluation of some available estimation techniques, Atmos. Chem. Phys., 10, 10255–10272, https://doi.org/10.5194/acp-10-10255-2010, 2010.
McFiggans, G., Mentel, T. F., Wildt, J., Pullinen, I., Kang, S., Kleist, E., Schmitt, S., Springer, M., Tillmann, R., Wu, C., Zhao, D., Hallquist, M., Faxon, C., Le Breton, M., Hallquist, Å. M., Simpson, D., Bergström, R., Jenkin, M. E., Ehn, M., Thornton, J. A., Alfarra, M. R., Bannan, T. J., Percival, C. J., Priestley, M., Topping, D., and Kiendler-Scharr, A.: Secondary organic aerosol reduced by mixture of atmospheric vapours, Nature, 565, 587–593, https://doi.org/10.1038/s41586-018-0871-y, 2019.
Orlando, J. J. and Tyndall, G. S.: Laboratory studies of organic peroxy radical chemistry: an overview with emphasis on recent issues of atmospheric significance, Chem. Soc. Rev., 41, 6294–6317, https://doi.org/10.1039/C2CS35166H, 2012.
Pankow, J. F.: An absorption model of gas/particle partitioning of organic compounds in the atmosphere, Atmos. Environ., 28, 185–188, https://doi.org/10.1016/1352-2310(94)90093-0, 1994.
Peng, Z. and Jimenez, J. L.: Radical chemistry in oxidation flow reactors for atmospheric chemistry research, Chem. Soc. Rev., 49, 2570–2616, https://doi.org/10.1039/C9CS00766K, 2020.
Ramanathan, V., Crutzen, P. J., Kiehl, J. T., and Rosenfeld, D.: Aerosols, Climate, and the Hydrological Cycle, Science, 294, 2119–2124, https://doi.org/10.1126/science.1064034, 2001.
Riipinen, I., Pierce, J. R., Donahue, N. M., and Pandis, S. N.: Equilibration time scales of organic aerosol inside thermodenuders: Evaporation kinetics versus thermodynamics, Atmos. Environ., 44, 597–607, https://doi.org/10.1016/j.atmosenv.2009.11.022, 2010.
Riva, M., Rantala, P., Krechmer, J. E., Peräkylä, O., Zhang, Y., Heikkinen, L., Garmash, O., Yan, C., Kulmala, M., Worsnop, D., and Ehn, M.: Evaluating the performance of five different chemical ionization techniques for detecting gaseous oxygenated organic species, Atmos. Meas. Tech., 12, 2403–2421, https://doi.org/10.5194/amt-12-2403-2019, 2019.
Schervish, M. and Donahue, N. M.: Peroxy radical chemistry and the volatility basis set, Atmos. Chem. Phys., 20, 1183–1199, https://doi.org/10.5194/acp-20-1183-2020, 2020.
Shao, Y., Wang, Y., Du, M., Voliotis, A., Alfarra, M. R., O'Meara, S. P., Turner, S. F., and McFiggans, G.: Characterisation of the Manchester Aerosol Chamber facility, Atmos. Meas. Tech., 15, 539–559, https://doi.org/10.5194/amt-15-539-2022, 2022.
Shilling, J. E., Zaveri, R. A., Fast, J. D., Kleinman, L., Alexander, M. L., Canagaratna, M. R., Fortner, E., Hubbe, J. M., Jayne, J. T., Sedlacek, A., Setyan, A., Springston, S., Worsnop, D. R., and Zhang, Q.: Enhanced SOA formation from mixed anthropogenic and biogenic emissions during the CARES campaign, Atmos. Chem. Phys., 13, 2091–2113, https://doi.org/10.5194/acp-13-2091-2013, 2013.
Shilling, J. E., Zawadowicz, M. A., Liu, J. M., Zaveri, R. A., and Zelenyuk, A.: Photochemical Aging Alters Secondary Organic Aerosol Partitioning Behavior, ACS Earth Space Chem., 3, 2704–2716, https://doi.org/10.1021/acsearthspacechem.9b00248, 2019.
Shrivastava, M., Fast, J., Easter, R., Gustafson Jr., W. I., Zaveri, R. A., Jimenez, J. L., Saide, P., and Hodzic, A.: Modeling organic aerosols in a megacity: comparison of simple and complex representations of the volatility basis set approach, Atmos. Chem. Phys., 11, 6639–6662, https://doi.org/10.5194/acp-11-6639-2011, 2011.
Shrivastava, M., Easter, R. C., Liu, X., Zelenyuk, A., Singh, B., Zhang, K., Ma, P.-L., Chand, D., Ghan, S., Jimenez, J. L., Zhang, Q., Fast, J., Rasch, P. J., and Tiitta, P.: Global transformation and fate of SOA: Implications of low-volatility SOA and gas-phase fragmentation reactions, J. Geophys. Res.-Atmos., 120, 4169–4195, https://doi.org/10.1002/2014JD022563, 2015.
Shrivastava, M., Cappa, C. D., Fan, J., Goldstein, A. H., Guenther, A. B., Jimenez, J. L., Kuang, C., Laskin, A., Martin, S. T., Ng, N. L., Petaja, T., Pierce, J. R., Rasch, P. J., Roldin, P., Seinfeld, J. H., Shilling, J., Smith, J. N., Thornton, J. A., Volkamer, R., Wang, J., Worsnop, D. R., Zaveri, R. A., Zelenyuk, A., and Zhang, Q.: Recent advances in understanding secondary organic aerosol: Implications for global climate forcing, Rev. Geophys., 55, 509–559, https://doi.org/10.1002/2016rg000540, 2017.
Shrivastava, M., Andreae, M. O., Artaxo, P., Barbosa, H. M. J., Berg, L. K., Brito, J., Ching, J., Easter, R. C., Fan, J., Fast, J. D., Feng, Z., Fuentes, J. D., Glasius, M., Goldstein, A. H., Alves, E. G., Gomes, H., Gu, D., Guenther, A., Jathar, S. H., Kim, S., Liu, Y., Lou, S., Martin, S. T., McNeill, V. F., Medeiros, A., de Sá, S. S., Shilling, J. E., Springston, S. R., Souza, R. A. F., Thornton, J. A., Isaacman-VanWertz, G., Yee, L. D., Ynoue, R., Zaveri, R. A., Zelenyuk, A., and Zhao, C.: Urban pollution greatly enhances formation of natural aerosols over the Amazon rainforest, Nat. Commun., 10, 1046, https://doi.org/10.1038/s41467-019-08909-4, 2019.
Srivastava, D., Favez, O., Perraudin, E., Villenave, E., and Albinet, A.: Comparison of Measurement-Based Methodologies to Apportion Secondary Organic Carbon (SOC) in PM2.5: A Review of Recent Studies, Atmosphere, 9, 452, 2018.
Stark, H., Yatavelli, R. L. N., Thompson, S. L., Kimmel, J. R., Cubison, M. J., Chhabra, P. S., Canagaratna, M. R., Jayne, J. T., Worsnop, D. R., and Jimenez, J. L.: Methods to extract molecular and bulk chemical information from series of complex mass spectra with limited mass resolution, Int. J. Mass Spectrom., 389, 26–38, https://doi.org/10.1016/j.ijms.2015.08.011, 2015.
Stark, H., Yatavelli, R. L. N., Thompson, S. L., Kang, H., Krechmer, J. E., Kimmel, J. R., Palm, B. B., Hu, W. W., Hayes, P. L., Day, D. A., Campuzano-Jost, P., Canagaratna, M. R., Jayne, J. T., Worsnop, D. R., and Jimenez, J. L.: Impact of Thermal Decomposition on Thermal Desorption Instruments: Advantage of Thermogram Analysis for Quantifying Volatility Distributions of Organic Species, Environ. Sci. Technol., 51, 8491–8500, https://doi.org/10.1021/acs.est.7b00160, 2017.
Stevens, P. S., Mather, J. H., Brune, W. H., Eisele, F., Tanner, D., Jefferson, A., Cantrell, C., Shetter, R., Sewall, S., Fried, A., Henry, B., Williams, E., Baumann, K., Goldan, P., and Kuster, W.: and ratios during the Tropospheric OH Photochemistry Experiment: Measurement and theory, J. Geophys. Res.-Atmos., 102, 6379–6391, https://doi.org/10.1029/96JD01704, 1997.
Tan, Z., Rohrer, F., Lu, K., Ma, X., Bohn, B., Broch, S., Dong, H., Fuchs, H., Gkatzelis, G. I., Hofzumahaus, A., Holland, F., Li, X., Liu, Y., Liu, Y., Novelli, A., Shao, M., Wang, H., Wu, Y., Zeng, L., Hu, M., Kiendler-Scharr, A., Wahner, A., and Zhang, Y.: Wintertime photochemistry in Beijing: observations of ROx radical concentrations in the North China Plain during the BEST-ONE campaign, Atmos. Chem. Phys., 18, 12391–12411, https://doi.org/10.5194/acp-18-12391-2018, 2018.
Topping, D. O., Barley, M. H., and McFiggans, G.: The sensitivity of Secondary Organic Aerosol component partitioning to the predictions of component properties – Part 2: Determination of particle hygroscopicity and its dependence on “apparent” volatility, Atmos. Chem. Phys., 11, 7767–7779, https://doi.org/10.5194/acp-11-7767-2011, 2011.
Tsigaridis, K., Daskalakis, N., Kanakidou, M., Adams, P. J., Artaxo, P., Bahadur, R., Balkanski, Y., Bauer, S. E., Bellouin, N., Benedetti, A., Bergman, T., Berntsen, T. K., Beukes, J. P., Bian, H., Carslaw, K. S., Chin, M., Curci, G., Diehl, T., Easter, R. C., Ghan, S. J., Gong, S. L., Hodzic, A., Hoyle, C. R., Iversen, T., Jathar, S., Jimenez, J. L., Kaiser, J. W., Kirkevåg, A., Koch, D., Kokkola, H., Lee, Y. H., Lin, G., Liu, X., Luo, G., Ma, X., Mann, G. W., Mihalopoulos, N., Morcrette, J.-J., Müller, J.-F., Myhre, G., Myriokefalitakis, S., Ng, N. L., O'Donnell, D., Penner, J. E., Pozzoli, L., Pringle, K. J., Russell, L. M., Schulz, M., Sciare, J., Seland, Ø., Shindell, D. T., Sillman, S., Skeie, R. B., Spracklen, D., Stavrakou, T., Steenrod, S. D., Takemura, T., Tiitta, P., Tilmes, S., Tost, H., van Noije, T., van Zyl, P. G., von Salzen, K., Yu, F., Wang, Z., Wang, Z., Zaveri, R. A., Zhang, H., Zhang, K., Zhang, Q., and Zhang, X.: The AeroCom evaluation and intercomparison of organic aerosol in global models, Atmos. Chem. Phys., 14, 10845–10895, https://doi.org/10.5194/acp-14-10845-2014, 2014.
Tsimpidi, A. P., Karydis, V. A., Pozzer, A., Pandis, S. N., and Lelieveld, J.: ORACLE 2-D (v2.0): an efficient module to compute the volatility and oxygen content of organic aerosol with a global chemistry–climate model, Geosci. Model Dev., 11, 3369–3389, https://doi.org/10.5194/gmd-11-3369-2018, 2018.
Vivanco, M. G., Santiago, M., Sánchez, M., Clavero, M. A., Borrás, E., Ródenas, M., Alacreu, F., Vázquez, M., Clemente, E., Porras, R., Muñoz, A., and Stein, A.: Experimental data on SOA formation from mixtures of anthropogenic and biogenic organic compounds, Atmósfera, 26, 59–73, https://doi.org/10.1016/S0187-6236(13)71062-2, 2013.
Voliotis, A., Wang, Y., Shao, Y., Du, M., Bannan, T. J., Percival, C. J., Pandis, S. N., Alfarra, M. R., and McFiggans, G.: Exploring the composition and volatility of secondary organic aerosols in mixed anthropogenic and biogenic precursor systems, Atmos. Chem. Phys., 21, 14251–14273, https://doi.org/10.5194/acp-21-14251-2021, 2021.
Voliotis, A., Du, M., Wang, Y., Shao, Y., Alfarra, M. R., Bannan, T. J., Hu, D., Pereira, K. L., Hamilton, J. F., Hallquist, M., Mentel, T. F., and McFiggans, G.: Chamber investigation of the formation and transformation of secondary organic aerosol in mixtures of biogenic and anthropogenic volatile organic compounds, Atmos. Chem. Phys. Discuss. [preprint], https://doi.org/10.5194/acp-2021-1080, in review, 2022.
Yang, L. H., Takeuchi, M., Chen, Y., and Ng, N. L.: Characterization of thermal decomposition of oxygenated organic compounds in FIGAERO-CIMS, Aerosol Sci. Technol., 55, 1321–1342, 10.1080/02786826.2021.1945529, 2021.
Ylisirniö, A., Buchholz, A., Mohr, C., Li, Z., Barreira, L., Lambe, A., Faiola, C., Kari, E., Yli-Juuti, T., Nizkorodov, S. A., Worsnop, D. R., Virtanen, A., and Schobesberger, S.: Composition and volatility of secondary organic aerosol (SOA) formed from oxidation of real tree emissions compared to simplified volatile organic compound (VOC) systems, Atmos. Chem. Phys., 20, 5629–5644, https://doi.org/10.5194/acp-20-5629-2020, 2020.
Zhao, B., Wang, S., Donahue, N. M., Jathar, S. H., Huang, X., Wu, W., Hao, J., and Robinson, A. L.: Quantifying the effect of organic aerosol aging and intermediate-volatility emissions on regional-scale aerosol pollution in China, Sci. Rep., 6, 28815, https://doi.org/10.1038/srep28815, 2016.