the Creative Commons Attribution 4.0 License.
the Creative Commons Attribution 4.0 License.
 | 21 Oct 2022
Global distribution of Asian, Middle Eastern, and North African dust simulated by CESM1/CARMA
Siying Lian
Luxi Zhou
Daniel M. Murphy
Karl D. Froyd
Owen B. Toon
Dust aerosols affect the radiative and energy balance at local and global scales by scattering and absorbing sunlight and infrared light. A previous study suggests that dust size distribution is one of the major sources of uncertainty in modeling the dust global distribution. Climate models overestimate the fine dust (≤5 µm) by an order of magnitude, while underestimates of the coarse dust (≥5 µm) range between 0.5 to 1.5 orders of magnitude compared with the global observations. Here we improved the simulated size distribution of dust aerosol using a sectional aerosol model (Community Aerosol and Radiation Model for Atmospheres) coupled with the Community Earth System Model (CESM1/CARMA). Simulated dust mass size distributions peak at around 2–3 µm in diameter and increase by 4 orders of magnitude from 0.1 to 2 µm. Our model demonstrates that North African, Middle Eastern, and Asian dust accounts for ∼ 59.7 %, 12.5 %, and 13.3 % of the global annual mean dust emissions, with the remaining 14.5 % originating from scattered smaller dust sources. The model dust vertical distributions are validated against the NASA Atmospheric Tomography (ATom) field campaign datasets. Both simulations and ATom in situ measurements during the ATom field campaign suggest that dust mass concentrations over the remote ocean drop by 2 to 3 orders of magnitude from the surface to the upper troposphere (200 hPa). Our model suggests that Asian dust contributes to more than 40 % of annual mean dust mass abundances in the global upper troposphere and lower stratosphere (UTLS). The model suggests that Asian dust dominates the dust mass budget in the UTLS of the Asian summer monsoon (ASM) region, with a relative contribution 1–2 orders of magnitude higher than the dust originating from the North African and Middle Eastern deserts.
- Article
(9589 KB) - Full-text XML
-
Supplement
(1030 KB) - BibTeX
- EndNote


Mineral dust, from both natural and anthropogenic sources, accounts for more than 50 % of the total global aerosol mass burden (Textor et al., 2006; Andreae, 1995; Andreae et al., 1986; Zender et al., 2004). Mineral dust impacts the radiation balance of the planet by scattering and absorbing sunlight, and unlike most other types of aerosols, dust has significant effects on thermal radiation due to its relatively large particle sizes (i.e., Satheesh and Moorthy, 2005; Sokolik and Toon, 1996; Balkanski et al., 2007; Tegen and Lacis, 1996). Dust optical properties vary between different sources (Sokolik and Toon, 1999), making it complex to construct global models of dust radiative effects. Dust also indirectly impacts climate by serving as prominent nuclei for heterogenous ice formation (e.g., Maloney et al., 2022; Cziczo et al., 2013). Despite being insoluble, dust can also serve as cloud condensation nuclei due to the large particle sizes of dust, influencing cloud microphysical and rainfall processes (Rosenfeld et al., 2001; Levin et al., 1996).
Tegen and Schepanski (2009) suggest that the Sahara and Asia are the largest source regions of mineral dust on Earth, accounting for more than 60 %–95 % of the global dust load. Saharan dust is lifted all year, primarily due to subtropical weather systems. Saharan dust can travel across the Atlantic Ocean, driven by the trade wind circulation (Karyampudi, 1979; Karyampudi et al., 1999). Asian dust is mostly lifted in the spring by mid-latitude frontal systems and is likely to be removed near its source due to rainfall, though it can be carried at upper levels across the Pacific (Su and Toon, 2011). North African and Asian dust can be transported to the upper troposphere (UT) and even farther around the Earth by subtropical westerly jets (Yang et al., 2022).
The accurate representation of the dust emissions from individual source regions is important to understand the climate impact of dust on the Earth system (Kok et al., 2021). The contributions of dust from the different source regions to the global dust load are still uncertain. Global model simulations show that the dust emission from different source regions differ by an order of magnitude among different models (Huneeus et al., 2011).
One source of uncertainty is quantifying the emission of dust aerosols that can be attributed to the size distribution of dust aerosol (Tegen, 2003). The emitted dust size distribution is a basic parameter to simulate (Huneeus et al., 2011), and the lifetime and radiative effect of dust with different particle sizes differ substantially, which impacts the simulation of dust on the global scale (Kok, 2011). Kok (2011) showed that most global climate models (GCMs) overestimate the dust-emitted fraction with particle sizes less than 2 µm by a factor of ∼ 2–8 and underestimate the fraction of emitted dust greater than 5 µm which causes the underestimation of the dust global emission rate.
The vertical distribution of dust is crucial for understanding the vertical and long-distance transport of dust aerosols. Bourgeois et al. (2015) showed that the residence time of dust is significantly affected by its vertical location during long-range transport. However, in situ measurements of dust's vertical distribution from the surface to the upper troposphere are extremely limited compared with surface measurements. Yu et al. (2015a) calculated the vertical mass flux of dust by converting the dust extinction coefficient of Cloud-Aerosol Lidar with Orthogonal Polarization (CALIOP) to dust mass concentration, yielding estimated dust mass fluxes with an uncertainty of ±(45 %–70 %). Yu et al. (2010) showed that the modeled dust extinction of the Goddard Chemistry Aerosol Radiation Transport (GOCART) exceeded CALIOP's measurements by more than a factor of 2 from the middle to the upper troposphere over the northwestern Pacific. Based on CloudSat data from 2007 to 2009, combined with CALIOP/CPR (cloud profiling radar) nighttime measurements, Yang et al. (2022) suggested that the dust mass loading at 4–10 km in the Northern Hemisphere (NH) reaches a maximum in March–April–May. The dust concentrations at 4–6 km have an opposite phase to the wind speed over Africa and west Asia. Despite the great coverage of satellite data, remote sensing techniques have considerable uncertainty in retrieving the dust vertical distribution. From 2016 to 2018, a pole-to-pole airborne in situ measurement from the NASA Atmospheric Tomography Mission (ATom) field campaign (Froyd et al., 2022; Wofsy et al., 2018) in situ measured dust vertical distributions from pole to pole and from the surface to the upper troposphere over the remote ocean.
Dust aerosol can be transported to the upper troposphere (UT) via deep convections. Dust transported to the upper troposphere can affect cirrus formation through heterogeneous nucleation (Froyd et al., 2010, 2022). Ma et al. (2019) simulated the chemical composition of the Asian tropopause aerosol layer and found a dust maximum inside the anticyclone of the Asian summer monsoon (ASM). However, the abundance, source attributions, and spatiotemporal distribution of dust in the UT of ASM still have large uncertainties.
We use a sectional aerosol model coupled with a climate model to study the global distribution of dust, with a focus on the size distribution and vertical distribution. We compare the simulated dust abundance from the surface to the upper troposphere with in situ measurements from the ATom field campaign (Froyd et al., 2022). Then we use the constrained model to simulate the spatiotemporal distribution of dust coming from the Sahara, Middle East, and East Asia. Finally, we estimate dust source attributions during the Asian summer monsoon from the three source regions.
2.1 CESM1/CARMA model
We use a sectional aerosol microphysics model, the Community Aerosol and Radiation Model for Atmospheres (CARMA; P. F. Yu et al., 2015, 2019; Bardeen et al., 2008; Toon et al., 1988) coupled with the National Science Foundation (NSF)/Department of Energy (DOE) Community Earth System Model (CESM) to simulate the global distribution of dust between 2014 and 2019. The model simulations are conducted at a horizontal resolution of 1.9∘ × 2.5∘ and with a time step of 30 min. The model has 56 hybrid levels from the surface up to about 45 km, with a vertical resolution of about 1 km near the tropopause. The meteorological fields were nudged to Goddard Earth Observing System (GEOS5) reanalysis data.
CESM1/CARMA includes two groups of particles. The first group is liquid sulfuric acid droplets that form from gas-phase nucleation and span a diameter range from 0.2 nm to 2.6 µm. The second group is an internal mixture of primary emitted organics, secondary organics, dust, sea salt, black carbon, and condensed sulfate (P. F. Yu et al., 2015). The mixed particles are resolved with 20 discrete size bins, with diameters ranging from 100 nm to 17 µm in the model. The aerosol optical properties in CESM1/CARMA are estimated using a Mie scattering code, with inputs based on particle size, relative humidity, and aerosol composition (P. F. Yu et al., 2015). We assume that dust has a density of 2.65 g cm−3 and use wavelength-dependent refractive indices (RIs; P. F. Yu et al., 2015). The RI at 532 nm is 1.53–0.006i in the mode which is independent of the dust source region, even though these properties vary with dust source in reality. Note that the reported imaginary part of the refractive index of dust aerosol ranges from 0.0006 to 0.0048, according to previous studies (Sinyuk et al., 2003; Di Biagio et al., 2019; Balkanski et al., 2007), which suggests that our model may overestimate the absorption aerosol optical depth from dust aerosol.
2.2 Dust emission parameterization
Mineral dust emission is simulated as a saltation sandblasting process, which can be explained by the wind erosion theory. The process is driven by surface stress, which is usually expressed as friction wind velocity (Ginoux et al., 2001). When the frictional wind speed exceeds a certain threshold, the force of the wind will overcome the gravitational force of the sand grains and the cohesive forces between particles, and sand-sized particles will saltate. When they impact, the surface dust particles will be lofted into the air (Marticorena and Bergametti, 1995). The wind-driven emission of dust aerosols in CESM1/CARMA is provided by Su and Toon (2009) and P. F. Yu et al. (2015). The total emission flux is parameterized as follows:
where Ftotal is the particle-size-dependent flux of dust. C is an arbitrary constant that depends on the spatial resolution of the climate model among other factors and is set to 0.6 µg s2 m−5. u is the 10 m wind speed, which is parameterized by the surface friction velocity (u∗) and the 10 m drag coefficient (Cd) so that, under neutral conditions, . ut is the threshold wind speed, which depends on the particle size (Su and Toon, 2009; Marticorena and Bergametti, 1995). Details on u∗, ut, and Cd can be found in P. F. Yu et al. (2015). Se is the dust erodibility factor, which denotes the efficiency of dust lifting and is derived from the Total Ozone Mapping Spectrometer (TOMS) aerosol index reported by Ginoux et al. (2001).
Following Prospero and Bonatti (1969), the model assumes that 90 % of the dust emission mass flux is distributed in silt bins with diameter ranges from 2.6 to 17.4 µm, and the remaining 10 % is in clay bins with diameter ranges from 0.1 to 2 µm (P. F. Yu et al., 2015). In the present study, we adjust the relative mass fractions in the clay and silt bins to match the data reported by Adebiyi and Kok (2020), and this is discussed in Sect. 3.1.
2.3 Convective transport parameterization
Particles are primarily activated at the cloud base. CESM1/CARMA consider the activation of particles, including dust, from the entrained air above the cloud bases (secondary activation; Froyd et al., 2022; Yu et al., 2019). Previous studies have found that climate models that fail to consider secondary activation above the cloud base overestimate the abundance of primary particles like sea salt and black carbon in the upper troposphere by orders of magnitude (Yu et al., 2019; Murphy et al., 2021). A comparison with global airborne measurements of dust suggests that dust is also subject to secondary activation above the cloud base and subsequent in-cloud removal (Froyd et al., 2022). For below-cloud scavenging, the tuning parameter for the aerosol's solubility in CESM1/CARMA is 0.2 for dust and 1.0 for sea salt (P. F. Yu et al., 2015). For convective removal, we treat dust's removal efficiency in the same way as other aerosol types. Details of the parameterizations can be found in Wang et al. (2013), Grell and Freitas (2014), and the supplement of Yu et al. (2019).
2.4 ATom airborne field campaign
The Atmospheric Tomography Mission (ATom) was an airborne field campaign with in situ measurements of atmospheric composition in the remote troposphere from about 0.18 to 12 km in altitude in the Pacific and Atlantic basins, spanning from ∼ 82∘ N to ∼ 86∘ S latitude (Spanu et al., 2020; Wofsy et al., 2018). It consisted of 48 science flights by the NASA DC-8 aircraft, with 548 vertical profiles during four flight series covering roughly the same loop (Bourgeois et al., 2020). A comprehensive set of aerosol measurement data, including mineral dust, was collected from July 2016 to May 2018.
In this study, we compare the simulations with measured dust concentrations during the ATom mission from 2016 to 2018. Dust concentration data are based on data from the National Oceanic and Atmospheric Administration (NOAA) Particle Analysis by Laser Mass Spectrometry (PALMS) instrument (Froyd et al., 2019; Brock et al., 2019; Murphy et al., 2003). The PALMS instrument measures the chemical composition of individual ambient particles from about 0.1 to 4.8 µm in diameter by evaporating individual particles and then using a time-of-flight mass spectrometer to analyze ions (Murphy et al., 2006). Dust and other particle types are classified using spectral signatures. Dust mass concentrations are then determined by combining the PALMS classifications with absolute particle concentrations from independent optical particle counters (Froyd et al., 2019, 2022). The measured aerodynamic particle size are converted to the geometric diameter using a constant density and shape factor as described in Froyd et al. (2022). To directly compare with the ATom dust vertical profiles measured by PALMS, we sample the simulated dust concentration with diameter between 0.1 and 4.5 µm along the ATom flight track.
2.5 Surface measurement networks
Huneeus et al. (2011) summarize dust measurements at the surface around the globe, including those compiled by Mahowald et al. (2009) and the University of Miami network (Prospero et al., 1989; Prospero, 1996; Arimoto et al., 1995). Data compiled by Mahowald et al. (2009) contain a dataset of short-term measurements from cruises and monitoring stations with daily averaged surface dust concentrations. Cruises measured iron (Fe) and converted it to dust by assuming a 3.5 % Fe in dust. The iron content in dust varies according to the source regions, and this value is the average iron content of the Earth's crust (Mahowald et al., 2005). Long-term observations by the University of Miami include Pacific, Atlantic, and Antarctic ocean sites globally and measure the mass concentration of dust with diameter less than 40 µm (Prospero et al., 1989; Prospero, 1996; Arimoto et al., 1995).
3.1 Dust size distribution and emission
Based on global measurements of atmospheric dust size distributions, Adebiyi and Kok (2020) found that the global models in AeroCom (Aerosol Comparison between Observations and Models project) underestimate the coarse dust mass load in the atmosphere by a factor of 4 and overestimate the fine dust mass load by 1–3 orders of magnitude. Figure 1 shows that CESM1/CARMA (P. F. Yu et al., 2015) generally reproduces the measured dust size distribution with diameter less than 1 µm or greater than 3 µm within the variabilities in the data. However, the CESM1/CARMA (P. F. Yu et al., 2015) underestimates the dust in the size range between 1 and 3 µm by 1 order of magnitude (red dashed line). In this study, we simply adjust the mass fraction of the emitted dust in the silt bins with a geometric diameter greater than 2 µm from 90 % to 94 %. The global dust size distribution simulated in the modified model (CESM-CARMA solid red line in Fig. 1) agrees better with measurements from Adebiyi and Kok (2020; Fig. 1). The simulation shows that the model underestimates the coarse-mode dust with diameter larger than 10 µm by ∼ 48 %. The modeled total dust concentration at the surface can be biased low, while modeled dust in the upper troposphere is not significantly affected as giant dust particles sediment quickly.
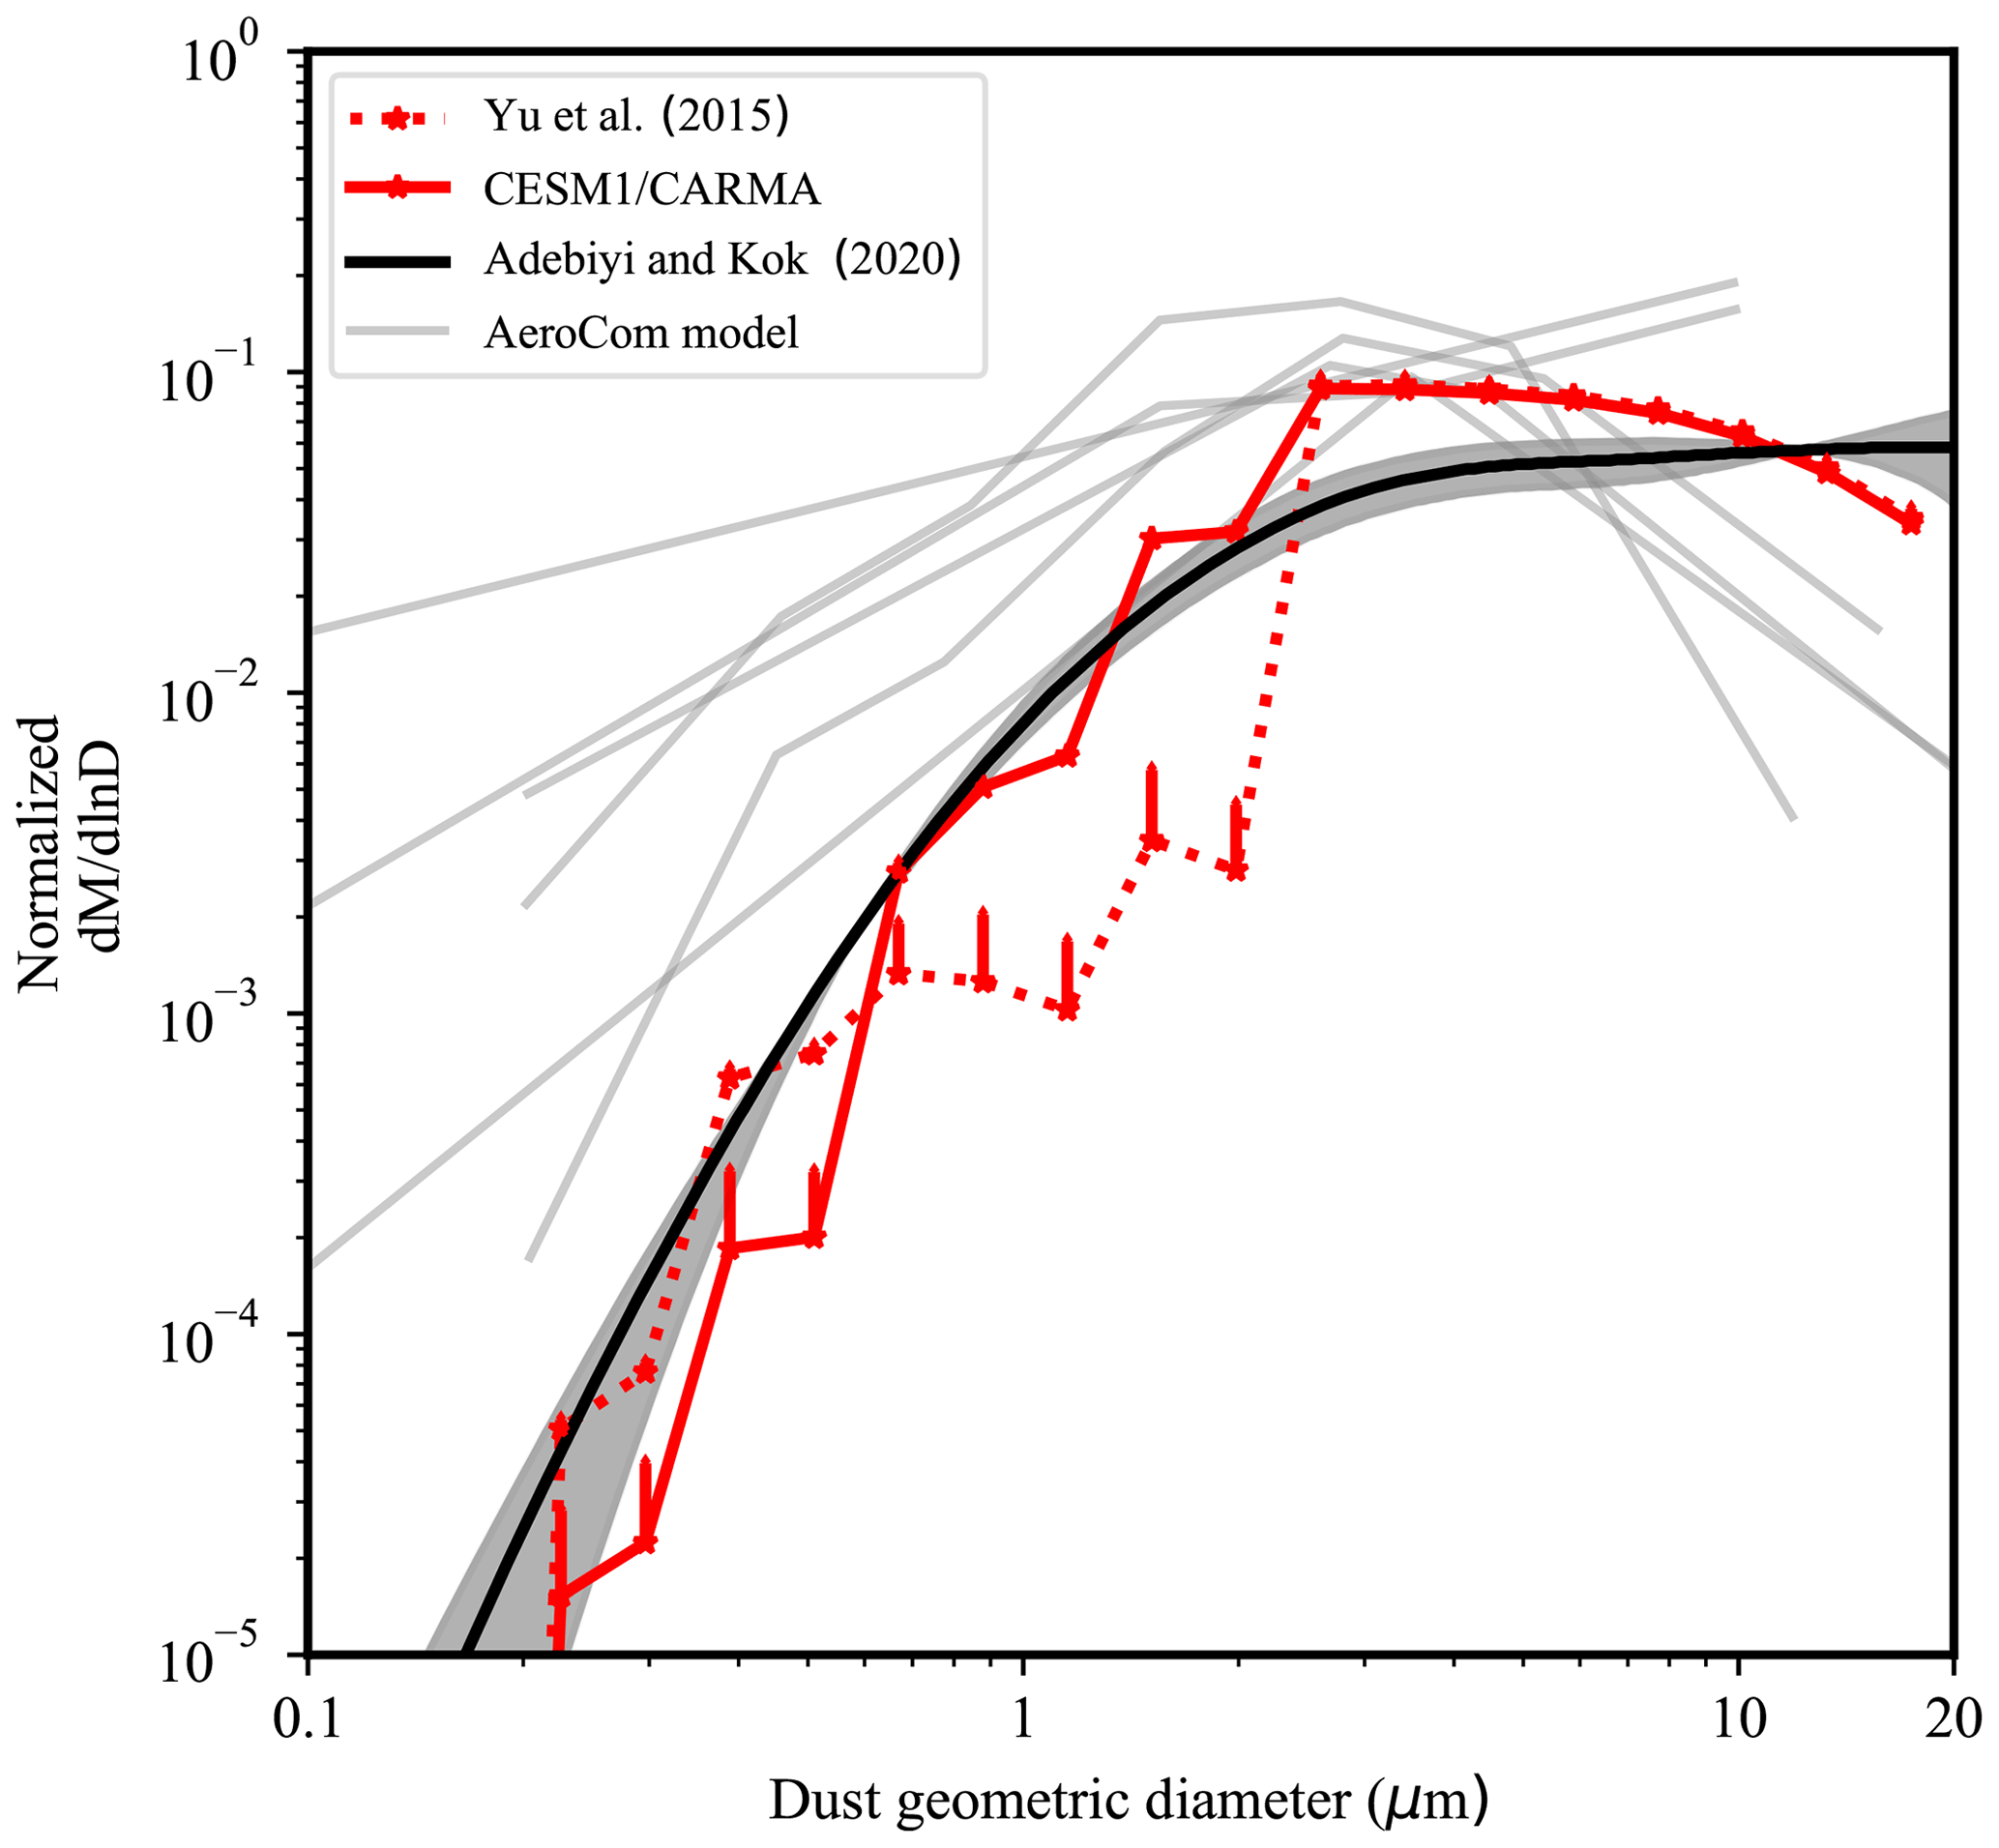
Figure 1Comparison of the simulated and measured normalized global mean dust size distributions. The dust mass size distributions are divided by the total dust mass integrated over the size range (i.e., the area under each dM dlnD curve). The global and annual mean dust size distribution simulated by CESM1/CARMA with the dust emission parameterization, described in P. F. Yu et al. (2015), is shown by the dashed red line. The simulation by CESM1/CARMA with the modified emission parameterization is shown by the solid red line. Temporal variabilities (1 standard deviation) from P. F. Yu et al. (2015) and CESM1/CARMA are denoted by green and cyan lines. The simulated size distribution by the AeroCom models reported in Adebiyi and Kok (2020) is denoted by the gray lines. The measured dust size distribution derived from the global measurements reported in Adebiyi and Kok (2020) is denoted by the solid black line. The shading represent the 95 % confidence interval.
Figure 2 shows the global annual mean emission of fine (with diameter less than 4.5 µm) and coarse (with diameter greater than 4.5 µm) dust simulated by CESM1/CARMA. The simulated global and annual mean mass emission of coarse dust is higher than that of fine dust by a factor of 2.8. The three largest dust source regions in the world, i.e., the Sahara, Middle East, and Asia, contribute ∼ 85 % of total global dust emissions and about 97 % of Northern Hemisphere (NH) dust. Dust emissions from the Sahara in North Africa account for ∼ 59.7 % of global emissions by mass. Middle Eastern and Asian dust emissions account for ∼ 12.5 % and 13.3 % of global emissions, respectively.
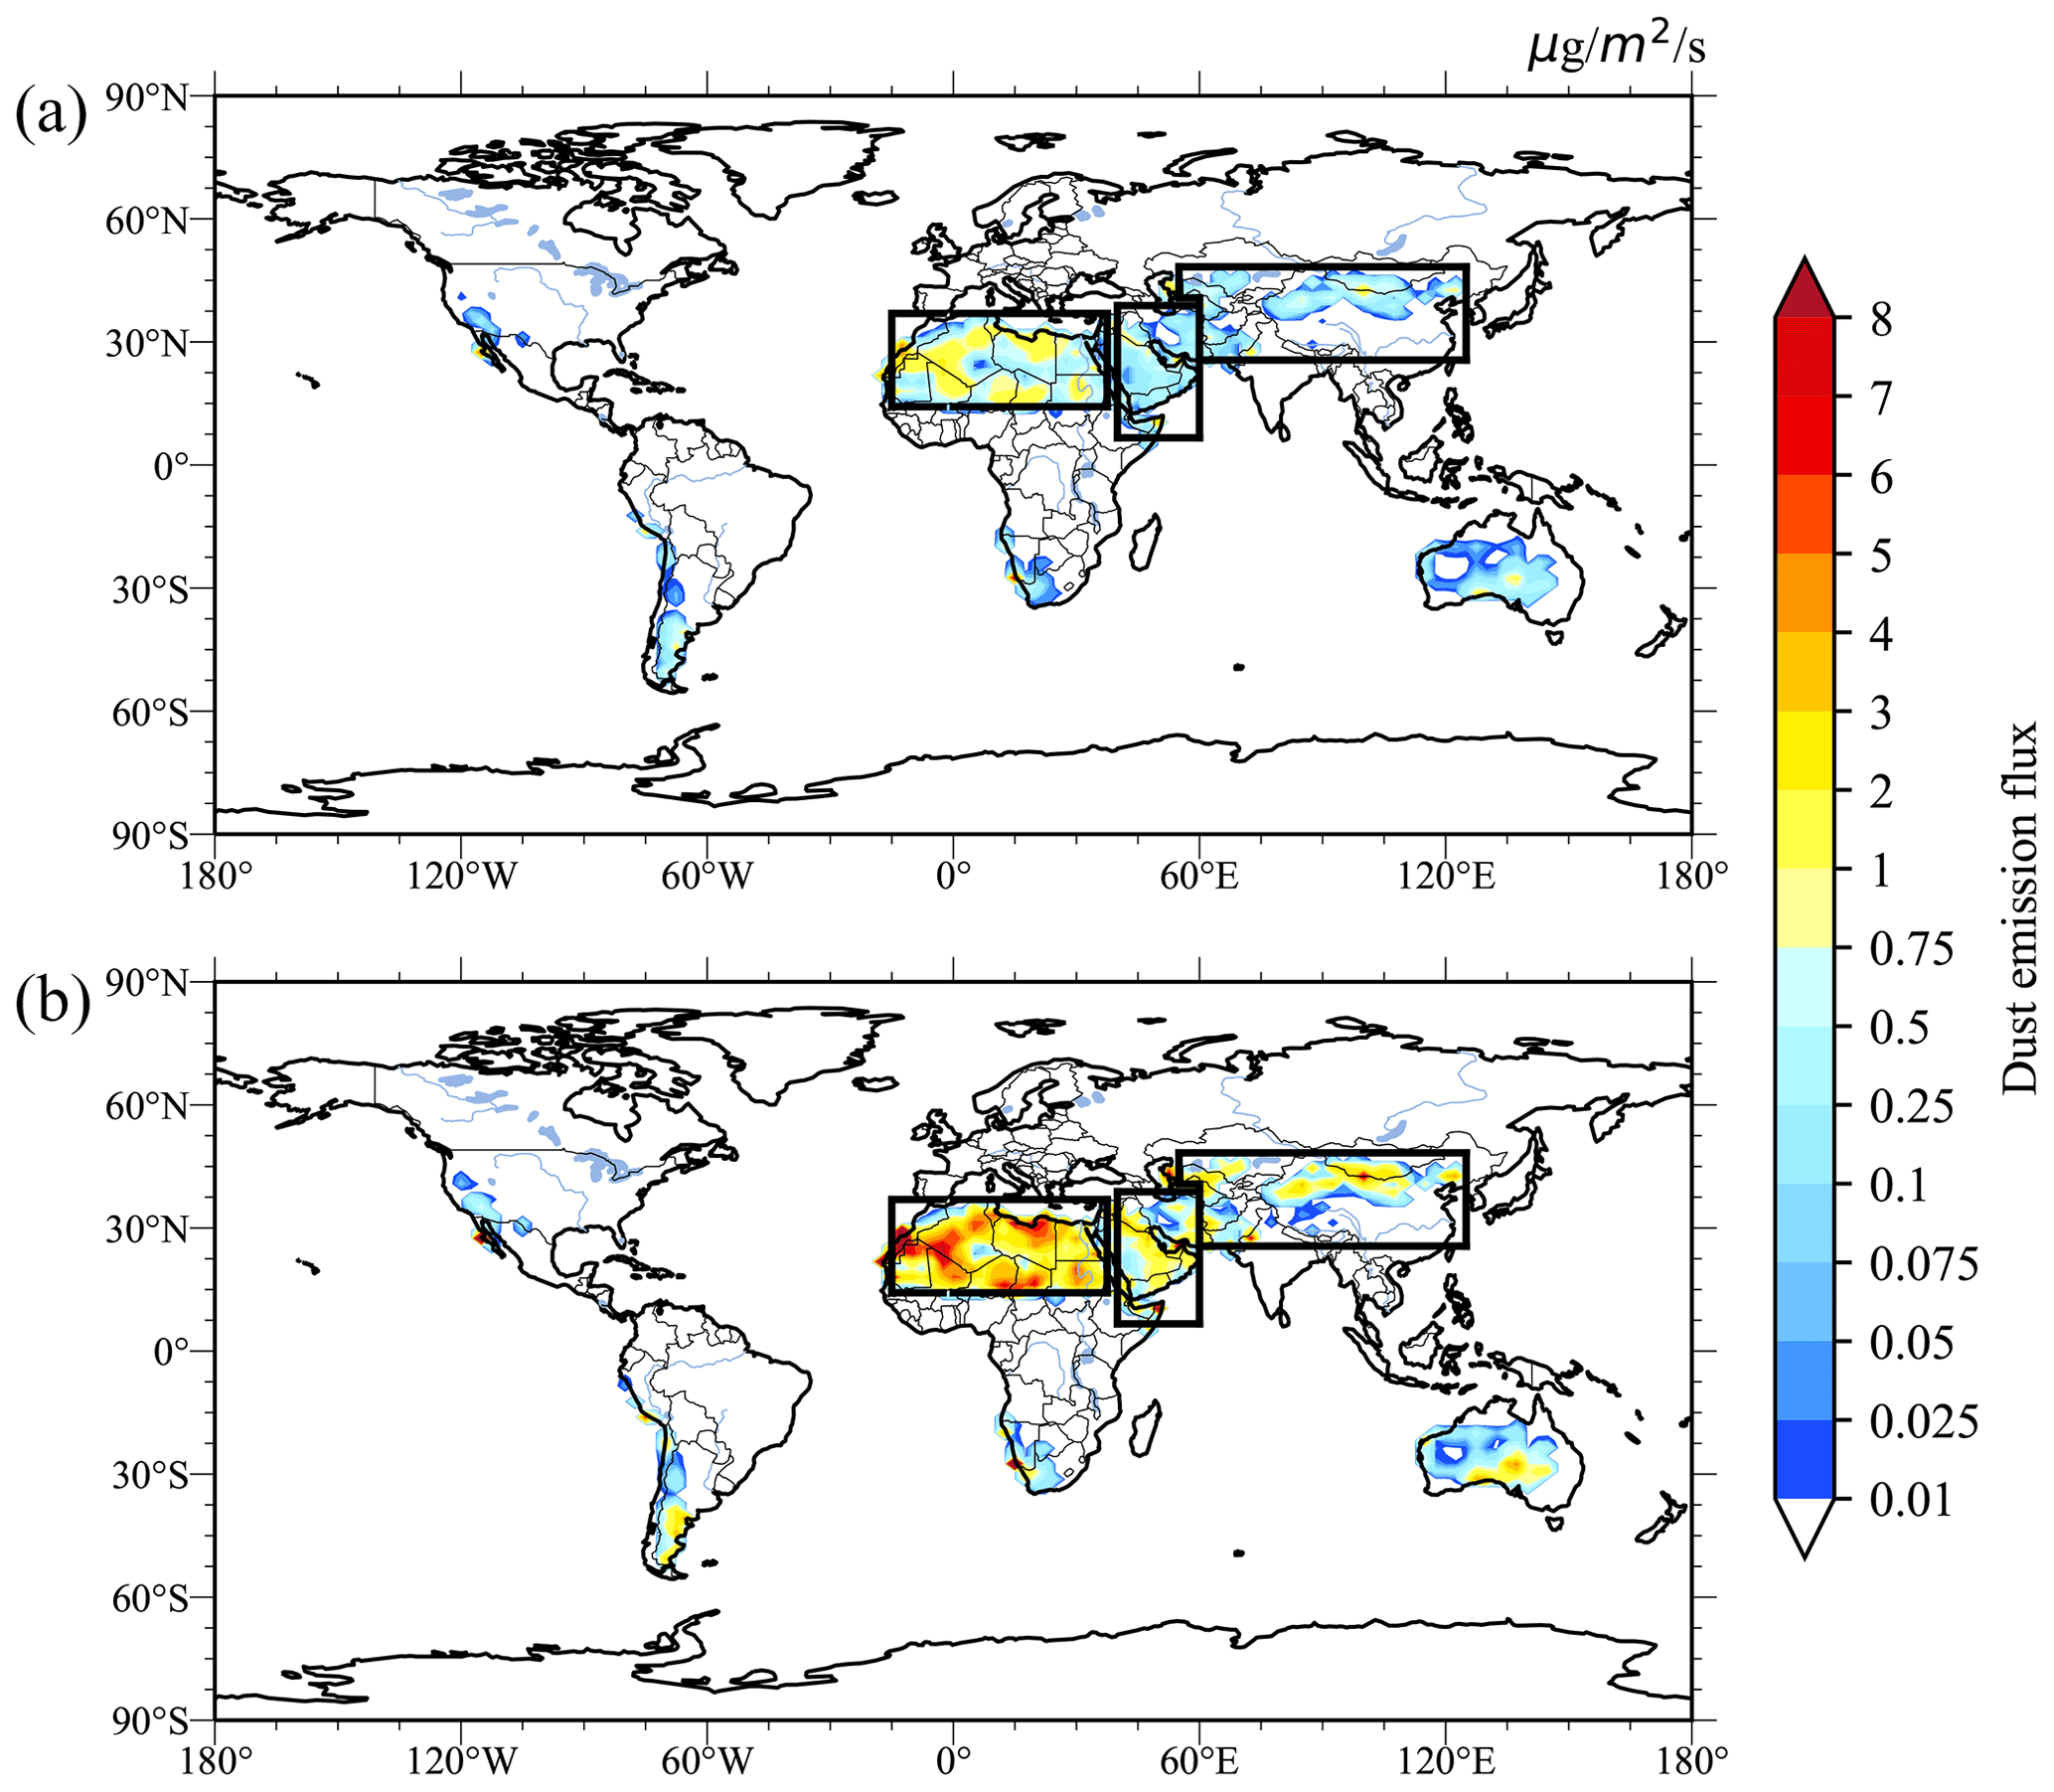
Figure 2(a) Simulated annual emission flux (µg m−2 s−1) of dust with a geometric diameter less than 4.5 µm in CESM1/CARMA, averaged from February 2014 to January 2018. Panel (b) is same the as panel (a) but for dust with a geometric diameter larger than 4.5 µm. The regions of interest are indicated by the black boxes. The coordinates of the three regions are the (1) North African source (20∘ W–35∘ E and 10.4–36.9∘ N), (2) Middle Eastern source (35–60∘ E and 6.6–38.8∘ N), and (3) Asian source (55–60∘ E for 40.7–48.3∘ N and 60–125∘ E for 25.5–48.3∘ N).
3.2 Comparison with dust surface measurements
In Fig. 3, we compare the simulated annual mean dust concentrations at the surface from 2014 to 2018 with the observational datasets summarized in Huneeus et al. (2011). In general, the simulated dust concentrations are within 1 order of magnitude of the observations (Fig. 3b). The simulated dust underestimated the measured dust concentration from the University of Miami network by 70 %, while it overestimated the dust concentration from the compiled dataset (Mahowald et al., 2009) by a factor of 3.75. Both the model and observations show that the dust concentration in the Northern Hemisphere (NH) is about 1 order of magnitude higher than that in the Southern Hemisphere (SH) due to higher NH dust emissions because of the greater area of NH deserts. Because a lack of detailed date information in the measurements compiled by Mahowald et al. (2009), the comparison of the annual mean model concentration and short-term observations possibly result in a large bias but still provide valuable information (Wang et al., 2015). In order to explain the bias, we show the error bars by the median (66 %) of the modeled daily averaged model concentration (denoted by the vertical dashed line) for each set of cruise data, following the method suggested by Mahowald et al. (2008) and Huneeus et al. (2011). Near the dust source region (e.g., downwind of the Sahara), the model underestimates the measured median dust surface concentrations by 5.4 %. The dust simulation underestimates the averaged ship cruise measurements by 11 % over the remote ocean basins in the SH. Higher model low biases of 72 % are found in the tropical Pacific, which indicates that dust is removed too efficiently amid transport from the source regions.
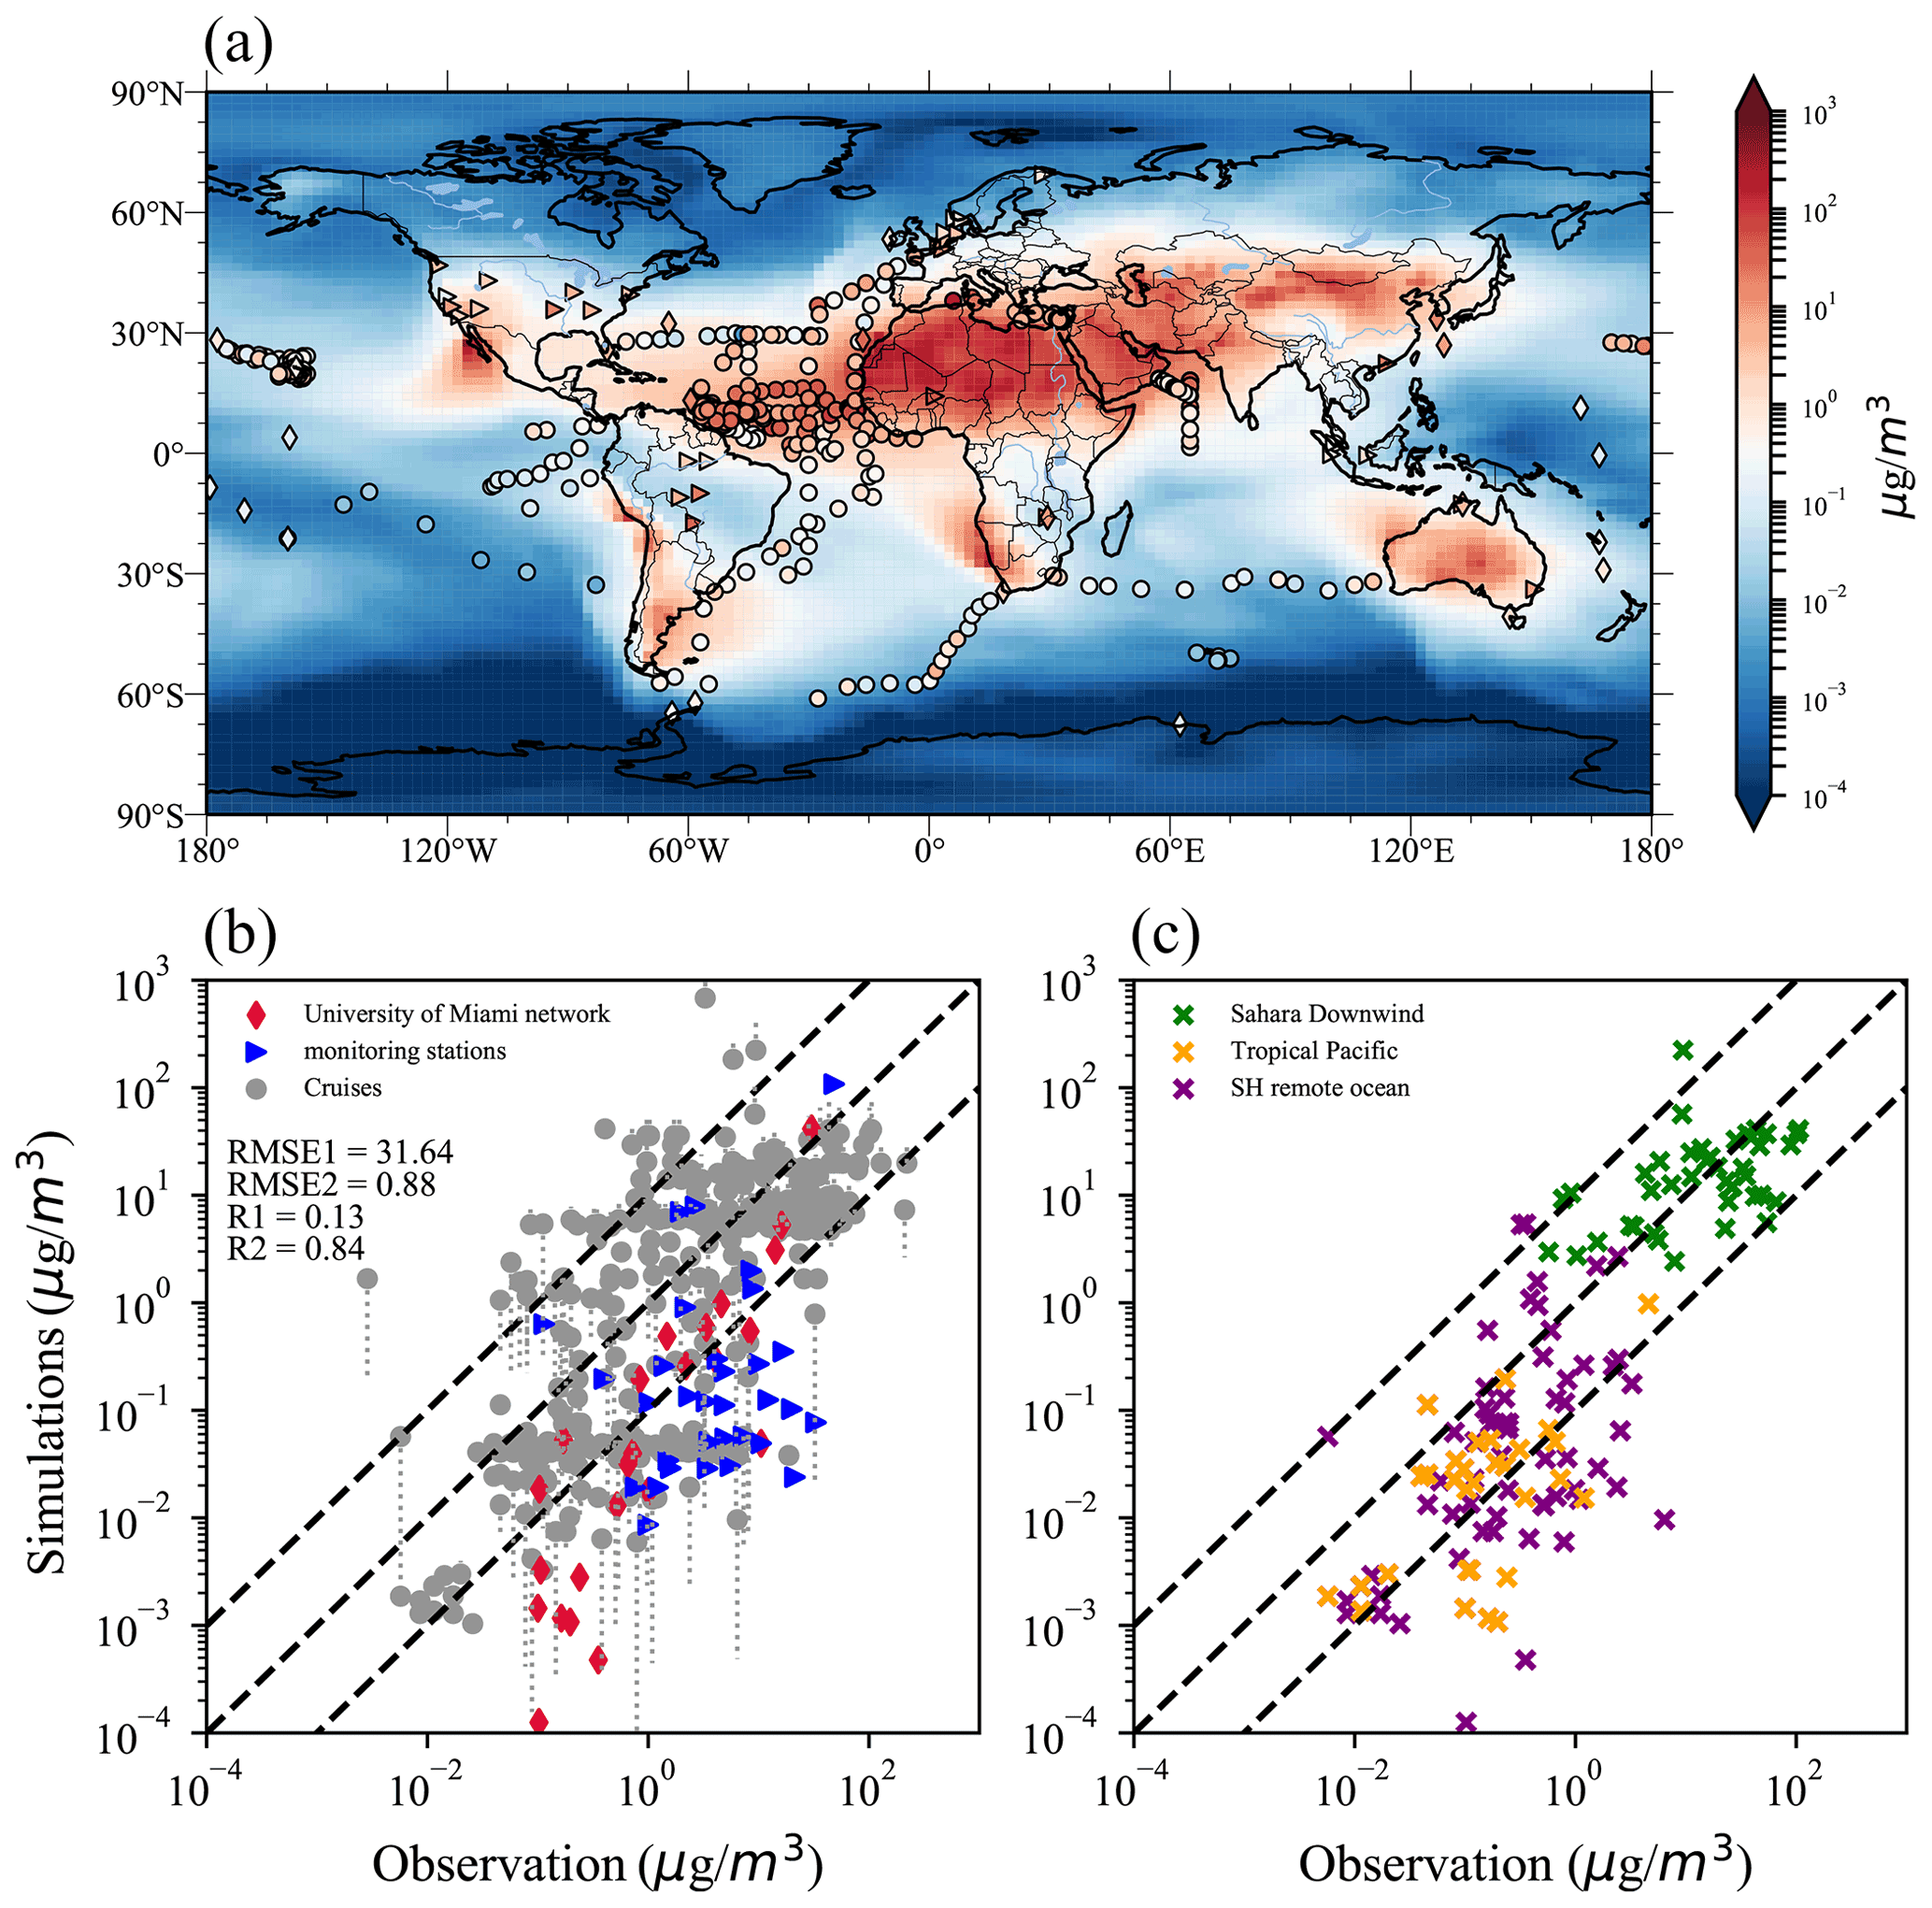
Figure 3(a) Simulated global dust surface concentrations (µg m−3) averaged from 2014 to 2019 from CESM1/CARMA shown with the filled contour. The summarized dust surface concentration datasets from Huneeus et al. (2011) are indicated by markers of different shapes. Compiled observations, including those from long-term observational sites and cruise data reported in Mahowald et al. (2009), are indicated by triangles and circles, respectively. Measurements from the University of Miami network (Prospero et al., 1989; Prospero, 1996; Arimoto et al., 1995) from 1981 to 1998 are indicated with diamonds. (b) Comparison of the simulated dust concentrations by CESM1/CARMA with the compiled observational dataset from Mahowald et al. (2009) and the University of Miami network. Gray circles and blue triangles represent selected data from the Mahowald et al. (2009) short-term cruises and long-term observations, respectively. Red diamonds represent the University of Miami network measurements. “R1” and “RMSE1” represent the correlation coefficient (R) and the root mean square error (RMSE) between simulations and measurements from Mahowald et al. (2009), respectively. In the meantime, “R2” and “RMSE2” represent the University of Miami dust data. The gray dotted line indicates the simulated error bar extracted from the simulated daily concentration, following the method in Mahowald et al. (2008). (c) Same as panel (b) but the North African downwind area and the tropical Pacific basin and SH remote ocean are represented as green, orange, and purple stars, respectively. The 1:1, 1:10, and 10:1 relationships between the simulated and observed dust concentrations are indicated by the black dashed lines.
Figure 4 compares the simulated concentrations of dust below 1 km above sea level (a.s.l.) with a diameter of less than 4.5 µm near the surface (0–1 km a.s.l.) over remote ocean basins with the NASA Atmospheric Tomography (ATom-1) airborne field campaign (Froyd et al., 2022; Wofsy et al., 2018). Both observations and the model suggest that higher dust concentrations are found in the Atlantic basin downwind of North Africa and near the west coast of North America. As shown in Fig. 4c, the model underestimates the average dust surface concentrations observed during ATom-1 by 62 %, with a correlation coefficient of 0.55. Except for the Southern Ocean, the modeled dust concentration is within an order of magnitude of the observations in general. The model strongly underestimates the observed dust concentration in the remote Southern Ocean by over 1 order of magnitude. The underestimation of southern Pacific Ocean dust could be partly due to the underestimation of the emissions in SH. In addition to a possible lack of emissions, the model may generate too much convection and thereby have a too efficient wet scavenging of dust aerosols.
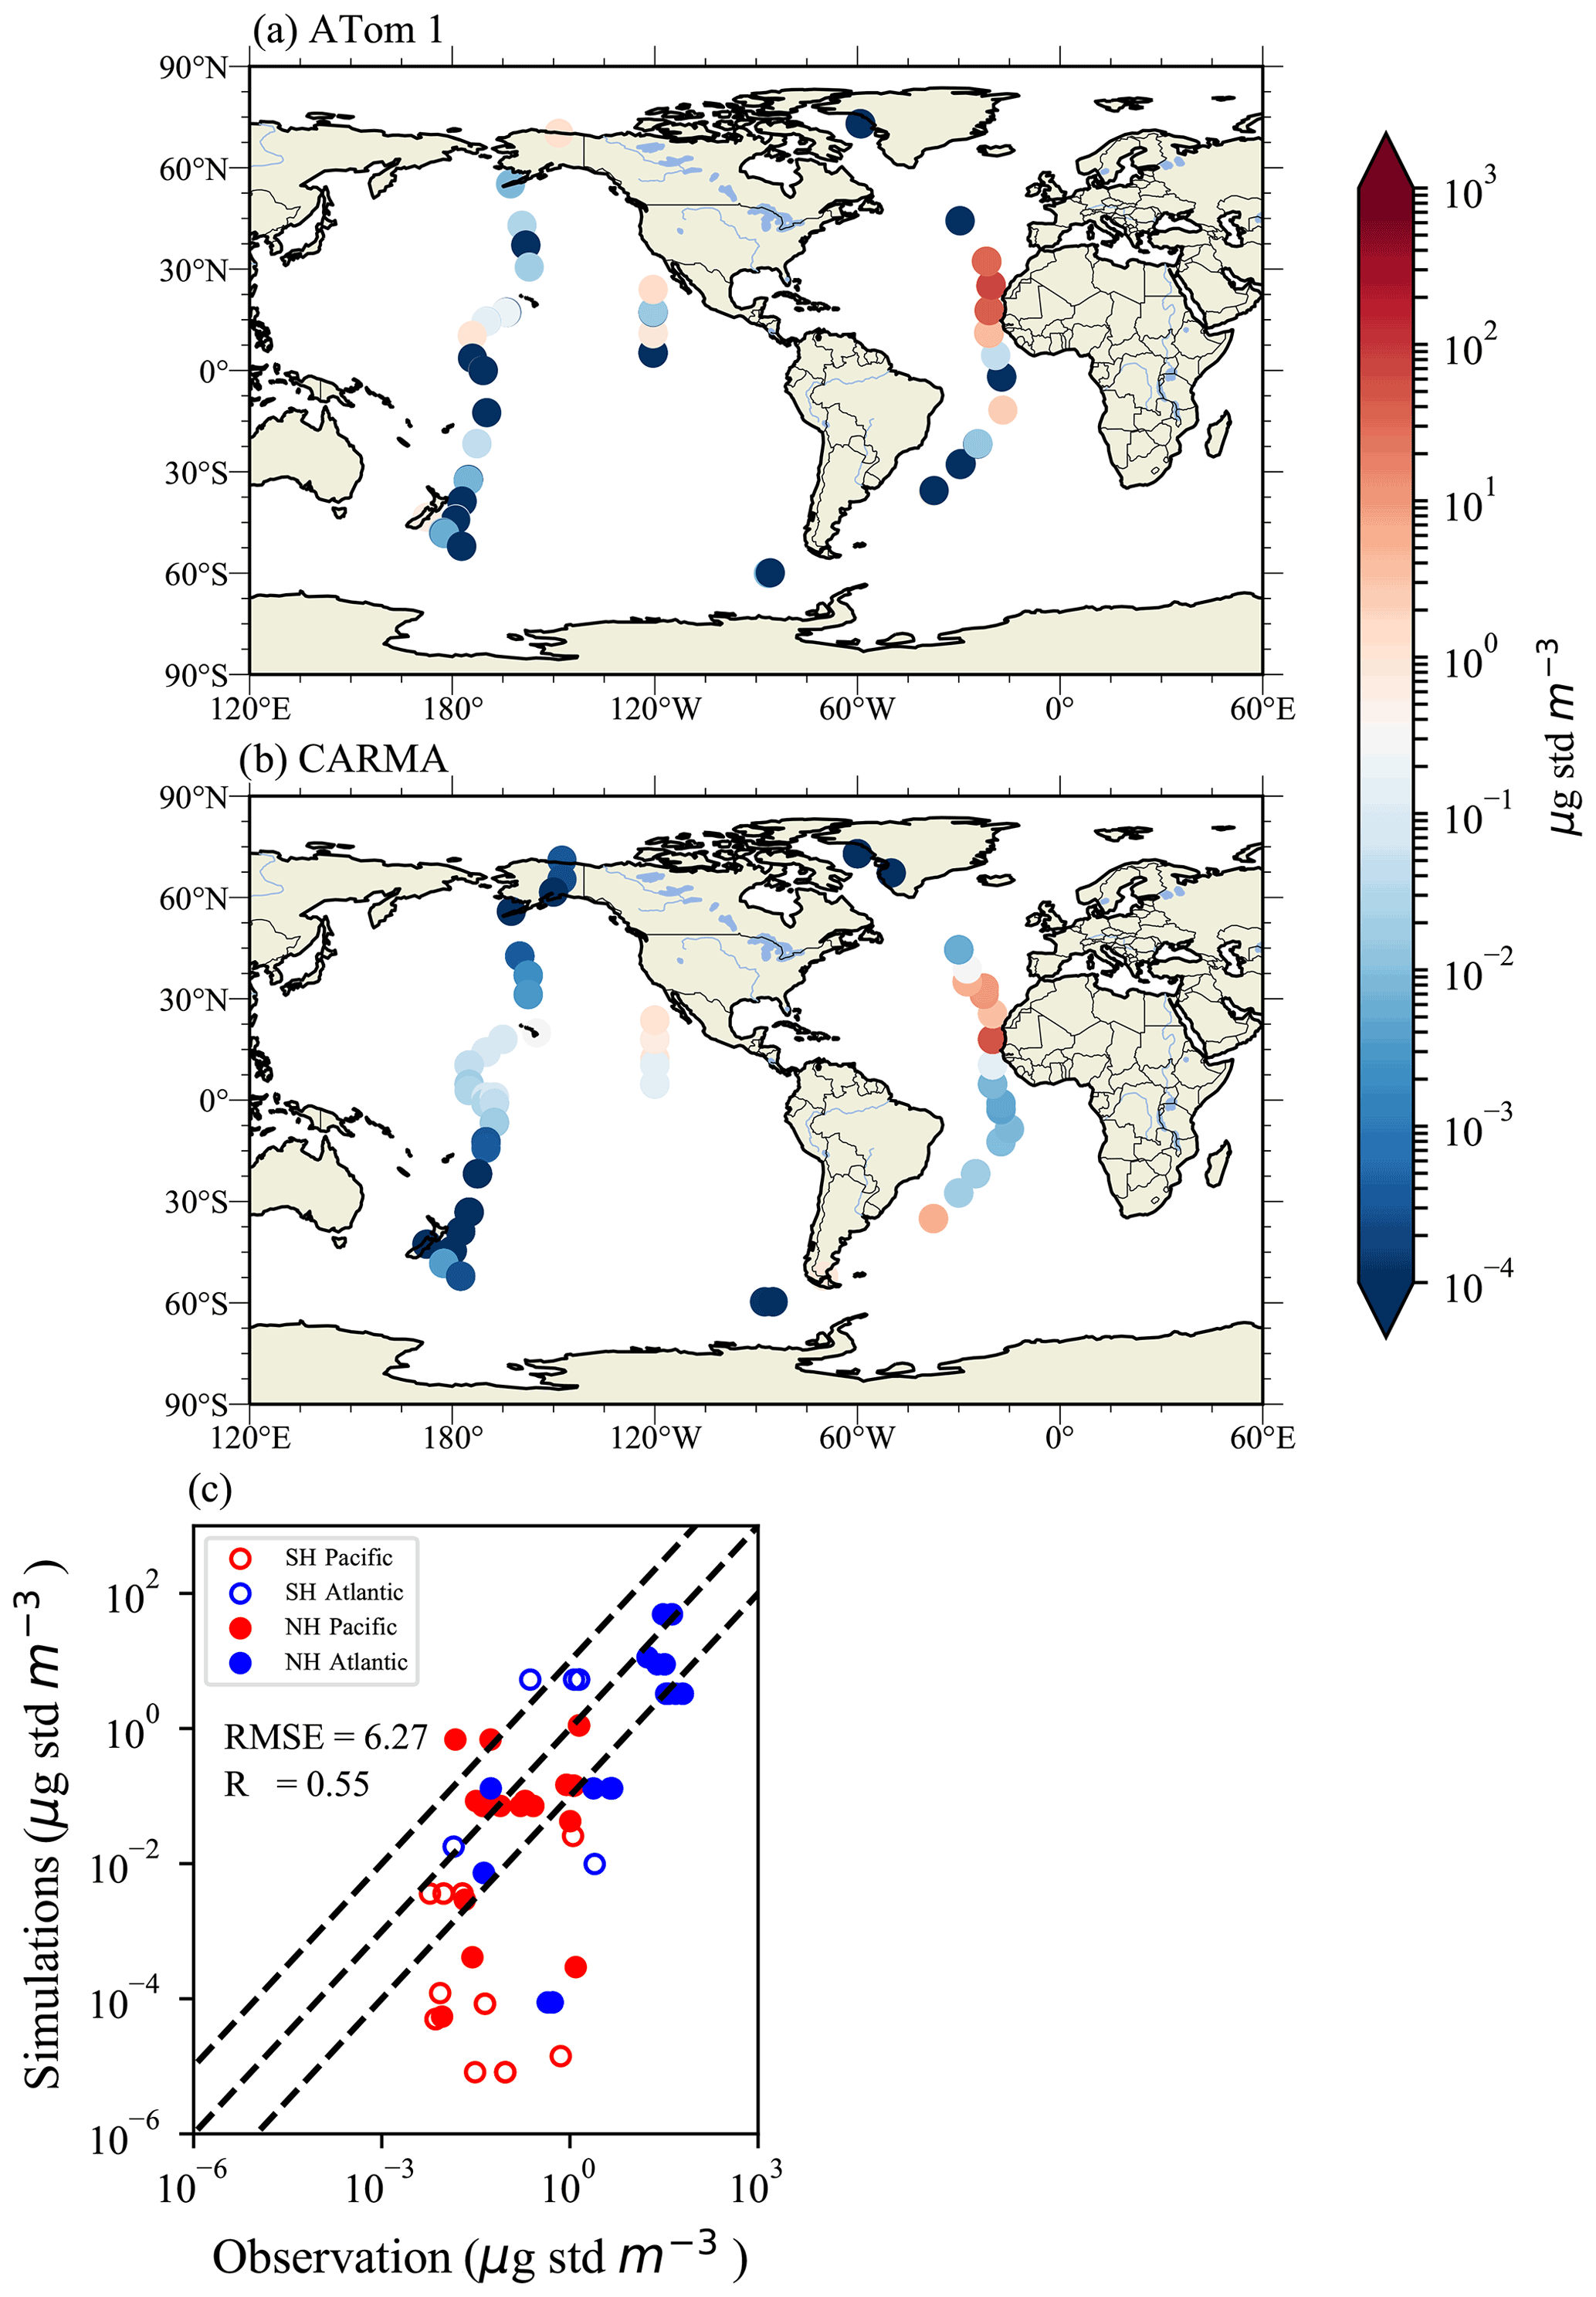
Figure 4Comparison of the dust concentration below 900 mb with a particle diameter of less than 4.5 µm simulated by CESM1/CARMA with the NASA ATom-1 airborne campaign. Both model and observations are sampled along the NASA Atom-1 flight track. (a) Observed dust surface concentration according to ATom-1. Panel (b) is the same as panel (a) but with simulations from CESM1/CARMA. (c) Scatterplot of CARMA simulation compared with ATom-1 for dust surface concentration. Southern Pacific and Atlantic basin sites are denoted by red and blue circles, respectively, while the northern Pacific and Atlantic basin sites are denoted by red and blue points, respectively. The black dashed lines in each panel denote 1:10, 1:1, and 10:1 relationships between observations and simulations, respectively.
3.3 Comparison with dust vertical distribution
Figure 5 compares the dust vertical distribution between CESM1/CARMA and measurements by PALMS during ATom-1 in August 2016. The observed dust concentrations in the lower tropospheric NH mid-latitudes (27–60∘ N) and tropics (27∘ S–27∘ N) are about an order of magnitude higher than those in the SH mid-latitudes (27–60∘ S), due to higher surface emissions in NH (Fig. 2). The tropical lower tropospheric dust loading in the Atlantic basin, which is downwind of North Africa, is over 1 order of magnitude higher than that in the Pacific Ocean. Both observations and the model show that the dust concentration decreases by 2 to 3 orders of magnitude from the surface to about 12 km. The strong vertical gradient is consistent with the findings reported in Yu et al. (2019) and Froyd et al. (2022) which show that deep convection activates the entrained dust aerosols above the cloud base and subsequently removes the particles in the cloud. Maloney et al. (2022) suggests that there is a strong removal of dust by ice formation through heterogeneous nucleation. The model overestimates the observed dust concentration in the mid and upper troposphere, possibly because our model does not include the interaction. A layer of dust between 2 and 8 km, which the model fails to reproduce over the southern Atlantic, is observed during ATom-1 but not in ATom-2–4 (Figs. S1–S3). Figure S1 shows that about 35 % of the simulated dust near the surface is in the coarse mode dust (4.5–17 µm), and the coarse dust mass fraction drops rapidly with altitude. Simulations show that 95 % of the total dust concentration above 5 km is fine dust (with a diameter of less than 4.5 µm) because coarse dust is subject to more efficient wet and dry deposition during long-range transport (either vertically or horizontally).
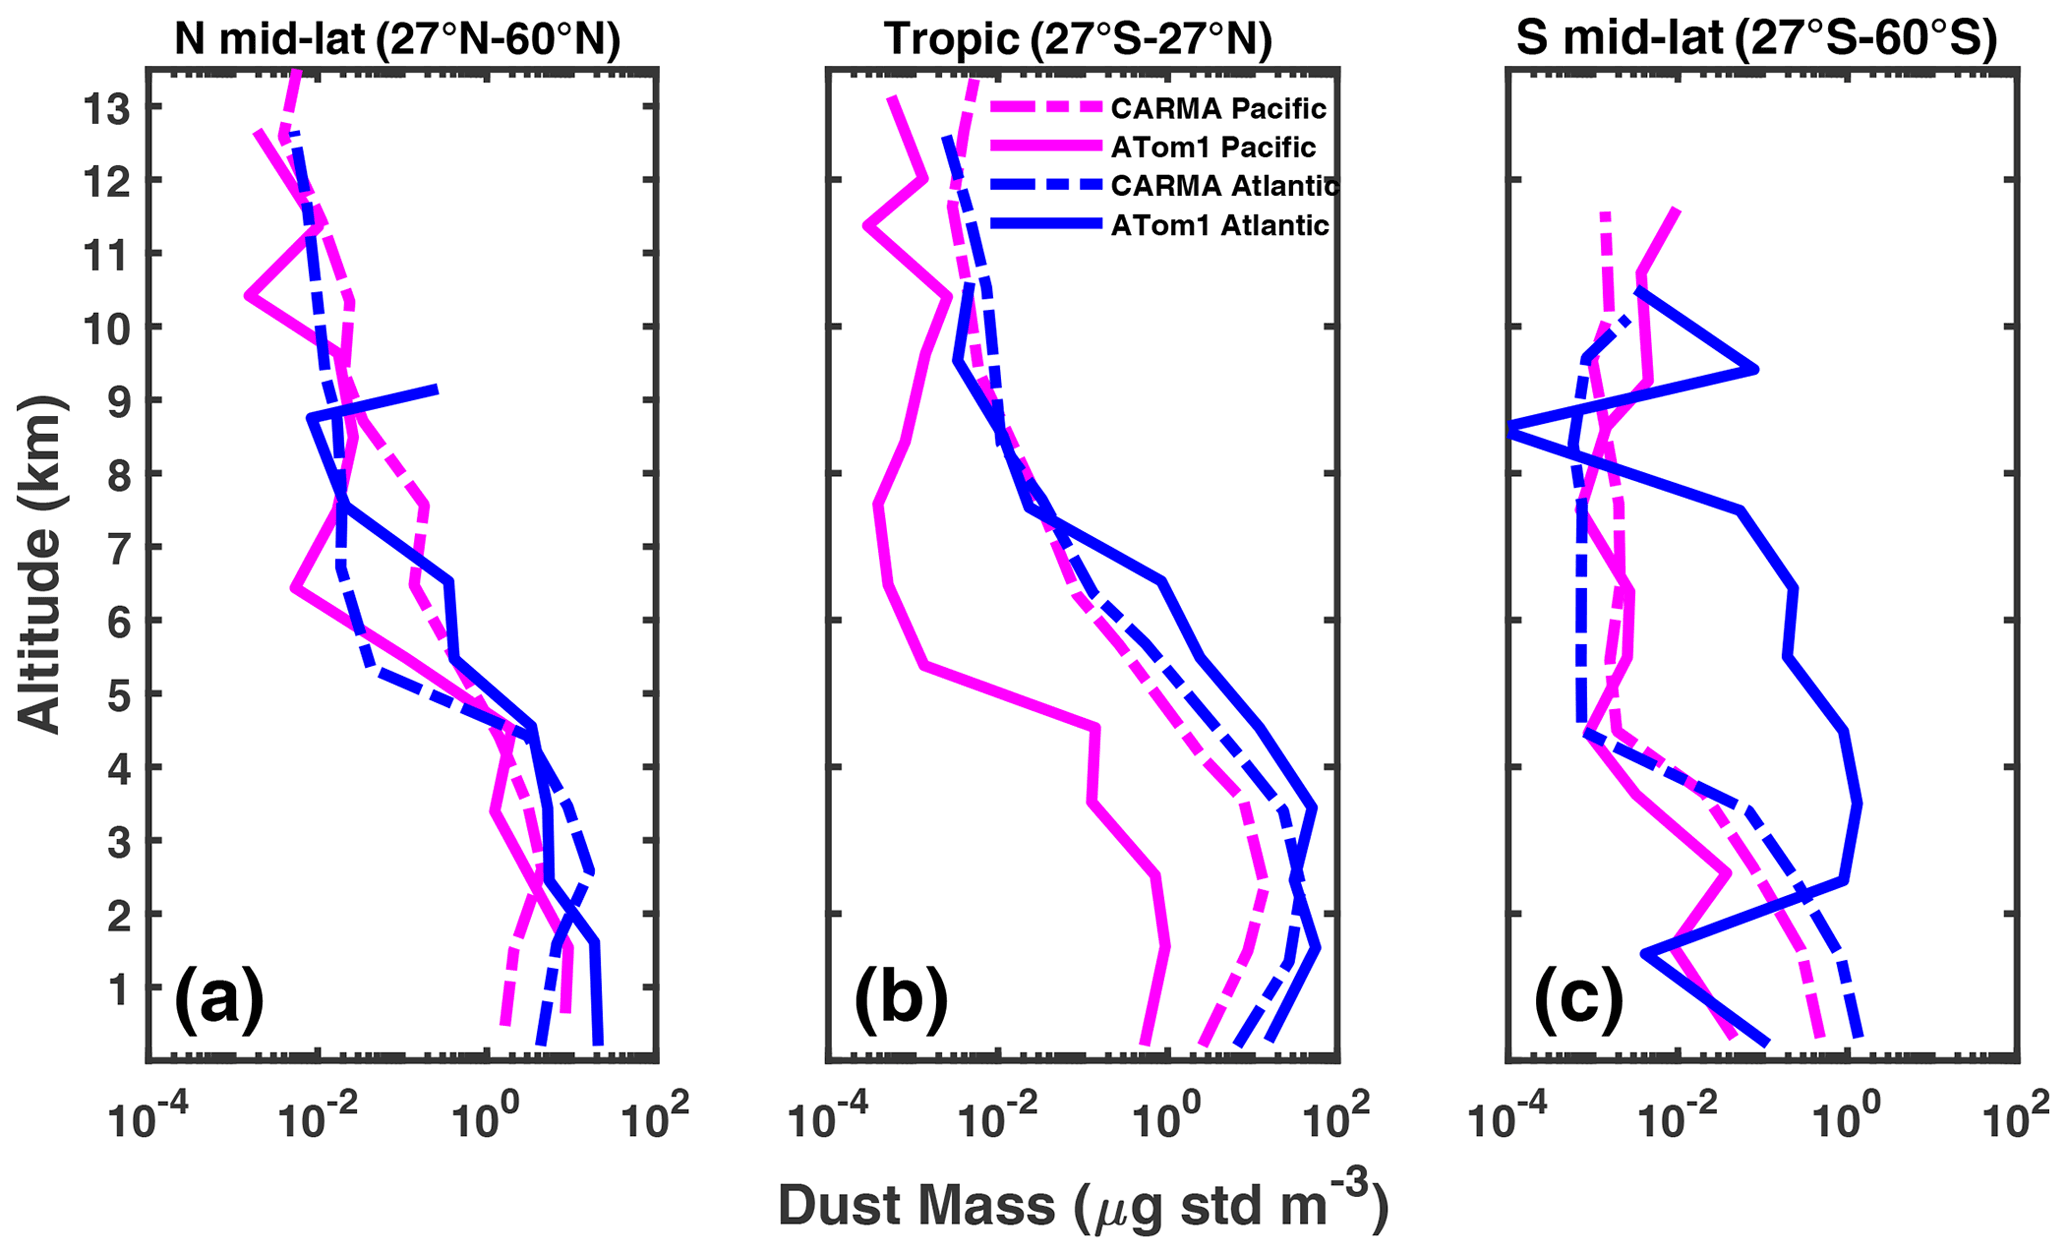
Figure 5Simulated (long dashed line) and measured (solid line) vertical profiles of the dust concentrations during the ATom-1 field campaign. Both model and observations are sampled along the flight track. The profiles are averaged over the Pacific Ocean (pink) or Atlantic Ocean (blue) in the Northern Hemisphere (NH) mid-latitudes (27–60∘ N; a) and tropics (27∘ S–27∘ N; b), and in the Southern Hemisphere (SH) mid-latitudes (27–60∘ S; c).
3.4 Comparison with AERONET in Asia and North Africa
The simulated aerosol optical depth (AOD) at 532 nm wavelength from CESM1/CARMA is compared to the measurements near dust source regions from 2014 to 2018 for most of the Aerosol Robotic Network (AERONET) sites (Fig. 6a). We use 18 AERONET sites inside the major dust emission region shown in Fig. 2. On average, the model underestimated the annual mean AOD of the selected 18 AERONET sites by 19 %. The model underestimates the averaged AOD by ∼ 14 % in North Africa and ∼ 25 % in the Middle East. Figure 6b shows the simulated AOD without dust emitted in the model underestimated the AERONET AOD by 74 % on average. The simulations with and without dust emission suggest that dust contributes to over 50 % of the simulated AOD in the selected AERONET sites. Consistent with the dust emission distribution shown in Fig. 2, the simulated and observed AOD near the dust source regions in the tropics and NH (e.g., Sahara, Middle East, and Asia) are significantly higher than that near SH deserts (e.g., central Australia). Dust from the source regions in NH and tropical deserts is transported downwind into the Pacific and Atlantic ocean basins.
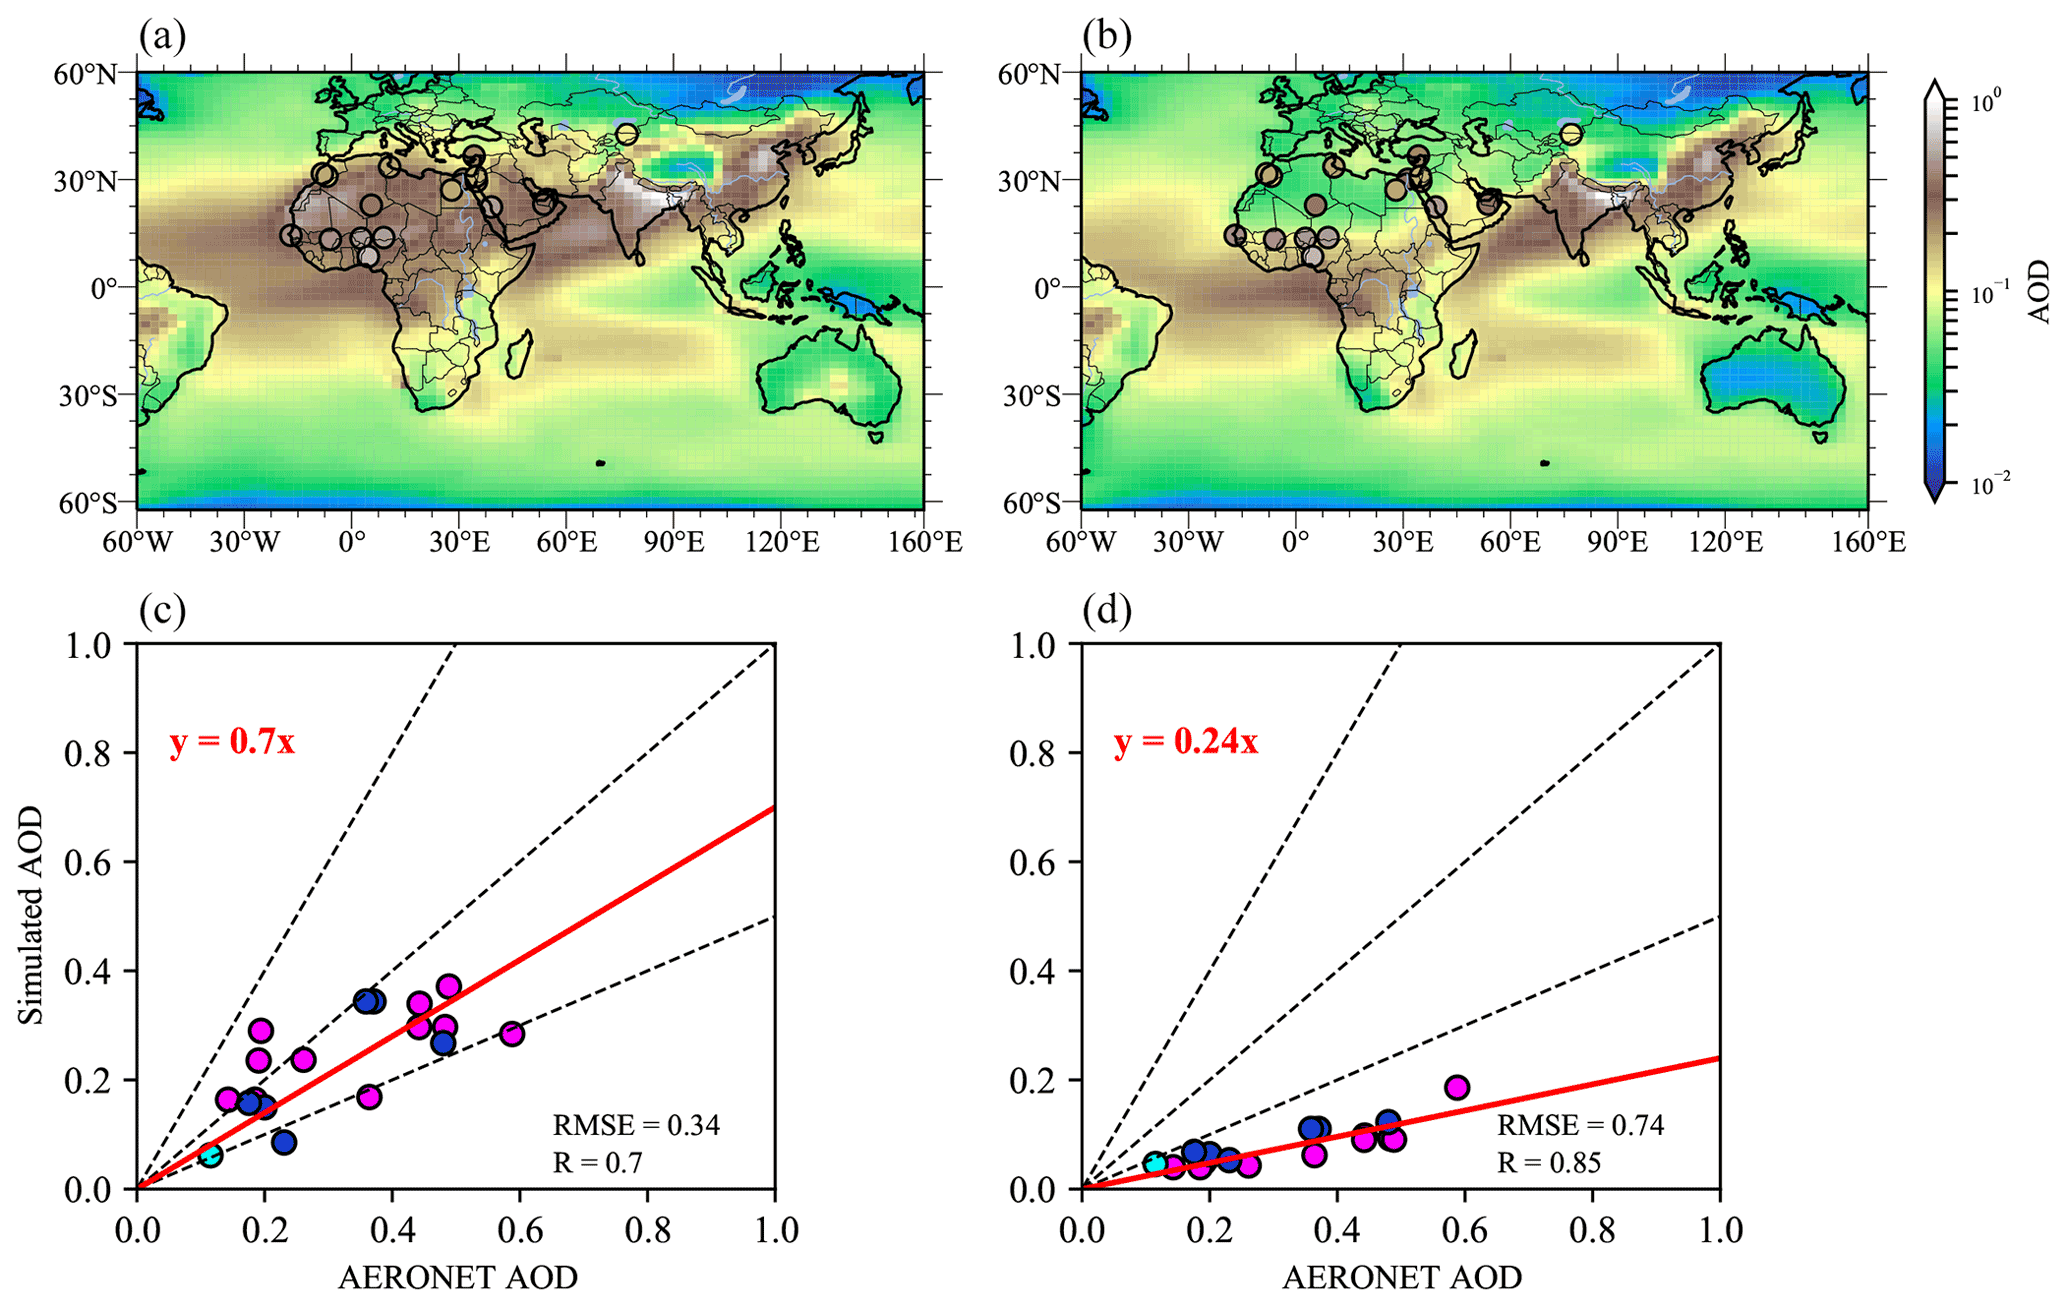
Figure 6(a) Annual mean AOD at 532 nm wavelength from 2014 to 2018 simulated by CESM1/CARMA, denoted by the color-filled contours. Panel (b) is the same as panel (a) for simulations without dust. The measured AOD from 18 AERONET ground sites located inside the major dust emission regions (Fig. 2) are denoted by the color-coded circles. (c) Comparison of the simulated annual mean AOD at 532 nm wavelength with measurements from 2014 to 2018 for the most of the AERONET sites. North Africa, the Middle East, and Asia are represented as pink, cyan, and blue numbers, respectively. Panel (d) is the same as panel (c) but for simulations without dust. The solid red line denotes the best fit. The dashed black lines represent 1:2, 1:1, and 2:1 relationships between the observations and simulations.
In this section, we show the global distributions and source attributions of dust from the surface to the lower stratosphere. Consistent with previous studies (Tanaka and Chiba, 2006; Chin et al., 2007; Kok et al., 2021), modeled North African dust accounts for about 50 %–60 % of the total global dust loading (mostly in the lower troposphere). Validated by the recent global NASA ATom measurements, our study calculated the dust source attributions in each altitude and the dust source attribution in the anticyclone of the Asian summer monsoon region. We show that the Asian dust, with fewer annual emissions than the North African dust, is transported higher and becomes dominant in the upper troposphere and lower stratosphere (UTLS).
4.1 Surface distribution of dust
Figure 7 shows the simulated annual mean surface concentrations of North African, Middle Eastern, and Asian dust and their relative contributions to the simulated total dust from 2014 to 2018. In general, the simulated maximum concentrations are located near the source regions. The dust concentrations decrease dramatically by about 2 to 3 orders of magnitude from the source to remote regions due to efficient dry and wet scavenging. Limited dust is transported across the Equator from NH to SH mid-latitudes at the surface level. The simulated NH dust can travel to SH once convection lifts the dust into the upper troposphere and lower stratosphere (Sect. 4.2).
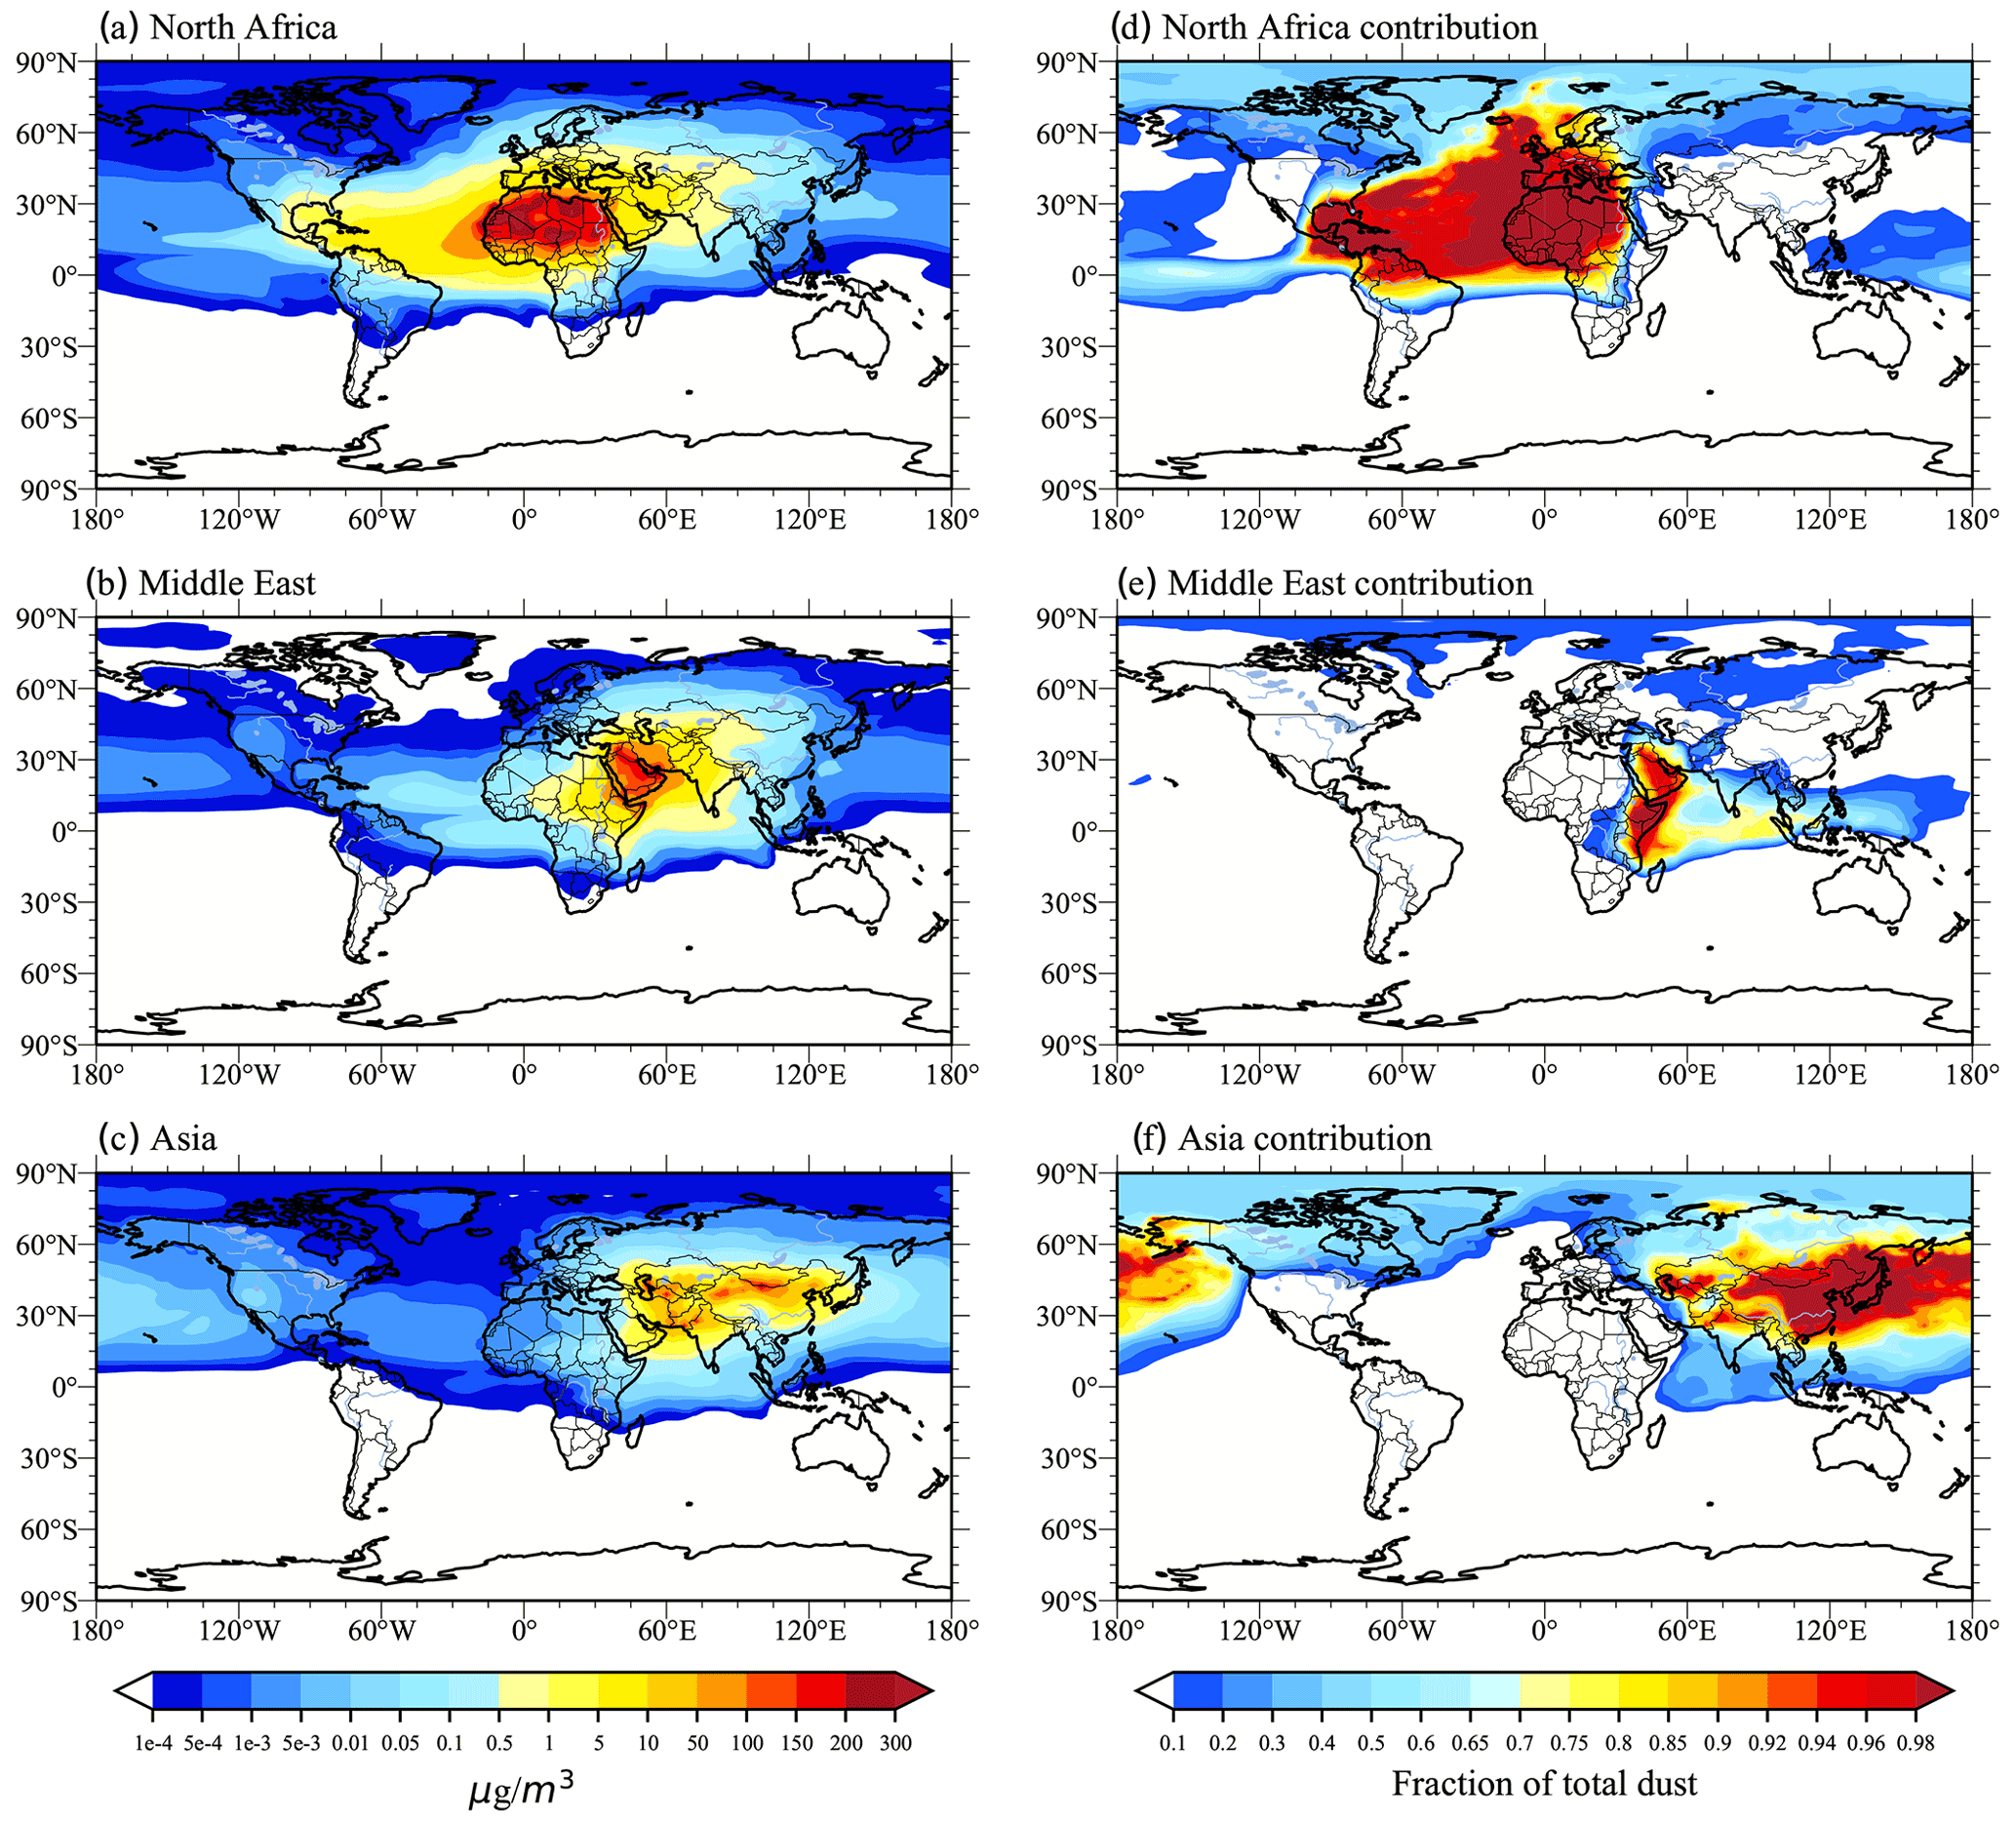
Figure 7Simulated global spatial distribution of annual mean surface dust mass concentrations and the fractional contribution of each source. Simulations are averaged from 2014 to 2018. Panels (a–c) represent each source's concentration of dust. Panels (d–f) represent each source's contribution to total dust.
North African dust dominates the surface dust concentrations in the western hemisphere, including the North Atlantic basin, Europe, Caribbean, and eastern North America. The model suggests that simulated North African dust concentrations drop by 3 orders of magnitude during transport from North Africa to 60∘ N and peak in the Caribbean. The modeled shape and direction of the transported dust plume are similar to the simulations of Colarco et al. (2003). The transatlantic transport of the African dust to Amazon basin in the northeasterly trade winds are observed (Yu et al., 2015b; Swap et al., 1992; Prospero et al., 2014). Based on satellite and in situ deposition data, Yu et al. (2015b) quantified the deposition of African dust in the Amazon basin. Consistently, our simulated dust over Amazon basin is primarily transported from North Africa.
The simulated annual mean dust concentration in Asia is about 24 % of that in North Africa, which Su and Toon (2011) attribute to Asia having a much smaller area of dust sources than the Sahara. Asian dust dominates in the eastern hemisphere, including the North Pacific basin and Russia, and some dust can be transported to Alaska and Canada. Previous studies have indicated that dust from the Gobi Desert region entrained in a surface cyclone arrives in the western U.S. boundary layer via cross-Pacific transport (Arimoto et al., 1996). With CARMA, we show that although some Asian dust can be transported to the western U.S. across the Pacific basin (Fig. 7), its relative mass contribution to the total dust concentration in the western U.S. is about 1 % on an annual basis (Fig. 3). Simulated dust in the boundary layer is mostly removed by wet and dry deposition during the cross-Pacific transport, while lifted Asian dust can be transported more efficiently across the Pacific basin and accounts for about 50 % of the dust loading in the middle troposphere above the western U.S. (Fig. S5). The Pacific Dust Experiment (PACDEX) shows that the coarse-mode Asian dust is rapidly removed amid the remote transport, while the fine-mode dust of less than 2.5 µm in diameter is entrained into the upper air and transported across the Pacific basin by the upper tropospheric westerly jets (Stith et al., 2009). Consistent with PACDEX, our model shows that 92 % of the Asian dust mass that is transported 10 km above U.S. is less than 2.5 µm in diameter (not shown). Middle Eastern dust contributes significantly to surface dust loading over the Indian Ocean, eastern edge of Africa, southern India, and Southeast Asia. The simulated latitudinal transport of Middle Eastern dust is limited (Fig. S5). Our model suggests that the contribution of North African and Asian dust to the surface dust in the Arctic is similar. Significant contributions of Asian dust are confirmed through ice core isotopic analysis of the dust deposited at the ice camp in Greenland (Bory et al., 2002, 2003). Note that the current model fails to consider high-latitude dust sources in Siberia and Alaska, which are believed to be the major contributors to Arctic dust (Lambert et al., 2015; Zwaaftink et al., 2016).
4.2 Vertical distribution of dust
Figure 8 compares the simulated vertical distributions of North African, Middle Eastern, and Asian dust in the lower, middle, and upper troposphere averaged from 2014 to 2018. Simulated global dust concentrations drop by 1 order of magnitude from the surface to about 600 hPa and by 4 orders of magnitude from the surface to 160 hPa. The rapid decline in dust mass concentration is mostly due to deposition and the subgrid-scale convective removal above the cloud base (Yu et al., 2019; Froyd et al., 2022). However, Maloney et al. (2022) show that the heterogenous nucleation of ice on dust, followed by sedimentation, also contributes to the loss of dust from the mid and upper troposphere. Model results show that the dust from the Sahara, Middle East, and Asia accounts for ∼ 61.7 %, 12.9 %, and 13.9 % of global annual mean surface dust concentration, respectively. In the NH mid-latitudes, the relative contribution of Asian dust increases with altitude and becomes dominant in the upper troposphere. Asian dust contributes ∼ 60.9 % of the dust at pressures from 266 to 160 hPa. Asian dust is mostly lifted in the spring by mid-latitude frontal systems (Caffrey et al., 2018). This higher relative contribution of Asian dust in the upper troposphere of the NH mid-latitudes and tropics suggests that Asian dust is lifted more efficiently than North African dust. Asian dust is mostly lifted in mid-latitude springtime weather systems that are efficient at transporting dust aloft. North African dust is lifted in tropical systems that are less efficient at transporting dust to high altitudes, since there is widespread descending air at the latitudes of North Africa, which is in the descending branch of the Hadley circulation (Su and Toon, 2011). The upward transport of North African dust is restricted due to infrequent deep convection over North Africa (Froyd et al., 2022). Frequent convective activity and cold frontal systems (Kawai et al., 2018, 2015; Hara et al., 2009) transport Asian dust upward to higher altitudes. Figure 8d–e show that the upper tropospheric dust concentration in the NH mid-latitudes is about 1 order of magnitude higher than that in the tropics. Note that the tropical dust in the middle and upper troposphere over the Pacific basin is overestimated by 1 order of magnitude compared to the ATom-1 observation (Fig. 5). However, the model's performance on the tropical dust varies with seasons. For example, the model underestimated the ATom-3 observation by 1 order of magnitude, while better agreements are made compared with ATom-2 and ATom-4 observations (Figs. S2–S4). In general, the modeled annual mean distribution of tropical dust is subject to large uncertainties (Fig. 8), especially because the convective transport parameterization for a climate model with coarse resolution is still highly uncertain.

Figure 8(a) Simulated vertical profiles of average dust concentration for 2014 to 2018 from each desert emission zone. Green bars denote North African dust, red bars denote Middle Eastern dust, and blue bars denote Asian dust. Panels (b–d) are the same as panel (a) but averaged for Northern Hemisphere (NH) mid-latitudes (30–60∘ N) and the tropics (30∘ S–30∘ N) from 500 to 350 hPa. Panels (d–e) are the same as panels (b–c) but for pressure levels from 266 to 160 hPa.
Figure 9 shows the vertical distribution of the zonal and annual mean dust fractional contributions from the three dust source regions. The Sahara dominates the tropical dust budget from the surface to the upper troposphere and accounts for about 50 % of the dust in the troposphere of the NH mid–high latitudes. The model shows that limited North African dust is transported into the stratosphere. In contrast, Asian dust contributes less than the North African dust in the troposphere, except for the mid-latitudes where the sources are located. Asian dust contributes more than 40 % of the dust in the global UTLS, with the peak in the NH mid-latitude UTLS having a mass fraction of more than 60 %. Once the Asian dust is lifted high enough into the stratosphere, some can be transported to the SH UTLS. Our model suggests that Asian dust might be the dominant source of ice-nucleating particles in the global UTLS. The simulations show that the fractional contribution of North African and Asian dust is comparable in the lower and middle troposphere of the Arctic.
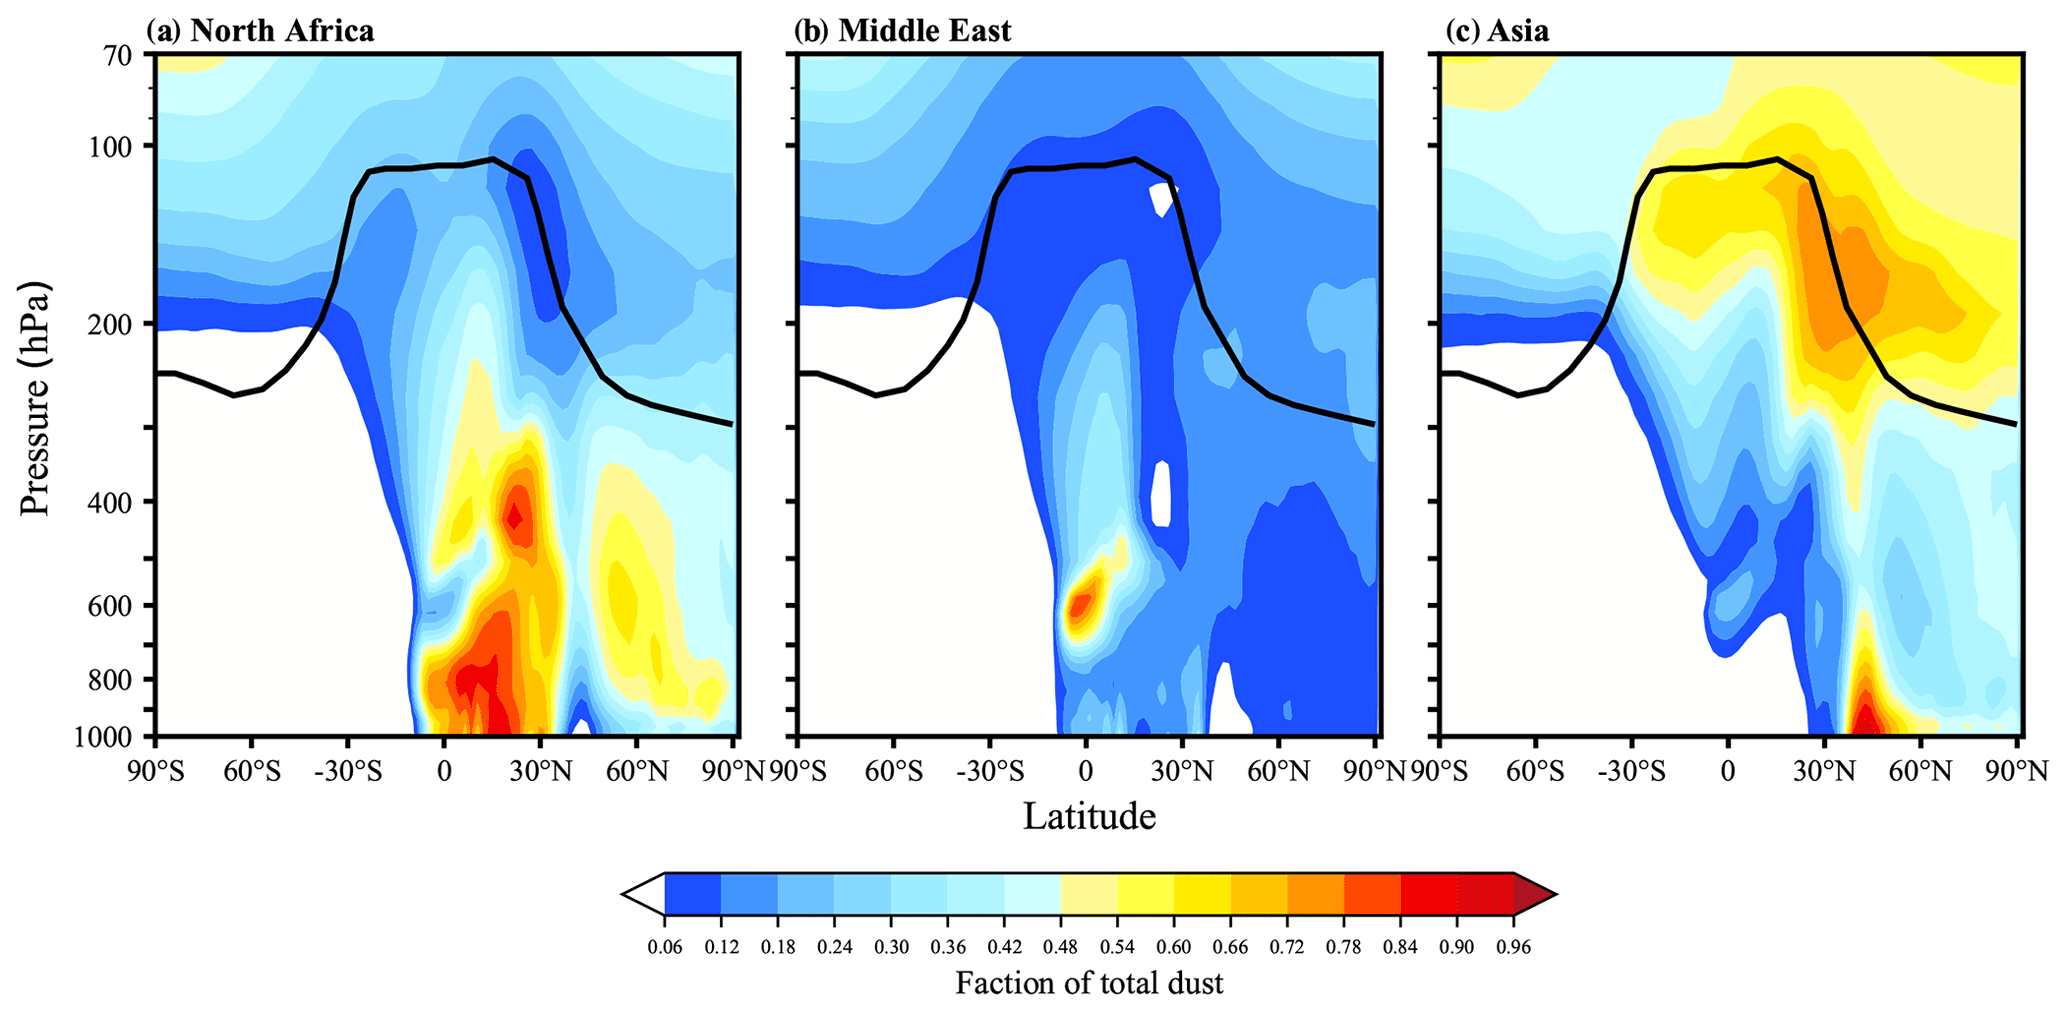
Figure 9Simulation of each dust source's fractional contribution to zonal and annual average total dust as a function of altitude (left axis) and latitude (bottom axis). Shading indicates dust concentrations, and the black line in each figure denotes the annually averaged simulated tropopause height.
4.3 Dust attribution in the Asian summer monsoon region
A layer of aerosols in the UTLS of the ASM is revealed by satellites (Thomason and Vernier, 2013; Vernier et al., 2015, 2011) and balloon-borne optical particle counters (Vernier et al., 2018; Yu et al., 2017). In the meantime, a high occurrence of cirrus clouds is found by satellites (Sassen et al., 2008; Nazaryan et al., 2008). The relative contributions of dust particles to the cirrus cloud in the ASM region remain unquantified and worth future evaluation. Recent airborne in situ measurements suggest that the ASM tropopause aerosol layer is composed of mostly sulfate, organics, and nitrate (Hopfner et al., 2019; Appel et al., 2022). The budget of dust particles near the tropopause (∼ 100 hPa) and at cirrus altitudes (e.g., 500–200 hPa) remains unquantified.
Figure 10 illustrates the simulated June–July–August (JJA) dust concentrations at 100 hPa, averaged from 2014 to 2018. A peak of dust is simulated in the ASM region associated with the anticyclonic airflow similar to sulfate and organics. However, the dust abundance is extremely limited compared with sulfate and organics. The simulated mass fraction of aerosol contributed by dust is ∼ 4 % at 200 hPa and 0.08 % at 100 hPa inside the ASM (Fig. S6). As expected, Asian dust dominates the dust budget in the ASM region, with a relative contribution 1–2 orders of magnitude higher than North African and Middle Eastern dust. There is limited North African and Middle Eastern dust transport to the ASM region by the strong upper tropospheric westerlies (Tanaka et al., 2005; Prasad and Singh, 2007). Note that the dust concentration simulated by CESM1/CARMA at 100 hPa in the ASM region is about µg m−3, which is about 3 orders of magnitude smaller than the values simulated by the CESM-MAM7 model reported by Bossolasco et al. (2021). Such low values of dust concentrations are due to the inclusion of the secondary activation of dust above the cloud base in the convective transport scheme revised by Yu et al. (2019). Failure to include this removal will lead to large overestimates of dust aloft.
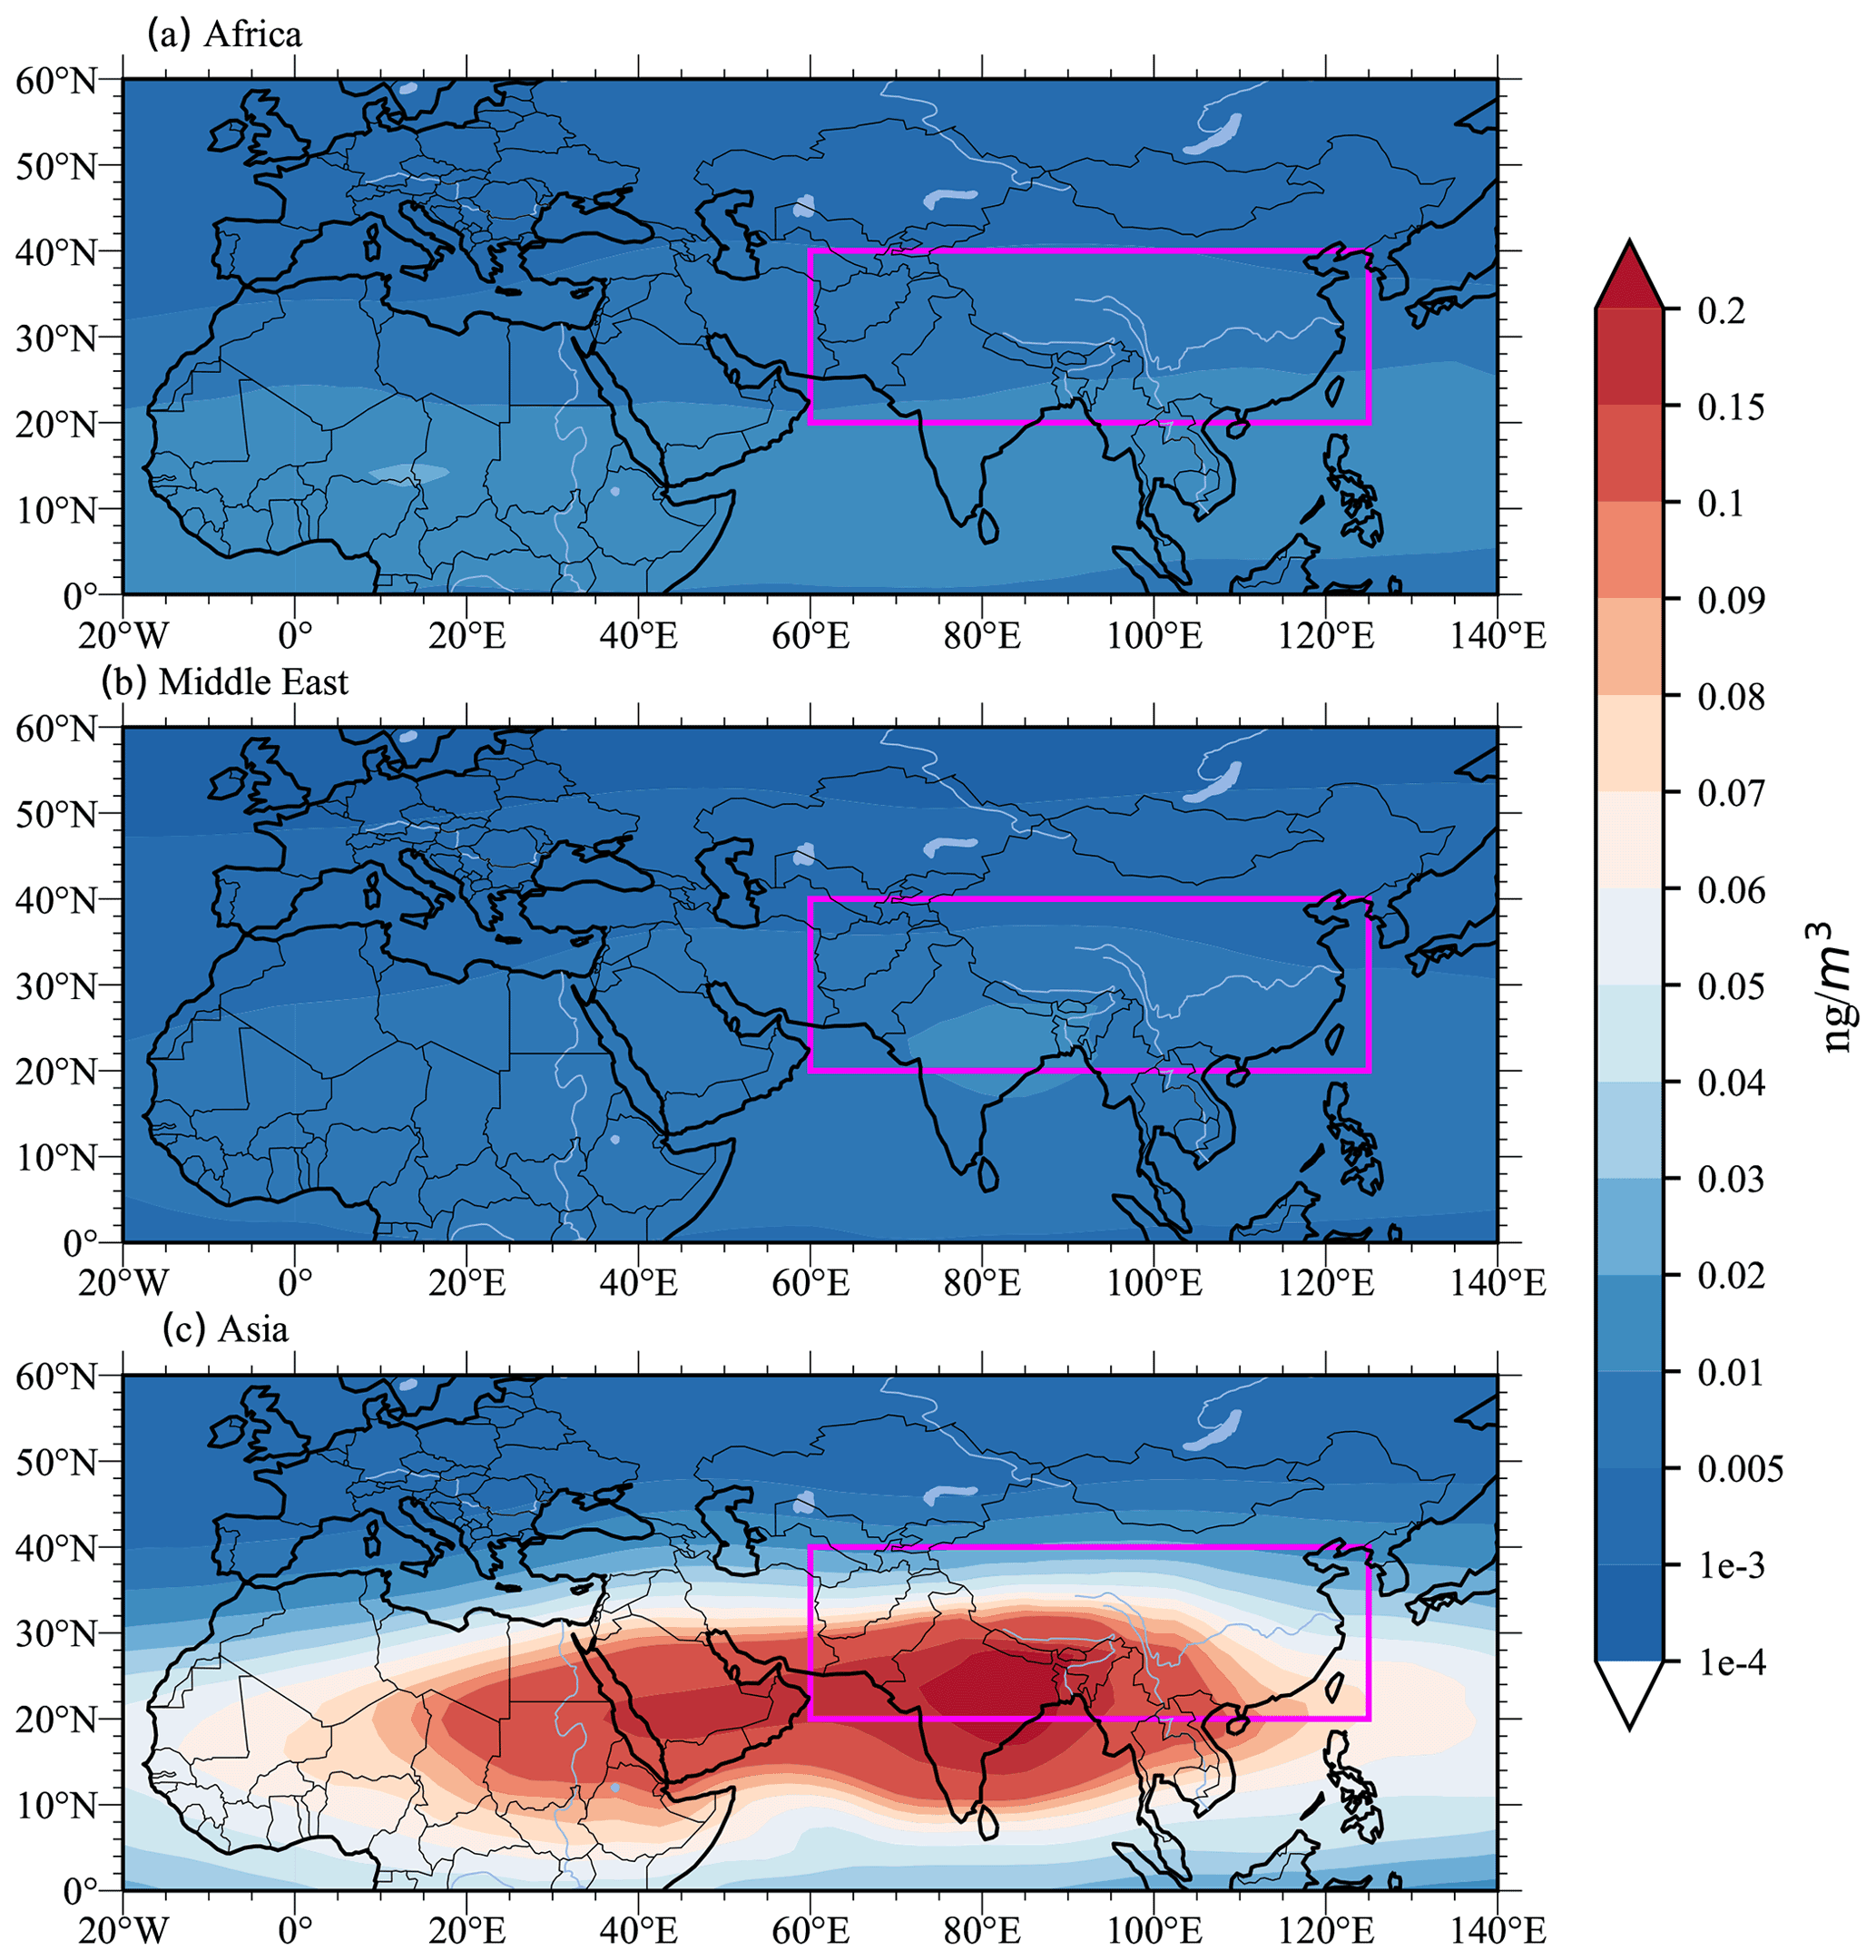
Figure 10Simulated mass concentrations of North African, Middle Eastern, and Asian dust at 100 hPa (left) averaged in June–July–August (JJA) from the year 2014 to 2018. Purple boxes denote the Asian summer monsoon region.
This study uses a sectional aerosol model coupled with a climate model, CESM1/CARMA, to simulate the global distribution of dust, 85 % of which comes from Asian, Middle Eastern, and North African sources. Compared with measurements reported in Adebiyi and Kok (2020), the model of P. F. Yu et al. (2015) underestimates the observed dust in the size range between 1 and 3 µm by 1 order of magnitude. We modified the size distribution of the dust emission, and the improved model is within the error bars of the measurements summarized by Adebiyi and Kok (2020). Both observations and the simulations suggest that the dust mass size distribution increases by about 4 orders of magnitude from 0.1 to 2 µm, reaches its highest values around 2–3 µm in diameter, and remains fairly constant for larger sizes up to 20 µm in diameter. We compared the simulated dust distributions with multiple observational datasets, including surface and airborne in situ measurements over remote regions and aerosol optical depth measurements, near the dust source regions. CESM1/CARMA reproduces the annual mean dust surface concentrations around the globe within 1 order of magnitude of the observations summarized in Huneeus et al. (2011). The global vertical distributions of dust measured by PALMS during the NASA ATom field campaign are used to constrain the model. Both the model and PALMS measurements suggest that dust mass concentrations over remote ocean basins drop by 2 to 3 orders of magnitude from the surface to the upper troposphere (200 hPa). Simulations show that about 52 % of dust near the surface are coarse, while 95 % of the total dust concentration in the upper troposphere is fine dust (with diameter less than 4.5 µm). The rapid decline in dust aerosols with altitude is associated with the efficient in-cloud convective removal of dust aerosols (Froyd et al., 2022; Yu et al., 2019). However, in situ cirrus formation can also lead to the downward transport of dust (Maloney et al., 2022). In addition, both the model and PALMS measurements suggest that dust concentrations in the lower troposphere of the NH mid-latitudes (27–60∘ N) and tropics (27∘ S–27∘ N) are about an order of magnitude higher than that in the SH mid-latitudes (27–60∘ S). The model captures ∼ 90 % of the annual mean column aerosol optical depth measured by 33 AERONET stations near the dust source regions.
Our simulations suggest that the annual mean dust emissions from the Sahara, Middle East, and Asia account for ∼ 59.7 %, 12.5 %, and 13.3 % of global annual mean dust emissions, respectively. Dust emitted from the Sahara is transported toward Europe but mostly to the western hemisphere, including the North Atlantic basin, and eastern North America. Asian dust dominates the eastern hemisphere, including the North Pacific basin and Russia, and some can be transported to Alaska and Canada. Middle Eastern dust contributes significantly to the surface dust over the Indian Ocean, the eastern edge of Africa, southern India, and Southeast Asia. Although North African dust dominates global dust mass loading at the surface, the relative contribution of Asian dust increases with altitude and becomes dominant in the upper troposphere of the Northern Hemisphere (NH). Once the Asian dust is lifted high enough into the stratosphere, some can be transported to the SH UTLS. Asian dust might be the dominant source of ice-nucleating particles in the global UTLS. Asian dust contributes ∼ 60.9 % of the dust mass at pressure levels from 266 to 160 hPa. The increasing fractional contribution of Asian dust is due to the efficient vertical transport in mid-latitude weather systems, while tropical weather systems are not as efficient due to subsiding motion in the descending branch of the Hadley circulation, and convective activity over the Sahara is relatively infrequent (Froyd et al., 2022). Asian dust dominates the dust budget in the global upper troposphere during the summer months, with the peak fractional contribution in the ASM region, which is about 1–2 orders of magnitude higher than that of North African and Middle Eastern dust. The model suggests that the dust forms a local maximum in the ASM anticyclone and organics and nitrate (Yu et al., 2022). However, the simulated dust mass concentration is only ∼ 0.08 % of the total aerosols in the Asian tropopause aerosol layer (ATAL). Constrained by the state-of-the-art measurements of dust at the global scale, our model highlights the significant contribution of Asian dust to the global upper troposphere where cirrus clouds may form heterogeneously.
Dust surface measurement data can be found in Mahowald et al. (2009), Arimoto et al. (1995), Prospero et al. (1989), and Prospero (1996). ATom data are available at https://doi.org/10.3334/ORNLDAAC/1925 (Wofsy et al., 2021). The AERONET data are publicly available from the AERONET website data tools: https://aeronet.gsfc.nasa.gov/cgi-bin/webtool_aod_v3 (NASA, 2022) for AOD.
The supplement related to this article is available online at: https://doi.org/10.5194/acp-22-13659-2022-supplement.
PY designed the research and ran the CESM1/CARMA model. SL analyzed the model output and observational datasets and wrote the paper. LZ, DMM, KDF, and OBT provided effective and constructive comments on the study. KDF and DMM provided the PALMS datasets. All authors edited the paper.
The contact author has declared that none of the authors has any competing interests.
Publisher’s note: Copernicus Publications remains neutral with regard to jurisdictional claims in published maps and institutional affiliations.
We thank Charles A. Brock at NOAA, for providing the NASA ATom total aerosol size distribution data. The AERONET data were obtained from the Aerosol Robotic Network. The CESM project is supported by the National Science Foundation and the Office of Science (BER) of the US Department of Energy. We acknowledge the high-performance computing platform of Jinan University. We appreciate the valuable comments from the anonymous reviewers, which helped us to improve the paper.
This work has been supported by the second Tibetan Plateau Scientific Expedition and Research Program (grant no. 2019QZKK0604). Luxi Zhou has been supported by the Guangdong Innovative and Entrepreneurial Research Team Program (grant no. 2019ZT08G669). Siying Lian and Pengfei Yu have partly been supported by the National Natural Science Foundation of China (grant nos. 42175089 and 42121004). Owen B. Toon has been supported by a NSF award (grant no. 1853932). The participation of PALMS in the ATom mission has been supported by NOAA climate funding and a NASA award (grant no. NNH15AB12I).
This paper was edited by Suvarna Fadnavis and reviewed by two anonymous referees.
Adebiyi, A. A. and Kok, J. F.: Climate models miss most of the coarse dust in the atmosphere, Sci. Adv., 6, eaaz9507, https://doi.org/10.1126/sciadv.aaz9507, 2020.
Andreae, M. O.: Climatic effects of changing atmospheric aerosol levels, World Surv. Climatol., 16, 347–398, 1995.
Andreae, M. O., Charlson, R. J., Bruynseels, F., Storms, H., Van Grieken, R., and Maenhaut, W.: Internal mixture of sea salt, silicates, and excess sulfate in marine aerosols, Science, 232, 1620–1623, 1986.
Appel, O., Köllner, F., Dragoneas, A., Hünig, A., Molleker, S., Schlager, H., Mahnke, C., Weigel, R., Port, M., Schulz, C., Drewnick, F., Vogel, B., Stroh, F., and Borrmann, S.: Chemical analysis of the Asian Tropopause Aerosol Layer (ATAL) with emphasis on secondary aerosol particles using aircraft based in situ aerosol mass spectrometry, Atmos. Chem. Phys. Discuss. [preprint], https://doi.org/10.5194/acp-2022-92, in review, 2022.
Arimoto, R., Duce, R. A., Ray, B. J., Ellis, W. G., Cullen, J. D., and Merrill, J. T.: Trace-Elements in the Atmosphere over the North-Atlantic, J. Geophys. Res.-Atmos., 100, 1199–1213, 1995.
Arimoto, R., Duce, R. A., Savoie, D. L., Prospero, J. M., Talbot, R., Cullen, J. D., Tomza, U., Lewis, N. F., and Ray, B. J.: Relationships among aerosol constituents from Asia and the North Pacific during PEM-West A, J. Geophys. Res.-Atmos., 101, 2011–2023, https://doi.org/10.1029/95JD01071, 1996.
Balkanski, Y., Schulz, M., Claquin, T., and Guibert, S.: Reevaluation of Mineral aerosol radiative forcings suggests a better agreement with satellite and AERONET data, Atmos. Chem. Phys., 7, 81–95, https://doi.org/10.5194/acp-7-81-2007, 2007.
Bardeen, C., Toon, O., Jensen, E., Marsh, D., and Harvey, V.: Numerical simulations of the three-dimensional distribution of meteoric dust in the mesosphere and upper stratosphere, J. Geophys. Res.-Atmos., 113, D17202, https://doi.org/10.1029/2007jd009515, 2008.
Bory, A. J. M., Biscaye, P. E., Svensson, A., and Grousset, F. E.: Seasonal variability in the origin of recent atmospheric mineral dust at NorthGRIP, Greenland, Earth Planet. Sc. Lett., 196, 123–134, https://doi.org/10.1016/S0012-821X(01)00609-4, 2002.
Bory, A. J. M., Biscaye, P. E., and Grousset, F. E.: Two distinct seasonal Asian source regions for mineral dust deposited in Greenland (NorthGRIP), Geophys. Res. Lett., 30, 1167, https://doi.org/10.1029/2002GL016446, 2003.
Bossolasco, A., Jegou, F., Sellitto, P., Berthet, G., Kloss, C., and Legras, B.: Global modeling studies of composition and decadal trends of the Asian Tropopause Aerosol Layer, Atmos. Chem. Phys., 21, 2745–2764, https://doi.org/10.5194/acp-21-2745-2021, 2021.
Bourgeois, I., Peischl, J., Thompson, C. R., Aikin, K. C., Campos, T., Clark, H., Commane, R., Daube, B., Diskin, G. W., Elkins, J. W., Gao, R.-S., Gaudel, A., Hintsa, E. J., Johnson, B. J., Kivi, R., McKain, K., Moore, F. L., Parrish, D. D., Querel, R., Ray, E., Sánchez, R., Sweeney, C., Tarasick, D. W., Thompson, A. M., Thouret, V., Witte, J. C., Wofsy, S. C., and Ryerson, T. B.: Global-scale distribution of ozone in the remote troposphere from the ATom and HIPPO airborne field missions, Atmos. Chem. Phys., 20, 10611–10635, https://doi.org/10.5194/acp-20-10611-2020, 2020.
Bourgeois, Q., Ekman, A. M. L., and Krejci, R.: Aerosol transport over the Andes from the Amazon Basin to the remote Pacific Ocean: A multiyear CALIOP assessment, J. Geophys. Res.-Atmos., 120, 8411–8425, https://doi.org/10.1002/2015jd023254, 2015.
Brock, C. A., Williamson, C., Kupc, A., Froyd, K. D., Erdesz, F., Wagner, N., Richardson, M., Schwarz, J. P., Gao, R.-S., Katich, J. M., Campuzano-Jost, P., Nault, B. A., Schroder, J. C., Jimenez, J. L., Weinzierl, B., Dollner, M., Bui, T., and Murphy, D. M.: Aerosol size distributions during the Atmospheric Tomography Mission (ATom): methods, uncertainties, and data products, Atmos. Meas. Tech., 12, 3081–3099, https://doi.org/10.5194/amt-12-3081-2019, 2019.
Caffrey, P. F., Fromm, M. D., and Kablick, G. P.: WRF-Chem Simulation of an East Asian Dust-Infused Baroclinic Storm (DIBS), J. Geophys. Res.-Atmos., 123, 6880–6895, https://doi.org/10.1029/2017jd027848, 2018.
Chin, M., Diehl, T., Ginoux, P., and Malm, W.: Intercontinental transport of pollution and dust aerosols: implications for regional air quality, Atmos. Chem. Phys., 7, 5501–5517, https://doi.org/10.5194/acp-7-5501-2007, 2007.
Colarco, P. R., Toon, O. B., Reid, J. S., Livingston, J. M., Russell, P. B., Redemann, J., Schmid, B., Maring, H. B., Savoie, D., Welton, E. J., Campbell, J. R., Holben, B. N., and Levy, R.: North African dust transport to the Caribbean during PRIDE: 2. Transport, vertical profiles, and deposition in simulations of in situ and remote sensing observations, J. Geophys. Res.-Atmos., 108, 8590, https://doi.org/10.1029/2002JD002659, 2003.
Cziczo, D. J., Froyd, K. D., Hoose, C., Jensen, E. J., Diao, M. H., Zondlo, M. A., Smith, J. B., Twohy, C. H., and Murphy, D. M.: Clarifying the Dominant Sources and Mechanisms of Cirrus Cloud Formation, Science, 340, 1320–1324, https://doi.org/10.1126/science.1234145, 2013.
d'Almeida, G. A.: A model for Saharan dust transport, J. Appl. Meteorol. Climatol., 25, 903–916, 1986.
Di Biagio, C., Formenti, P., Balkanski, Y., Caponi, L., Cazaunau, M., Pangui, E., Journet, E., Nowak, S., Andreae, M. O., Kandler, K., Saeed, T., Piketh, S., Seibert, D., Williams, E., and Doussin, J.-F.: Complex refractive indices and single-scattering albedo of global dust aerosols in the shortwave spectrum and relationship to size and iron content, Atmos. Chem. Phys., 19, 15503–15531, https://doi.org/10.5194/acp-19-15503-2019, 2019.
Froyd, K. D., Murphy, D. M., Lawson, P., Baumgardner, D., and Herman, R. L.: Aerosols that form subvisible cirrus at the tropical tropopause, Atmos. Chem. Phys., 10, 209–218, https://doi.org/10.5194/acp-10-209-2010, 2010.
Froyd, K. D., Murphy, D. M., Brock, C. A., Campuzano-Jost, P., Dibb, J. E., Jimenez, J.-L., Kupc, A., Middlebrook, A. M., Schill, G. P., Thornhill, K. L., Williamson, C. J., Wilson, J. C., and Ziemba, L. D.: A new method to quantify mineral dust and other aerosol species from aircraft platforms using single-particle mass spectrometry, Atmos. Meas. Tech., 12, 6209–6239, https://doi.org/10.5194/amt-12-6209-2019, 2019.
Froyd, K. D., Yu, P. F., Schill, G. P., Brock, C. A., Kupc, A., Williamson, C. J., Jensen, E. J., Ray, E., Rosenlof, K. H., Bian, H. S., Darmenov, A. S., Colarco, P. R., Diskin, G. S., Bui, T., and Murphy, D. M.: Dominant role of mineral dust in cirrus cloud formation revealed by global-scale measurements, Nat. Geosci., 15, 177–183, https://doi.org/10.1038/s41561-022-00901-w, 2022.
Ginoux, P., Chin, M., Tegen, I., Prospero, J. M., Holben, B., Dubovik, O., and Lin, S. J.: Sources and distributions of dust aerosols simulated with the GOCART model, J. Geophys. Res.-Atmos., 106, 20255–20273, https://doi.org/10.1029/2000jd000053, 2001.
Grell, G. A. and Freitas, S. R.: A scale and aerosol aware stochastic convective parameterization for weather and air quality modeling, Atmos. Chem. Phys., 14, 5233–5250, https://doi.org/10.5194/acp-14-5233-2014, 2014.
Hara, Y., Yumimoto, K., Uno, I., Shimizu, A., Sugimoto, N., Liu, Z., and Winker, D. M.: Asian dust outflow in the PBL and free atmosphere retrieved by NASA CALIPSO and an assimilated dust transport model, Atmos. Chem. Phys., 9, 1227–1239, https://doi.org/10.5194/acp-9-1227-2009, 2009.
Hopfner, M., Ungermann, J., Borrmann, S., Wagner, R., Spang, R., Riese, M., Stiller, G., Appel, O., Batenburg, A. M., Bucci, S., Cairo, F., Dragoneas, A., Friedl-Vallon, F., Hunig, A., Johansson, S., Krasauskas, L., Legras, B., Leisner, T., Mahnke, C., Mohler, O., Molleker, S., Muller, R., Neubert, T., Orphal, J., Preusse, P., Rex, M., Saathoff, H., Stroh, F., Weigel, R., and Wohltmann, I.: Ammonium nitrate particles formed in upper troposphere from ground ammonia sources during Asian monsoons, Nat. Geosci., 12, 608–612, doi10.1038/s41561-019-0385-8, 2019.
Huneeus, N., Schulz, M., Balkanski, Y., Griesfeller, J., Prospero, J., Kinne, S., Bauer, S., Boucher, O., Chin, M., Dentener, F., Diehl, T., Easter, R., Fillmore, D., Ghan, S., Ginoux, P., Grini, A., Horowitz, L., Koch, D., Krol, M. C., Landing, W., Liu, X., Mahowald, N., Miller, R., Morcrette, J.-J., Myhre, G., Penner, J., Perlwitz, J., Stier, P., Takemura, T., and Zender, C. S.: Global dust model intercomparison in AeroCom phase I, Atmos. Chem. Phys., 11, 7781–7816, https://doi.org/10.5194/acp-11-7781-2011, 2011.
Karyampudi, V. M.: A detailed synoptic-scale study of the structure, dynamics, and radiative effects of the Saharan air layer over the eastern tropical Atlantic during the GARP Atlantic tropical experiment, M. S. thesis, Department of Meteorology, The Pennsylvania State University, 136 pp., 1979.
Karyampudi, V. M., Palm, S. P., Reagen, J. A., Fang, H., Grant, W. B., Hoff, R. M., Moulin, C., Pierce, H. F., Torres, O., Browell, E. V., and Melfi, S. H.: Validation of the Saharan Dust Plume Conceptual Model Using Lidar, Meteosat, and ECMWF Data, Bull. Am. Meteorol. Soc., 80, 1045–1076, https://doi.org/10.1175/1520-0477(1999)080<1045:VOTSDP>2.0.CO;2, 1999.
Kawai, K., Kai, K., Jin, Y., Sugimoto, N., and Batdorj, D.: Dust Event in the Gobi Desert on 22–23 May 2013: Transport of Dust from the Atmospheric Boundary Layer to the Free Troposphere by a Cold Front, Sola, 11, 156–159, https://doi.org/10.2151/sola.2015-035, 2015.
Kawai, K., Kai, K., Jin, Y., Sugimoto, N., and Batdorj, D.: Lidar Network Observation of Dust Layer Development over the Gobi Desert in Association with a Cold Frontal System on 22–23 May 2013, J. Meteorolog. Soc. Jpn., 96, 255–268, https://doi.org/10.2151/jmsj.2018-023, 2018.
Kok, J. F.: A scaling theory for the size distribution of emitted dust aerosols suggests climate models underestimate the size of the global dust cycle, P. Natl. Acad. Sci., 108, 1016–1021, https://doi.org/10.1073/pnas.1014798108, 2011.
Kok, J. F., Adebiyi, A. A., Albani, S., Balkanski, Y., Checa-Garcia, R., Chin, M., Colarco, P. R., Hamilton, D. S., Huang, Y., Ito, A., Klose, M., Li, L., Mahowald, N. M., Miller, R. L., Obiso, V., Pérez García-Pando, C., Rocha-Lima, A., and Wan, J. S.: Contribution of the world's main dust source regions to the global cycle of desert dust, Atmos. Chem. Phys., 21, 8169–8193, https://doi.org/10.5194/acp-21-8169-2021, 2021.
Levin, Z., Ganor, E., and Gladstein, V.: The Effects of Desert Particles Coated with Sulfate on Rain Formation in the Eastern Mediterranean, J. Appl. Meteorol. Climatol., 35, 1511–1523, https://doi.org/10.1175/1520-0450(1996)035<1511:TEODPC>2.0.CO;2, 1996.
Lambert, F., Tagliabue, A., Shaffer, G., Lamy, F., Winckler, G., Farias, L., Gallardo, L., and De Pol-Holz, R.: Dust fluxes and iron fertilization in Holocene and Last Glacial Maximum climates, Geophys. Res. Lett., 42, 6014–6023, https://doi.org/10.1002/2015gl064250, 2015.
Ma, J., Brühl, C., He, Q., Steil, B., Karydis, V. A., Klingmüller, K., Tost, H., Chen, B., Jin, Y., Liu, N., Xu, X., Yan, P., Zhou, X., Abdelrahman, K., Pozzer, A., and Lelieveld, J.: Modeling the aerosol chemical composition of the tropopause over the Tibetan Plateau during the Asian summer monsoon, Atmos. Chem. Phys., 19, 11587–11612, https://doi.org/10.5194/acp-19-11587-2019, 2019.
Mahowald, N. M., Baker, A. R., Bergametti, G., Brooks, N., Duce, R. A., Jickells, T. D., Kubilay, N., Prospero, J. M., and Tegen, I.: Atmospheric global dust cycle and iron inputs to the ocean, Global Biogeochem. Cy., 19, GB4025, https://doi.org/10.1029/2004GB002402, 2005.
Mahowald, N., Jickells, T. D., Baker, A. R., Artaxo, P., BenitezNelson, C. R., Bergametti, G., Bond, T. C., Chen, Y., Cohen, D. D., Herut, B., Kubilay, N., Losno, R., Luo, C., Maenhaut, W., McGee, K. A., Okin, G. S., Siefert, R. L., and Tsukuda, S.:Global distribution of atmospheric phosphorus sources, concentrations and deposition rates, and anthropogenic impacts, Global Biogeochem. Cy., 22, GB4026, https://doi.org/10.1029/2008GB003240, 2008.
Mahowald, N. M., Engelstaedter, S., Luo, C., Sealy, A., Artaxo, P., Benitez-Nelson, C., Bonnet, S., Chen, Y., Chuang, P. Y., Cohen, D. D., Dulac, F., Herut, B., Johansen, A. M., Kubilay, N., Losno, R., Maenhaut, W., Paytan, A., Prospero, J. A., Shank, L. M., and Siefert, R. L.: Atmospheric Iron Deposition: Global Distribution, Variability, and Human Perturbations, Ann. Rev. Mar. Sci., 1, 245–278, https://doi.org/10.1146/annurev.marine.010908.163727, 2009.
Maloney, C., Toon, B., Bardeen, C., Yu, P. F., Froyd, K., Kay, J., and Woods, S.: The Balance Between Heterogeneous and Homogeneous Nucleation of Ice Clouds Using CAM5/CARMA, J. Geophys. Res.-Atmos., 127, e2021JD035540, https://doi.org/10.1029/2021jd035540, 2022.
Marticorena, B. and Bergametti, G.: Modeling the atmospheric dust cycle: 1. Design of a soil-derived dust emission scheme, J. Geophys. Res.-Atmos., 100, 16415–16430, 1995.
Murphy, D. M., Middlebrook, A. M., and Warshawsky, M.: Cluster analysis of data from the Particle Analysis by Laser Mass Spectrometry (PALMS) instrument, Aerosol Sci. Technol., 37, 382–391, https://doi.org/10.1080/02786820300971, 2003.
Murphy, D. M., Cziczo, D. J., Froyd, K. D., Hudson, P. K., Matthew, B. M., Middlebrook, A. M., Peltier, R. E., Sullivan, A., Thomson, D. S., and Weber, R. J.: Single-particle mass spectrometry of tropospheric aerosol particles, J. Geophys. Res.-Atmos., 111, D23S32, https://doi.org/10.1029/2006jd007340, 2006.
Murphy, D. M., Froyd, K. D., Bourgeois, I., Brock, C. A., Kupc, A., Peischl, J., Schill, G. P., Thompson, C. R., Williamson, C. J., and Yu, P.: Radiative and chemical implications of the size and composition of aerosol particles in the existing or modified global stratosphere, Atmos. Chem. Phys., 21, 8915–8932, https://doi.org/10.5194/acp-21-8915-2021, 2021.
NASA: AERONET Data Download Tool, https://aeronet.gsfc.nasa.gov/cgi-bin/webtool_aod_v3, last access: October 2022.
Nazaryan, H., McCormick, M. P., and Menzel, W. P.: Global characterization of cirrus clouds using CALIPSO data, J. Geophys. Res.-Atmos., 113, D16211, https://doi.org/10.1029/2007jd009481, 2008.
Prasad, A. K. and Singh, R. P.: Changes in aerosol parameters during major dust storm events (2001–2005) over the Indo-Gangetic Plains using AERONET and MODIS data, J. Geophys. Res.-Atmos., 112, D09208, https://doi.org/10.1029/2006jd007778, 2007.
Prospero, J. M., Uematsu, M., and Savoie, D. L.: Mineral aerosol transport to the Pacific Ocean, edited by: Riley, J. P., 187–218, Academic Press, New York, 1989.
Prospero, J. M.: The Atmospheric Transport of Particles to the Ocean, in: Particle Flux in the Ocean, edited by: Ittekkot, V., Schafer, P., Honjo, S., and Depetris, P. J., John Wiley and Sons Ltd., New York, 1996.
Prospero, J. M. and Bonatti, E.: Continental dust in the atmosphere of the Eastern Equatorial Pacific, J. Geophys. Res., 74, 3362–3371, https://doi.org/10.1029/JC074i013p03362, 1969.
Prospero, J. M., Collard, F.-X., Molinie, J., and Jeannot, A.: Characterizing the annual cycle of African dust transport to the Caribbean Basin and South America and its impact on air quality and the environment, Global Biogeochem. Cy., 29, 757–773, https://doi.org/10.1002/2013GB004802, 2014.
Rosenfeld, D., Rudich, Y., and Lahav, R.: Desert dust suppressing precipitation: A possible desertification feedback loop, P. Natl. Acad. Sci. USA, 98, 5975–5980, https://doi.org/10.1073/pnas.101122798, 2001.
Sassen, K., Wang, Z., and Liu, D.: Global distribution of cirrus clouds from CloudSat/Cloud-Aerosol Lidar and Infrared Pathfinder Satellite Observations (CALIPSO) measurements, J. Geophys. Res.-Atmos., 113, D00A12, https://doi.org/10.1029/2008jd009972, 2008.
Satheesh, S. K. and Moorthy, K. K.: Radiative effects of natural aerosols: A review, Atmos. Environ., 39, 2089–2110, https://doi.org/10.1016/j.atmosenv.2004.12.029, 2005.
Sinyuk, A., Torres, O., and Dubovik, O.: Combined use of satellite and surface observations to infer the imaginary part of refractive index of Saharan dust, Geophys. Res. Lett., 30, 1081, https://doi.org/10.1029/2002gl016189, 2003.
Sokolik, I. N. and Toon, O. B.: Direct radiative forcing by anthropogenic airborne mineral aerosols, Nature, 381, 681–683, https://doi.org/10.1038/381681a0, 1996.
Sokolik, I. N. and Toon, O. B.: Incorporation of mineralogical composition into models of the radiative properties of mineral aerosol from UV to IR wavelengths, J. Geophys. Res.-Atmos., 104, 9423–9444, 1999.
Spanu, A., Dollner, M., Gasteiger, J., Bui, T. P., and Weinzierl, B.: Flow-induced errors in airborne in situ measurements of aerosols and clouds, Atmos. Meas. Tech., 13, 1963–1987, https://doi.org/10.5194/amt-13-1963-2020, 2020.
Stith, J. L., Ramanathan, V., Cooper, W. A., Roberts, G. C., DeMott, P. J., Carmichael, G., Hatch, C. D., Adhikary, B., Twohy, C. H., Rogers, D. C., Baumgardner, D., Prenni, A. J., Campos, T., Gao, R., Anderson, J., and Feng, Y.: An overview of aircraft observations from the Pacific Dust Experiment campaign, J. Geophys. Res.-Atmos., 114, D05207, https://doi.org/10.1029/2008jd010924, 2009.
Su, L. and Toon, O. B.: Numerical simulations of Asian dust storms using a coupled climate-aerosol microphysical model, J. Geophys. Res. Atmos., 114, D14202, https://doi.org/10.1029/2008jd010956, 2009.
Su, L. and Toon, O. B.: Saharan and Asian dust: similarities and differences determined by CALIPSO, AERONET, and a coupled climate-aerosol microphysical model, Atmos. Chem. Phys., 11, 3263–3280, https://doi.org/10.5194/acp-11-3263-2011, 2011.
Swap, R., Garstang, M., Greco, S., Talbot, R., and Kallberg, P.: Saharan dust in the Amazon Basin, Tellus B, 44, 133–149, https://doi.org/10.1034/j.1600-0889.1992.t01-1-00005.x, 1992.
Tanaka, T. Y. and Chiba, M.: A numerical study of the contributions of dust source regions to the global dust budget, Global Planet. Change, 52, 88–104, https://doi.org/10.1016/j.gloplacha.2006.02.002, 2006.
Tanaka, T. Y., Kurosaki, Y., Chiba, M., Matsumura, T., Nagai, T., Yamazaki, A., Uchiyama, A., Tsunematsu, N., and Kai, K.: Possible transcontinental dust transport from North Africa and the Middle East to East Asia, Atmos. Environ., 39, 3901–3909, https://doi.org/10.1016/j.atmosenv.2005.03.034, 2005.
Tegen, I.: Modeling the mineral dust aerosol cycle in the climate system, Quaternary Sci. Rev., 22, 1821–1834, https://doi.org/10.1016/s0277-3791(03)00163-x, 2003.
Tegen, I. and Lacis, A. A.: Modeling of particle size distribution and its influence on the radiative properties of mineral dust aerosol, J. Geophys. Res.-Atmos., 101, 19237–19244, https://doi.org/10.1029/95jd03610, 1996.
Tegen, I. and Schepanski, K.: The global distribution of mineral dust, IOP Conf. Ser. Earth Environ. Sci., 7, 012001, https://doi.org/10.1088/1755-1307/7/1/012001, 2009.
Textor, C., Schulz, M., Guibert, S., Kinne, S., Balkanski, Y., Bauer, S., Berntsen, T., Berglen, T., Boucher, O., Chin, M., Dentener, F., Diehl, T., Easter, R., Feichter, H., Fillmore, D., Ghan, S., Ginoux, P., Gong, S., Grini, A., Hendricks, J., Horowitz, L., Huang, P., Isaksen, I., Iversen, I., Kloster, S., Koch, D., Kirkevåg, A., Kristjansson, J. E., Krol, M., Lauer, A., Lamarque, J. F., Liu, X., Montanaro, V., Myhre, G., Penner, J., Pitari, G., Reddy, S., Seland, Ø., Stier, P., Takemura, T., and Tie, X.: Analysis and quantification of the diversities of aerosol life cycles within AeroCom, Atmos. Chem. Phys., 6, 1777–1813, https://doi.org/10.5194/acp-6-1777-2006, 2006.
Thomason, L. W. and Vernier, J.-P.: Improved SAGE II cloud/aerosol categorization and observations of the Asian tropopause aerosol layer: 1989–2005, Atmos. Chem. Phys., 13, 4605–4616, https://doi.org/10.5194/acp-13-4605-2013, 2013.
Toon, O. B., Turco, R. P., Westphal, D., Malone, R., and Liu, M.: A Multidimensional Model for Aerosols: Description of Computational Analogs, J. Atmos. Sci., 45, 2123–2144, https://doi.org/10.1175/1520-0469(1988)045<2123:AMMFAD>2.0.CO;2, 1988.
Vernier, J. P., Thomason, L. W., and Kar, J.: CALIPSO detection of an Asian tropopause aerosol layer, Geophys. Res. Lett., 38, L07804, https://doi.org/10.1029/2010gl046614, 2011.
Vernier, J. P., Fairlie, T. D., Natarajan, M., Wienhold, F. G., Bian, J., Martinsson, B. G., Crumeyrolle, S., Thomason, L. W., and Bedka, K. M.: Increase in upper tropospheric and lower stratospheric aerosol levels and its potential connection with Asian pollution, J. Geophys. Res.-Atmos., 120, 1608–1619, https://doi.org/10.1002/2014jd022372, 2015.
Vernier, J. P., Fairlie, T. D., Deshler, T., Ratnam, M. V., Gadhavi, H., Kumar, B. S., Natarajan, M., Pandit, A. K., Raj, S. T. A., Kumar, A. H., Jayaraman, A., Singh, A. K., Rastogi, N., Sinha, P. R., Kumar, S., Tiwari, S., Wegner, T., Baker, N., Vignelles, D., Stenchikov, G., Shevchenko, I., Smith, J., Bedka, K., Kesarkar, A., Singh, V., Bhate, J., Ravikiran, V., Rao, M. D., Ravindrababu, S., Patel, A., Vernier, H., Wienhold, F. G., Liu, H., Knepppp, T. N., Thomason, L., Crawford, J., Ziembmba, L., Moore, J., Crumeyrolle, S., Williamson, M., Berthet, G., Jegou, F., and Renard, J. B.: BATAL The Balloon Measurement Campaigns of the Asian Tropopause Aerosol Layer, Bull. Am. Meteorol. Soc., 99, 955–973, https://doi.org/10.1175/bams-d-17-0014.1, 2018.
Wang, H., Easter, R. C., Rasch, P. J., Wang, M., Liu, X., Ghan, S. J., Qian, Y., Yoon, J.-H., Ma, P.-L., and Vinoj, V.: Sensitivity of remote aerosol distributions to representation of cloud–aerosol interactions in a global climate model, Geosci. Model Dev., 6, 765–782, https://doi.org/10.5194/gmd-6-765-2013, 2013.
Wang, R., Balkanski, Y., Boucher, O., Bopp, L., Chappell, A., Ciais, P., Hauglustaine, D., Peñuelas, J., and Tao, S.: Sources, transport and deposition of iron in the global atmosphere, Atmos. Chem. Phys., 15, 6247–6270, https://doi.org/10.5194/acp-15-6247-2015, 2015.
Wofsy, S. C., Afshar, S., Allen, H. M., Apel, E. C., Asher, E. C., Barletta, B., Bent, J., Bian, H., Biggs, B. C., Blake, D. R., Blake, N., Bourgeois, I., Brock, C. A., Brune, W. H., Budney, J. W., Bui, T. P., Butler, A., Campuzano-Jost, P., Chang, C. S., Chin, M., Commane, R., Correa, G., Crounse, J. D., Cullis, P. D., Daube, B. C., Day, D. A., Dean-Day, J. M., Dibb, J. E., Digangi, J. P., Diskin, G. S., Dollner, M., Elkins, J. W., Erdesz, F., Fiore, A. M., Flynn, C. M., Froyd, K. D., Gesler, D. W., Hall, S. R., Hanisco, T. F., Hannun, R. A., Hills, A. J., Hintsa, E. J., Hoffman, A., Hornbrook, R. S., Huey, L. G., Hughes, S., Jimenez, J. L., Johnson, B. J., Katich, J. M., Keeling, R. F., Kim, M. J., Kupc, A., Lait, L. R., Lamarque, J.-F., Liu, J., Mckain, K., Mclaughlin, R. J., Meinardi, S., Miller, D. O., Montzka, S. A., Moore, F. L., Morgan, E. J., Murphy, D. M., Murray, L. T., Nault, B. A., Neuman, J. A., Newman, P. A., Nicely, J. M., Pan, X., Paplawsky, W., Peischl, J., Prather, M. J., Price, D. J., Ray, E. A., Reeves, J. M., Richardson, M., Rollins, A. W., Rosenlof, K. H., Ryerson, T. B., Scheuer, E., Schill, G. P., Schroder, J. C., Schwarz, J. P., St. Clair, J. M., Steenrod, S. D., Stephens, B. B., Strode, S. A., Sweeney, C., Tanner, D., Teng, A. P., Thames, A. B., Thompson, C. R., Ullmann, K., Veres, P. R., Vizenor, N., Wagner, N. L., Watt, A., Weber, R., Weinzierl, B. B., Wennberg, P., Williamson, C., Wilson, J., Wolfe, G., Woods, C., and Zeng, L.: ATom: Merged Atmospheric Chemistry, Trace Gases, and Aerosols, ORNL DAAC, https://doi.org/10.3334/ORNLDAAC/1581, 2018.
Wofsy, S. C., Afshar, S., Allen, H. M., Apel, E. C., Asher, E. C., Barletta, B., Bent, J., Bian, H., Biggs, B. C., Blake, D. R., Blake, N., Bourgeois, I., Brock, C. A., Brune, W. H., Budney, J. W., Bui, T. P., Butler, A., Campuzano-Jost, P., Chang, C. S., Chin, M., Commane, R., Correa, G., Crounse, J. D., Cullis, P. D., Daube, B. C., Day, D. A., Dean-Day, J. M., Dibb, J. E., DiGangi, J. P., Diskin, G. S., Dollner, M., Elkins, J. W., Erdesz, F., Fiore, A. M., Flynn, C. M., Froyd, K. D., Gesler, D. W., Hall, S. R., Hanisco, T. F., Hannun, R. A., Hills, A. J., Hintsa, E. J., Hoffman, A., Hornbrook, R. S., Huey, L. G., Hughes, S., Jimenez, J. L., Johnson, B. J., Katich, J. M., Keeling, R. F., Kim, M. J., Kupc, A., Lait, L. R., McKain, K., Mclaughlin, R. J., Meinardi, S., Miller, D. O., Montzka, S. A., Moore, F. L., Morgan, E. J., Murphy, D. M., Murray, L. T., Nault, B. A., Neuman, J. A., Newman, P. A., Nicely, J. M., Pan, X., Paplawsky, W., Peischl, J., Prather, M. J., Price, D. J., Ray, E. A., Reeves, J. M., Richardson, M., Rollins, A. W., Rosenlof, K. H., Ryerson, T. B., Scheuer, E., Schill, G. P., Schroder, J. C., Schwarz, J. P., St.Clair, J. M., Steenrod, S. D., Stephens, B. B., Strode, S. A., Sweeney, C., Tanner, D., Teng, A. P., Thames, A. B., Thompson, C. R., Ullmann, K., Veres, P. R., Wagner, N. L., Watt, A., Weber, R., Weinzierl, B. B., Wennberg, P. O., Williamson, C. J., Wilson, J. C., Wolfe, G. M., Woods, C. T., Zeng, L. H., and Vieznor, N.: ATom: Merged Atmospheric Chemistry, Trace Gases, and Aerosols, Version 2. ORNL DAAC, Oak Ridge, Tennessee, USA, https://doi.org/10.3334/ORNLDAAC/1925, 2021.
Yang, K., Wang, Z. E., Luo, T., Liu, X. H., and Wu, M. X.: Upper troposphere dust belt formation processes vary seasonally and spatially in the Northern Hemisphere, Commun. Earth Environ., 3, 24, https://doi.org/10.1038/s43247-022-00353-5, 2022.
Yu, H. B., Chin, M., Winker, D. M., Omar, A. H., Liu, Z. Y., Kittaka, C., and Diehl, T.: Global view of aerosol vertical distributions from CALIPSO lidar measurements and GOCART simulations: Regional and seasonal variations, J. Geophys. Res.-Atmos., 115, D00H30, https://doi.org/10.1029/2009jd013364, 2010.
Yu, H. B., Chin, M., Bian, H. S., Yuan, T. L., Prospero, J. M., Omar, A. H., Remer, L. A., Winker, D. M., Yang, Y. K., Zhang, Y., and Zhang, Z. B.: Quantification of trans-Atlantic dust transport from seven-year (2007–2013) record of CALIPSO lidar measurements, Remote Sens. Environ., 159, 232–249, https://doi.org/10.1016/j.rse.2014.12.010, 2015a.
Yu, H. B., Chin, M., Yuan, T. L., Bian, H. S., Remer, L. A., Prospero, J. M., Omar, A., Winker, D., Yang, Y. K., Zhang, Y., Zhang, Z. B., and Zhao, C.: The fertilizing role of African dust in the Amazon rainforest: A first multiyear assessment based on data from Cloud-Aerosol Lidar and Infrared Pathfinder Satellite Observations, Geophys. Res. Lett., 42, 1984–1991, https://doi.org/10.1002/2015gl063040, 2015b.
Yu, P., Rosenlof, K. H., Liu, S., Telg, H., Thornberry, T. D., Rollins, A. W., Portmann, R. W., Bai, Z., Ray, E. A., Duan, Y., Pan, L. L., Toon, O. B., Bian, J., and Gao, R.-S.: Efficient transport of tropospheric aerosol into the stratosphere via the Asian summer monsoon anticyclone, P. Natl. Acad. Sci., 114, 6972–6977, https://doi.org/10.1073/pnas.1701170114, 2017.
Yu, P., Lian, S., Zhu, Y., Toon, O. B., Höpfner, M., and Borrmann, S.: Abundant Nitrate and Nitric Acid Aerosol in the Upper troposphere and Lower Stratosphere, Geophys. Res. Lett., 49, e2022GL100258, https://doi.org/10.1029/2022GL100258, 2022.
Yu, P. F., Toon, O. B., Bardeen, C. G., Mills, M. J., Fan, T. Y., English, J. M., and Neely, R. R.: Evaluations of tropospheric aerosol properties simulated by the community earth system model with a sectional aerosol microphysics scheme, J. Adv. Model. Earth Syst., 7, 865–914, https://doi.org/10.1002/2014ms000421, 2015.
Yu, P. F., Froyd, K. D., Portmann, R. W., Toon, O. B., Freitas, S. R., Bardeen, C. G., Brock, C., Fan, T. Y., Gao, R. S., Katich, J. M., Kupc, A., Liu, S., Maloney, C., Murphy, D. M., Rosenlof, K. H., Schill, G., Schwarz, J. P., and Williamson, C.: Efficient In-Cloud Removal of Aerosols by Deep Convection, Geophys. Res. Lett., 46, 1061–1069, https://doi.org/10.1029/2018gl080544, 2019.
Zender, C. S., Miller, R. L. R. L., and Tegen, I.: Quantifying mineral dust mass budgets:Terminology, constraints, and current estimates, Eos Trans. Am. Geophys. Union, 85, 509–512, https://doi.org/10.1029/2004EO480002, 2004.
Zwaaftink, C. D. G., Grythe, H., Skov, H., and Stohl, A.: Substantial contribution of northern high-latitude sources to mineral dust in the Arctic, J. Geophys. Res.-Atmos., 121, 13678–13697, https://doi.org/10.1002/2016jd025482, 2016.